Article

Matrix Effects of Different Water Types on the Efficiency of Fumonisin B1 Removal by Photolysis and Photocatalysis Using Ternary- and Binary-Structured ZnO-Based Nanocrystallites

by
Ivana Jevtić
1,†,
Sandra Jakšić
2,†,
Daniela Šojić Merkulov
3,
Szabolcs Bognár
3,
Biljana Abramović
3 and
Tamara Ivetić
4,*
1
Academy of Professional Studies Šabac, Hajduk Veljkova 10, 15000 Šabac, Serbia
2
Scientific Veterinary Institute Novi Sad, Rumenački put 20, 21000 Novi Sad, Serbia
3
Department of Chemistry, Biochemistry and Environmental Protection, University of Novi Sad Faculty of Sciences, Trg Dositeja Obradovića 3, 21000 Novi Sad, Serbia
4
Department of Physics, University of Novi Sad Faculty of Sciences, Trg Dositeja Obradovića 4, 21000 Novi Sad, Serbia
*
Author to whom correspondence should be addressed.
These authors contributed equally to this work.
Catalysts 2023, 13(2), 375; https://doi.org/10.3390/catal13020375
Submission received: 29 December 2022 / Revised: 20 January 2023 / Accepted: 4 February 2023 / Published: 8 February 2023
(This article belongs to the Special Issue Innovative Functional Materials in Photocatalysis, 2nd Edition)

Abstract

:
Several ternary- and binary-structured ZnO-based nanocrystallites (Zn2SnO4, Zn2TiO4, ZnO/SnO2, ZnO/TiO2) were synthesized by the solid-state method and first tested as photocatalysts in the removal of fumonisin B1 (FB1) under UV irradiation. The phase composition and nanocrystalline dimensions (50–80 nm) were confirmed by X-ray diffraction and Raman analyses. Similar preparation procedures applied in the case of binary structures resulted in their uniform morphology consisting of spherical particles ranging from 100 nm to 1 µm in size. However, higher synthesis temperatures of ternary oxides contributed to the growth of particles up to 10 µm. The optical energy bands of the examined photocatalysts were in the range of 3.08–3.36 eV. The efficiency of photocatalysis was compared with the efficiency of direct and indirect (sensitized by UV/H2O2 or UV/S2O82−) photolysis. The matrix effect of the different water types (Danube River, ground, and tap water) on the removal efficiency of FB1 was investigated by applying direct and indirect photolysis, as well as in the presence of the Zn2SnO4 photocatalyst. The effects of inorganic anions (Cl, NO3, HCO3 and SO42−), cations (Ca2+ and Mg2+), and humic acid were also investigated, since they were identified as a major species in tap, ground, and river water.

1. Introduction

Fumonisin B1 (FB1) belongs to the group of widespread Fusarium mycotoxins [1]. These pollutants were discovered at the end of the 1980s [2], and since then, fumonisins have been extensively studied because of their harmful effects on human and animal health [2]. Their presence in corn is statistically associated with the occurrence of esophageal cancer in humans, and according to the International Agency for Research on Cancer, fumonisins are classified as potentially carcinogenic compounds [3]. They usually contaminate corn and wheat, as well as the products thereof [1,4,5]. The presence of fumonisins in corn, corn-based food, and feed is regulated by the maximum permitted and recommended values [6].
Since their discovery in the 1980s, 30 fumonisins have been isolated and their structures elucidated, while nearly 100 new fumonisins and isomers have been detected by LC-ESI-ITMS and LC-ESI-TOFMS procedures [7]. However, FB1 is the most toxic and most prevalent in nature. According to its chemical structure, it is a 2S-amino-12S,16R-dimethyl-3S,5R,10R,14S,15R-penta-hydroxy-eicosane with esterified hydroxyl groups at the C14 and C15 positions and a terminal carboxyl group of propane-1,2,3-tricarboxylic acid [8]. The solubility of FB1 in deionized water was determined to be approximately 20 mg/cm3 [9]. In addition, the stability of this toxin was confirmed in the aquatic environment at ambient temperature [10]. The possibility of fumonisins production in the water matrix [11] as well as the presence of FB1 in different types of water was proven [12]. The highest concentration (27.4–55.6 ng/dm3) of this mycotoxin was recorded in river water in the period from April to November [12].
Due to the potential risk of the presence of fumonisins in water, the development of methods for their removal is of the highest importance. Advanced oxidation processes (AOPs) are effective in the treatment of waters contaminated with organic pollutants [13]. These processes are mainly based on the formation of highly reactive hydroxyl (OH) and sulfate (SO4•−) radicals that effectively remove many pollutants [14]. Moreover, other types of radicals and reactive oxygen species such as superoxide radical-anion (O2•−), its conjugated acid form, hydroperoxide radical (HO2), triplet oxygen (3O2), ozone (O3) as well as organic peroxide radicals (R-O-O) can also occur during AOPs and be involved in the degradation processes [15]. The expected result of the abovementioned interactions between radicals and organic pollutants is the complete pollutant mineralization to CO2 and H2O. Although these radicals can cause the oxidation of some living cell components, they do not threaten their activity or viability [13].
A successful AOP of heterogeneous photocatalysis requires the presence of efficient semiconductors as catalysts. Semiconductors of binary metal (II-VI and IV-VI) oxides and their chemically more stable ternary metal (II-IV-VI) oxide compounds are attracting much attention due to their unique properties and diverse applications in electronics, sensing, energy conversion, and environmental heterogeneous photocatalysis [16,17,18,19,20,21]. In particular, ZnO-based materials are considered to be multifunctional, and their high chemical stability and electrochemical coupling coefficient, wide range of radiation absorption, and high photostability makes them highly desired in photocatalysis [22]. ZnO is a II-IV semiconductor with a covalence between ionic and covalent compounds, a wide band gap (about 3.37 eV), and high thermal and mechanical stability [23,24]. Overcoming the disadvantages of ZnO, such as its significant tendency to agglomerate, motivates numerous researchers to find effective modification procedures to stabilize its surface. The most popular techniques apply another inorganic (Al2O3, SiO2, SnO2, TiO2, ZrO2, CeO2) and organic (triethanolamine, aminopropyltriethoxysilane, steric acid) compounds or polymer matrices (polyethylene glycol, silane, polymethylmethacrylate) as modifiers for changing the surface area and particle size, reducing agglomeration, and improving its long-term stability and dispersion and overall electrical, thermal, and optical properties [16].
Mechanochemistry has a long history as a standard method for manipulating solid materials and is attracting increased attention especially from the area of production of new composite materials for environmental applications, as it can be performed without hazardous solvents and at a low cost. Zinc oxide forms spinel-type ternary compounds with SnO2 and TiO2, zinc orthostannate Zn2SnO4 [25], and zinc orthotitanate Zn2TiO4 [26] by mechanochemical synthesis starting at temperatures of 700 °C [27,28]. All of these materials are well-known for their various applications, especially in photocatalysis [26,29]. A modifier in this research, the TiO2 itself, is one of the most familiar, commercialized, chemically stable, and biologically harmless photocatalysts for the degradation of organic pollutants and is primarily active under UV light [30]. The second modifier, the SnO2, which shows a wide range of applications in gas sensors, batteries, transistors, and transparent electrodes, has no adverse health effects and is considered a potentially ideal photocatalyst, having a structure, band gap, and chemical stability similar to TiO2 [31]. Ternary zinc–tin oxide, Zn2SnO4, showed significant efficiency in the photodegradation of various organic water pollutants under UV irradiation [32,33,34]. A recent comprehensive study on the chemical stability of Zn2SnO4 in aqueous media [35] proved that Zn2SnO4 powder can be used in a variety of applications involving acidic or basic aqueous media. In this study, acidic media resulted in a higher rate of dissolution of Zn2+ and Sn4+ ions compared to basic media, and Zn2+ ions were dissolved by a proton-induced dissolution mechanism in acidic media. Furthermore, the strength of the cationic field in Zn2SnO4 caused the differential dissolution of Sn4+ and Zn2+ ions, which were determined to have a maximum of 0.04% and 0.4%, respectively, and no interaction layer was found on the surface of particles. Thus, it can be soundly concluded that Zn2SnO4 powders are chemically stable materials in terms of potential metal leaching from the material during photocatalysis. Zinc–titanium oxide Zn2TiO4 is present in binary systems of ZnO–TiO2 as one of the most stable structures, and is particularly attractive due to its cheapness, non-toxicity, and exceptional stability, with optical properties in UV and near-visible light [36]. The high photocatalytic efficiency of ZnO, SnO2, TiO2, Zn2SnO4, and Zn2TiO4 structures, which have been established so far, justifies the commitment of many studies to combine these metal-oxide semiconductors as photocatalysts to achieve a synergistic effect and improve photocatalytic degradation processes [32,33,36,37,38,39,40].
This work aimed to examine the efficiency of different binary and ternary ZnO-based semiconductors in the photocatalytic removal of FB1 prepared by simple, hazard- and solvent-free, and low-cost mixing–calcination and solid-state reaction methods. Scanning electron microscopy (SEM), X-ray diffraction (XRD), Raman, diffuse-reflectance (DRS), and photoluminescence (PL) spectroscopy were used to characterize the obtained photocatalysts. The matrix effects of various water types on the efficiency of FB1 removal by photolysis and photocatalysis were also examined using ternary and binary-structured ZnO-based nanocrystallites. Furthermore, we studied the effects of the inorganic anions (Cl, NO3, HCO3 and SO42−), cations (Ca2+ and Mg2+), and humic acid (HA) as a surrogate for dissolved organic matter, as these were identified as most abundant in tap, ground, and river water. To the best of our knowledge, this is the first study of FB1 removal in environmental and tap waters.

2. Results and Discussion

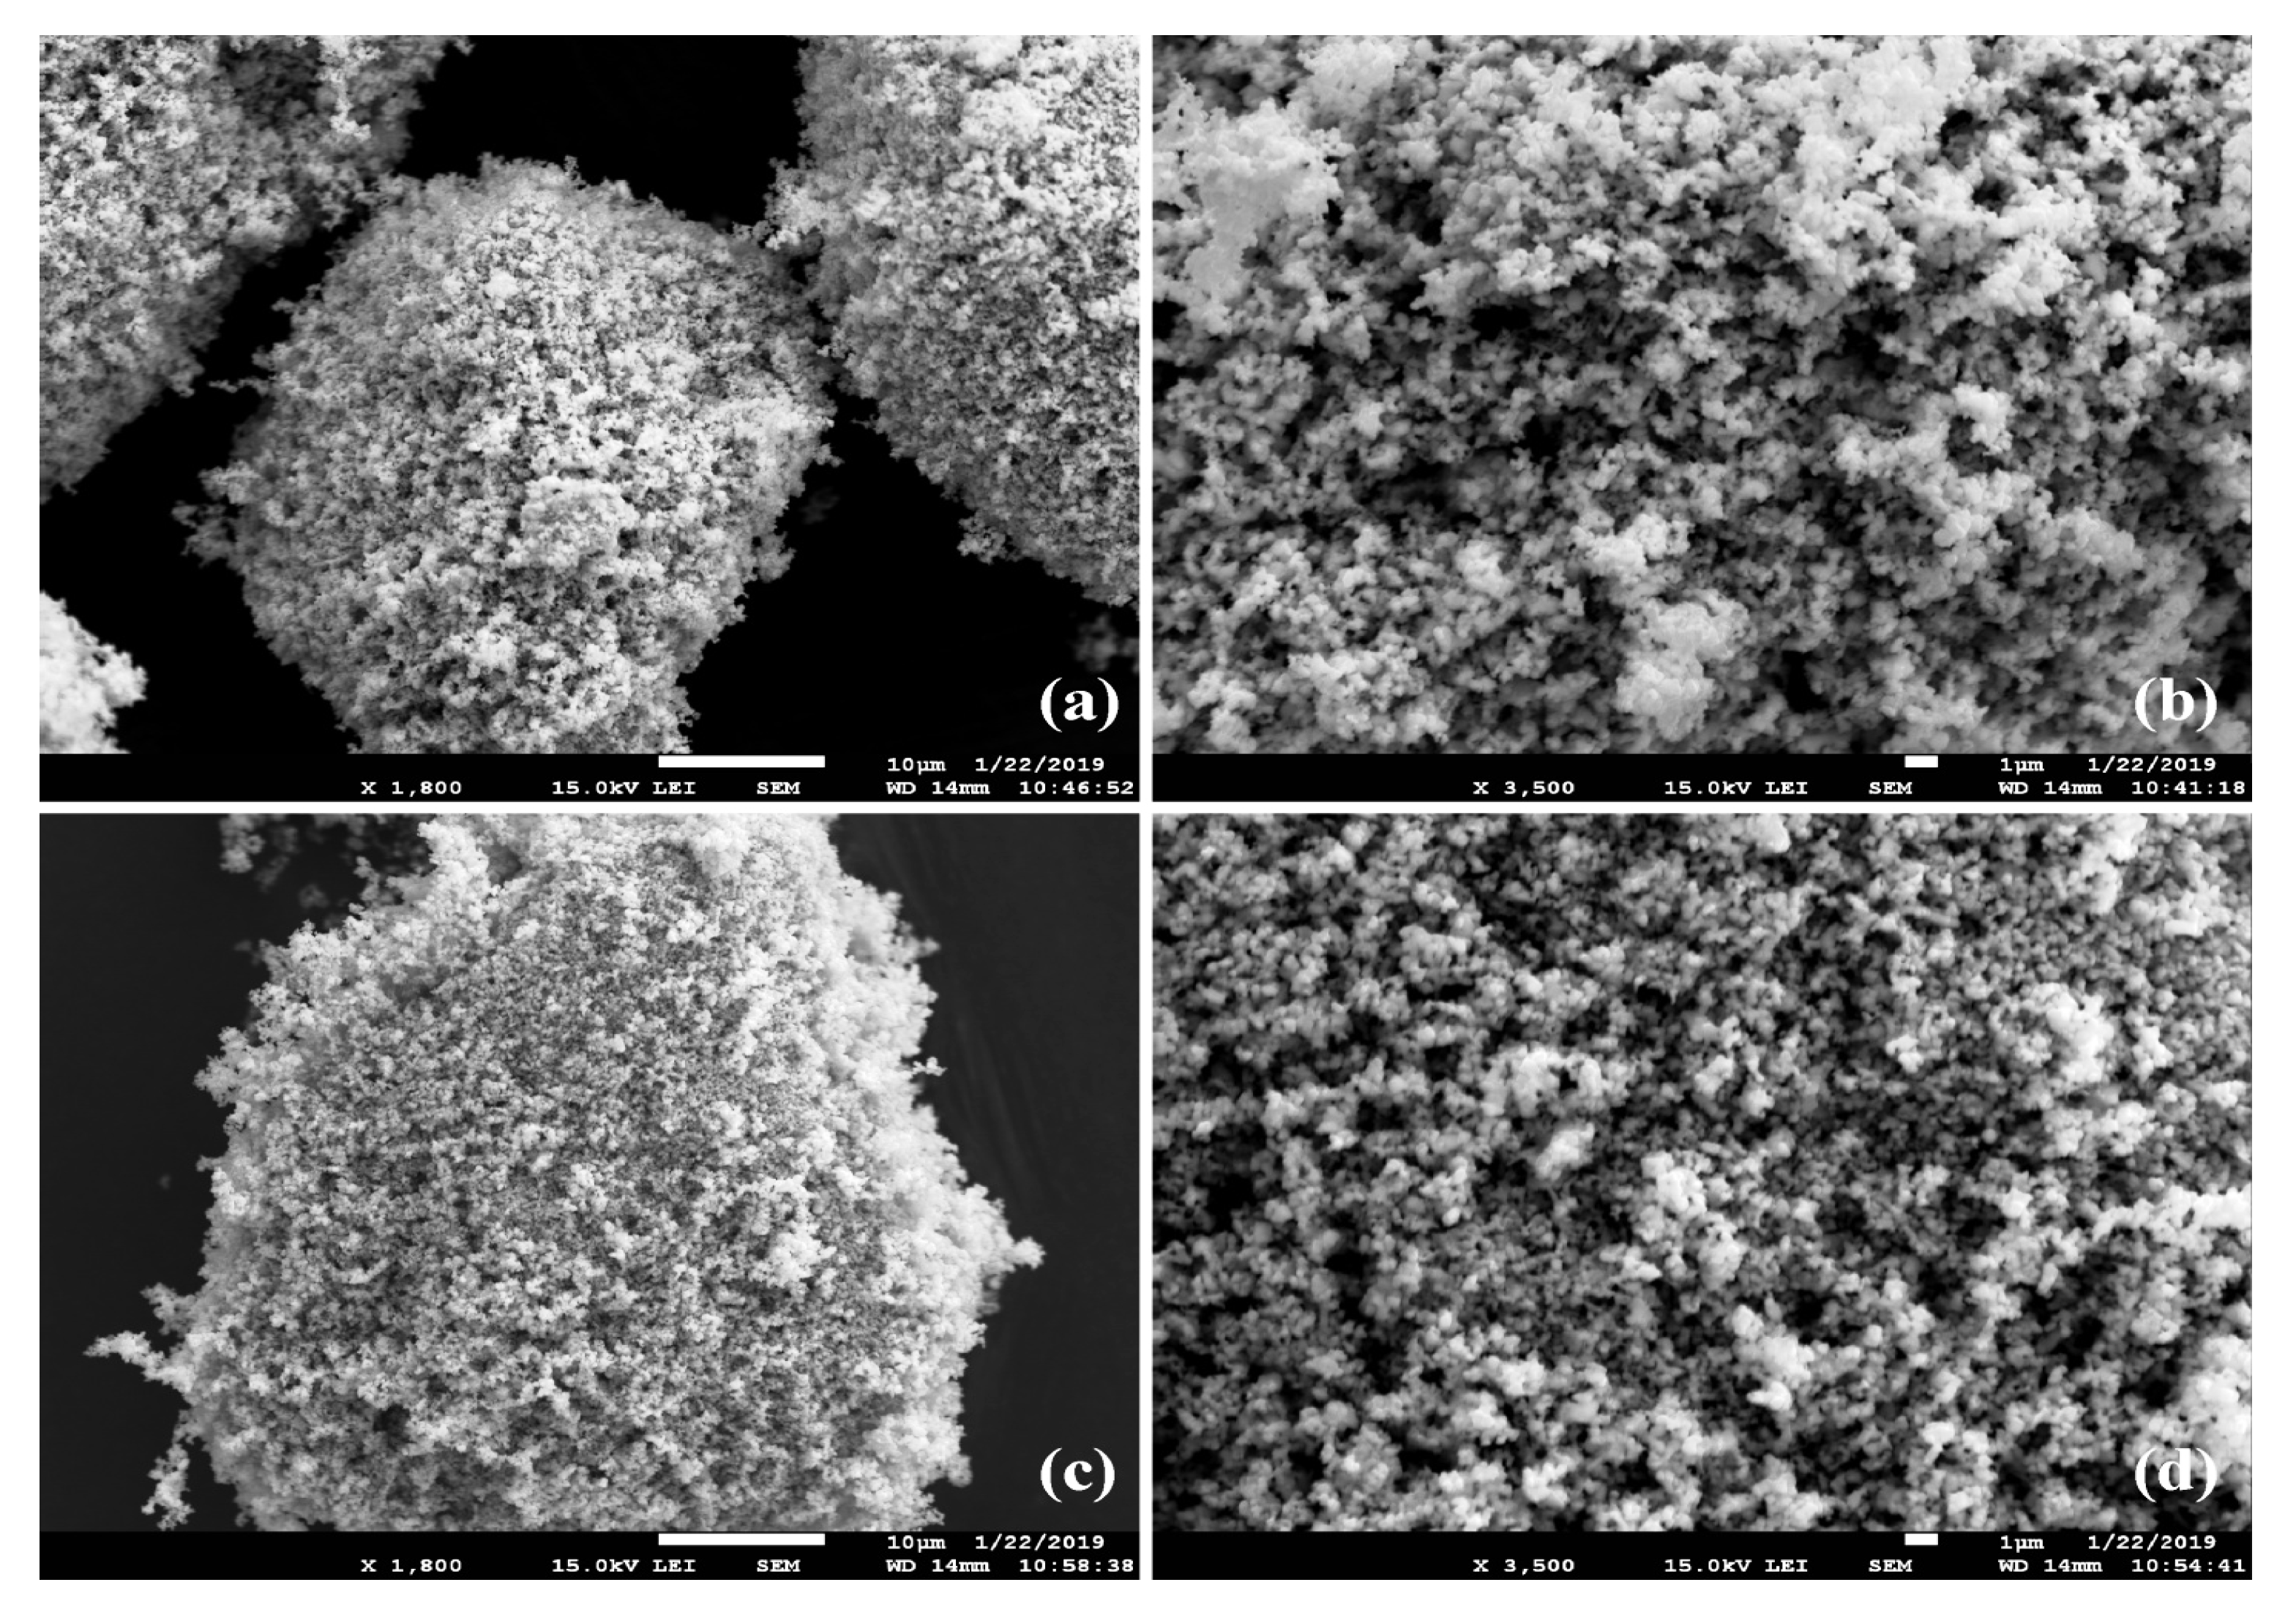
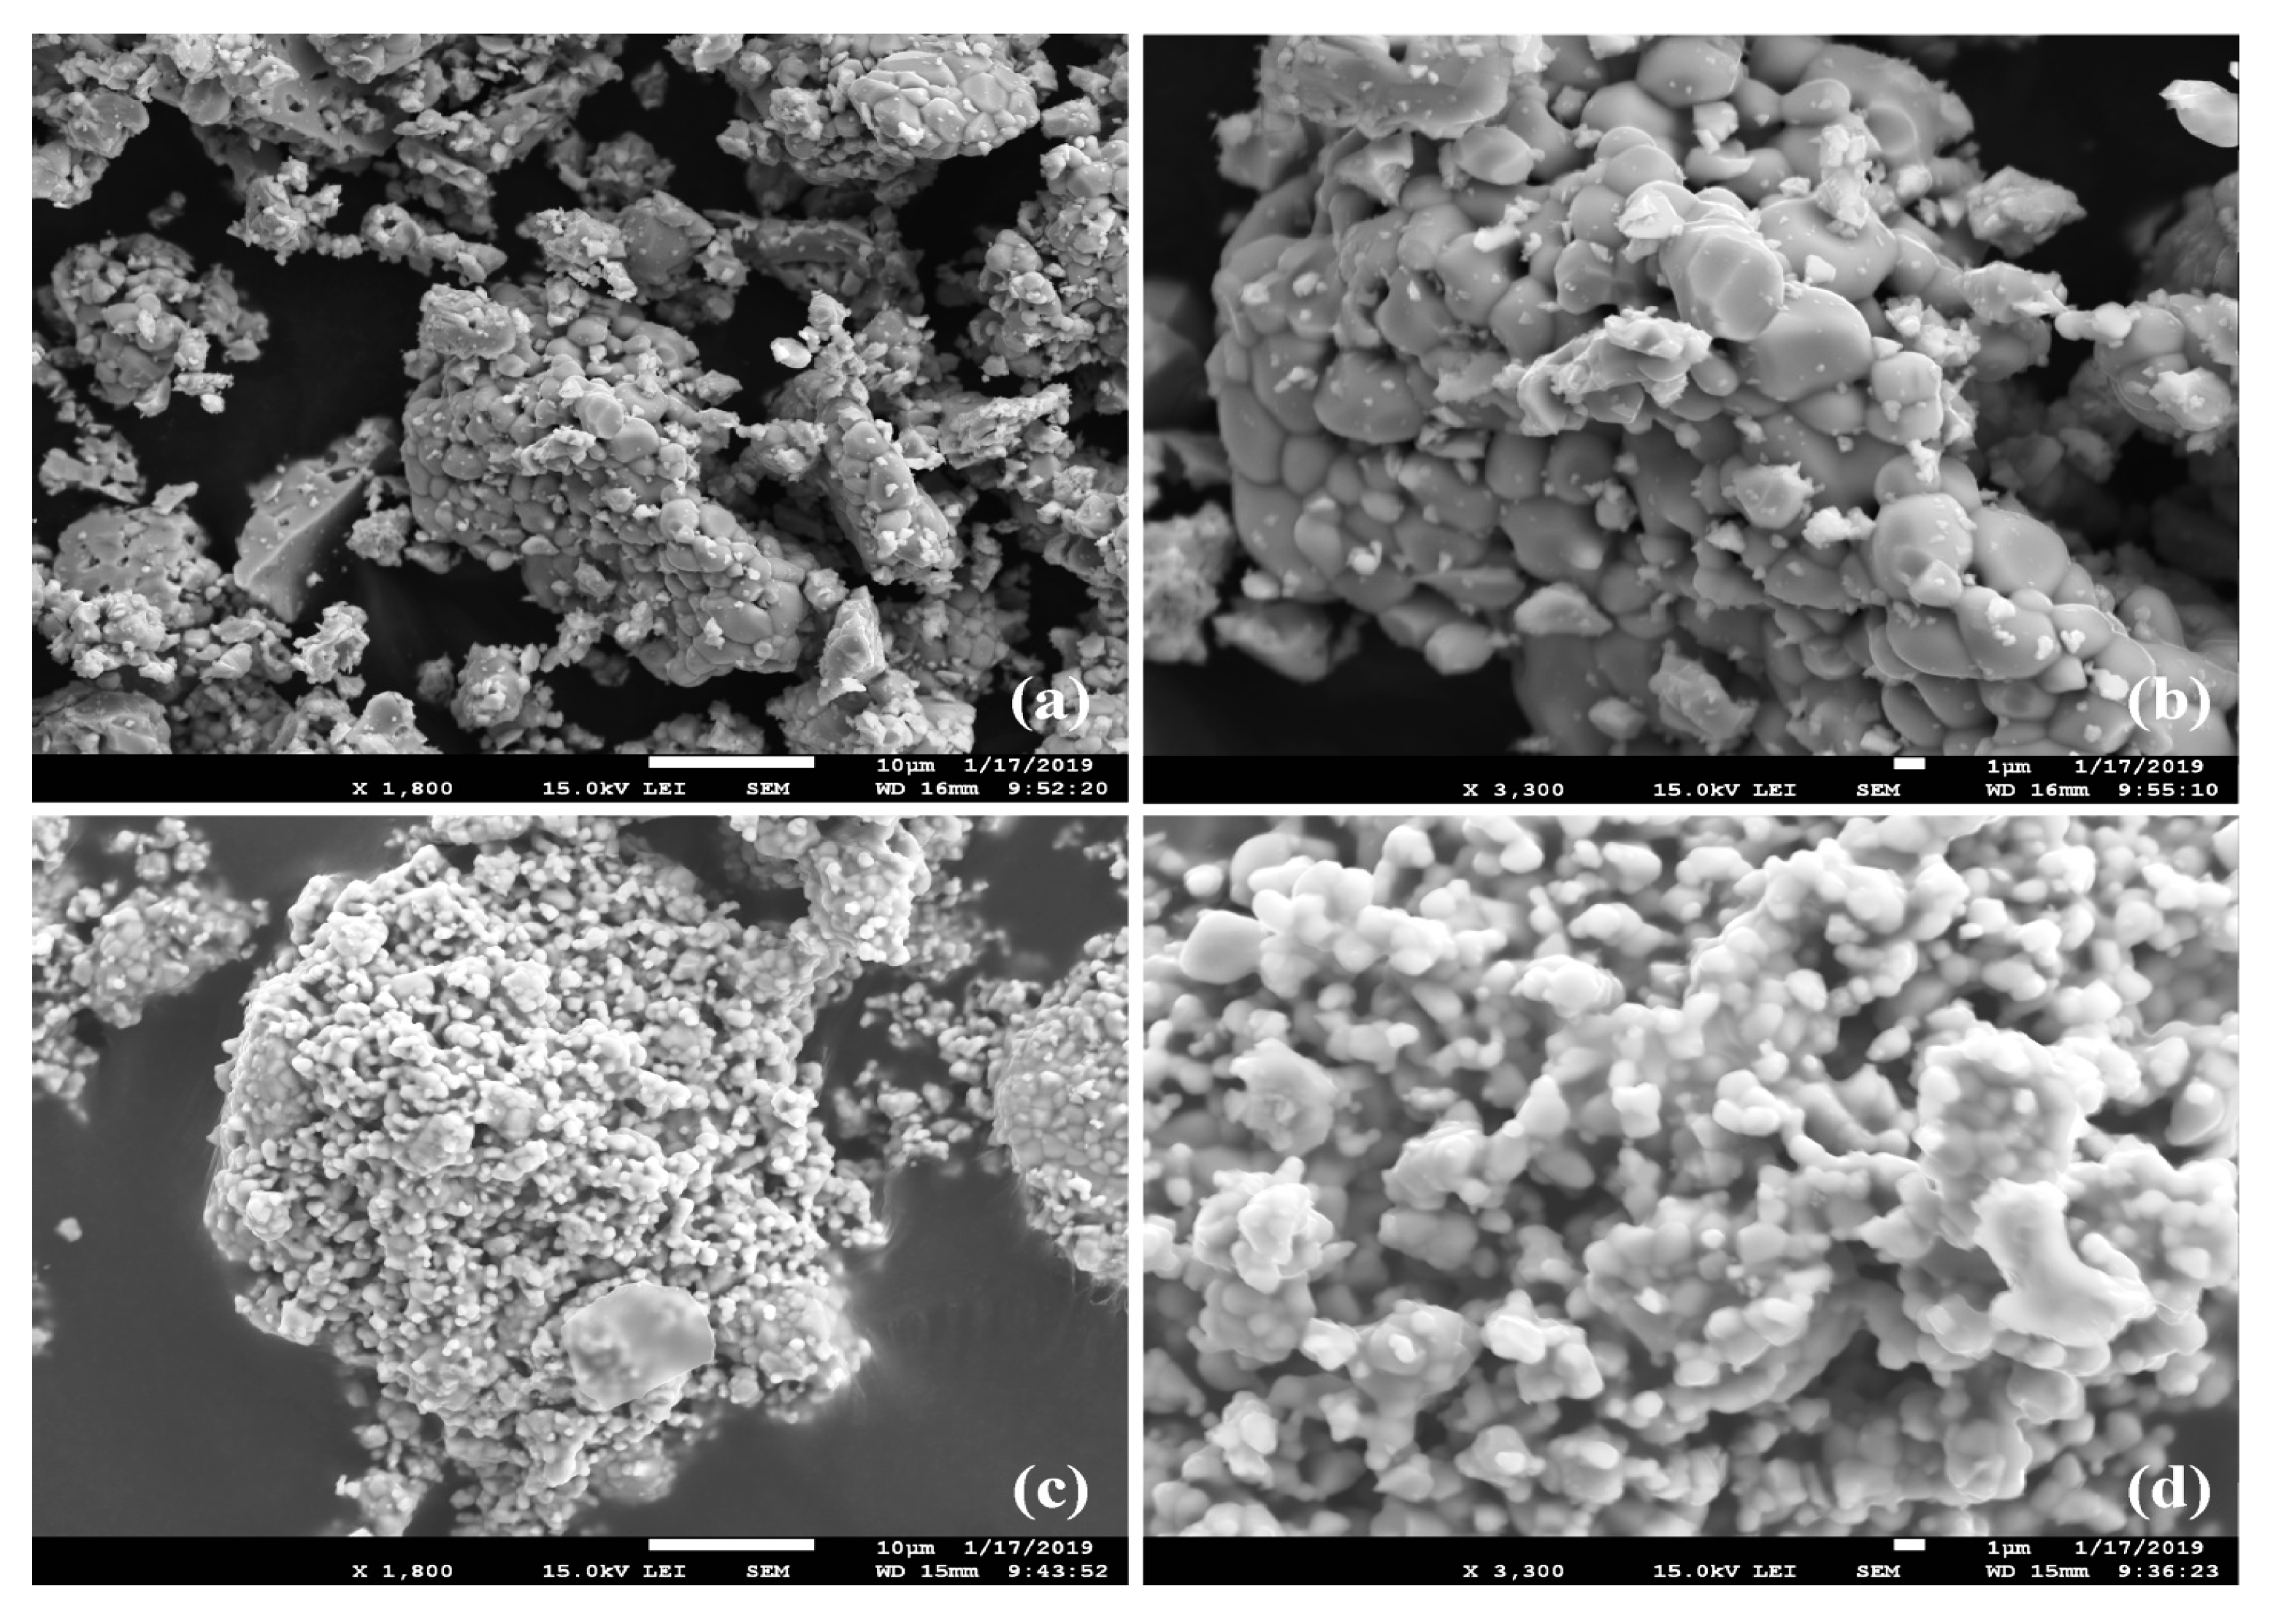
2.1. Morphology of ZnO-Based Catalysts

Figure 1 and Figure 2 show the SEM images of binary and ternary ZnO-based catalysts, respectively. The binary sample of zinc–tin oxide (ZnO/SnO2) is further marked as ZS–1 and zinc–titanium oxide (ZnO/TiO2) mixture as ZT–1. The ternary sample of zinc orthostannate (Zn2SnO4) is hereinafter marked as ZS–2, and zinc orthotitanate (Zn2TiO4) is marked as ZT–2. Similar preparation procedures applied in the case of binary catalysts resulted in the formation of agglomerates consisting of uniform spherical particles ranging from 100 nm to 1 µm in size (Figure 1). However, more intense mechanical activation and higher synthesis temperatures of ternary oxides contributed to their rather different morphology with the growth of particles up to 10 µm (Figure 2). While ZS–2 consists of clearly defined closely spaced quite round particles, ZT–2 particles show formation of contact necks, which is characteristic for the initial phases of sintering. However, ZS–2 shows less agglomeration (Figure 2a) as compared to the others (Figure 1a,c and Figure 2c).

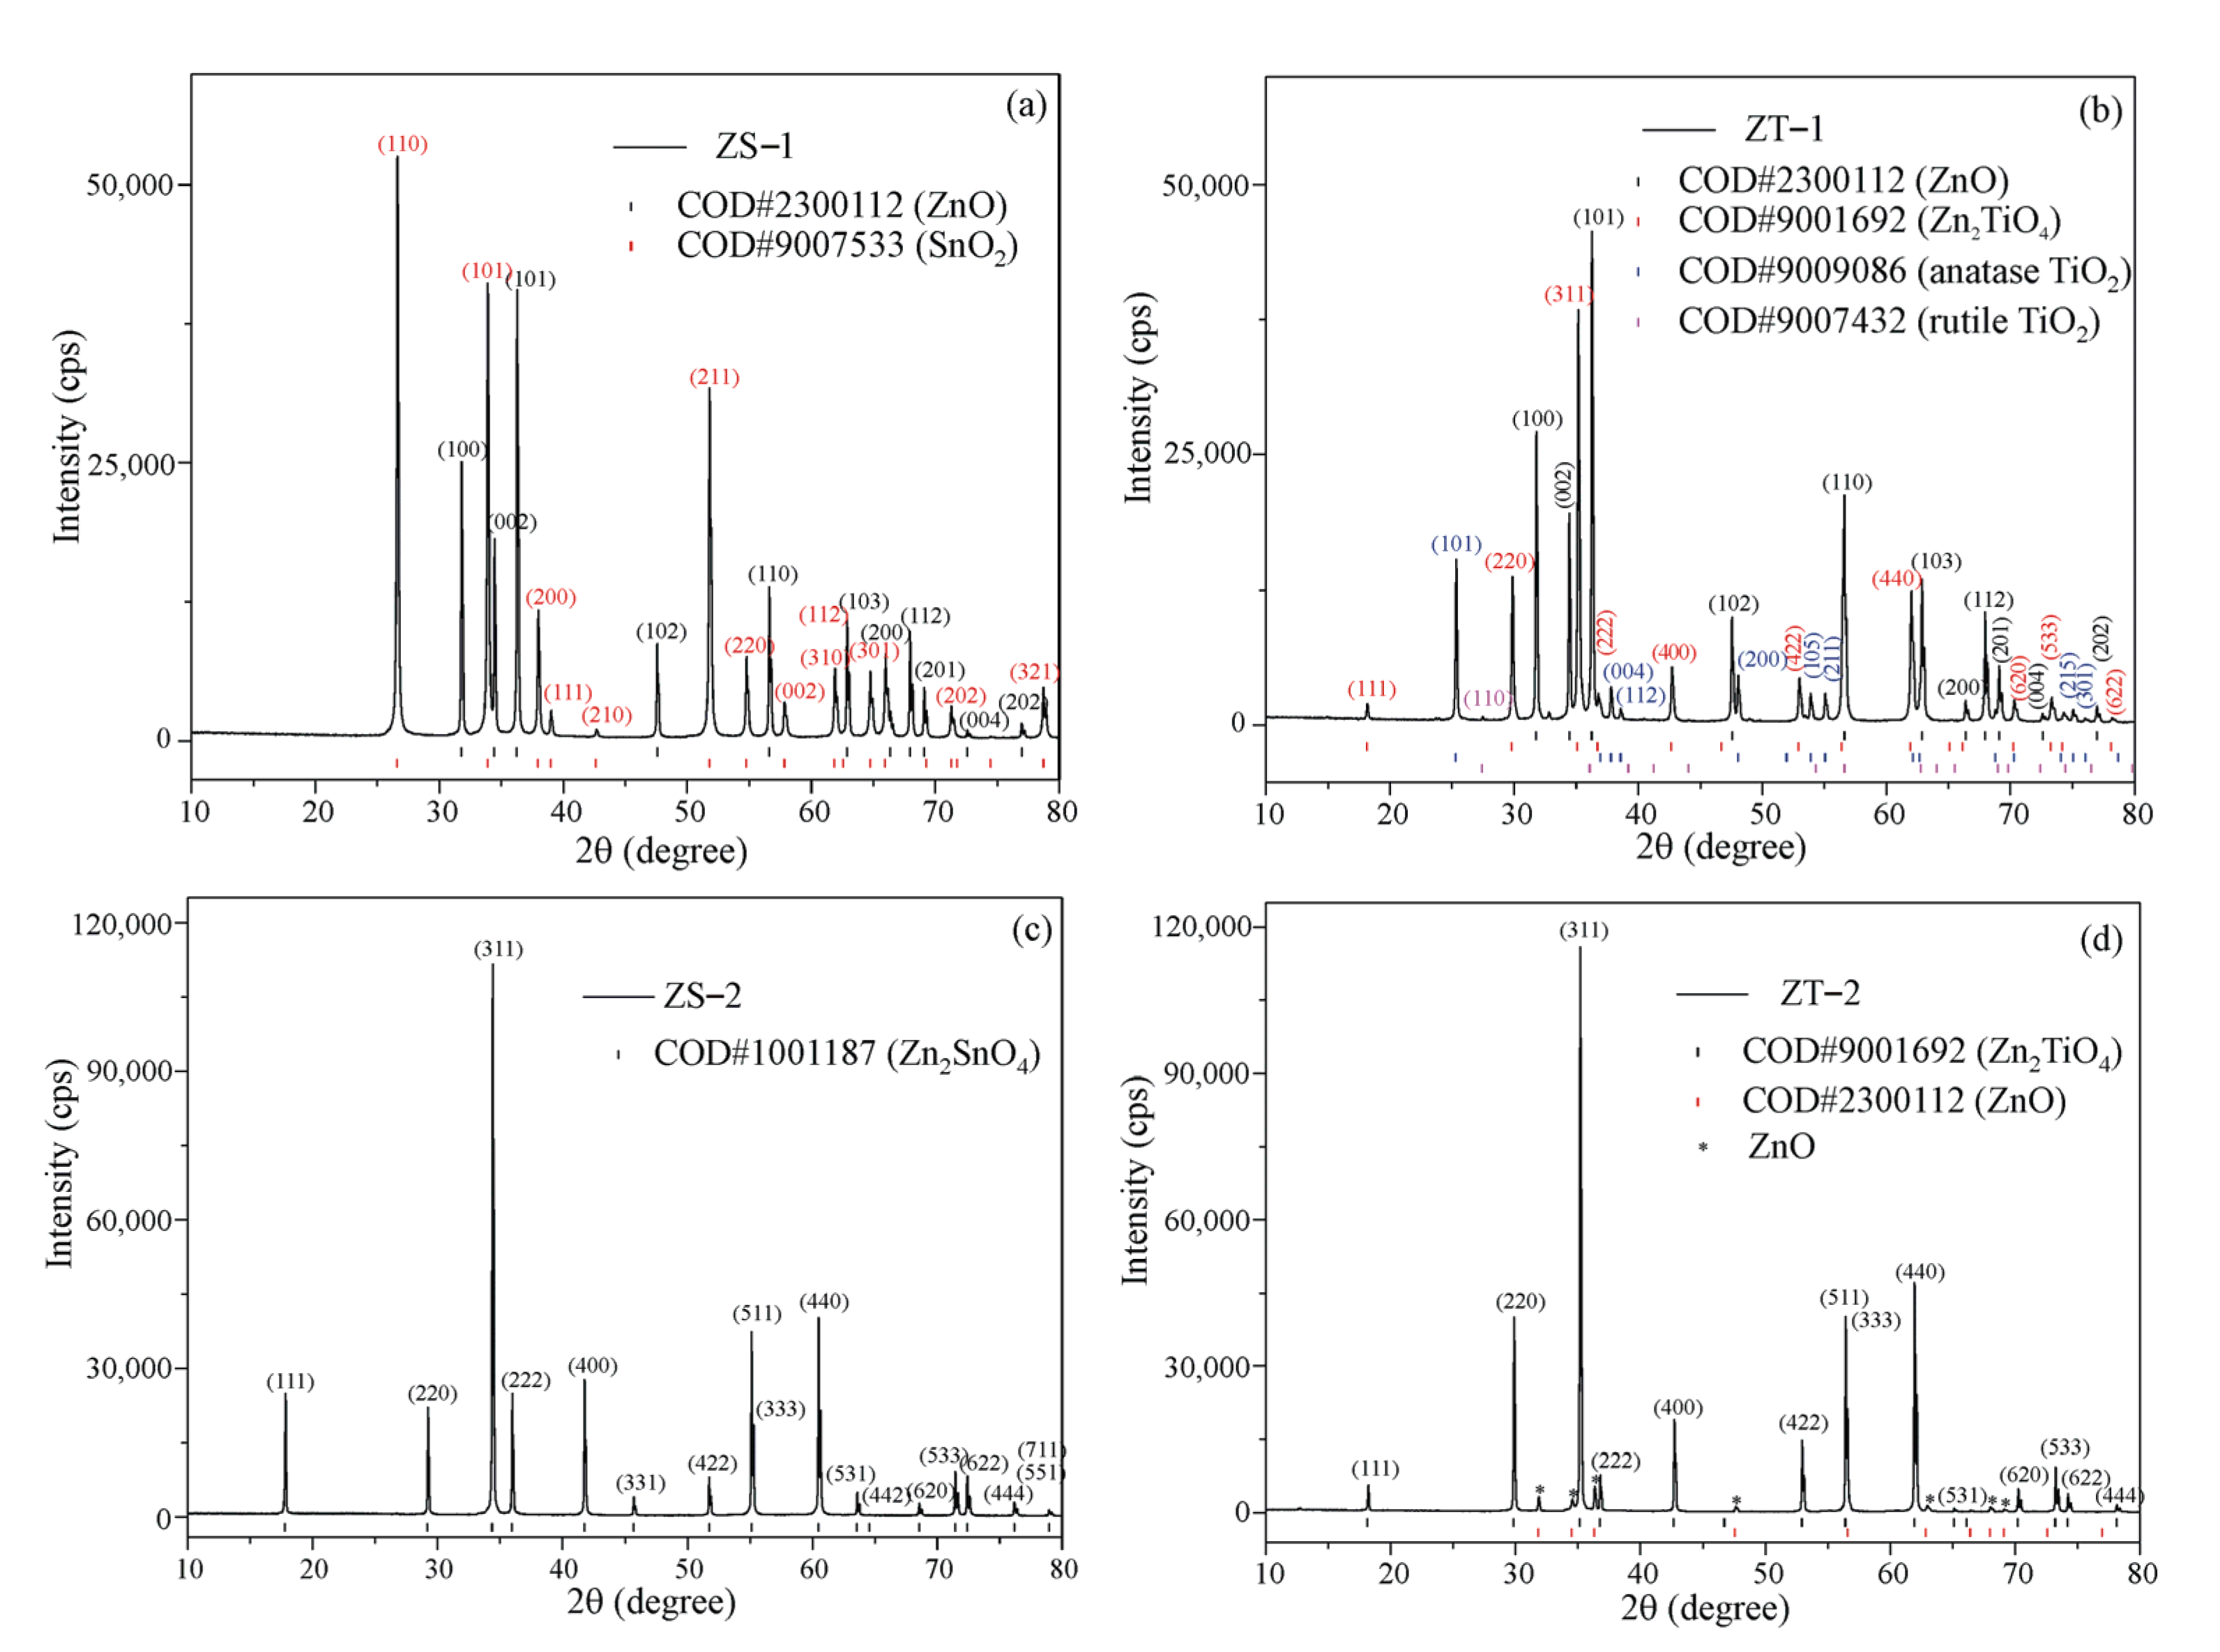
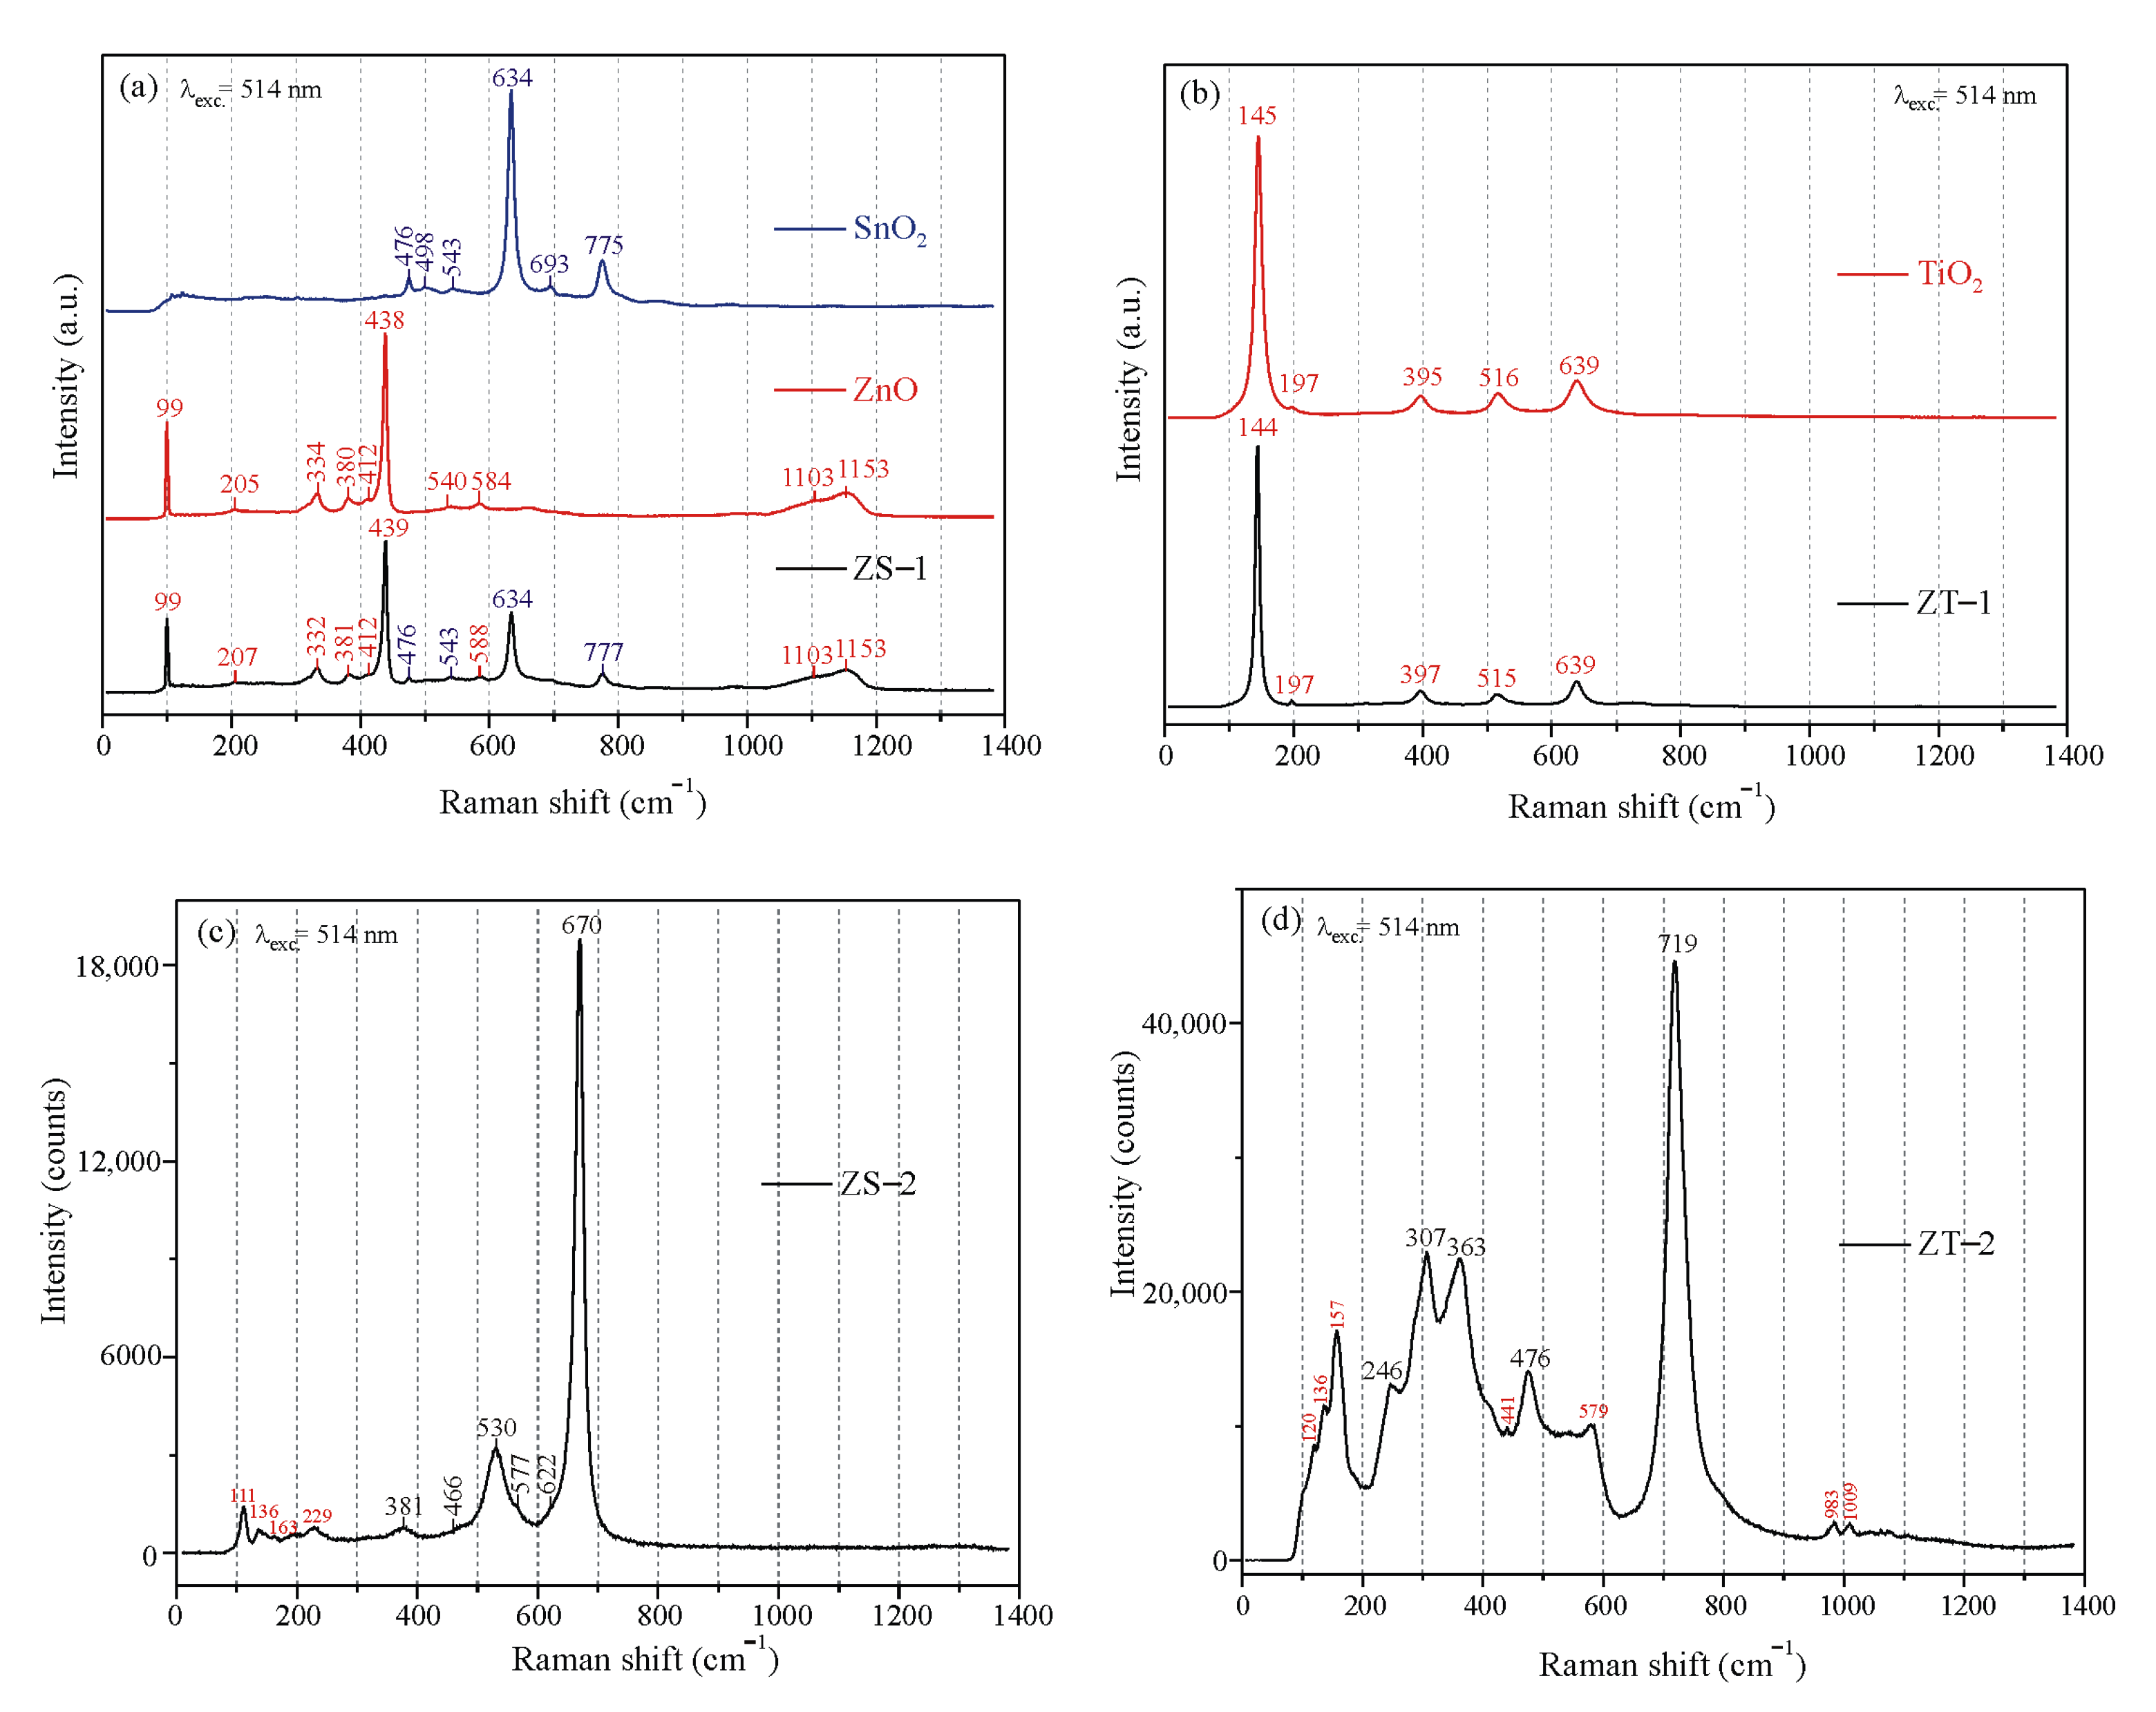
2.2. Crystal Structure Characterization (XRD and Raman) of ZnO-Based Catalysts

Figure 3 shows the XRD diffraction patterns of ZnO-based catalysts. XRD profile analysis was performed using the Rietveld refinement method to identify the phases and estimate their crystallite size and lattice parameters. The obtained values are shown in Table 1, Table 2 and Table 3 together with the statistical parameters of Rietveld fitting quality, R-factors: weighted profile (RWP), profile (RP), expected (REXP), the goodness of fit (GOF = RWP/REXP). ICDD cards: 2300112, 9007533, 9009086, and 9007432 were used for the identification of ZnO, SnO2, anatase TiO2 (hereafter TiO2 (A)), and rutile TiO2 (hereafter TiO2 (R)), respectively, in the ZS–1 (Table 1), ZT–1 (Table 2), and ZT–2 (Table 3). ICDD cards: 1001187 and 9001692 were used to index the peaks of Zn2SnO4 and Zn2TiO4 phases present in the ZS–2 and ZT–2, respectively (Table 3). Both Zn2SnO4 and Zn2TiO4 phases crystallized in the face-centered cubic spinel structure. The low-intensity peaks of residual ZnO were found in ZT–2 (Figure 3d), but the % ZnO could not be quantified and was considered an impurity. The crystalline dimensions of all phases present were in the nano range of 50–80 nm (Table 1, Table 2 and Table 3).
Raman spectroscopy of the resulting binary and ternary ZnO-based catalysts obtained by 514 nm excitation is shown in Figure 4. Figure 4a shows the Raman spectrum of ZS–1 with vibrational modes of both ZnO and SnO2, which is consistent with the percentage of these phases found in ZS–1 (Table 1). The Raman positions of ZS–1 are in good agreement with previous reports [23,39]. However, the Raman spectrum of ZT–1 (Figure 4b) shows vibrational modes of only the anatase TiO2 structure with a total of five modes found at 144, 197, 397, 515, and 639 cm−1. Similar vibrational behavior of the ZnO/TiO2 mixture was previously reported [28], except that our experiments did not show vibrations belonging to the ZnO and Zn2TiO4 phases found there.
Figure 4c,d show the vibration characteristics of ternary ZS–2 and ZT–2 structures, respectively. According to the factor group analysis, the spinel-type ternary compounds (Zn2SnO4 and Zn2TiO4) have five allowed Raman-active modes: A1g + Eg + 3F2g.
The ZS–2 Raman spectrum shows characteristic cubic inverse-spinel type zinc–tin oxide (Zn2SnO4) phonon modes at 381 (F2g), 466 (Eg), 530 (F2g), 577 (F2g), and 670 cm−1 (A1g) [40]. The mode at 622 cm−1 arises when Zn2SnO4 is synthesized by the mechanochemical method [41] due to the disorder of Sn and Zn cations over the tetrahedral (in parentheses brackets) and octahedral [in square brackets] of (Zn2+)[Sn4+Zn2+]O4 structure sites. The leakage Raman peaks observed at 111, 136, 163, and 229 cm−1 do not belong to first-order Raman modes of Zn2SnO4 and could originate from laser plasma effect, order–disorder in Zn2SnO4 structure, or something else.
The band at 719 cm−1 that dominates the ZT–2 Raman spectrum belongs to the A1g mode of Zn2TiO4 structure (Figure 4d), while the much weaker intensity mode at 307 cm−1 has the Eg symmetry. Three other lower-intensity peaks at 246, 363, and 476 cm−1 of the Zn2TiO4 first-order Raman modes are indexed as F2g modes [42]. Leakage peaks of the ZT–2 are marked red in Figure 4d.

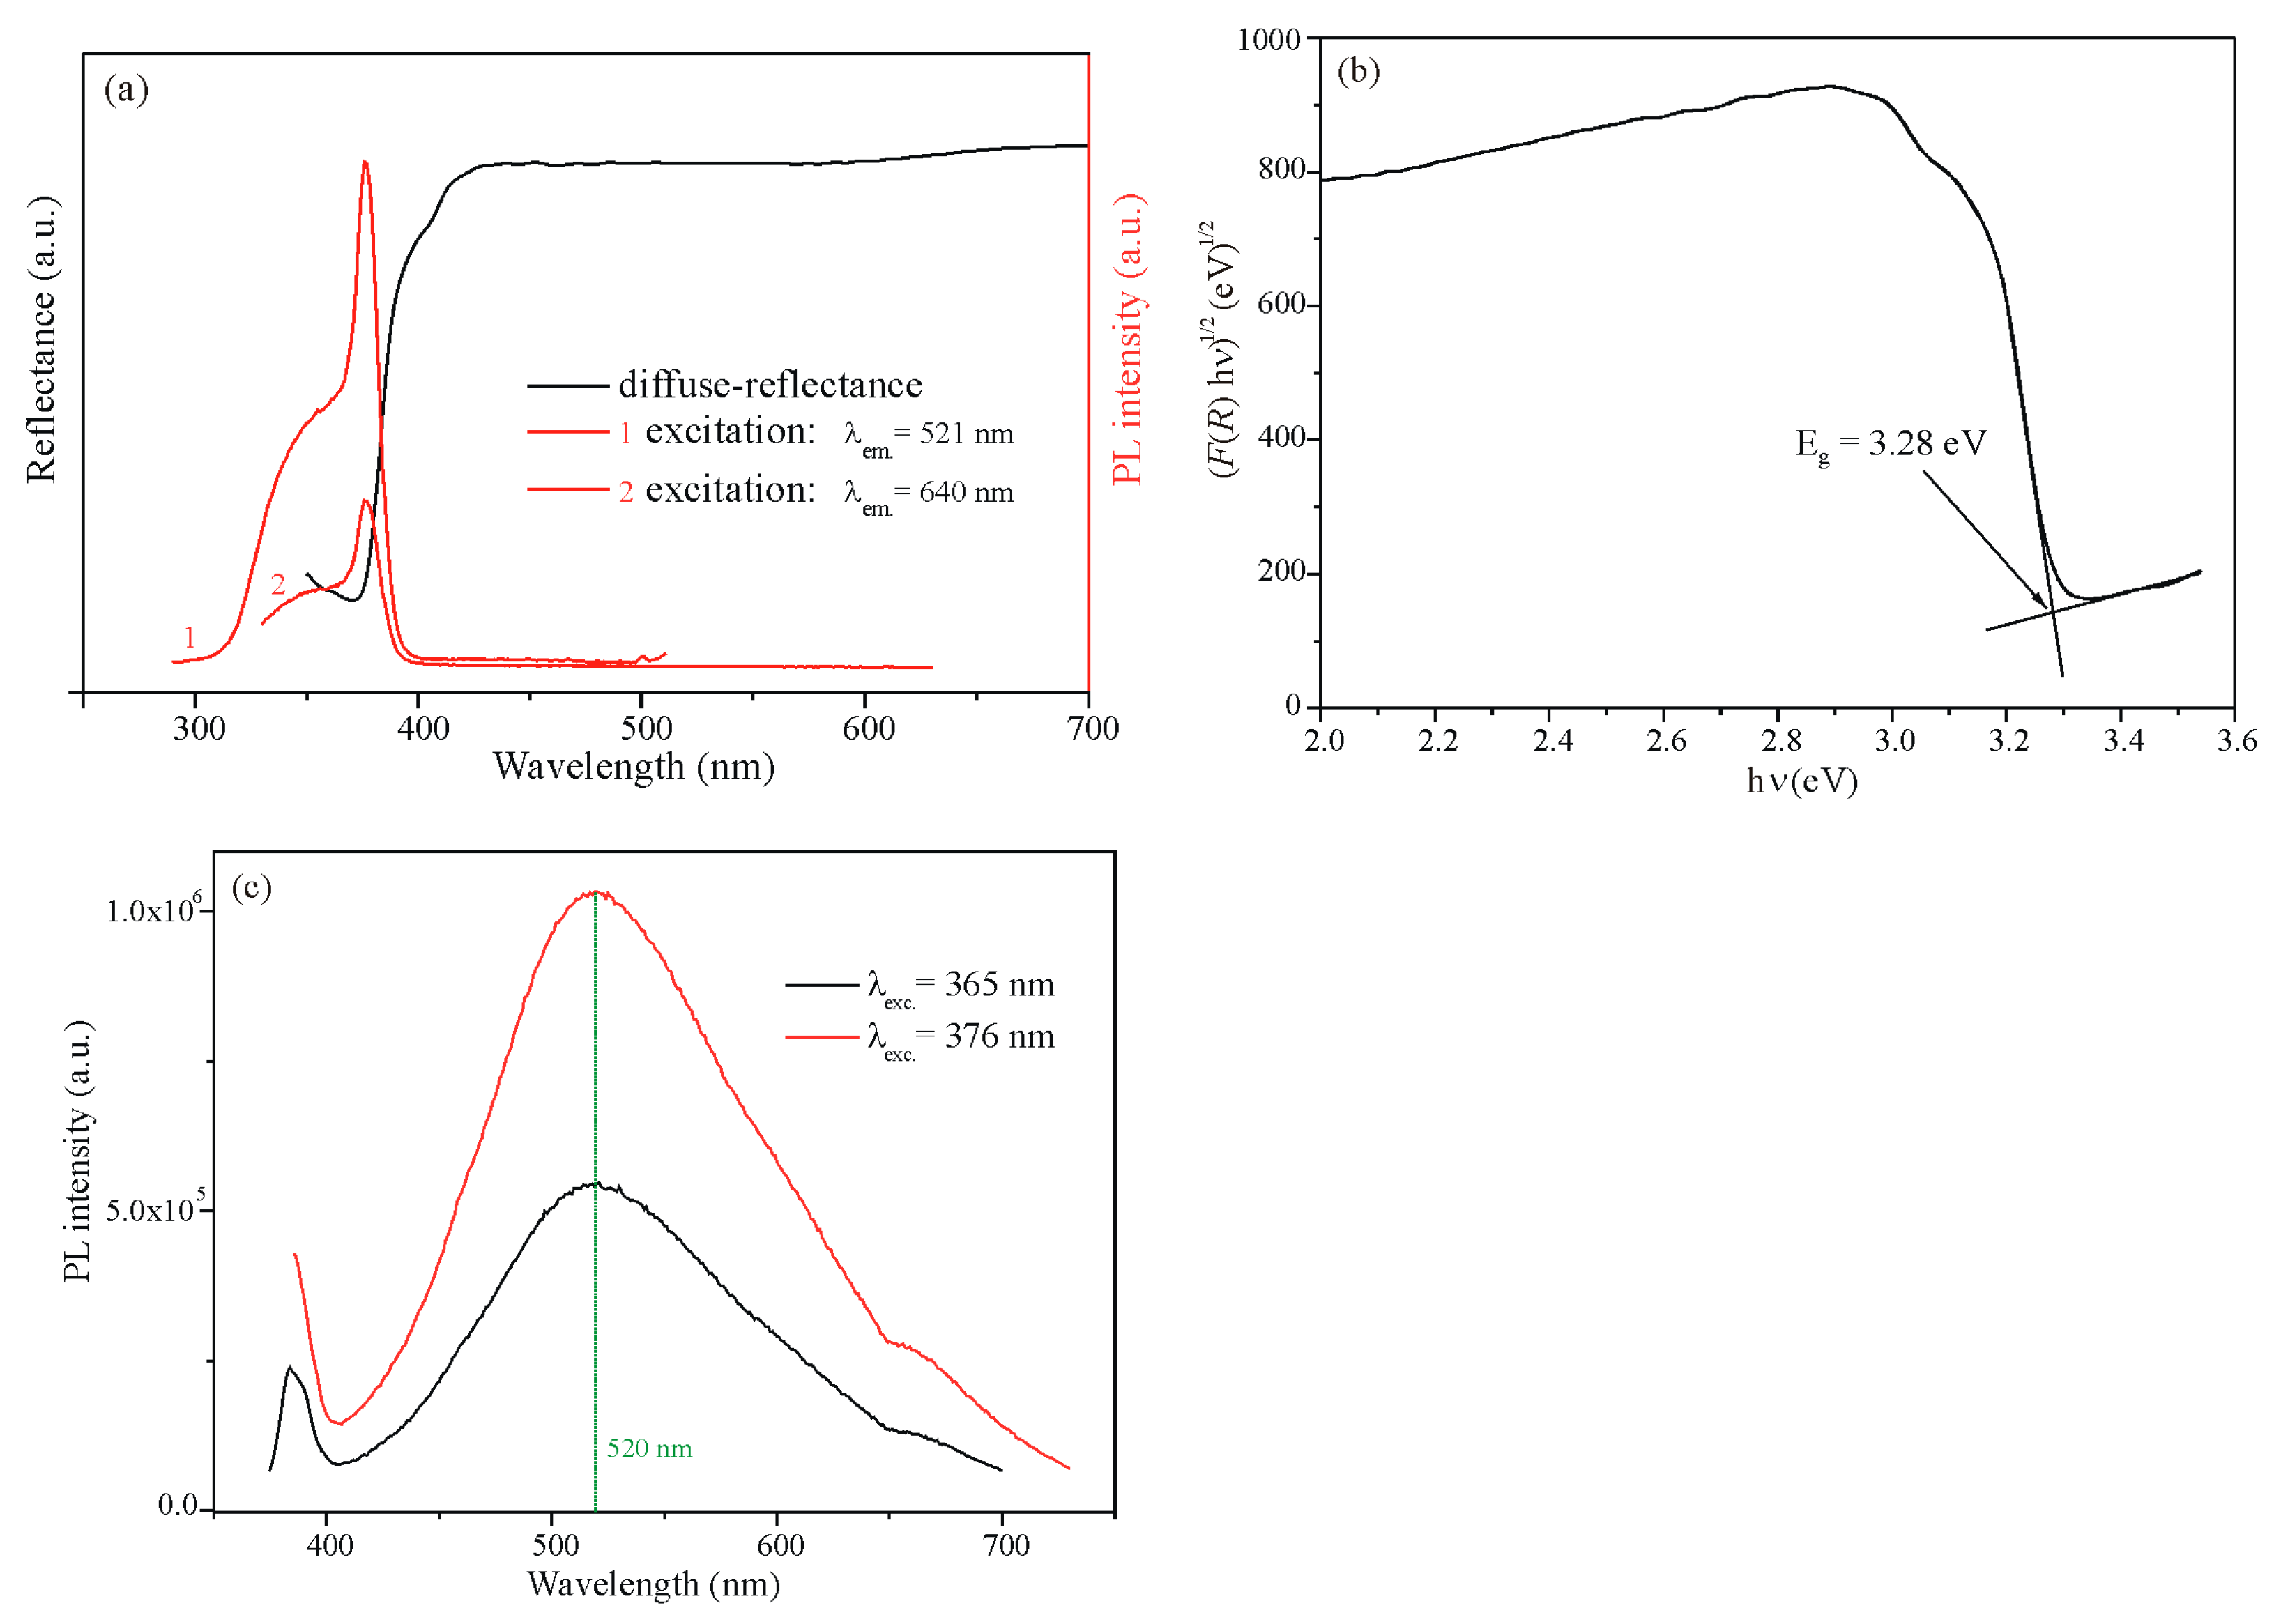
2.3. UV-Vis DRS and PL Characterization of ZnO-Based Catalysts

DRS spectra (example of ZT–2 is shown in Figure 5a) were used to estimate the optical band gap energy (Eg) by plotting the (F(R)·hν)1/n vs. photon energy (hν), where F(R) is the Kubelka–Munk transformation of the measured diffuse reflectance (%) defined as (1-R)2/2R (example of ZT–2 is shown in Figure 5b). The estimation of the optical band gap was performed using the model of indirect band gap transition, where the value of n = 2 was used in (F(R)·hν)1/n vs. photon energy (hν) plot. The estimated values (summarized in Table 4) were in the range of 3.08–3.36 eV, while the optical absorption thresholds of ZnO-based catalysts calculated as 1240/Eg were between 369–402 nm (Table 4), which confirms their UV and Vis absorption photocatalytic capacity. Although the proposed fundamental Eg of Zn2SnO4 is 3.6–3.7 eV, previous experimental and theoretical reports on the band gap of Zn2SnO4 have shown large variability in the obtained Eg values from 3.32 to 4.1 eV [40]. The lower Eg value of 3.36 eV (ZS–2) estimated in our experiments may be the result of defect traps formed during mechanochemical synthesis. The optical energy band gap of 3.28 eV found for Zn2TiO4 (ZT–2) is consistent with the literature data, where, similar to Zn2SnO4, different values of the optical energy band gap, caused by different microstructures, the grain sizes, etc., have been reported in the range of 3.0–3.8 eV [43,44]. The estimated Eg of binary ZnO/TiO2 (ZT–1) is between the Eg of single metal oxides (Eg of ZnO = 3.2 eV is commonly reported for ZnO powder [40]; Eg of anatase TiO2 = 3.2 eV) and ternary Zn2TiO4 (the Zn2TiO4 content of 41.42 wt. % is found in ZT–1). However, the Eg of the ZnO/SnO2 (ZS–1) mixture has the lowest value of 3.08 eV, which is again consistent with previous reports [39,40], and it is lower than single oxides (Eg of ZnO = 3.2 e; Eg of SnO2 = 3.9 eV [40]). This lowest value of the optical band gap indicates that the ZS–1 has the highest capacity for visible photocatalysis among these catalysts, but also the close contact-type heterojunction between ZnO and SnO2 in the binary ZnO/SnO2 (ZS–1), i.e., their effective coupling [39,40].
Compatible results were obtained by PL spectroscopy (an example for ZT–2 is shown in Figure 5a–c). The PL excitation spectra of ZT–2 under 521 nm and 640 nm emissions (Figure 5a) confirm the position of the optical absorption edge, as the PL peak at around 378 nm belongs to the optical band gap emission estimated by DRS to 3.28 eV (Table 4). Moreover, the PL emission spectra of ZT–2 shown in Figure 5c with excitations at 365 and 376 nm show green emissions with a band centered at about 520 nm. Semiconductor nanomaterials (such as ZnO, Zn2SnO4, SnO2), often show such green emissions, which are due to oxygen vacancies that induce the formation of new energy levels in the band gap or other similar luminescent center formed during synthesis, as a photo-excited hole with an electron occupying oxygen vacancy yields these green emissions [45].

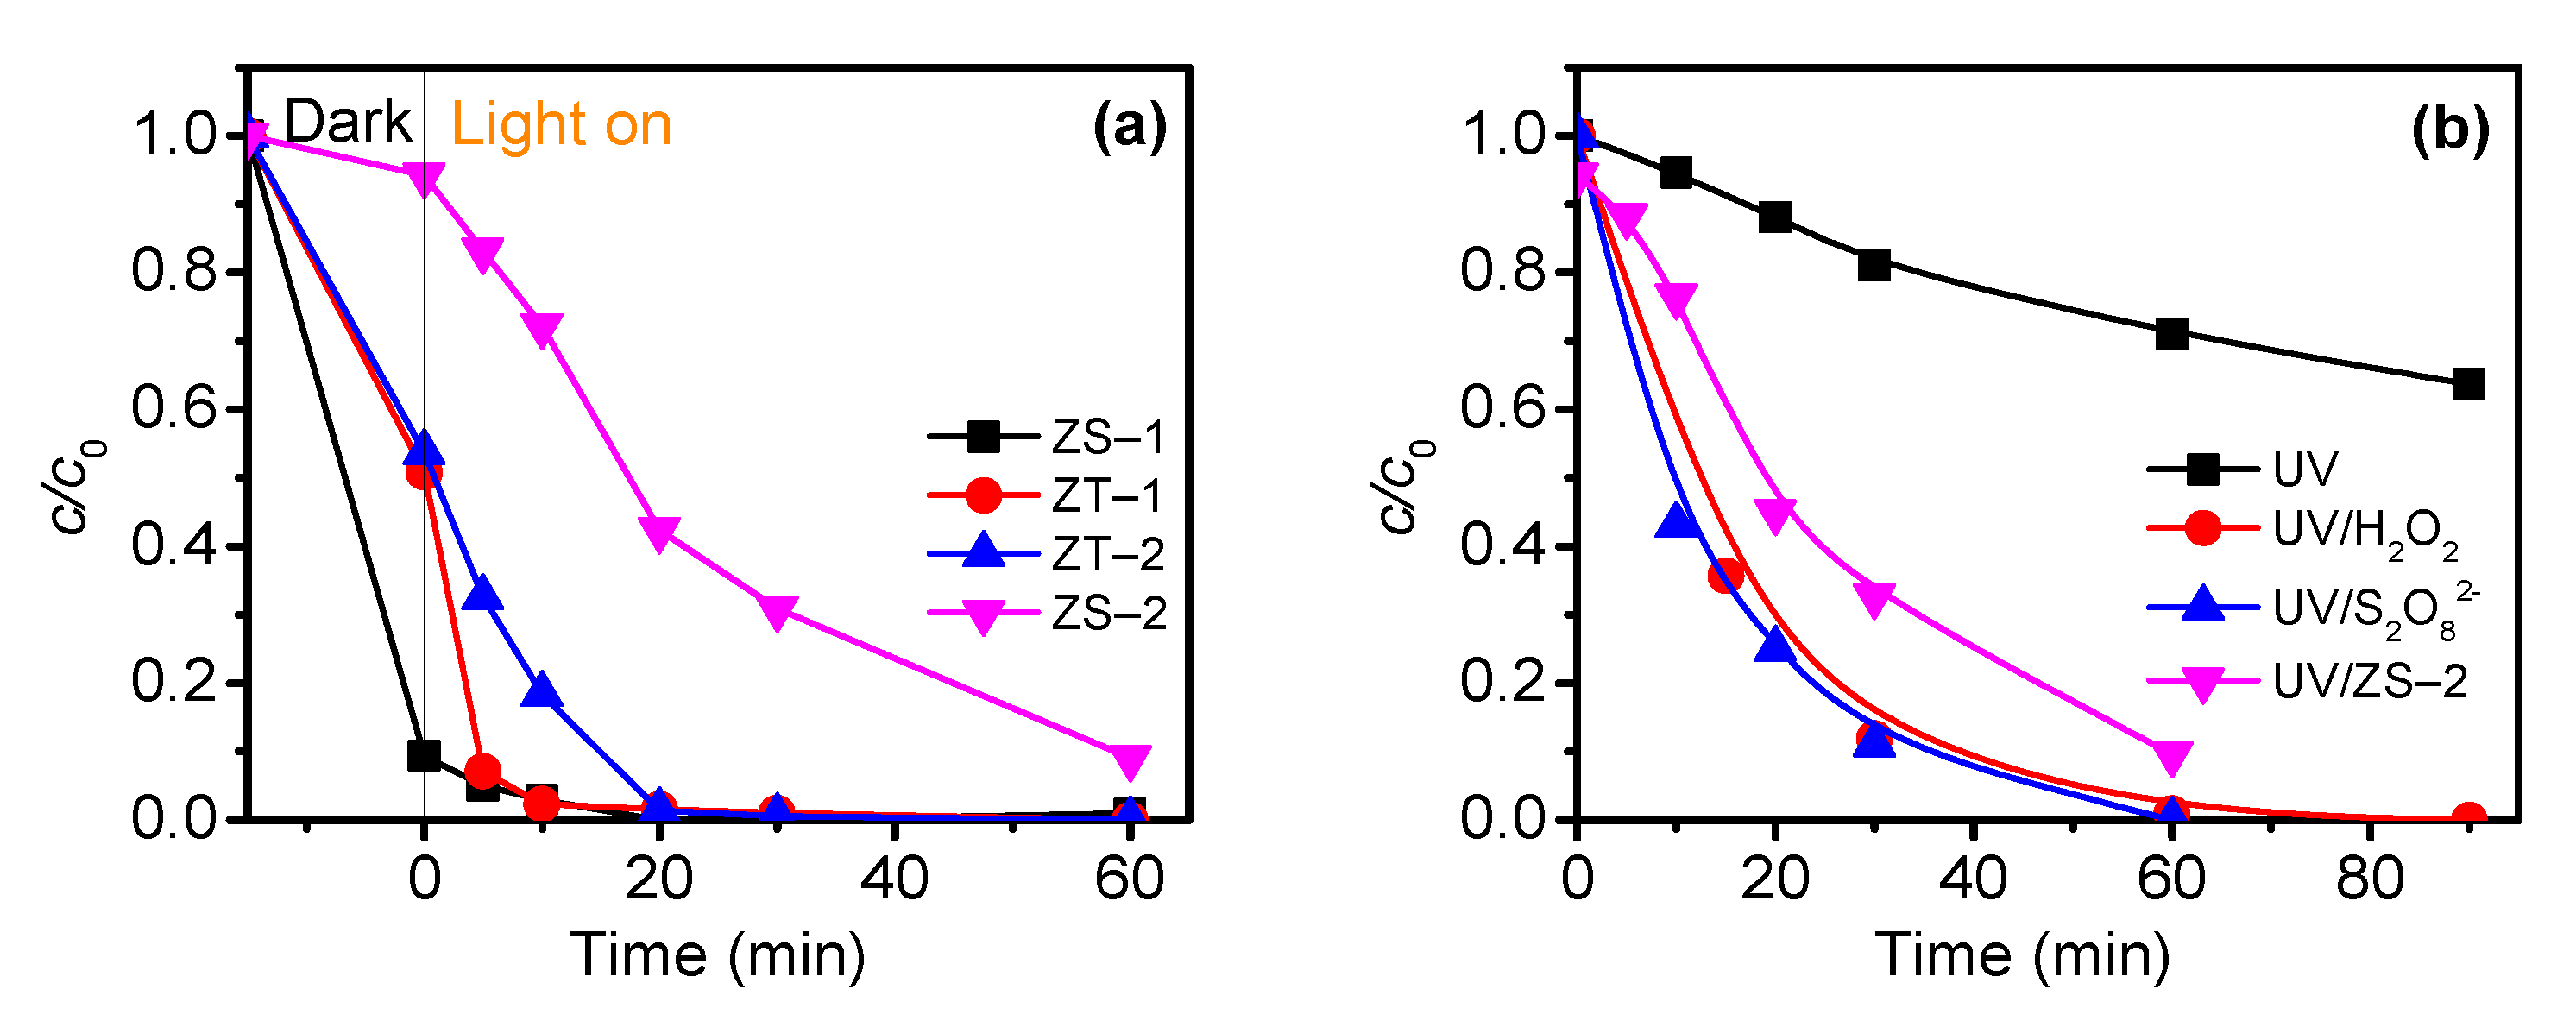
2.4. Effect of Photocatalyst Type

Figure 6a shows the efficiency of FB1 removal from reaction suspensions using ZS–1, ZT–1, ZS–2 and ZT–2 nanocrystallites under UV irradiation in ultrapure water (UPW). As can be seen, depending on the catalyst type, the degree of adsorption as well as FB1 degradation was very different. The degree of FB1 adsorption on ZS–1 during sonification in the dark was as much as 90%, whereas it was about 50% for ZT–1 and ZT–2, and only 6% for ZS–2 (Figure 6a). The complete removal of FB1 using ZS–1, ZT–1, and ZT–2 after 20 min of degradation can be explained by the abovementioned high adsorption, while in the system with ZS–2, 90% of FB1 was removed after 60 min of irradiation. A different degree of FB1 adsorption on the studied nanocrystallites is probably due to the differences in their chemical composition. Similarly, the tests of the efficiency of ZnO and TiO2 Degussa P25 for FB1 removal revealed the FB1 adsorption in the dark (15 min) of 90 and 100%, respectively [46]. The somewhat lower FB1 adsorption in the case of ZT–1 compared to ZnO and TiO2 [46] was probably due to the presence of about 41% Zn2TiO4, while the TiO2 content was only about 15% (Table 2). Since the least FB1 adsorption was observed in the system with ZS–2 (Figure 6a), further experiments were carried out in the presence of this catalyst.
By comparing the efficiency of FB1 photocatalytic removal using ZS–2 with the efficiency of direct (UV) and indirect (UV/H2O2 and UV/S2O82−) photolysis under optimal conditions [46], it was found that the most efficient removal of FB1 was achieved by indirect photolysis (Figure 6b). Namely, during the first 30 min of irradiation, 26% of FB1 was degraded by direct photolysis, 88% by UV/H2O2, and 89% by UV/S2O82− (Figure 6b). In the case of photocatalysis, 67% of FB1 was removed after the same irradiation time. The difference in the efficiency of indirect photolysis and photocatalysis decreases over time, so after 60 min of irradiation, it was about 10%. Under the relevant experimental conditions, the reactions followed pseudo-first-order kinetics. On the basis of the kinetic curves lnc (substrate concentration) vs. t, the values of the apparent first-order degradation rate constant (k′) were calculated (Table S1, from Supplementary Materials). Almost the same values for the degradation rate constant were observed using UV/H2O2 and UV/S2O82− treatment (0.071 min−1) where the correlation coefficients were (r) 0.996, while a lower k′ was obtained using photocatalytic treatment (0.039 min−1, r = 0.992).
All tests on the efficiency of FB1 removal using different treatments were carried out at initial pH ~8, since the different water samples tested in this study had a pH of around 8. In this way, the influence of pH on the efficiency of FB1 removal was eliminated.

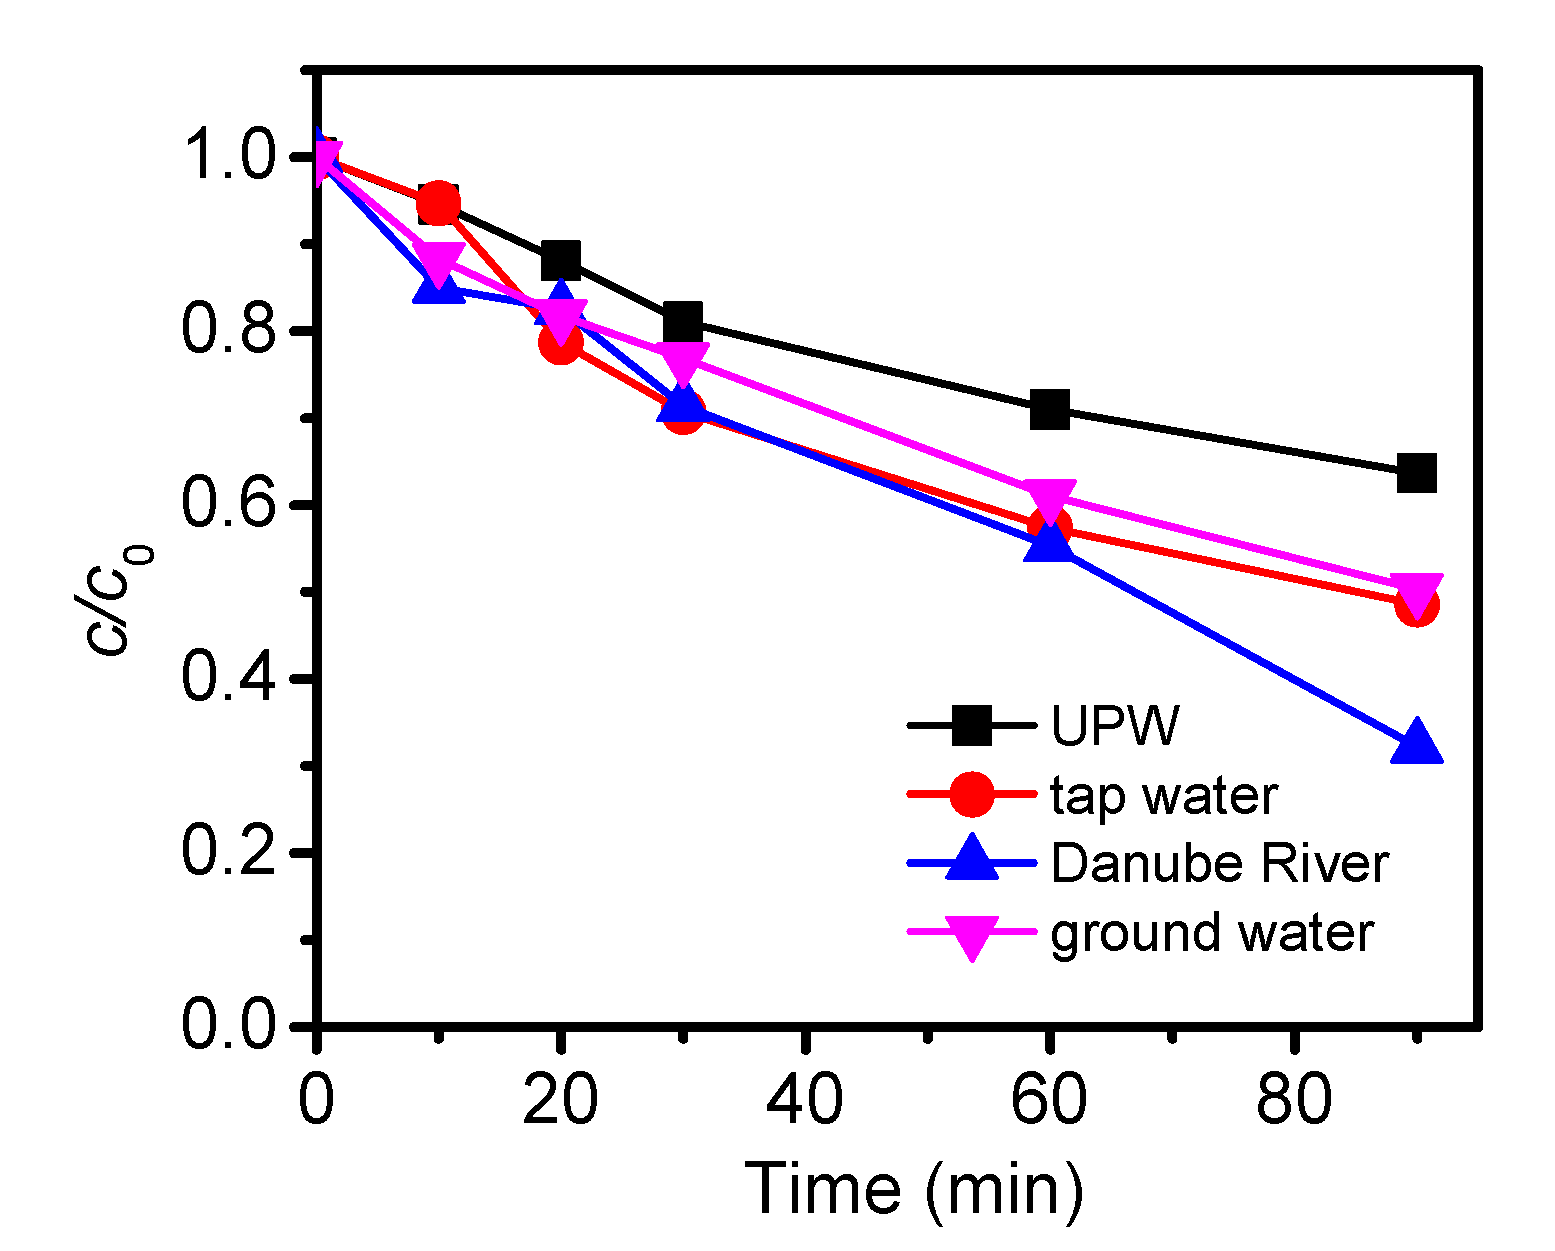
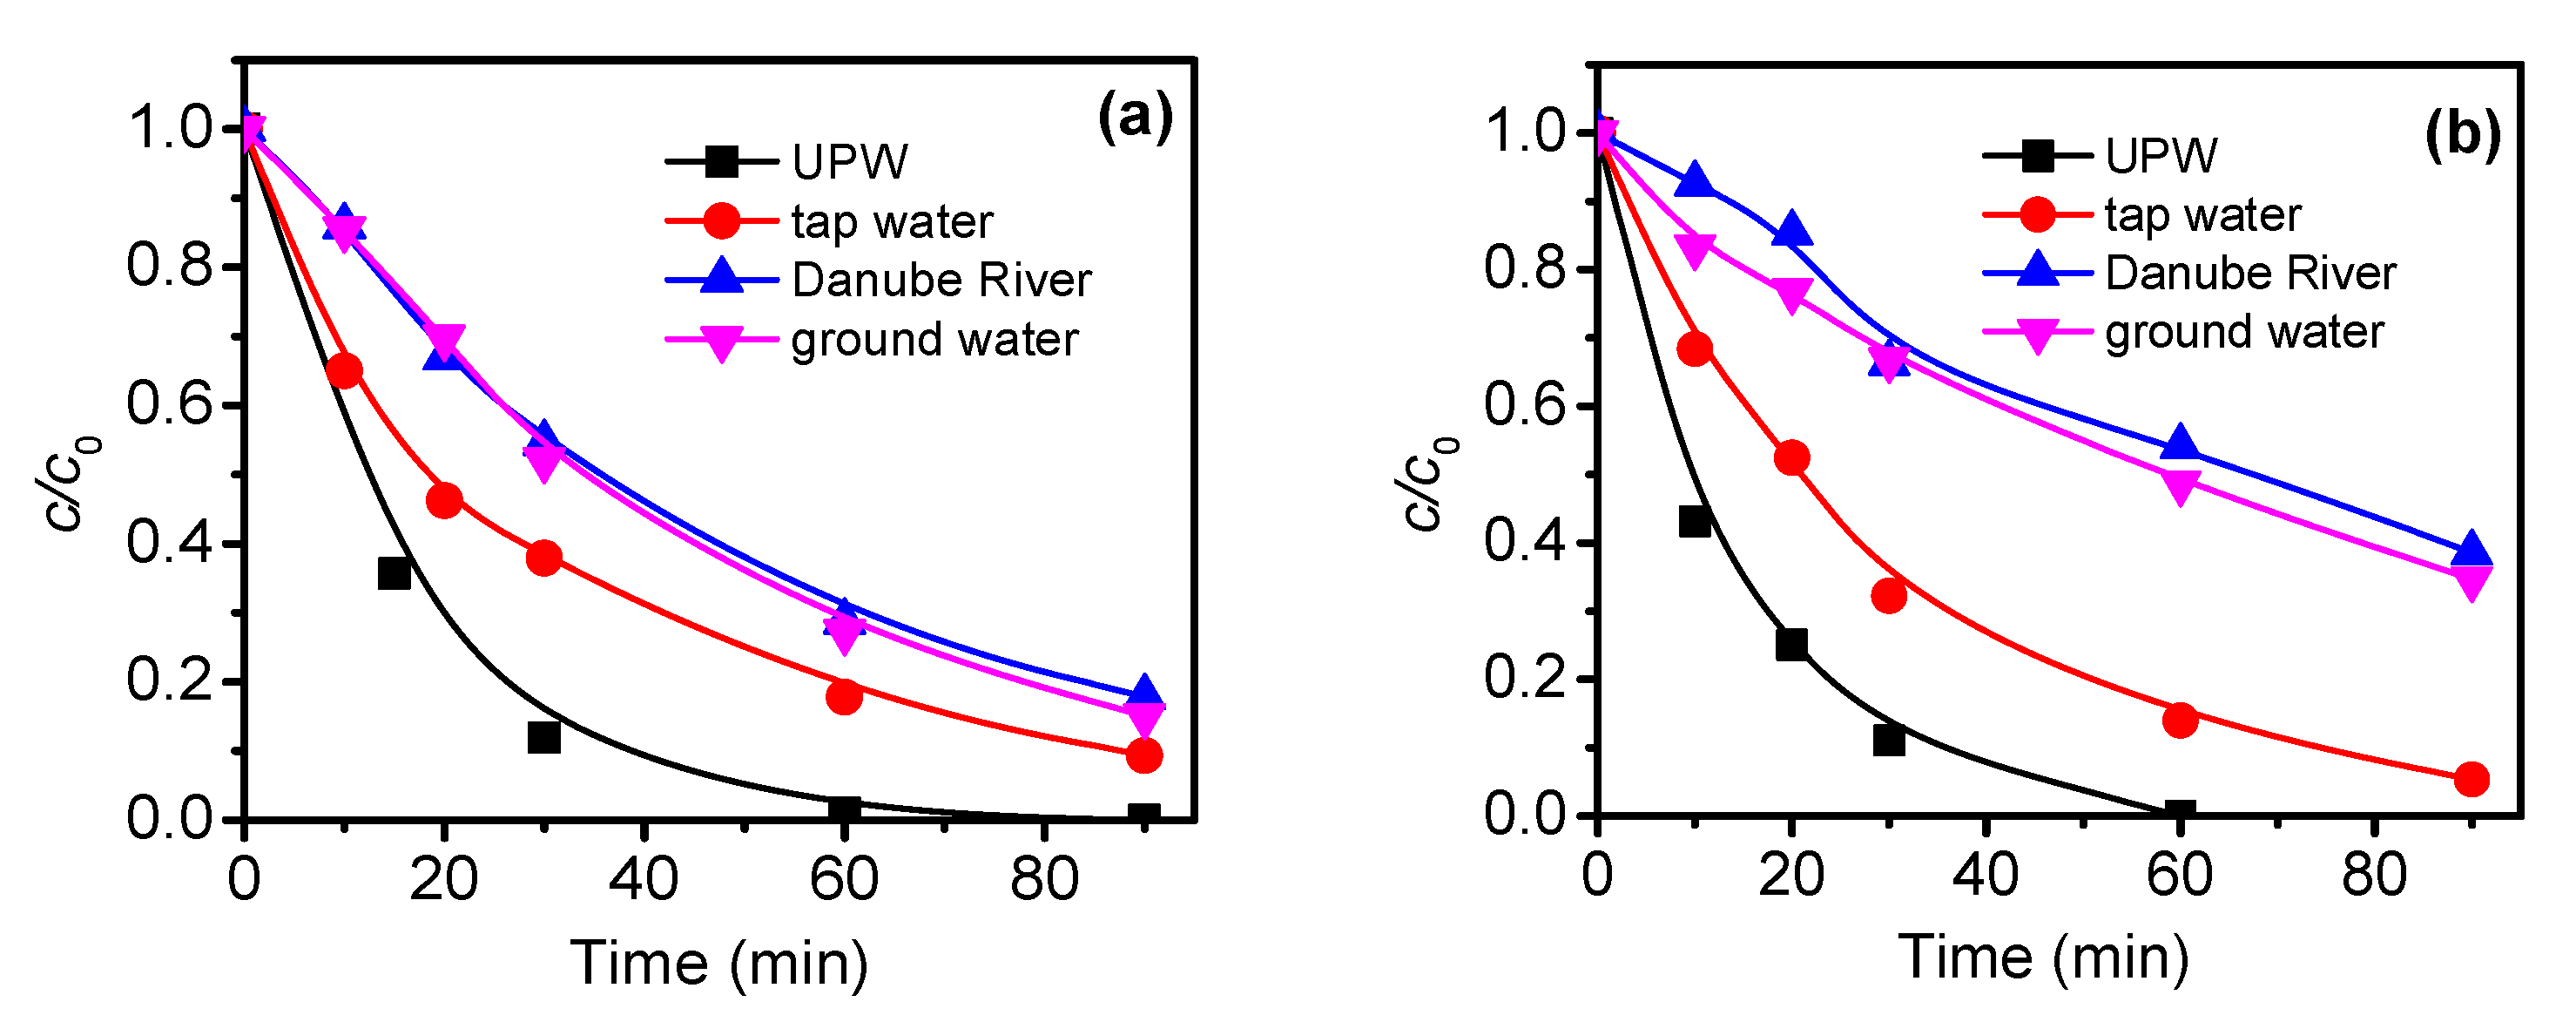
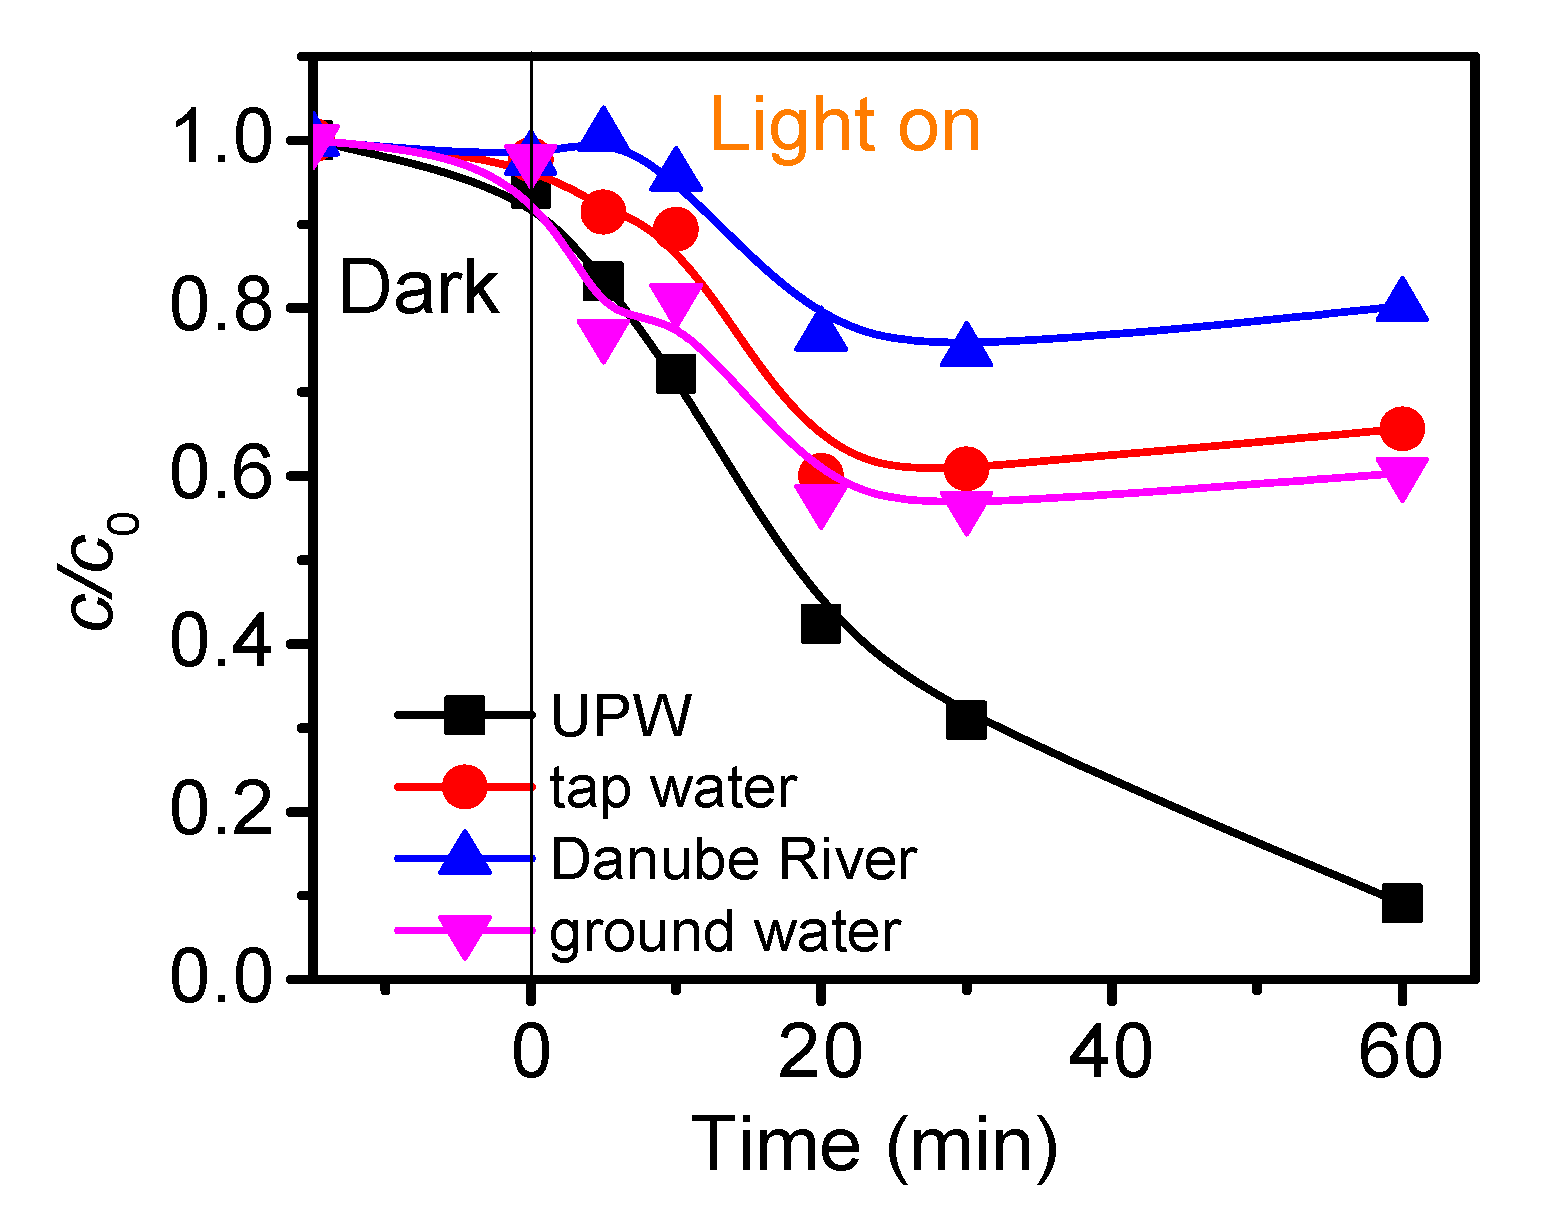
2.5. The Effect of the Matrix of Different Types of Water

Considering the presence of a large number of different ions and organic substances in natural waters and their different composition, the removal rate of FB1 in different natural types of water (tap, Danube, and ground) was compared using UV photolysis and photocatalysis. As can be seen in Figure 7, the efficiency of FB1 degradation by direct photolysis increases in tap, Danube, and ground water as compared to UPW. The efficiency of degradation during the first 30 min of irradiation was approximately the same for all four types of water. However, after 90 min of irradiation, the efficiency of FB1 removal was significantly changed. The efficiency of FB1 degradation was the highest in Danube water (Figure 7; 68%), which was almost twice as high as in UPW (Figure 7; 36%). On the other hand, the degradation efficiency in tap and ground water was almost the same—52% and 50%, respectively (Figure 7). The degradation rate constants of FB1 in different types of water are presented in Table S2 (Supplementary Materials). A certain difference in relation to the degradation efficiency is a consequence of determining the degradation rate constant for the first 60 min of irradiation when the linear regression coefficient is the highest. During the photodegradation process, the pH value of the reaction suspension was monitored, and the pH value was increased by 0.5–1 pH units. The largest increase was recorded in Danube water, where the highest efficiency of degradation was determined. This is probably due to the formation of intermediates that increase the pH. During the decomposition in UPW, the pH only changed by about 0.2 pH units.
The efficiency/degradation rate constants of indirect photolysis in the degradation of FB1 in different types of water matrixes were also investigated (Figure 8, Table S3) (Supplementary Materials). The matrix influence on UV/H2O2 treatment can be seen in Figure 8a, while the influence on UV/S2O82− treatment is shown in Figure 8b. It is known that the natural water matrix usually reduces the oxidation efficiency of the target pollutant by consuming OH radicals generated during UV/H2O2 treatment, and the pollutant degradation rate is expected to be lower [47]. The same result was observed during UV/S2O82− treatment, where natural waters and various ions also slowed down the degradation of pollutants [48]. Our findings are consistent with previously reported data, as the greatest and fastest degradation of FB1 was observed in the UPW using UV/H2O2 (Figure 8a). Namely, in the first 10 min of treatment, the degradation rates in tap water and UPW were similar; however, during further irradiation, the degradation efficiency started to differ. More importantly, after 90 min of irradiation, 91% and 100% of FB1 was degraded in tap water and UPW, respectively (Figure 8a). Slightly lower efficiency of FB1 degradation was observed in Danube and ground water during the entire treatment. After 90 min of irradiation, the degradation efficiency of FB1 in the Danube and ground water was 82% and 85%, respectively (Figure 8a). We obtained similar results in the case of the degradation rate constants of FB1 (Table S3) (Supplementary Materials). A certain difference in relation to the degradation efficiency is a consequence of determining the degradation rate constant for the first 60 min of irradiation when the linear regression coefficient is the highest. Based on the data obtained during the pH monitoring in the conducted experiments, it can be seen that the initial pH increased by one pH unit in tap water, while in natural waters, it increased by 0.6–0.8 pH units. In the case of UPW, the pH increased to 8.5 during the first 30 min of irradiation, and then decreased to 7.8 after 90 min. The pH change during indirect photolysis could be explained by the formation/disappearance of certain degradation intermediates.
Kinetic curves in Figure 8b show that the complete degradation of FB1 was achieved in UPW after 60 min of irradiation (Figure 8b), while in other types of water, even 90 min of irradiation was not enough for complete degradation (Figure 8b). A higher FB1 removal efficiency was observed in tap water, where 95% of FB1 was degraded after 90 min of irradiation (Figure 8b) as compared to natural waters, where the degradation percentage was about 60% for the same irradiation time (Figure 8b). UV/H2O2 and UV/S2O82− treatments acted similarly, as the kinetic of the FB1 degradation reaction was similar in both mentioned processes. This is also shown by the values for the decomposition rate constant, which are significantly higher in UPW compared to other types of water, regardless of the treatment (Table S3) (Supplementary Materials). In all tested water types, the initial pH was ~8. During the treatment, the pH increased by 0.6–1 pH units in Danube, tap, and ground water, whereas it decreased by 0.6 pH units in UPW. As previously assumed, this is likely due to the formation/disappearance of certain degradation intermediates.
The photocatalytic efficiency of FB1 removal in different types of water was also investigated. As can be seen in Figure 9, the highest FB1 removal efficiency was achieved in UPW, similar to the indirect photolysis. After 30 min of irradiation, about 40% of FB1 was removed from tap and ground water, while the removal rate in Danube water was 25%. On the other hand, about 70% of FB1 was removed from the UPW after the same time of irradiation. After 60 min of treatment, the percentage of FB1 removal from UPW was 90%, while significantly lower removal rates were observed for other types of water for the same treatment period, being 40% for ground water, 35% for tap water, and 20% for Danube water. The degradation rate constants of FB1 in different types of water are presented in Table S4 (Supplementary Materials). Furthermore, a significant increase in pH (by about one pH unit) was also observed in these waters, while there was no significant change in the initial pH in UPW. Bearing in mind that the removal efficiency is higher at a lower pH value [46], besides the water matrix effect, increased pH during the treatment probably further reduces the efficiency of FB1 removal from the tap, Danube, and ground water.

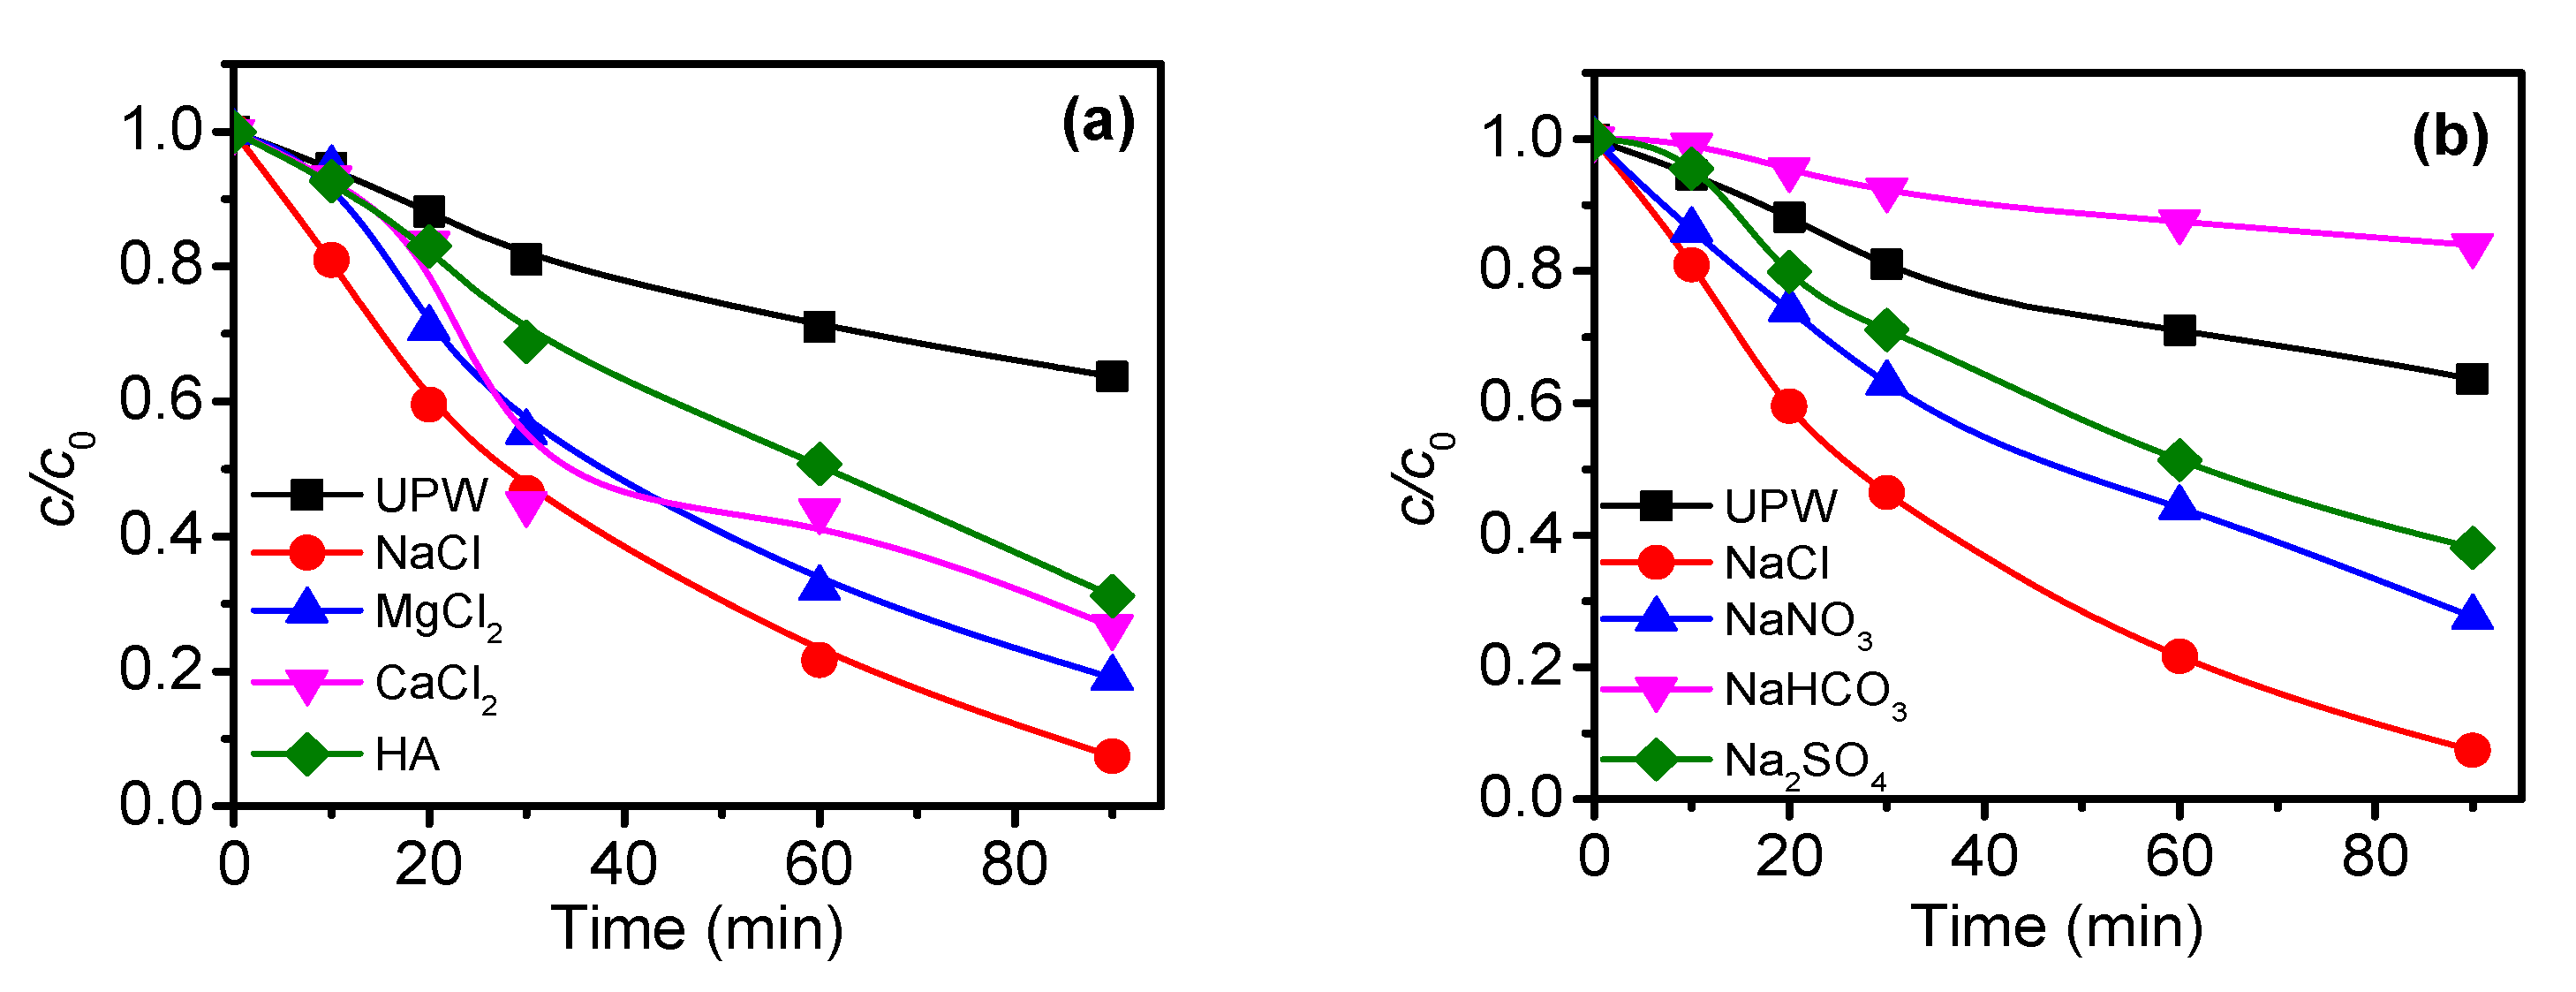
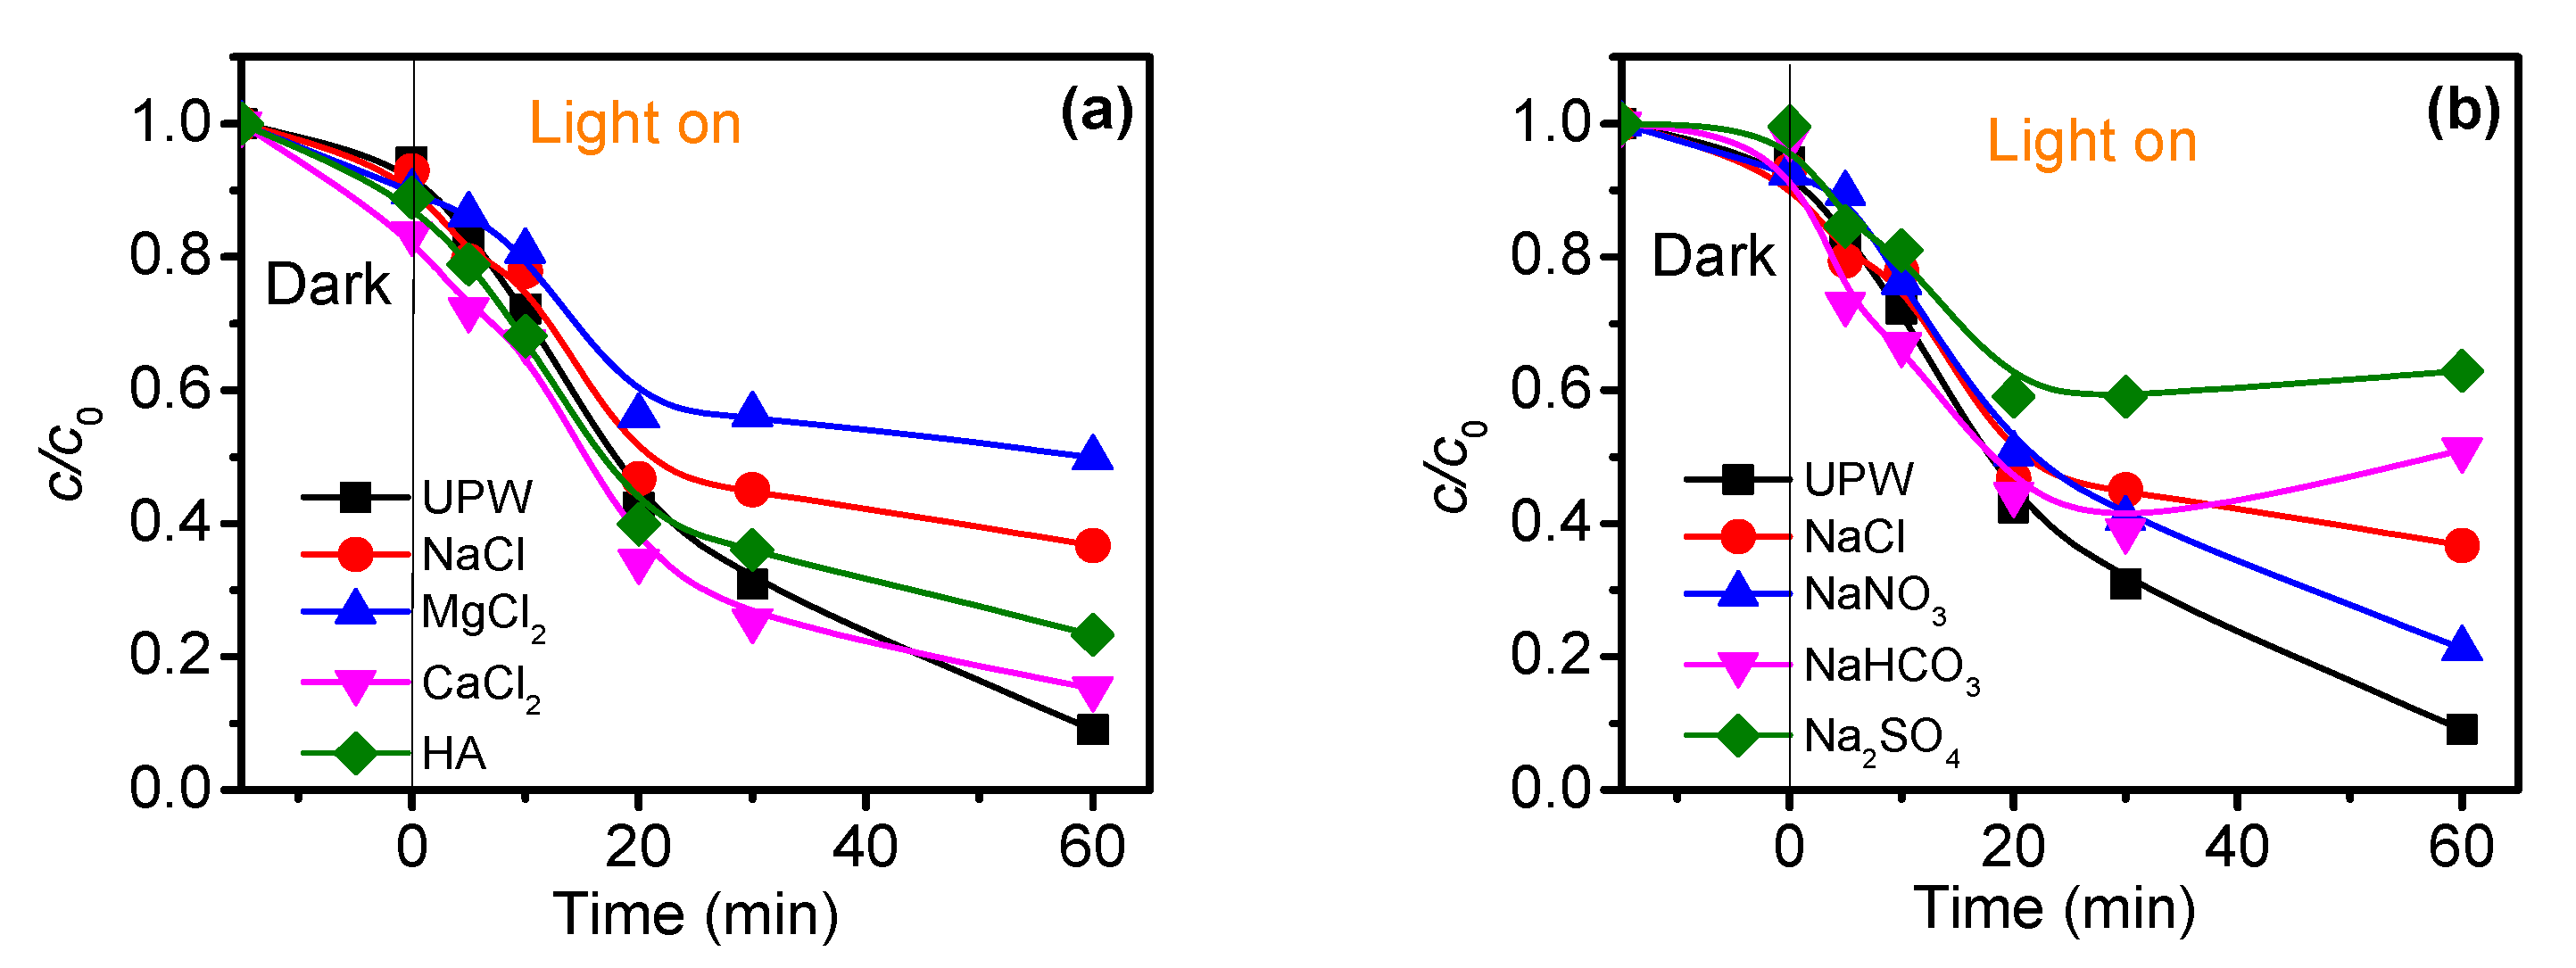
2.6. Effect of Species in the Solution Matrix on FB1 Removal Efficiency Using UV and UV/H2O2

2.6.1. Effect of Cations

Since the content of calcium and magnesium ions was the highest compared to the other cations present in the tested waters, the influence of these cations on the efficiency of direct photolysis of FB1 was investigated by adding their chloride salts MgCl2 and CaCl2 to the reaction suspension (Figure 10a; Table S5) (Supplementary Materials). The mass concentrations of added Mg2+ and Ca2+ ions were 20.30 mg/dm3 and 70.49 mg/dm3, respectively, which were also their maximum concentrations in the tested waters (Table S8). To determine the effect of chloride on photodegradation efficiency, NaCl was added to the tested samples, and the obtained results are shown in Figure 10a, where the chloride concentration was the same as that obtained with MgCl2, while chloride concentration was doubled with CaCl2. The addition of NaCl resulted in 93% degradation of FB1 after 90 min of irradiation, which was about 2.5 times the degradation efficiency in UPW (Figure 10a). Compared to NaCl, a slightly lower efficiency was observed with the addition of MgCl2 when 81% of FB1 was degraded, while in the presence of CaCl2, 73% of FB1 was degraded, which was almost double the degradation efficiency as compared to UPW (Figure 10a).
Based on the obtained results, it can be concluded that the influence of tested compounds on the efficiency of FB1 degradation decreases in the following order: NaCl > MgCl2 > CaCl2. This indicates that positive effect of chloride on the degradation efficiency was strongly evident. However, it should be emphasized that the concentration of chloride in the presence of NaCl (Figure 10a) was twice as low as in the case of CaCl2. Lower FB1 degradation efficiency in the presence of Mg2+ and especially Ca2+ ions is probably due to the formation of complexes of these ions with FB1. Namely, the carboxyl groups of FB1 in neutral conditions have an affinity to form complexes with metal ions [49], which can cause a decrease in the degradation rate of FB1. The more pronounced inhibitory effect of Ca2+ ions than that of Mg2+ is probably due to the formation of a more stable complex with FB1.
The initial pH in the presence of NaCl and CaCl2 was 8.2 and decreased to 7.6 during irradiation. Slightly lower initial pH was measured in the presence of MgCl2 (7.6) and during the degradation; it increased by about 0.4 pH units, while the pH returned to the initial value (7.6) after 90 min of irradiation.
Experiments were also conducted to compare the effect of different water matrixes (Figure 7) with the effect of cations (Figure 10a) on the efficiency of FB1 degradation. Our findings indicated the same degradation trend. However, the influence of the water matrix was less pronounced, which was probably due to the presence of other components that had an inhibiting influence.
Given that the UV/H2O2 treatment proved to be very effective in fumonisin degradation, the effect of cations was also examined using this treatment. The results are shown in Figure 10c, and degradation rate constants of FB1 using UV/H2O2 treatment are presented in Table S6 (Supplementary Materials). As can be seen, both ions (Mg2+ and Ca2+) had an inhibitory effect, since the degradation efficiency of FB1 was lower compared to the degradation in UPW (Figure 10c). It is interesting to note that kinetics curves in the presence of Mg2+ and Ca2+ have a similar shape, where 85% and 75% of FB1 was degraded in the presence of Mg2+ and Ca2+, respectively, after 90 min of irradiation. In the same time, FB1 was completely removed from UPW. For these reasons, the efficiency of FB1 degradation using UV/H2O2 was also investigated in the presence of Cl, and the obtained data are shown in the same figure (Figure 10c). Based on our findings, it can be seen that chloride showed an inhibitory effect, yet it was less pronounced as compared to the reaction mixtures containing Mg2+ and especially Ca2+ ions. Namely, in the presence of NaCl, about 88% of FB1 was degraded after 90 min of irradiation. According to these results, it can be concluded that Mg2+ and Ca2+ ions had an inhibitory effect on both indirect and direct photolysis of FB1. The addition of these cations did not significantly change the pH during FB1 degradation. The pH of the reaction mixture in the presence of NaCl decreased during irradiation by about 0.3 pH units, while in the presence of MgCl2 and CaCl2, there was practically no pH change during the treatment.

2.6.2. Effect of Anions

Given that different anions can also be found in the aqueous environment, their influence on the efficiency of FB1 degradation was also investigated in different water samples. The following inorganic anions were added to UPW: Cl, HCO3, SO42−, and NO3 ions. Their final concentrations were equal to the real concentration of the mentioned anions in the tested types of water.
Effect of chloride: As can be seen in Figure 10b, the presence of Cl increased efficiency of direct photolysis, and 93% of FB1 was degraded after 90 min of irradiation, which is about 2.5 times higher compared to UPW. This phenomenon could be explained by the possible formation of Cl2•− radicals, although there is little chance of this process happening because of applied radiation. Moreover, higher degradation efficiency may also be due to a higher ionic strength in the presence of NaCl [50]. We obtained similar results in the case of the degradation rate constants of FB1 (Table S5) (Supplementary Materials). During the treatment, the pH was monitored, revealing a decrease in pH value by 0.6 units compared to the initial value.
On the other hand, oxidation reactions can also take place between the Cl ion and H2O2, leading to the production of Cl radicals, but this only happens in an acidic environment, usually at pH < 5 (reactions 1 and2) [51]. In the next step, the Clradical reacts with the Cl ion. Since the Cl2•− ion is less reactive than the OH-radical (Cl2•−/2Cl 2.13 V) [52], the inhibition of photodegradation can be related to the reduced OH-radical concentrations (reaction 2). If the reaction takes place in a neutral or basic medium, the inhibition of photodegradation is not very pronounced because the reactions are reversible and flow to the reactants.
OH+ Cl ⇄ HOCl•−
HOCl•− + H+ ⇄ Cl+ H2O
As previously stated, the efficiency of FB1 degradation by direct photolysis was increased in the presence of Cl; however, during indirect UV/H2O2 photolysis in the presence of Cl, the opposite effect was obtained. As can be seen in Figure 10d, decreased FB1 degradation rate was observed in the presence of chloride compared to UPW. After 90 min of irradiation, 88% of FB1 was degraded, whereas the efficiency of FB1 degradation in the absence of chloride was 100%. The degradation rate constants of FB1 using UV/H2O2 treatment are presented in Table S6 (Supplementary Materials). These results are consistent with data published by AlHamedi et al. [53], where the addition of all investigated anions (Cl, NO3, SO42−, PO43−) in the presence of H2O2 inhibited the degradation, but this effect, similar to our research, was less pronounced with chloride. The possible inhibitory effect of Cl has been earlier explained in detail [51].
Effect of nitrates: Experiments were also carried out to determine the effect of NO3 ions. Based on our findings (Figure 10b), it can be concluded that these anions, similarly to Clions, increased the efficiency of FB1 photolytic degradation at natural pH (about 8.2). These results are in accordance with published results, where NO3 ions at low concentrations improved the efficiency of pollutant degradation [54,55]. This phenomenon originates from the UV irradiation of NO3 ions, which generate additional OH radicals that can be used for efficient pollutant removal. Our results show that 72% of FB1 is degraded after 90 min of irradiation, which is twice the degradation efficiency in UPW. Similar results were obtained when examining the effect of nitrates on the degradation rate constant of FB1 (Table S5) (Supplementary Materials). The pH value was monitored throughout the degradation process and did not change significantly, except for a slight drop in the pH value after 30 min of irradiation followed by an increase to 8.6. By the end of the photodegradation, i.e., after 90 min of irradiation, the pH value was about 0.3 pH units higher compared to the initial value (8.5). Since the pH value during the whole process was similar to the treatment in UPW, it can be concluded that the efficiency of FB1 degradation was only influenced by the addition of NO3 ions.
For the UV/H2O2 treatment, in the presence of NO3 ions, 78% of FB1 was removed after 90 min of irradiation (Figure 10d), which is 22% less compared to UPW (Figure 10d). This effect was also reported by Liu et al. [56] during the degradation of the antibiotics florfenicol and thiamphenicol using UV/H2O2 treatment. The authors stated that NO3 ions act as OH radical scavengers (reactions 3 and 4), which reduces the concentration of OH, and thus the rate of antibiotic degradation. Similar results were obtained when examining the effect of nitrate on degradation rate constant of FB1 (Table S6) (Supplementary Materials). The addition of NO3 ions did not significantly affect the pH value, since the initial value was 8.2 being 8.3 at the end of the treatment.
NO3+ H+ → HNO3
•OH + HNO3 → H2O+ NO3
Effect of hydrogencarbonate: Unlike the previous two anions, the addition of HCO3 reduced the efficiency of FB1 degradation by direct UV photolysis (Figure 10b, Table S5) (Supplementary Materials), which is accordance with data in the literature on this effect [57]. After 90 min of irradiation in the presence of HCO3 ions, only 16% of FB1 was degraded, which is about two times less than in UPW. Moreover, HCO3 ions act as scavengers of OH radicals (reaction 5) and thereby inhibit the photodegradation reaction of FB1. The low efficiency of degradation can also be a consequence of a higher initial pH. Similar results were obtained when examining the effect of hydrogencarbonate on the degradation rate constant of FB1 (Table S6) (Supplementary Materials). Still, this effect is not very pronounced, since after addition of HCO3 ions, the initial pH value was 9.0, and during the treatment, it increased by 0.5 pH units to reach 9.5 after 90 min of irradiation.
HCO3 + •OH→ CO3•− + OH
Similar to UV direct photolysis, the presence of HCO3 ions also inhibited the indirect photolysis of FB1 under UV/H2O2 treatment (Figure 10d, Table S6) (Supplementary Materials). During this process, no significant results in the degradation of FB1 were achieved. This result is in accordance with the data of Li et al. [56], where the inhibition of clofibic acid was recorded when HCO3 ion was added, this being due to the trapping of OH radicals. During the degradation of FB1, the pH value changed by about two pH units from the initial 8.0 to the final 10.0.
Effect of sulphate: From Figure 10b and Table S5 (Supplementary Materials), it can be seen that SO42− ions increased the efficiency of photolytic degradation of FB1. Under these experimental conditions, 62% of FB1 was degraded after 90 min of irradiation, while no significant variations in pH (7.7–8.0) were detected. Higher efficiency of FB1 degradation by direct UV photolysis in the presence of stable SO42− ions can be explained by the increased ionic strength of the solution, which also plays a role in the degradation of organic molecules [50].
Furthermore, similar to the already examined ions, the presence of SO42− ions inhibits FB1 degradation by UV/H2O2 treatment as compared to direct photolysis. As can be seen in Figure 10d, the degradation of FB1 after 90 min of irradiation was 86%, which is similar to the results obtained with the addition of NaCl. However, the inhibitory effect of SO42− ions on the FB1 degradation efficiency at the beginning of the treatment was somewhat more pronounced. The inhibitory effect of SO4•− ions was probably due to the reduced concentration of OH radicals (reaction 6). In spite of the formation of SO4•− radicals, which can further oxidize organic molecules, the FB1 degradation efficiency was lower compared to UPW (Table S6) (Supplementary Materials). Similar results were obtained by AlHamedi et al. [53], who investigated the influence of the SO42− ions on the efficiency of rhodamine B degradation using UV/H2O2 treatment. The initial pH value during FB1 degradation was slightly lower (7.5) and did not change significantly during the treatment (7.8).
SO42− + •OH→SO4•− + OH

2.6.3. Effect of Humic Acid

Based on the obtained results, it can be concluded that HA (Figure 10a), similar to chloride and nitrate ions, increased the rate of direct FB1 photolysis using UV radiation (Figure 10b). During the first 20 min of irradiation with the addition of HA, 17% of FB1 was degraded. After 90 min of irradiation in the presence of HA, 69% of FB1 was degraded, while 36% of FB1 was removed from UPW (Figure 10a). Similar results were obtained when examining the effect of HA on the degradation rate constant of FB1 (Table S5) (Supplementary Materials). The obtained results are in accordance with the data in the literature, where the addition of HA led to more efficient degradation of pollutants [58,59]. However, Ren et al. [59] found that HA can improve the degradation efficiency up to a certain concentration, after which it acts as a scavenger of reactive oxygen species, thus reducing the efficiency of photolysis. The pH was also monitored and a slight decrease of about 0.8 units was noted.
Figure 10c shows the efficiency of FB1 degradation using UV/H2O2 treatment with the addition of HA. HA showed an inhibitory effect, as 70% of FB1 was degraded after 90 min of irradiation, which is 30% less than in the case of indirect photolysis of FB1 in UPW. Similar results were obtained when examining the effect of HA on degradation rate constant of FB1 (Table S6) (Supplementary Materials). The obtained results are in agreement with published data [55], where the inhibitory effect of HA on UV/H2O2 treatment was also confirmed. In addition to the fact that HA acid can act as a scavenger of free OH radicals (reaction 7), higher concentrations of HA can also reduce the penetration of UV light through the irradiated solution [55]. Moreover, a slight change in pH was also observed during the treatment, as the pH increased from 7.6 to 7.9.
•OH + HA → HA• + H2O

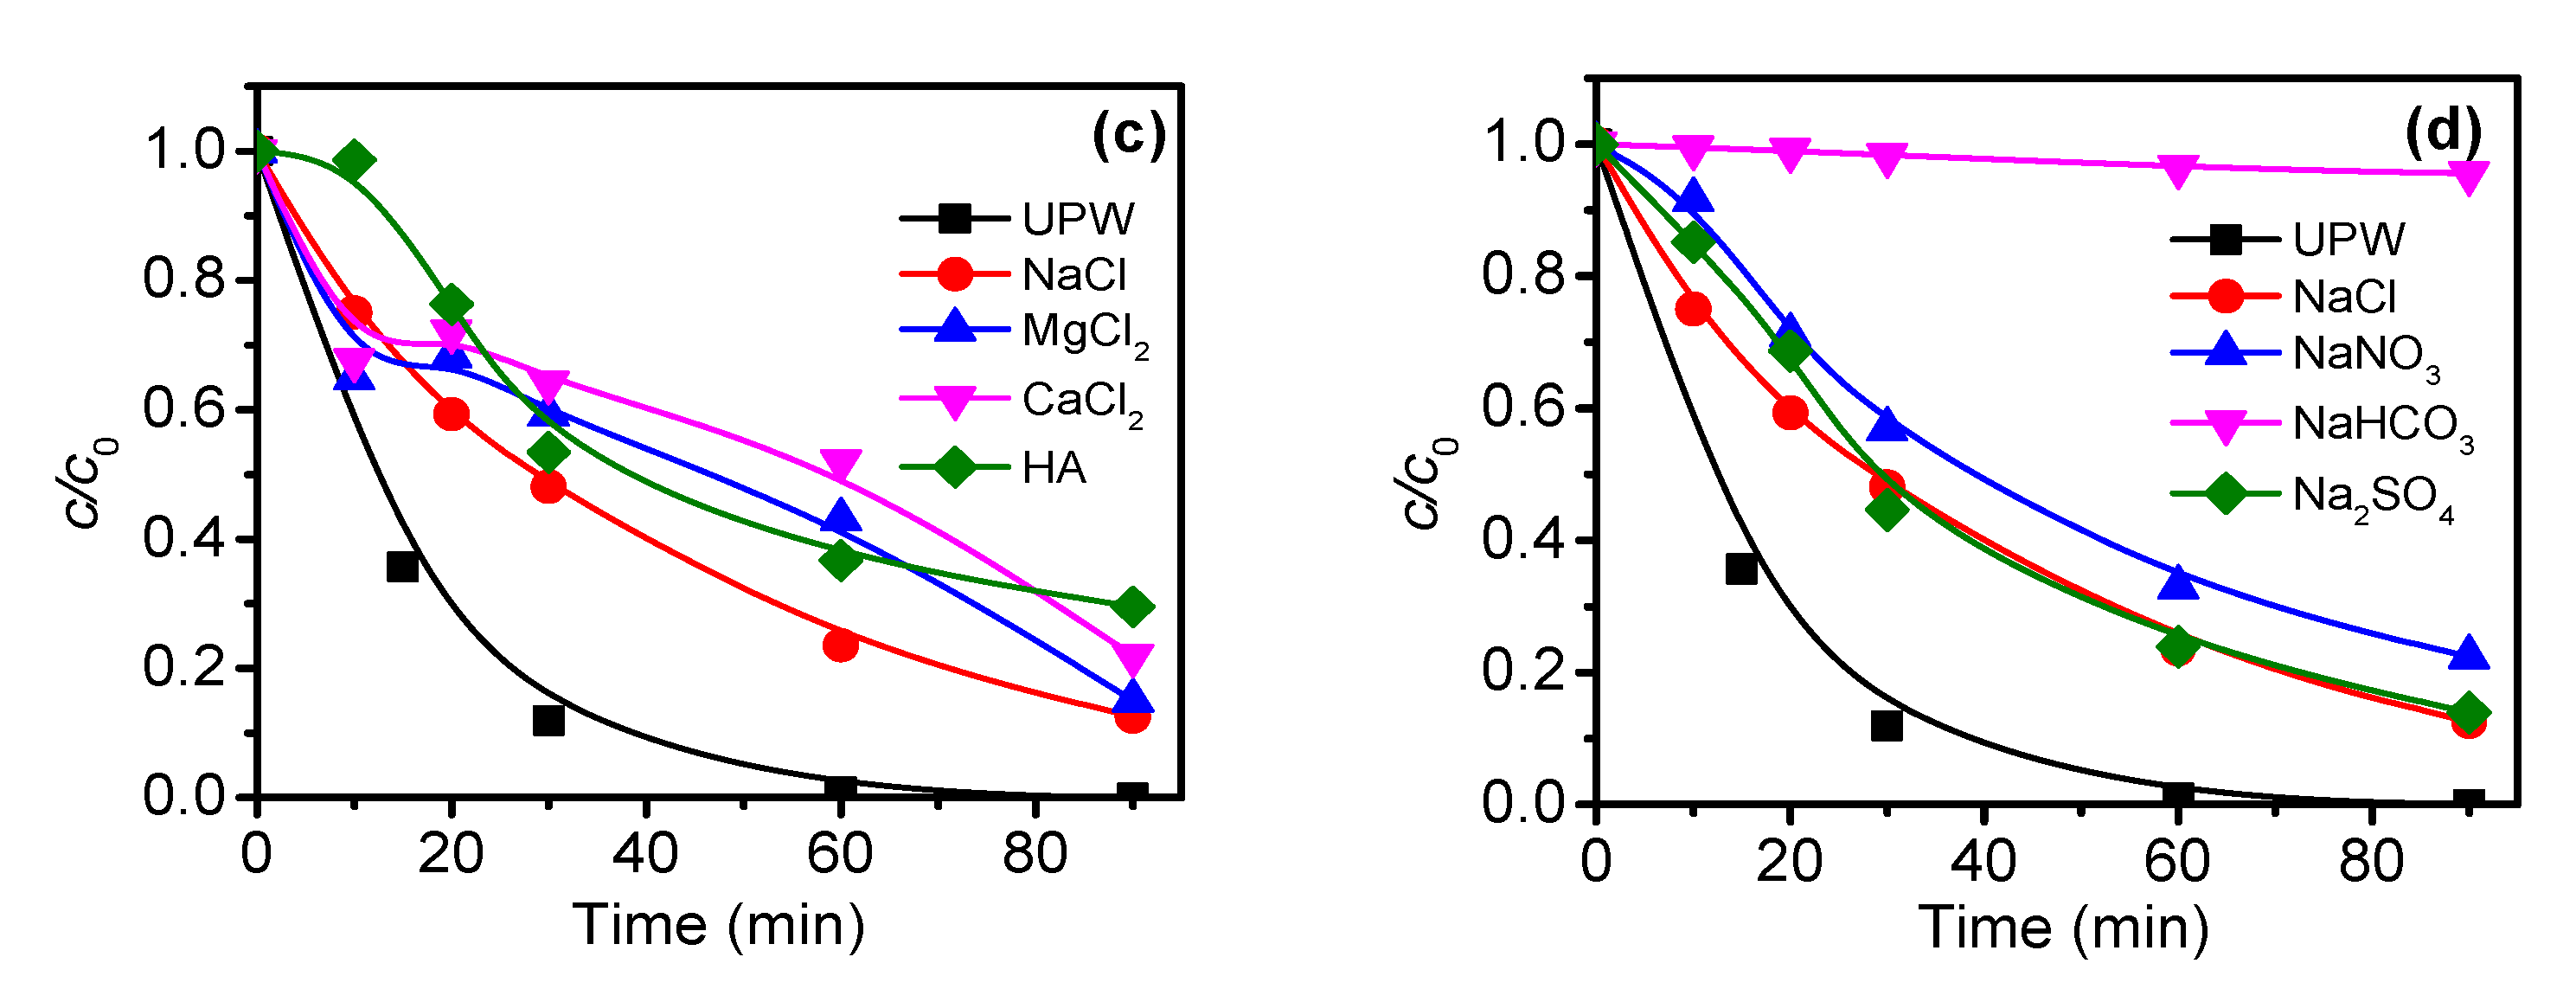
2.7. Effect of Species in the Solution Matrix on FB1 Removal Efficiency Using Zn2SnO4

Similar to the direct and indirect photolysis of FB1, the effect of the water matrix on the efficiency of FB1 removal using ZS–2 photocatalyst and UV irradiation was also investigated (Figure 11). The degradation rate constants of FB1 in different types of water are presented in Table S7 (Supplementary Materials).

2.7.1. Effect of Cations

Similar to photolysis, Ca2+ and Mg2+ cations have an inhibiting effect on the efficiency of photocatalytic removal of FB1 using Zn2SnO4 by UV irradiation. To eliminate the influence of chloride (whose salts of cations are added), the influence of NaCl on the FB1 removal efficiency was also examined. As can be seen in Figure 11a, the FB1 removal efficiency in the presence of NaCl was 27% lower than in UPW. Slightly lower removal percentage (about 50%) was recorded with MgCl2 (Figure 11a). On the other hand, in the presence of CaCl2, the photocatalysis occurred somewhat faster than in UPW during the first 30 min, while after 60 min of irradiation, the FB1 removal was lower by about 5% (Figure 11a). Similar results were obtained in the case of determination of the degradation rate constants of FB1 (Table S7) (Supplementary Materials). A certain difference in relation to the degradation efficiency is a consequence of determining the degradation rate constant for the first 20 min of irradiation when the linear regression coefficient is the highest. These results are in agreement with the data of Burns et al. [60], who consider that Ca2+ and Mg2+ ions cannot be scavengers of radicals or holes because they are in their maximum oxidation state. Potential inhibition can be explained by the formation of an ionic bridge, which leads to a more intense aggregation of nanoparticles [61]. In general, multivalent cations (Ca2+ and Mg2+) have a more negative effect on removal than monovalent cations (Na+) [62]. The pH of the suspension with addition of these cations did not change significantly (up to 0.3 pH units).

2.7.2. Effect of Anions

Effect of chloride: Data on the influence of Cl ions on the FB1 degradation in the presence of ZS–2 nanocatalyst are shown in Figure 11b. During the first 20 min of suspension irradiation, about 55% of FB1 was degraded, which is the same as in the case of UPW (Figure 11b). On the other hand, at the end of the process, the removal efficiency was much lower compared to UPW, being around 67%. Based on the obtained results, it can be concluded that the addition of Cl ion inhibits the FB1 removal. Similar results were obtained in the case of determination of the degradation rate constants of FB1 in the presence of Cl for the first 20 min of irradiation (Table S7) (Supplementary Materials). The influence of Cl ion can be twofold: it can act as a scavenger of (i) OH radicals [63] and (ii) holes [64]. During this treatment, the initial pH was 7.9, and there was no change in pH.
Effect of nitrate: The addition of NO3 ion also slightly inhibited the removal of FB1 (Figure 11b). Kinetics curves in the presence of NaNO3 have almost the same shape as that of UPW (Figure 11b). In the first 20 min of irradiation, the difference was very small (see also Table S7), and with further irradiation up to 60 min, the removal percentage of FB1 was lower by 10% compared to UPW. After 60 min of treatment in the presence of NO3 ions, about 80% of FB1 was removed, and this was the highest degradation efficiency with anions. The inhibition of photocatalysis in the presence of NO3 ions was reported by Farner Budarz et al. [65], where these ions acted as OH radical scavengers. No change in pH value was observed during this treatment.
Effect of hydrogencarbonate: The reduced removal efficiency of FB1 was registered in the presence of HCO3 ions (Figure 11b). As can be seen, the kinetics curve has an irregular shape, where the highest removal rate (62%) was achieved after 30 min of irradiation, and after 60 min of treatment, that percentage was about 50%. Based on the degradation rate constant (Table S7) (Supplementary Materials), it can also be concluded that the inhibitory effect of HCO3 is not pronounced for the first 20 min of irradiation. According to Matthews [63], the HCO3 ion also acts as a scavenger of OH radicals, whereby a strong surface complex with the catalyst is not formed. During the treatment, the pH value changed by about one pH unit (from 8.1 to 9.2).
Effect of sulphate: Photocatalysis of FB1 in the presence of SO42− ions was shown to be the least efficient compared to other anions. During this treatment, only 37% of FB1 was removed in 60 min of irradiation (Figure 11b). SO42− ions, just like other anions, act as scavengers of OH radicals and thus reduce the rate of pollutant degradation [66]. Further, depending on pH, inorganic layers can form on the surface of the catalyst, which interfere with the pollutants and slow down the degradation [67]. Based on the data in Table S7 (Supplementary Materials), it can also be concluded that the inhibitory effect of SO42− is the most pronounced compared to other anions. The initial pH of this solution was 7.8, and at the end of the treatment, it increased by about 0.5 pH units (8.3).

2.7.3. Effect of Humic Acid

Humic acid showed a very low effect on the efficiency of photocatalytic degradation of FB1. In the first 30 min of treatment, the percentage of FB1 removal as well as the shape of the kinetic curves were almost the same for the systems with and without HA (Figure 11a, Table S7) (Supplementary Materials). However, during further irradiation of up to 60 min, HA inhibited the removal of FB1, and the final removal efficiency using ZT–2 was 77%. Similar results were obtained by Šojić Merkulov et al. [68], who also observed a minor effect of HA on photocatalysis efficiency. During the treatment, no significant change in pH was recorded (about 0.4 pH units).

3. Material and Methods

3.1. Chemical and Solutions

A stock solution of FB1 was prepared by dissolving 1 mg of solid FB1 (from Fusariummoniliforme, approx. 98% TLC, Sigma-Aldrich F1147, St. Louis, MO, USA) in 100 cm3 of ultrapure water. Working solutions were prepared by diluting the stock solution with ultrapure water to a concentration of 1.39 μmol/dm3 for FB1. The aqueous solution of FB1 (1.39 μmol/dm3) was found to be stable in the dark for more than 500 days at 4 °C to 8 °C.
Methanol (HPLC gradient grade, LiChrosolv, Merck, Darmstadt, Germany) and 0.1 mol/dm3 NaH2PO4 (extra pure, Merck, Darmstadt, Germany) were used as components of the mobile phase, where the pH was adjusted with H3PO4 (p.a, Centrohem, Stara Pazova, Serbia). To prepare the means for derivatizationo-phthaldialdehyd (min. 99%, Sigma, Darmstadt, Germany), 0.1 mol/dm3 Na2B4O7 (p.a., Zorka, Šabac, Serbia), and 2-mercaptoethanol (min 99%, Serva, Heidelberg, Germany) were used. H2O2 (30%, Sigma-Aldrich, St. Louis, MO, USA) and (NH4)2S2O8 (p.a. Merck-Alkaloid, Skopje, North Macedonia) were used in the experiments of indirect photolysis. The solutions for adjusting the initial pH were obtained by dilution of 70% HClO4 (99.999% trace metals basis, Merck-Alkaloid, Skopje, North Macedonia), and 30% NaOH (Suprapur®, Sigma-Aldrich, St. Louis, MO, USA). All chemicals were used without further purification.
Physicochemical characteristics of the Danube River (Novi Sad, Serbia), ground water (Štrand, Novi Sad, Serbia), and tap water (Novi Sad, Serbia) together with UPW are given in Table S8. Samples of all water types were filtered through a filter paper (Whatman, diameter 125 nm, pore size 0.1 μm) and stored at 4 °C.
To examine the influence of individual ions and HA on the efficiency of direct and indirect photolysis as well as photocatalysis, their concentrations in the reaction solution/suspension were adjusted to the highest values determined in real water samples. The following chemicals were used to simulate the effects of ions and organic matter: NaCl and HCO3 (ZorkaPharm, Šabac, Serbia), NaNO3 (Kemika, Zagreb, Croatia), Na2SO4 (MPhemija, Belgrade, Serbia), MgCl2 and CaCl2 (Merck, Darmstadt, Germany), and humic acid (p.a, Fluka, St Louis, MO, USA).

3.2. Preparation of ZnO-Based Catalysts

ZS-1 and ZT–1 samples were prepared by a three-step mixing–calcination method in solid-state, when starting precursors (ZnO, TiO2, and SnO2, purity 99.9%, particle size ≤1 μm, Sigma-Aldrich, St. Louis, MO, USA) in a molar ratio of ZnO:SnO2 = 2:1 and ZnO:TiO2 = 2:1 were ground in an agate mortar, annealed at 700 °C in the air for 2 h, and ground again. ZS–2 and ZT–2 samples were prepared by multi-step-mechanochemical processing, when starting precursors (ZnO, TiO2, and SnO2, purity 99.9%, particle size ≤1 μm, Sigma-Aldrich, St. Louis, MO, USA) were first mixed in stoichiometric amounts in a ball mill (Retsch GmbH PM100, Haan, Germany) using a zirconia vial and 5 mm diameter zirconia balls in ethanol for 4 h. A standard ball-to-powder mass ratio of 10:1 was used, followed by drying. The next step was mechanical activation of stoichiometric ZnO/SnO2 powder mixture for 160 min (speed 320 rpm) for the synthesis of ZS–2 and of stoichiometric ZnO/TiO2 powder mixture for 90 min (speed 320 rpm) for the synthesis of ZT–2. Both ZS–2 and ZT–2 powder mixtures were afterward ground in ethanol for 10 min (speed 100 rpm) for homogenization. After drying, the mechanically activated mixture of ZS–2 was annealed at 1200 °C to synthesize Zn2SnO4, while the mechanically activated mixture of ZT–2 was annealed at 1000 °C to obtain Zn2TiO4 for 120 min in an air atmosphere. The choice of these synthesis conditions was made based on previous experimental results and data from the literature [17,18,19,20,25,26,27,28,39,40].

3.3. Structure, Morphology, and Optical Characterization of ZnO-Based Catalysts

XRD analysis was performed on a MiniFlex600 (Rigaku, Japan) X-ray diffractometer with Cu-Kα radiation (λ = 1.5406 Å) at a tube voltage of 40 kV and a tube current of 15 mA, a step size of 0.02°, and a counting time of 1°/min in the angular range 2θ from 10° to 80°. The morphology of the obtained powder samples was examined with scanning electron microscopy SEM (JEOL JSM 7001F, Tokyo, Japan). Raman spectra were obtained on a Renishaw confocal Raman microscope InviaTm, (Gloucestershire, UK) with excitation of 514 nm argon-ion laser at ambient temperature. A laser beam of 514 nm was focused with a50x objective, and Raman signal was collected by a CCD camera up to 1400 cm−1 with a spectral resolution of 2 cm−1 and accumulation time of 3s. Photoluminescence (PL) spectra were recorded by Horiba Fluorolog®-3 spectrofluorometer (model FL3-22) equipped with a 450W ozone-free xenon lamp as a light source (Tokyo, Japan). DRS was obtained using an Ocean Optics QE65000 (Dunedin, FL, USA) spectrometer at room temperature.

3.4. Photodegradation Procedure

Degradation of FB1 (20 cm3) was performed in a photochemical cell (total volume about 40 cm3, liquid layer thickness 35 mm) by focusing the light beam on the plain window of the cell [69]. To examine the efficiency of the indirect photolysis, an appropriate volume of H2O2 (0.278 mmol/dm3) or (NH4)2S2O8 (0.140 mmol/dm3) was added to the reaction mixture. Based on our previous research [39,40], to study the efficiency of photocatalysis, 20 mg of photocatalyst (1.0 mg/cm3) was added. Thereafter, the reaction suspension with the catalyst was sonicated (50 Hz) in the dark for 15 min to evenly distribute the photocatalyst particle and achieve the adsorption–desorption equilibrium. Then, the photochemical cell was placed on a magnetic stirrer (with continuous stirring in a stream of O2, 3.0 cm3/min) and thermostated at 25 ± 0.5 °C. As a source of artificial UV radiation, a high-pressure mercury lamp (HPL-N, 125W, Philips, Brussel, Belgium, emission bands in the range of UVB (290, 293, 296, 304, and 314 nm) and UVA (335 and 366 nm) with emission maximum at 366 nm) together with a corresponding concave mirror were used.
A solution of FB1 with a concentration of 2.78 μmol/dm3 was prepared to test the effect of the matrix of several types of water on the photodegradation efficiency of FB1. In the photocell, 10.00 cm3 of this FB1 solution and 10.00 cm3 of each of the tested types of water (Danube River, ground, tap water, and UPW water) were measured, so that the concentration of the FB1 solution was 1.39 μmol/dm3. When examining the individual influence of ions and HA, 100 μL of solution (NaCl, NaNO3, Na2SO4, or HA) or the corresponding mass (MgCl2, CaCl2, or NaHCO3) of the salt of the investigated ion was added to the photochemical cell containing the fumonisin solution.
Since the pH value in the investigated types of water was around pH 8.0, in the experiments where the pH was different (e.g., in indirect photolysis UV/S2O82−, photolysis, photocatalysis with different types of water and with the addition of some ions), NaOH or HClO4 (0.10 mol/dm3) were added before the treatment to exclude the effect of pH on the removal efficiency [46]. Changes in the pH during the degradation were monitored by using a combined glass electrode (pH-Electrode SenTix 20, WTW, Thermo Fisher Scientific, Waltham, MA, USA) connected to the pHmeter (pH/Cond 340i, WTW).

3.5. FB1 Determination

Aliquots of the reaction mixture (0.4 cm3, allowed volume change of 10%) were taken before the start of irradiation as well as during irradiation at certain time intervals in order to monitor the kinetics of FB1 photodegradation. Suspensions containing the catalyst were filtered through a membrane filter (Sartorius™ Minisart™, cellulose acetate, sterile, 0.45 µm, Goettingen, Germany). The absence of fumonisin adsorption on the filter was confirmed by the HPLC−FLD system.
For FB1 derivatization prior to HPLC–FLD determination, an aliquot of 0.1 cm3 of the reaction mixture was mixed with 0.1 cm3 of OPA–MCE reagent at room temperature and stirred for 1 min. Then, 10 µL of the derivatized solution was injected into the HPLC−FLD system. Liquid chromatography equipment consisted of a Thermo Scientific DionexUltiMate3000 Series HPLC−FLD system with FLD 3100 fluorescence detector, WPS-3000 autosampler, degasser, quaternary pump, and Hypersil GOLD column 150 × 3 mm, particle size 3 µm (Thermo Scientific, Germering, Germany). The mobile phase consisted of MeOH−0.1 mol/dm3 NaH2PO4 (77:23, v/v), pH value adjusted to 3.35 with H3PO4, with isocratic elution, flow rate of 0.8 cm3/min, excitation wavelength of 335 nm, and emission wavelength of 440 nm. The temperatures of the analytical column and the fluorescent detector were 30 °C and 50 °C, respectively.

4. Conclusions

In this study, two ternary (Zn2SnO4 and Zn2TiO4) and two binary (ZnO/SnO2 and ZnO/TiO2) structured nanocrystallites were investigated as photocatalysts in the heterogeneous photocatalysis of FB1 using UV irradiation in UPW. Since, in the case of ternary Zn2SnO4, the adsorption of FB1 was the least pronounced and the photodegradation efficiency was the highest, this nanocatalyst was used for further tests. Upon comparing the efficiency of direct and indirect photolysis with photocatalysis using Zn2SnO4 as a photocatalyst in the removal of FB1, it was found that indirect photolysis and photocatalysis were significantly more effective treatments than direct photolysis. Photolysis of FB1 in tap, ground, and river waters was inhibited as compared to UPW. Based on our findings, it can be concluded that the inhibition effect of different water samples was more pronounced in the case of indirect photolysis with UV/H2O2 and UV/S2O82−. Namely, in the case of direct photolysis, the efficiency of FB1 removal was higher in tested waters (about 1.3 to 2 times) than in ultrapure water, while in the case of indirect photolysis, as well as in photocatalysis, the rate of FB1 removal was significantly reduced (about 1.3 to 4 times). The positive influence of the studied ions on photolysis was established, except in the case of hydrogencarbonate ions. On the other hand, the inhibitory influence of ions on FB1 degradation was confirmed in the system with UV/H2O2. The efficiency of FB1 photocatalysis also depends on the presence of the tested ions, and the least inhibition was observed for Ca2+ and NO3 ions, as well as HA.

Supplementary Materials

The following supporting information can be downloaded at https://www.mdpi.com/article/10.3390/catal13020375/s1: Table S1: Effect of photolysis and photocatalysis using UV irradiation at pH ~8 on degradation rate constant of FB1 (1.39 µmol/dm3); Table S2: Effect of different types of water on degradation rate constant of FB1 (1.39 µmol/dm3) using UV irradiation at pH ~8; Table S3: Effect of different types of water on degradation rate constant of FB1 (1.39 µmol/dm3) using indirect photolysis at pH ~8; Table S4: Effect of different types of water on degradation rate constant of FB1 (1.39 µmol/dm3) using ZS–2 photocatalyst at pH ~8; Table S5: Effect of different ions and HA on degradation rate constant of FB1 (1.39 µmol/dm3) at pH 7.7–9.0 using UV irradiation; Table S6: Effect of different ions and HA on degradation rate constant of FB1 (1.39 µmol/dm3) at pH 7.7–9.0 using UV/H2O2 treatment; Table S7: Effect of different ions and HA on degradation rate constant of FB1 (1.39 µmol/dm3) at pH 7.7–9.0 using ZS–2 photocatayst; Table S8: The physicochemical characteristics of the analyzed water types.

Author Contributions

Conceptualization, I.J., S.J. and B.A.; methodology, I.J., S.J. and T.I.; validation, I.J., S.J., B.A. and T.I.; formal analysis, I.J., S.J., T.I. and S.B.; synthesis and characterization, T.I.; investigation, I.J., S.J., T.I. and S.B.; data curation, I.J., S.J., T.I. and S.B.; writing—original draft preparation, I.J., S.J., D.Š.M., S.B., B.A. and T.I.; writing—review and editing, S.J., D.Š.M., B.A. and T.I.; supervision, I.J., S.J., D.Š.M., B.A. and T.I. All authors have read and agreed to the published version of the manuscript.

Funding

This research was supported by the Science Fund of the Republic of Serbia (Grant No. 7747845, In situ pollutants removal from waters by sustainable green nanotechnologies-CleanNanoCatalyze) and by the Ministry of Science, Technological Development and Innovation of the Republic of Serbia (Grant No. 451-03-68/2022-14/200125).

Data Availability Statement

The authors declare that the raw data supporting the findings and conclusions of this research are available from the corresponding author upon request.

Acknowledgments

The authors would also like to thank Lothar Wondraczek and his team at the Otto Schott Institute of Materials Research (OSIM) of the Friedrich Schiller University of Jena, Jena, Germany for XRD (Nadja Buchert), SEM (Claudia Siedler), Raman (Omar Benzine), and PL (Yicong Ding) measurements.

Conflicts of Interest

The authors declare no conflict of interest. The funders had no role in the design of the study; in the collection, analyses, or interpretation of data; in the writing of the manuscript, or in the decision to publish the results.

References

  1. FAO/WHO—World Health Organization. Evaluation of Certain Food Additives and Contaminants. Seventy-Forth Report of the Joint FAO/WHO Expert Committee on Food Additives. WHO Technical Report Series 966. 2011. Available online: http://www.inchem.org/documents/jecfa/jecmono/v966je01.pdf (accessed on 30 November 2022).
  2. Gelderblom, W.C.A.; Jaskiewicz, K.; Marasas, W.F.O.; Thiel, P.G.; Horak, R.M.; Vleggaar, R.; Kriek, N.P.J. Fumonisins—Novel mycotoxins with cancer-promoting activity produced by Fusariummoniliforme. Appl. Environ. Microbiol. 1988, 54, 1806–1811. [Google Scholar] [CrossRef] [PubMed]
  3. IARC International Agency for Research on Cancer. Some Traditional Herbal Medicines, Some Mycotoxins, Naphthalene and Styrene. IARC Monographs on the Evaluation of Carcinogenic Risks to Humans. 2002, Volume 82. Available online: http://monographs.iarc.fr/ENG/Monographs/vol82/mono82.pdf (accessed on 30 November 2022).
  4. Jakšić, S.; Živkov Baloš, M.; Jajić, I.; Abramović, B. Fumonisins in Serbian corn: Long-time assessment under actual climate change conditions. Cereal Res. Commun. 2019, 47, 714–723. [Google Scholar] [CrossRef]
  5. Bryła, M.; Pierzgalski, A.; Zapaśnik, A.; Uwineza, P.A.; Ksieniewicz-Woźniak, E.; Modrzewska, M.; Waśkiewicz, A. Recent Research on Fusarium Mycotoxins in Maize—A Review. Foods 2022, 11, 3465. [Google Scholar] [CrossRef] [PubMed]
  6. EC (European Commission). Commission Regulation 1126/2007 of 28 September 2007 amending Regulation (EC) No 1881/2006 Setting Maximum Levels for Certain Contaminants in Foodstuffs as Regards Fusarium Toxins in Maize and Maize Products. Off. J.2007, L 255, 14–17. Available online: https://eur-lex.europa.eu/LexUriServ/LexUriServ.do?uri=OJ:L:2007:255:0014:0017:EN:PDF (accessed on 25 December 2022).
  7. Angeli, C.; Nagy, T.M.; Horváth, L.; Varga, M.; Szekeres, A.; Tóth, G.K.; Janáky, T.; Szolomájer, J.; Kovács, M.; Kövér, K.E.; et al. Preparation of 3-O-, 5-O- and N-palmitoyl derivatives of fumonisin B1 toxin and their characterisation with NMR and LC-HRMS methods. Food Addit. Contam. Part A 2022, 39, 1759–1771. [Google Scholar] [CrossRef]
  8. Soriano, J.M.; Dragacci, S. Occurrence of fumonisins in foods. Food Res. Int. 2004, 37, 985–1000. [Google Scholar] [CrossRef]
  9. National Toxicology Program—NTP. NTP Technical Report on the Toxicology and Carcinogenesis Studies of Fumonisin B1 (CAS No 116355-83-0) in F344/N Rats and B6C3F1 Mice (Feed Studies); TR 496; NIH Publication No 99-3955; NTP: Research Triangle Park, NC, USA, 2000. [Google Scholar]
  10. Jackson, L.S.; Hlywka, J.J.; Senthil, K.R.; Bullerman, L.B.; Musser, S.M. Effects of time, temperature, and pH on the stability of fumonisin B1 in an aqueous model system. J. Agric. Food Chem. 1996, 44, 906–912. [Google Scholar] [CrossRef]
  11. Oliveira, B.R.; Mata, A.T.; Ferreira, J.P.; Barreto Crespo, M.T.; Pereira, V.J.; Bronze, M.R. Production of mycotoxins by filamentous fungi in untreated surface water. Environ. Sci. Pollut. Res. Int. 2018, 25, 17519–17528. [Google Scholar] [CrossRef]
  12. Waśkiewicz, A.; Bocianowski, J.; Perczak, A.; Goliński, P. Occurrence of fungal metabolites—Fumonisins at the ng/L level in aqueous environmental samples. Sci. Total Environ. 2015, 524–525, 394–399. [Google Scholar] [CrossRef]
  13. Malato, S.; Fernández-Ibáñez, P.; Maldonado, M.I.; Blanco, J.; Gernjak, W. Decontamination and disinfection of water by solar photocatalysis: Recent overview and trends. Catal. Today 2009, 147, 1–59. [Google Scholar] [CrossRef]
  14. Vilhunen, S.; Sillanpää, M. Recent developments in photochemical and chemical AOPs in water treatment: A mini-review. Rev. Environ. Sci. Biotechnol. 2010, 9, 323–330. [Google Scholar] [CrossRef]
  15. Litter, M.I. Introduction to Photochemical Advanced Oxidation Processes for Water Treatment. In Environmental Photochemistry Part II. The Handbook of Environmental Chemistry; Boule, P., Bahnemann, D.W., Robertson, P.K.J., Eds.; Springer: Berlin/Heidelberg, Germany, 2005; Volume 2M. [Google Scholar] [CrossRef]
  16. Sun, S.; Liang, S. Morphological zinc stannate: Synthesis, fundamental properties and applications. J. Mater. Chem. A 2017, 5, 20534–20560. [Google Scholar] [CrossRef]
  17. Ivetić, T.; Vuković, Z.; Nikolić, M.V.; Pavlović, V.B.; Nikolić, J.R.; Minić, D.; Ristić, M.M. Morphology investigation of mechanically activated ZnO-SnO2 system. Ceram. Int. 2008, 34, 639–643. [Google Scholar] [CrossRef]
  18. Slankamenac, M.; Ivetić, T.; Nikolić, M.V.; Ivetić, N.; Živanov, M.; Pavlović, V.B. Impedance response and dielectric relaxation in liquid-phase sintered Zn2SnO4-SnO2 ceramics. J. Electron. Mater. 2010, 39, 447–455. [Google Scholar] [CrossRef]
  19. Ivetić, T.; Nikolić, M.V.; Slankamenac, M.; Živanov, M.; Minić, D.; Nikolić, P.M.; Ristić, M.M. Influence of Bi2O3 on microstructure and electrical properties of ZnO-SnO2 ceramics. Sci. Sinter. 2007, 39, 229–240. [Google Scholar] [CrossRef]
  20. Nikolić, M.V.; Ivetić, T.; Paraskevopoulos, K.M.; Zorbas, K.T.; Blagojević, V.; Vasiljević-Radović, D. Far infrared reflection spectroscopy of Zn2SnO4 ceramics obtained by sintering mechanically activated ZnO-SnO2 powder mixtures. J. Eur. Ceram. Soc. 2007, 27, 3727–3730. [Google Scholar] [CrossRef]
  21. Ivetić, T.B.; Finčur, N.L.; Šojić Merkulov, D.V.; Despotović, V.N.; Četojević-Simin, D.D.; Armaković, S.J.; Uzelac, M.M.; Bognár, S.I.; Zec, N.J.; Lukić-Petrović, S.R.; et al. Water-active titanium/molybdenum/mixed-oxides: Removal efficiency of organic water pollutants by adsorption and photocatalysis and toxicity assessment. Catalysts 2021, 11, 1054. [Google Scholar] [CrossRef]
  22. Kołodziejczak-Radzimska, A.; Jesionowski, T. Zinc oxide—From synthesis to application: A review. Materials 2014, 7, 2833–2881. [Google Scholar] [CrossRef]
  23. Ivetić, T.B.; Dimitrievska, M.R.; Finčur, N.L.; Đačanin, L.R.; Guth, I.O.; Abramović, B.F.; Lukić-Petrović, S.R. Effect of annealing temperature on structural and optical properties of Mg-doped ZnO nanoparticles and their photocatalytic efficiency in alprazolam degradation. Ceram. Int. 2014, 40, 1545–1552. [Google Scholar] [CrossRef]
  24. Ivetić, T.B.; Dimitrievska, M.R.; Gúth, I.O.; Đačanin, L.R.; Lukić-Petrović, S.R. Structural and optical properties of europium-doped zinc oxide nanopowders prepared by mechanochemical and combustion reaction methods. J. Res. Phys. 2012, 36, 43–51. [Google Scholar] [CrossRef]
  25. Marynowski, W.; Saski, M.; Paluba, B.; Pisarek, M.; Lewiński, J. An innovative solid-state approach to zinc ortostannate: Remarkable sintering temperature reduction via lithium doping and mechanochemical activation of low-melting precursors. ACS Appl. Electron. Mater. 2022, 4, 2253–2263. [Google Scholar] [CrossRef]
  26. Iordanova, R.; Bachvarova-Nedelcheva, A.; Dimitriev, Y.; Iliev, T. Mechanochemical synthesis and photocatalytic properties of zinc titanates. Bulg. Chem. Commun. 2011, 43, 378–382. [Google Scholar]
  27. Mihaiua, S.; Toadera, A.; Atkinsona, I.; Mocioiua, O.C.; Hornoiua, C.; Teodorescub, V.S.; Zaharescu, M. Advanced ceramics in the SnO2–ZnO binary system. Ceram. Int. 2015, 41, 4936–4945. [Google Scholar] [CrossRef]
  28. Štrbac, D.; Aggelopoulos, C.A.; Štrbac, G.; Dimitropoulos, M.; Novaković, M.; Ivetić, T.; Yannapoulos, S.N. Photocatalytic degradation of Naproxen and methylene blue: Comparison between ZnO, TiO2 and their mixture. Process Saf. Environ. 2018, 113, 174–183. [Google Scholar] [CrossRef]
  29. Shi, L.; Dai, Y. Synthesis and photocatalytic activity of Zn2SnO4 nanotube arrays. J Mater. Chem. A 2013, 1, 12981. [Google Scholar] [CrossRef]
  30. Chen, S.; Wang, H.; Zhu, L.; Li, J.; Sun, J. Solvothermal synthesis of TiO2 hollow nanospheres utilizing the Kirkendall effect and their photocatalytic activities. Appl. Surf. Sci. 2014, 321, 86–93. [Google Scholar] [CrossRef]
  31. Kim, S.P.; Choi, M.Y.; Choi, H.C. Photocatalytic activity of SnO2 nanoparticles in methylene blue degradation. Mat. Res. Bull. 2016, 74, 85–89. [Google Scholar] [CrossRef]
  32. Jia, T.; Fu, F.; Long, F.; Min, Z.; Zhao, J.; Chen, J.; Li, J. Synthesis, characterization and enhanced visible-light photocatalytic activity of Zn2SnO4/C nanocomposites with truncated octahedron morphology. Ceram. Int. 2016, 42, 13893–13899. [Google Scholar] [CrossRef]
  33. Jia, T.; Liu, M.; Yu, D.; Long, F.; Mo, S.; Deng, Z.; Wang, W. A facile approach for the synthesis of Zn2SnO4/BiOBr hybrid nanocomposites with improved visible-light photocatalytic performance. Nanomaterials 2018, 8, 313. [Google Scholar] [CrossRef]
  34. Ai, Z.; Lee, S.; Huanga, Y.; Hoa, W.; Zhang, L. Photocatalytic removal of NO and HCHO over nanocrystalline Zn2SnO4 microcubes for indoor air purification. J. Hazard. Mater. 2010, 179, 141–150. [Google Scholar] [CrossRef]
  35. Erden, S.; Savaci, U.; Ozel, E.; Turan, S.; Suvaci, E. Investigation of the chemical stability of Zn2SnO4 in aqueous media by using ICP-OES and TEM analyses. Mater. Chem. Phys. 2020, 239, 122066. [Google Scholar] [CrossRef]
  36. De Queiroz, J.C.A.; Naeem, M.; Filho, J.B.A.; Liborio, M.S.; Queiroz, M.G.O.; Sousa, R.R.M.; Melo, E.B.; Feitor, M.; Costa, T.H.C. Synthesis and characterization of ZnO/ZnAl2O4/ Zn2TiO4 composite films by AreO2 mixture hollow cathode glow discharge. J. Mater. Res. Technol. 2021, 12, 2426–2437. [Google Scholar] [CrossRef]
  37. Janani, F.Z.; Khiar, H.; Taoufk, N.; Elhalil, A.; Sadiq, M.; Mansouri, S.; Barka, N. ZnO-Zn2TiO4 heterostructure for highly efcient photocatalytic degradation of pharmaceuticals. Environ. Sci. Pollut. Res. 2022. [Google Scholar] [CrossRef]
  38. Jia, T.; Fu, F.; Li, J.; Wang, W.; Hu, X. Constructing a novel Zn2SnO4/C/AgBr nanocomposite with extended spectral response and improved photocatalytic performance. J. Alloys Compd. 2019, 783, 687–696. [Google Scholar] [CrossRef]
  39. Ivetić, T.B.; Finčur, N.L.; Abramović, B.F.; Dimitrievska, M.; Štrbac, G.R.; Čajko, K.O.; Miljević, B.B.; Đačanin, L.R.; Lukić-Petrović, S.R. Environmentally friendly photoactive heterojunction zinc tin oxide nanoparticles. Ceram. Int. 2016, 42, 3575–3583. [Google Scholar] [CrossRef]
  40. Ivetić, T.B.; Finčur, N.L.; Đačanin, L.R.; Abramović, B.F.; Lukić-Petrović, S.R. Ternary and coupled binary zinc tin oxide nanopowders: Sythesis, characterization, and potential application in photocatalytic processes. Mat. Res. Bull. 2015, 62, 114–121. [Google Scholar] [CrossRef]
  41. Šepelák, V.; Becker, S.M.; Bergmann, I.; Indris, S.; Scheuermann, M.; Feldhoff, A.; Kübel, C.; Bruns, M.; Stürzl, N.; Ulrich, A.S.; et al. Nonequilibrium structure of Zn2SnO4 spinel nanoparticles. J. Mater. Chem. 2012, 22, 3117–3126. [Google Scholar] [CrossRef]
  42. Wang, Z.; Saxena, S.K.; Zh, C.S. In situ X-ray diffraction and Raman spectroscopy of pressure-induced phase transformation in spinel Zn2TiO4. Phys. Rev. B 2002, 66, 024103. [Google Scholar] [CrossRef]
  43. Mebrek, A.; Alleg, S.; Benayache, S.; Benabdeslem, M. Preparation and characterization of spinel type Zn2TiO4 nanocomposite. Ceram. Int. 2018, 44, 10921–10928. [Google Scholar] [CrossRef]
  44. Jang, J.S.; Borse, P.H.; Lee, J.S.; Lim, K.T.; Jung, O.-S.; Jeong, E.D.; Bae, J.S.; Won, M.S.; Kim, H.G. Energy band structure and photocatalytic property of Fe-doped Zn2TiO4 material. Bull. Korean Chem. Soc. 2009, 30, 3021–3024. [Google Scholar] [CrossRef]
  45. Fu, X.; Wang, X.; Long, J.; Ding, Z.; Yan, T.; Zhang, G.; Zhang, Z.; Lin, H.; Fu, X. Hydrothermal synthesis, characterization, and photocatalytic properties of Zn2SnO4. J. Solid State Chem. 2009, 182, 517–524. [Google Scholar] [CrossRef]
  46. Jevtić, I.; Jakšić, S.; Četojević Simin, D.; Uzelac, M.; Abramović, B. UV-induction of photolytic and photocatalytic degradation of fumonisins in water: Reaction kinetics and toxicity. Environ. Sci. Pollut. Res. 2021, 28, 53917–53925. [Google Scholar] [CrossRef] [PubMed]
  47. Crittenden, J.C.; Hu, S.; Hand, D.W.; Green, S.A. A kinetic model for H2O2/UV process in a completely mixed batch reactor. Water Res. 1999, 33, 2315–2328. [Google Scholar] [CrossRef]
  48. Zhang, Y.; Xiao, Y.; Zhong, Y.; Lim, T.-T. Comparison of amoxicillin photodegradation in the UV/H2O2 and UV/persulfate systems: Reaction kinetics, degradation pathways, and antibacterial activity. J. Chem. Eng. 2019, 372, 420–428. [Google Scholar] [CrossRef]
  49. Masayoshi, T. Development of Simultaneous Determination Methods for Mycotoxins in Foods by LC-MS/MS and LC-Orbitrap MS. Ph.D. Thesis, Graduate School of Medical Sciences, Kanazawa University, Kanazawa, Japan, 2016. [Google Scholar]
  50. Pinto, M.I.; Salgado, R.; Laia, C.A.T.; Cooper, W.J.; Sontag, G.; Burrows, H.D.; Brancoa, L.; Valeb, C.; Noronha, J.P. The effect of chloride ions and organic matter on the photodegradation of acetamiprid in saline waters. J. Photochem. Photobiol. A 2018, 360, 117–124. [Google Scholar] [CrossRef]
  51. Dabić, D.; Babić, S.; Škorić, I. The role of photodegradation in the environmental fate of hydroxychloroquine. Chemosphere 2019, 230, 268–277. [Google Scholar] [CrossRef]
  52. Armstrong, D.A.; Huie, R.E.; Koppenol, W.H.; Lymar, S.V.; Merényi, G.; Neta, P.; Ruscica, B.; Stanburyb, D.M.; Steenken, S.; Wardman, P. Standard electrode potentials involving radicals in aqueous solution: Inorganic radicals (IUPAC Technical Report). Pure Appl. Chem. 2015, 87, 1139–1150. [Google Scholar] [CrossRef]
  53. AlHamedi, F.H.; Rauf, M.A.; Ashraf, S.S. Degradation studies of Rhodamine B in the presence of UV/H2O2. Desalination 2009, 239, 159–166. [Google Scholar] [CrossRef]
  54. Chen, Y.; Zhang, K.; Zuo, Y. Direct and indirect photodegradation of estriol in the presence of humic acid, nitrate and iron complexes in water solutions. Sci. Total Environ. 2013, 463–464, 802–809. [Google Scholar] [CrossRef]
  55. Kang, Y.-M.; Kim, M.-K.; Zoh, K.-D. Effect of nitrate, carbonate/bicarbonate, humic acid, and H2O2 on the kinetics and degradation mechanism of Bisphenol-A during UV photolysis. Chemosphere 2018, 204, 148–155. [Google Scholar] [CrossRef]
  56. Liu, N.; Sijak, S.; Zheng, M.; Tang, L.; Xu, G.; Wu, M. Aquatic photolysis of florfenicol and thiamphenicol under direct UV irradiation, UV/H2O2 and UV/Fe(II) processes. Chem. Eng. Sci. 2015, 260, 826–834. [Google Scholar] [CrossRef]
  57. Li, W.; Lu, S.; Qiu, Z.; Lin, K. UV and VUV photolysis vs. UV/H2O2 and VUV/H2O2 treatment for removal of clofibric acid from aqueous solution. Environ. Technol. 2011, 32, 1063–1071. [Google Scholar] [CrossRef]
  58. Sanlaville, Y.; Guittonneau, S.; Mansour, M.; Feicht, E.A.; Meallier, P.; Kettrup, A. Photosensitized degradation of terbuthylazine in water. Chemosphere 1996, 33, 353–362. [Google Scholar] [CrossRef]
  59. Ren, D.; Huang, B.; Bi, T.; Xiong, D.; Pan, X. Effects of pH and dissolved oxygen on the photodegradation of 17α-ethynylestradiol in dissolved humic acid solution. Environ. Sci. Process Impacts 2016, 18, 78–86. [Google Scholar] [CrossRef]
  60. Burns, R.A.; Crittenden, J.C.; Hand, D.W.; Selzer, V.H.; Sutter, L.L.; Salman, S.R. Effect of Inorganic Ions in Heterogeneous Photocatalysis of TCE. J. Environ. Eng. 1999, 125, 77–85. [Google Scholar] [CrossRef]
  61. Romanello, M.B.; de Cortalezzi, M.M.F. An experimental study on the aggregation of TiO2 nanoparticles under environmentally relevant conditions. Water Res. 2013, 47, 3887–3898. [Google Scholar] [CrossRef]
  62. Feng, M.; Wang, X.; Chen, J.; Qu, R.; Sui, Y.; Cizmas, L.; Wang, Z.; Sharma, V.K. Degradation of fluoroquinolone antibiotics by ferrate (VI): Effects of water constituents and oxidized products. Water Res. 2016, 103, 48–57. [Google Scholar] [CrossRef]
  63. Matthews, R.W. Hydroxylation reactions induced by near-ultraviolet photolysis of aqueous titanium dioxide suspensions. J. Chem. Soc. Faraday Trans. 1984, 1, 457–471. [Google Scholar] [CrossRef]
  64. Lindner, M.; Bahnemann, D.W.; Hirthe, B.; Griebler, W.-D. Solar water detoxification: Novel TiO2 powders as highly active photocatalysts. J. Sol. Energy Eng. 1997, 119, 120–125. [Google Scholar] [CrossRef]
  65. Farner Budarz, J.; Turolla, A.; Piasecki, A.F.; Bottero, J.-Y.; Antonelli, M.; Wiesner, M.R. Influence of aqueous inorganic anions on the reactivity of nanoparticles in TiO2 photocatalysis. Langmuir 2017, 33, 2770–2779. [Google Scholar] [CrossRef]
  66. Wang, K.; Zhang, J.; Lou, L.; Yang, S.; Chen, Y. UV or visible light induced photodegradation of AO7 on TiO2 particles: The influence of inorganic anions. J. Photochem. Photobiol. A Chem. 2004, 165, 201–207. [Google Scholar] [CrossRef]
  67. Tran, M.L.; Fu, C.C.; Juang, R.S. Removal of metronidazole and amoxicillin mixtures by UV/TiO2 photocatalysis: An insight into degradation pathways and performance improvement. Environ. Sci. Pollut. Res. 2019, 26, 11846–11855. [Google Scholar] [CrossRef] [PubMed]
  68. Šojić Merkulov, D.V.; Lazarević, M.J.; Despotović, V.N.; Banić, N.D.; Finčur, N.L.; Maletić, S.P.; Abramović, B.F. The effect of inorganic anions and organic matter on mesotrione (Callisto®) removal from environmental waters. J. Serb. Chem. Soc. 2017, 82, 343–355. [Google Scholar] [CrossRef]
  69. Abramović, B.; Šojić, D.; Despotović, V.; Vione, D.; Pazzi, M.; Csanádi, J. A comparative study of the activity of TiO2 Wackherr and Degussa P25 in the photocatalytic degradation of picloram. Appl. Catal. B Environ. 2011, 105, 191–198. [Google Scholar] [CrossRef]
Figure 1. SEM images of binary structured (a,b) ZS–1, and (c,d) ZT–1 catalysts at the same magnifications (a,c) ×1800 and (b,d) ×3500 for comparison.
Catalysts 13 00375 g001
Figure 2. SEM images of ternary structured (a,b) ZS–2, and (c,d) ZT–2 catalysts at the same magnifications (a,c) ×1800 and (b,d) ×3300 for comparison.
Catalysts 13 00375 g002
Figure 3. XRD patterns of (a) ZS–1, (b) ZT–1, (c) ZS–2, and (d) ZT–2 catalysts.
Catalysts 13 00375 g003
Figure 4. Raman spectra of (a) ZS–1 compared to the ZnO and SnO2, (b) ZT–1 compared to the TiO2, (c) ZS–2, and (d) ZT–2.
Catalysts 13 00375 g004
Figure 5. UV–Vis diffuse-reflectance and PL excitation spectroscopy of ZT–2 (a), Kubelka–Munk estimation of the optical band gap of ZT–2 (b), and PL emission spectra of ZT–2 (c).
Catalysts 13 00375 g005
Figure 6. Efficiency of FB1 (1.39 µmol/dm3) removal at pH ~8 using (a) different nanocrystallites (1 mg/cm3) during UV photocatalysis; (b) photolysis and photocatalysis by UV irradiation.
Catalysts 13 00375 g006
Figure 7. Efficiency of FB1 (1.39 µmol/dm3) degradation in different types of water using UV irradiation at natural pH.
Catalysts 13 00375 g007
Figure 8. Efficiency of FB1 (1.39 µmol/dm3) degradation in different types of water using: (a) UV/H2O2 treatment at natural pH~8; (b) UV/S2O82− treatment at pH~8. c(H2O2) = 0.278 mmol/dm3, c(S2O82−) = 0.140 mmol/dm3.
Catalysts 13 00375 g008
Figure 9. Efficiency of FB1 (1.39 µmol/dm3) removal in different types of water using ZS–2 photocatalyst (1 mg/cm3) using UV irradiation at pH~8.
Catalysts 13 00375 g009
Figure 10. Effect of different ions and HA on the efficiency of FB1 (1.39 µmol/dm3) degradation at pH 7.7–9.0: (a,b) using UV irradiation; (c,d) using UV/H2O2treatment. c(H2O2) = 0.278 mmol/dm3.
Catalysts 13 00375 g010aCatalysts 13 00375 g010b
Figure 11. Effect of different cations and HA (a) and anions (b) on the FB1 (1.39 µmol/dm3) removal efficiency using photocatalyst ZS–2 and UV irradiation at pH~8.
Catalysts 13 00375 g011
Table 1. Phase composition and structure parameters of ZS–1 by Rietveld refinement.
PhaseZnOSnO2
Phase content (%)53.9446.06
Crystallite size (nm)72.050.5
Microstrain (%)0.0340.042
a3.25024.7385
b3.25024.7385
c5.20683.1870
RWP (%)5.515.51
RP (%)4.394.39
REXP (%)2.642.64
GOF2.0882.088
Table 2. The phase composition, crystallite size, and microstrain of ZT–1 by Rietveld refinement.
PhaseZnOZn2TiO4TiO2 (A)TiO2 (R)
Phase content (%)43.2041.4214.980.39
Crystallite size (nm)69.556.961.482.9
Microstrain (%)0.0330.0790.0590.08
Table 3. Structure parameters of ZS–2 and ZT–2 by Rietveld refinement.
SampleZS–2ZT–2
PhaseZn2SnO4Zn2TiO4
Crystallite size (nm)70.271.5
Microstrain (%)0.070.07
a8.66128.4736
b8.66128.4736
c8.66128.4736
RWP (%)11.6217.55
RP (%)8.069.91
REXP (%)2.852.91
GOF4.07866.0294
Table 4. Estimated optical band gap energy values of ZS–1, ZT–1, ZS–2, and ZT–2 catalysts and their corresponding absorption edges.
SampleZS–1ZT–1ZS–2ZT–2
Eg (eV)3.083.273.363.28
λ (nm)402379369378
Disclaimer/Publisher’s Note: The statements, opinions and data contained in all publications are solely those of the individual author(s) and contributor(s) and not of MDPI and/or the editor(s). MDPI and/or the editor(s) disclaim responsibility for any injury to people or property resulting from any ideas, methods, instructions or products referred to in the content.

