Article

Effect of Modulation and Functionalization of UiO-66 Type MOFs on Their Surface Thermodynamic Properties and Lewis Acid–Base Behavior

by
Ali Ali-Ahmad
1,2,3,
Tayssir Hamieh
1,4,*,
Thibault Roques-Carmes
5,
Mohamad Hmadeh
3,* and
Joumana Toufaily
1,2
1
Laboratory of Materials, Catalysis, Environment and Analytical Methods Laboratory (MCEMA), Faculty of Sciences, Lebanese University, Hadath P.O. Box 6573, Lebanon
2
Laboratory of Applied Studies to the Sustainable Development and Renewable Energies (LEADDER), EDST, Faculty of Sciences, Lebanese University, Hadath P.O. Box 90656, Lebanon
3
Department of Chemistry, American University of Beirut, Riad El-Solh, Beirut P.O. Box 11-0236, Lebanon
4
Faculty of Science and Engineering, Maastricht University, P.O. Box 616, 6200 MD Maastricht, The Netherlands
5
Laboratoire Réactions et Génie des Procédés, UMR 7274 CNRS, Université de Lorraine, 54000 Nancy, France
*
Authors to whom correspondence should be addressed.
Catalysts 2023, 13(1), 205; https://doi.org/10.3390/catal13010205
Submission received: 13 December 2022 / Revised: 30 December 2022 / Accepted: 11 January 2023 / Published: 16 January 2023

Abstract

:
In this study, we investigated the surface thermodynamic properties of four MOF structures of the UiO-66 series, by employing seven molecular models, a thermal model, and three other methods using the inverse gas chromatography (IGC) technique at infinite dilution. We first determined the effect of the modulation of UiO-66 by an acid (e.g., formic acid and acetic acid) and on the other hand, we studied the effect of the functionalization of the organic linker by an amine group (NH2) on their dispersive component of the surface energy and on their Lewis acid–base properties. We found that all the studied MOFs presented an amphoteric character with a strong acidity whose acidity/basicity ratio is greater than 1 using all the models and methods in IGC. Moreover, the introduction of a modulator such as acetic acid or formic acid in the synthesis of these MOFs increased the number of structural defects and therefore increased the acidity of these MOFs. Similarly, the functionalization of the MOF by the NH2 group leads to an increase in the basicity constant of the functionalized MOF while remaining smaller than their acidity constant. In addition, the use of acids as modulators and amine groups as functional groups resulted in an increase in the dispersive component of the surface energy of the MOFs. Finally, comparing the results obtained by the different models and methods and based on the increasing order of the acidity of each MOF, it was clear that the thermal model resulted in more exact and precise values than the others. Our findings pave the way for the design and development of new acid catalysts based on UiO-66 structures.

Graphical Abstract

1. Introduction

Zirconium-based MOFs, such as UiO-66, play a major role in many areas of industrial applications due to their high chemical, and thermal [1] and mechanical [2] stability [3] compared to traditional MOFs. UiO-66-based MOFs have been used in several applications such as gas storage [4], water remediation, and catalysis [5,6].
On the other hand, structural defects within UiO-66 affect its textural characteristics, stability, and activity. For instance, these defects improve the mechanical stability of this MOF [7] through the use of trifluoroacetic acid as a modulator which replaces the linker on the Zr cluster. Many research groups have focused on the synthesis and characterization of defective UiO-66. Lillerud [8] and Goodwin [9] were among the first to believe that these defects can be exploited to improve the physical and chemical properties of UiO-66-based structures [10].
Although initially considered problematic, these defects are now realized to have the potential to improve properties for specific applications. Given the possibility of improving the absorptive capabilities of UiO-66-based MOFs through the creation of defects, this area has attracted a great deal of interest and recently defects have been characterized at the molecular level using single crystal X-ray diffraction [11]. Subsequently, it was found that the concentration of defects in UiO-66 depends on the nature, concentration, and acidity of the modulator used, resulting in a positive alteration of the gas absorption capacities. For example, when using hydrochloric acid as a modulator during the synthesis of a range of UiO-66 MOFs, higher N2 uptakes were recorded due to the presence of such defects. Interestingly, it was found that four of the twelve linkers of the Zr cluster were missing as evidenced by the surface area measurements [12,13].
In the first modulation study of Zr-MOFs, benzoic acid and acetic acid were investigated as modulators for the synthesis of a variety of UiO-66 crystals [14]. The addition of modulators was found to alter crystal size and morphology while improving crystallinity, probably by controlling the rate and kinetics of nucleation and thus crystal growth through competitive coordination between the monocarboxylate and the bridging linker to the Zr clusters [15,16]. The scope of modulators used during the synthesis of zirconium MOFs has been expanded to include hydrochloric acid, hydrofluoric acid, formic acid, trifluoroacetic acid, and recently, amino acids [17].
On the other hand, like most MOFs, zirconium-based MOFs, especially the UiO-66 series can be further functionalized by organic groups such as amine, carboxylic acid, alcohol, and nitro [18]. These zirconium-based MOFs have been used as adsorbents. As an example, UiO-66 was functionalized with an amine or amidoxime to extract uranium [19]. While the free carboxylic acid functional groups have been used for ammonia capture [20]. Similarly, a possible reaction of NO2 with amine-functionalized linkers is also an important strategy for the adsorption of toxic industrial chemical TICs [21].
The main purpose of MOFs functionalization is to modify the properties of the materials for the desired application [22]. In addition, linker functionalization can be a determining factor of the topology of the MOF structure [23,24]. For instance, it was found that the position of the functionalities on the BTB linker allows the selection for a specific net (qom, pyr, and rtl), and that mixing of functional groups (-H, -NH2, and -C4H4) is an important strategy for the incorporation of a specific functionality (-NO2) into MOF-177 topology [24].
Generally, the most used functional groups are primary amines which can be post-synthetically transformed by N-alkylation [25] or by peptide coupling [26]. On the other hand, the introduction of -NH2 amine groups on the internal surface of MOFs was found to increase the CO2 adsorption capacity due to the high affinity of alkylamines for this molecule.
In this study, three MOF structures of different defect numbers, namely, UiO-66-00, UiO-66-AA, and UiO-66-FA in addition to an amino-functionalized UiO-66 (UiO-66-(NH2)) were synthesized and fully characterized using powder X-ray diffraction (PXRD), scanning electron microscopy (SEM), N2 sorption measurements and thermogravimetric analysis (TGA). The thermodynamic and surface properties as well as the Lewis acid–base properties of the synthesized MOFs were studied by using the technique of inverse gas chromatography (IGC) at infinite dilution. Different models and methods applied to the IGC technique were thoroughly investigated. By interpreting the obtained results, we were able to determine the influence of defect number and the functionalization of a MOF on its properties such as the dispersive component of the surface energy and the acid–base constants in the Lewis sense.

2. Results and Discussion

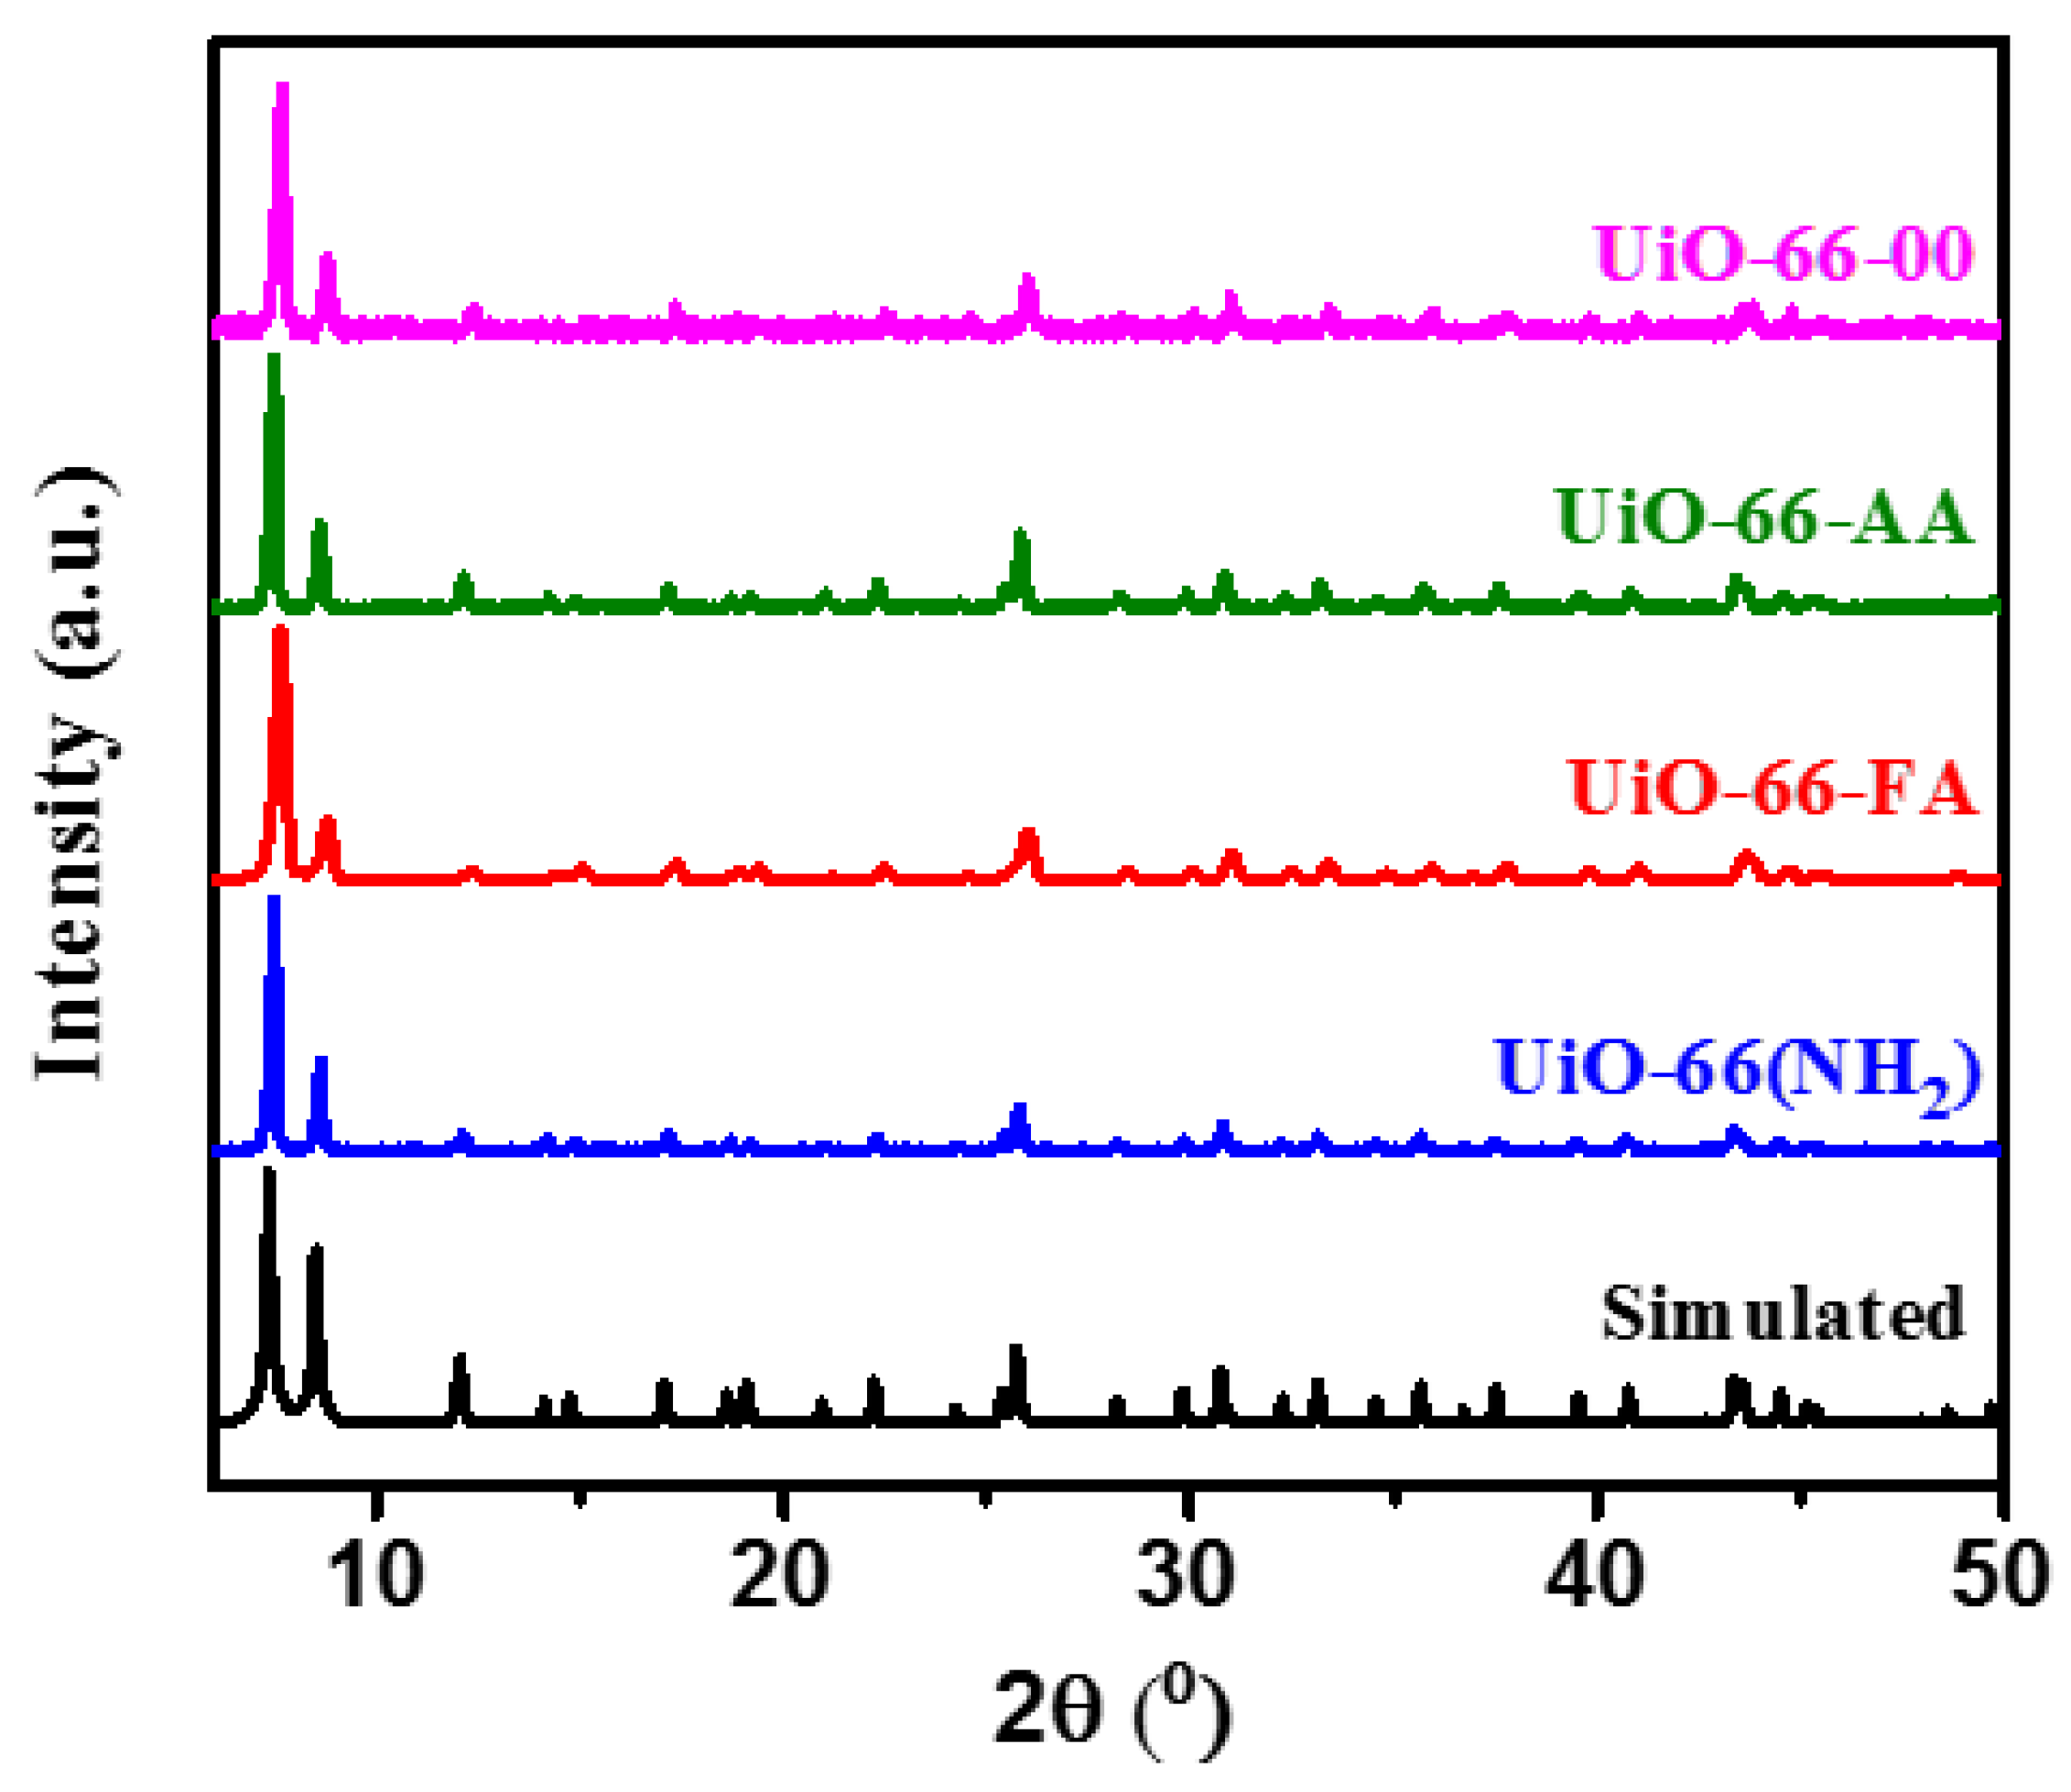
2.1. Powder X-ray Diffraction

PXRD patterns of the different MOFs were shown to be identical and in great agreement with the simulated pattern of UiO-66 which reflects the high crystallinity and purity of these materials (Figure 1). Moreover, it has been shown that the absence or presence of a modulator, even when changing the nature of the modulator using formic acid or acetic acid, did not change the PXRD of these materials. On the other hand, by comparing the PXRD pattern of UiO-66(NH2) with the others, we also noticed that the presence of functional groups in the organic linker did not affect the PXRD pattern, and then the crystal structure was not varied.

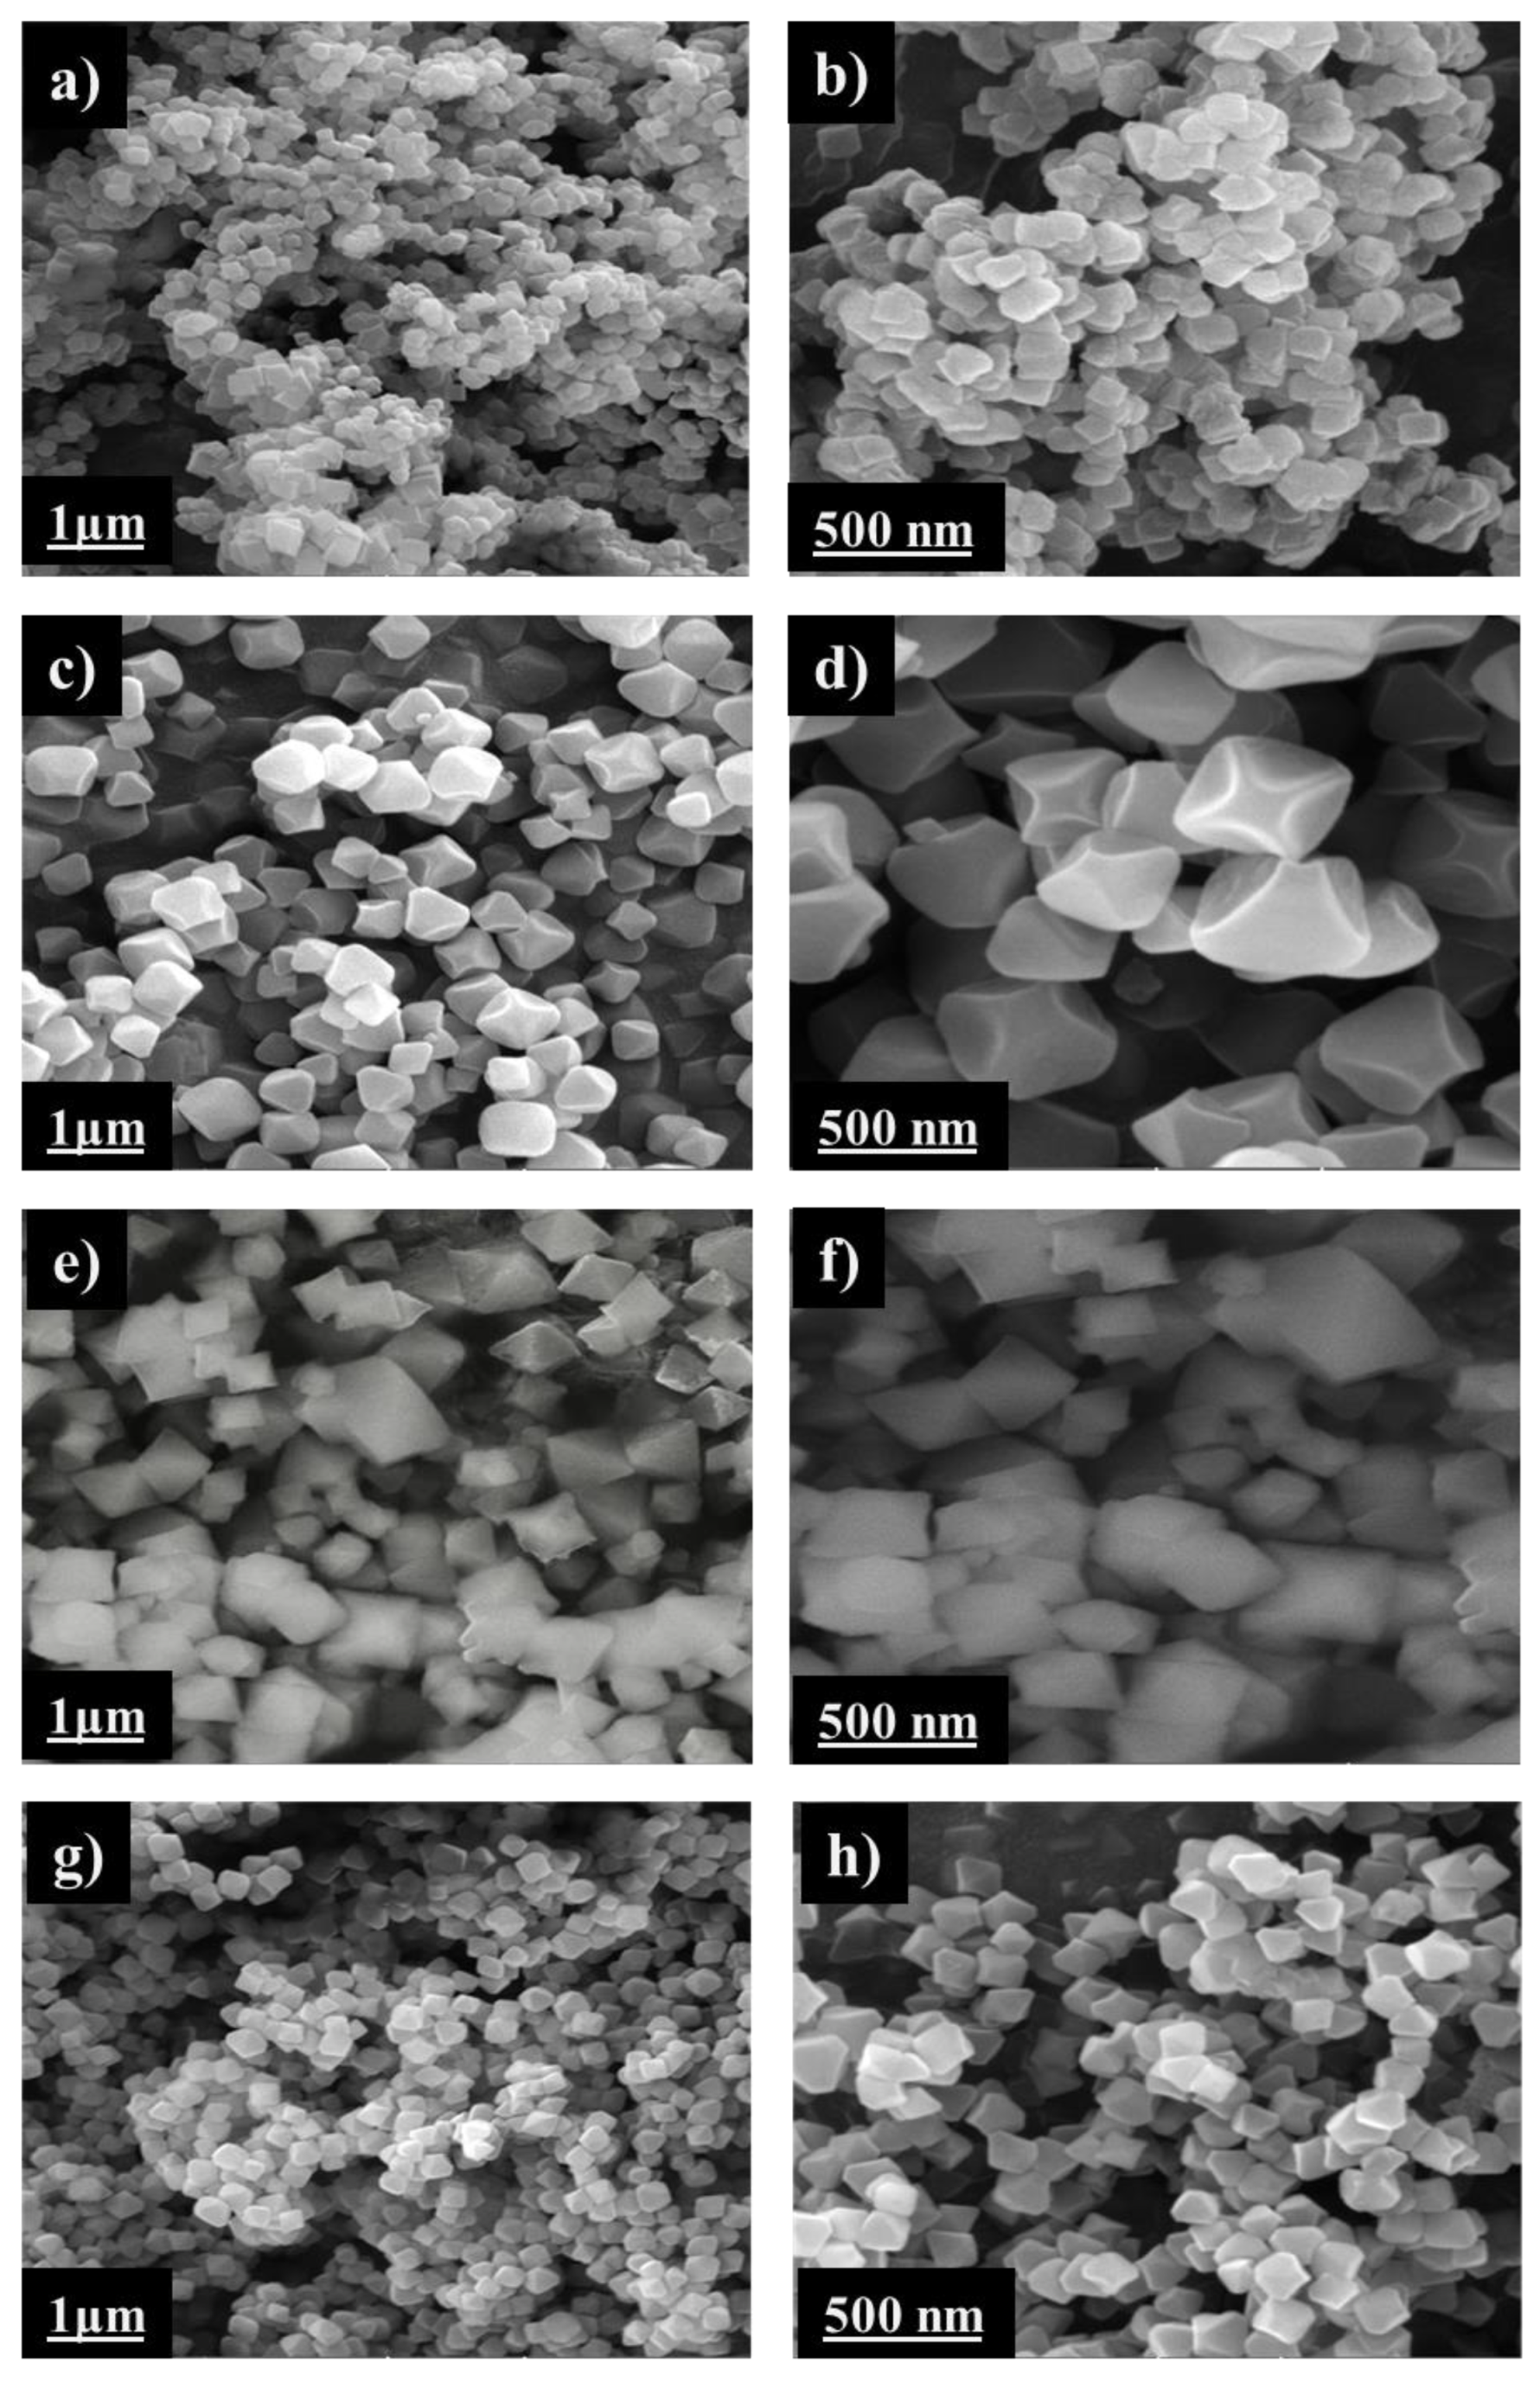
2.2. Scanning Electron Microscopy

SEM images of the four MOF samples were recorded in order to understand the influence of the variation of the experimental conditions of synthesis of these MOFs on the morphology and particle size of these crystals (Figure 2). These images clearly revealed that the synthesis of UiO-66 without using a modulator (case of UiO-66-00) leads to the formation of very small intercalated cubes [17]. However, the presence of the modulator in the synthesis results in the formation of much larger homogeneous pure octahedral crystals [8].
By comparing the two modulated MOFs, UiO-66-AA and UiO-66-FA, we observed that the modulation with formic acid favors crystals of larger size and less homogeneous and polydispersed octahedral shape; whereas, with acetic acid, the size was smaller, and the shape was more homogeneous. This means that the presence of the modulator generally led to an increase in the particle size with well-defined octahedral geometry.
The main reason for the increase in particle size of the MOF with the addition of a modulator may be due to the competition between the latter and the organic linker in order to bind to the SBUs leading to a slower nucleation rate while favoring crystal growth [8,17]. On the other hand, by comparing the two MOFs synthesized with the same modulator (acetic acid) but with two different organic linkers, UiO-66-AA and UiO-66(NH2), it was found that both MOFs presented the same morphology (homogeneous octahedral) but the crystal size of UiO-66(NH2) was smaller than that of UiO-66-AA. This trend has been reported for the UiO-66 series in previous studies [27,28]. The average particle size of these four MOFs can be found in Table 1.

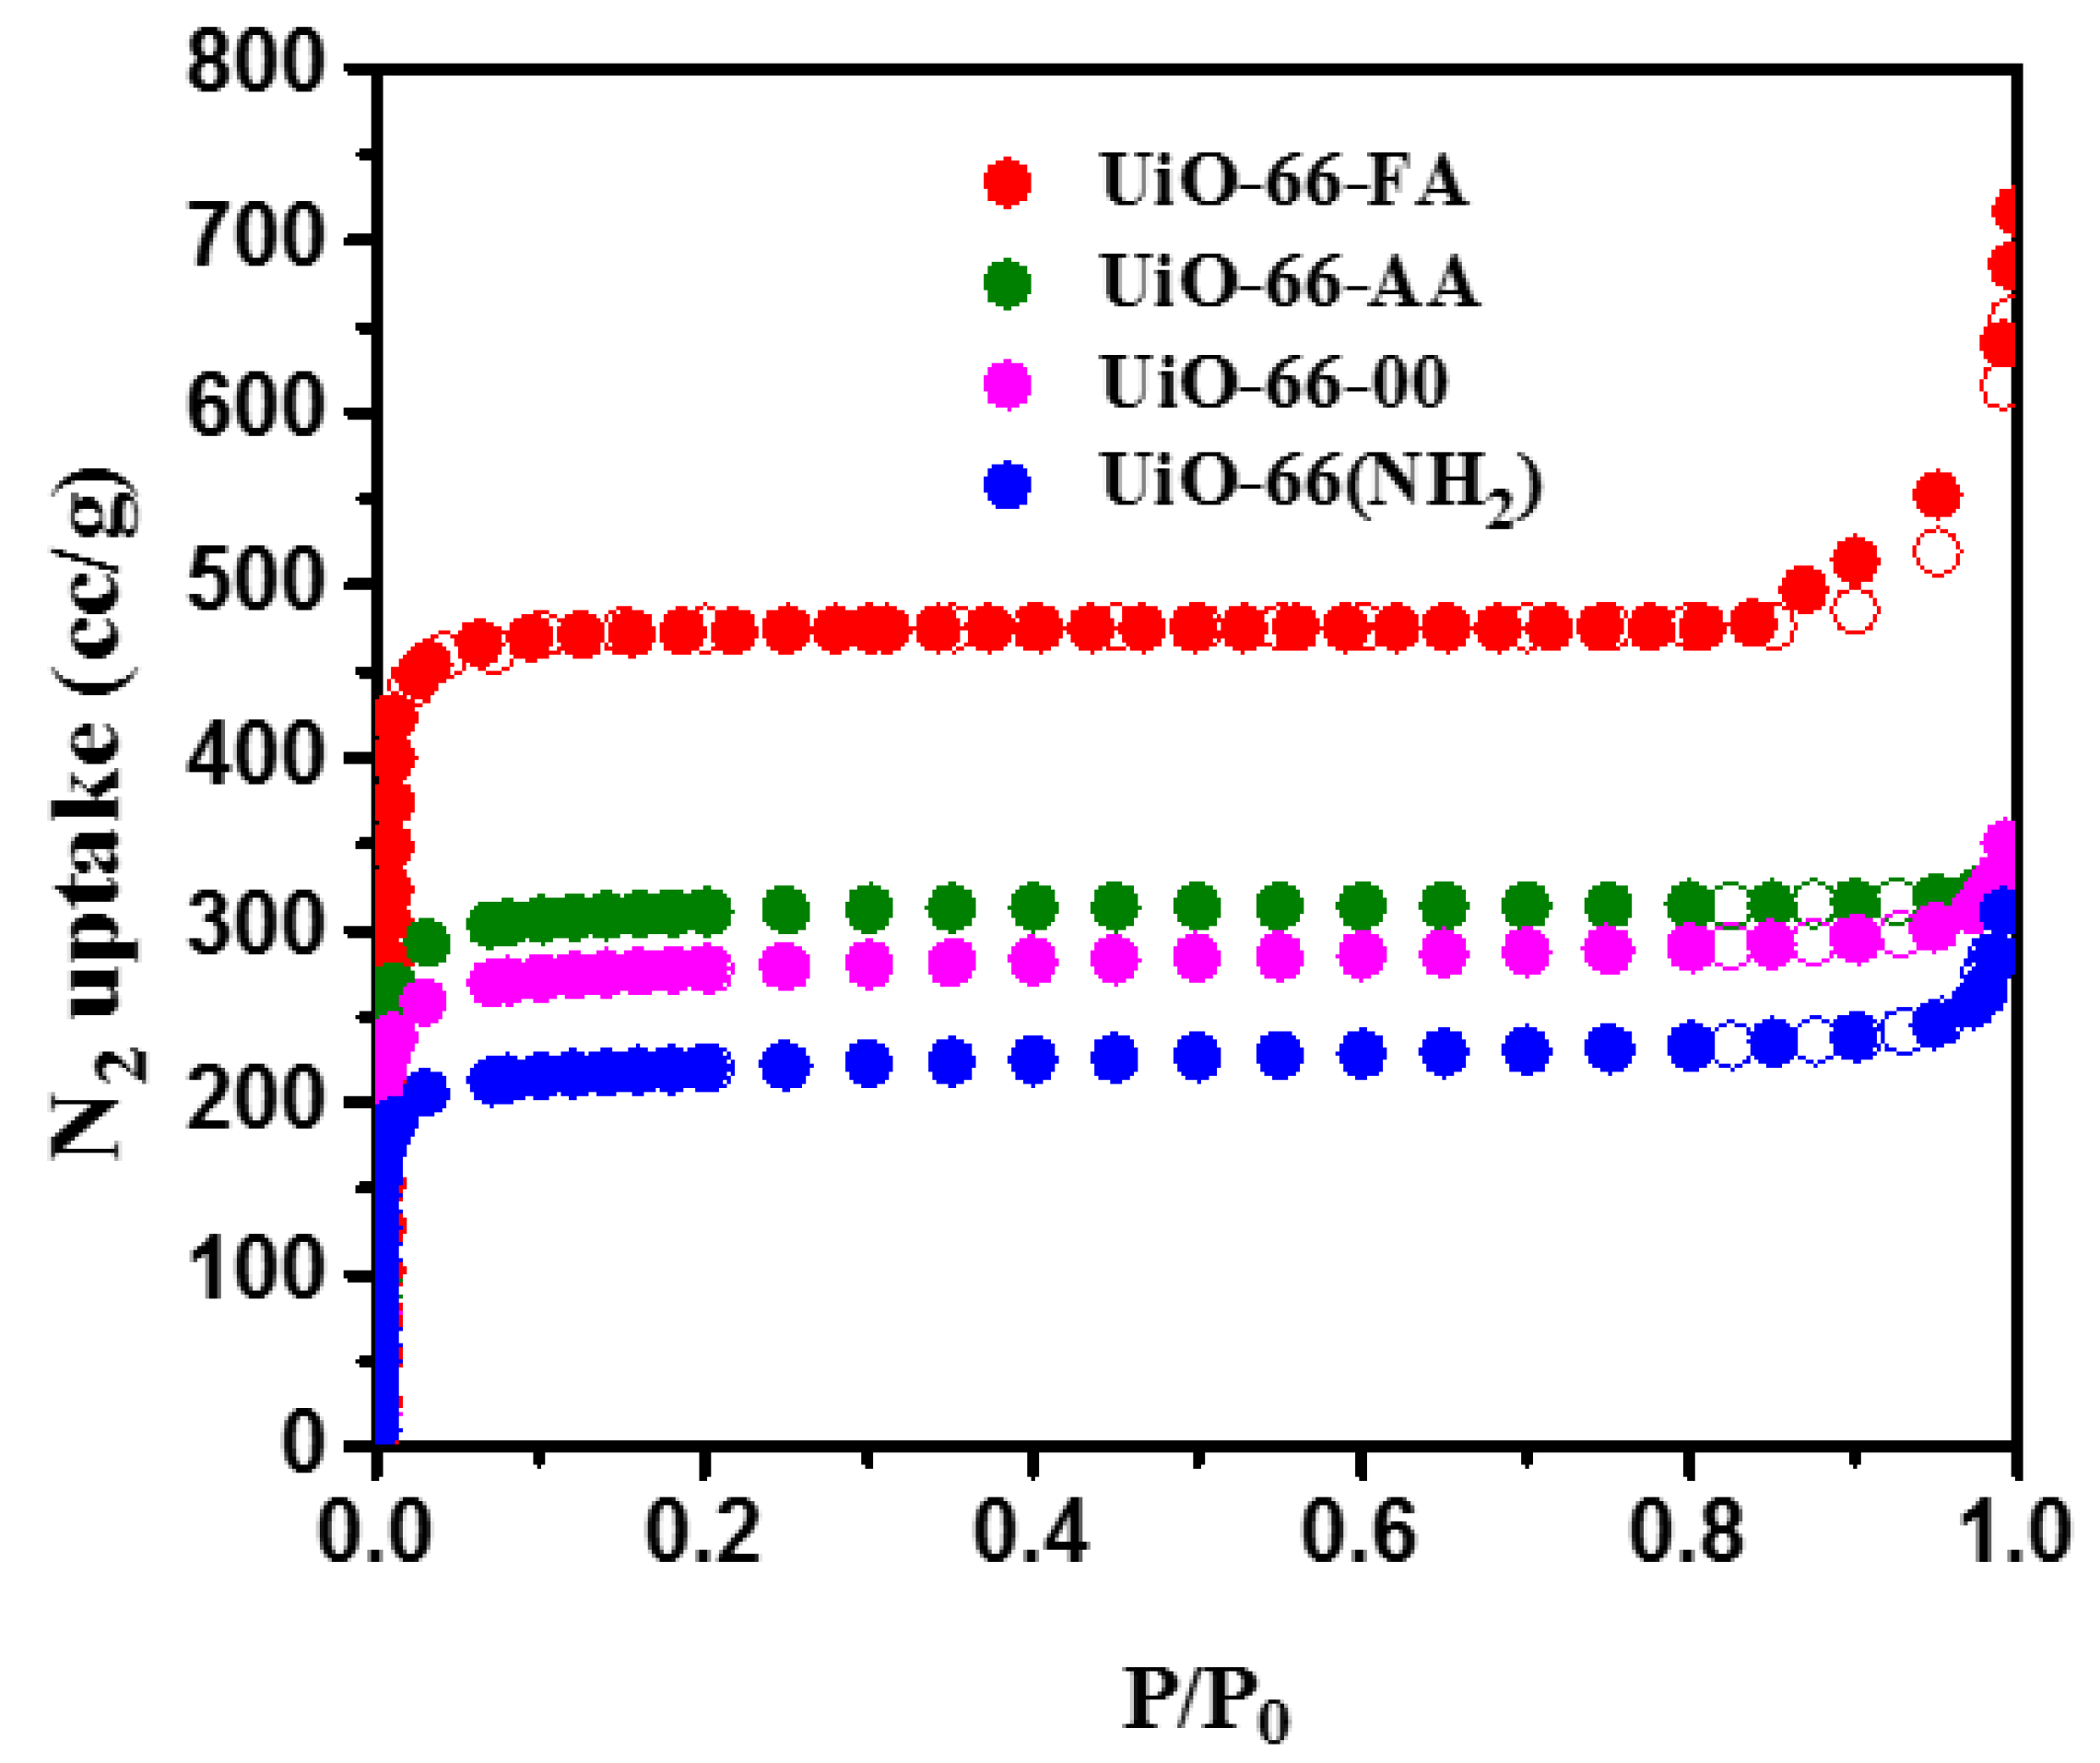
2.3. N2 Sorption–Desorption Measurements

The nitrogen adsorption–desorption isotherms of all the synthesized MOFs plotted in Figure 3, shows type I isotherms which generally reflected the microporous nature of the MOFs and monolayer adsorption on these materials. The BET surface area plot and pore size distribution can be found in the Supplementary Materials (Figure S1). In the first step, when comparing the isotherms of the MOFs synthesized with the same organic linker (UiO-66-00, UiO-66-AA, and UiO-66-FA), we observed that the adsorption was varied according to the presence or absence of the modulator. Among these three materials, the nitrogen adsorption for UiO-66-00 was found to be the lowest, but the greatest in the case of UiO-66-AA and still significantly large in the case of UiO-66-FA. This means that the presence of a modulator in the structure of the MOF increased the N2 adsorption, which was also dependent on the nature of this modulator, since the adsorption was much larger when using the formic acid instead of the acetic acid. This means that the formic acid leads to the formation of a highly defective structure.
In the second step, the effect of the introduction of amine functional group NH2 on nitrogen adsorption was determined by comparing UiO-66-AA with UiO-66(NH2). It was found that the N2 uptake by UiO-66-AA is greater than that of UiO-66(NH2), which can be explained by the fact that a part of the porous network for the UiO-66(NH2) particles was blocked by the bulky amine groups, thus causing a remarkable decrease in the porosity and subsequently a decrease in the specific surface area. This again proved that these groups resulted in the lowest nitrogen adsorption for UiO-66(NH2), not only when comparing it to UiO-66-AA, but also when compared to the other two MOFs. The Brunauer–Emmett–Teller (BET) surface areas and pore volumes of the particles were obtained from the isotherms in Figure 3 and the values were given in Table 1.
These results show that the BET surface area has increased from 886 m2/g for UiO-66-00 to 988 m2/g for UiO-66-AA to reach a significantly larger value of 1720 m2/g for UiO-66-FA. In addition, the BET surface area for UiO-66(NH2) represented the smallest value of 703 m2/g. On the other hand, the pore volumes calculated and given in Table 1 show the same trend as that for the surface areas of these MOFs. Despite the difference between the adsorption capacities of these MOFs, they all exhibited large specific surface areas and therefore the very high porosities needed for several applications such as catalysis and gas storage.

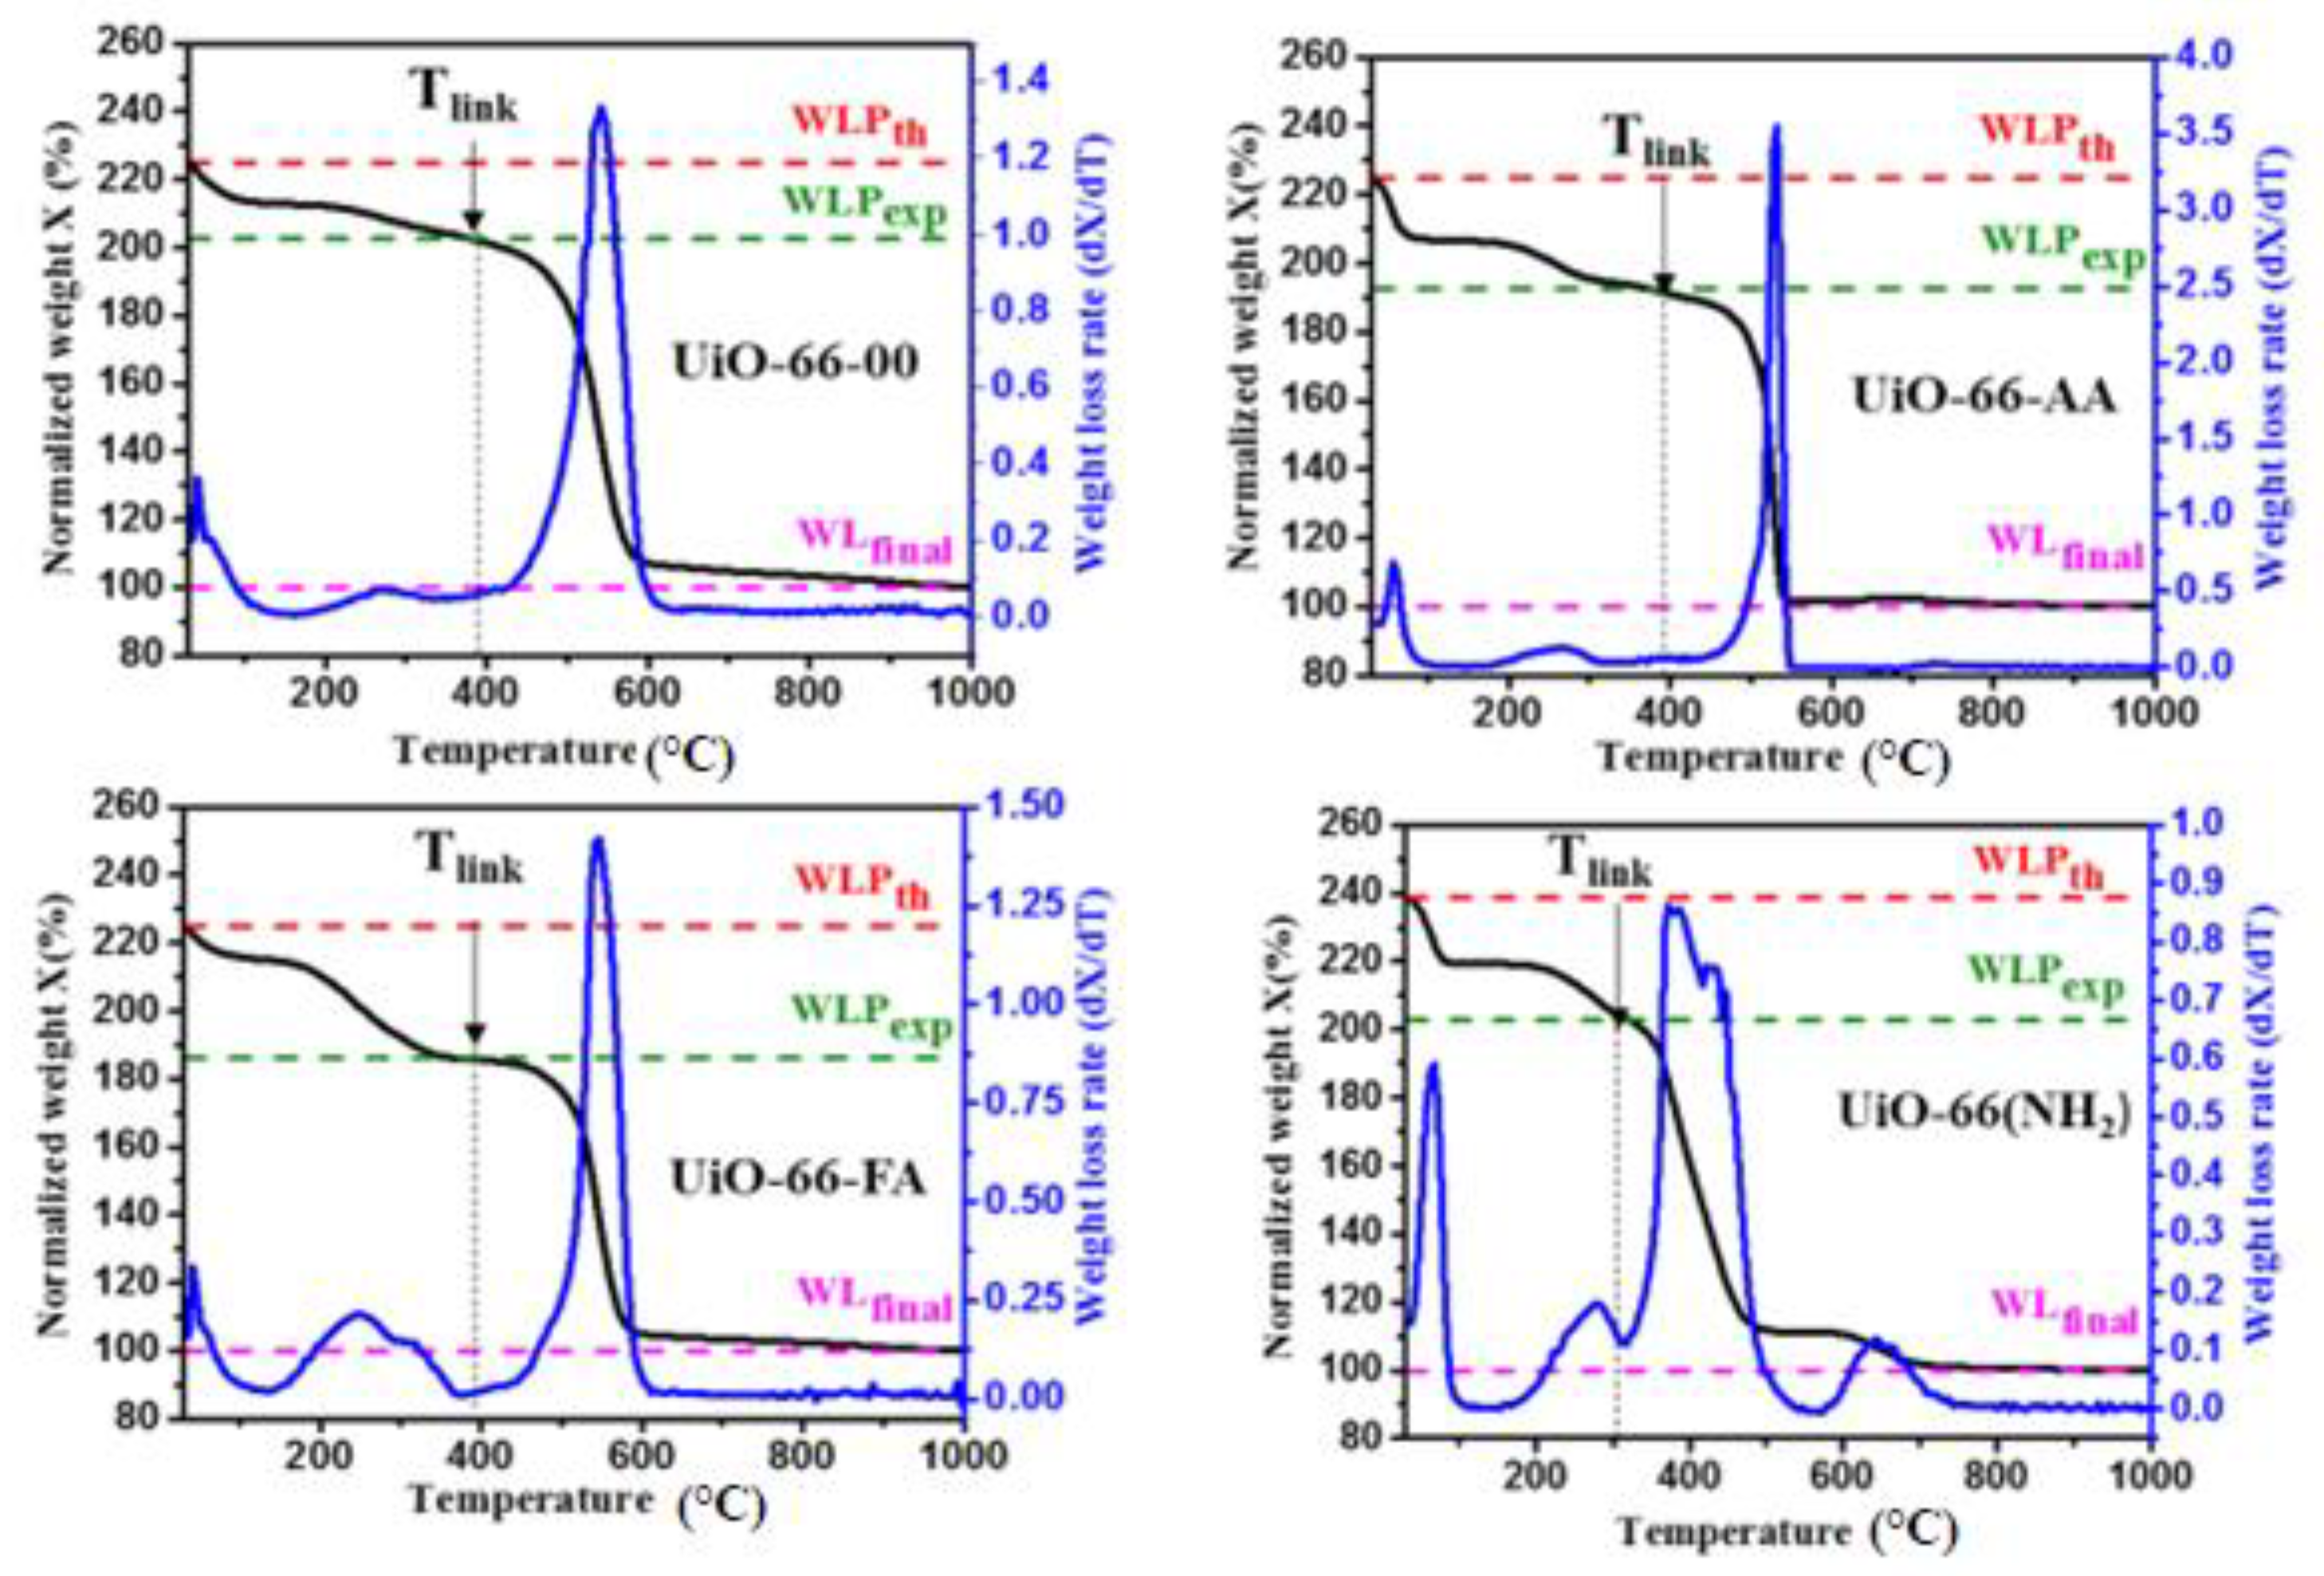
2.4. Thermogravimetric Analysis

In order to study the thermal stability of these materials and to calculate the number of missing linkers in their structures, thermogravimetric analysis was performed on these MOFs. Figure 4 shows the results obtained with the TGA curves that clearly show the change in the mass of each sample as a function of the temperature ranging from 30 °C to 1000 °C.
First, the black TGA curves were normalized so that the final mass loss WLfinal was set to 100%. WLPth and WLPexp represented the theoretical and experimental mass loss plateaus, respectively. In addition, the curves in blue represented the DTG curves of the first derivatives of the TGA curves which allowed to determine the phases corresponding to the mass losses and to obtain the number of defects in each structure. Several recent studies on defective MOFs have employed thermogravimetric analysis as a tool to account for structural defects quantitatively [29,30,31]. Figure 4 shows that there was a difference between WLPth and WLfinal and between WLPexp and WLfinal for the four MOFs. This means that the four synthesized materials had structural defects where a number of the organic linkers were missing, thus creating Lewis acid sites in the MOF structure. It was clearly seen that the mass loss plateau measured experimentally was lower than the theoretical plateau under all the synthesis conditions.
For the four synthesized MOFs, we observed the existence of three main mass losses. The first mass loss approximately occurs between 35 °C and 100 °C, which corresponds to the removal of water molecules adsorbed by the MOFs crystals. The second mass loss is generally due to the elimination of the monocarboxylate ligands by dehydroxylation of the zirconium clusters. This second phase extended from 100 °C up to a temperature called Tlink which is the temperature from which the mass loss is attributed to the combustion of the organic linker [32,33]. Then, the third phase of major mass loss which starts from Tlink, was attributed to the destruction of the MOF structure by the combustion of the organic linker. This phase results in a very sharp peak for the four MOFs, but with another additional small peak following it in the case of UiO-66-NH2 only. This additional peak was obtained in the phase of the combustion of the functionalized organic linkers, and it could be due to the combustion of the amine functional groups of the organic linker of the MOF. This was the reason why the temperature range for UiO-66(NH2) was different from that of other MOFs in the third phase.
For the three unfunctionalized MOFs, UiO-66-00, UiO-66-AA, and UiO-66-FA, the mass loss attributed to the combustion of terephthalic acid occurs above a temperature Tlink around 400 °C where the very small peak preceding the combustion of the linker ends. For this case, we confirmed that the presence or absence of a modulator in these three structures did not affect the maximum temperature Tlink. The MOF can withstand before the combustion of its linker and therefore cannot affect the thermal stability of the MOF. However, for UiO-66(NH2), the mass loss attributed to 2-aminoterephthalic acid combustion should include the temperature range of functional group combustion. We found here that the Tlink temperature corresponding to this MOF was approximately equal to 305 °C.
Now, the TGA curves are analyzed for the determination of the number of defects present within each structure of these MOFs. Knowing that the mass loss plateau corresponding to the combustion of the linker is inversely proportional to the number of missing linkers in the structure [1,34] we deduced that the more linkers were missing in the crystal, the lower the percentage of linker mass relative to the total mass of the crystal was, and the smaller the mass loss plateau was. It can be noticed here that the creation of these defects was attributed to a loss at the linker level or at the cluster level; both were taken into consideration.
As can be seen in Figure 4, the mass loss plateau corresponding to the linker combustion in UiO-66-00 is the largest among the others. In addition, this plateau in the case of UiO-66-AA was larger than that of UiO-66-FA. Therefore, the structure of UiO-66-FA represented the largest defect number, whereas UiO-66-00 represents the smallest defect number (Table 1). Interestingly, the structures of these MOFs are defective either in the presence or absence of the modulator. However, the degree of these defects depends on the type and the concentration of the modulator [35,36].
On the other hand, the functionalized MOF, UiO-66(NH2), also presented a higher defect number than UiO-66-AA despite the fact that these two MOFs were synthesized in the presence of the same modulator which was the acetic acid. This is due to the presence of the amino functional group which resulted in a decrease in the affinity of the amino-terephthalic acid to the Zr cluster.
The textural properties of the four synthesized MOFs such as the number of structural defects (number of missing linkers per cluster), the specific surface area, the pore volume and the particle size are presented in Table 1.

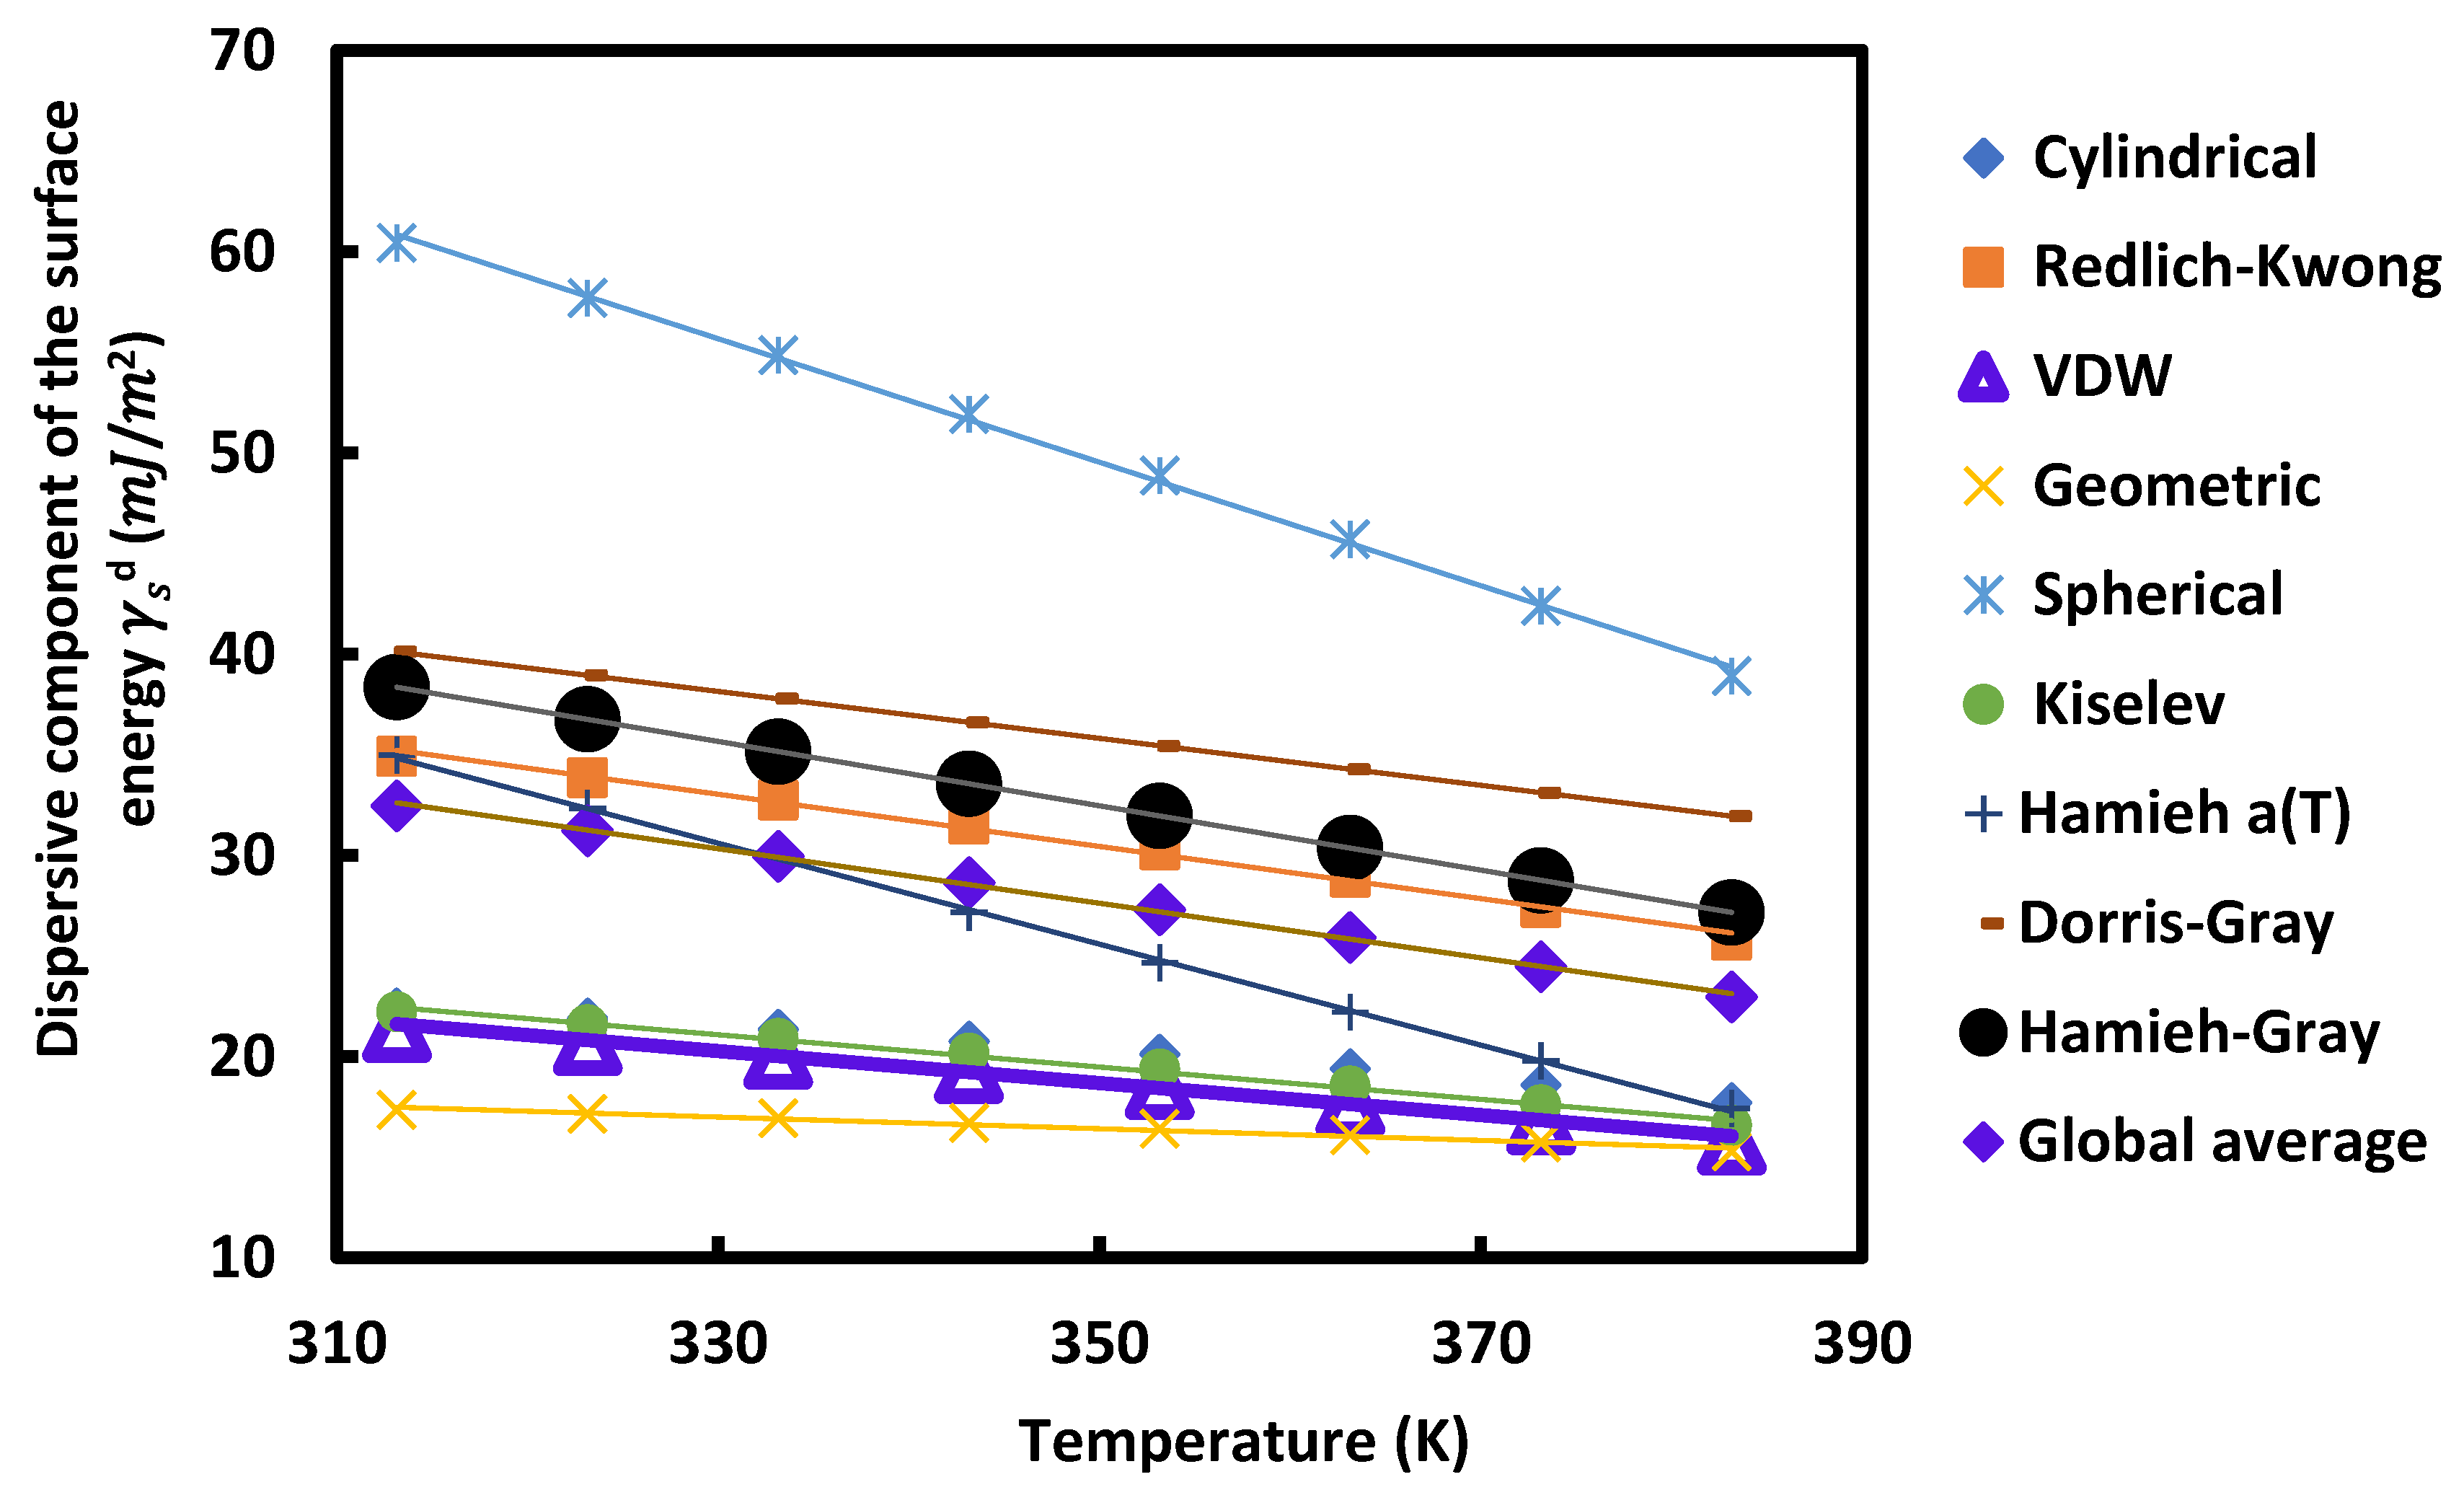
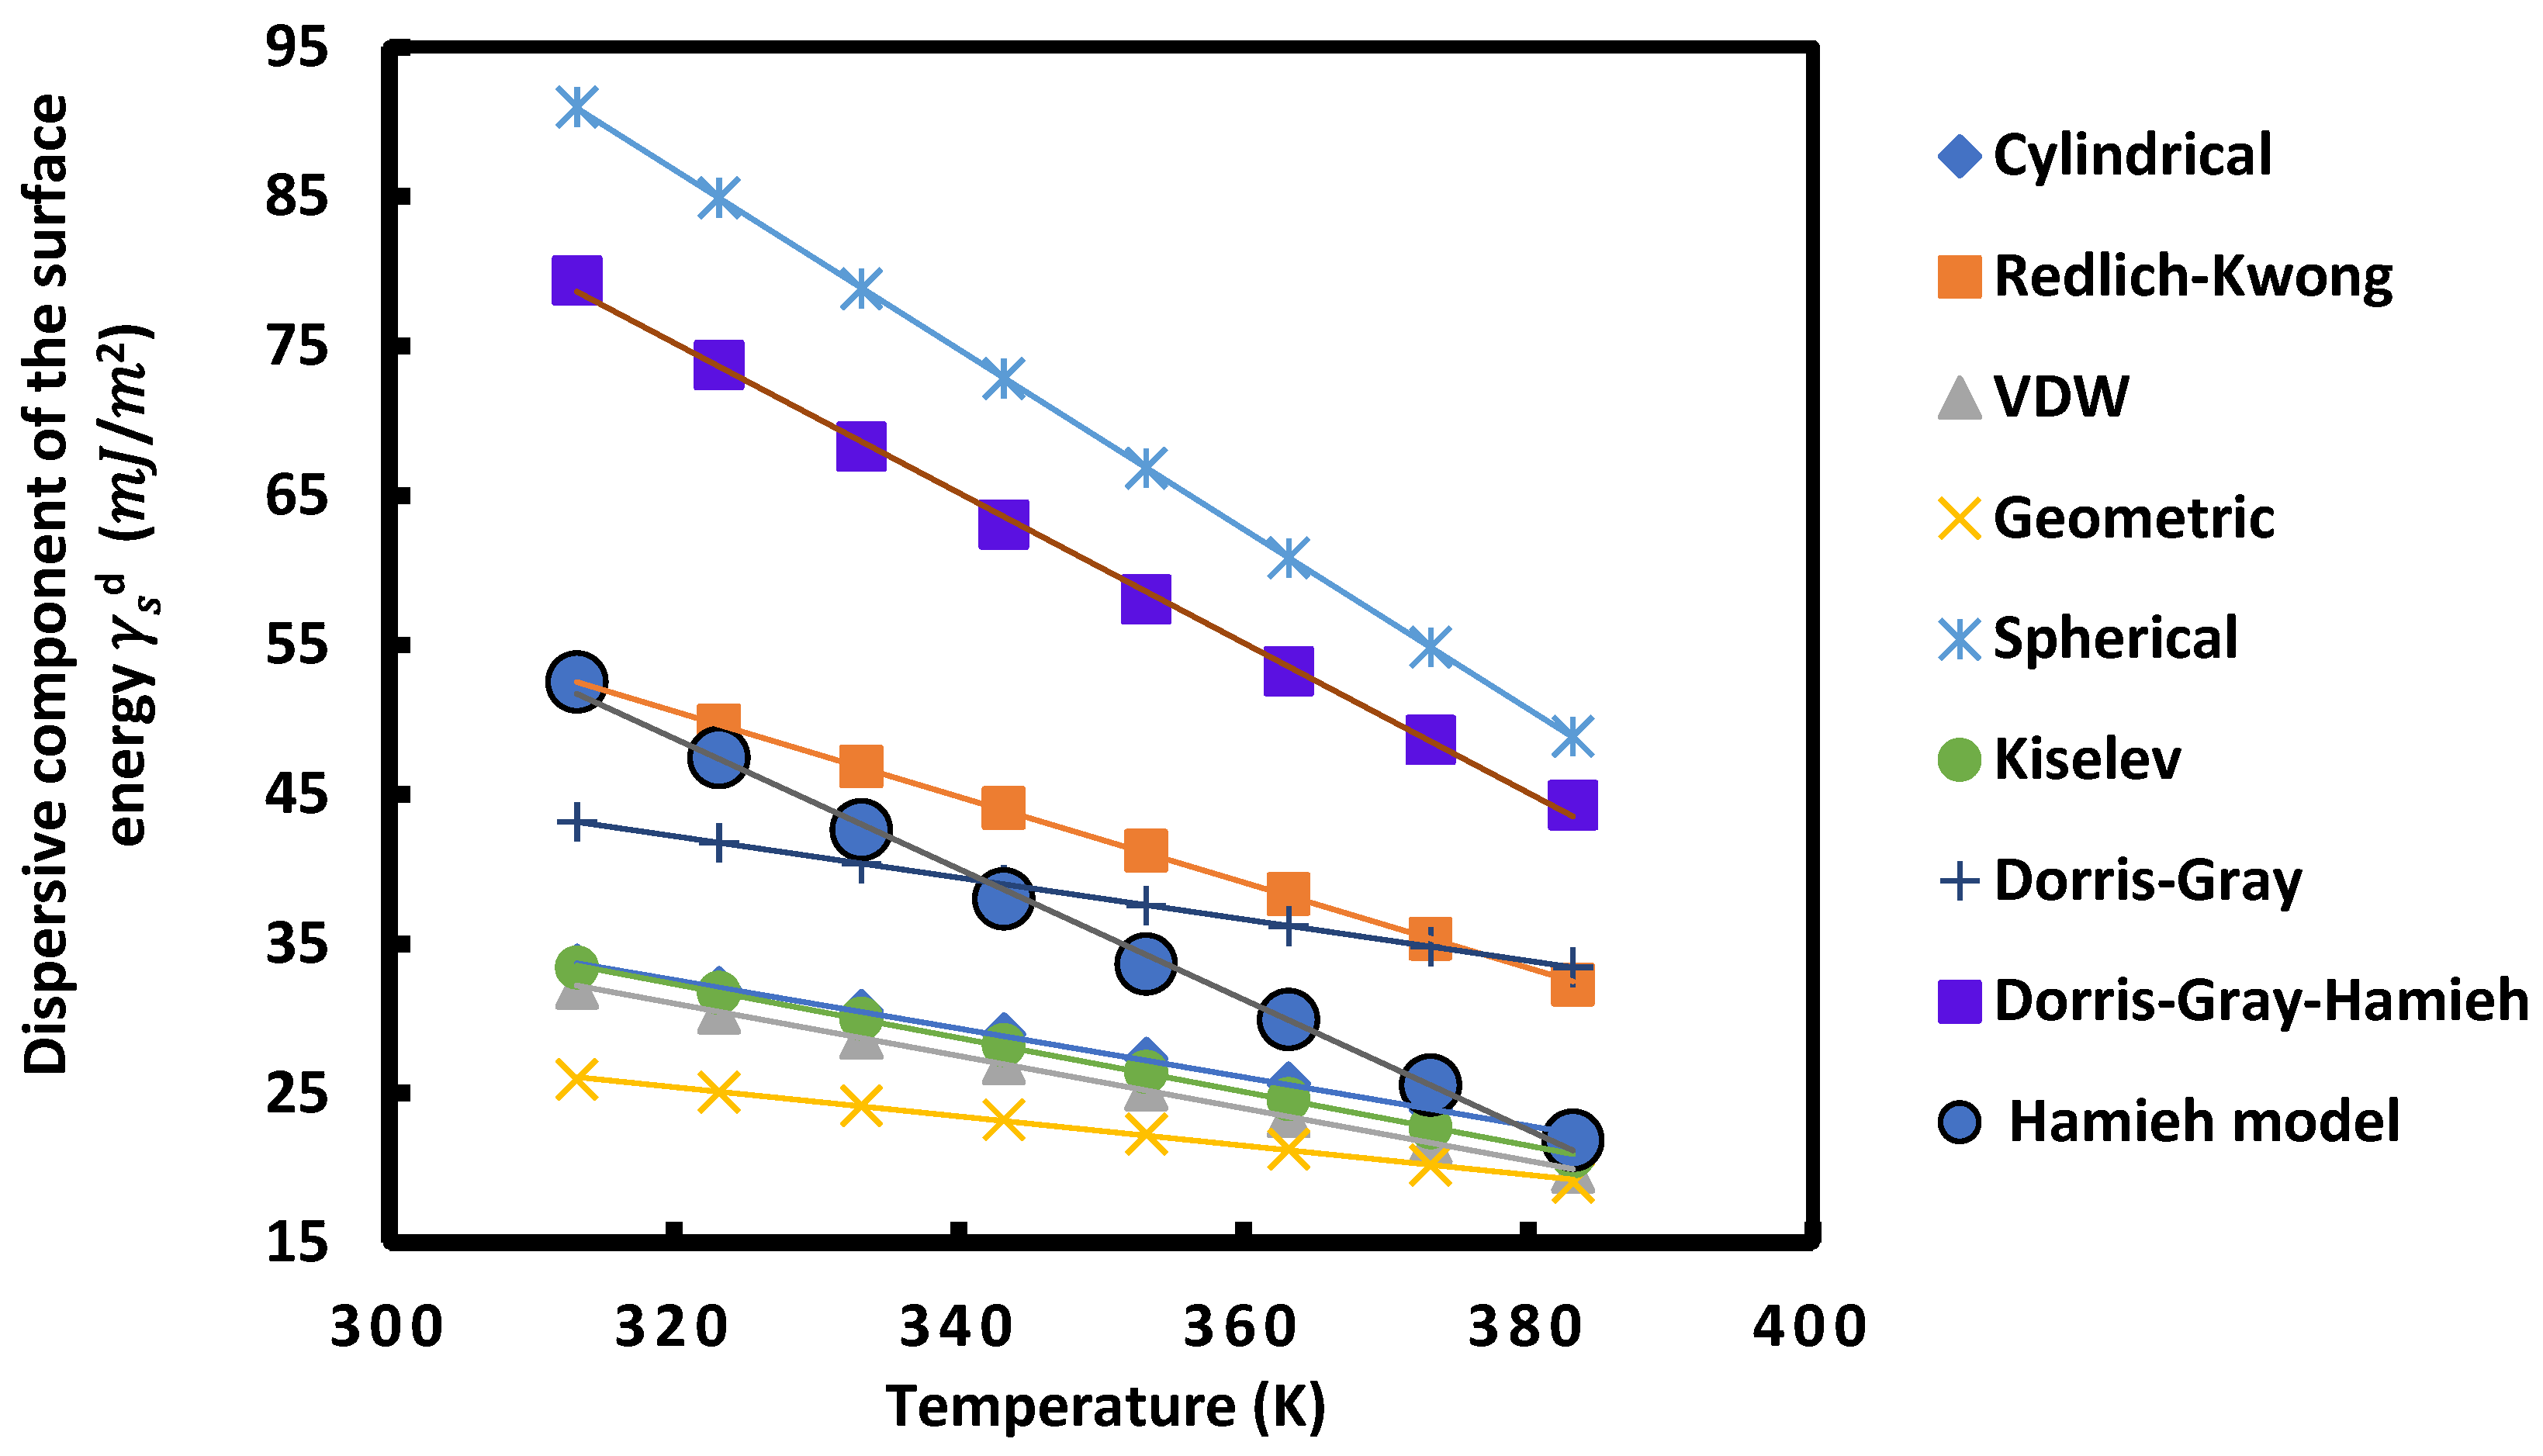
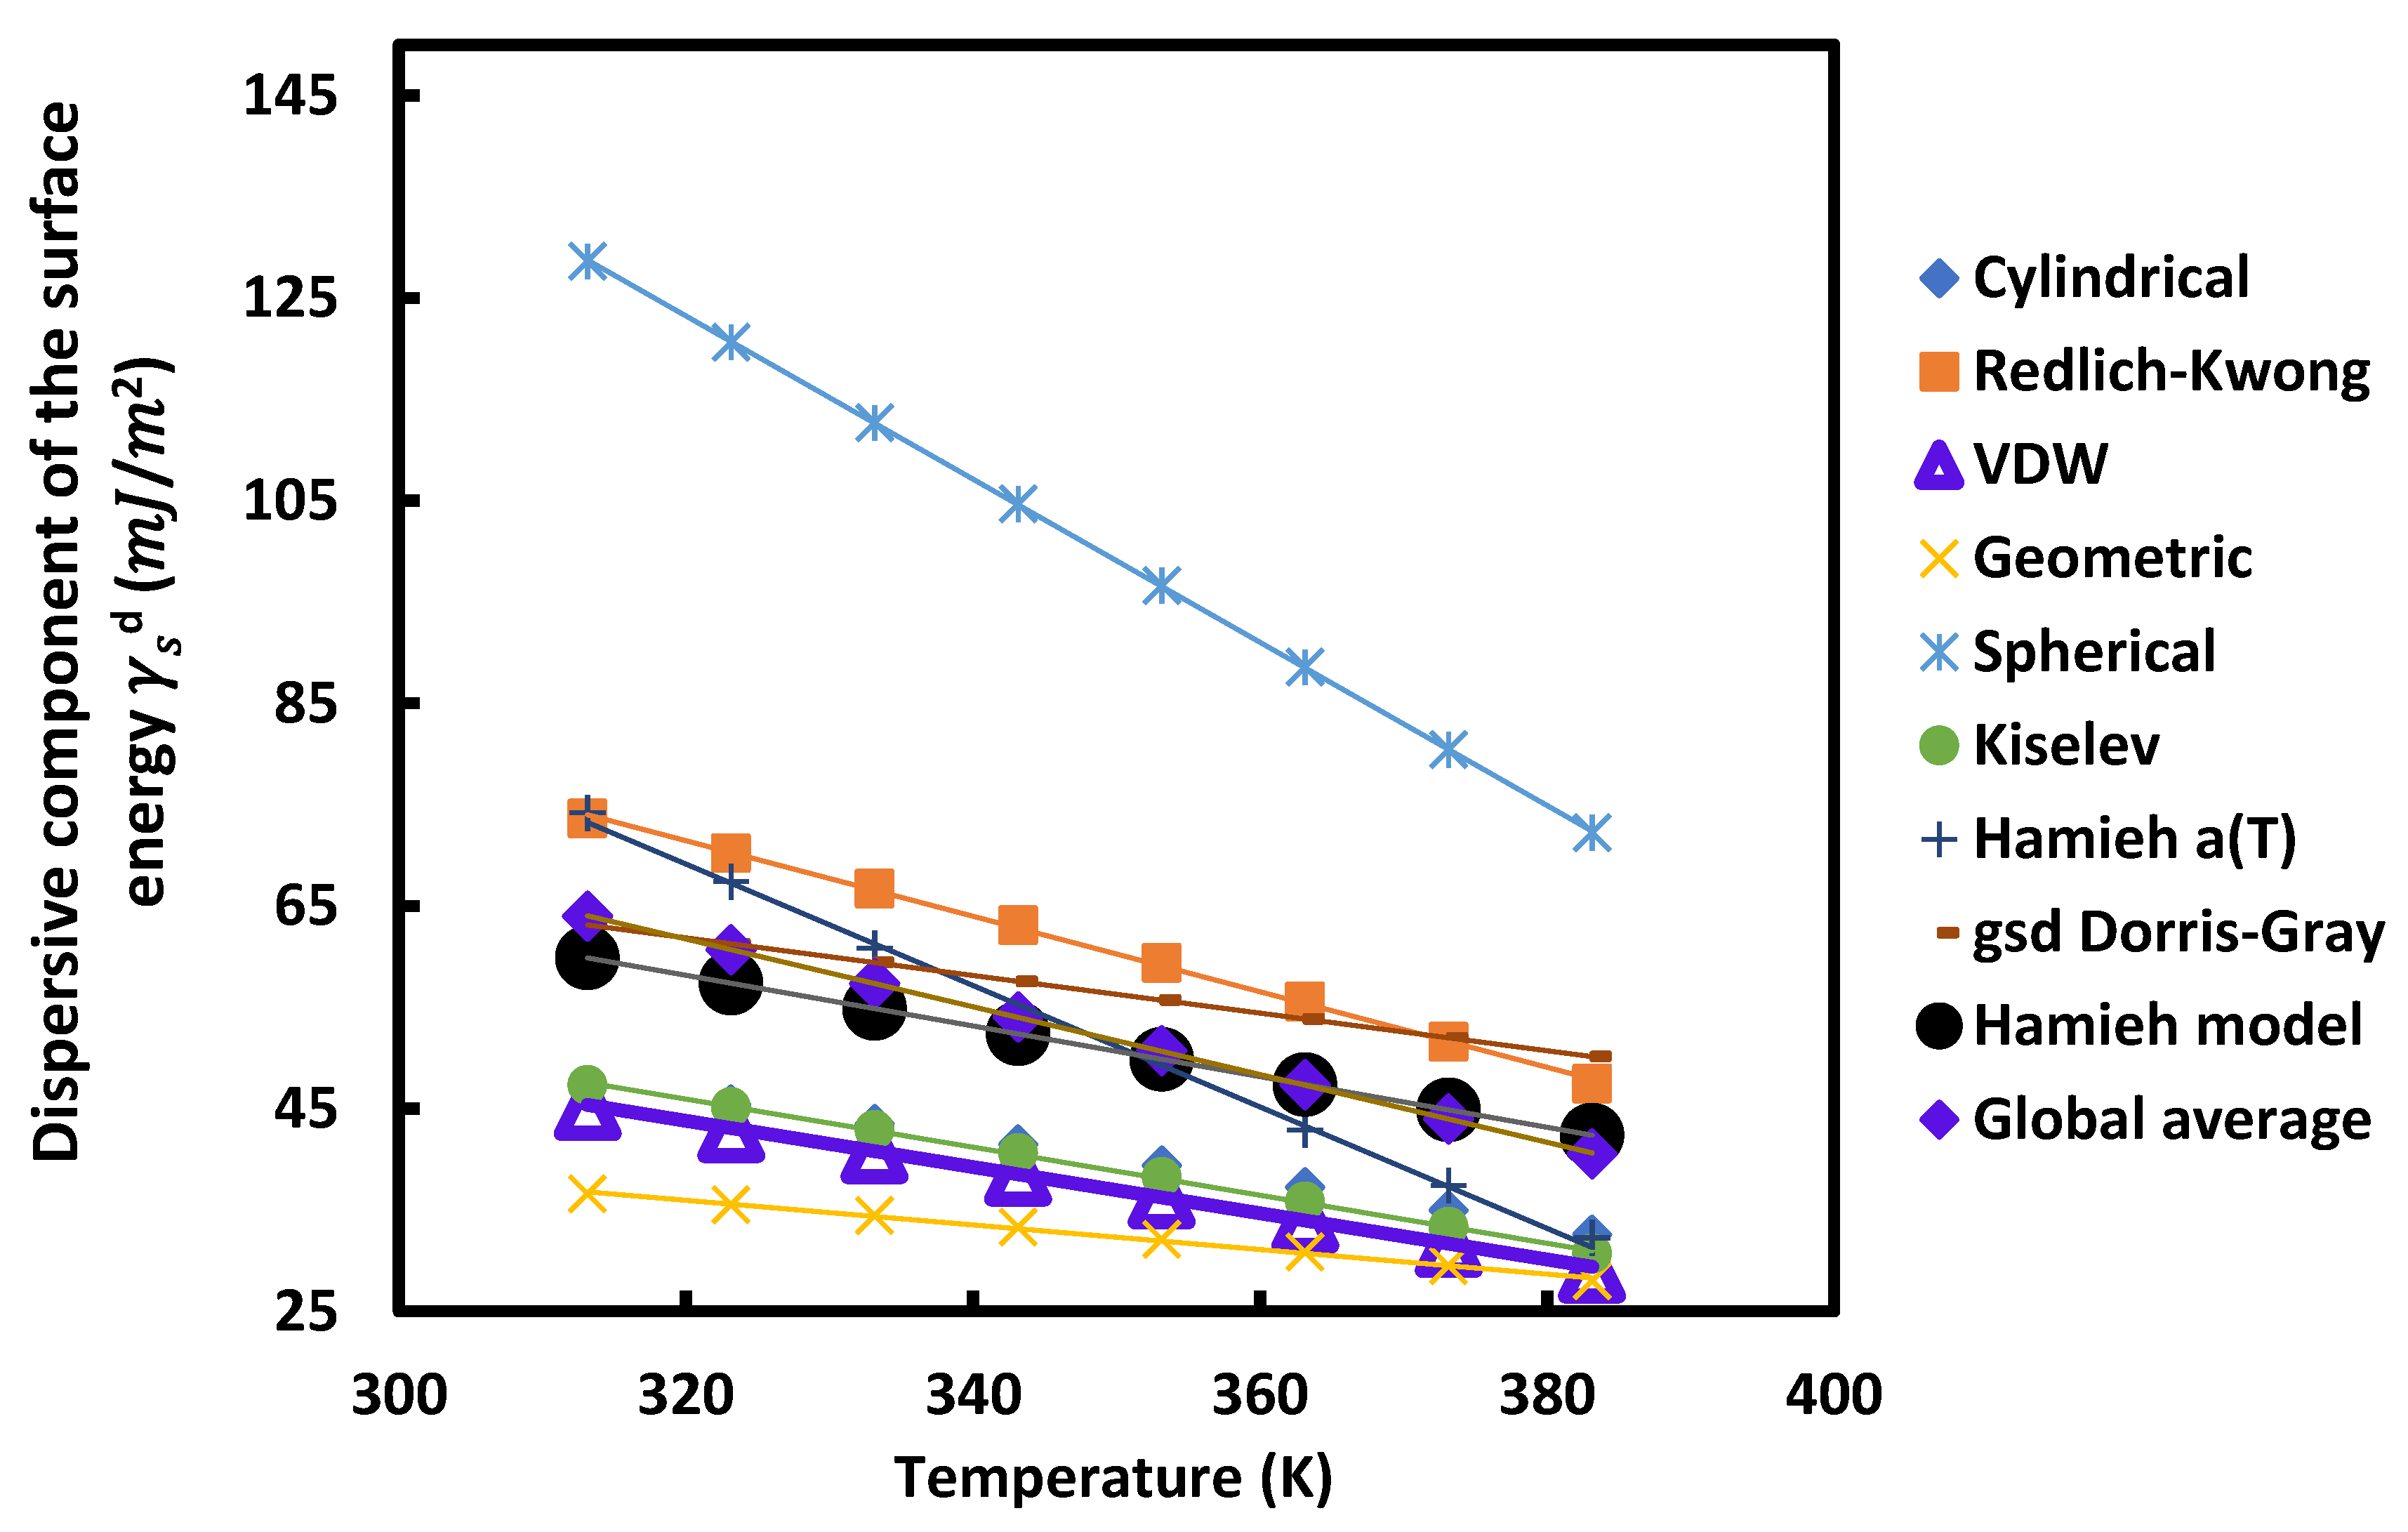
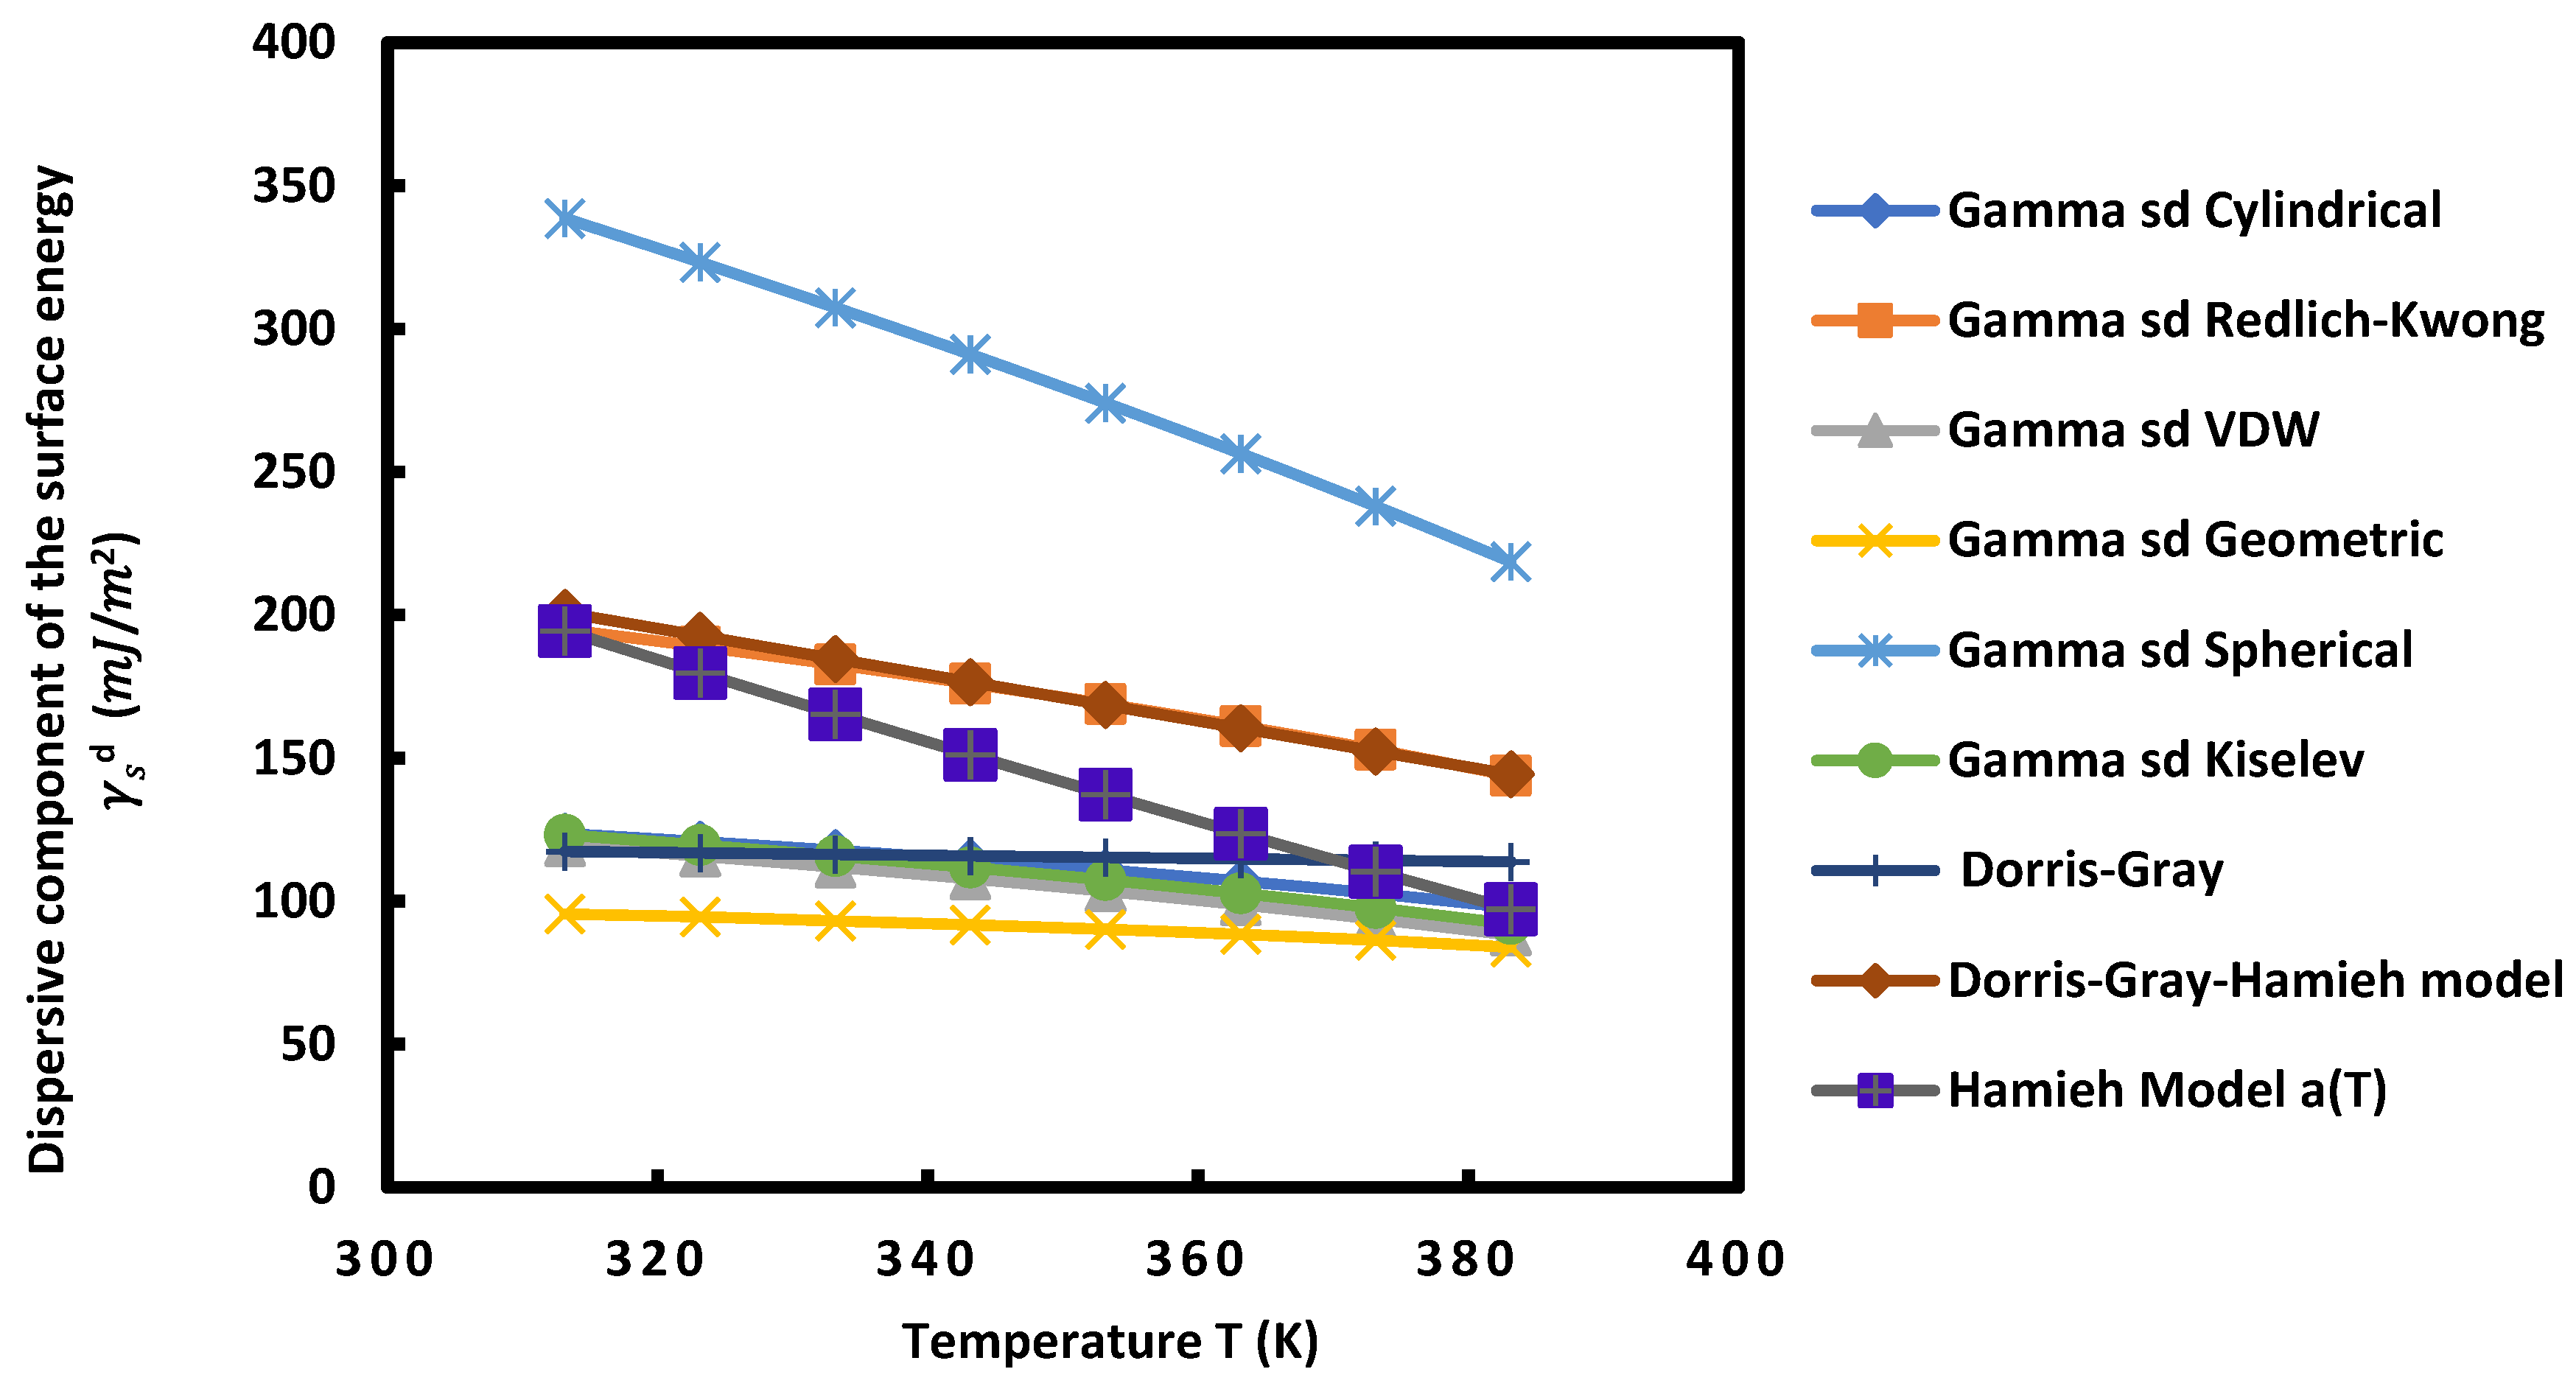
2.5. Effect of Modulation and Functionalization on the Dispersive Component of Surface Energy

On Tables S1–S4, we gave the values of the dispersive component of surface energy γ s d as a function of temperature for the four synthesized MOFs using nine molecular and thermal models which are described above. The variations of γ s d ( T ) are given in Figure 5, Figure 6, Figure 7 and Figure 8.
For all these MOFs and according to the different models used, Figure 5, Figure 6, Figure 7 and Figure 8 show that the variation of γ s d as a function of temperature was perfectly linear decreasing indicating the decrease in the dispersive component of the surface energy of the different materials when the temperature increases. Then, a general linear equation with excellent linearity is obtained for γ s d ( T ) for each of these materials. This equation is of the form:
γ s d ( T )   =   a   T   +   b
where a = d γ s d d T = ε s d and b = γ s d ( T = 0   K ) .
The slope of the equation obtained represents the value of the dispersive surface entropy ε s d and the value of b represents the dispersive component of the surface energy at T = 0 K obtained by extrapolation. Table 2, Table 3, Table 4 and Table 5 show the linear variations of γ s d ( T ) as well as the values of ε s d and γ s d ( 0   K ) for all material surfaces.
Figure 5, Figure 6, Figure 7 and Figure 8 and Table 2, Table 3, Table 4 and Table 5 show that for each MOF, there is a large difference between the values of γ s d ( T ) , ε s d et γ s d ( 0   K ) obtained by the different models already described. This disparity between the values of the dispersive surface energy of materials is certainly due to the difference in the estimation between the different models of the surface areas of the various organic molecules. In fact, there is an important effect of the temperature on the surface area of molecules adsorbed on solid surfaces. All models except the thermal model did not take into account the variation of the surface area as a function of the temperature. Consequently, the values obtained for these surface parameters depend on the nature of the used model. By comparing the obtained data reported in the previous tables and figures, we deduced that at a fixed temperature and for any studied model, UiO-66-FA had the largest dispersive surface energy component among them. Similarly, MOF with acetic acid gave values of γ s d greater than the non-modulated MOF. The reason for obtaining these results is due to the fact that the acids have large surface energy and therefore, give higher values of the dispersive component for the two MOFs modulated with these acids. On the other hand, knowing that formic acid has a higher surface energy than that of acetic acid, the dispersive surface energy γ s d of UiO-66-FA was proved to be greater than that of UiO-66-AA. Similarly, the same trend was observed between the dispersive surface entropy (in absolute value) and the dispersive component extrapolated at T = 0 K of the three other MOFs. Furthermore, we observed that at a fixed temperature the surface dispersive energy and its entropy were the largest for UiO-66(NH2) compared to the non-functionalized MOFs. These higher values relative to UiO-66(NH2) are due to its organic linker functionalized by the amine group NH2 that has a high surface energy and to its acid acetic modulator. Two factors for this MOF can be considered as responsible for these highest values: the modulation and functionalization of the MOF.

2.6. Effect of Modulation and Functionalization on the Lewis Acid–Base Behavior

Using IGC methods such as vapor pressure methods, deformation polarizability, topological index as well as organic and thermal models already mentioned, we determined the specific free energy of adsorption ( Δ G a s p ( T ) ) of polar molecules on the surfaces of these MOFs as a function of temperature. From the obtained linear relations of ( Δ G a s p ) as a function of temperature, it was also possible to deduce the values of specific enthalpy ( Δ H a s p ) and specific entropy ( Δ S a s p ) of adsorption of the various polar solvents on the material surfaces. The obtained results are shown in Tables S5–S16 in the Supplementary Materials. After the determination of these specific interactions, and in order to determine the Lewis acid–base constants of the four MOF surfaces, we plotted the variations of ( Δ H a s p A N ) and ( Δ S a s p A N ) as a function of ( D N A N ) for all models and IGC methods. The results obtained are shown in Figures S2–S9 in the Supplementary Materials.
The Lewis acid KA and base KD constants of the different materials as well as the entropic acid–base parameters ωA and ωD were determined using Equations (3) and (4) [37,38,39].
The curve of ( Δ H a S p A N ) versus D N A N resulted in a straight line of slope KA and intercept KD and the curve of ( Δ S a S p A N ) versus D N A N allowed us to determine ωA and ωD.
The obtained values of Lewis acid–base constants for the four synthesized MOFs were given in Table 6, Table 7, Table 8 and Table 9. These results proved that for all used models and methods for all MOFs, the acidity/basicity ratio is greater than 1. These results reflect the amphoteric character of UiO-66 series with high acidity compared to their basicity. This is due to the structural defects that were found within the structure of each MOF, i.e., the number of defects is proportional to the acidity of each MOF.
On the other hand, we can classify the four MOF structures (Table 1) in increasing order of defects number as follows:
Number of defects (UiO-66-00) < number of defects (UiO-66-AA) < number of defects (UiO-66-NH2) < number of defects (UiO-66-FA).
Therefore, according to this classification, the order of acidity of these MOFs must have the same tendency and the same order. Consequently, the acid constant KA of UiO-66-FA must be the greatest one and followed successively by that of UiO-66(NH2), UiO-AA, and finally by UiO-66-00 which exhibits the lowest acid constant.
Now, by comparing the experimental acid constants KA of the four MOFs for all the models and methods used, we showed that only the thermal model of Hamieh verified these results and this classification, hence the importance of this model and its effectiveness among others. This more accurate result obtained for this model is due to the fact that it takes into account the thermal effect on the surface areas of the polar and non-polar probes while the other methods and models do not take this effect into consideration.
Our results proved the following increasing order of the acid constant of MOFs:
KA (UiO-66-00) = 0.49 < KA (UiO-66-AA) = 0.57 < KA (UiO-66(NH2)) = 1.06 < KA (UiO-66-FA) = 1.09. These results are in great agreement with the acid properties of the UiO-66 series tested as catalysts for esterification reaction [28,40].
Concerning the basicity constant KD, we found that UiO-66(NH2) exhibited the largest basicity constant for all used models and IGC methods. This is due to the presence of the functional group NH2 which has a basic character and, consequently, it contributes to the increase in the MOF basicity. The highest value of the basicity constant of UiO-66(NH2) compared to other MOFs means that this MOF has the highest number of basic sites relative to the other MOFs. This interesting result can be advantageously used to improve several applications of MOFs such as catalysis.

3. Materials and Methods

3.1. Materials and Synthesis Procedure

The chemicals required for the synthesis of our MOFs are zirconium chloride (ZrCl4, 98%), terephthalic acid (C6H4 (CO2H)2, 99%), 2-aminoterephthalic acid (C8H7NO4, 99%), acetic acid (C2H4O2, 99%) formic acid (CH2O2, 99%) were obtained from Acros Organics (Beirut, Lebanon). Non-polar n-alkane molecules such as pentane, hexane, heptane, and octane or nonane, and polar solvents such as N,N-dimethylformamide, dichloromethane, chloroform, benzene, toluene, ether, acetonitrile, and tetrahydrofuran at high purity were purchased from Fisher Scientific (Beirut, Lebanon). The four MOFs were synthesized in a manner similar to the synthesis in the literature [40,41].
For the synthesis of UiO-66-AA, 566 mg of terephthalic acid was dissolved with 795 mg of zirconium chloride in 250 mL of DMF and 15 mL of acetic acid (as modulator) in a 500 mL autoclavable reagent bottle. For UiO-66(NH2), the same amount of zirconium chloride was used (795 mg) and dissolved with 617 mg of 2-aminoterephthalic acid (functionalized organic linker) in the same amount of solvent and modulator mixture.
For UiO-66-00, 344 mg of zirconium chloride and 245 mg of terephthalic acid were dissolved in 40 mL of DMF and 100 μL of water in a 100 mL autoclavable reagent bottle.
The synthesis of UiO-66-FA was completed in the same manner as that of UiO-66-00 but with the addition of 11 mL of formic acid (as a modulator) to the mixture. After the complete homogenization of the mixture obtained for each MOF of these four MOFs, the bottle was placed in a sonicator at room temperature and caped and placed in an oven for 21 h at a temperature of 120 °C. After this time, the bottle was removed from the oven where a precipitate was obtained by centrifugation. The precipitate was washed with two solvents; first four times consecutively with DMF, then four times consecutively with DCM where the MOF was allowed to decant for two hours in each wash. However, in the last wash for each solvent, the obtained product was soaked in the solvent overnight. The remaining DCM was then removed by centrifugation another time and the well-washed MOF was placed in a vacuum oven under a temperature of 170 °C over one night for thermal activation.

3.2. Structural Characterization and IGC Conditions

Once the synthesis and the thermal activation of these four MOFs were achieved, these materials were characterized by PXRD, SEM, TGA, and N2 sorption measurements [41].
For the chromatographic measurements, we used a DELSI GC 121 FB chromatograph (Beirut, Lebanon) equipped with a flame ionization detector using dried nitrogen as a carrier gas [37]. Four chromatographic columns of the same nature, of the same length, and of the same internal diameter (25 cm in length and 1 mm in internal diameter) were used in this study. Each column was filled with a given mass of one of these materials in powder form; 145 mg of UiO-66-00, 205 mg of UiO-66-AA, 230 mg of UiO-66-FA and 170 mg of UiO-66-NH2 mg. After packing a specific type of these materials into each column, the column was preconditioned at 280 °C under nitrogen flow for 24 h to remove any residual solvent left in the packing material. For UiO-66-00, UiO-66-AA, and UiO-66-FA, the carrier gas flow rate was optimized at 20 mL/min while this flow rate was optimized at 30 mL/min for UiO-66(NH2). The temperatures of the measurements (column temperature) were varied from 220 to 270 °C by a step of 5 °C for each measurement. The first-order retention time was determined for all measurements. Each measurement of this time was repeated three times where the standard deviation was less than 1% in all measurements.

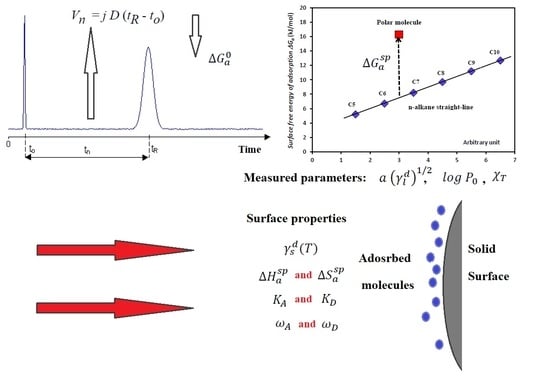
3.3. Models and Methods of Inverse Gas Chromatography

By using the inverse gas chromatography technique at infinite dilution, we determined the net retention times and volumes and then calculated the free energy of adsorption Δ G a 0 of n-alkanes and polar solvents on the different MOFs by varying the temperature. We used the fundamental equation of IGC technique:
Δ G a 0 = R T   l n   V n + R T   l n   ( s m π 0 P 0 )
where V n is the net retention volume of a probe, T the absolute temperature, R the perfect gas constant, m the mass of the solid filling the column, and P 0 and π 0 given by one of the two following reference states:
Kemball and Rideal reference state [42] given for T 0 = 0   ° C by P 0 = 1.013 × 10 5   Pa and π 0 = 6.08 × 10 5   N   m 1 .
De Boer et al. reference state [43] given for T 0 = 0   ° C by P 0 = 1.013 × 10 5   Pa and π 0 = 3.38 × 10 5   N   m 1 .
Different models and methods in IGC technique at infinite dilution were used to determine the surface thermodynamic properties of the MOFs, such as the surface dispersive component and the specific interactions of these materials for the determination of the Lewis acid–base behavior of the synthetized MOFs.
The determination of the dispersive energy of surface of each material was obtained according to several models such as Dorris–Gray and those based on the relation of Fowkes by applying various molecular models giving the surface areas of n-alkanes and polar organic molecules. Six models were used: Kiselev, spherical, geometric, van der Waals, Redlich–Kwong, cylindrical models, and finally the Hamieh thermal model which takes into account the effect of temperature on the surface areas of the probe molecules [44]. In addition, the specific interactions such as the specific enthalpy, entropy, and free enthalpy of adsorption of the polar molecules on the surfaces of these materials have been determined using the same molecular and thermal models by using the parameter a   ( γ l d ) 1 / 2 where γ l d is the dispersive component of the surface tension of the solvent and a its surface area. We applied three other IGC methods and used the following thermodynamic parameters:
The logarithm of the vapor pressure l o g   P 0 [45],
The deformation polarizability α 0 [46]
The topological index χ T [47].
By using the above models and methods, we determined the specific free energy Δ G a s p ( T ) of the polar molecules given by:
Δ G a s p ( T ) = Δ H a s p T Δ S a s p
where Δ H a s p and Δ S a s p , respectively, represent the specific enthalpy and entropy of adsorption of polar solvents on the different MOFs. Δ H a s p and Δ S a s p were directly determined from Equation (3) by varying the temperature [29].
By using the specific enthalpy ( Δ H a s p ) and entropy ( Δ S a s p ) of adsorption as a function of the corrected donor (DN′) and acceptor (AN′) numbers of polar molecules:
( Δ H a s p ) = K A D N + K D A N
( Δ S a s p ) = ω A D N + ω D A N
We determined K A and K D representing the enthalpic acidic and basic parameters of the solid, respectively, as well as ω A and ω D which correspond to the entropic acidic and basic constants, respectively.

4. Conclusions

The inverse gas chromatography technique at infinite dilution was used to determine the surface and thermodynamic properties and the superficial acid–base properties in Lewis terms of four zirconium-based MOFs of the UiO-66 series. These materials were synthetized and fully characterized by XRD, SEM, TGA, and N2 sorption–desorption measurements.
Nine molecular and thermal models and three chromatographic methods were employed in the IGC technique at infinite dilution. We determined the variations of the dispersive component of the surface energy for all these materials as a function of temperature and we found that it linearly decreased as a function of the temperature. On the other hand, our results show that the use of a modulator such as formic acid or acetic acid and the incorporation of an amine functional group leads to an increase in the value of the dispersive component of the surface energy of the material surfaces while remaining decreasing as a function of temperature.
The different models and IGC methods show an amphoteric character of all MOFs with high acidity compared to their basicity. This result reflected the high acidity of zirconium-based MOFs and explained their high efficiency as acid-based catalysts. By comparing the acidity of the four MOFs, it was shown that UiO-66-FA has the greatest acidity due to the largest number of defects among these surfaces. We proved the following increasing order of the different MOFs:
KA (UiO-66-00) < KA (UiO-66-AA) < KA (UiO-66(NH2)) < KA (UiO-66-FA)
On the other hand, we observed that UiO-66(NH2) exhibited the greatest basicity constant due to the presence of the NH2 functional group grafted in the organic linker. By comparing the results obtained by these different models and methods, it was found that the thermal model of Hamieh gave the most accurate results compared to other models and IGC methods.

Supplementary Materials

The following supporting information can be downloaded at: https://www.mdpi.com/article/10.3390/catal13010205/s1, Figure S1: BET surface area plot and correlation coefficient: (a) for UiO-66-00, (b) for UiO-66-AA, (c) for UiO-66(NH2) and (d) the plot of pore size distribution of MOFs; Figure S2: Variations of ( Δ H a s p A N ) as a function of ( D N A N ) of UiO-66-00 for different models and IGC methods; Figure S3: Variations of ( Δ H a s p A N ) as a function of ( D N A N ) of UiO-66-AA for different models and IGC methods; Figure S4: Variations of ( Δ H a s p A N ) as a function of ( D N A N ) of UiO-66-FA for different models and IGC methods; Figure S5: Variations of ( Δ H a s p A N ) as a function of ( D N A N ) of UiO-66(NH2) for different models and IGC methods; Figure S6: Variations of ( Δ S a s p A N ) as a function of ( D N A N ) of UiO-66-00 for different models and IGC methods; Figure S7: Variations of ( Δ S a s p A N ) as a function of ( D N A N ) of UiO-66-AA for different models and IGC methods; Figure S8: Variations of ( Δ S a s p A N ) as a function of ( D N A N ) of UiO-66-FA for different models and IGC methods; Figure S9: Variations of ( Δ S a s p A N ) as a function of ( D N A N ) of UiO-66(NH2) for different models and IGC methods; Table S1: Values of the dispersive component of the surface energy γ s d   ( mJ / m 2 ) of UiO-66-00 material as a function of the temperature; Table S2: Values of the dispersive component of the surface energy of UiO-66-AA material as a function of the temperature; Table S3: Values of the dispersive component of the surface energy γ s d   ( mJ / m 2 ) of UiO-66-FA material as a function of the temperature; Table S4: Values of the dispersive component of the surface energy γ s d   ( mJ / m 2 ) of UiO-66(NH2) material as a function of the temperature; Table S5: Values (in kJ/mol) of the specific free energy ( Δ G a s p ( T ) ) of the various polar solvents adsorbed on UiO-66-00 material surface for different temperatures by using the various IGC models and methods; Table S6: Values (in kJ/mol) of the specific free energy ( Δ G a s p ( T ) ) of the various polar solvents adsorbed on UiO-66-AA material surface for different temperatures by using the various IGC models and methods; Table S7: Values (in kJ/mol) of the specific free energy ( Δ G a s p ( T ) ) of the various polar solvents adsorbed on UiO-66-FA material surface for different temperatures by using the various IGC models and methods; Table S8: Values (in kJ/mol) of the specific free energy ( Δ G a s p ( T ) ) of the various polar solvents adsorbed on UiO-66(NH2) material surface for different temperatures by using the various IGC models and methods; Table S9: Values of the specific enthalpy ( Δ H a s p   in   kJ   mol 1 ) of the various polar solvents adsorbed on UiO-66-00 by using the various molecular models, Hamieh model, topological index, deformation polarizability and vapor pressure methods compared to global average; Table S10: Values of the specific entropy ( Δ S a s p   in   J   K 1 mol 1 ) of the various polar solvents adsorbed on UiO-66-00 by using the various molecular models, Hamieh model, topological index, deformation polarizability and vapor pressure methods compared to global average; Table S11: Values of the specific enthalpy ( Δ H a s p   in   kJ   mol 1 ) of the various polar solvents adsorbed on UiO-66-AA by using the various molecular models, Hamieh model, topological index, deformation polarizability and vapor pressure methods compared to global average; Table S12: Values of the specific entropy ( Δ S a s p   in   J   K 1 mol 1 ) of the various polar solvents adsorbed on UiO-66-AA by using the various molecular models, Hamieh model, topological index, deformation polarizability and vapor pressure methods compared to global average; Table S13: Values of the specific enthalpy ( Δ H a s p   in   kJ   mol 1 ) of the various polar solvents adsorbed on UiO-66-FA by using the various molecular models, Hamieh model, topological index, deformation polarizability and vapor pressure methods compared to global average; Table S14: Values of the specific entropy ( Δ S a s p   in   J   K 1 mol 1 ) of the various polar solvents adsorbed on UiO-66-FA by using the various molecular models, Hamieh model, topological index, deformation polarizability and vapor pressure methods compared to global average; Table S15: Values of the specific enthalpy ( Δ H a s p   in   kJ   mol 1 ) of the various polar solvents adsorbed on UiO-66(NH2) by using the various molecular models, Hamieh model, topological index, deformation polarizability and vapor pressure methods compared to global average; Table S16: Values of the specific entropy ( Δ S a s p   in   J   K 1 mol 1 ) of the various polar solvents adsorbed on UiO-66(NH2) by using the various molecular models, Hamieh model, topological index, deformation polarizability and vapor pressure methods compared to global average.

Author Contributions

Conceptualization, T.H. and J.T.; methodology, A.A.-A., T.H., T.R.-C., M.H. and J.T.; validation, A.A.-A., T.H., T.R.-C. and M.H.; formal analysis, A.A.-A., T.H., T.R.-C., M.H. and J.T.; investigation, A.A.-A., M.H. and J.T.; resources, J.T.; writing—original draft, A.A.-A., T.H., T.R.-C., M.H. and J.T.; writing—review and editing, T.H.; visualization, T.R.-C. and M.H.; supervision, T.H., T.R.-C., M.H. and J.T.; project administration, T.H.; funding acquisition, T.H. and J.T. All authors have read and agreed to the published version of the manuscript.

Funding

This research received no external funding.

Data Availability Statement

The data were added in the supporting information.

Conflicts of Interest

The authors declare no conflict of interest.

References

  1. Shearer, G.C.; Chavan, S.; Ethiraj, J.; Vitillo, J.G.; Svelle, S.; Olsbye, U.; Lamberti, C.; Bordiga, S.; Lillerud, K.P. Tuned to perfection: Ironing out the defects in metal–organic framework UiO-66. Chem. Mater. 2014, 26, 4068–4071. [Google Scholar] [CrossRef]
  2. Wu, H.; Yildirim, T.; Zhou, W. Exceptional mechanical stability of highly porous zirconium metal–organic framework UiO-66 and its important implications. J. Phys. Chem. Lett. 2013, 4, 925–930. [Google Scholar] [CrossRef] [PubMed]
  3. Rogge, S.M.; Wieme, J.; Vanduyfhuys, L.; Vandenbrande, S.; Maurin, G.; Verstraelen, T.; Waroquier, M.; Van Speybroek, V. Thermodynamic insight in the high-pressure behavior of UiO-66: Effect of linker defects and linker expansion. Chem. Mater. 2016, 28, 5721–5732. [Google Scholar] [CrossRef] [PubMed] [Green Version]
  4. Wu, H.; Chua, Y.S.; Krungleviciute, V.; Tyagi, M.; Chen, P.; Yildirim, T.; Zhou, W. Unusual and highly tunable missing-linker defects in zirconium metal–organic framework UiO-66 and their important effects on gas adsorption. J. Am. Chem. Soc. 2013, 135, 10525–10532. [Google Scholar] [CrossRef] [PubMed]
  5. Vermoortele, F.; Bueken, B.; Le Bars, G.; Van de Voorde, B.; Vandichel, M.; Houthoofd, K.; Vimont, A.; Daturi, M.; Waroquier, M.; Van Speybroeck, V.; et al. Synthesis modulation as a tool to increase the catalytic activity of metal–organic frameworks: The unique case of UiO-66 (Zr). J. Am. Chem. Soc. 2013, 135, 11465–11468. [Google Scholar] [CrossRef]
  6. DeCoste, J.B.; Peterson, G.W.; Schindler, B.J.; Killops, K.L.; Browe, M.A.; Mahle, J.J. The effect of water adsorption on the structure of the carboxylate containing metal–organic frameworks Cu-BTC, Mg-MOF-74, and UiO-66. J. Mater. Chem. A 2013, 1, 11922–11932. [Google Scholar] [CrossRef]
  7. Hu, Z.; Zhao, D. De facto methodologies toward the synthesis and scale-up production of UiO-66-type metal–organic frameworks and membrane materials. Dalton Trans. 2015, 44, 19018–19040. [Google Scholar] [CrossRef]
  8. Shearer, G.C.; Chavan, S.; Bordiga, S.; Svelle, S.; Olsbye, U.; Lillerud, K.P. Defect engineering: Tuning the porosity and composition of the metal–organic framework UiO-66 via modulated synthesis. Chem. Mater. 2016, 28, 3749–3761. [Google Scholar] [CrossRef]
  9. Cliffe, M.J.; Wan, W.; Zou, X.; Chater, P.A.; Kleppe, A.K.; Tucker, M.G.; Wilhelm, H.; Funnell, N.P.; Coudert, F.-X.; Goodwin, A.L. Correlated defect nanoregions in a metal–organic framework. Nat. Commun. 2014, 5, 4176. [Google Scholar] [CrossRef] [Green Version]
  10. Canivet, J.; Vandichel, M.; Farrusseng, D. Origin of highly active metal–organic framework catalysts: Defects? Defects! Dalton Trans. 2016, 45, 4090–4099. [Google Scholar] [CrossRef]
  11. Trickett, C.A.; Gagnon, K.J.; Lee, S.; Gándara, F.; Bürgi, H.-B.; Yaghi, O.M. Definitive molecular level characterization of defects in UiO-66 crystals. Angew. Chem. Int. Ed. 2015, 54, 11162–11167. [Google Scholar] [CrossRef]
  12. Xydias, P.; Spanopoulos, I.; Klontzas, E.; Froudakis, G.E.; Trikalitis, P.N. Drastic enhancement of the CO2 adsorption properties in sulfone-functionalized Zr-and Hf-UiO-67 MOFs with hierarchical mesopores. Inorg. Chem. 2014, 53, 679–681. [Google Scholar] [CrossRef]
  13. Katz, M.J.; Brown, Z.J.; Colón, Y.J.; Siu, P.W.; Scheidt, K.A.; Snurr, R.Q.; Hupp, J.T.; Farha, O.K. A facile synthesis of UiO-66, UiO-67 and their derivatives. Chem. Commun. 2013, 49, 9449–9451. [Google Scholar] [CrossRef]
  14. Schaate, A.; Roy, P.; Godt, A.; Lippke, J.; Waltz, F.; Wiebcke, M.; Behrens, P. Modulated synthesis of Zr-based metal–organic frameworks: From nano to single crystals. Chem.—A Eur. J. 2011, 17, 6643–6651. [Google Scholar] [CrossRef]
  15. Stock, N.; Biswas, S. Synthesis of metal-organic frameworks (MOFs): Routes to various MOF topologies, morphologies, and composites. Chem. Rev. 2012, 112, 933–969. [Google Scholar] [CrossRef]
  16. Zahn, G.; Zerner, P.; Lippke, J.; Kempf, F.L.; Lilienthal, S.; Schröder, C.A.; Schneider, A.M.; Behrens, P. Insight into the mechanism of modulated syntheses: In situ synchrotron diffraction studies on the formation of Zr-fumarate MOF. CrystEngComm 2014, 16, 9198–9207. [Google Scholar] [CrossRef] [Green Version]
  17. Han, Y.; Liu, M.; Li, K.; Zuo, Y.; Wei, Y.; Xu, S.; Zhang, G.; Song, C.; Zhang, Z.; Guo, X. Facile synthesis of morphology and size-controlled zirconium metal–organic framework UiO-66: The role of hydrofluoric acid in crystallization. CrystEngComm 2015, 17, 6434–6440. [Google Scholar] [CrossRef]
  18. Kandiah, M.; Nilsen, M.H.; Usseglio, S.; Jakobsen, S.; Olsbye, U.; Tilset, M.; Larabi, C.; Quadrelli, E.A.; Bonino, F.; Lillerud, K.P. Synthesis and stability of tagged UiO-66 Zr-MOFs. Chem. Mater. 2010, 22, 6632–6640. [Google Scholar] [CrossRef]
  19. Rinsant, D. Elaboration de matériaux hybrides fonctionnalisés de type MOFs pour l’extraction sélective de l’uranium. Ph.D. Thesis, Université Montpellier, Montpellier, France, 2019. [Google Scholar]
  20. Jasuja, H.; Peterson, G.W.; Decoste, J.B.; Browe, M.A.; Walton, K.S. Evaluation of MOFs for air purification and air quality control applications: Ammonia removal from air. Chem. Eng. Sci. 2015, 124, 118–124. [Google Scholar] [CrossRef]
  21. Peterson, G.W.; Mahle, J.J.; DeCoste, J.B.; Gordon, W.O.; Rossin, J.A. Extraordinary NO2 Removal by the Metal–Organic Framework UiO-66-NH2. Angew. Chem. 2016, 128, 6343–6346. [Google Scholar] [CrossRef]
  22. Wang, Z.; Cohen, S.M. Postsynthetic modification of metal–organic frameworks. Chem. Soc. Rev. 2009, 38, 1315–1329. [Google Scholar] [CrossRef] [PubMed]
  23. Dau, P.V.; Tanabe, K.K.; Cohen, S.M. Functional group effects on metal–organic framework topology. Chem. Commun. 2012, 48, 9370–9372. [Google Scholar] [CrossRef] [PubMed]
  24. Zhang, Y.-B.; Furukawa, H.; Ko, N.; Nie, W.; Park, H.J.; Okajima, S.; Cordova, K.E.; Deng, H.; Kim, J.; Yaghi, O.M. Introduction of functionality, selection of topology, and enhancement of gas adsorption in multivariate metal–organic framework-177. J. Am. Chem. Soc. 2015, 137, 2641–2650. [Google Scholar] [CrossRef] [PubMed]
  25. Bai, Z.-Q.; Yuan, L.-Y.; Zhu, L.; Liu, Z.-R.; Chu, S.-Q.; Zheng, L.-R.; Zhang, J.; Chai, Z.-F.; Shi, W.-Q. Introduction of amino groups into acid-resistant MOFs for enhanced U (VI) sorption. J. Mater. Chem. A 2015, 3, 525–534. [Google Scholar] [CrossRef]
  26. Wang, L.L.; Luo, F.; Dang, L.L.; Li, J.Q.; Wu, X.L.; Liu, S.J.; Luo, M.B. Ultrafast high-performance extraction of uranium from seawater without pretreatment using an acylamide-and carboxyl-functionalized metal–organic framework. J. Mater. Chem. A 2015, 3, 13724–13730. [Google Scholar] [CrossRef]
  27. Chen, Z.; Wang, X.; Noh, H.; Ayoub, G.; Peterson, G.W.; Buru, C.T.; Islamoglu, T.; Farha, O.K. Scalable, room temperature, and water-based synthesis of functionalized zirconium-based metal–organic frameworks for toxic chemical removal. CrystEngComm 2019, 21, 2409–2415. [Google Scholar] [CrossRef]
  28. Das, A.; Das, S.; Trivedi, V.; Biswas, S. A dual functional MOF-based fluorescent sensor for intracellular phosphate and extracellular 4-nitrobenzaldehyde. Dalton Trans. 2019, 48, 1332–1343. [Google Scholar] [CrossRef]
  29. Molavi, H.; Eskandari, A.; Shojaei, A.; Mousavi, S.A. Enhancing CO2/N2 adsorption selectivity via post-synthetic modification of NH2-UiO-66 (Zr). Microporous Mesoporous Mater. 2018, 257, 193–201. [Google Scholar] [CrossRef]
  30. U.S. Energy Information Administration (EIA). International Energy Outlook 2016, with Projections to 2040; Technical Report; Government Printing Office: Washington, DC, USA, 2016.
  31. Liu, J.; Thallapally, P.K.; McGrail, B.P.; Brown, D.R.; Liu, J. Progress in adsorption-based CO2 capture by metal–organic frameworks. Chem. Soc. Rev. 2012, 41, 2308–2322. [Google Scholar] [CrossRef]
  32. Valenzano, L.; Civalleri, B.; Chavan, S.; Bordiga, S.; Nilsen, M.H.; Jakobsen, S.; Lillerud, K.P.; Lamberti, C. Disclosing the complex structure of UiO-66 metal organic framework: A synergic combination of experiment and theory. Chem. Mater. 2011, 23, 1700–1718. [Google Scholar] [CrossRef]
  33. Shearer, G.C.; Forselv, S.; Chavan, S.; Bordiga, S.; Mathisen, K.; Bjørgen, M.; Svelle, S.; Lillerud, K.P. In situ infrared spectroscopic and gravimetric characterisation of the solvent removal and dehydroxylation of the metal organic frameworks UiO-66 and UiO-67. Top. Catal. 2013, 56, 770–782. [Google Scholar] [CrossRef]
  34. Van de Voorde, B.; Stassen, I.; Bueken, B.; Vermoortele, F.; De Vos, D.; Ameloot, R.; Tan, J.-C.; Bennett, T.D. Improving the mechanical stability of zirconium-based metal–organic frameworks by incorporation of acidic modulators. J. Mater. Chem. A 2015, 3, 1737–1742. [Google Scholar] [CrossRef] [Green Version]
  35. Ren, J.; Ledwaba, M.; Musyoka, N.M.; Langmi, H.W.; Mathe, M.; Liao, S.; Pang, W. Structural defects in metal–organic frameworks (MOFs): Formation, detection and control towards practices of interests. Coord. Chem. Rev. 2017, 349, 169–197. [Google Scholar] [CrossRef]
  36. Hu, Z.; Castano, I.; Wang, S.; Wang, Y.; Peng, Y.; Qian, Y.; Chi, C.; Wang, X.; Zhao, D. Modulator effects on the water-based synthesis of Zr/Hf metal–organic frameworks: Quantitative relationship studies between modulator, synthetic condition, and performance. Cryst. Growth Des. 2016, 16, 2295–2301. [Google Scholar] [CrossRef]
  37. Hamieh, T.; Ali-Ahmad, A.; Jrad, A.; Roques-Carmes, T.; Hmadeh, M.; Toufaily, J. Surface Thermodynamics and Lewis Acid-Base Properties of UiO-66 Crystals by Inverse Gas Chromatography at Infinite Dilution. SSRN, 2021; preprint. [Google Scholar] [CrossRef]
  38. Papirer, E.; Brendlé, E.; Balard, H.; Dentzer, J. Variation of the surface properties of nickel oxide upon heat treatment evidenced by temperature programmed desorption and inverse gas chromatography studies. J. Mater. Sci. 2000, 35, 3573–3577. [Google Scholar] [CrossRef]
  39. Balard, H.; Sidqi, M.; Papirer, E.; Donnet, J.B.; Tuel, A.; Hommel, H.; Legrand, A.P. Study of modified silicas by inverse gas chromatography part II: Influence of chain length on surface properties of silicas grafted with α−ω diols. Chromatographia 1988, 25, 712–716. [Google Scholar] [CrossRef]
  40. Jrad, A.; Hmadeh, M.; Tarboush, B.J.A.; Awada, G.; Ahmad, M. Structural engineering of Zr-based metal-organic framework catalysts for optimized biofuel additives production. Chem. Eng. J. 2020, 382, 122793. [Google Scholar] [CrossRef]
  41. Jrad, A.; Tarboush, B.J.A.; Hmadeh, M.; Ahmad, M. Tuning acidity in zirconium-based metal organic frameworks catalysts for enhanced production of butyl butyrate. Appl. Catal. A Gen. 2019, 570, 31–41. [Google Scholar] [CrossRef]
  42. Kemball, C.; Rideal, E.K. The adsorption of vapours on mercury. I. Non-polar substances. Proc. R. Soc. London Ser. A Math. Phys. Sci. 1946, 187, 53–73. [Google Scholar]
  43. De Boer, J.H.; Kruyer, S. Entropy and mobility of adsorbed molecules: I. Procedure; atomic gases on charcoal. Proc. K. Ned. Akad. Van Wet. 1952, 55, 451–463. [Google Scholar]
  44. Hamieh, T. New methodology to study the dispersive component of the surface energy and acid–base properties of silica particles by inverse gas chromatography at infinite dilution. J. Chromatogr. Sci. 2022, 60, 126–142. [Google Scholar] [CrossRef] [PubMed]
  45. Saint Flour, C.; Papirer, E. Gas-solid chromatography. A method of measuring surface free energy characteristics of short glass fibers. 1. Through adsorption isotherms. Ind. Eng. Chem. Prod. Res. Dev. 1982, 21, 337–341. [Google Scholar] [CrossRef]
  46. Donnet, J.B.; Park, S.J.; Balard, H. Evaluation of specific interactions of solid surfaces by inverse gas chromatography. Chromatographia 1991, 31, 434–440. [Google Scholar] [CrossRef]
  47. Brendlé, E.; Papirer, E. A new topological index for molecular probes used in inverse gas chromatography for the surface nanorugosity evaluation. J. Colloid Interface Sci. 1997, 194, 207–216. [Google Scholar] [CrossRef]
Figure 1. PXRD patterns of the synthesized MOFs compared to the simulated one.
Catalysts 13 00205 g001
Figure 2. SEM images for the synthesized MOFs at a 1 μm and 500 nm scales; (a,b) for UiO-66-00, (c,d) for UiO-66-AA, (e,f) for UiO-66-FA, (g,h) for UiO-66(NH2).
Catalysts 13 00205 g002
Figure 3. Nitrogen adsorption–desorption isotherms for the synthesized MOFs.
Catalysts 13 00205 g003
Figure 4. TGA and DTG curves of the synthesized MOFs.
Catalysts 13 00205 g004
Figure 5. Variations of the dispersive component of the surface energy γ s d   ( mJ / m 2 ) of UiO-66-00 as a function of the temperature T (K) using different models.
Catalysts 13 00205 g005
Figure 6. Variations of the dispersive component of the surface energy γ s d   ( mJ / m 2 ) of UiO-66-AA as a function of the temperature T (K) using different models.
Catalysts 13 00205 g006
Figure 7. Variations of the dispersive component of the surface energy γ s d   ( mJ / m 2 ) of UiO-66-FA as a function of the temperature T (K) using different models.
Catalysts 13 00205 g007
Figure 8. Variations of the dispersive component of the surface energy γ s d   ( mJ / m 2 ) of UiO-66(NH2) as a function of the temperature T (K) using different models.
Catalysts 13 00205 g008
Table 1. Textural properties of the synthesized MOFs.
Number of Missing LinkersSurface Area (m2/g)Pore Volume (cc/g)Particle Size (nm)
UiO-66-001.28860.53142
UiO-66-AA1.39880.58460
UiO-66-FA1.7517200.71510
UiO-66(NH2)1.567030.48207
Table 2. Equations γ s d ( T ) of UiO-66-00 surface, the dispersive surface entropy ε s d , and the extrapolated values γ s d ( 0   K ) by using the different molecular and thermal models.
UiO-66-00
Molecular Model γ s d ( T ) (mJ/m2) ε s d = d γ s d d T (mJ·m−2·K−1) γ s d ( 0   K ) (mJ/m2)
Cylindrical γ s d = −0.067 T + 43.5−0.06743.5
Redlich−Kwong γ s d = −0.130 T + 75.8−0.13075.8
VDW γ s d = −0.080 T + 46.5−0.08046.5
Geometric γ s d = −0.029 T + 26.5−0.02926.5
Spherical γ s d = −0.307 T + 156.9−0.307156.9
Kiselev γ s d = −0.080 T + 47.6−0.08047.6
Hamieh model γ s d = −0.251 T + 113.4−0.251113.4
Dorris–Gray γ s d = −0.117 T + 76.6−0.11776.6
Dorris–Gray–Hamieh γ s d = −0.160 T + 88.4−0.16088.4
Table 3. Equations γ s d ( T ) of UiO-66-AA surface, the dispersive surface entropy ε s d , and the extrapolated values γ s d ( 0   K ) by using the different molecular and thermal models.
UiO-66-AA
Molecular Model γ s d ( T ) (mJ/m2) ε s d = d γ s d d T (mJ·m−2·K−1) γ s d ( 0   K ) (mJ/m2)
Cylindrical     γ s d = −0.163 T + 84.63−0.16384.63
Redlich−Kwong     γ s d = −0.286 T + 142.14−0.286142.14
VDW     γ s d = −0.175 T + 87.15−0.17587.15
Geometric     γ s d = −0.098 T + 56.71−0.09856.71
Spherical     γ s d = −0.601 T + 279.23−0.601279.23
Kiselev     γ s d = −0.180 T + 89.97−0.18089.97
Hamieh model     γ s d = −0.444 T + 190.86−0.444190.86
Dorris–Gray     γ s d = −0.139 T + 86.68−0.13986.68
Dorris–Gray–Hamieh     γ s d = −0.192 T + 112.2−0.192112.2
Table 4. Equations γ s d ( T ) of UiO-66-FA surface, the dispersive surface entropy ε s d , and the extrapolated values γ s d ( 0   K ) by using the different molecular and thermal models.
UiO-66-FA
Molecular Model γ s d ( T ) (mJ/m2) ε s d = d γ s d d T (mJ·m−2·K−1) γ s d ( 0   K ) (mJ/m2)
Cylindrical γ s d = −0.21 T + 113.28−0.21113.28
Redlich−Kwong γ s d = −0.37 T + 190.74−0.37190.74
VDW γ s d = −0.23 T + 116.79−0.23116.79
Geometric γ s d = −0.12 T + 74.801−0.1274.80
Spherical       γ s d = −0.81 T + 380.95−0.81380.95
Kiselev γ s d = −0.40 T + 121.86−0.24121.86
Hamieh model γ s d = −0.60 T + 260.91−0.60260.91
Dorris–Gray γ s d = −0.19 T + 121.28−0.19121.28
Dorris–Gray–Hamieh γ s d = −0.25 T + 138.16−0.25138.16
Table 5. Equations γ s d ( T ) of UiO-66(NH2) surface, the dispersive surface entropy ε s d , and the extrapolated values γ s d ( 0   K ) by using the different molecular and thermal models.
UiO-66(NH2)
Molecular Model γ s d ( T ) (mJ/m2) ε s d = d γ s d d T (mJ·m−2·K−1) γ s d ( 0   K ) (mJ/m2)
Cylindrical γ s d = −0.3661 T + 239.31−0.3661239.31
Redlich–Kwong γ s d = −0.7253 T + 423.68−0.7253423.68
VDW γ s d = −0.4434 T + 259.24−0.4434259.24
Geometric γ s d = −0.1638 T + 147.47−0.1638147.47
Spherical γ s d = −1.7097 T + 876.13−1.7097876.13
Kiselev γ s d = −0.4421 T + 262.67−0.4421262.67
Hamieh model γ s d = −1.3896 T + 628.7−1.3896628.7
Dorris–Gray     γ s d = −0.209 T + 133.51−0.2090133.51
Dorris–Gray–Hamieh γ s d = −0.807 T + 453.49−0.8070453.49
Table 6. Values of the enthalpic acid–base constants K A and K D   (unitless) and the entropic acid–base constants ω A and ω D   (unitless) of UiO-66-00 and their acid–base ratios for the different used molecular models and IGC methods.
UiO-66-00
Models and IGC MethodsKAKDKA/KD10−3·ωA10−3·ωDωA/ωD
Kiselev0.6000.4041.4851.8030.9341.930
Spherical0.5810.4731.2300.4730.2841.666
Geometric0.4930.1463.3681.0480.7121.472
Van der Waals1.0140.1905.3452.2001.8351.199
Redlich–Kwong0.7720.4691.6462.3021.4361.603
Cylindrical0.5170.2492.0781.5441.0491.471
Hamieh model0.4900.2921.6781.7450.9771.786
Topological index0.3800.1702.2330.4230.1283.311
Deformation polarizability0.4120.2042.0210.3510.0983.579
Vapor pressure0.3570.3361.0630.2590.1062.440
Average values0.560.291.9151.210.761.607
Table 7. Values of the enthalpic acid–base constants K A and K D   (unitless) and the entropic acid–base constants ω A and ω D   (unitless) of UiO-66-AA catalyst and their acid–base ratios for the different used molecular models and IGC methods.
UiO-66-AA
Models and IGC MethodsKAKDKA/KD10−3·ωA10−3·ωDωA/ωD
Kiselev0.630.351.800.710.46 1.53
Spherical0.590.411.430.930.621.49
Geometric0.440.231.930.690.352.01
Van der Waals0.490.261.910.730.441.66
Redlich–Kwong0.480.271.800.960.641.50
Cylindrical0.580.341.730.810.521.57
Hamieh model0.570.183.140.520.351.48
Topological index0.380.211.810.460.381.20
Deformation polarizability0.500.301.670.690.097.63
Vapor pressure0.320.161.960.380.311.24
Average values0.500.271.840.690.421.65
Table 8. Values of the enthalpic acid–base constants K A and K D   (unitless) and the entropic acid–base constants ω A and ω D   (unitless) of UIO-66-FA catalyst and their acid–base ratios for the different used molecular models and IGC methods.
UiO-66-FA
Models and IGC MethodsKAKDKA/KD10−3·ωA10−3·ωDωAD
Kiselev1.020.224.692.021.181.71
Spherical1.120.254.502.281.032.23
Geometric0.890.302.991.841.051.75
Van der Waals0.960.442.202.201.062.09
Redlich–Kwong1.000.492.032.051.181.74
Cylindrical0.970.313.172.170.982.22
Hamieh model1.090.392.792.241.042.14
Topological index1.080.392.760.730.481.52
Deformation polarizability1.120.412.720.980.511.92
Vapor pressure1.260.423.041.060.472.26
Average values1.050.362.911.760.901.96
Table 9. Values of the enthalpic acid–base constants K A and K D   (unitless) and the entropic acid–base constants ω A and ω D   (unitless) of UIO-66(NH2) catalyst and their acid–base ratios for the different used molecular models and IGC methods.
UiO-66(NH2)
Models and IGC MethodsKAKDKA/KD10−3·ωA10−3·ωDωAD
Kiselev1.440.522.792.71.22.27
Spherical1.450.781.853.71.13.44
Geometric1.691.031.644.31.72.59
Van der Waals1.560.821.891.60.27.79
Redlich–Kwong1.620.951.702.10.514.23
Cylindrical1.160.462.521.80.335.60
Hamieh model1.060.452.351.00.382.73
Topological index1.050.482.201.10.293.76
Deformation polarizability0.900.452.622.30.73.26
Vapor pressure0.700.52.752.71.22.27
Average values1.260.612.073.71.13.44
Disclaimer/Publisher’s Note: The statements, opinions and data contained in all publications are solely those of the individual author(s) and contributor(s) and not of MDPI and/or the editor(s). MDPI and/or the editor(s) disclaim responsibility for any injury to people or property resulting from any ideas, methods, instructions or products referred to in the content.

