
Differentiating the Reactivity of ZrO2-Bound Formates Formed on Cu/ZrO2 during CO2 Hydrogenation


Abstract
:1. Introduction
2. Experimental Section
3. Results and Discussion

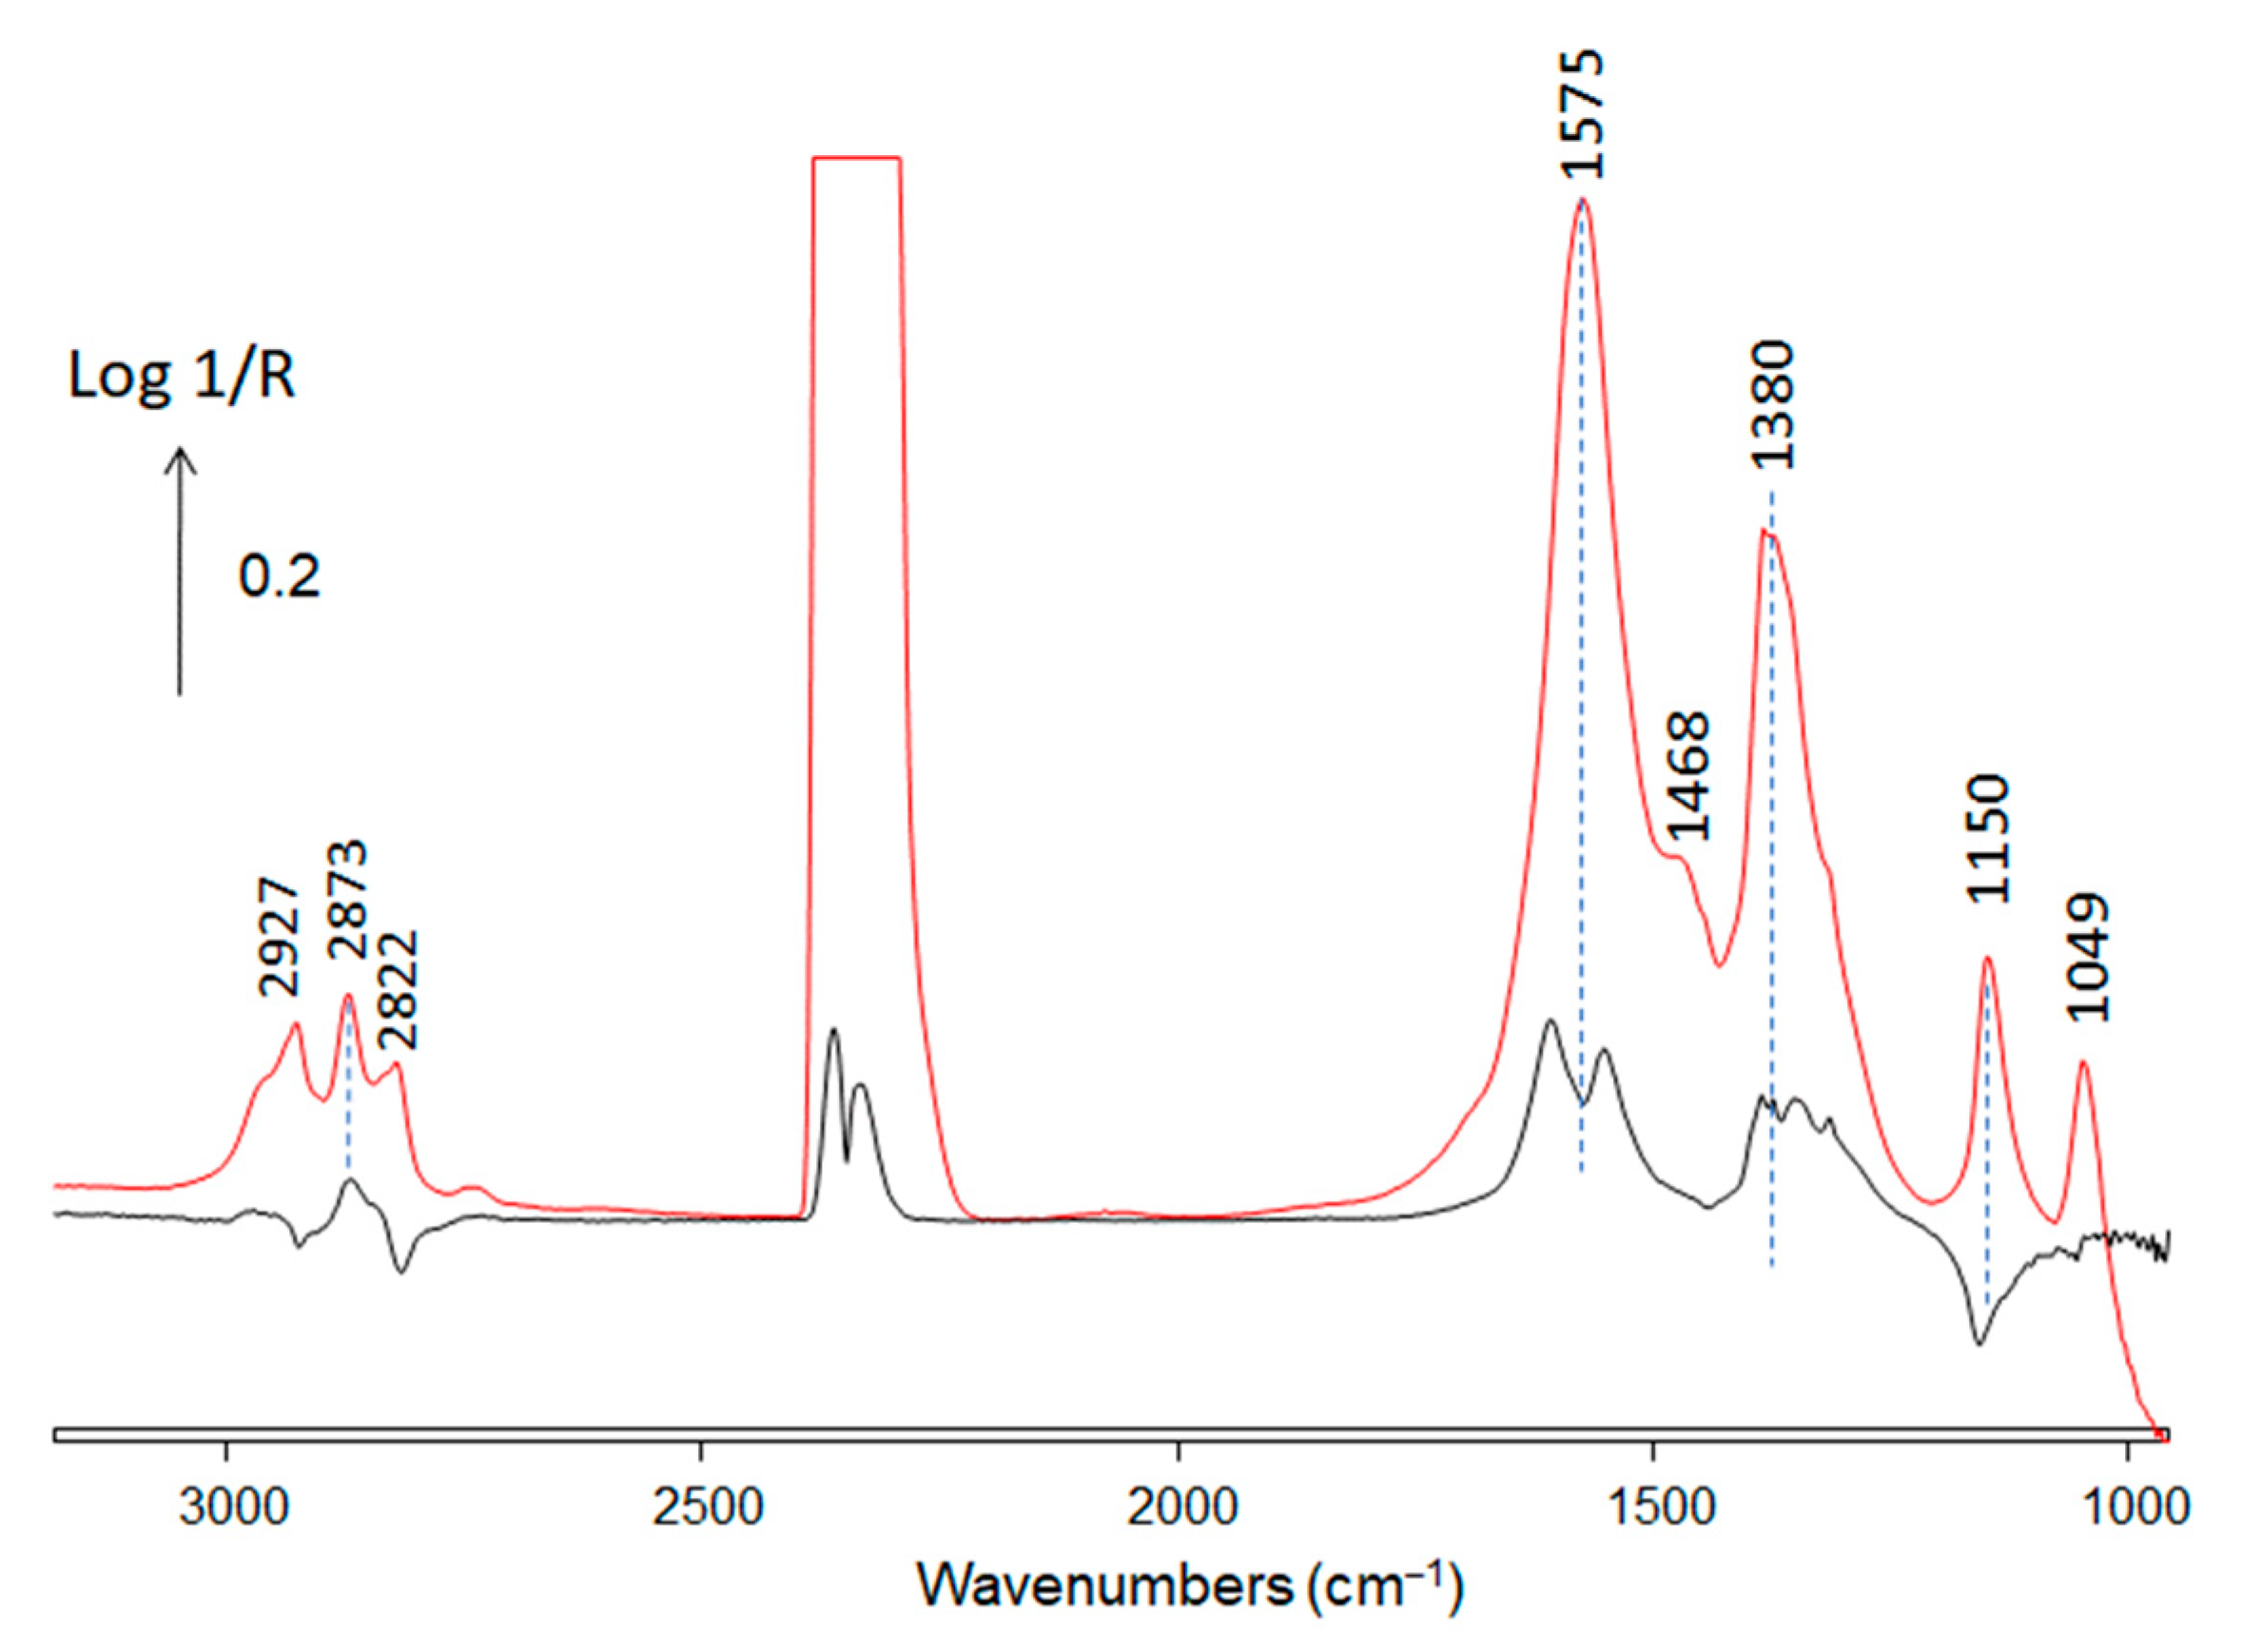
| Wavenumber (cm−1) | References | |
|---|---|---|
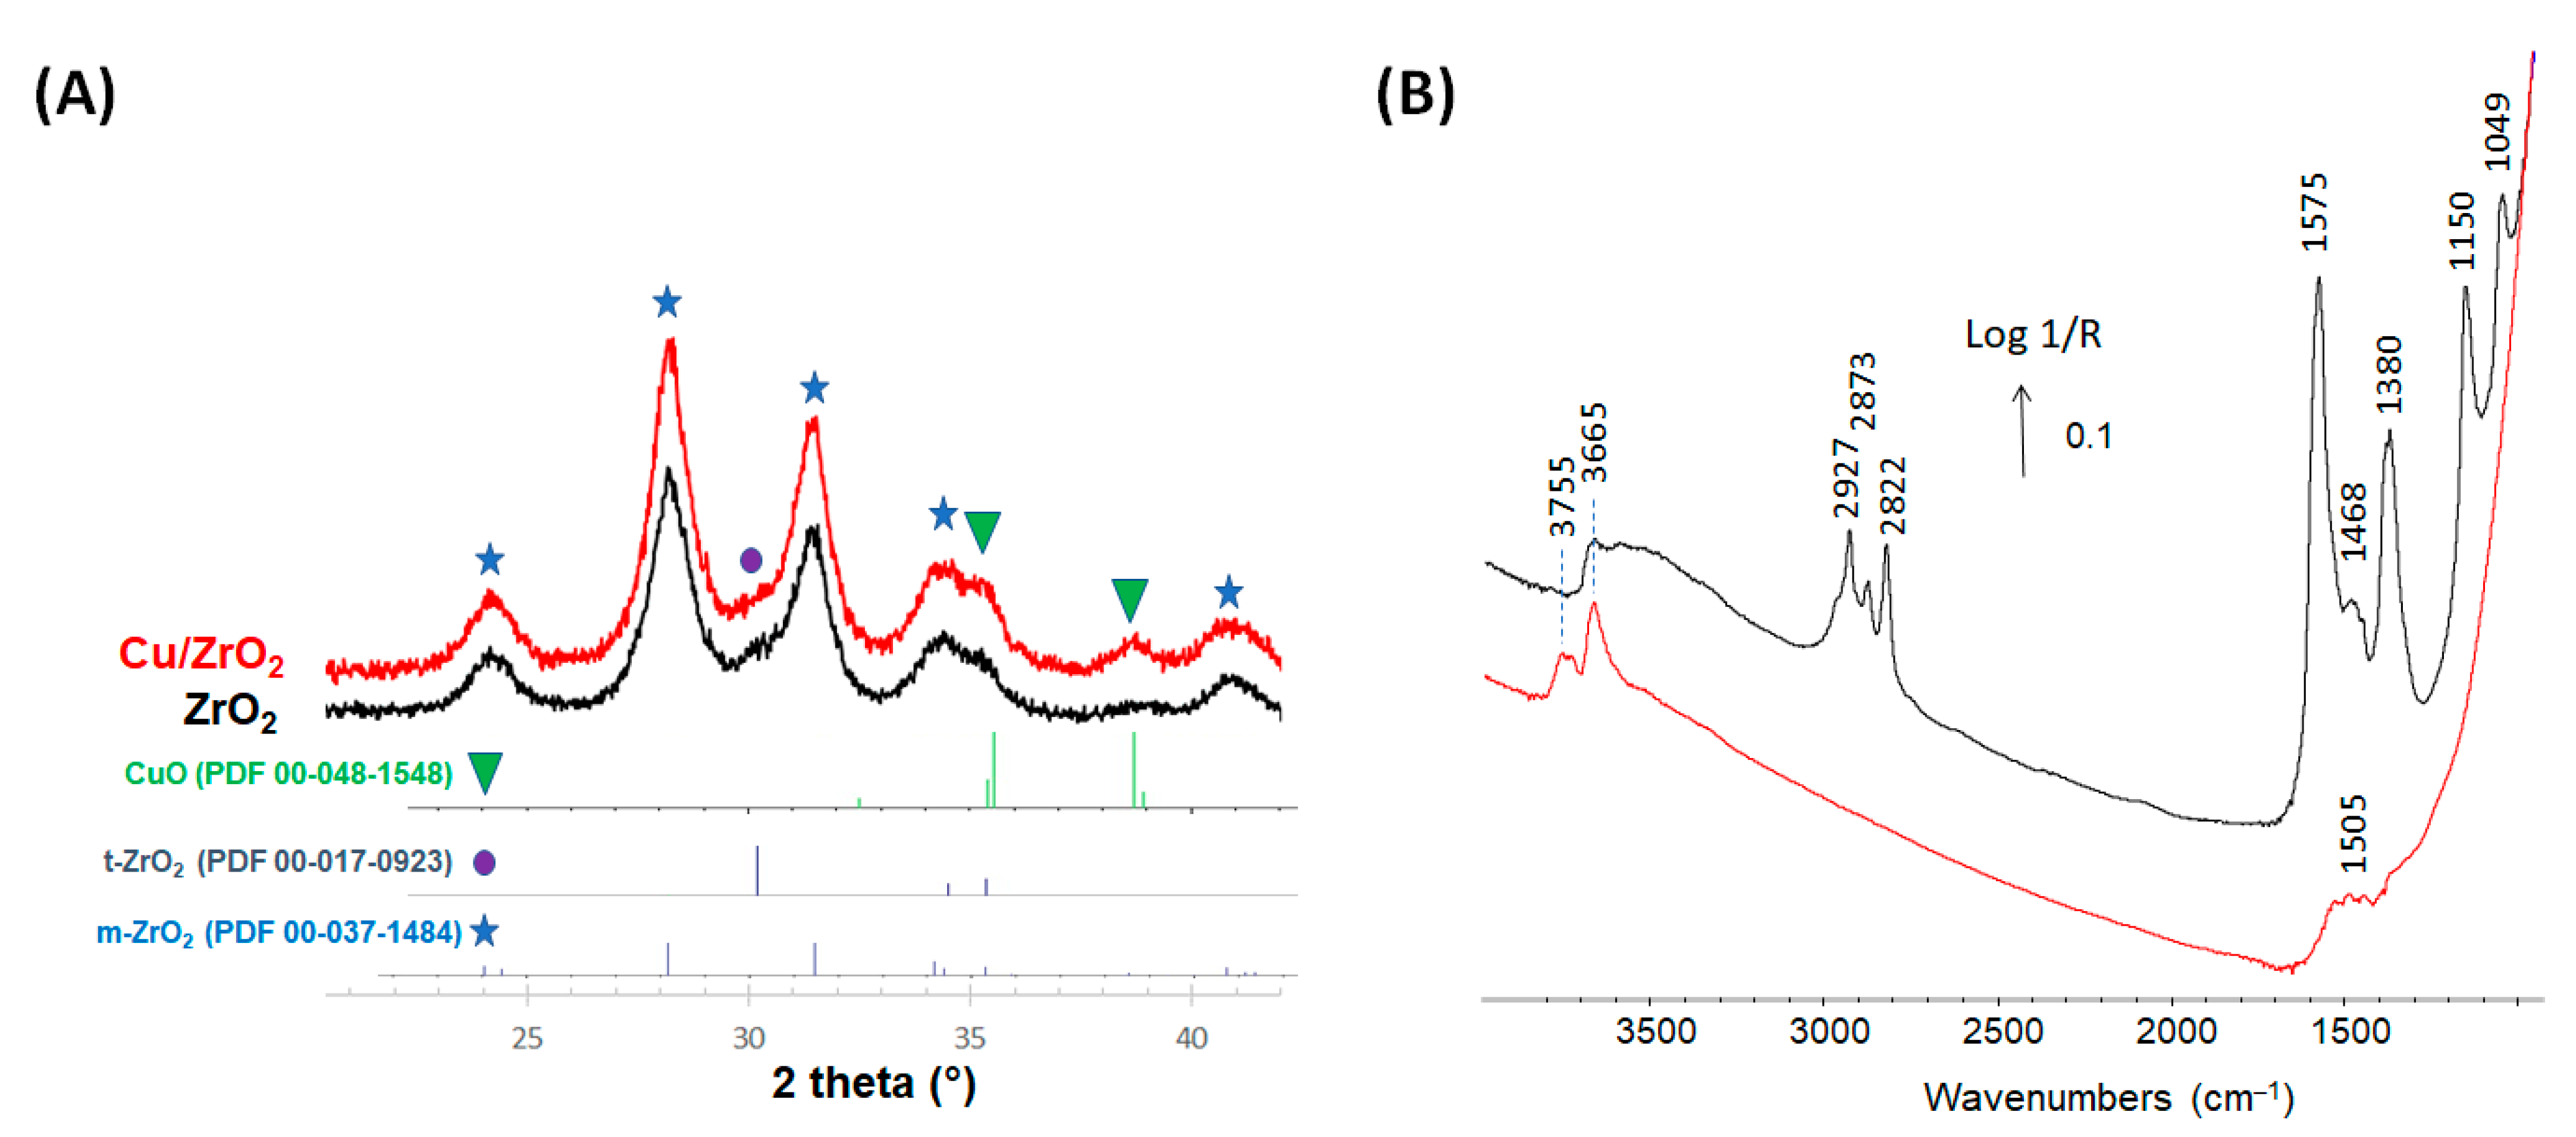
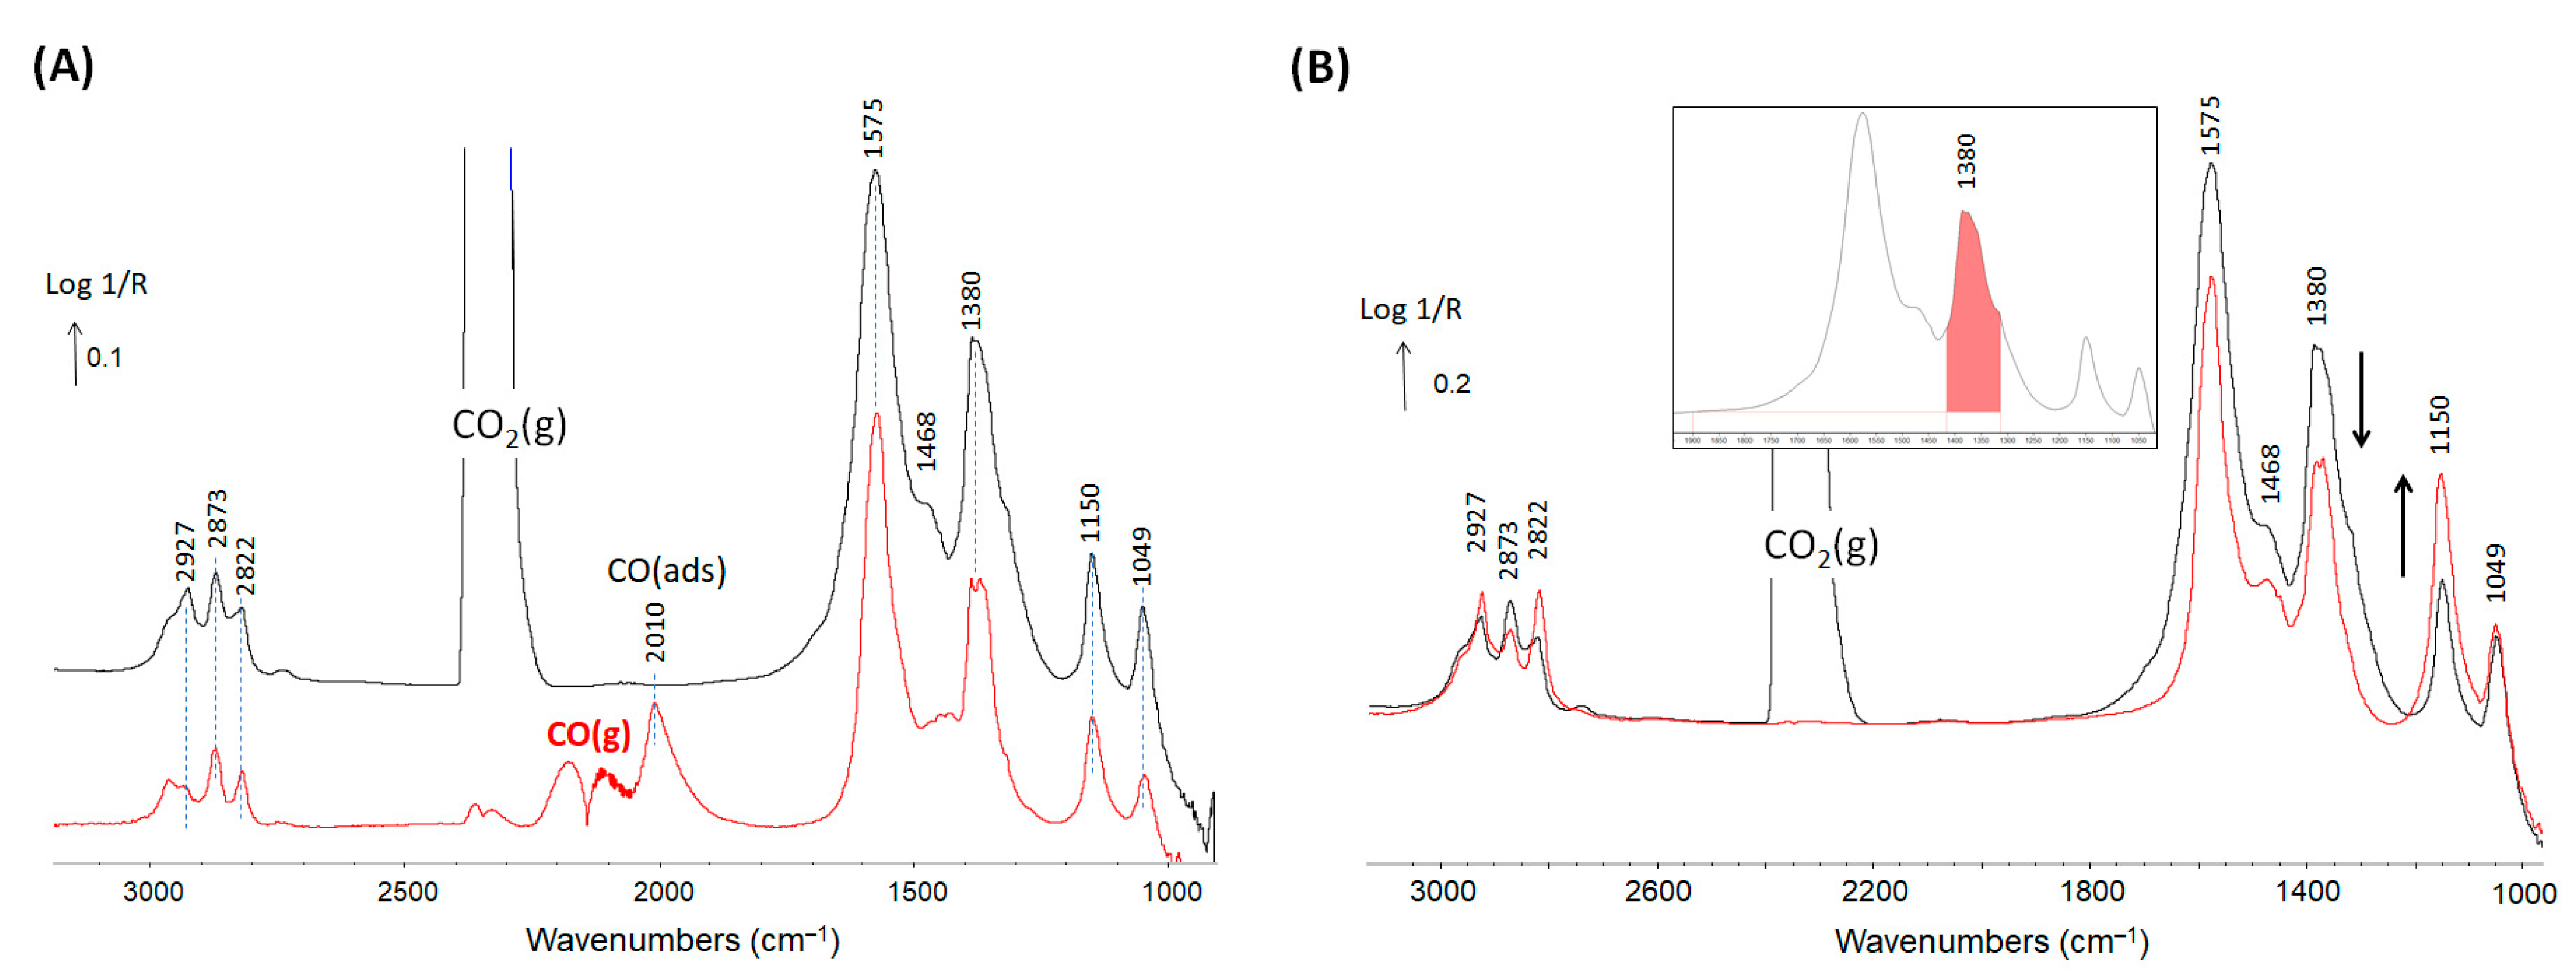
| 3755 and 3665 | Hydroxyls on zirconia | [34] |
| 2873, 1575 and 1380 | Formate on zirconia | [35,36] |
| 1468 | Multi-bonded carbonates | [21] |
| 2927, 2822, 1150 | Methoxy type I | [34,37] |
| 2927, 2822, 1049 | Methoxy type II | [34,37] |
| 2010 | carbonyl on Cu0 | [38] |
4. Conclusions
Author Contributions
Funding
Institutional Review Board Statement
Conflicts of Interest
References
- Meunier, F.C. Mixing Copper Nanoparticles and ZnO Nanocrystals: A Route towards Understanding the Hydrogenation of CO2 to Methanol? Angew. Chem. Int. Ed. 2011, 50, 4053–4054. [Google Scholar] [CrossRef] [PubMed]
- Bowker, M. Methanol Synthesis from CO2 Hydrogenation. Methanol Synthesis from CO2 Hydrogenation. ChemCatChem 2019, 11, 4238–4246. [Google Scholar] [CrossRef] [PubMed] [Green Version]
- Golunski, S.; Burch, R. CO2 Hydrogenation to Methanol over Copper Catalysts: Learning from Syngas Conversion. Top. Catal. 2021, 64, 974–983. [Google Scholar] [CrossRef]
- Jiang, X.; Nie, X.; Guo, X.; Song, C.; Chen, J.G. Recent Advances in Carbon Dioxide Hydrogenation to Methanol via Heterogeneous Catalysis. Chem. Rev. 2020, 120, 7984–8034. [Google Scholar] [CrossRef]
- Pavlišič, P.A.; Ruiz–Zepeda, F.; Kovač, J.; Likozar, B. Mechanisms of Copper-Based Catalyst Deactivation during CO2 Reduction to Methanol. Ind. Eng. Chem. Res. 2019, 58, 13021–13029. [Google Scholar]
- O’Connor, A.M.; Meunier, F.C.; Ross, J.R.H. An In-situ DRIFTS Study of the Mechanism of the CO2 Reforming of CH4 over a Pt/ZrO2 Catalyst. Stud. Surf. Sci. Catal. 1998, 119, 819–824. [Google Scholar]
- Lim, Z.-Y.; Wu, C.Z.; Wang, W.G.; Choy, K.-L.; Yin, H. Porosity effect on ZrO2 hollow shells and hydrothermal stability for catalytic steam reforming of methane. J. Mater. Chem. A 2016, 4, 153–159. [Google Scholar] [CrossRef]
- Breen, J.P.; Meunier, F.C.; Ross, J.R.H. Mechanistic aspects of the steam reforming of methanol over a CuO/ZnO/ZrO2/Al2O3 catalyst. Chem. Commun. 1999, 22, 2247–2248. [Google Scholar] [CrossRef]
- Al-Naji, M.; Popova, M.; Chen, Z.; Wilde, N.; Glaser, R. Aqueous-Phase Hydrogenation of Levulinic Acid Using Formic Acid as a Sustainable Reducing Agent Over Pt Catalysts Supported on Mesoporous Zirconia. ACS Sust. Chem. Eng. 2020, 8, 393–402. [Google Scholar] [CrossRef]
- Wang, J.; Li, G.; Li, Z.; Tang, C.; Feng, Z.; An, H.; Liu, H.; Liu, T.; Li, C. A highly selective and stable ZnO-ZrO2 solid solution catalyst for CO2 hydrogenation to methanol. Sci. Adv. 2017, 3, e1701290. [Google Scholar] [CrossRef] [Green Version]
- Burch, R.; Golunski, S.E.; Spencer, M.S. The role of copper and zinc oxide in methanol synthesis catalysts. J. Chem. Soc. Faraday Trans. 1990, 86, 2683–2691. [Google Scholar] [CrossRef]
- Arena, F.; Barbera, K.; Italiano, G.; Bonura, G.; Spadaro, L.; Frusteri, F. Synthesis, characterization and activity pattern of Cu–ZnO/ZrO2 catalysts in the hydrogenation of carbon dioxide to methanol. J. Catal. 2007, 249, 185–194. [Google Scholar] [CrossRef]
- Arena, F.; Italiano, G.; Barbera, K.; Bordiga, S.; Bonura, G.; Spadaro, L.; Frusteri, F. Solid-state interactions, adsorption sites and functionality of Cu-ZnO/ZrO2 catalysts in the CO2 hydrogenation to CH3OH. Appl. Catal. A Gen. 2008, 350, 16–23. [Google Scholar] [CrossRef]
- Amenomiya, Y. Methanol synthesis from CO2 + H2 II. Copper-based binary and ternary catalysts. Appl. Catal. 1987, 30, 57–68. [Google Scholar] [CrossRef]
- Li, K.; Chen, J.G. CO2 Hydrogenation to Methanol over ZrO2-Containing Catalysts: Insights into ZrO2 Induced Synergy. ACS Catal. 2019, 9, 7840–7861. [Google Scholar] [CrossRef]
- Tada, S.; Kayamori, S.; Honma, T.; Kamei, H.; Nariyuki, A.; Kon, K.; Toyao, T.; Shimizu, K.-I.; Satokawa, S. Design of Interfacial Sites between Cu and Amorphous ZrO2 Dedicated to CO2-to-Methanol Hydrogenation. ACS Catal. 2018, 8, 7809–7819. [Google Scholar] [CrossRef]
- Fisher, I.A.; Bell, A.T. In Situ Infrared Study of Methanol Synthesis from H2/CO over Cu/SiO2and Cu/ZrO2/SiO2. J. Catal. 1998, 178, 153–173. [Google Scholar] [CrossRef]
- Rhodes, M.D.; Pokrovski, K.A.; Bell, A.T. The effects of zirconia morphology on methanol synthesis from CO and H2 over Cu/ZrO2 catalysts: Part II. Transient-response infrared studies. J. Catal. 2005, 233, 210–220. [Google Scholar] [CrossRef] [Green Version]
- Fujita, S.-I.; Usui, M.; Ohara, E.; Takezawa, N. Methanol synthesis from carbon dioxide at atmospheric pressure over Cu/ZnO catalyst. Role of methoxide species formed on ZnO support. Catal. Lett. 1992, 13, 349–358. [Google Scholar] [CrossRef]
- Millar, G.J.; Rochester, C.H.; Waugh, K.C. An in situ high pressure FT-IR study of CO2/H2 interactions with model ZnO/SiO2, Cu/SiO2 and Cu/ZnO/SiO2 methanol synthesis catalysts. Catal. Lett. 1992, 14, 289–295. [Google Scholar] [CrossRef]
- Fisher, I.A.; Bell, A.T. In Situ Infrared Study of Methanol Synthesis from H2/CO2 over Cu/SiO2and Cu/ZrO2/SiO2. J. Catal. 1997, 172, 222–237. [Google Scholar] [CrossRef]
- Kattel, S.; Yan, B.; Yang, Y.; Chen, J.G.; Liu, P. Optimizing Binding Energies of Key Intermediates for CO2 Hydrogenation to Methanol over Oxide-Supported Copper. J. Am. Chem. Soc. 2016, 138, 12440–12450. [Google Scholar] [CrossRef] [PubMed]
- Lam, E.; Corral-Pérez, J.J.; Larmier, K.; Noh, G.; Wolf, P.; Comas-Vives, A.; Urakawa, A.; Copéret, C. CO2 Hydrogenation on Cu/Al2O3: Role of the Metal/Support Interface in Driving Activity and Selectivity of a Bifunctional Catalyst. Angew. Chem. Int. Ed. 2019, 58, 13989–13996. [Google Scholar] [CrossRef] [PubMed]
- Larmier, K.; Liao, W.C.; Tada, S.; Lam, E.; Verel, R.; Bansode, A.; Urakawa, A.; Comas–Vives, A.; Copéret, C. CO2-to-Methanol Hydrogenation on Zirconia-Supported Copper Nanoparticles: Reaction Intermediates and the Role of the Metal–Support Interface. Angew. Chem. Int. Ed. 2017, 56, 2318–2323. [Google Scholar] [CrossRef]
- Paredes-Nunez, L.A.; Mirodatos, C.; Schuurman, Y.; Meunier, F.C. Determination of formate decomposition rates and relation to product formation during CO hydrogenation over supported cobalt. Catal. Today 2015, 259, 192–196. [Google Scholar]
- Chinchen, G.C.; Hay, C.M.; Vandervell, H.D.; Waugh, K.C. The measurement of copper surface areas by reactive frontal chromatography. J. Catal. 1987, 103, 79–86. [Google Scholar] [CrossRef]
- Bennici, G.S. Dispersion and surface states of copper catalysts by temperature-programmed-reduction of oxidized surfaces (s-TPR). Appl. Catal. A Gen. 2005, 281, 199–205. [Google Scholar]
- Meunier, F.C.; Goguet, A.; Shekhtman, S.; Rooney, D.; Daly, H. A modified commercial DRIFTS cell for kinetically relevant operando studies of heterogeneous catalytic reactions. Appl. Catal. A Gen. 2008, 340, 196–202. [Google Scholar] [CrossRef]
- Li, H.; Rivallan, M.; Thibault–Starzyk, F.; Travert, A.; Meunier, F.C. Effective bulk and surface temperatures of the catalyst bed of FT-IR cells used for in situ and operando studies. Phys. Chem. Chem. Phys. 2013, 5, 7321–7327. [Google Scholar] [CrossRef]
- Bredy, P.; Farrusseng, D.; Schuurman, Y.; Meunier, F.C. On the link between CO surface coverage and selectivity to CH4 during CO2 hydrogenation over supported cobalt catalysts. J. Catal. 2022, 411, 93–96. [Google Scholar] [CrossRef]
- Sirita, J.; Phanichphant, S.; Meunier, F.C. Quantitative Analysis of Adsorbate Concentrations by Diffuse Reflectance FT-IR. Anal. Chem. 2007, 79, 3912–3918. [Google Scholar] [CrossRef] [PubMed] [Green Version]
- Jbir, P.I.; Bianchi, D.; Meunier, F.C. Spectrum baseline artefacts and correction of gas-phase species signal during diffuse reflectance FT-IR analyses of catalysts at variable temperatures. Appl. Catal. A Gen. 2015, 495, 17–22. [Google Scholar]
- Meunier, F.C. Pitfalls and benefits of in situ and operando diffuse reflectance FT-IR spectroscopy (DRIFTS) applied to catalytic reactions. React. Chem. Eng. 2016, 1, 134–141. [Google Scholar] [CrossRef]
- Bensitel, M.; Moravek, V.; Lamotte, J.; Saur, O.; Lavalley, J.C. Infrared study of alcohols adsorption on zirconium oxide: Reactivity of alkoxy species towards CO2. Spectrochim. Acta 1987, 43, 1487–1491. [Google Scholar] [CrossRef]
- Busca, G.; Lamotte, J.; Lavalley, J.C.; Lorenzelli, V. FT-IR study of the adsorption and transformation of formaldehyde on oxide surfaces. J. Am. Chem. Soc. 1987, 109, 5197–5202. [Google Scholar] [CrossRef]
- Meunier, T.F.C.; Goguet, A.; Reid, D.; Burch, R.; Boaro, M.; Vicario, M.; Trovarelli, A. An investigation of possible mechanisms for the water–gas shift reaction over a ZrO2-supported Pt catalyst. J. Catal. 2006, 244, 183–191. [Google Scholar]
- Binet, C.; Daturi, M. Methanol as an IR probe to study the reduction process in ceria–zirconia mixed compounds. Catal. Today 2001, 70, 155–167. [Google Scholar] [CrossRef]
- Courtois, D.X.; Perrichon, V.; Bianchi, D. Heats of Adsorption of CO on a Cu/Al2O3 Catalyst Using FTIR Spectroscopy at High Temperatures and under Adsorption Equilibrium Conditions. J. Phys. Chem. B 2000, 104, 6001–6011. [Google Scholar]


Publisher’s Note: MDPI stays neutral with regard to jurisdictional claims in published maps and institutional affiliations. |
© 2022 by the authors. Licensee MDPI, Basel, Switzerland. This article is an open access article distributed under the terms and conditions of the Creative Commons Attribution (CC BY) license (https://creativecommons.org/licenses/by/4.0/).
Share and Cite
Meunier, F.C.; Dansette, I.; Eng, K.; Schuurman, Y. Differentiating the Reactivity of ZrO2-Bound Formates Formed on Cu/ZrO2 during CO2 Hydrogenation. Catalysts 2022, 12, 793. https://doi.org/10.3390/catal12070793
Meunier FC, Dansette I, Eng K, Schuurman Y. Differentiating the Reactivity of ZrO2-Bound Formates Formed on Cu/ZrO2 during CO2 Hydrogenation. Catalysts. 2022; 12(7):793. https://doi.org/10.3390/catal12070793
Chicago/Turabian StyleMeunier, Frederic C., Isaac Dansette, Kimleang Eng, and Yves Schuurman. 2022. "Differentiating the Reactivity of ZrO2-Bound Formates Formed on Cu/ZrO2 during CO2 Hydrogenation" Catalysts 12, no. 7: 793. https://doi.org/10.3390/catal12070793