Article

Effects of Potassium Loading over Iron–Silica Interaction, Phase Evolution and Catalytic Behavior of Precipitated Iron-Based Catalysts for Fischer-Tropsch Synthesis

1
National Institute of Clean-and-Low-Carbon Energy, Beijing 102211, China
2
Laboratory of Inorganic Materials and Catalysis, Department of Chemical Engineering and Chemistry, Eindhoven University of Technology, 5600 Eindhoven, The Netherlands
*
Authors to whom correspondence should be addressed.
Catalysts 2022, 12(8), 916; https://doi.org/10.3390/catal12080916
Submission received: 6 July 2022 / Revised: 10 August 2022 / Accepted: 17 August 2022 / Published: 19 August 2022
(This article belongs to the Special Issue Development of Novel Catalysts for Fischer–Tropsch Synthesis)

Abstract

:
Potassium (K) promoter and its loading contents were shown to have remarkable effects on the Fe–O–Si interaction of precipitated Fe/Cu/K/SiO2 catalysts for low-temperature Fischer-Tropsch synthesis (FTS). With the increase in K content from 2.3% (100 g Fe based) up to 7% in the calcined precursors, Fe–O–Si interaction was weakened, as reflected by ATR/FTIR, H2-TPR and XPS investigations. XRD results confirmed that the diffraction peak intensity from (510) facet of χ-Fe5C2 phase strengthened with increasing K loading, which indicates the crystallite size of χ-Fe5C2 increased with the increase in K contents either during the syngas reduction/carburization procedure or after FTS reaction. H2-TPH results indicated that more reactive surface carbon (alpha-carbon) was obtained over the higher K samples pre-carburized by syngas. Raman spectra illustrated that a greater proportion of graphitic carbon was accumulated over the surface of spent samples with higher K loading. At the same time, ATR-FTIR, XRD and Mössbauer spectra (MES) characterization results showed that a relatively higher level of bulk phase Fayalite (Fe2SiO4) species was observed discernibly in the lowest K loading sample (2.3 K%) in this work. The catalytic evaluation results showed that the CO conversion, CO2 selectivity and O/P (C2–C4) ratio increased progressively with the increasing K loading, whereas a monotonic decline in both CO conversion and O/P (C2–C4) ratio was observed on the highest K loading sample during c.a. 280 h of TOS.

1. Introduction

Fischer-Tropsch synthesis (FTS) has widely been considered a viable route for converting syngas (H2+CO) derived from carbon-containing non-petroleum resources (e.g., coal, natural gas, biomass, etc.) into transportation fuels and/or other useful chemicals [1]. Precipitated iron-based catalysts are preferable for FTS reactions, which shows the characteristics of high activity, feed flexibility (H2/CO = 0.5~2.5), a wider temperature window for process operation (230~350 °C) and cheaper precursor materials [2,3].
Iron-based FTS catalyst is well known as an industrially applicable multi-component embodiment, among which potassium is the most important electronic promoter [4,5]. Many researchers have been exploring its effects on physical/textural properties, reduction and carburization degree, and the catalytic performance of the precipitated iron-based catalyst [6,7,8,9,10,11]. Potassium (K) causes an increase in crystallite size and a decrease in the BET surface area. With the increase in the potassium content, the reduction of the Fe/Mn catalyst was retarded due to the strong interaction of iron oxide with potassium oxide [6]. In addition, the effects of potassium on facilitating CO-dissociative adsorption [6,8], weakening/suppressing H2 adsorption and dissociation [8,12,13], and strengthening Fe–C bond have well been interpreted by electronic effects. C.H. Bartholomew et al. [11] investigated the FT reaction and deactivation kinetics based on unpromoted and potassium-promoted iron catalysts. The author proposed a deactivation model involving parallel paths, i.e., simultaneous conversion of (a) atomic carbon to polymeric to graphitic carbon and (b) active carbon-rich carbides to inactive carbon-poor carbides. The activation energy for the deactivation of Fe/K was consistent with the atomic-to-polymeric conversion being rate-determining, while that for Fe may be involved in the conversion of either polymeric to graphitic carbon and/or of active carbides to inactive carbides as the rate-determining step. It was also reported that [9], in the case of a catalyst that is unpromoted or not K-promoted enough, the deactivation is attributable to the oxidation of iron carbide (χ-Fe5C2) into Fe3O4, while the deactivation rate was related to carbon deposition in terms of the catalysts with excessive K loading, which could embed iron carbide particles and cause the site blocking. Nevertheless, most of the above-mentioned research as executed over the iron catalyst without silica (SiO2) incorporation.
SiO2 has been considered as a proper structural promoter for iron-based catalysts [4]. The formula 100Fe/5Cu/4.2K/25SiO2 from Ruhrchemie A. G. in Germany [14] was one of the classical recipes, which acts as the basic formula of precipitated iron-based FTS catalysts, has been widely used as a benchmark for basic research and industrial catalyst development [15,16,17,18]. In the research works related to SiO2-incorporation effects, some works have indicated that its promotion of the attrition property, FTS activity/stability and selectivity/hydrocarbon productivity of Fe catalyst seemed to some extent to exhibit contrary correlation [19,20]. These complicated effects of silica over catalyst performance have usually been attributed to the interaction between iron and SiO2 or potassium and the structural promoter. Actually, the iron hydroxide/oxyhydroxide formed during the precipitation usually possesses a large number of coordinated unsaturated sites (CUSs), which may interact with SiO2 via a hydrolysis reaction of surface hydroxyl groups between them to induce Fe–O–Si bonds [3,21,22]. This kind of interaction of Fe–O–Si was reported to result in the retardation of iron oxide reduction/carburization [23], strengthening of C, O adsorption on iron sites [3,22], lowering of CO converting activity [21] and so on. In addition, several works have proposed that there may also be an interaction between K and structural promoter SiO2 besides Fe–SiO2 interaction [20,23,24]. The authors observed decreased FTS activity with increasing SiO2 contents in Fe/Cu/K/SiO2 catalysts and postulated that the increased support suppressed potassium basicity or its promotional effects. However, which kind of impacts potassium shows in turn toward Fe–SiO2 interaction, as well as how the potassium loading level affects the Fe–O–Si phase evolution and catalytic performance of silica incorporated in Fe/Cu/K catalysts, have scarcely been reported.
In this paper, precipitated Fe/Cu/K/SiO2 FTS catalysts, the bulk structure of which shows the characteristic of ferrihydrite (FH), were prepared with different potassium loadings at an identical content of other components and subjected to an FTS performance test in a fixed-bed reactor (FBR). Physico-chemical properties, bulk and surface structures and phase evolution of as-prepared/used catalysts, as well as the reduction/carburization behavior of fresh samples, were characterized by multiple techniques, including BET, IR(ATR), ex and in situ XRD, XPS, Raman spectra, Mössbauer spectroscopy (MES) and H2-TPR, H2-TPH. The obtained results are intended to provide new insight into potassium’s effects on SiO2-incorporated iron-based catalysts, the structure–performance relationship of which has been reported to be governed mainly by the iron–silica interaction.

2. Results and Discussion

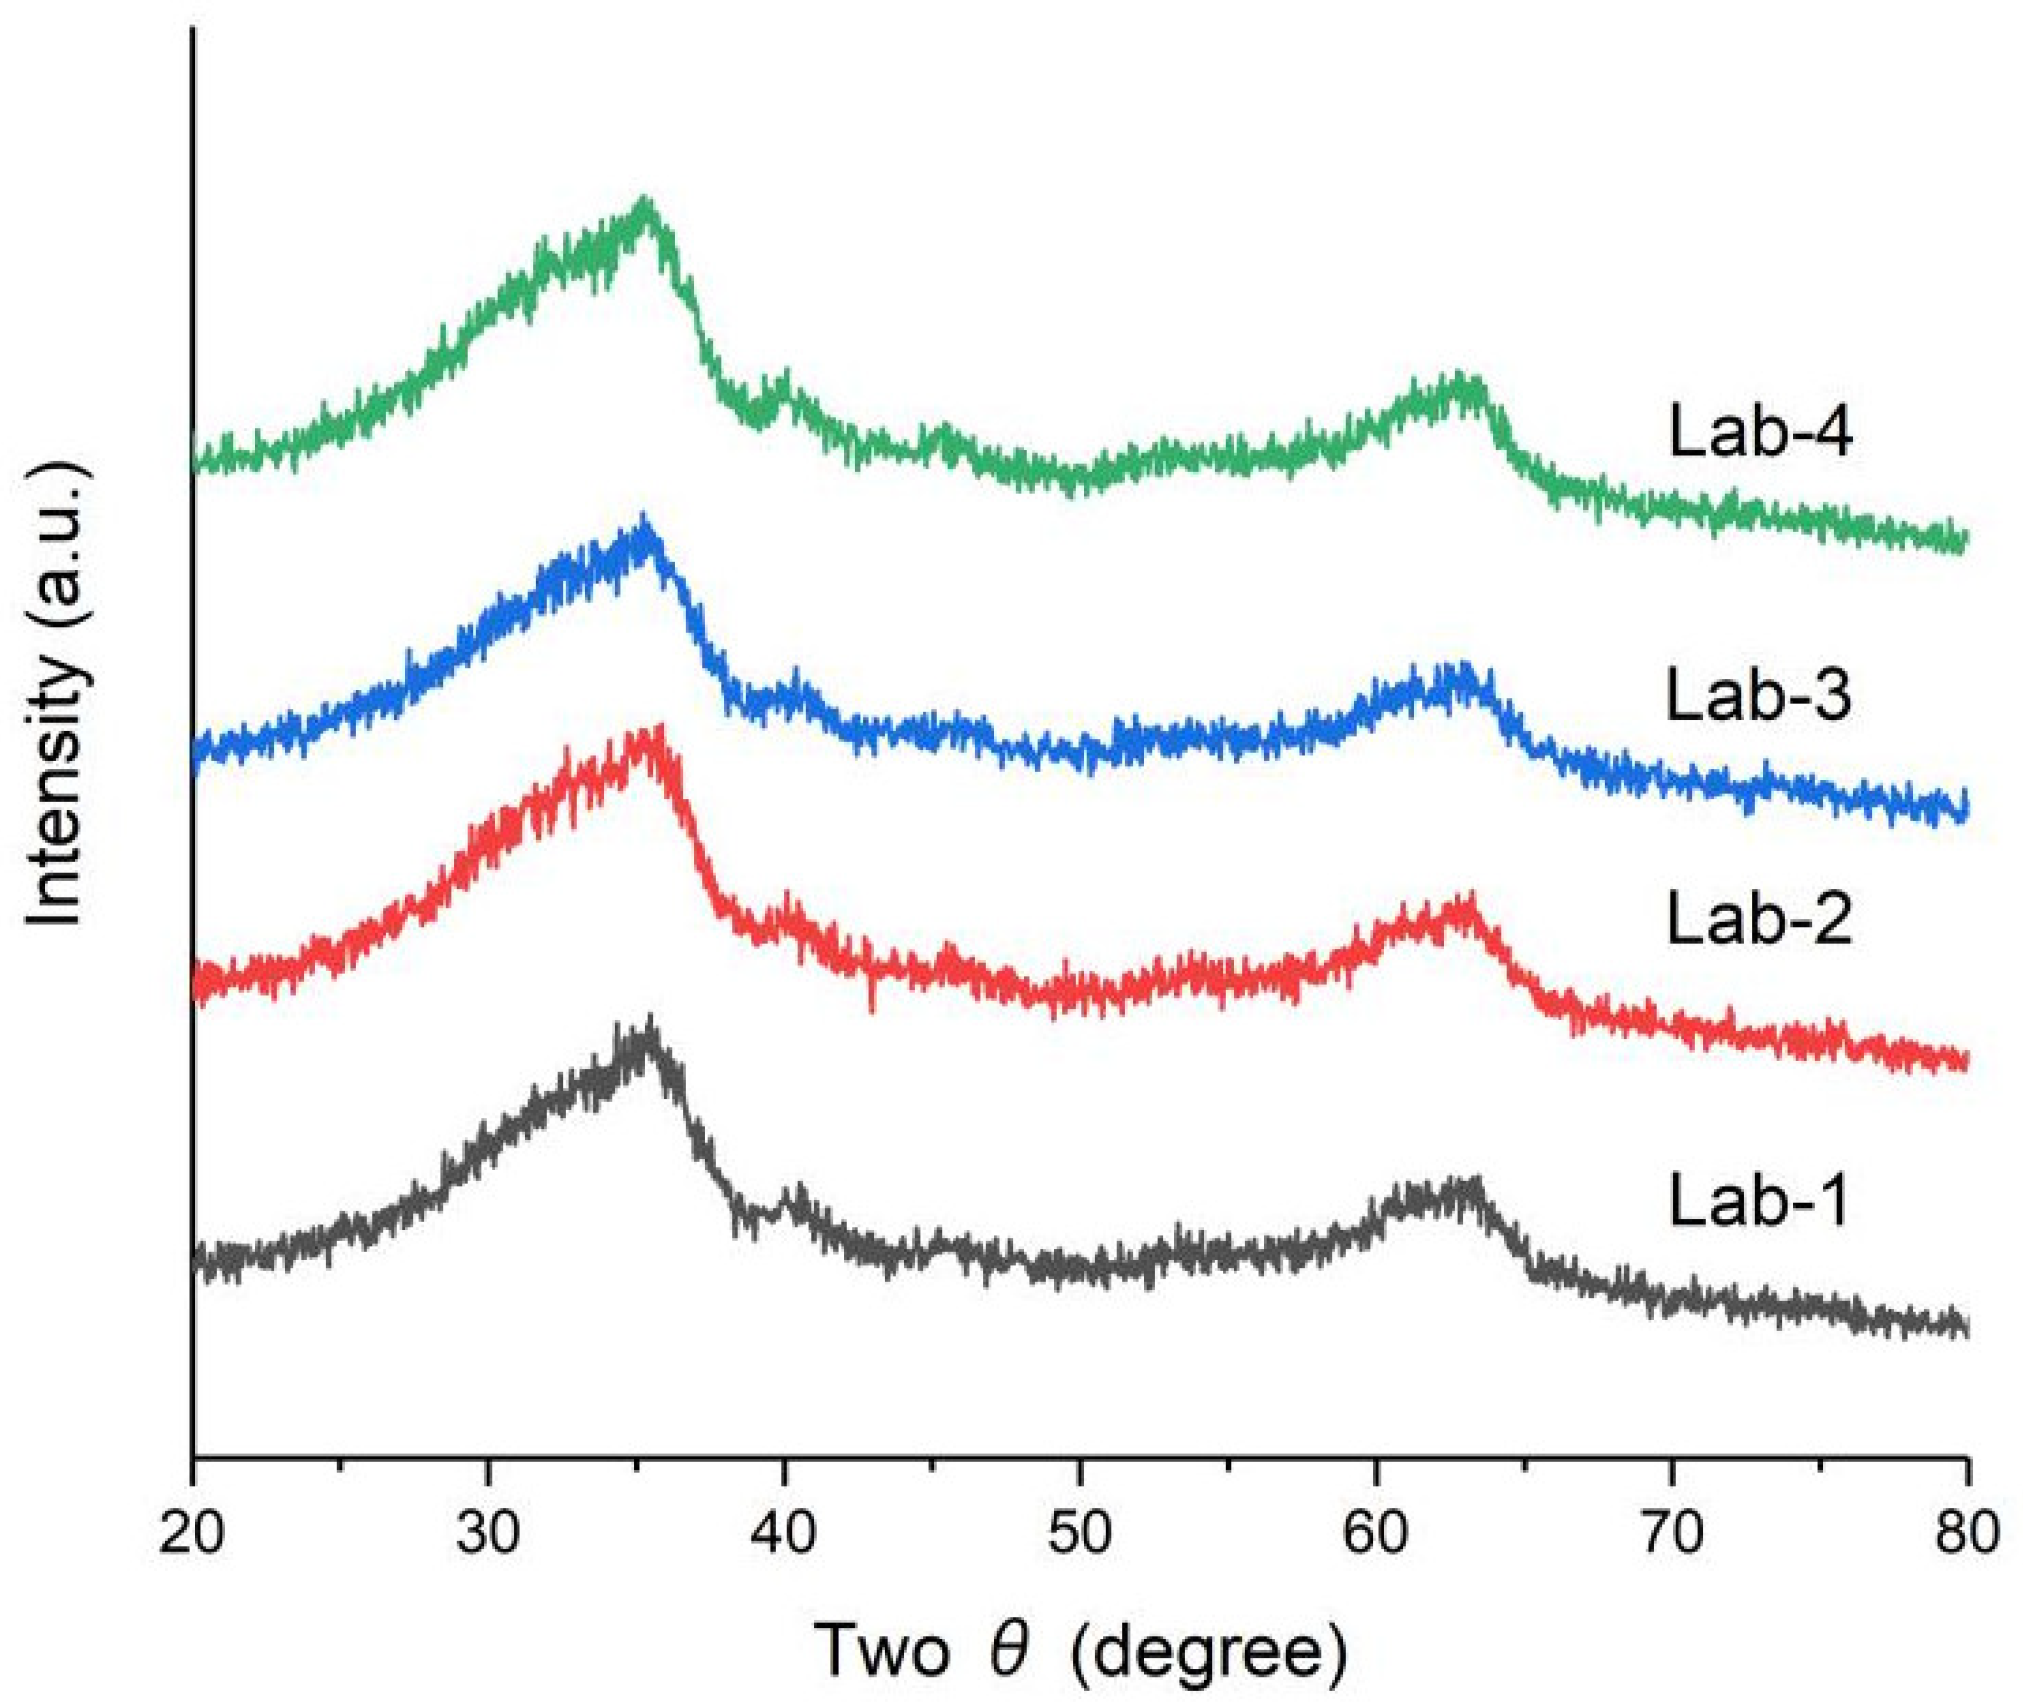
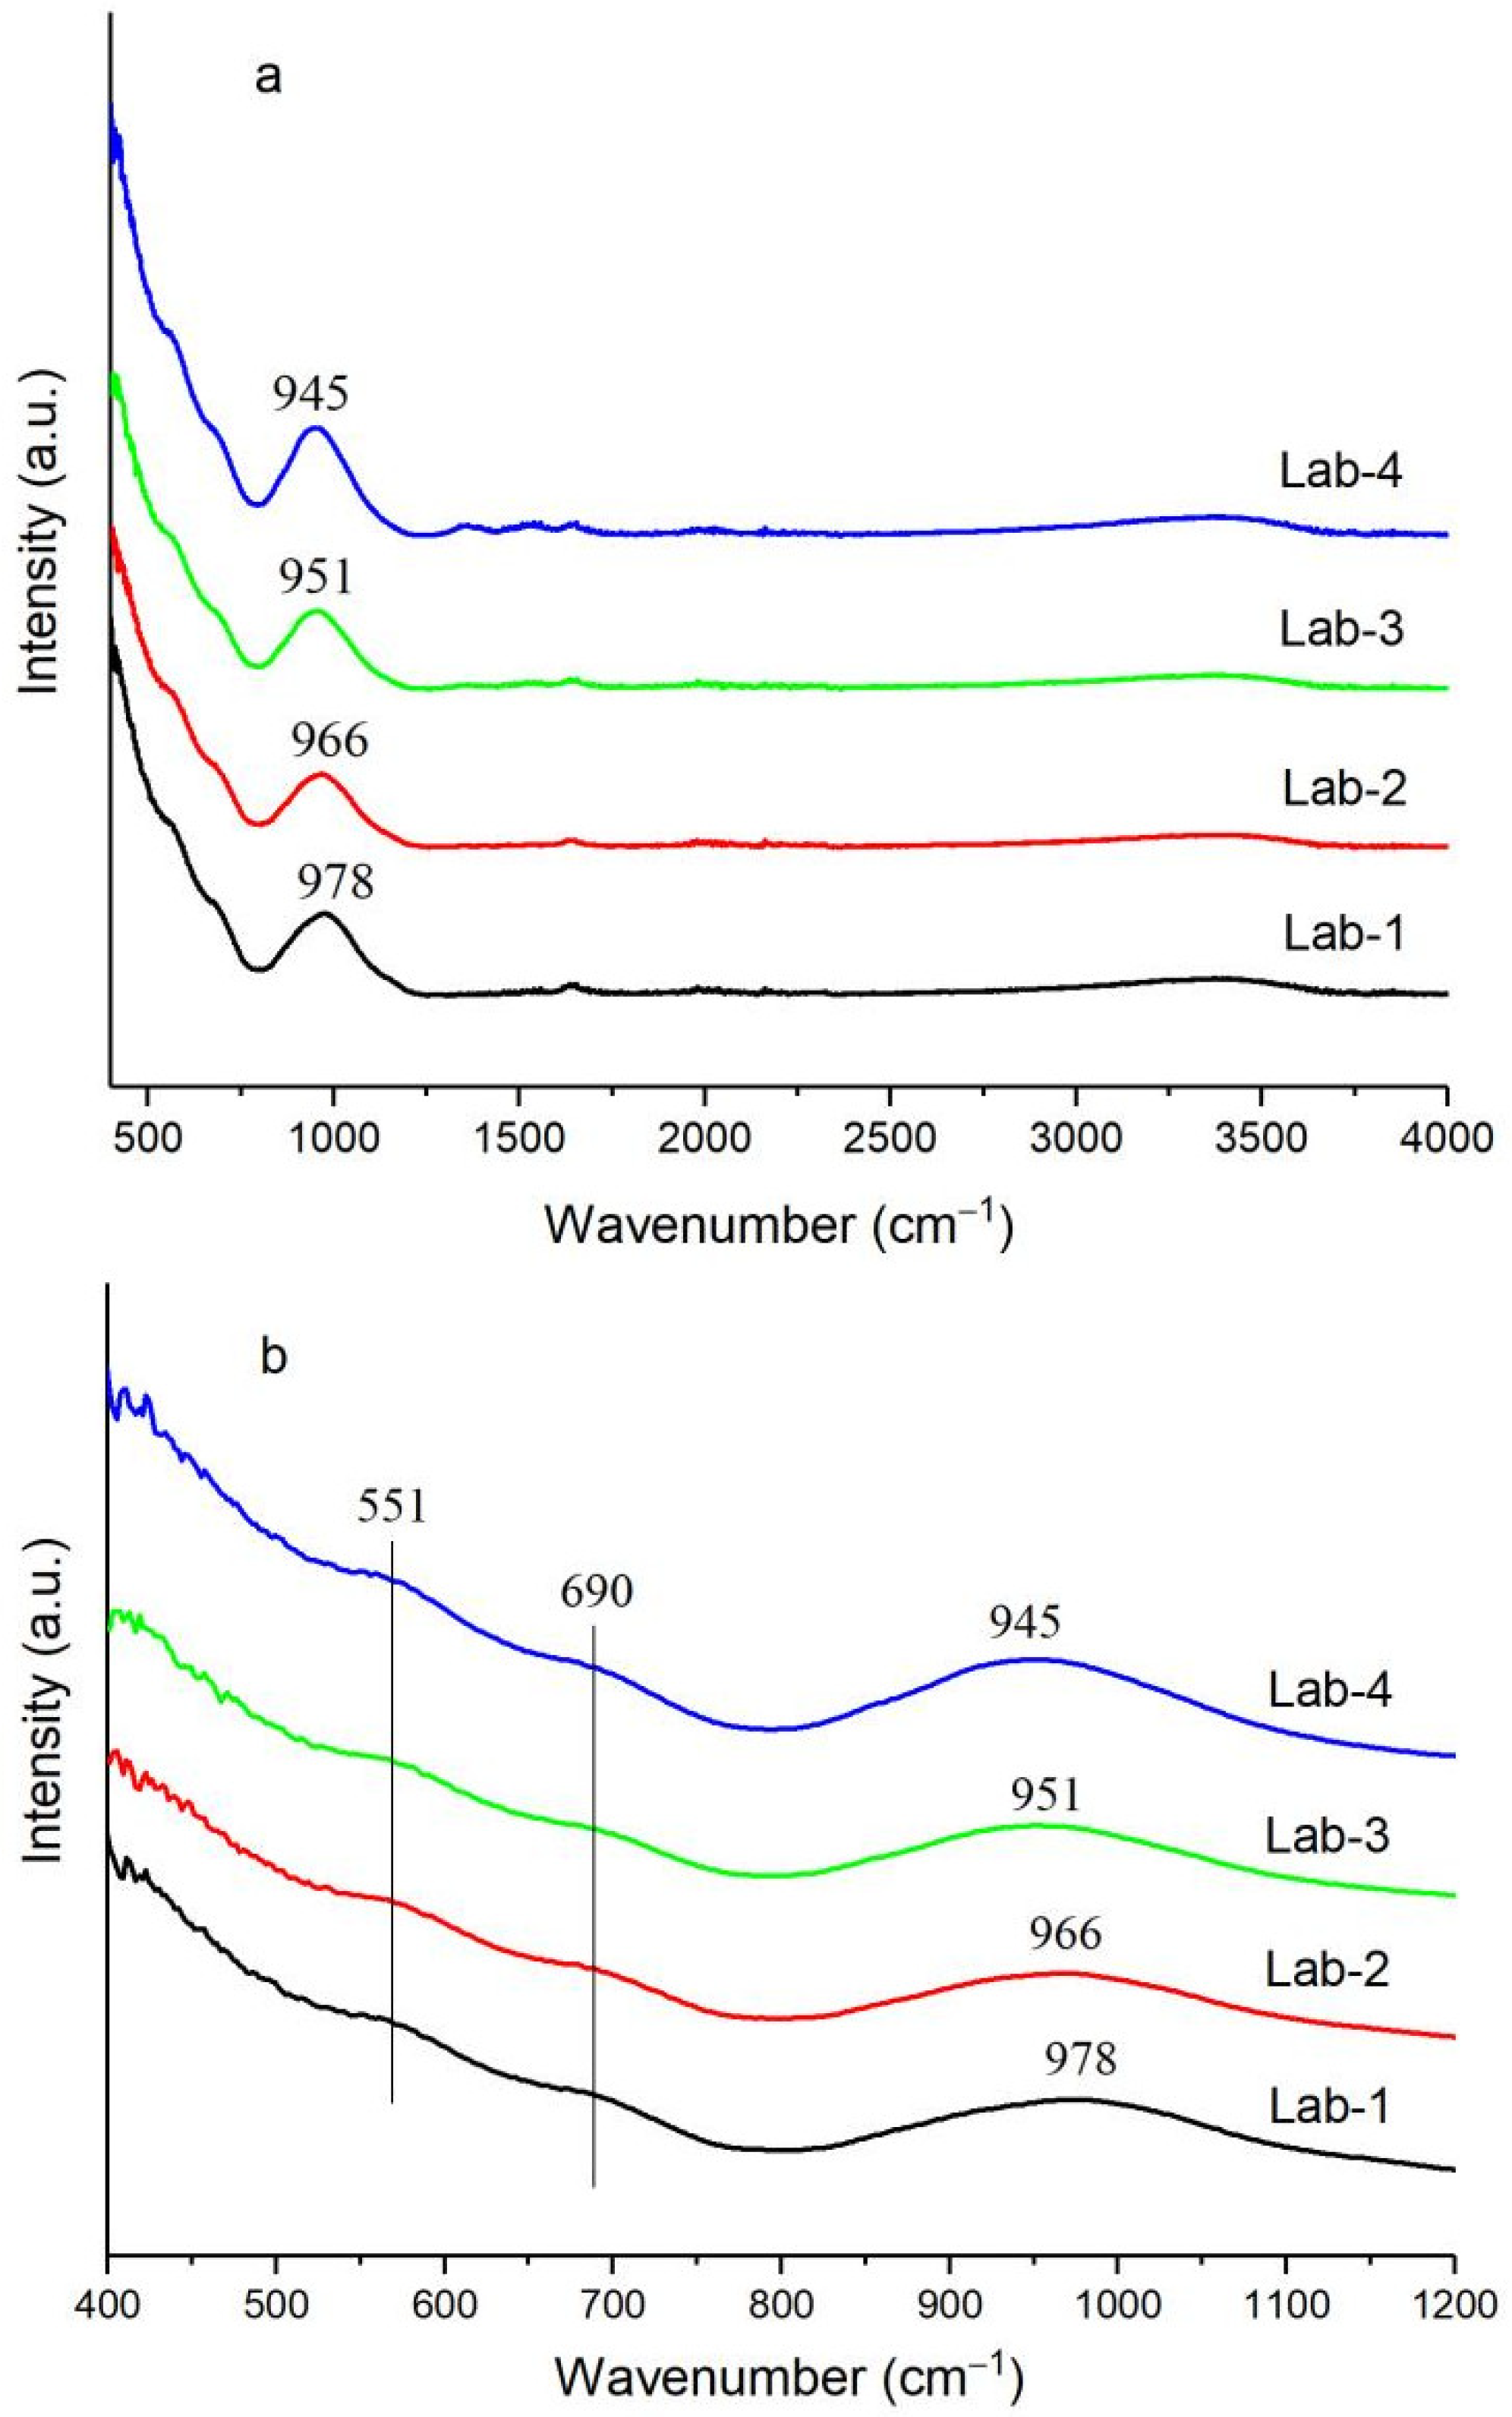
2.1. Effect of K Loading on Fe–O–Si Interaction

BET surface area, as well as pore volume of the four fresh precursors, decreased from 221.7 (Lab-1) to 200.4 (Lab-4) m2/g, and from 0.51 to 0.44 cm3/g as the K loading level increased from 2.3% to 7%, while the average pore diameter remained essentially unchanged. These results are similar to those reported in the literature without or with SiO2 incorporation [6,25].
XRD illustrated that all samples show a broadened diffraction peak in the 2θ range at around 35° and 63°, corresponding to a characteristic pattern of an FH diffraction [26,27] (see Figure 1). The diffraction pattern is so broad and the intensities of all four samples are basically identical to each other, which indicates that the crystallite of those iron oxides in all samples was so highly dispersed that they were hard to differentiate precisely by the powder-diffraction technique. The size diameter of a synthetic FH crystallite was reported to be very small [27,28].
The ATR-FTIR spectra of fresh samples are depicted in Figure 2. There are several weak bands observed in the 400–800 cm−1 spectral range, and one broad and stronger absorption peak in the ranges 800–1200 cm−1 over each sample, while the IR spectrum above 1200 cm−1 is almost featureless. The bands in the lower wave-number range (less than 750 cm−1) were attributed to Fe-O and Fe-OH stretching or lattice vibrations [29,30,31]. Two weak peaks here, one at 551 cm−1 and another at c.a. 690 cm−1, are therefore characteristic adsorption bands of low crystalline FH [30]. It can be further observed, interestingly, that the position of the maximum of the most intense absorption peak shifts from 978 cm−1 toward 945 cm−1 (red shift: 978-->966-->951-->945 cm−1) in parallel with the increasing K loading, whereas the other bands at 400–750 cm−1 remain unaffected (Figure 2b). The positions of the weak peaks below 750 cm−1 are identical among four samples, which indicates that Fe-O bonding vibration [26] was barely affected by the variation of K loading.
The band with the absorption peak at approx. 970 cm−1 can be indicative of a silica-rich Fe–O–Si or Fe–O–Si group in a local-composition environment with a lower Fe/Si ratio [22,32,33,34]. Eric van Steen et al. [22] studied nano-sized iron oxides with different levels of contents of surface silicate groups with an inverse approach and reported the absorption bands in the region of 870–1020 cm−1 to be typically ascribed to the Fe–O–Si stretching frequency, while the one at 940–952 cm−1 was ascribed to a bidentate ((=FeO)2-Si(OH)2) [35]. The author observed a blue shift in the band region that stepped across 940–952 cm−1, and attributed it to a change from tridentate to bidentate to monodentate bonding of the surface silanol group. M.S. Seehra et al. [27] investigated synthetic ferrihydrite nanoparticles doped with Si and observed a considerable IR band shift in frequency from the position at 870 cm−1 for 2Si% (FH based) to its location at ~1000 cm−1 for 50Si% (FH based) in parallel with an increasing trend of silicate contents. Furthermore, according to the study of Peter J. Swedlund’s group [35], the maximum IR absorbance at the lowest Si surface concentrations for H2SiO4 in FH suspension occurred at 945 cm−1, and this spectral feature has been attributed to a monomeric silicate surface species. Based on the above literature summary, those peaks, located at 945–978 cm−1, are securely ascribed to the Fe–O–Si stretching frequency, and the IR absorbance band with higher frequency is indicative of silica-rich Fe–O–Si. The red shift observed here could be attributed to the gradual decrease in both the surface silicate concentration and the Fe–O–Si interaction [36,37] in parallel with the increasing trend of K loading, even though the IR band shift is in a narrow range. That is, the higher the K loading in the sample, the lower the probability and extent of iron–silica interaction, which can be considered the consequence of the strengthened interruption of potassium towards the overall interaction. Therefore, the introduction of potassium and its loading content play important roles in Fe–O–Si.
The reduction behavior of fresh samples in an H2 atmosphere was investigated by TPR (see Figure 3). H2-TPR profiles roughly present two reduction curves [38]: a distinct sharp peak in the 185~285 °C temperature range represents the superposition of the reduction peak from iron (Fe3+) oxide toward lower-valanced iron species, mainly magnetite (Fe3O4), which also overlaps with that from CuO to Cu [10,25], and a prolonged weaker peak situated at 340~740 °C corresponds to the reduction process of Fe3O4 to α-Fe [16,21,25,39,40]. According to the literature, the reduction in pure Fe2O3 [25] or Fe/SiO2 [3,22] in the absence of CuO will occur at a temperature higher than about 300 °C, but it will markedly shift down to a lower reduction temperature range (215–280 °C) with the co-existence of CuO [25]. The latter process can also be divided into two parts: one with easier reduction of Fe3O4 to α-Fe and the other with a harder reduction of Fe3O4 to metallic iron possibly via FeO or non-stoichiometric Fe2+ to α-Fe, which is mainly caused by the interference of iron–silica interaction over Fe–O–Si [21]. It is obvious (see Figure 3) that the first reduction peak shifts toward a higher temperature (227-->245-->252-->254 °C). This is indicative that the higher K level inhibits the reduction process of catalyst from Fe3+ oxide towards lower-valanced iron species (first step of reduction), whereas the end temperature of the second reduction peak moves apparently toward a lower-temperature zone with increased K loading, which seemed to facilitate the reduction of Fe3O4 (or perhaps through other types of Fe2+ species as an intermediate to metallic iron).
As the K content increased, the first step of reduction was restrained, which can easily be understood by the inhibitory effects of strongly alkaline potassium towards the dissociation and adsorption of H2 and the strengthened Fe-O bond. This was evidenced by the H2 consumption in the TPR procedure (see Table 1 and Figure 4). It can be seen from the table that the H2 consumed in the first peak lowered from 0.27 mol H2/mol Fe (Lab-1) down to 0.218 mol H2/mol Fe (Lab-4). All of these H2 uptakes in the first peak (a little bit higher than the theoretical value of Fe3+ oxide to Fe3O4: 0.16–0.17 mol H2/mol Fe; lower than that of Fe3+ oxide to FeO: 0.5 mol H2/mol Fe) implies that (1) the first reduction pattern is safely attributable to the reduction of Fe3+ oxide toward the lower-valanced iron species (mainly Fe3O4); (2) the first reduction process also involves the parts of an in-depth reduction of Fe3+, which is prevented or stabilized by the iron–silica interaction [36].
However, the classical electron-donating theory can hardly explain the case of the second step of reduction, which appeared to be accelerated. It is clear from Figure 3 and Table 1 that there is relatively higher H2 consumption, which requires a high temperature above 570 °C in the Lab-1 sample, less in Lab-2 and Lab-3, and negligible in the highest K-loading samples. It is reasonable to assume the higher K loading should degrade the intact interaction between iron and silica, so as to decrease or eliminate the induction of the hardly reducible iron species. Furthermore, the lower-valanced iron species besides magnetite with non-reducibility at temperatures below 300 °C, together with all of the residual iron species in higher K-loading samples, were reduced at a relatively lower temperature (less than 570 °C) in this study. Furthermore, the infrared spectrum mentioned above showed that the corresponding absorption band of Fe–O–Si vibration showed a “red shift” with increased K content, which can be attributed to the increased potassium weakening the bonding or coordination status between iron and silica. Thus, the increase in K loading in the Fe/Cu/K/SiO2 catalyst induced the weakening of Fe–O–Si interaction.
XPS data revealed further that the distinct interaction between iron and silica is affected apparently by potassium loading (Figure 5). As can be seen from the figure, the Fe2p binding energy of Lab-1 sample (the lowest K content) is 711.6 eV, and then the binding energy gradually decreases with the increase in K loading. This is due to the Fe–O–Si interaction in the sample being weakened by increasing K content, which is consistent with the results obtained by ATR-FTIR and H2-TPR. The electronic structure of the surface from the XPS result shows that the Fe–O–Si interaction in the low K loading (e.g., Lab-1) sample is stronger, indicating that its electrons are difficult to excite, while the binding energy of Fe2p on the sample with higher K is lower. It is noticeable that the binding energy of the catalyst with even the highest K loading is still higher than the typical binding energy of silica-free Fe2O3 (710.5 eV) reported in the literature [3], showing the silica species on the surface of all four samples [3,41], and it may further implied that the coating of an iron-based Fe/Cu/SiO2 catalyst with potassium will just weaken the iron–silica interaction instead of eradicate it.
Indeed, the iron–silica interaction in the precipitated iron-based catalyst is subtle. The participation of silica in precipitated iron catalyst is usually small (25% by mass in the typical recipe), so the silica species could not possibly interact directly with each of the iron atoms in the entire catalyst to induce the Fe-O-Si covalent bonding. However, it was documented that there should be a remote interaction between iron and silica, which was reflected by the continuously increasing electron-deficient state of iron caused by the increasing content of SiO2 in the Fe/SiO2 binary model catalyst [3]. In the author’s work, with increasing content of SiO2 from 0 to 50%, the binding energy of Fe3p increased in a stepwise manner. However, the electrons in the Fe2p core level closer to the nuclei should hardly be more excited. Thus, the decreasing binding energy of Fe2p with the increase in K loading should imply a weakened iron–silica interaction.

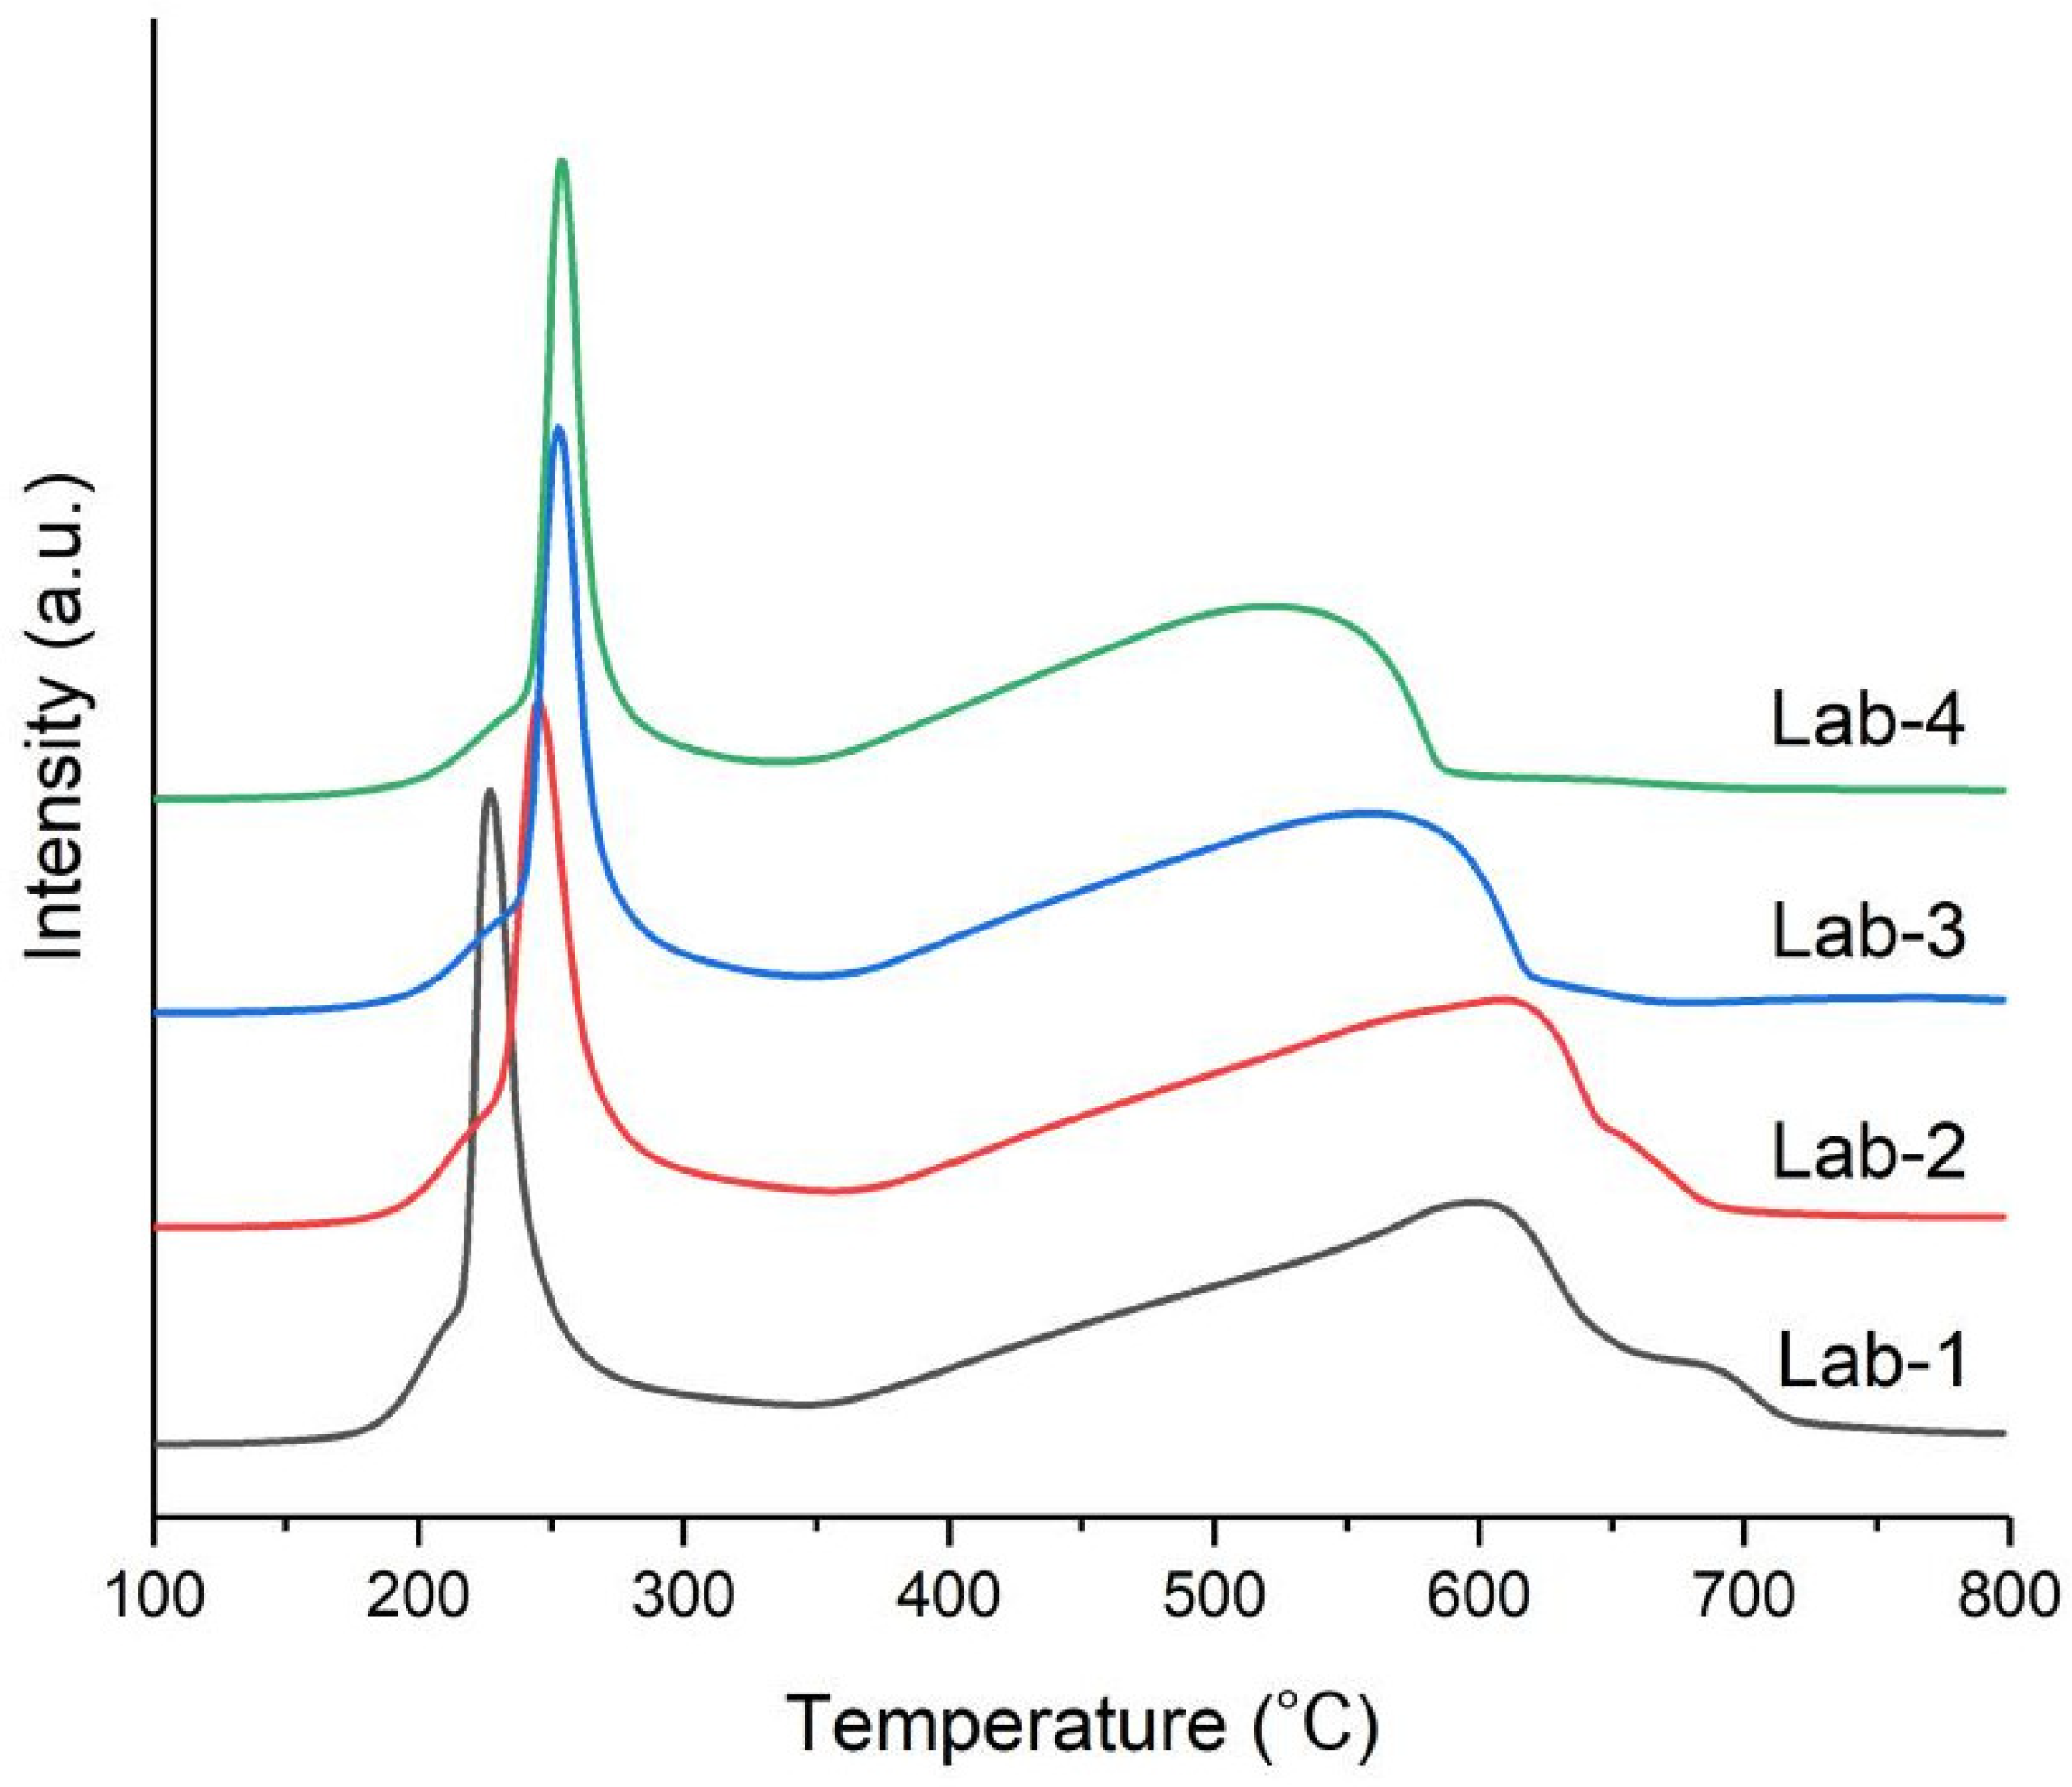
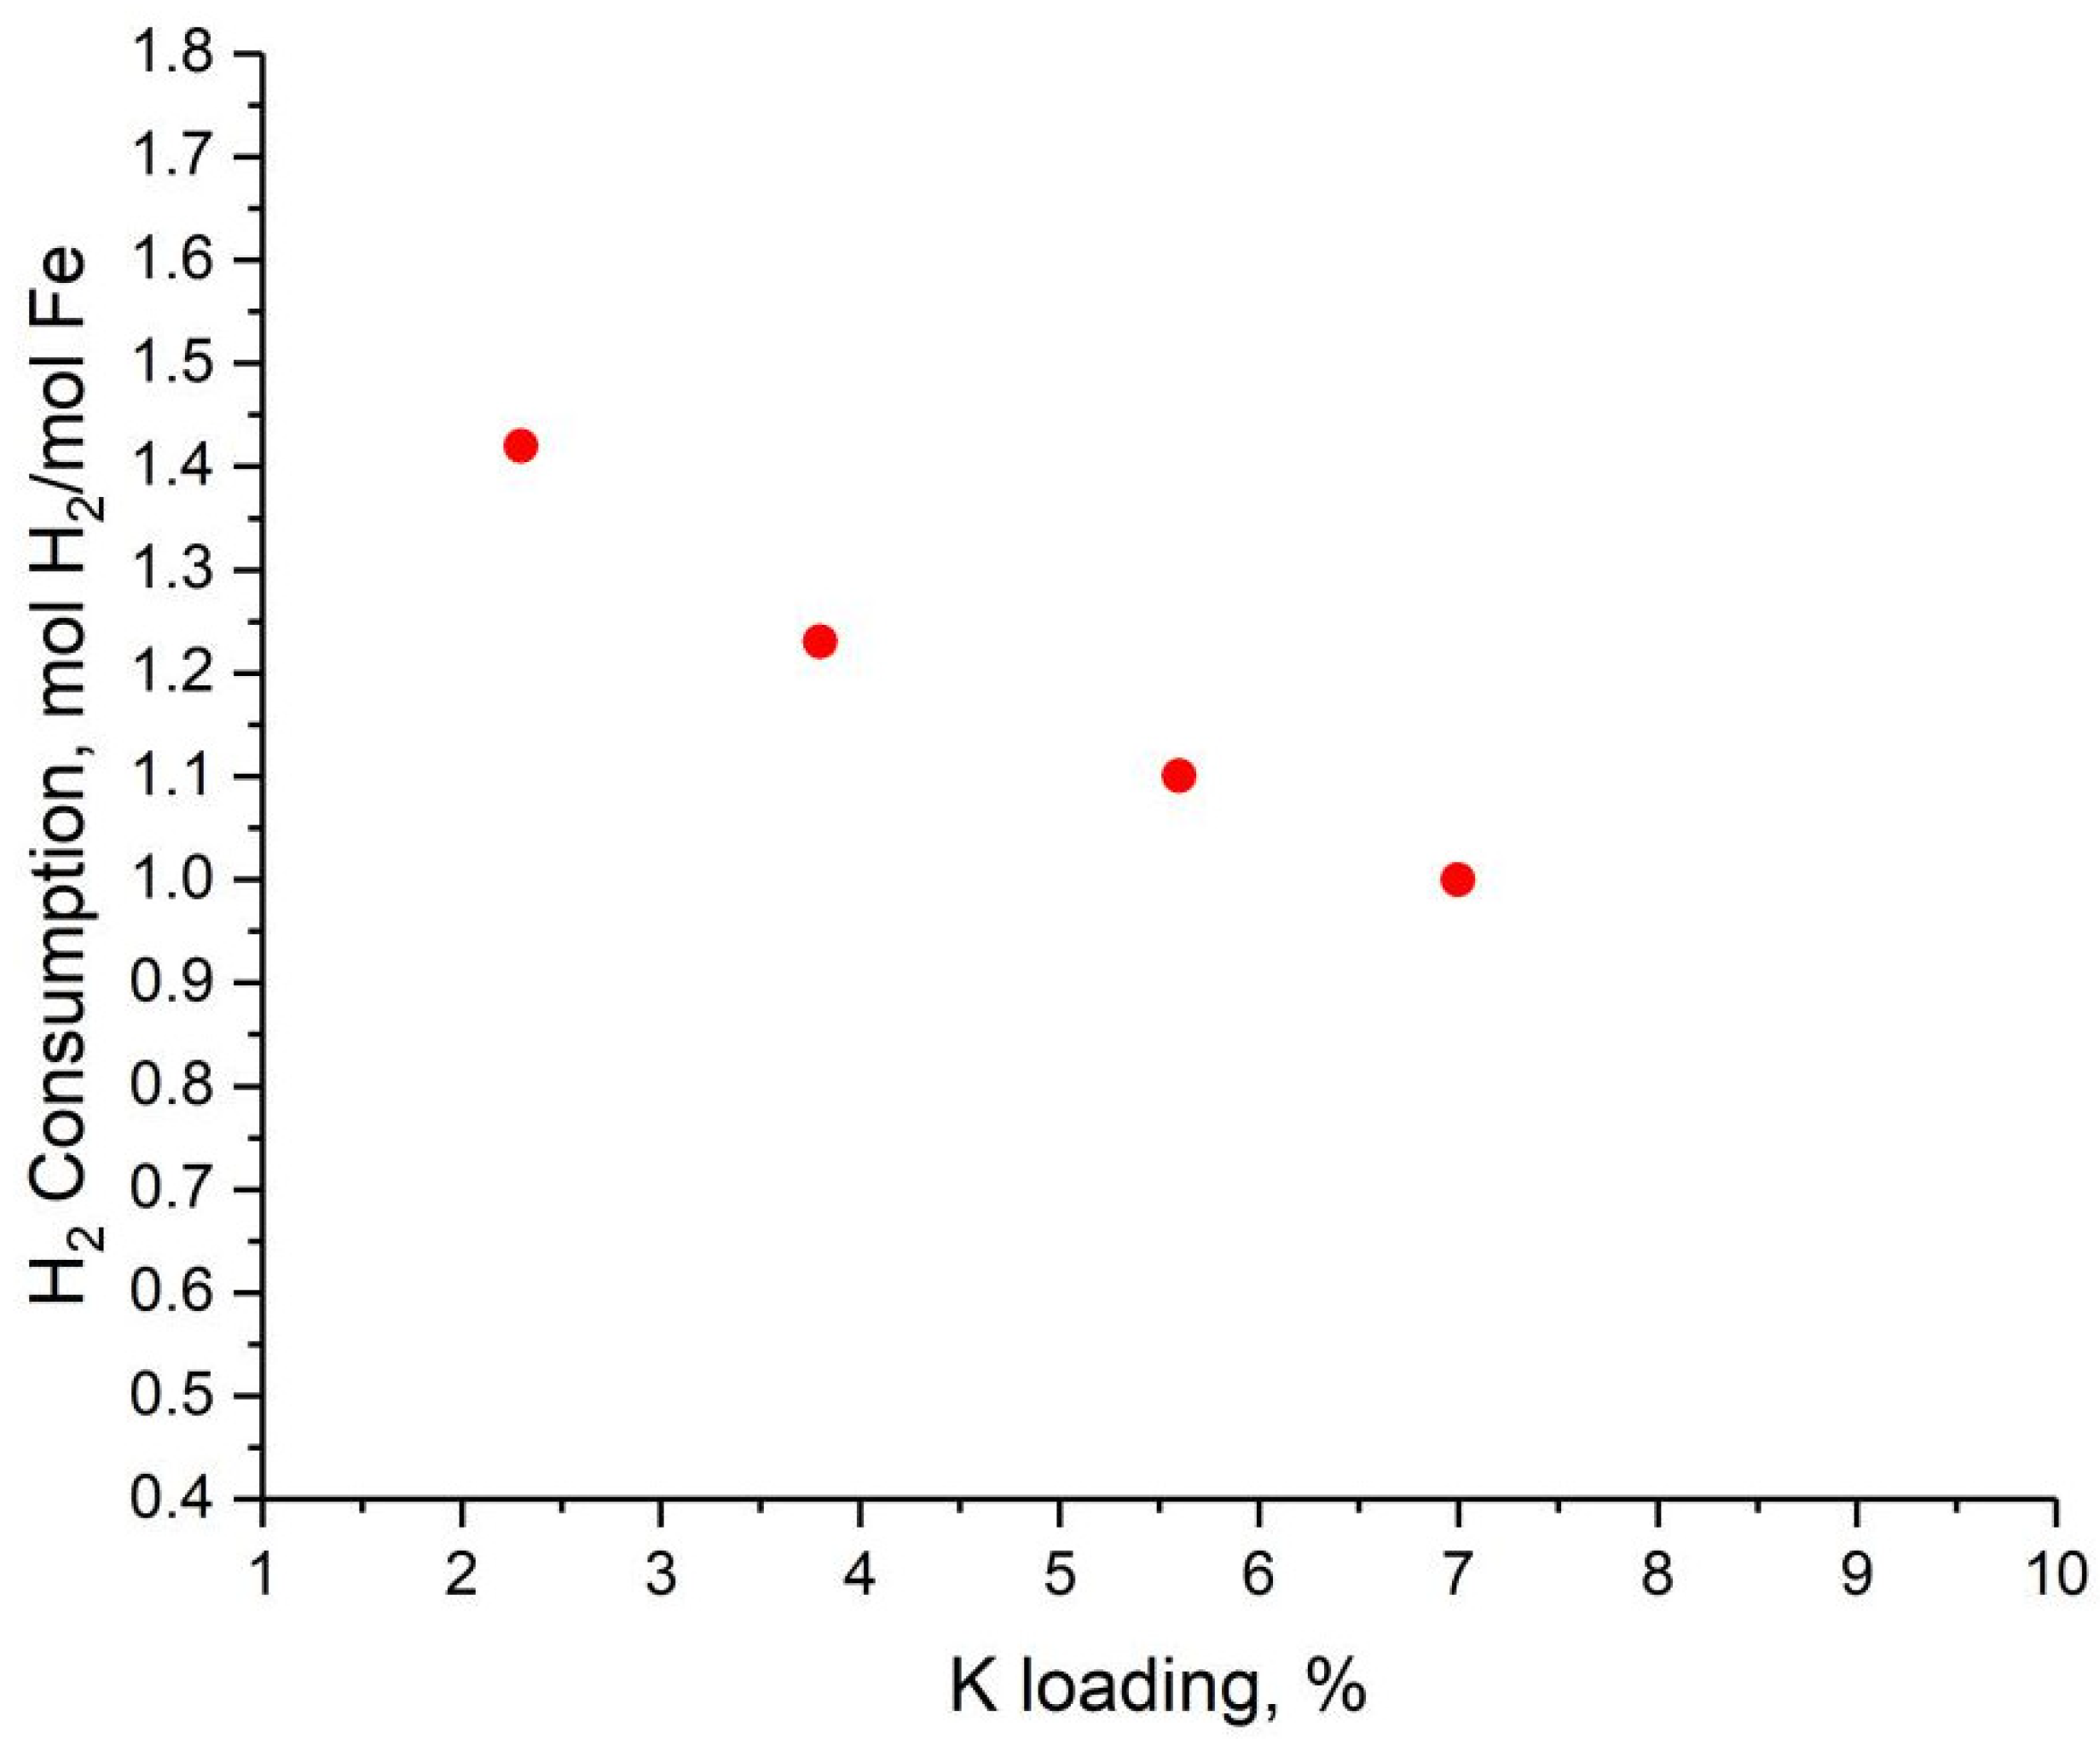
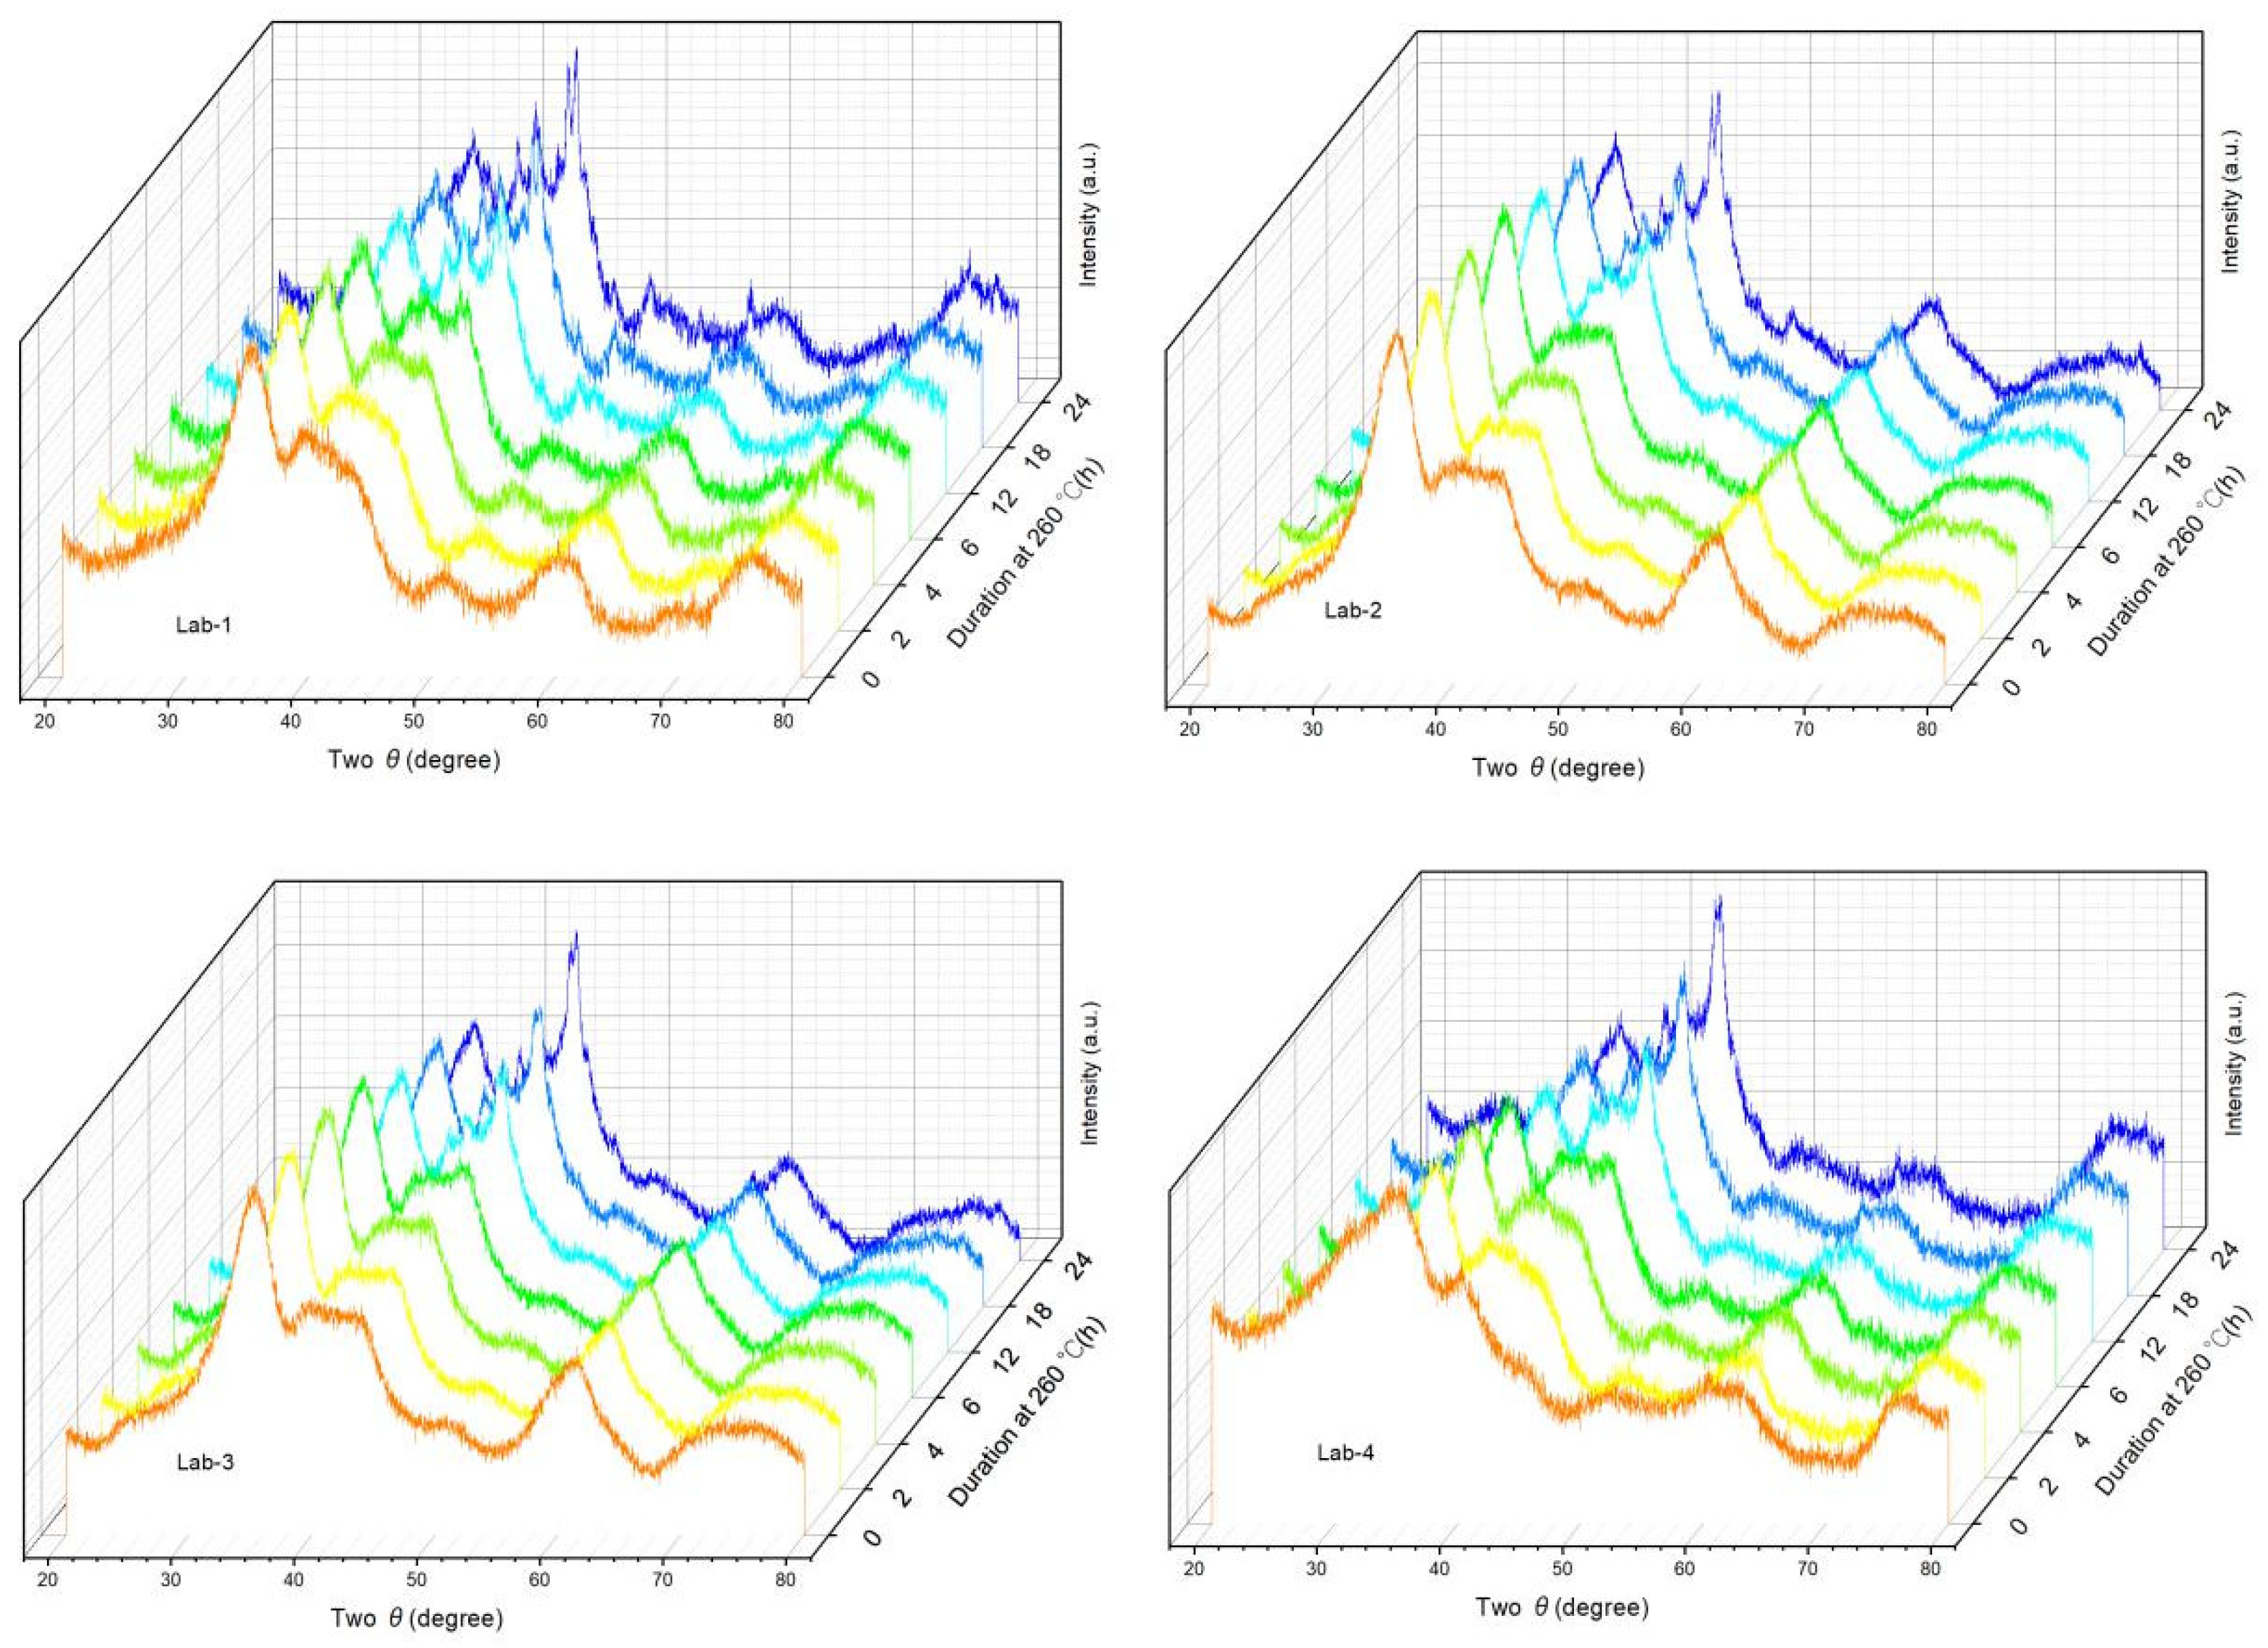
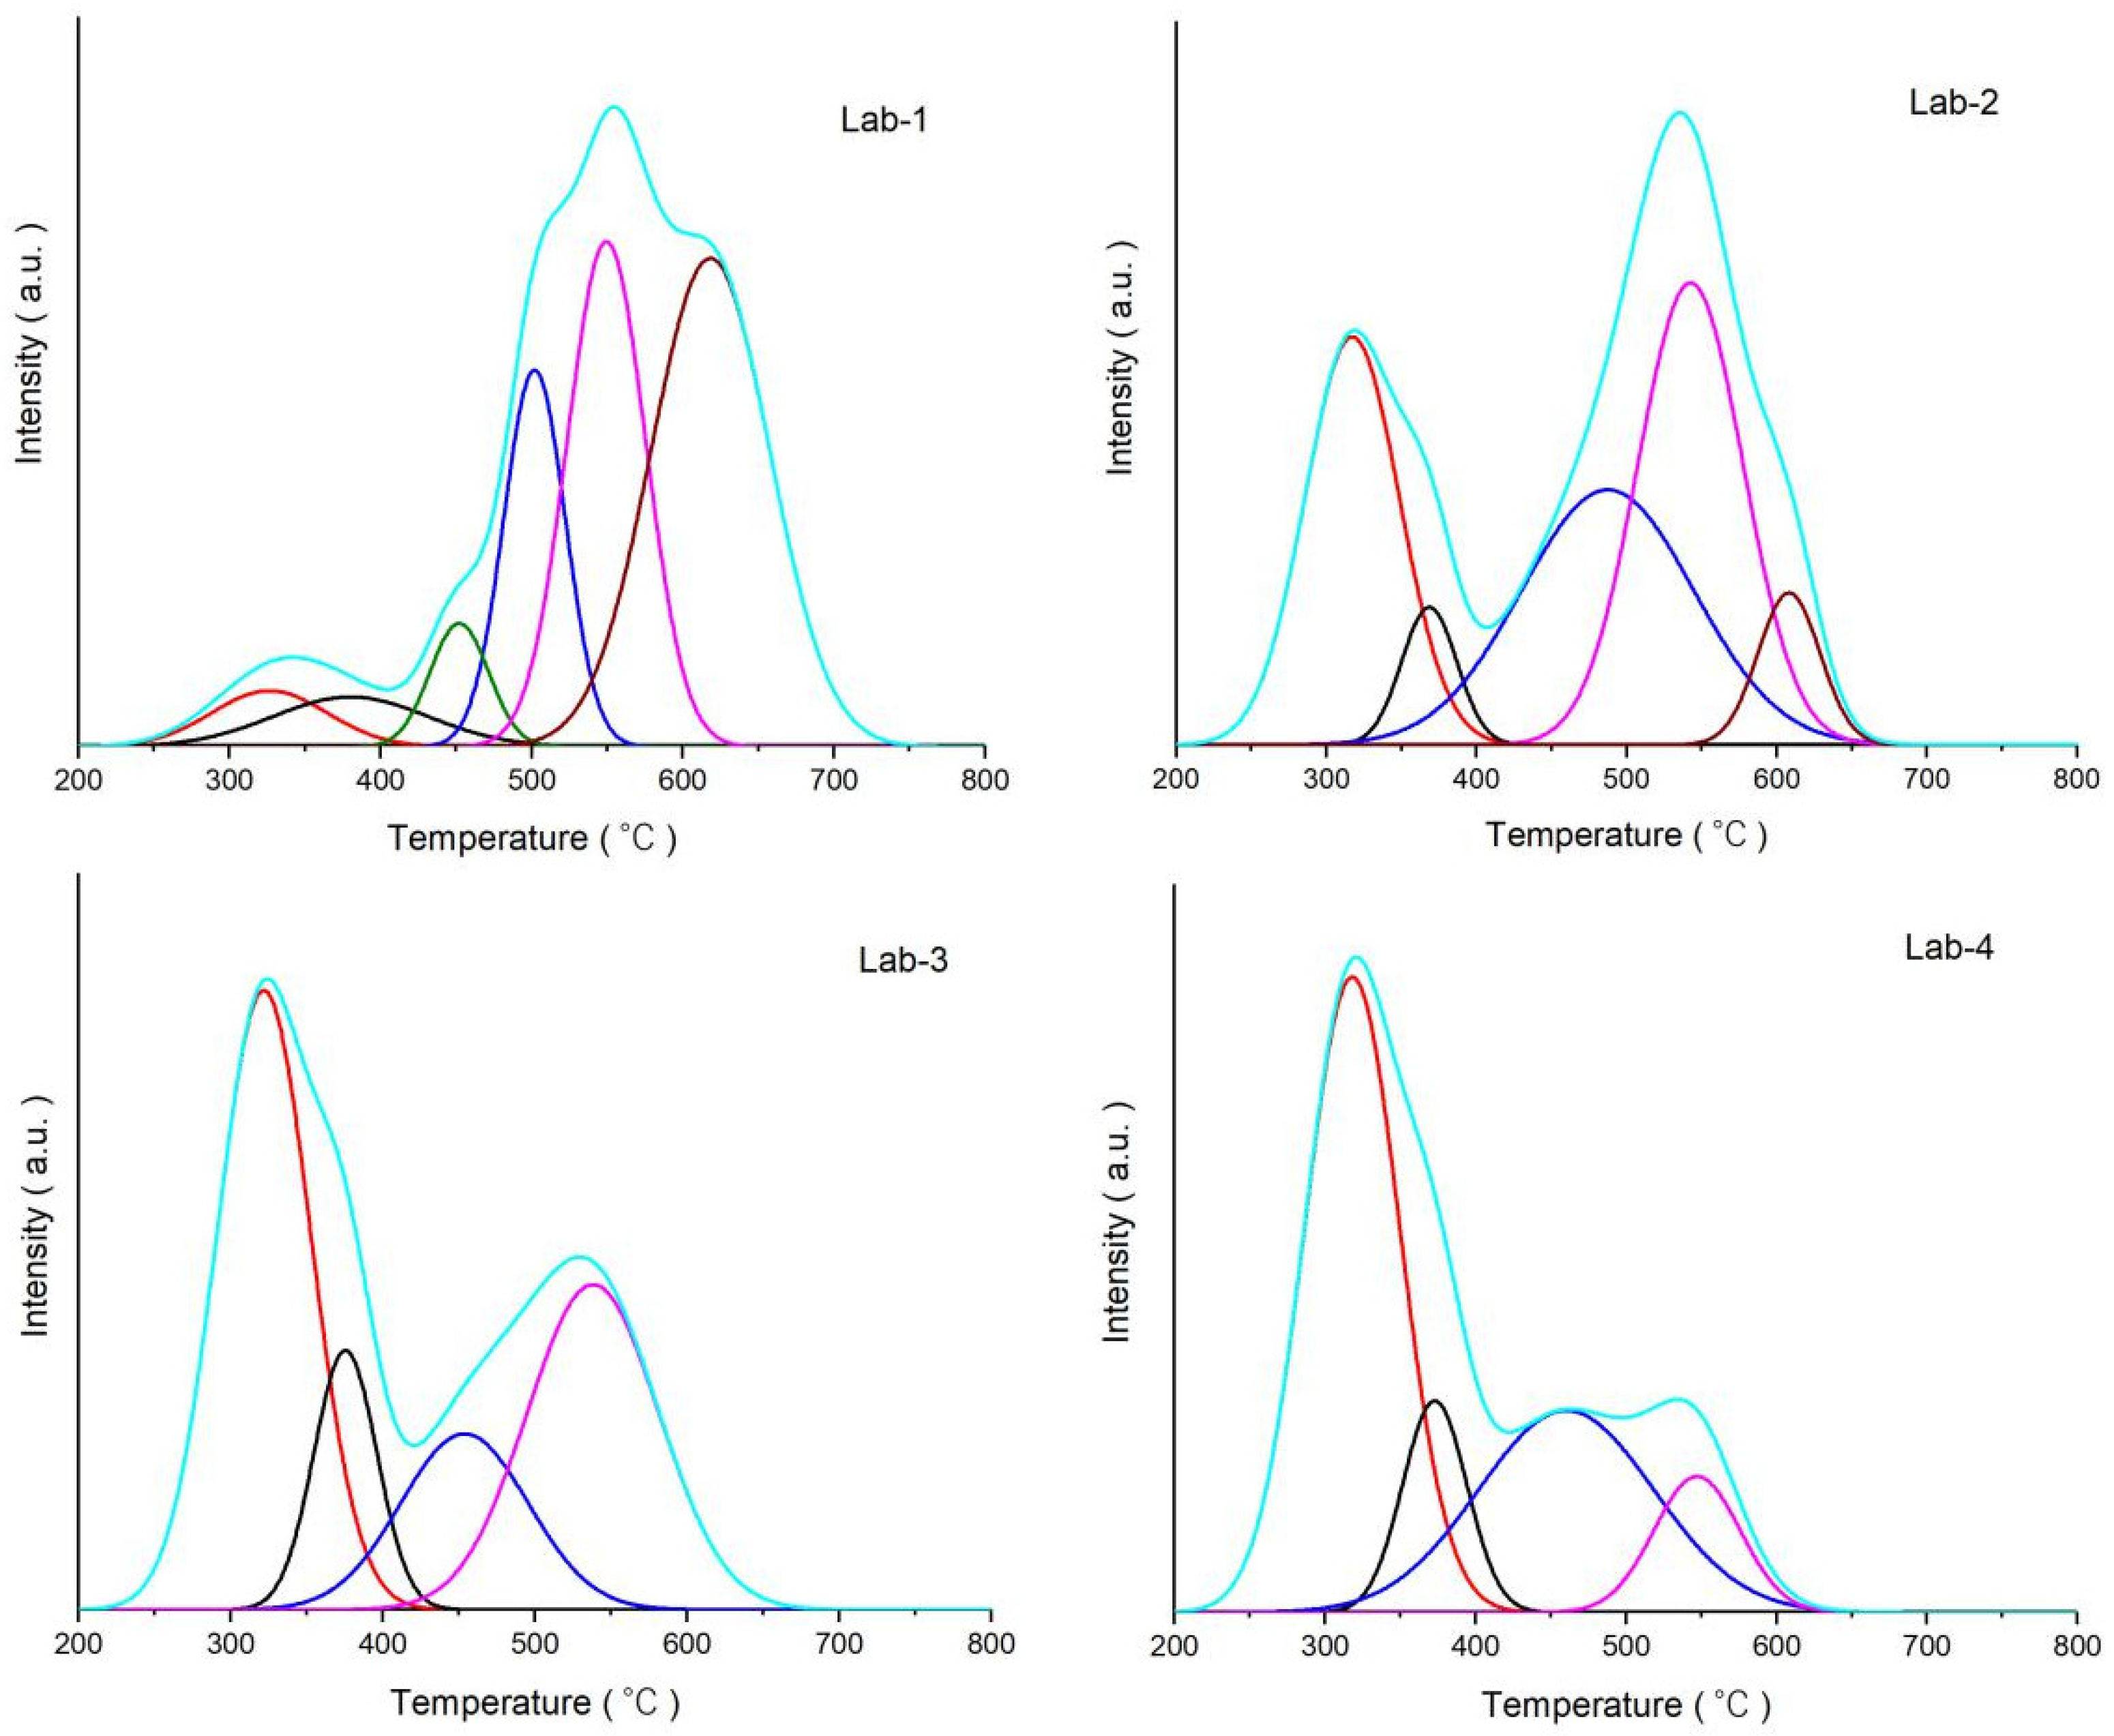
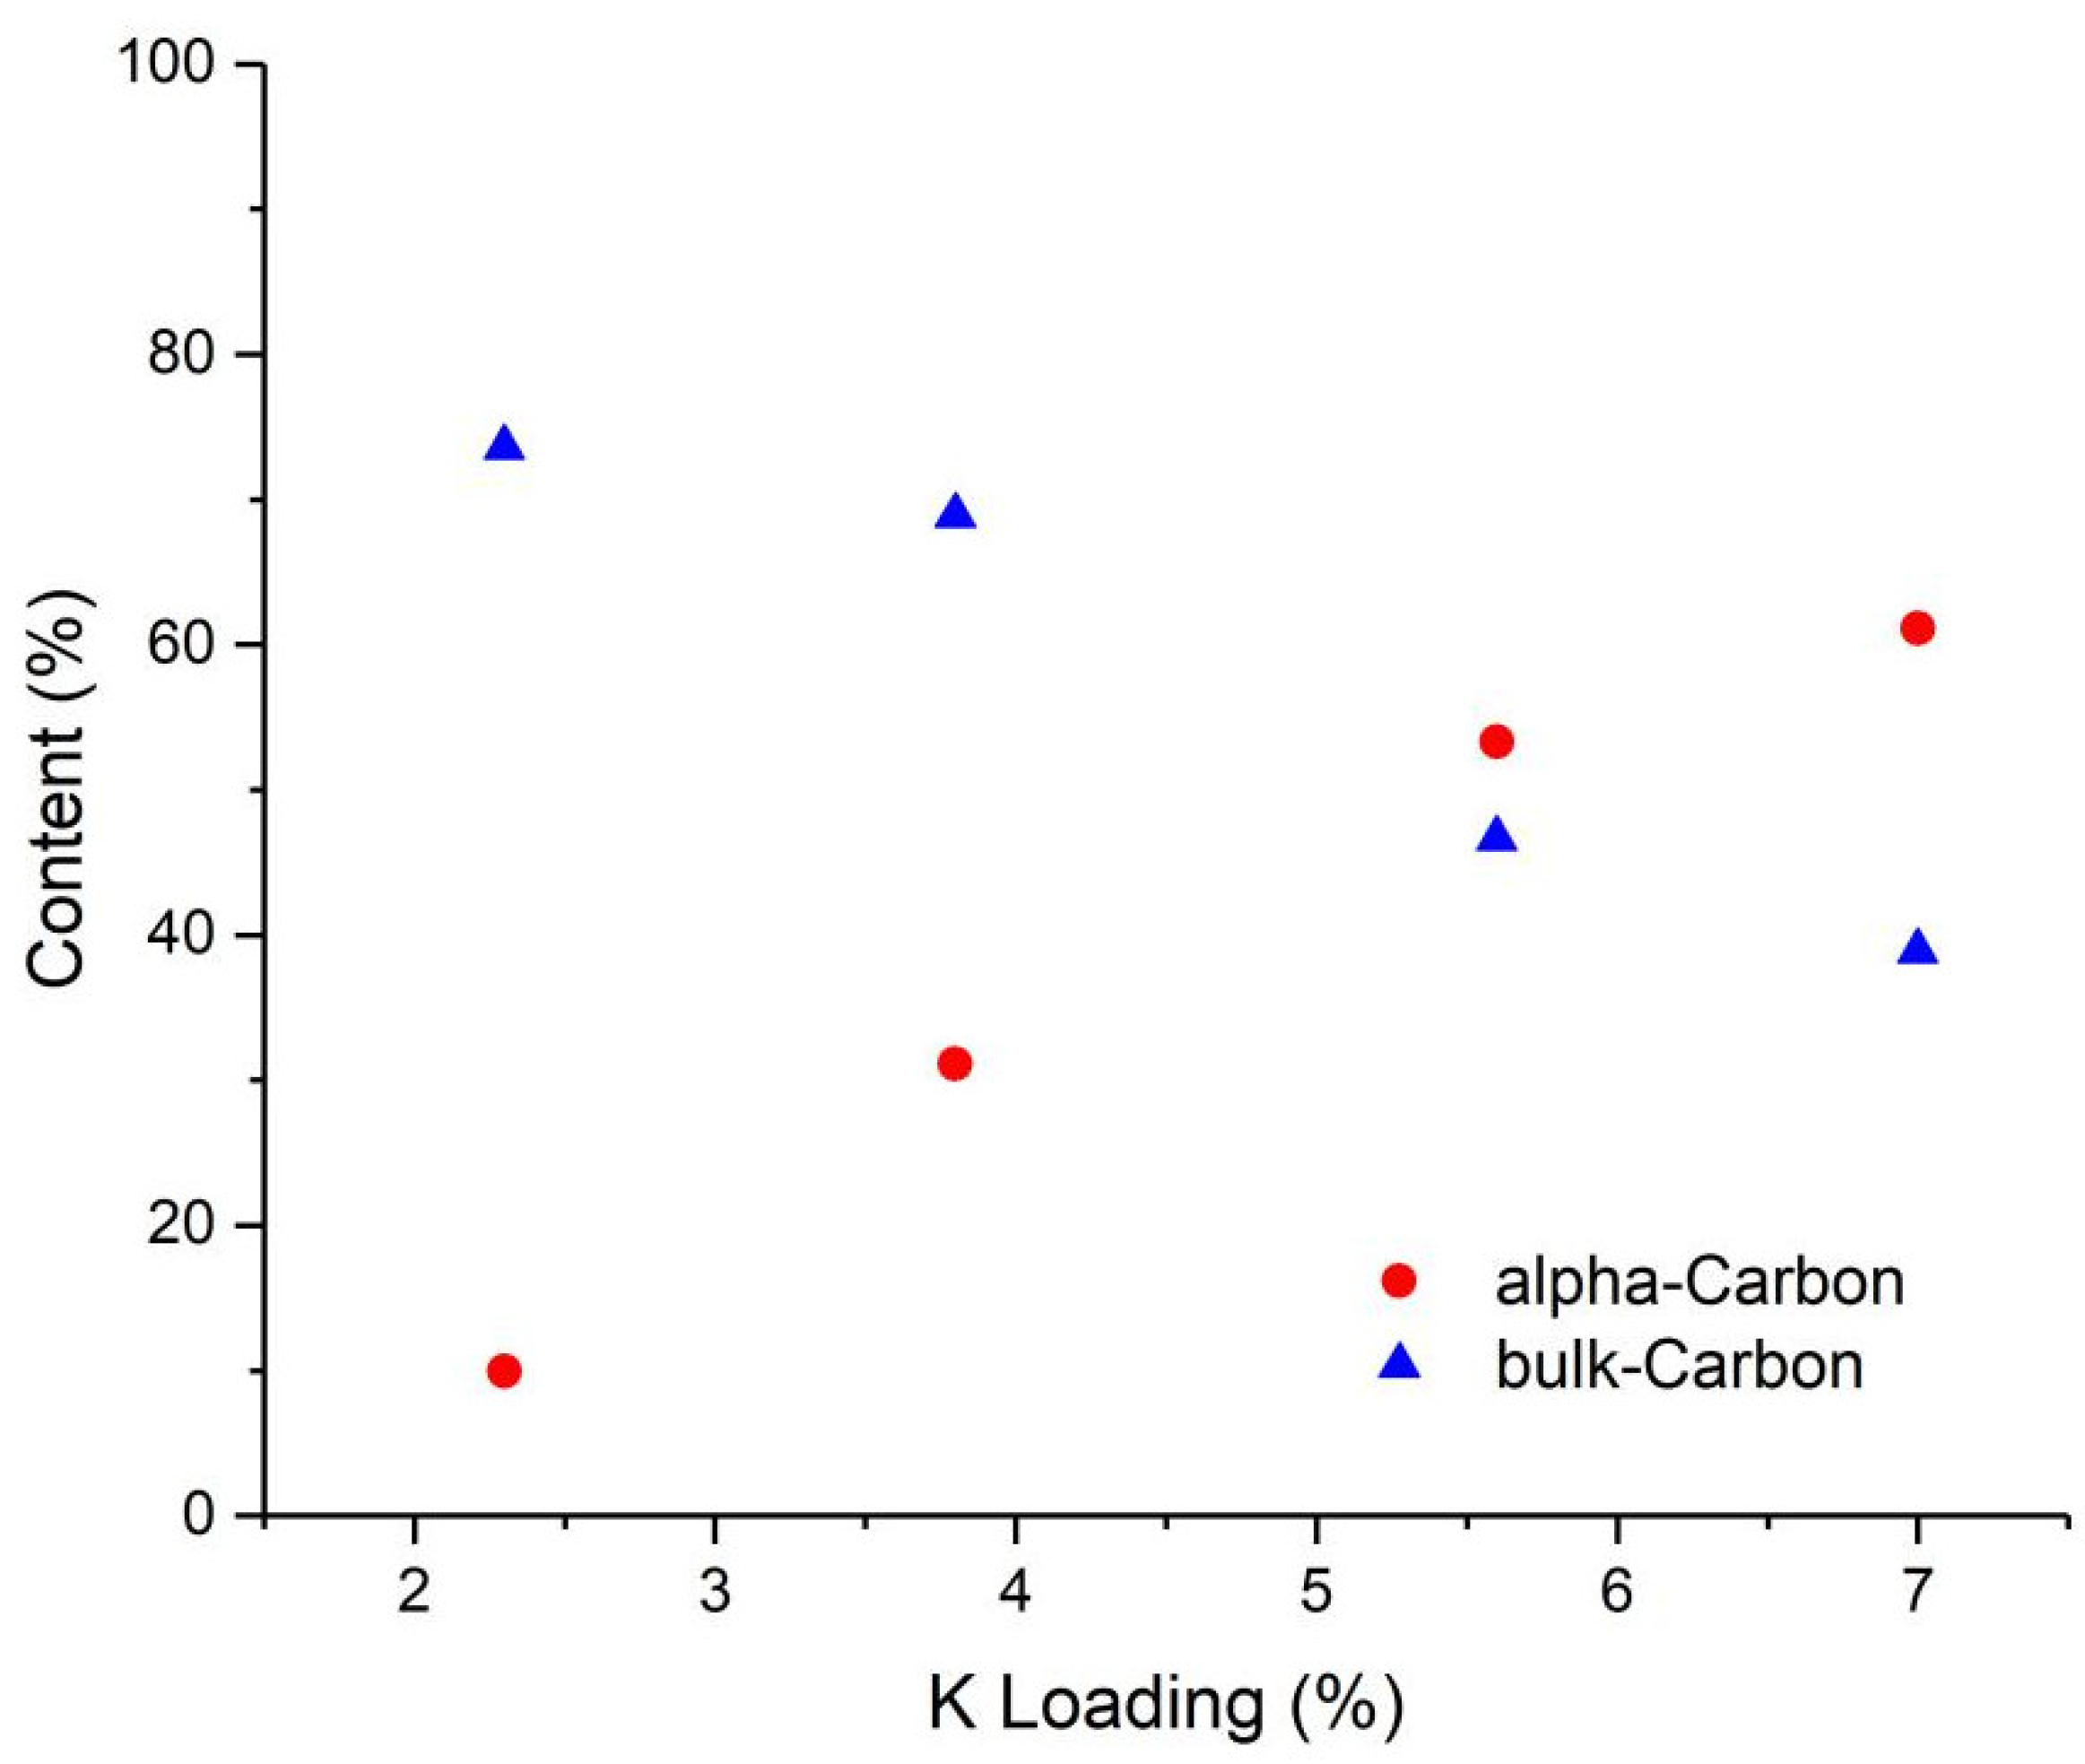
2.2. Effects of K Loading on Carburization of Catalysts

In situ XRD measurements were carried out to study the phase transformation of fresh samples during syngas reduction. XRD patterns at different reduction durations are shown in Figure 6. With the progress of reduction, the crystal phase of the samples gradually changed from FH phase to iron-carbide phase (χ-Fe5C2, the only detectable iron carbide species from XRD), and the crystallite size of χ-Fe5C2 calculated by (510) facet was remarkable with an increased K content.
The reactivity of iron carbide as well as other carbonaceous species induced from syngas reduction was further investigated by temperature-programmed hydrogenation (TPH). Gaussian fitting results of the TPH spectral line are given in Figure 7, and the attribution temperature range of carbon species is listed in Table 2. The carbon species were assigned to carbidic carbon (atomic C), amorphous carbon, β carbon (amorphous surface methyl chains or films) and bulk carbide carbon based on the previous literature [42,43]. The first two kinds of carbon (carbidic and amorphous), the hydrogenation temperature of which is below 390 °C, can also be recognized as alpha-carbon (alpha-C) [17]. None of graphite carbon, the hydrogenation temperature of which should be above 700 °C [42,43,44], was detected in the TPH profiles of the pre-carburized samples. The figure shows that the hydrogenation end temperature of the bulk carbide carbon in the Lab-1 sample reaches c.a. 700 °C, which is comparable to that of other samples, decrease with the increase in K loading. This may indicate that the bulk carbide carbon in the samples with higher K content can be hydrogenated at a lower temperature, as the peak temperature increases in the order of decreasing reactivity with H2 [43]. It has been reported that the addition of silica largely changes the adsorption sites of the iron-based catalysts, which can improve the adsorption strengths of H, C, and O on reduced or carburized catalysts [3].
It is noteworthy that the more K content in the sample, the more carbidic carbon (atomic carbon) is formed over it (see Table 3). It was reported that alpha-carbon is highly reactive and essential to FTS reactions to some extent [42]. Thus, the relationship of alpha-carbon and bulk carbide carbon with K loading is plotted in Figure 8. The relative content of alpha-carbon increased proportionally with the increasing K loading, while that of bulk carbide carbon was decreased.

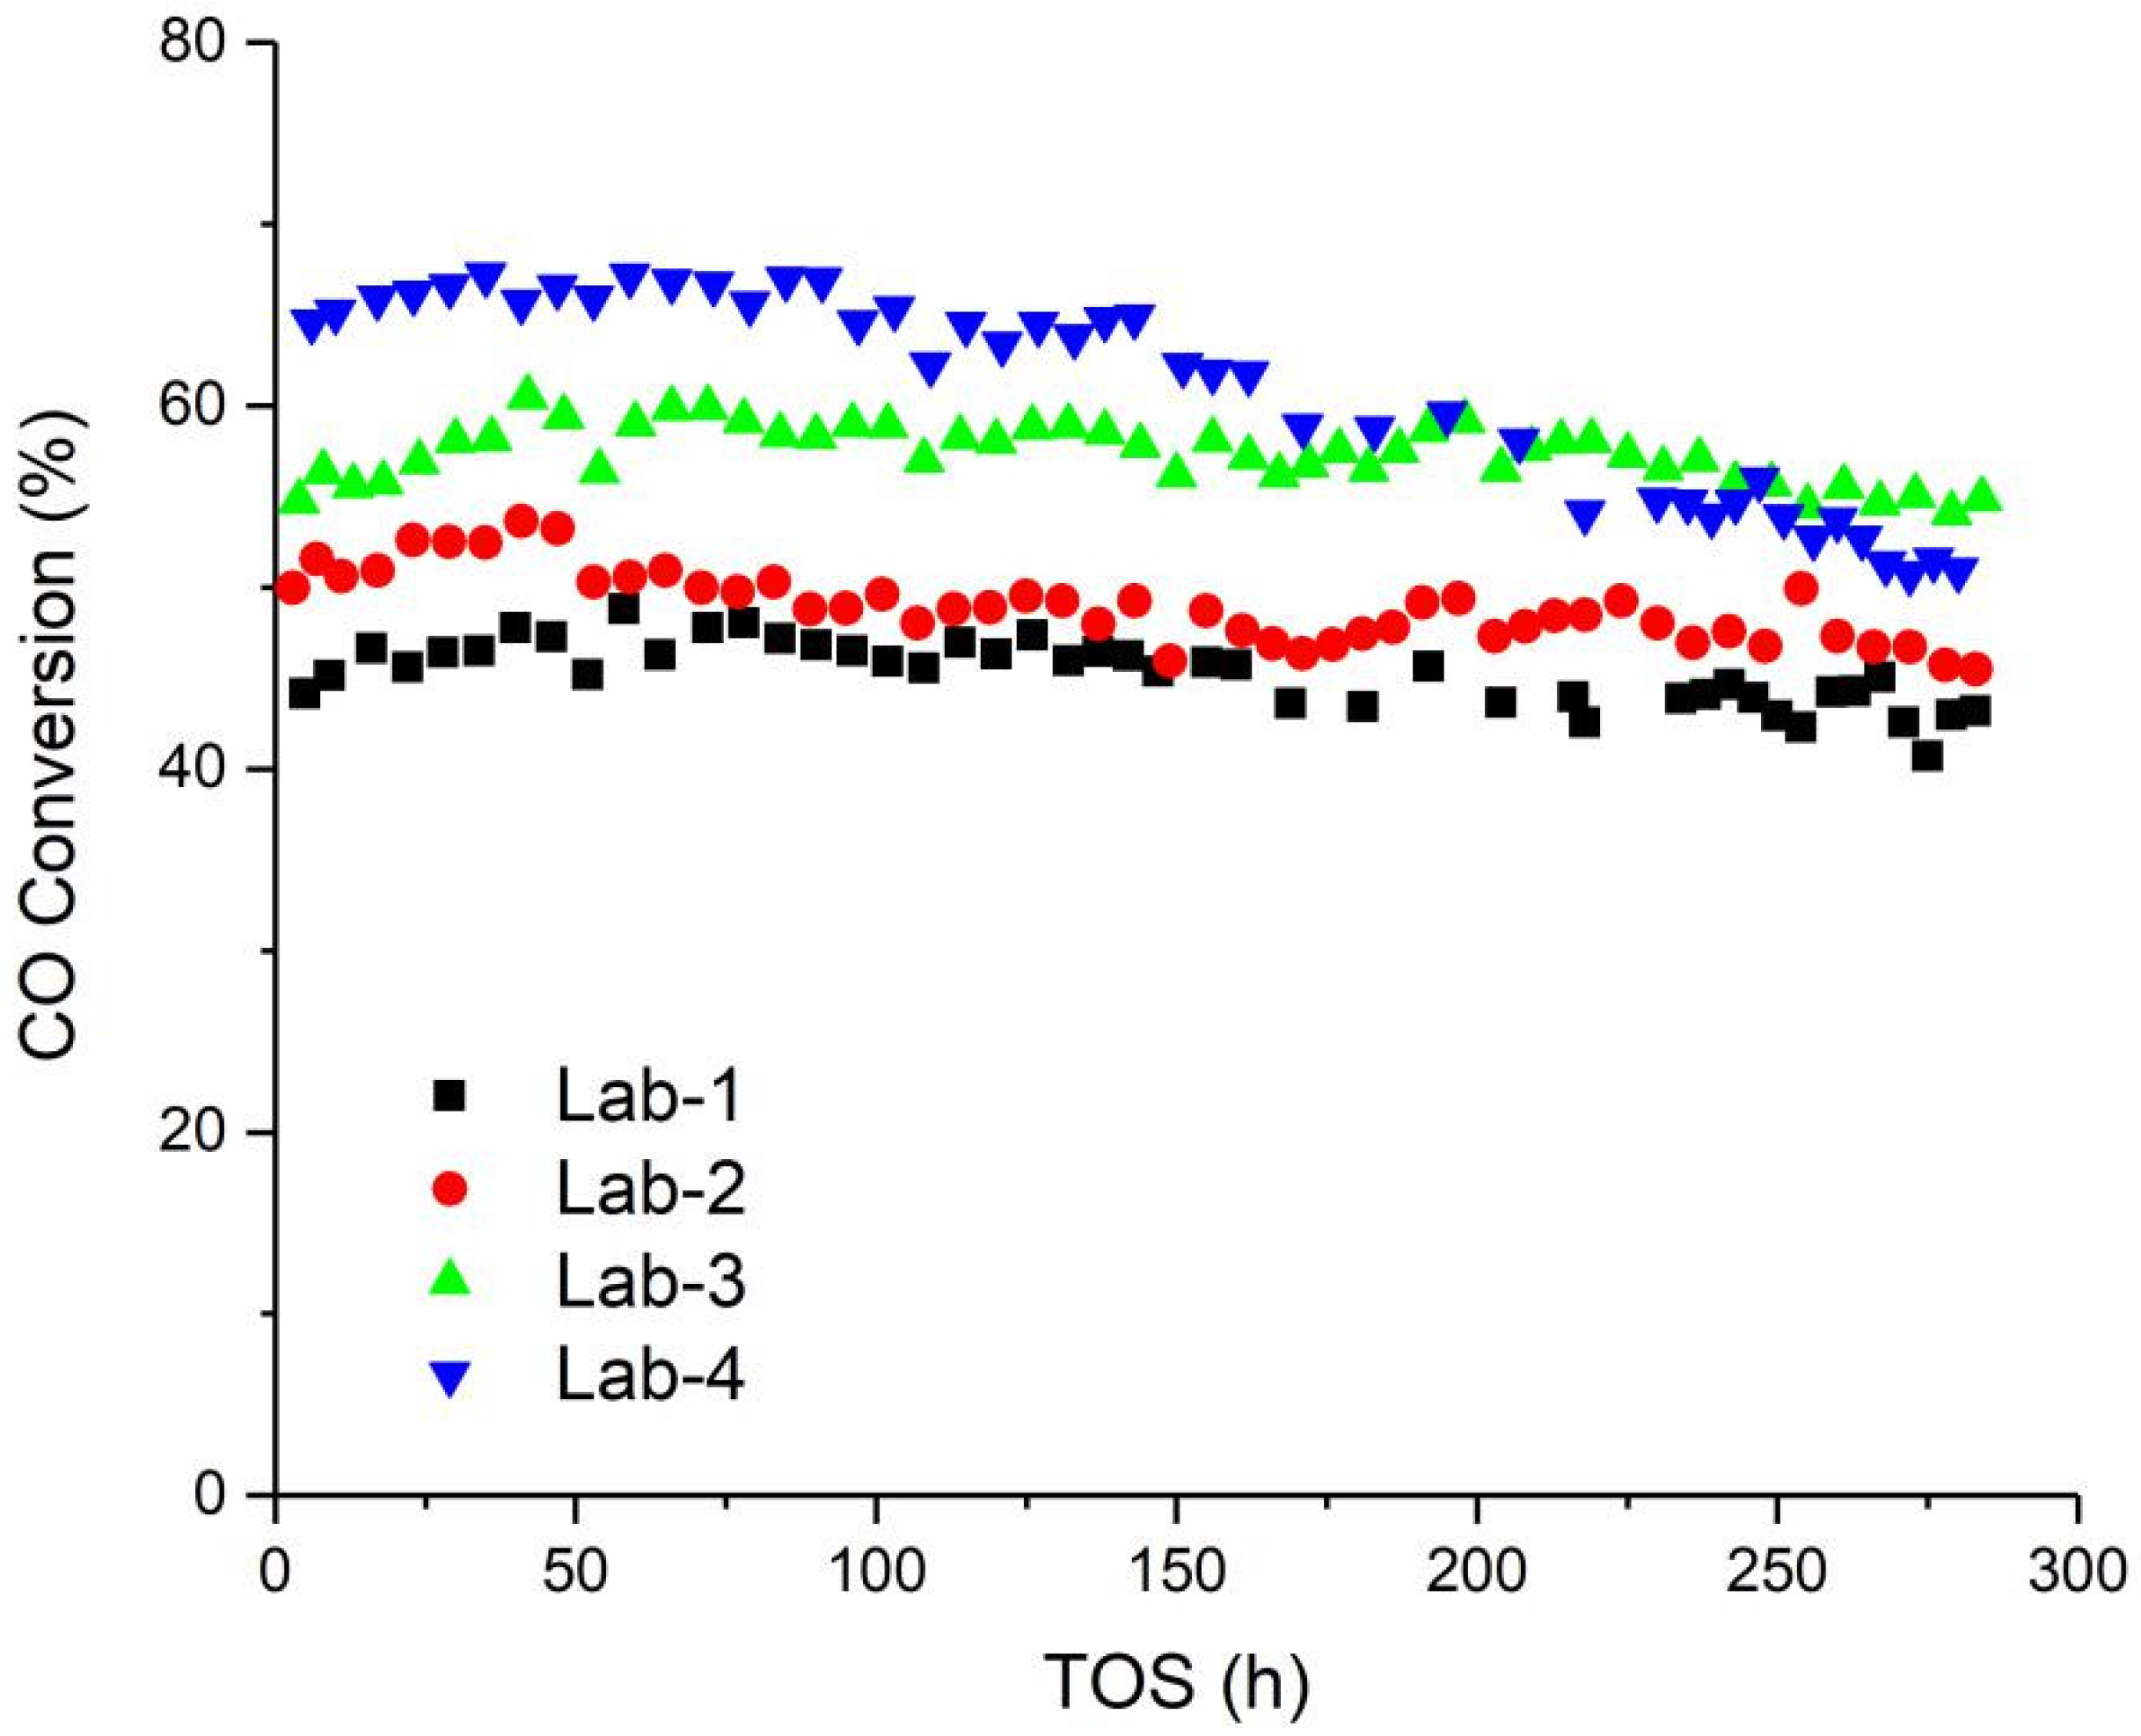
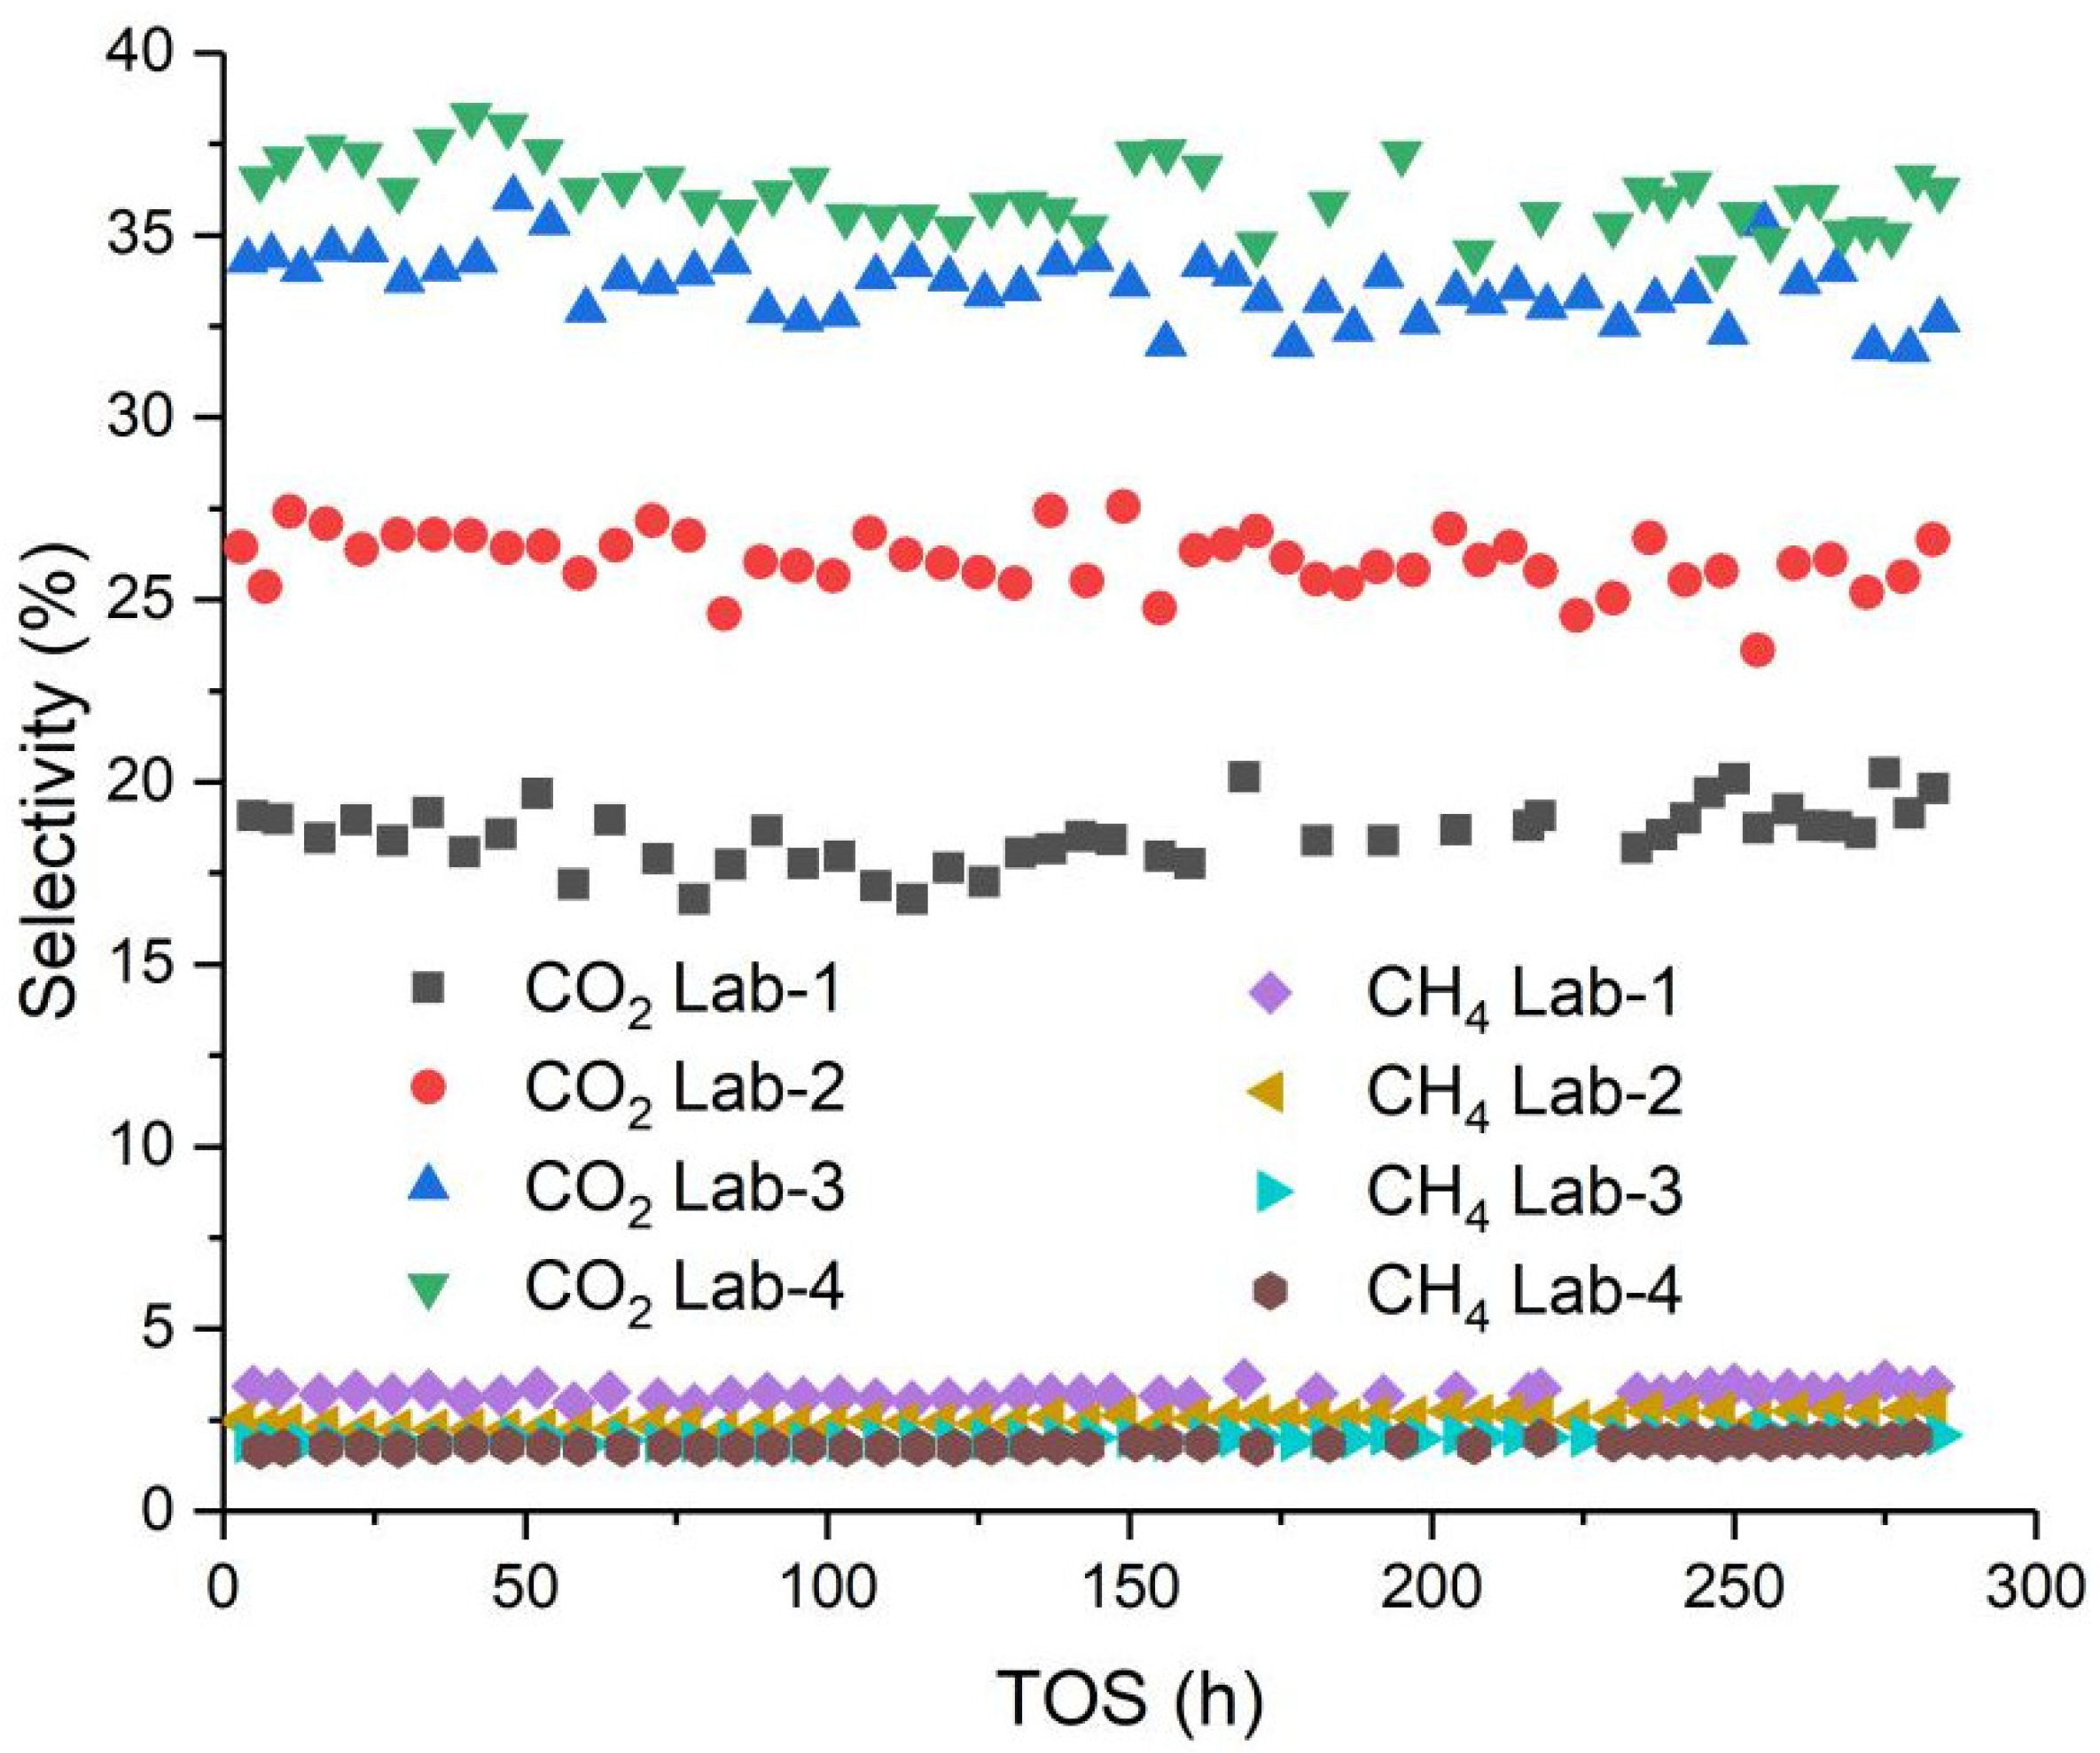
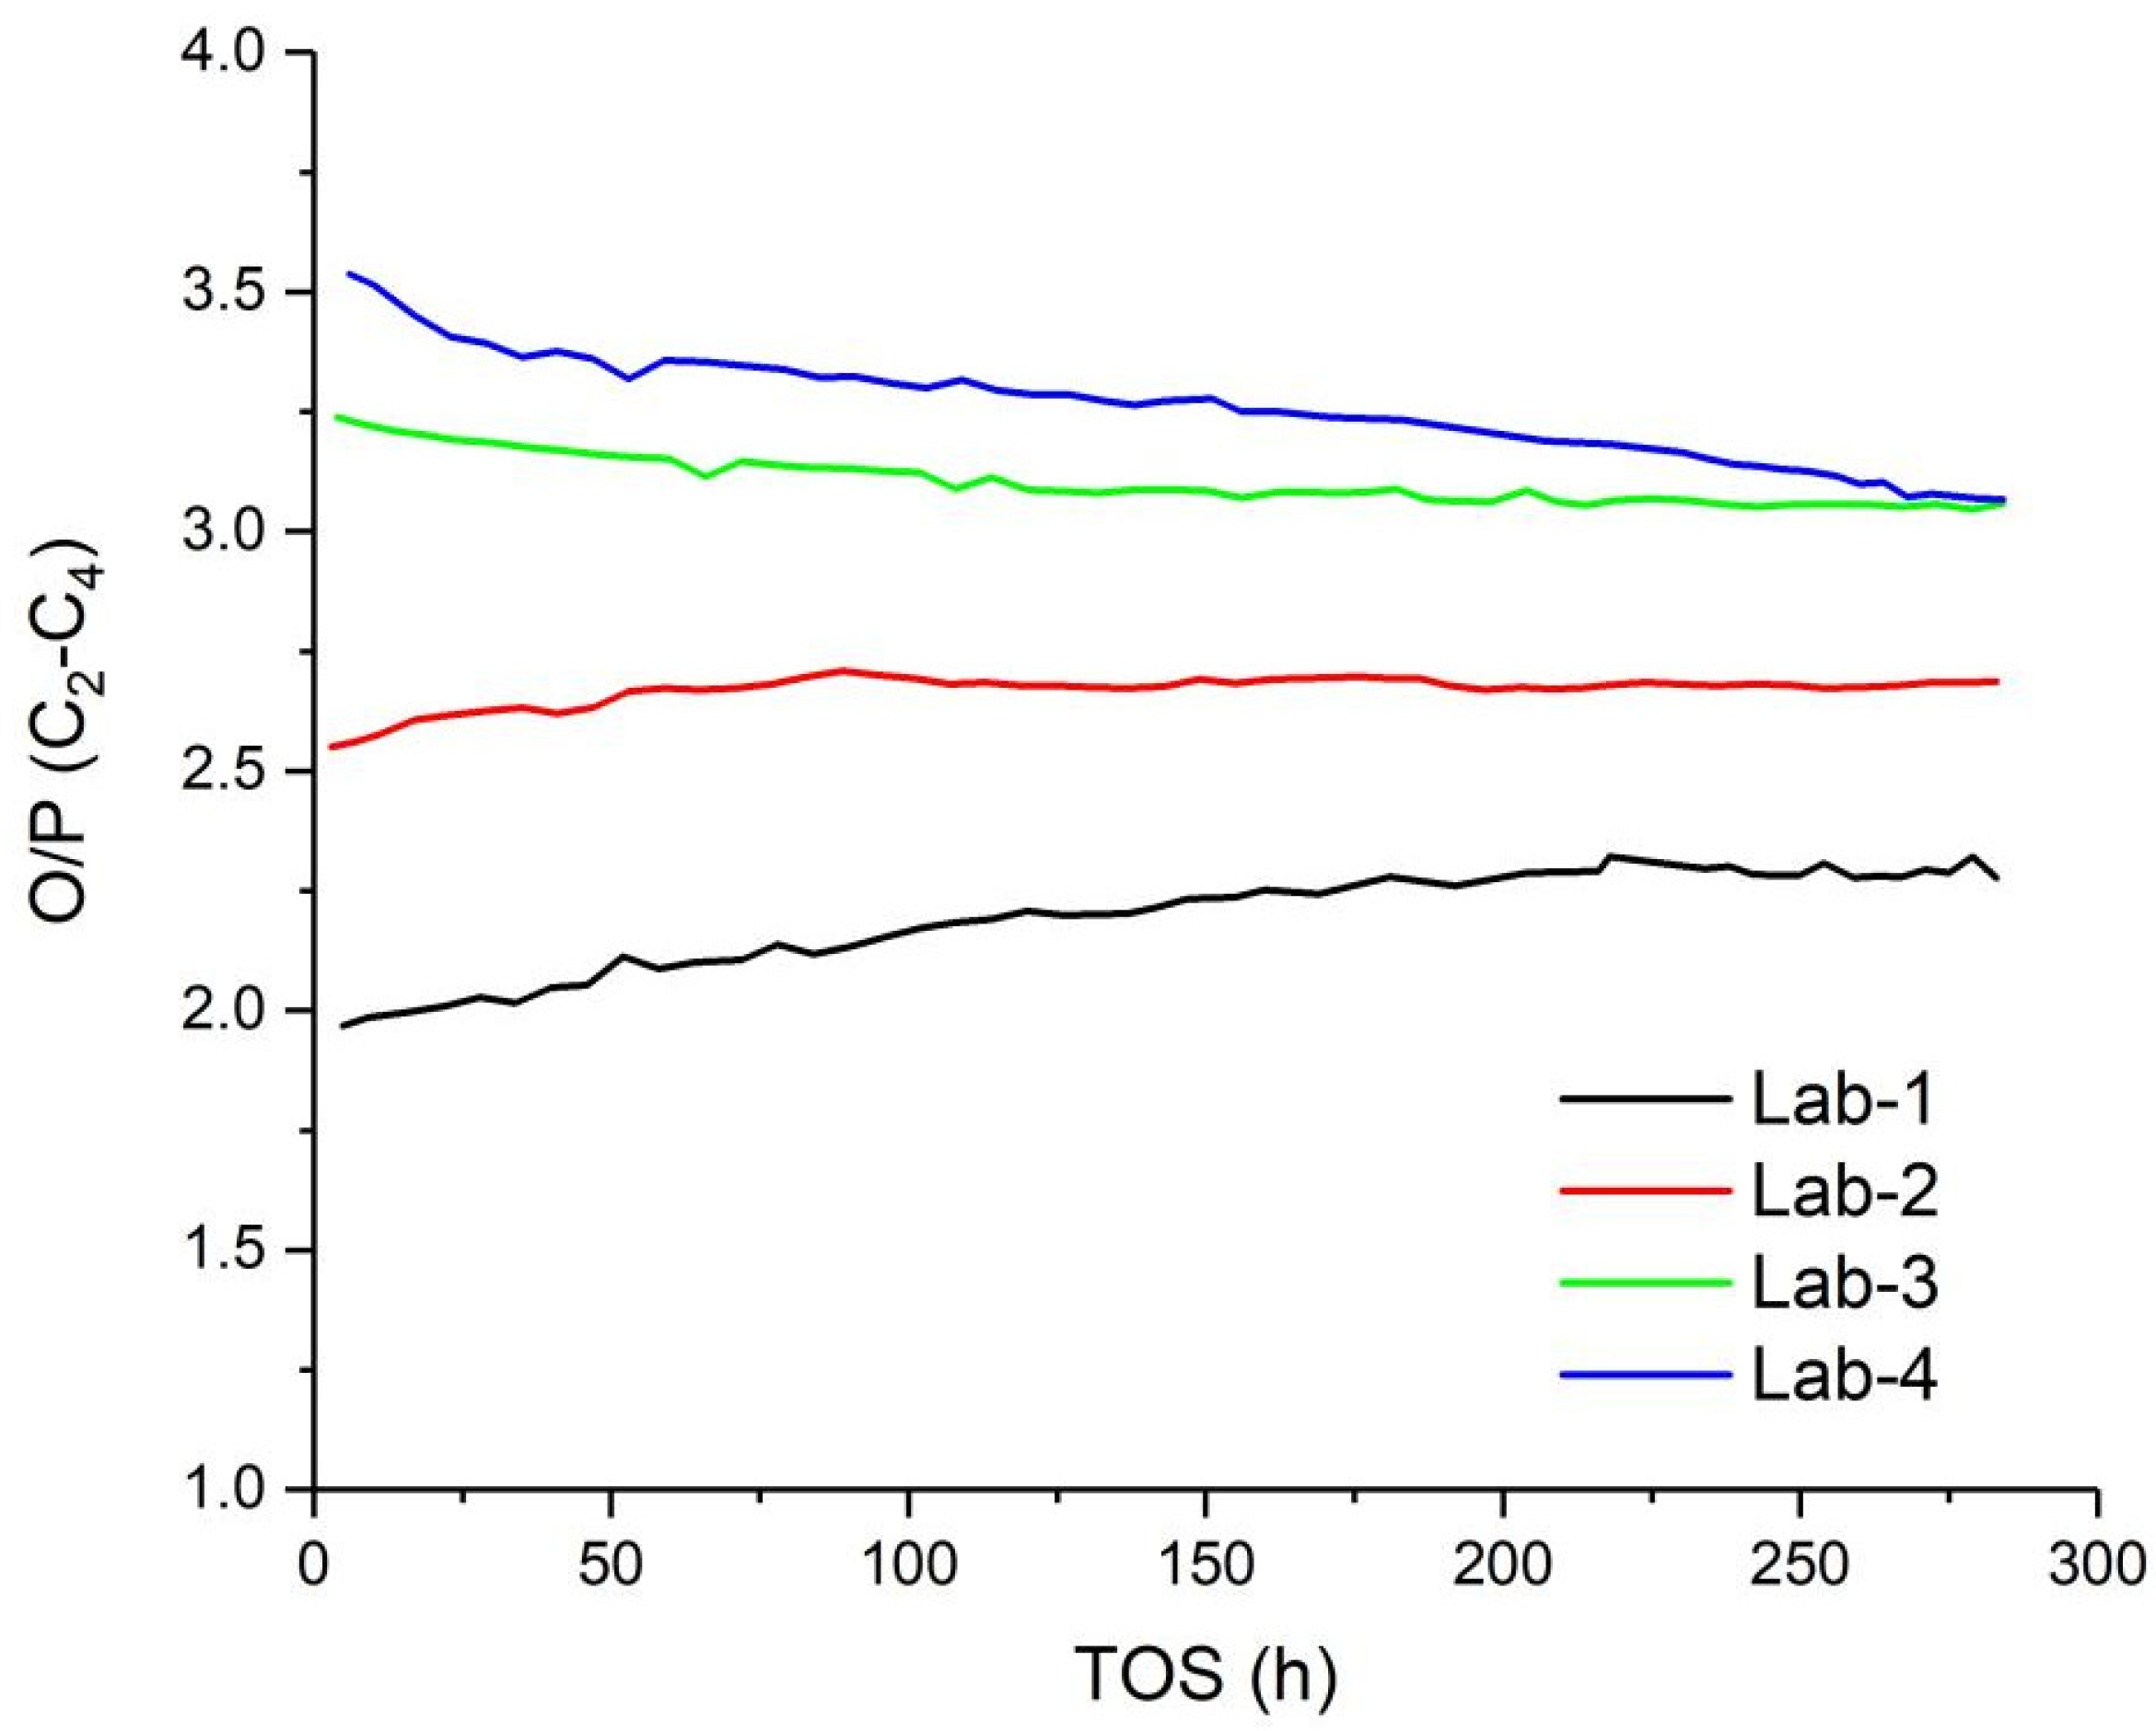
2.3. Fischer-Tropsch Synthesis Performance

The FTS performance of the four catalysts is illustrated in Figure 9. The initial activity increased progressively with increasing K loading. This might be attributed to the fact that increased reactive carbon can be achieved over the higher K loading samples after syngas reduction (see Figure 8). However, the deactivation of high K loading (Lab-4) was especially evident after approx. 150 h of TOS, and its activity decreased monotonically thereafter, dropping evenly to a lower level than that of Lab-3. In contrast, the activity of the remaining three samples was rather stable with TOS.
Carbon deposition over spent samples was characterized by Raman spectroscopy, and the results are given in Figure 10. The Raman spectrum of the graphite shows, respectively, a sharp band (G-band) and a broad band (D-band) at 1580 and 1360 cm−1. It is shown that the intensities of both the G-band and the D-band were strengthened with the increasing K contents (see inset pattern in Figure 10). The calculated ratio of I(D)/I(G) was in the range of 0.51–0.56, which is closer to the value of standard graphite materials reported in the literature [45]. Even though the I(D)/I(G) ratio is a little bit higher than the standard graphite material (0.37), the relatively higher I(G) to I(D) in the higher K loading may imply that the deposition of graphitic carbon was higher for the higher K loading samples. It has been reported that the deposition of graphite-like inert carbon over the catalyst surface gives rise to the deactivation of iron catalysts, especially the K-promoted one [9,11]. However, the results from the Raman spectra may be insufficiently responsible for the faster deactivation rate observed over the Lab-4 sample, which cannot explain the best stability in Lab-3.
The CO2 and CH4 selectivity of the catalysts are shown in Figure 11. Similar to the CO conversion activity, the corresponding CO2 selectivity of the sample with higher K is also higher, which seems likely to coincide with the theory of the electron-donating effect of the K promoter. However, it is noteworthy that the CO2 selectivity did not decrease proportionally with the decline in the CO-conversion activity of Lab-4 (7.0 K%), which indicates that the declining activity of Lab-4 (after approx. 150 h) is mainly due to the loss of FTS reaction performance. This was further manifested by the olefin-to-paraffin ratio in the hydrocarbon products.
Figure 12 shows the olefin-to-paraffin ratio (O/P) in the C2–C4 section. It is clear from the figure that, with the increase in K loading, the O/P ratio increased in a stepwise manner during the initial periods of the FTS reaction, where the maximum value approached approximately 3.5 for the highest loading (Lab-4). However, the O/P ratio over this sample decreased obviously after approx. 150 h TOS, which coincides with the decline in CO conversion. Combined with the methane selectivity, the lower K loading samples exhibited a higher hydrogenation activity, which easily acquires the chain terminals of the hydrocarbon products during FTS. The effects of K hindering H2 dissociation and adsorption on iron-based catalysts have been reported [8]. This evidence implies that, even though the increase in K content is beneficial to increasing the olefin/paraffin ratio in the early stages of FTS reaction, a steady-state conversion activity is more important.

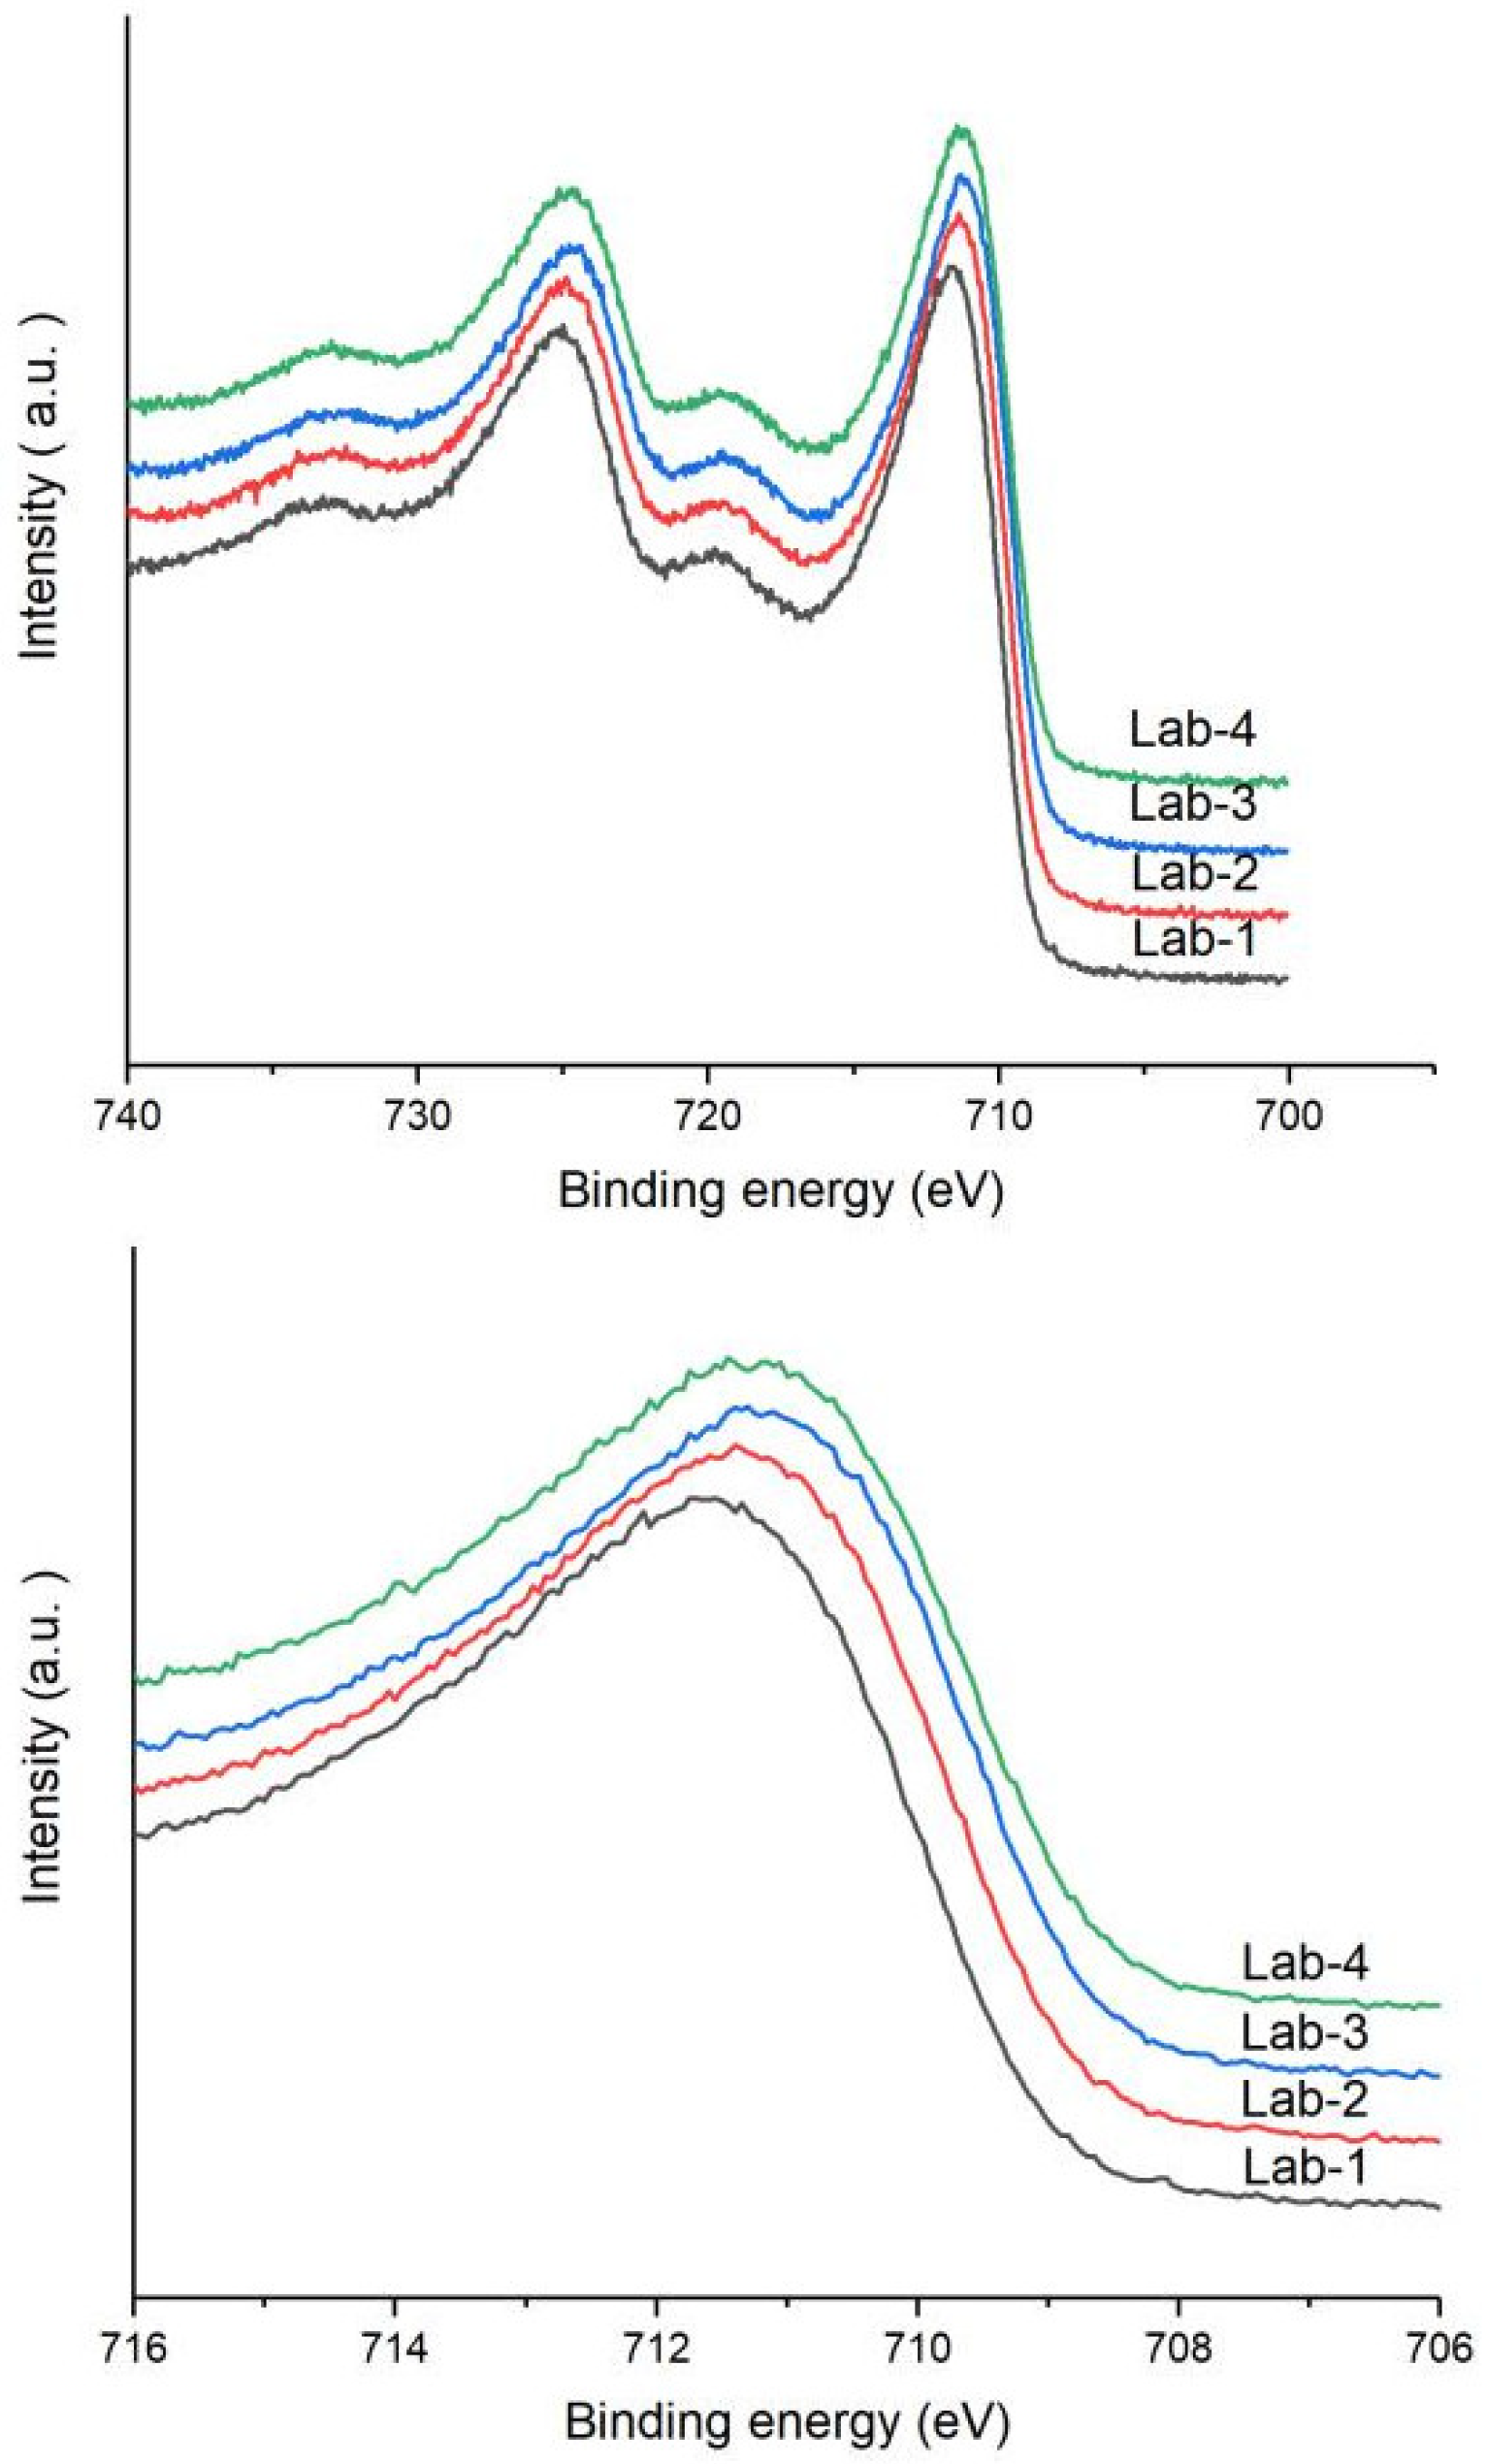
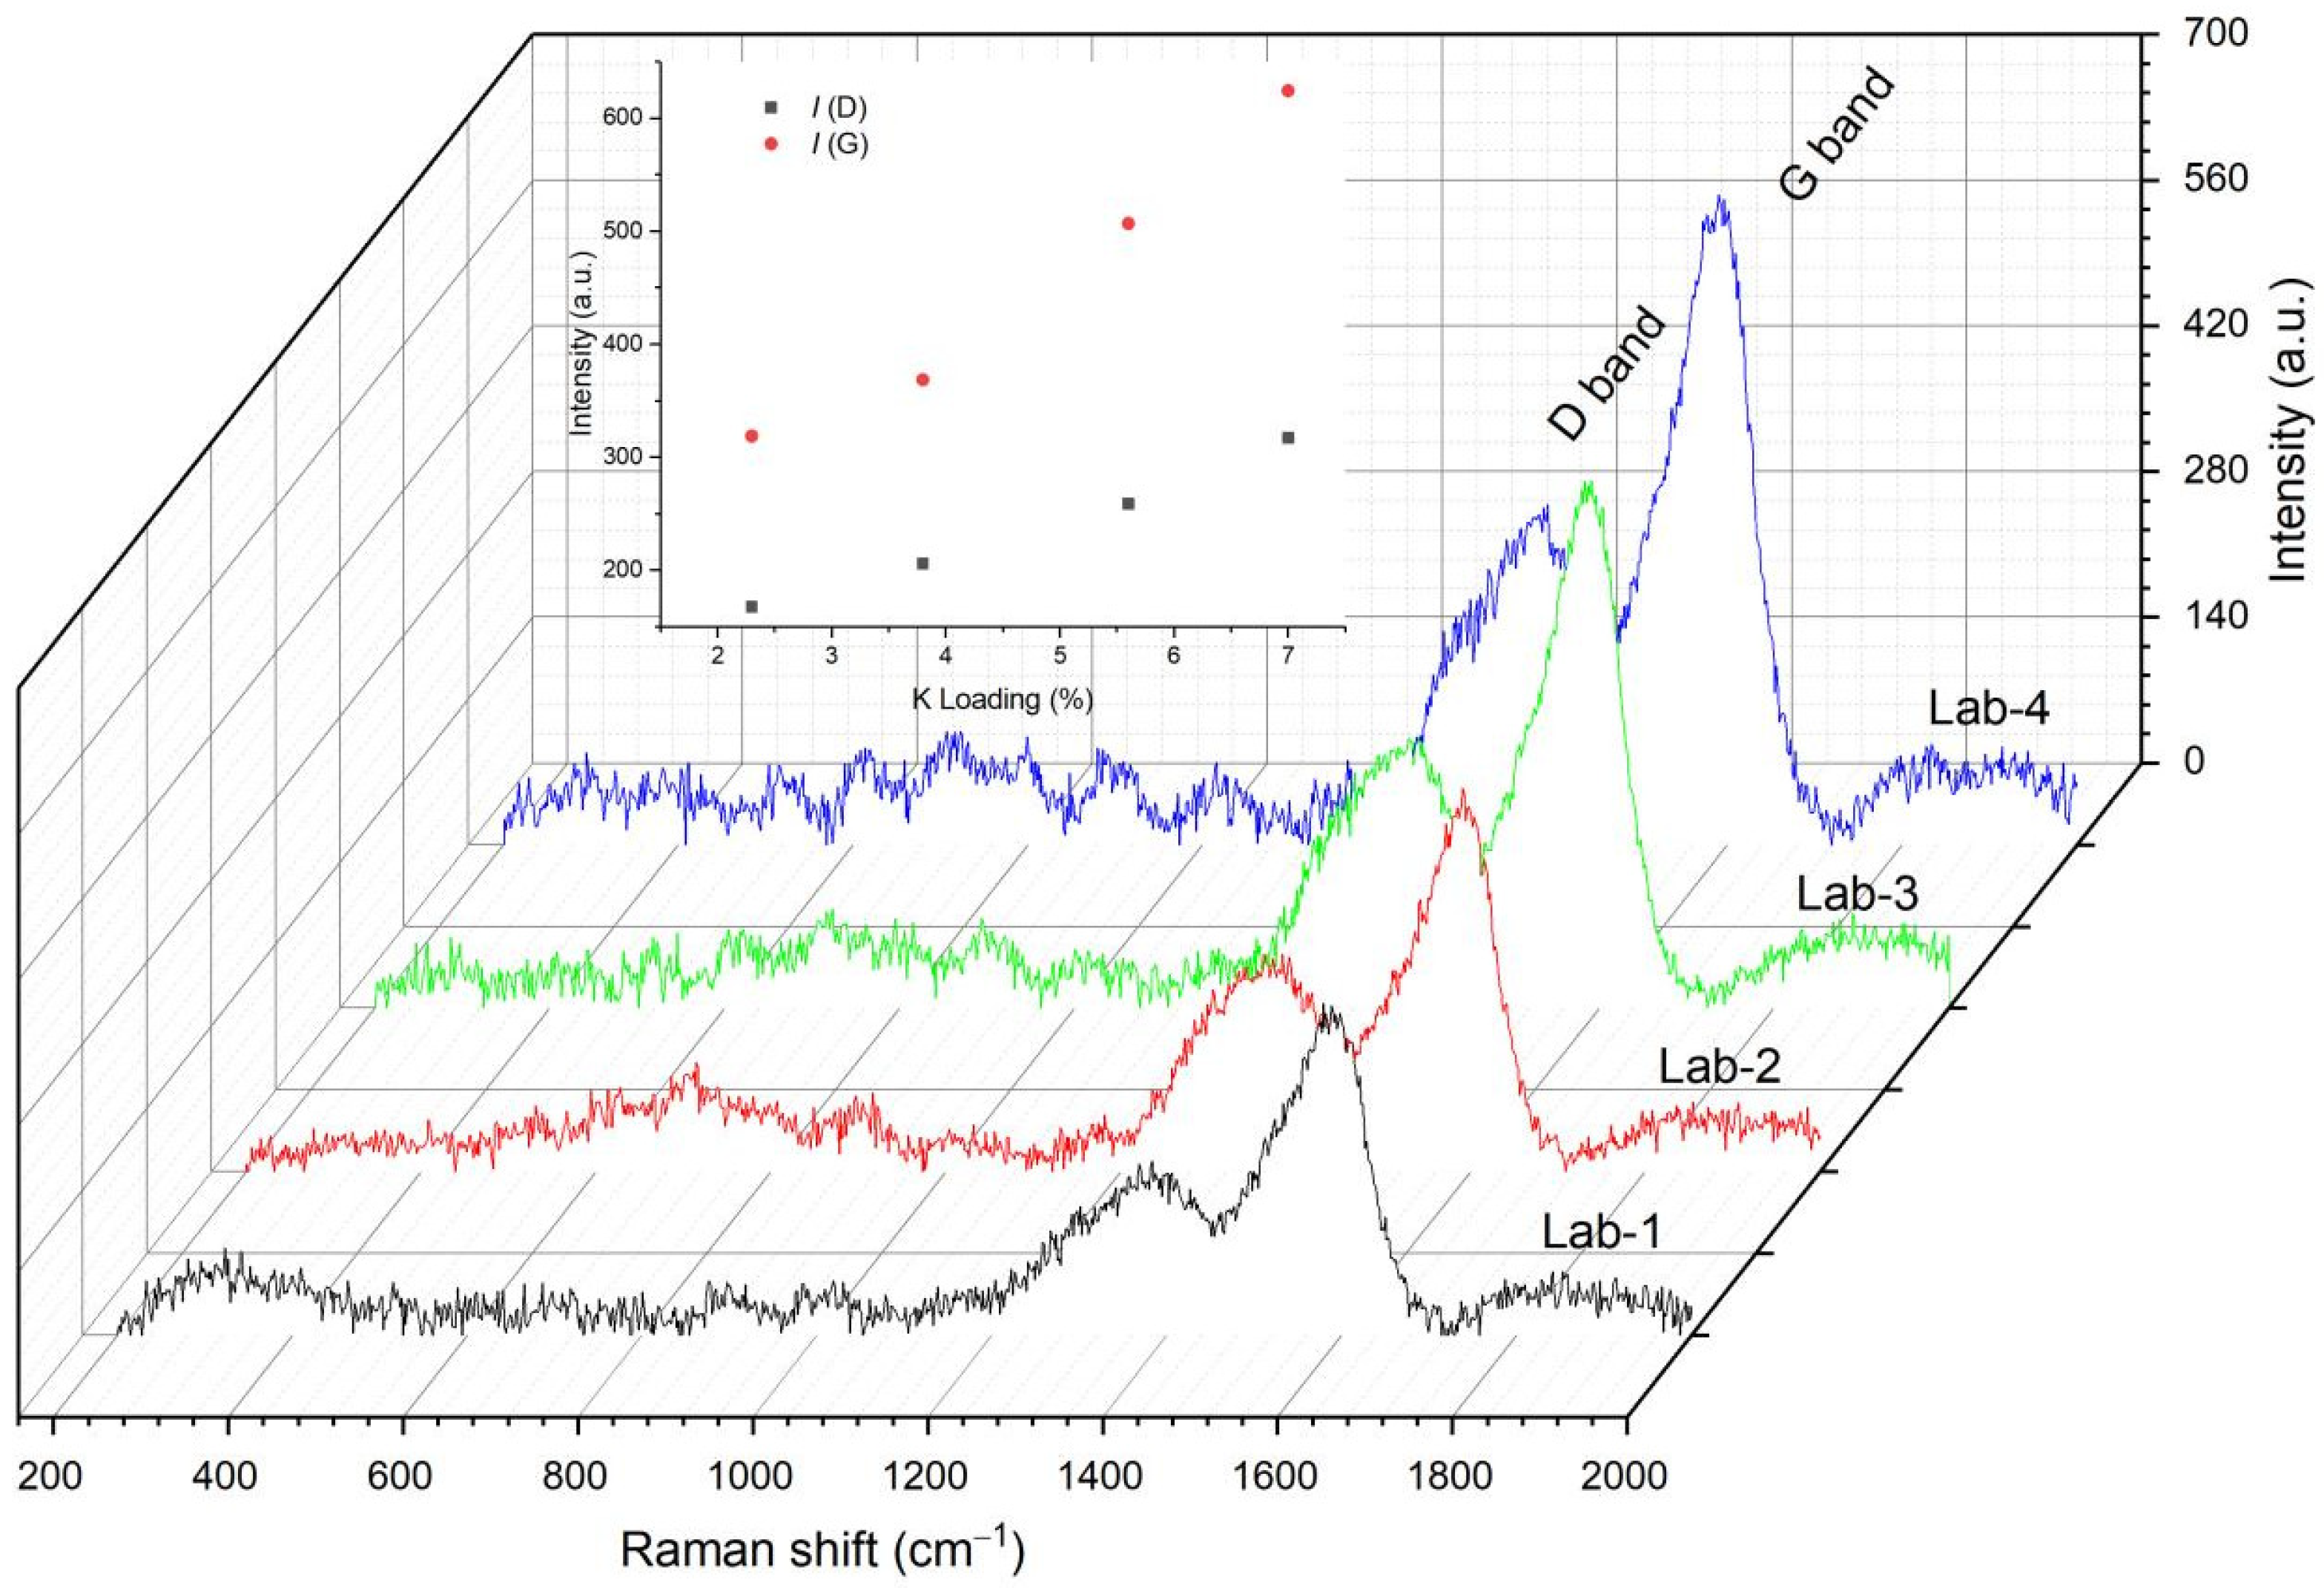
2.4. Characterization of Spent Catalyst Samples

The chemical structures of the four spent samples was also investigated by ATR-FTIR (see Figure 13). The infrared spectra of the samples changed noticeably compared with those of the fresh precursors (see Figure 2). The common point is that the absorption peak of the Fe-O bonding with the characteristic of low-crystalline FH located at 400–750 cm−1 becomes more obvious. One visible shoulder peak at ~717 cm−1 emerged, which is the absorption band of the Fe-O in the FH [26], at the expense of the shoulder peak located at 690 cm−1 in fresh precursors. The intensity of the strong absorption peak corresponding to Fe–O–Si in the FH structure at 800–1200 cm−1 is relatively weak, and all of the wave-number of the main peak maxima are centered at ~945 cm−1. The difference is that in the spectrum of Lab-1, the peak intensity (551 cm−1) caused by Fe-O absorption is significantly stronger than that of the other three samples, and a new strong band was observed at ~866 cm−1. The strengthened peak intensity of Lab-1 at 551 cm−1 implies that a greater Fe-O bond emerged in the chemical structure of the spent catalyst sample. Meanwhile, according to the literature, an absorption band with the characteristic of a pure Fayalite (Fe2SiO4) occurs at an IR frequency of 870 cm−1 [33,46]. Therefore, the adsorption band here at 866 cm−1 can tentatively be assigned to Fe2SiO4. It can be envisaged that after c.a. 280 h of FTS reaction, the infrared spectrum shows a characteristic peak of the SiO32− group (in the range of 700–750 cm−1) in all four spent samples, while the obvious absorption peak with the characteristic of Fe2SiO4 appears in the sample with the lowest K content, over which the Fe2+ ion should be stabilized by the strong Fe–O–Si interaction.
XRD patterns of the spent catalysts are given in Figure 14. The strong diffraction peaks at 2θ = 36.5°, 39.5°, 40.3°, 45.8, and 60.0° are ascribed to the diffraction of quartz beads (SiO2) (JCPDS card 46-1045). The peaks at 40.8, 41.1, 43.4°, 44.2°, 45.1°, 45.8°, 47.3° and 58.3° can be attributed to the characteristic diffraction of Hägg carbide (χ-Fe5C2) (JCPDS card 89-2544). As the result of searching the JCPDS databases, we found that χ-Fe5C2 is the single iron carbide phase of four spent samples. The peaks at 30.1°, 35.5°, 37.1°, 43.1°, 53.5°, 57.0° and 62.6° were attributed to the characteristic diffraction of Fe3O4 (JCPDS card 65-3107). Furthermore, the XRD profile of the spent Lab-1 catalyst is quite different from the others, which shows clear characteristic diffraction at 31.7°, 34.1°, 34.2°, 35.0°, 35.9°, 37.3°, 39.1°, 51.5° and 61.2°. These peaks are attributed to the characteristic diffraction of Fayalite (JCPDS card 09-0307). Evidently, a crystal-like Fayalite compound was formed in the Lab-1 catalyst during the period of FTS reaction, but it did not show up in the other three samples. It was reported that the formation of the ferrous silicate compound could only be brought about when an intimate contact between the support and the iron precursor was achieved [47]. This supports the IR and H2-TPR results from fresh precursors, where the iron–silica interaction between Fe–O–Si is considered stronger for the sample with lower K loading. The result is further in good accordance with the infrared spectrum results of the spent catalysts.
In addition, the crystallite size of χ-Fe5C2 over the spent samples in accordance with the (510) plane and that of the fresh samples are depicted in Table 4. Apparently, the crystallite growth of the iron carbide calculated by (510) facet was obvious in accordance with the increasing K loading. This is consistent with the result from in situ XRD in the syngas reduction in the fresh samples. Thus, the iron–silica interaction is evident in the size diameter and shows that for the highest K loading sample (7 K%), the crystallite sizes increased by a factor of four.
The iron-phase composition of each of the spent catalysts was further determined by MES at an ambient temperature. The Mössbauer spectra are shown in Figure 15. MES parameters of various phases are deduced from the figure, and their relative contributions to spectral absorption areas are listed in Table 5 and Figure 16. As revealed in Figure 15 and Table 5, the MES line of each sample is the result of the superposition of at least six sub-spectra including three doublets associated with the different iron sites. The two doublets with 0.339 mm/s < IS < 0.3598 mm/s, 0.602 mm/s < QS < 1.147 mm/s and without magnetic hyperfine splitting contribute to the Fe3+ sites (superparamagnetic, spm) [21,48] and the FH phase [23,49]. More precisely, the higher and lower QS values with near-identical IS values can be attributed to the Fe3+ ions located on the surface and in the bulk of the crystallites, respectively [48]. The subspectra with both magnetic hyperfine splitting and quardrple splitting, where Hhf in the range 45.59~50.23 T, contribute to the A (tetra)/B (hexa) of two different sites of the ferrimagnetic Fe3O4 phase [3,48]. Those with 0.20 mm/s < IS < 0.40 mm/s and 18.54 T < Hhf < 20.579 T correspond to the two different sites of the stoichiometric iron carbide (χ-Fe5C2) [3,48,50]. The results in Table 5 and Figure 16 show that the relative content of the iron carbide phase (χ-Fe5C2) increased from 13.38% (Lab-1) to 25.03% (Lab-4) with increasing K content.
Interestingly but unexpectedly, the subspectra of the remaining doublet with the characteristics of Fayalie are observed in the MES spectrum of all spent samples. According to the literature, the crystal-like structure of Fayalie (Fe2SiO4) is orthorhombic and consists of an approximately hexagonal close-packed arrangement of the oxygen atoms, silicon occurring at the tetrahedrally coordinated position, and iron located at two octahedral coordinated positions and shows relatively higher IS and QS values in MES measurements [21,51]. Generally, the isomer shift for iron cations with lower oxidation states is higher, while their different spin states could be differentiated with the help of quadruple splitting values. There have been several research works observing these kinds of higher values. Haiyun Suo et al. associated the subspectrum with IS = 1.33 mm/s and QS = 2.93 mm/s with crystalline fayalite (Fe2SiO4) [3]. In an earlier work, A.F.H. Wielers et al. reported that a direct formation of a Fe2+ compound with MES parameters (IS = 1.22 mm/s; QS = 2.30 mm/s) is essentially different from Fe1−xO, and it was attributed to a ferrous silicate but not a ferrous oxide [47]. Furthermore, Yuen et al. observed, during the reduction of 1 wt% Fe/SiO2 catalyst reduced at increasingly severe conditions, two Fe2+ doublets. An inner doublet (IS = 1.06 mm/s; QS = 0.93 ± 0.03 mm/s) was attributed to the cations of low coordination (denoted as iron surface silicate), and an outer doublet (IS = 1.28 mm/s; QS = 1.84 mm/s) was ascribed to the Fe2+ cations of high coordination (present in highly dispersed iron(II) oxide particles) [52]. Taking the overall summary of the literature into consideration, the phase with the higher QS value (2.806 mm/s) for high spin states exists in the bulk region, while that with lower values (2.29–2.39 mm/s) is located at or near the surface region, thus explaining the reason why the bulk-phase Fe2+ silicate was detected only in the X-ray diffraction over the spent sample of the Lab-1, with the exception of none of the others.
MES results revealed that in the bulk phase of the spent samples, the relative content of iron carbide (χ-Fe5C2) was increased with increasing K loading, while a relatively higher level of Fayalite species was observed on the lowest K-loading sample. The higher content of the χ-Fe5C2 phase may rationalize the higher FTS activity [23]. However, it can hardly explain the decreased activity (Figure 9) or the O/P ratio (Figure 12) of the Lab-4 sample at the end of FTS run, since the χ-Fe5C2 phase was the only carbide phase out of all the samples according to XRD and MES characterization. There were no other types of carbon-poor carbides; e.g., θ-Fe3C was observed, which was proposed to be less reactive than the χ-Fe5C2 phase, thus causing the catalyst deactivation [11]. MES results also indicate that the magnetite phase in the spent Lab-4 was not the highest one. Instead, it is revealed by XRD results (Figure 14 and Table 4) on spent samples that the most severe crystallite growth was obtained for the highest K loading sample (Lab-4), which increased by a factor of four. This should explain the highest deactivation rate observed on the highest K loading, which could have severely decreased the active surface. Considering the results and discussion in the foregoing section, it should originate from the K-loading effects on the Fe–O–Si interaction. ATR, H2-TPR, and XPS results indicated that Fe–O–Si interaction was the weakest in the Lab-4 (7 K%) sample, while it was strongest in Lab-1 (2.3 K%), whose degree of crystallite sintering was the smallest after a long-term FTS reaction in four samples.

3. Materials and Methods

3.1. Materials

H2 (99.9%) and CO (99.9%) were purchased from Beijing AP BAIF gases industry Co., Ltd. (Beijing, China) and were desulfurized (up to <0.05 μg/g), deoxidized and dehydrated before usage. Fe(NO3)3·9H2O, Cu(NO3)2·3H2O, Na2CO3 and K2SiO3 were purchased from Sinopharm Chemical Reagent Co., Ltd. (Shanghai, China). All chemicals were used as received.

3.2. Catalyst Preparation

The oxide catalyst precursors were prepared by the co-precipitation method, followed by promoter/binder addition, drying and calcination. In brief, the mixed ferric nitrate and copper nitrate solutions with the desired Fe3+/Cu2+ ratio were co-precipitated with sodium carbonate solution under a temperature of 70 °C and maintaining a pH at ~7. The generated precursor precipitation was followed by filtering and washing. The filter cakes were re-slurried in DI water, followed by adding a certain stoichiometric aqueous solution of potassium silicate. The obtained slurry was divided equally into four parts and filtered, respectively. The final filter cakes were dried at 120 °C overnight and then calcined in a muffle with air at 500 °C for 6 h. The resulting powders were crushed and sieved, respectively, into a diameter range of 80~150 µm before activity tests and other characterizations. The final oxide precursor samples, of which XRF (X-ray fluorescence, Rigaku ZSX Primus Ⅱ (Tokyo, Japan)) analysis shows x K/100Fe, x = 2.3, 3.8, 5.6 and 7.0, respectively, were denoted as Lab-1, -2, -3 and -4. The contents of Cu, and SiO2 were kept identical in each sample.

3.3. Catalyst Characterization

3.3.1. Nitrogen Adsorption/Desorption

BET surface area and pore size distribution of catalysts were determined by nitrogen physisorption using an Autosorb IQ (Quantachrome instrument, Boynton Beach, FL, USA). Each sample was degassed under vacuum at 1.43 × 10⁶ MPa at 350 °C for 3 h prior to each measurement.

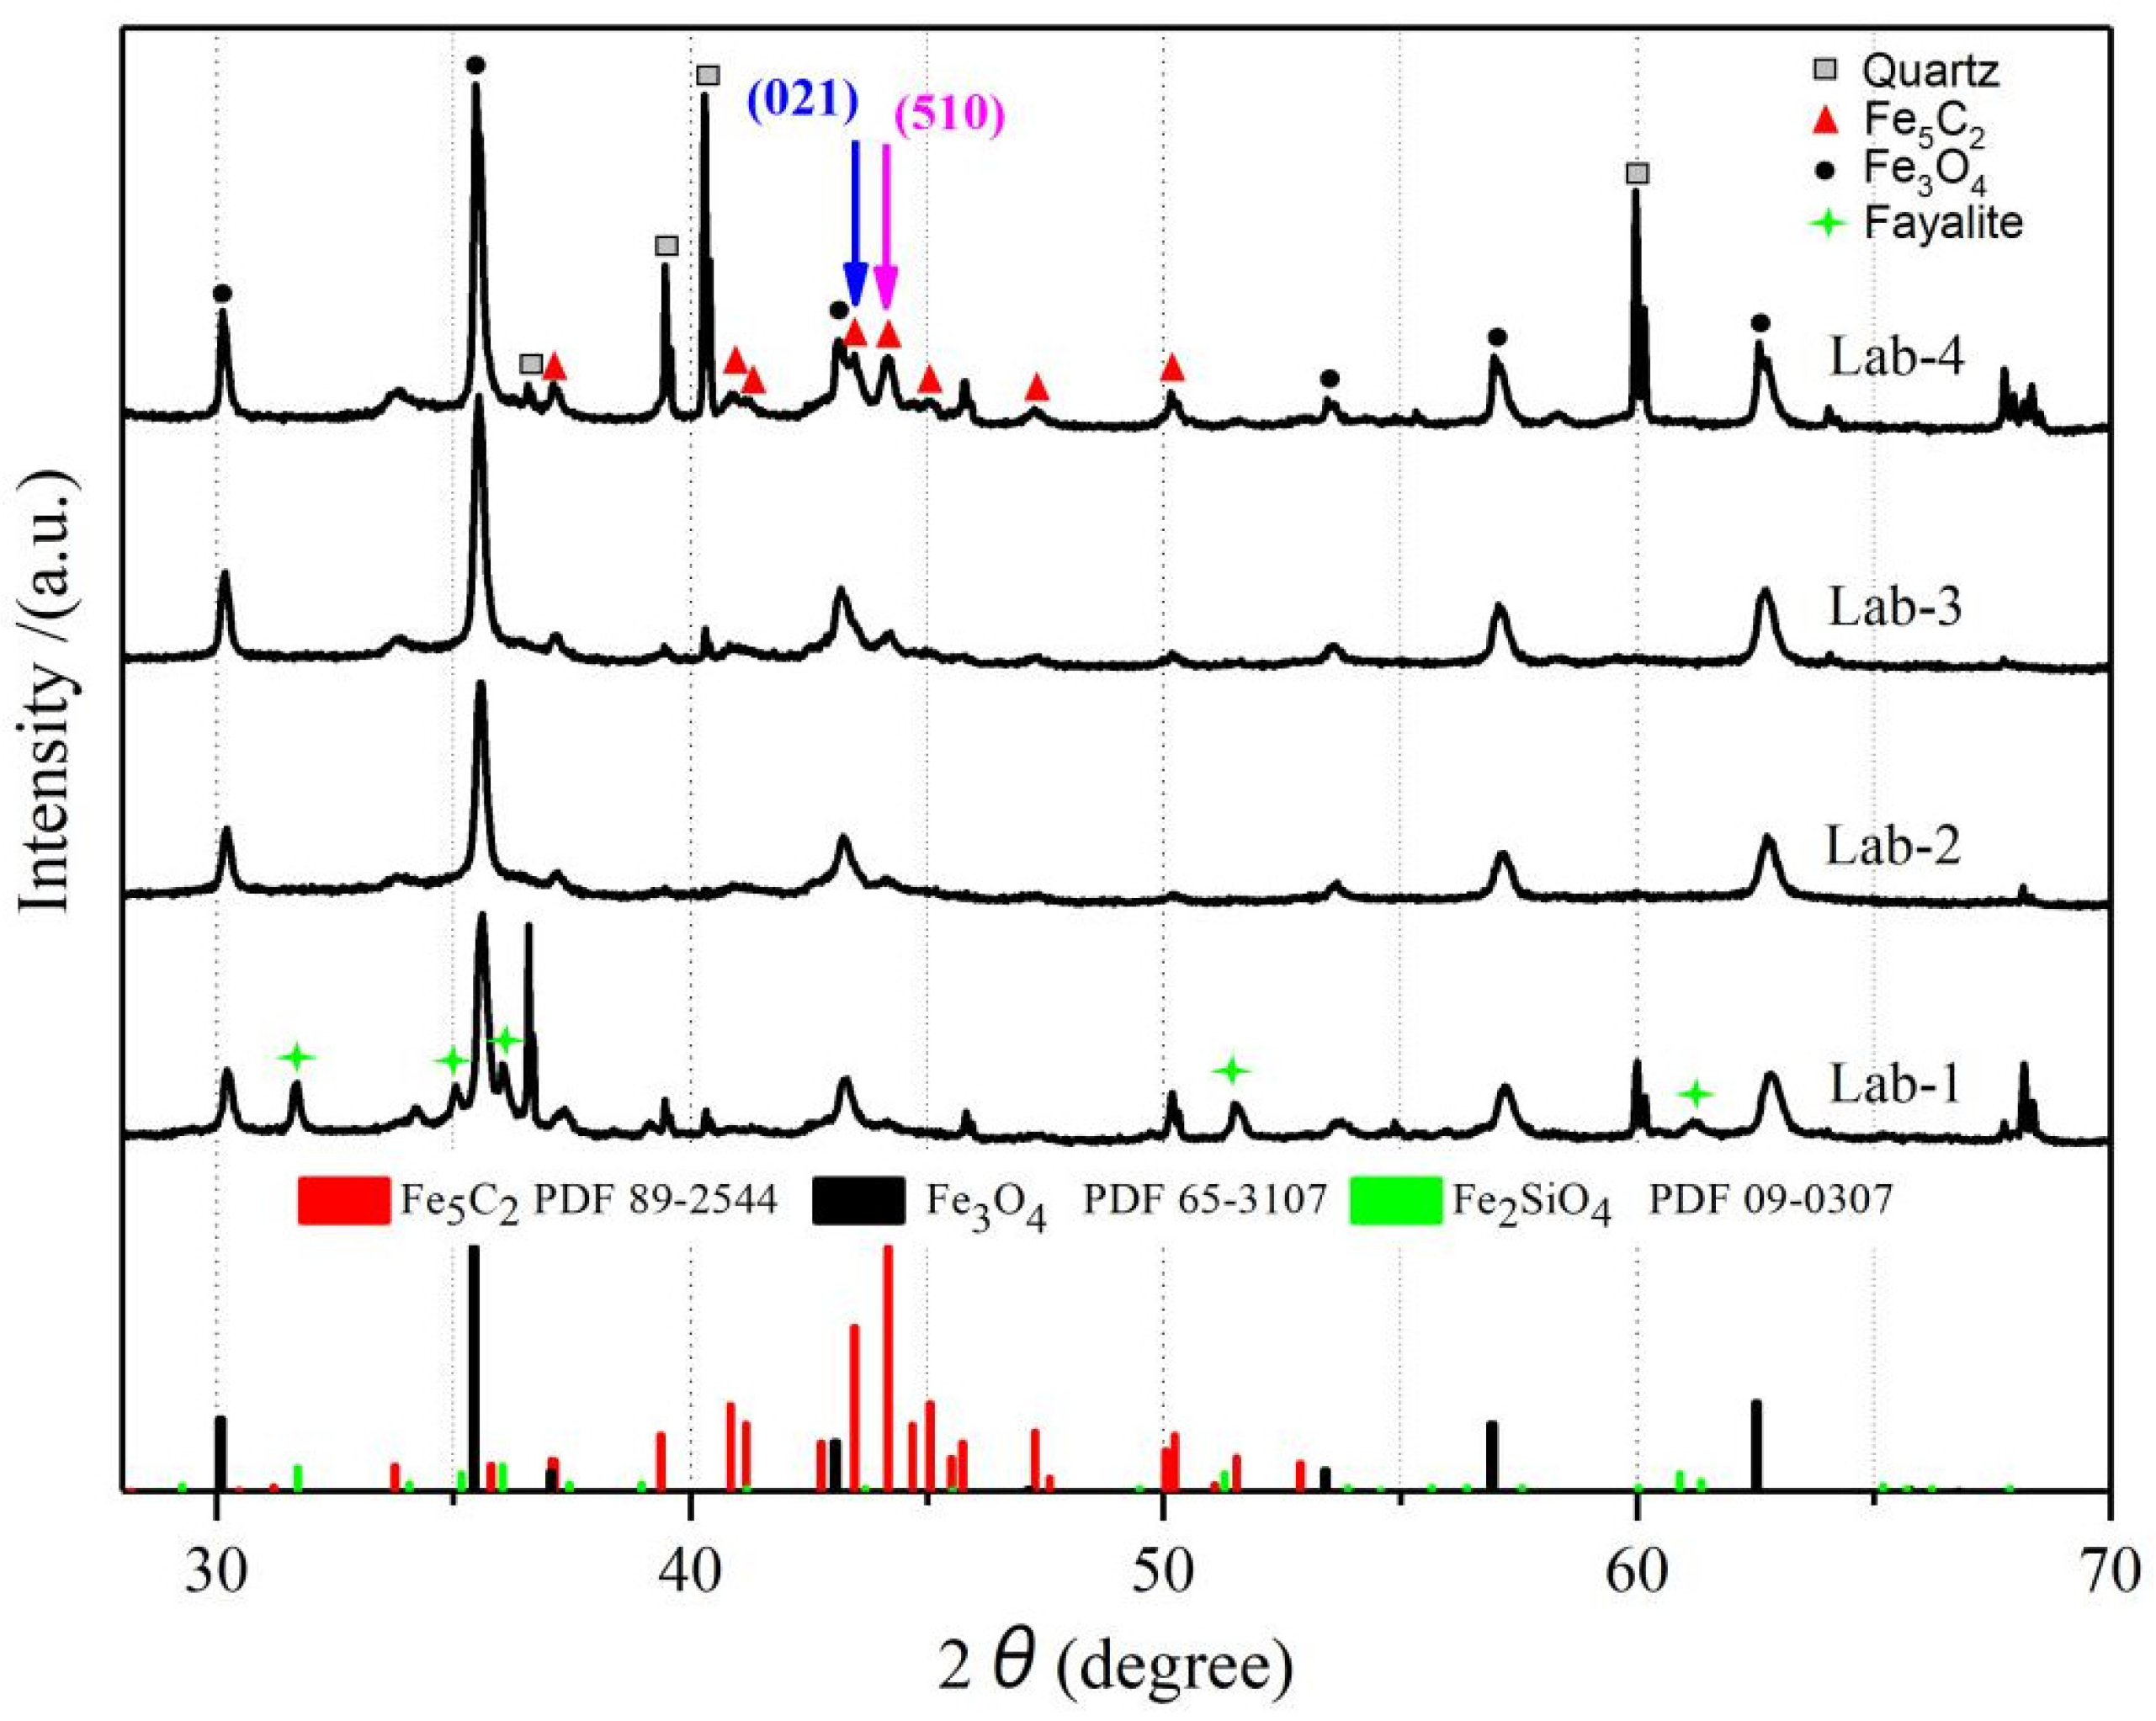
3.3.2. X-ray Diffraction

X-ray diffractometer (Bruker D8 Advance, Karlsruhe, German) was used to determine the phase composition of the catalysts. Cu Kα radiation (λ = 1.54056 Å) was used as the X-ray source, and an electric current of 40 mA, a voltage of 40 kV, and a scanning speed of 0.30°/min were used.

3.3.3. In Situ XRD

In situ XRD was carried out in a continuous mode on a D/max-2600/PC apparatus (Rigaku, Tokyo, Japan) equipped with a D/teX ultra-high-speed detector. The X-ray generator consisted of a Cu rotating anode target with a maximum power of 9 kW. All the tests were operated at 150 mA and 40 kV. In situ XRD patterns were recorded in an Anton Paar XRK-900 cell equipped with an H2/CO = 20 gas system at 260 °C at different duration up to 24 h.

3.3.4. FTIR/ATR Spectra

The IR (ATR, Attenuated Total Reflectance) spectra of the samples (fresh and spent) were acquired on an IRPrestige-21 spectrometer operating with Diamond crystal ATR (Specac Ltd., Orpington, UK). Thirty-two scans were taken over the wave-number range of 400~4000 cm−1 for each sample with a resolution of 4 cm−1.

3.3.5. Temperature-Programmed Reduction (TPR)

Temperature-programmed reduction (H2-TPR) profiles of calcined catalysts were recorded using an Autochem II 2920 unit (Micromeritics, Norcross, GA, USA) equipped with a thermal conductivity detector (TCD). A sample of approx. 100 mg of catalyst was loaded into a U-type quartz tube reactor and pre-treated by purging with argon (50 mL (STP)/min for 40 min at 120 °C, after which the system was cooled down in Ar to about 40 °C. The gas supply was then switched to a mixture of H2/90% Ar (50 mL (STP)/min), and the temperature was ramped to 800 °C with a heating rate of 10 °C/min.

3.3.6. Temperature-Programmed Hydrogenation (TPH)

Temperature-Programed Hydrogenation (TPH) was conducted in a quartz tube reactor coupled with a mass spectrometer. Typically, 50 mg of the sample was reduced in situ and carburized by a flow rate of 30 mL (STP)/min with H2/CO = 5 at atmospheric pressure and 280 °C before the TPH experiment. During the TPH, the temperature was ramped from room temperature to 1000 °C at a rate of 10 °C/min in 10 vol% H2/He flow (50 mL (STP)/min in total).

3.3.7. X-ray Photoelectron Spectroscopy (XPS)

The sXPS experiment was recorded with a Thermo Fischer ESCALAB 250 Xi spectrometer at a base pressure of 1 × 10⁻⁹ mbar. The spectra were obtained at 20 eV pass energy with monochromatic Al Kα (1486.6 eV) radiation. The C1s peak of adventitious carbon (284.6 eV) was used as a reference for estimating the binding energy. The binding energies were given with an accuracy of ±0.1 eV.

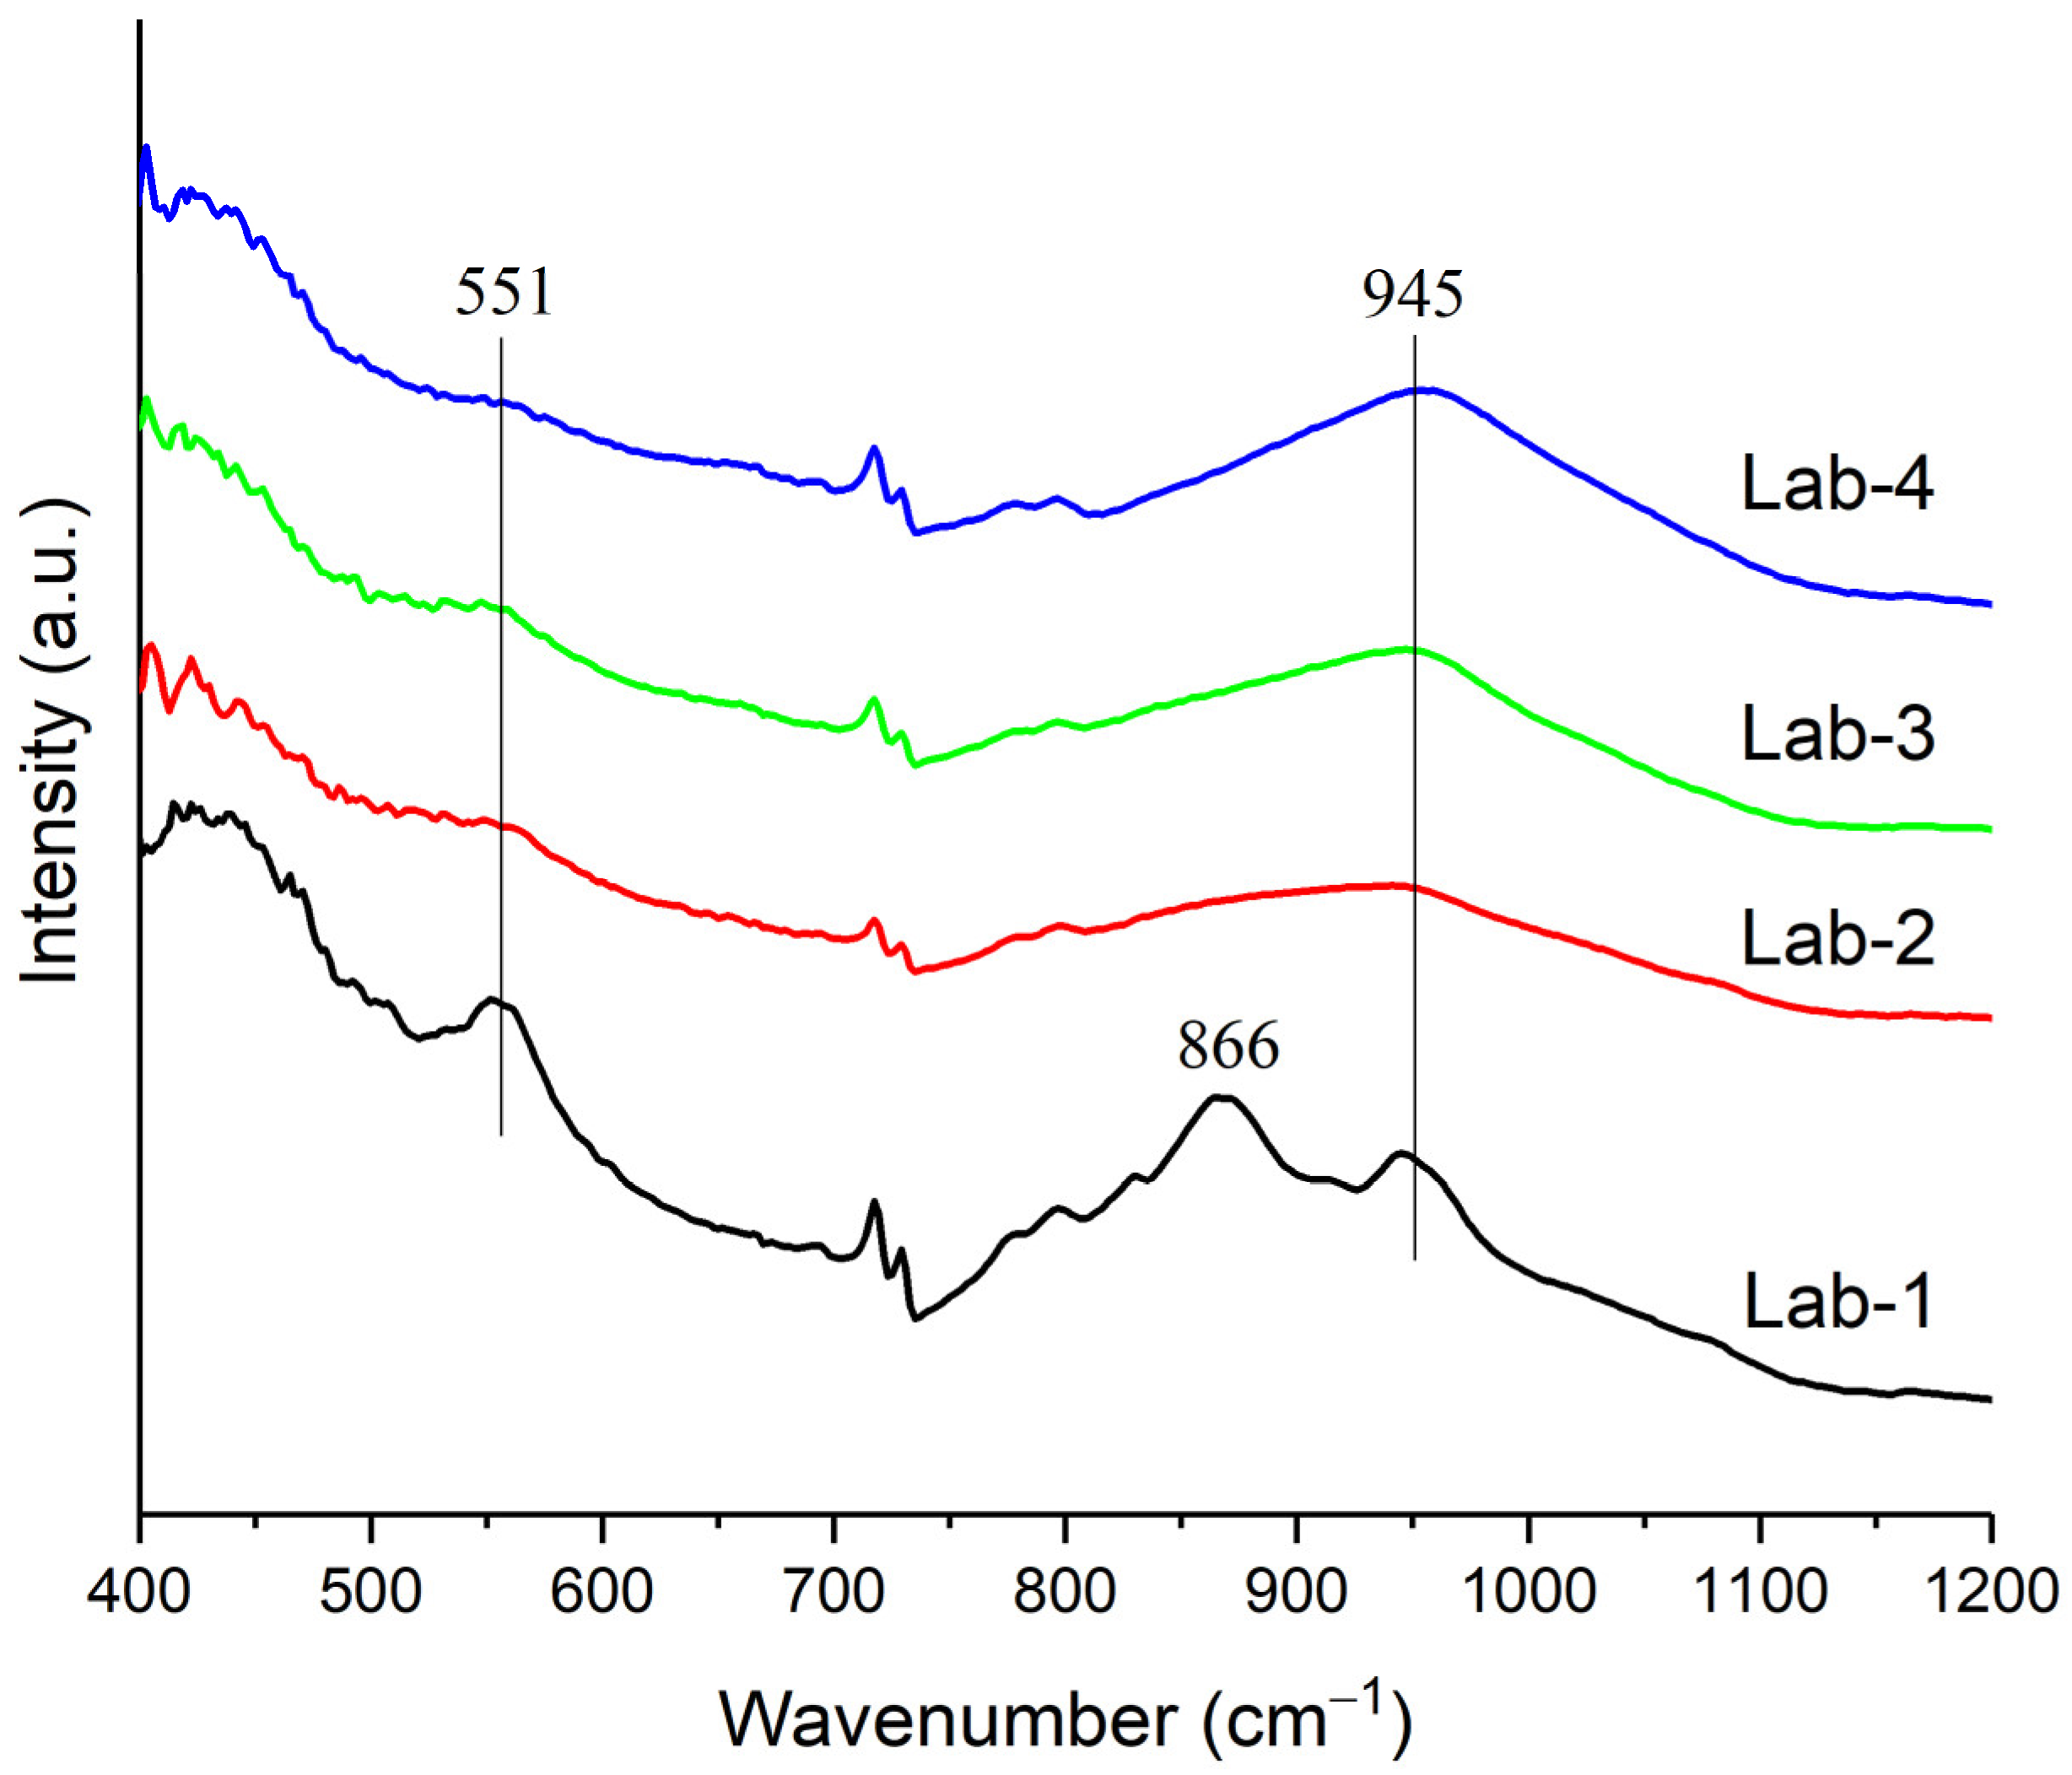
3.3.8. Raman Spectrum

LRS was obtained on LabRAM HR800 (Horiba Jobin Yvon, Palaiseau, France) using Synapse CCD as the detector and an air-cooled frequency-doubled Nd:Yag laser (λ = 532 nm) as the laser source.

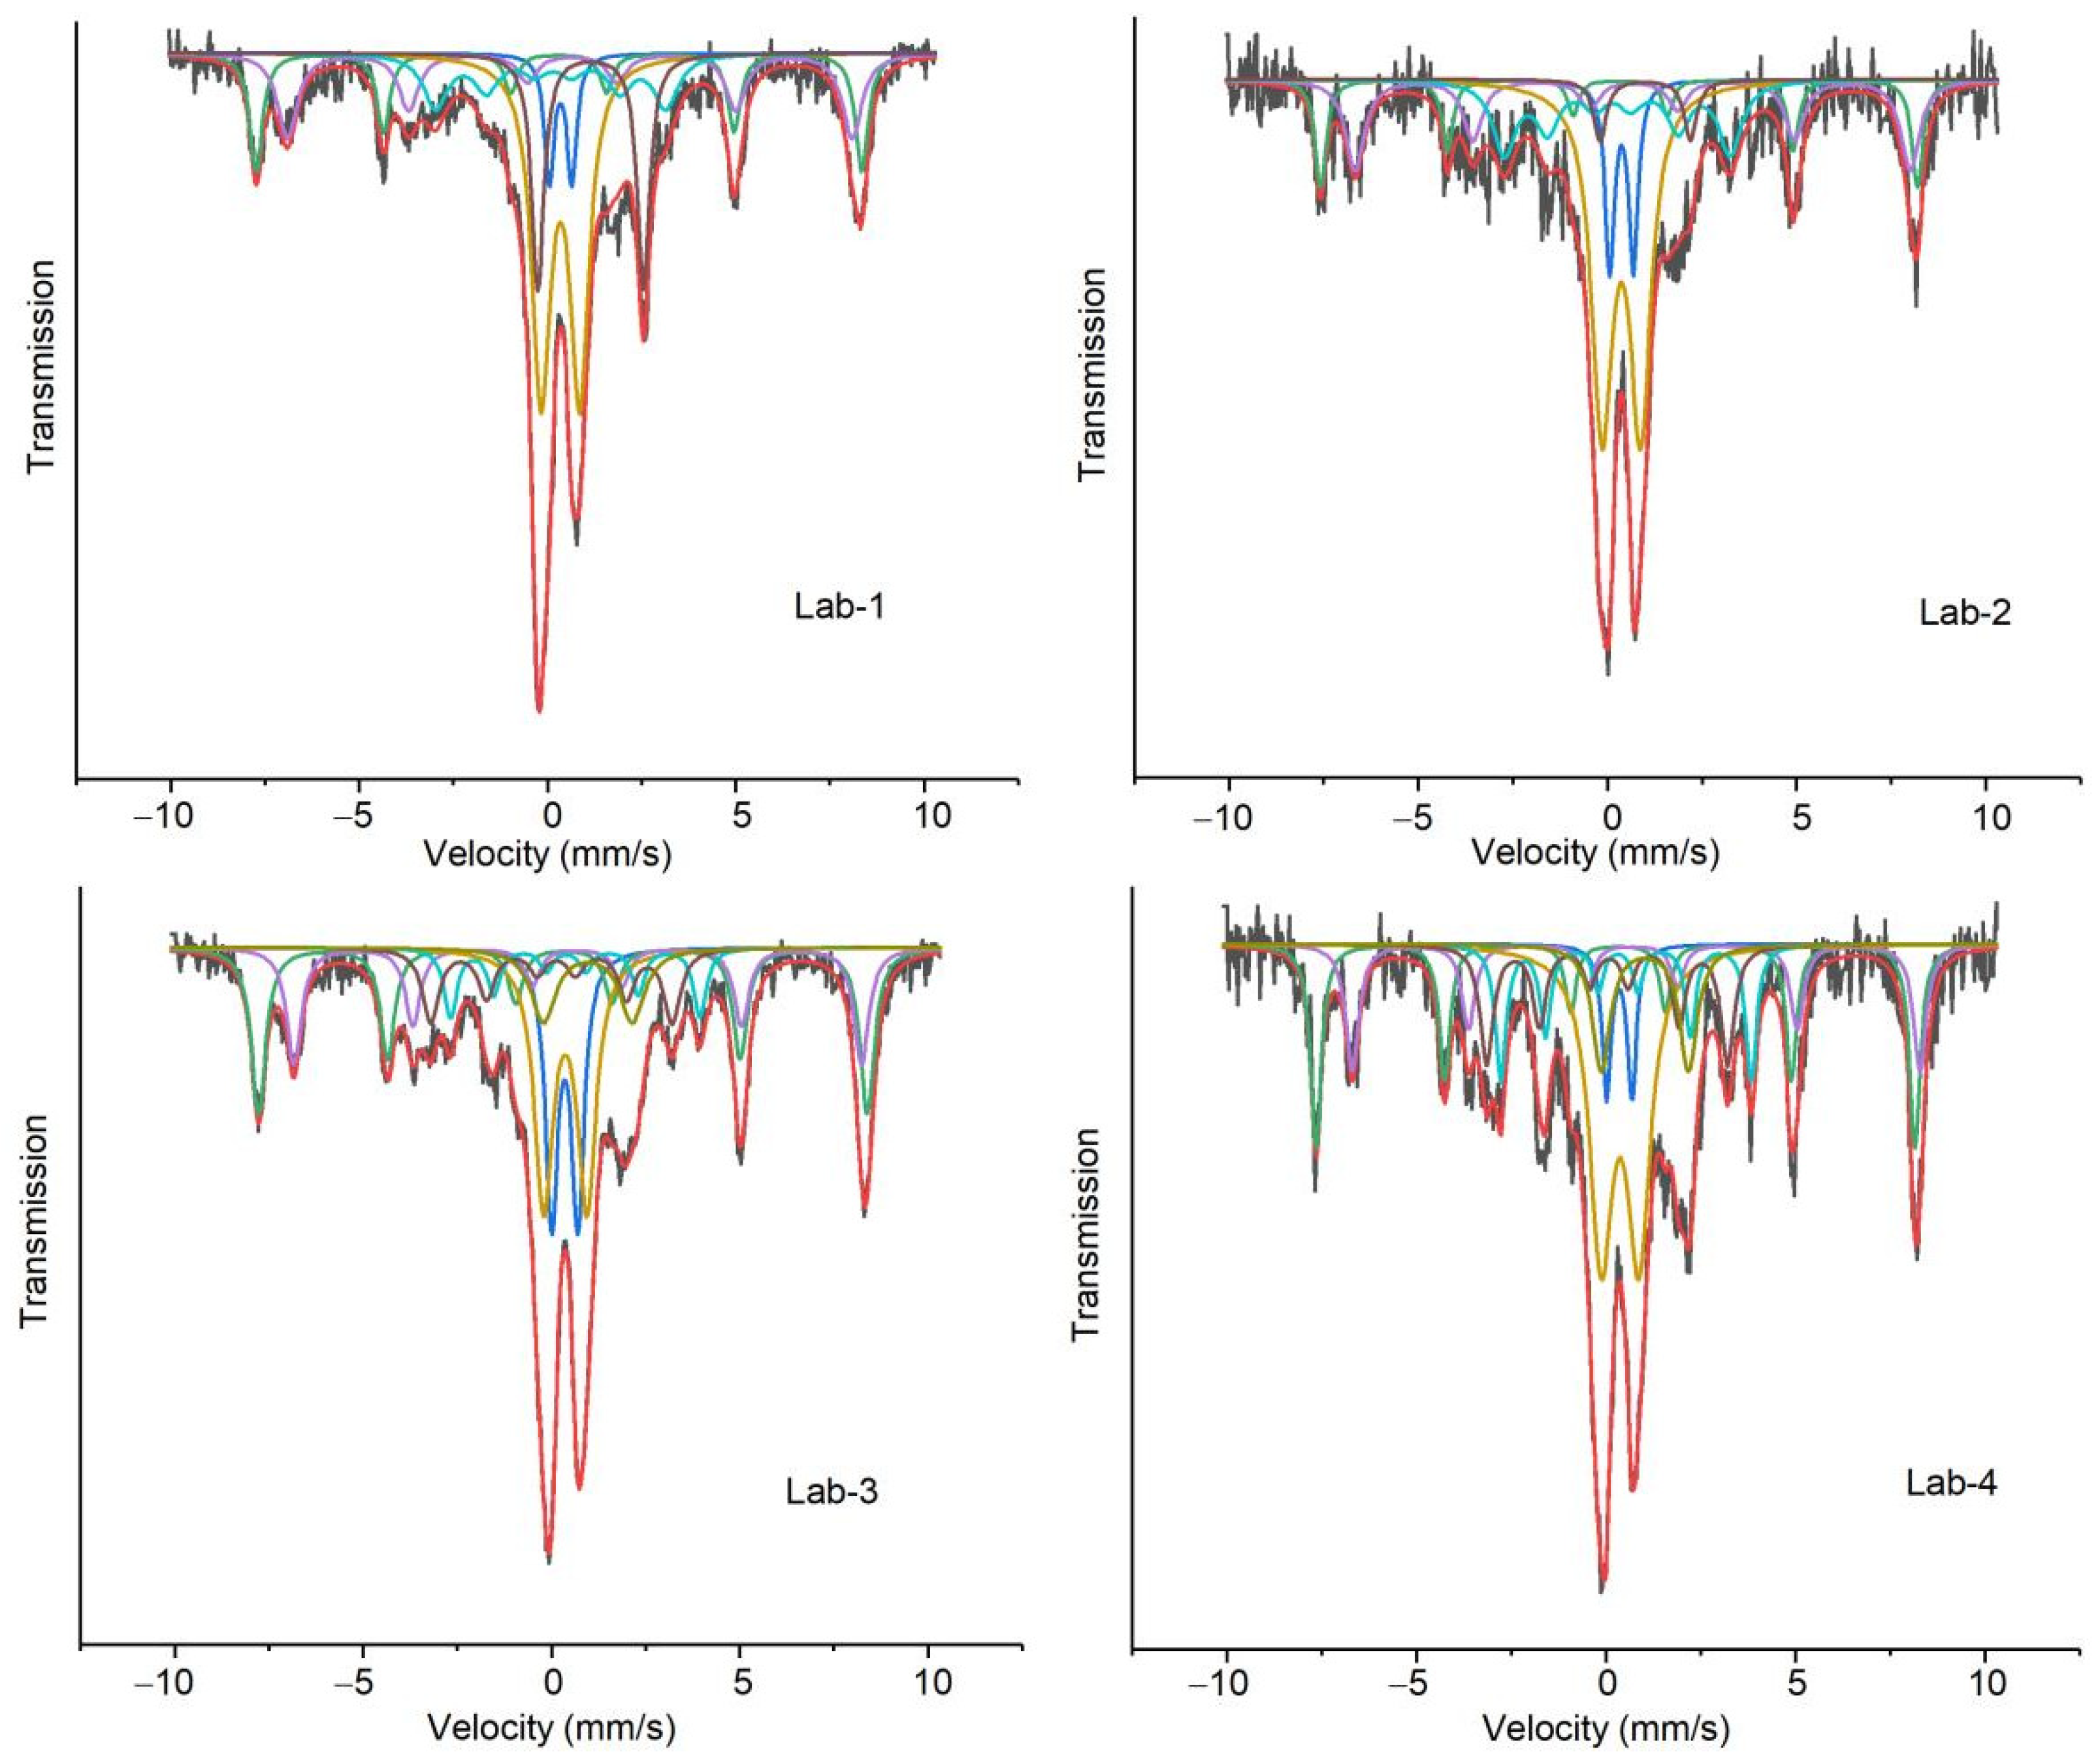
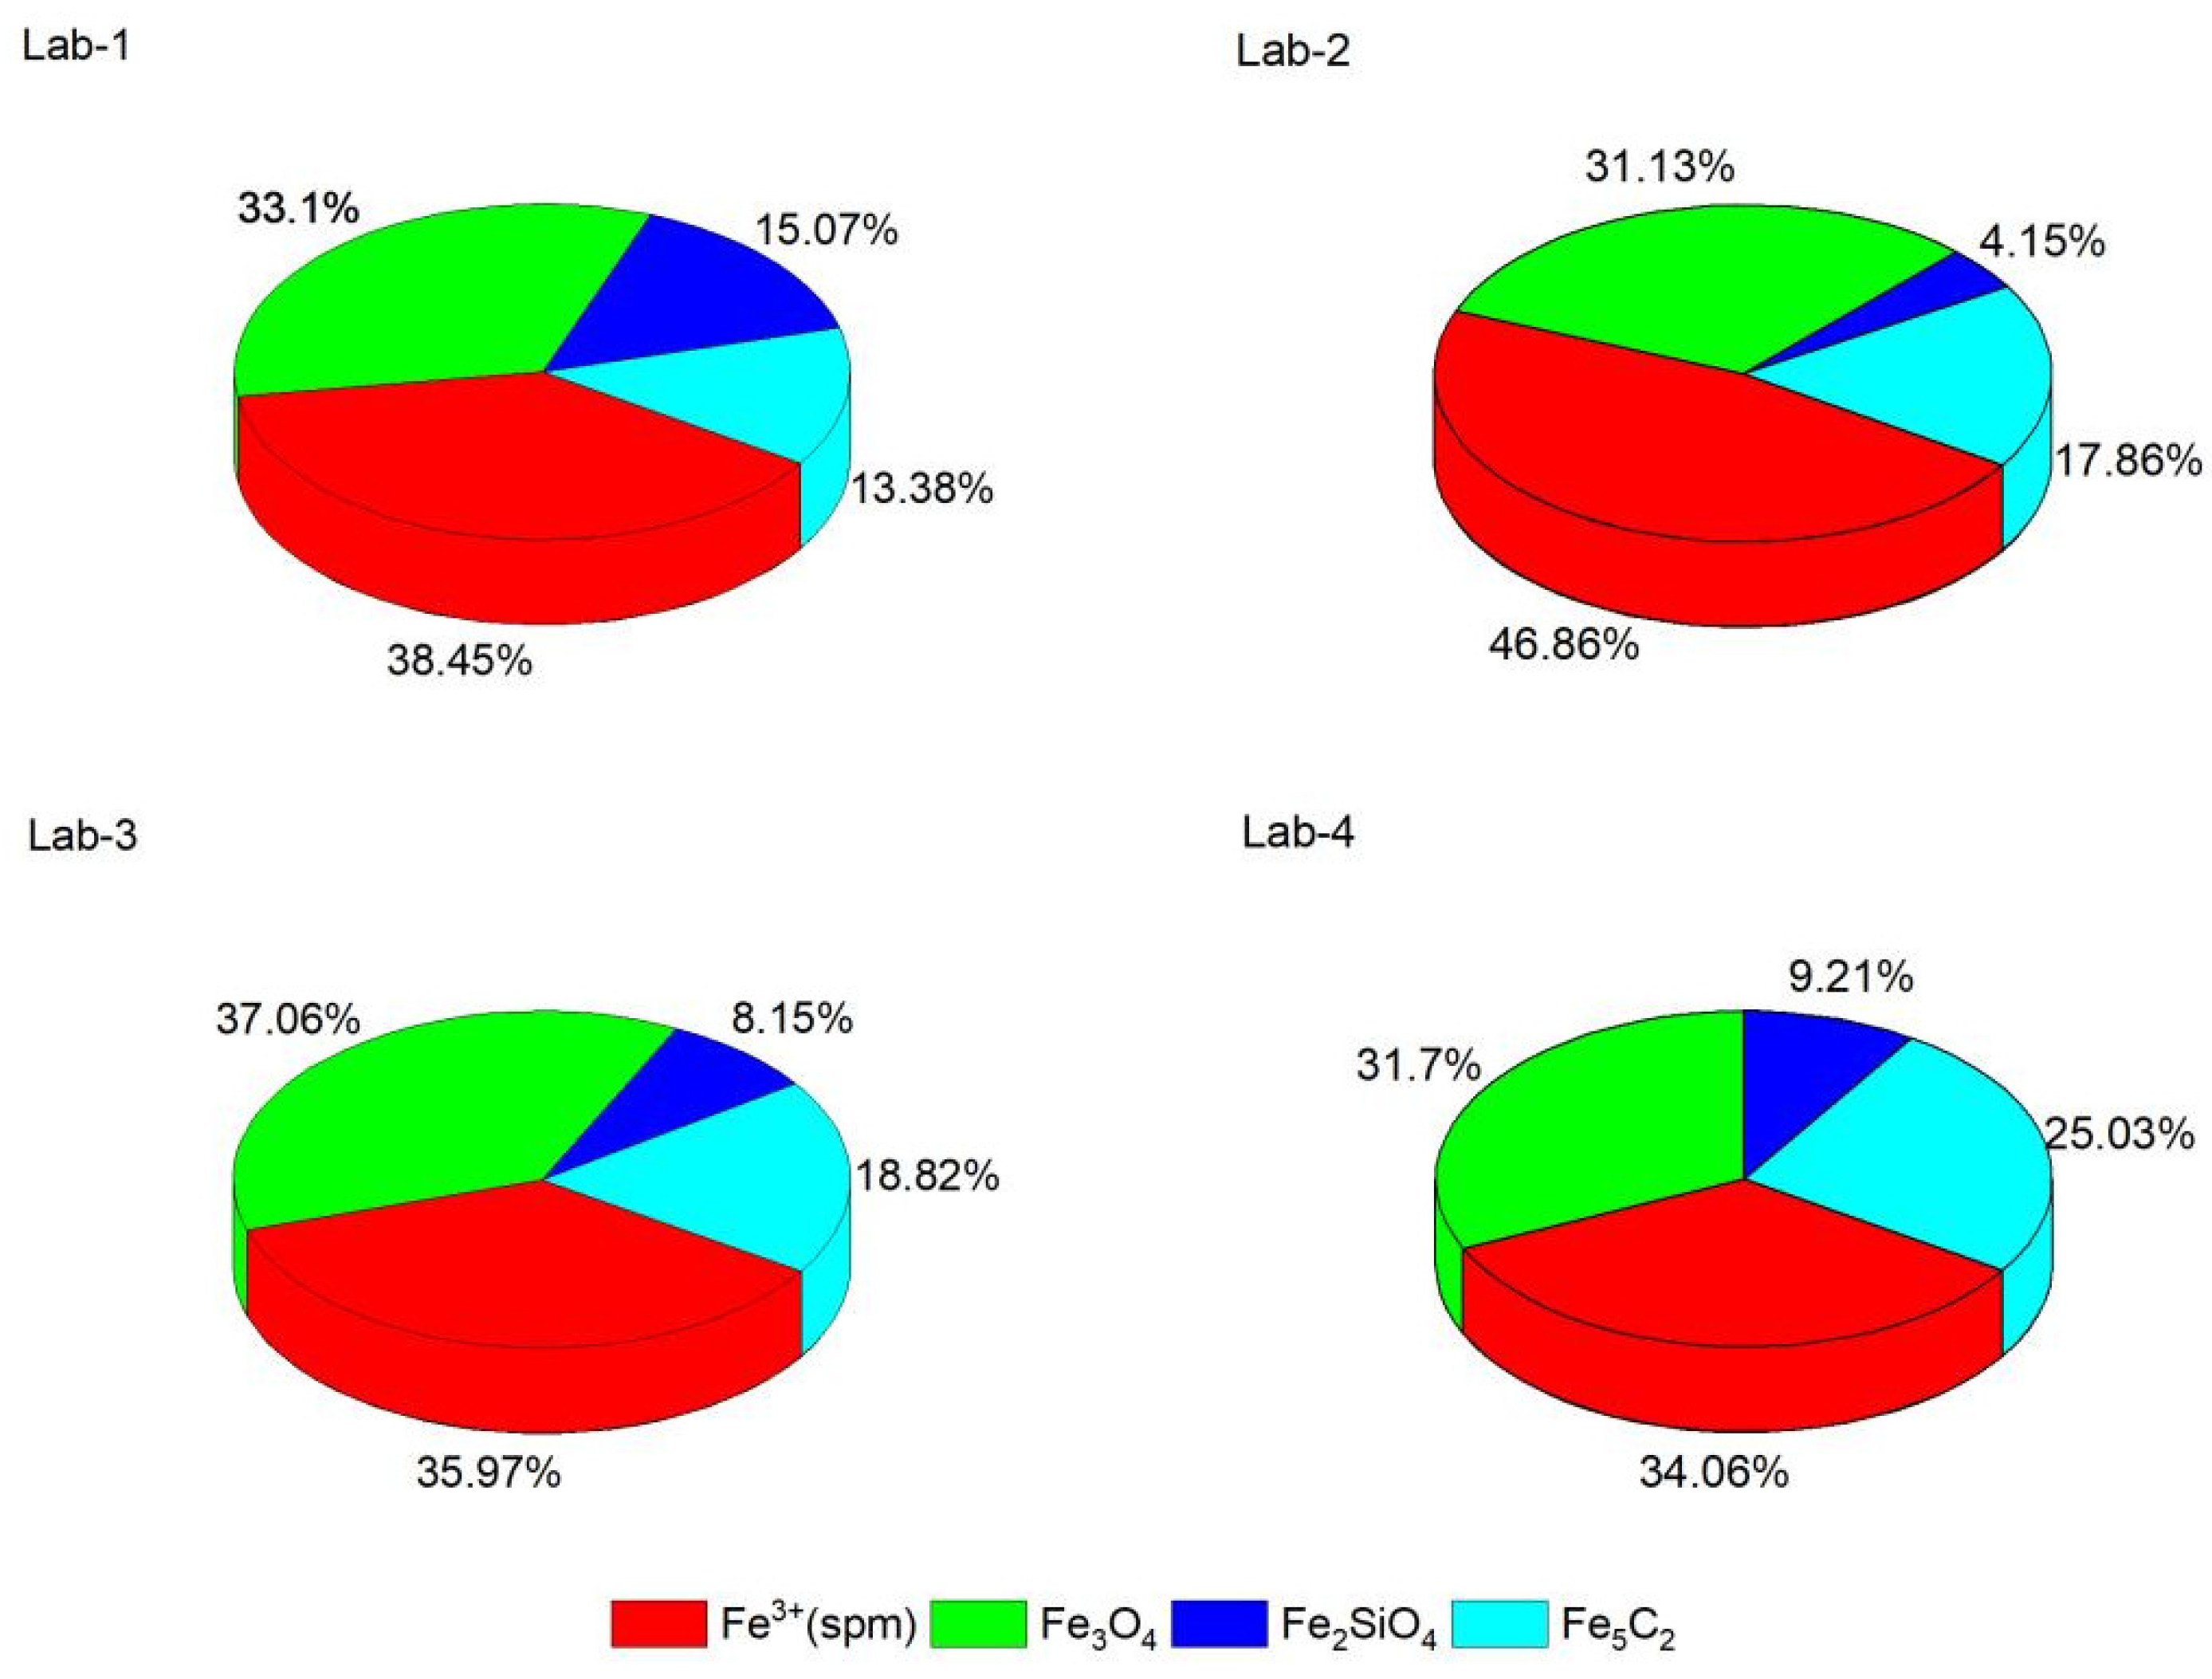
3.3.9. Mössbauer Spectra (MES)

57Fe Mössbauer spectra were recorded at room temperature using a Topologic 500A spectrometer with a proportional counter. 57Co (Rh) moving in constant-acceleration mode was used as the radioactive source. The Doppler velocity of the spectrometer was calibrated with respect to a standard α-Fe foil. The absorption thickness of the sample was adjusted to 10 mg Fe/cm2. The analysis of the Mössbauer spectrum is based on the Lorentz absorption curve and fitted by a computer with moss winn 4.0 software (http://www.mosswinn.com/english/index.html). The spectral components were identified based on their isomer shift (IS), quadruple splitting (QS), absorption linewidth (LW) and magnetic hyperfine fields (Hhf). The relative content of various iron phases in the catalyst was determined by integrating the absorption peak area of each phase.

3.4. Fischer-Tropsch Synthesis Performance Test

3.4.1. FTS Test in Fixed-Bed Reactor (FBR)

FTS performance of catalysts was evaluated in a fixed bed reactor and its matching product analysis systems. A 1.5 g sample of fresh precursor catalyst (80~150 µm), mixed with a similar size of quartz beads in a certain proportion was charged into the reactor. The outlet of the reactor was connected with a hot trap and a cold trap at the system pressure. After the product collectors, the pressure of the tail gas was released through a backpressure regulator. The flow rate of the tail gas was monitored by a wet-gas flow meter.
The catalysts were pre-treated in situ at 260 °C for 24 h in a syngas stream (1 bar, H2/CO = 20, 1800 mL/(g-cat·h) GHSV). The flow rate of the purified syngas was controlled using a mass flow meter. Subsequently, the bed temperature was lowered down to about 150 °C, the system was pressurized to 2.3 MPa, and the syngas was adjusted H2/CO = 1.5, 3000 mL/(g-cat·h) GHSV. The reaction allowed for more than 280 h at 235 °C on-stream to reach a steady state before the analysis of the effluents.

3.4.2. Product Analysis

Reactants and gas-phase products were analyzed using an online Agilent GC (6890N) equipped with a thermo conductivity detector (TCD) and a Chromosorb column. The heavy hydrocarbon products were analyzed using an offline GC (Agilent 1260) with a flame-ionization detector (FID) and a fused silica capillary column.

4. Conclusions

The physical-chemical structural evolution, phase transformation and FTS catalytic behavior of precipitated Fe/Cu/K/SiO2 catalysts with four different potassium loading levels were investigated. ATR-FTIR results showed the formation of the Fe–O–Si structure in fresh precursors. This kind of iron–silica interaction was weakened with an increase in K loading, which was evidenced by an apparent “red shift” over the peak maxima of Fe–O–Si infrared spectra, a step-wise lowering of a peak temperature corresponding to Fe3O4 reduction to α-Fe, and a clear decreasing Fe2p binding energy observed, respectively, as a consequence of ATR-FTIR, H2-TPR and XPS investigation. The obvious retardation of the second reduction process observed on the lower K sample indicated that a stronger Fe–O–Si interaction was formed, and it appeared to stabilize the Fe2+. The marked shift toward the lower-end temperature of the second reduction peak occurred on the samples with a rising K loading indicating the acceleration of the Fe3O4 reduction to the metallic iron (α-Fe). Obviously, this was the result of weakened iron–silica interaction affected by higher K content. The H2-TPH experiment revealed that a greater proportion of reactive surface carbon (atomic and amorphous) was obtained with increasing K loading, while the iron carbide (χ-Fe5C2) phase in the samples with lower K loading was restrained and stabilized by the stronger iron–silica interaction between iron and silica from hydrogenation. In situ XRD results showed that the crystallite size of χ-Fe5C2 calculated by (510) facet was remarkable with the increased K content.
In the fixed-bed reactor, the higher K loading sample is intended to expose a higher CO conversion activity and a higher O/P (C2–C4) ratio, which might be attributed to the fact that the increased reactive surface carbon (alpha-carbon) can be achieved over the higher K loading samples after syngas reduction. After the FTS reaction, the Raman spectra showed a greater proportion of graphitic carbon intended to accumulate on the higher K sample, which may be insufficiently responsible for the high deactivation observed over the Lab-4 (7 K%) sample. MES results revealed that the relative content of the iron carbide (χ-Fe5C2) phase was increased with increasing K loading, while highly dispersed/stabilized Fe2+ ions; structurally Fayalite (Fe2SiO4) compound, which was also detected by ATR-FTIR; and XRD characterizations were observed both in the bulk and surface region of the lowest K loading (2.3 K%) sample. The iron–silica interaction was evident in the size diameter and showed that the crystallite sizes increased by a factor of four for the 7 K% sample after long-term FTS reaction, which rationalized the high deactivation obtained.

Author Contributions

Conceptualization, H.C., Q.L. and M.C.; investigation, H.C., M.C. and K.Z.; Characterization, B.F. and J.C.; writing—original draft, H.C., Q.L., M.C. and K.Z.; writing—review and editing, H.C., Q.L., M.C. and K.Z.; project administration, Q.L., Y.L. and Z.M.; funding acquisition, Q.L., Y.L. and Z.M. All authors have read and agreed to the published version of the manuscript.

Funding

This research was funded by the Technical Innovation project of China Energy Investment Corporation (Project No. GJNY-21-72).

Conflicts of Interest

The authors declare no conflict of interest. The funders had no role in the design of the study; in the collection, analyses, or interpretation of data; in the writing of the manuscript; or in the decision to publish the results.

References

  1. Dry, M.E. The Fischer-Tropsch process: 1950–2000. Catal. Today 2002, 71, 227–241. [Google Scholar] [CrossRef]
  2. Botes, F.G.; Niemantsverdriet, J.W.; van de Loosdrecht, J. A comparison of cobalt and iron based slurry phase Fischer-Tropsch synthesis. Catal. Today 2013, 215, 112–120. [Google Scholar] [CrossRef]
  3. Suo, H.Y.; Wang, S.G.; Zhang, C.H.; Xu, J.; Wu, B.S.; Yang, Y.; Xiang, H.W.; Li, Y.W. Chemical and structural effects of silica in iron-based Fischer-Tropsch synthesis catalysts. J. Catal. 2012, 286, 111–123. [Google Scholar] [CrossRef]
  4. Dry, M.E. Fischer-Tropsch synthesis. In Catalysis, Science and Technology, 1st ed.; Anderson, J.R., Boudart, M., Eds.; Springer: New York, NY, USA, 1981; pp. 159–255. [Google Scholar]
  5. Dry, M.E. Present and future applications of the Fischer-Tropsch process. Appl. Catal. A Gen. 2004, 276, 1–3. [Google Scholar] [CrossRef]
  6. Yang, Y.; Xiang, H.W.; Xu, Y.Y.; Bai, L.; Li, Y.W. Effect of potassium promoter on precipitated iron-manganese catalyst for Fischer-Tropsch synthesis. Appl. Catal. A Gen. 2004, 266, 181–194. [Google Scholar] [CrossRef]
  7. Raje, A.P.; O’Brien, R.J.; Davis, B.H. Effect of Potassium Promotion on Iron-Based Catalysts for Fischer-Tropsch Synthesis. J. Catal. 1998, 180, 36–43. [Google Scholar] [CrossRef]
  8. Bukur, D.B.; Mukesh, D.S.; Patal, A. Promoter Effects on Precipitated Iron Catalysts for Fischer-Tropsch Synthesis. Ind. Eng. Chem. Res. 1990, 29, 194–204. [Google Scholar] [CrossRef]
  9. Pendyala, V.R.R.; Graham, U.M.; Jacobs, G.; Hamdeh, H.H.; Davis, B.H. Fischer-Tropsch Synthesis: Deactivation as a Function of Potassium Promoter Loading for Precipitated Iron Catalyst. Catal. Lett. 2014, 144, 704–1716. [Google Scholar] [CrossRef]
  10. Niu, L.W.; Liu, X.W.; Wen, X.D.; Yang, Y.; Xu, J.; Li, Y.W. Effect of potassium promoter on phase transformation during H2 pretreatment of a Fe2O3 Fischer Tropsch synthesis catalyst precursor. Catal. Today 2020, 343, 101–111. [Google Scholar] [CrossRef]
  11. Eliason, S.A.; Bartholomew, C.H. Reaction and deactivation kinetics for Fischer-Tropsch synthesis on unpromoted and potassium-promoted iron catalysts. Appl. Catal. A Gen. 1999, 186, 229–243. [Google Scholar] [CrossRef]
  12. Kölbel, H. Kalium als strucktureller und Energetischer Promotor in Eisenkatalysatoren. In Actes du Deuxieme Congress International de Catalyse; Tchnip: Paris, France, 1960; Volume II, p. 2075. [Google Scholar]
  13. Soled, S.; Iglesia, E.; Miseo, S.; DeRites, B.A.; Fiato, R.A. Selective synthesis of a-olefins on Fe-Zn Fischer-Tropsch catalysts. Top. Catal. 1995, 2, 193. [Google Scholar] [CrossRef]
  14. Frohning, C.D.; Kölbel, H.; Ralek, M.; Rottig, W.; Schuur, F.; Schulz, H. Fischer-Tropsch-Synthese. In Chemierohstoffe aus Kohle; Falbe, J., Ed.; Georg Thieme Verlag: Stuttgart, Germany, 1977; pp. 219–299. [Google Scholar]
  15. Jothimurugesan, K.; Spivey, J.J.; Gangwal, S.K.; Goodwin, J.G. Effect of silica on iron-based Fischer-Tropsch catalysts. Natural Gas Conversion V. In Studies in Surface Science and Catalysis; Elsevier: Amsterdam, The Netherlands, 1998; Volume 119, pp. 215–220. [Google Scholar]
  16. Hou, W.J.; Wu, B.S.; Yang, Y.; Hao, Q.L.; Tian, L.; Xiang, H.W.; Li, Y.W. Effect of SiO2 content on iron-based catalysts for slurry Fischer-Tropsch synthesis. Fuel Process. Technol. 2008, 89, 284–291. [Google Scholar] [CrossRef]
  17. Chang, H.; Cheng, M.; Lin, Q.; Zhu, J.Q.; Lv, Y.J.; Men, Z.W. Effects of binder addition process parameters on physical-chemical and catalytic performance of iron-based Fischer-Tropsch (F-T) synthesis catalyst. J. China Coal Soc. 2021, 46, 3350–3356. [Google Scholar]
  18. Lin, Q.; Cheng, M.; Zhang, K.; Li, W.Z.; Wu, P.; Chang, H.; Lv, Y.J.; Men, Z.W. Development of an Iron-Based Fischer-Tropsch Catalyst with High Attrition Resistance and Stability for Industrial Application. Catalysts 2021, 11, 908. [Google Scholar] [CrossRef]
  19. Bukur, D.B.; Carreto-Vazqueza, V.H.; Ma, W.P. Catalytic performance and attrition strength of spray-dried iron catalysts for slurry phase Fischer-Tropsch synthesis. Appl. Catal. A Gen. 2010, 388, 240–247. [Google Scholar] [CrossRef]
  20. Yang, Y.; Xiang, H.W.; Tian, L.; Wang, H.; Zhang, C.H.; Tao, Z.C.; Xu, Y.Y.; Zhong, B.; Li, Y.W. Structure and Fischer-Tropsch performance of iron-manganese catalyst incorporated with SiO2. Appl. Catal. A Gen. 2005, 284, 105–122. [Google Scholar] [CrossRef]
  21. Zhang, C.-H.; Wan, H.-J.; Yang, Y.; Xiang, H.-W.; Li, Y.-W. Study on the iron–silica interaction of a co-precipitated Fe/SiO2 Fischer-Tropsch synthesis catalyst. Catal. Commun. 2006, 7, 733–738. [Google Scholar] [CrossRef]
  22. Mogorosi, R.; Fischer, N.; Claeys, M.; Steen, E.V. Strong-metal–support interaction by molecular design: Fe–silicate interactions in Fischer-Tropsch catalysts. J. Catal. 2012, 289, 140–150. [Google Scholar] [CrossRef]
  23. Dlamini, H.; Motjope, T.; Joorst, G.; Stege, G.T.; Mdleleni, M. Changes in physico-chemical properties of iron-based Fischer-Tropsch catalyst induced by SiO2 addition. Catal. Lett. 2002, 78, 201–207. [Google Scholar] [CrossRef]
  24. Bukur, D.B.; Lang, X.S.; Mukesh, D.; Zimmerman, W.H.; Rosynek, M.P.; Li, C.P. Binder/support effects on the activity and selectivity of iron catalysts in the Fischer-Tropsch synthesis. Ind. Eng. Chem. Res. 1990, 29, 1588–1599. [Google Scholar] [CrossRef]
  25. Lohitharn, N.; Goodwin, J.G. Effect of K promotion of Fe and FeMn Fischer-Tropsch synthesis catalysts: Analysis at the site level using SSITKA. J. Catal. 2008, 260, 7–16. [Google Scholar] [CrossRef]
  26. Liu, H.; Li, P.; Lu, B.; Wei, Y.; Sun, Y.H. Transformation of ferrihydrite in the presence or absence of trace Fe(Ⅱ): The effect of preparation procedures of ferrihydrite. J. Solid State Chem. 2009, 182, 1767–1771. [Google Scholar] [CrossRef]
  27. Seehra, M.; Roy, P.; Raman, A.; Manivannan, A. Structural investigations of synthetic ferrihydrite nanoparticles doped with Si. Solid State Commun. 2004, 130, 597–601. [Google Scholar] [CrossRef]
  28. Stolyar, S.V.; Yaroslavtsev, R.N.; Bayukov, C.A.; Balaev, D.A.; Krasikov, A.A.; Iskhakov, R.S.; Vorotynov, A.M.; Pladygina, V.P.; Purtov, K.V.; Volochaev, M.N. Preparation, structure and magnetic properties of synthetic ferrihydrite nanoparticles. J. Phys. Conf. Ser. 2018, 994, 0120023. [Google Scholar] [CrossRef]
  29. Krehula, S.; Music, S. Influence of aging in an alkaline medium on the microstructural properties of a-FeOOH. J. Cryst. Growth 2008, 310, 513–520. [Google Scholar] [CrossRef]
  30. Rzepa1, G.; Pieczara1, G.; Gaweł1, A.; Tomczyk, A.; Zalecki, R. The inflfluence of silicate on transformation pathways of synthetic 2-line ferrihydrite. J. Therm. Anal. Calorim. 2016, 125, 407–421. [Google Scholar] [CrossRef]
  31. Chernyshova, I.V.; Hochella, M.F., Jr.; Madden, A.S. Size-dependent structural transformations of hematite nanoparticles. 1. Phase transition. Phys. Chem. Chem. Phys. 2007, 9, 1736–1750. [Google Scholar] [CrossRef] [PubMed]
  32. Swedlund, P.J.; Gordon, M.; Miskelly, G.M.; McQuillan, A.J. An attenuated total reflflectance IR study of silicic acid adsorbed onto a ferric oxyhydroxide surface. Geochim. Cosmochim. Acta 2009, 73, 4199–4214. [Google Scholar] [CrossRef]
  33. Das, S.K.; Majhi, S.; Mohanty, P.; Pant, K.K. CO-hydrogenation of syngas to fuel using silica supported Fe-Cu-K catalysts: Effects of active components. Fuel Process. Technol. 2014, 118, 82–89. [Google Scholar] [CrossRef]
  34. Choi, J.-S.; Yoon, S.-S.; Jang, S.-H.; Ahn, W.-S. Phenol hydroxylation using Fe-MCM-41 catalysts. Catal. Today 2006, 111, 280–287. [Google Scholar] [CrossRef]
  35. Swedlund, P.J.; Miskelly, G.M.; McQuillan, A.J. Silicic acid adsorption and oligomerization at the ferrihydrite-water interface: Interpretation of ATR-IR spectra based on a model surface structure. Langmuir 2010, 26, 3394–3401. [Google Scholar] [CrossRef] [PubMed]
  36. Zhang, Y.; Qing, M.; Wang, H.; Liu, X.; Liu, S.; Wan, H.; Li, L.; Gao, X.; Yang, Y.; Wen, X.; et al. Comprehensive Understanding of SiO2-promoted Fe Fischer-Tropsch Synthesis Catalysts: Fe-SiO2 Interaction and Beyond. Catal. Today 2021, 368, 96–105. [Google Scholar] [CrossRef]
  37. Qing, M.; Yang, Y.; Wu, B.; Xu, J.; Zhang, C.; Gao, P.; Li, Y. Modification of Fe-SiO2 interaction with zirconia for iron-based Fischer-Tropsch catalysts. J. Catal. 2011, 279, 111–122. [Google Scholar] [CrossRef]
  38. Bukur, D.B.; Sivaraj, C. Supported iron catalyst for slurry phase Fischer-Tropsch synthesis. Appl. Catal. A Gen. 2002, 231, 201–214. [Google Scholar] [CrossRef]
  39. Suo, H.; Zhang, C.; Wu, B.; Xu, J.; Yang, Y.; Xiang, H.; Li, Y. A comparative study of Fe/SiO2 Fischer-Tropsch synthesis catalysts using tetraethoxysilane and acidic silica sol as silica sources. Catal. Today 2012, 183, 88–95. [Google Scholar] [CrossRef]
  40. Wan, H.-J.; Wu, B.-S.; Tao, Z.-C.; Li, T.-Z.; An, X.; Xiang, H.-W.; Li, Y.-W. Study of an iron-based Fischer-Tropsch synthesis catalyst incorporated with SiO2. J. Mol. Catal. A Chem. 2006, 260, 255–263. [Google Scholar] [CrossRef]
  41. Qiu, T.; Wang, L.; Lv, S.; Sun, B.; Zhang, Y.; Liu, Z.; Yang, W.; Li, J. SAPO-34 zeolite encapsulated Fe3C nanoparticles as highly selective Fischer-Tropsch catalysts for the production of light olefins. Fuel 2017, 203, 811–816. [Google Scholar] [CrossRef]
  42. Xu, J.; Bartholomew, C.H. Temperature-programmed hydrogenation (TPH) and in situ Mössbauer spectroscopy studies of carbonaceous species on silica-supported iron Fischer-Tropsch catalysts. Phys. Chem. B 2005, 109, 2392–2403. [Google Scholar] [CrossRef]
  43. Nakhaei Pour, A.; Housaindokht, M.R.; Tayyari, S.F.; Zarkesh, J.; Alaei, M.R. Deactivation studies of Fischer-Tropsch synthesis on nano-structured iron catalyst. J. Mol. Catal. A Chem. 2010, 330, 112–120. [Google Scholar] [CrossRef]
  44. Mo, W.L.; Wang, X.X.; Zou, M.; Huang, X.J.; Ma, F.Y.; Zhao, J.Z.; Zhao, T.S. Influence of Ni Precursors on the Structure, Performance, and Carbon Deposition of Ni-Al2O3 Catalysts for CO Methanation. ACS Omega 2021, 6, 16373–16380. [Google Scholar] [CrossRef]
  45. Paalanen, P.P.; van Vreeswijk, S.H.; Weckhuysen, B.M. Combined in situ x-ray diffractrometry/raman spectroscopy of iron carbide and carbon species evolution in Fe(-Na-S)/a-Al2O3 catalysts during Fisch-Tropsch synthesis. ACS Catal. 2020, 10, 9837–9855. [Google Scholar] [CrossRef]
  46. Brunetto, R.; Lantz, C.; Ledu, D.; Baklouti, D.; Barucci, M.A.; Beck, P.; Delauche, L.; Dionnet, Z.; Dumas, P.; Duprat, J.; et al. Iron irradiation of allende meteorite probed by visible, IR, and Raman spectroscopy. Icarus 2014, 237, 278–292. [Google Scholar] [CrossRef]
  47. Wielers, A.F.H.; Kock, A.J.H.M.; Hop, C.E.C.A.; Geus, J.W.; van der Kran, A.M. The Reduction Behavior of Silica-Supported and Alumina-Supported Iron Catalysts: A Mossbauer and Infrared Spectroscopic Study. J. Catal. 1989, 117, 1–18. [Google Scholar] [CrossRef]
  48. Hou, W.J.; Wu, B.S.; An, X.; Li, T.Z.; Tao, Z.C.; Zheng, H.Y.; Xiang, H.W.; Li, Y.W. Effect of the ratio of precipitated SiO2 to binder SiO2 on iron-based catalysts for Fischer-Tropsch synthesis. Catal. Lett. 2007, 119, 353–360. [Google Scholar] [CrossRef]
  49. Pariona, N.; Camacho-Aguilar, K.I.; Ramos-González, R.; Martinez, A.I.; Herrera-Trejo, M.; Baggio-Saitovitch, E. Magnetic and structural properties of ferrihydrite/hematite nanocomposites. J. Magn. Magn. Mater. 2016, 406, 221–227. [Google Scholar] [CrossRef]
  50. Huggins, F.E.; Bali, S.; Huffman, G.P.; Eyring, E.M. Iron-oxide aerogel and xerogel catalyst formulations: Characterization by 57Fe Mössbauer and XAFS spectroscopies. Spectrochim. Acta Part A 2010, 76, 74–83. [Google Scholar] [CrossRef]
  51. Hafner, S.S.; Stanek, J.; Stanek, M. 57Fe Hyperfine interactions in the magnetic phase of fayalite, Fe2SiO4. J. Phys. Chem. Solids 1990, 51, 203–208. [Google Scholar] [CrossRef]
  52. Yuen, S.; Chen, Y.; Kubsh, J.E.; Dumesic, J.A.; TopsØe, N.; TopsØe, H. Metal Oxide-Support Interactions in Silica-Supported Iron Oxide Catalysts Probed by Nitric Oxide Adsorption. J. Phys. Chem. 1982, 86, 3022–3032. [Google Scholar] [CrossRef]
Figure 1. XRD pattern of the calcined precursor samples.
Catalysts 12 00916 g001
Figure 2. ATR-FTIR spectra of fresh calcined samples: (a) full spectra range with 400–4000 cm−1; (b) spectra range with 400–1200 cm−1).
Catalysts 12 00916 g002
Figure 3. Temperature programmed reduction profiles of the calcined samples.
Catalysts 12 00916 g003
Figure 4. Total H2 consumption during TPR for the fresh samples with different K loadings.
Catalysts 12 00916 g004
Figure 5. Fe2p spectra of as-prepared catalysts.
Catalysts 12 00916 g005
Figure 6. In situ XRD pattern of calcined samples during syngas reduction procedure (H2/CO = 20, from an ambient temperature up to 260 °C, and maintained at 260 °C).
Catalysts 12 00916 g006
Figure 7. Peak splitting and fitting of H2-TPH profiles of the four catalyst samples (color correspondance by, red: carbidic carbon; black: amorphous carbon; green: β carbon; blue: bulk carbon 1; purple: bulk carbon 2; brown: bulk carbon 3).
Catalysts 12 00916 g007
Figure 8. Relationship between reactive carbon and bulk carbide carbon contents with K loading.
Catalysts 12 00916 g008
Figure 9. Variation of CO conversion with time on stream over the samples (Reaction conditions: FBR, H2/CO = 1.5, 2.3 MPa, 235 °C; Activation: H2/CO = 20, 260 °C, 24 h).
Catalysts 12 00916 g009
Figure 10. Raman spectra of four spent catalysts. The inset pattern is the intensity of the D band (I(D)) and G band (I(G)) plotted with potassium loading.
Catalysts 12 00916 g010
Figure 11. CO2 and CH4 selectivity with time on stream over the samples (reaction conditions: FBR, 2.3 MPa, 235 °C; Activation: H2/CO = 20, 260 °C, 24 h).
Catalysts 12 00916 g011
Figure 12. Olefin-to-paraffin ratio in the C2–C4 section with time in-stream over the samples (reaction conditions: FBR, 2.3 MPa, 235 °C; Activation: H2/CO = 20, 260 °C, 24 h).
Catalysts 12 00916 g012
Figure 13. FTIR spectra of the spent catalysts following FTS reaction.
Catalysts 12 00916 g013
Figure 14. XRD pattern of the spent catalyst samples following FTS reaction (c.a. 280 h).
Catalysts 12 00916 g014
Figure 15. MES spectra of samples after FTS reaction.
Catalysts 12 00916 g015
Figure 16. Relative contents of each phase acquired from MES over four spent catalyst samples.
Catalysts 12 00916 g016
Table 1. Quantitative results of H2 consumption for the catalysts in the H2-TPR procedure.
SamplePeakPeak Centre, °CH2 Consumption, mol H2/mol FeFe% in First Peak
SingleTotal
Lab-1I226.80.271.4219.11
II589.90.6/
III629.40.55/
Lab-2I245.30.241.2319.83
II579.10.858/
III635.30.125/
Lab-3I252.30.2371.121.42
II558.30.868/
Lab-4I253.80.2181.0121.54
II526.00.792/
Table 2. Attributed temperature of carbon species corresponding to the surface reaction of the H2-TPH process over catalysts with different potassium loading.
SampleTPH Peak Temperature, °C
Carbidic CAmorphous Cβ-CBulk C1Bulk C2Bulk C3
Lab-1324385446504552625
Lab-2312365/523562624
Lab-3319385/473544/
Lab-4319373/470540/
Table 3. Relative contents of carbonaceous species calculated from the corresponding peak area of Gaussian fitting of H2-TPH patterns over the catalysts with a different potassium loading.
SampleCarbon Species Assignment and Relative Percentage, %
Carbidic CAmorphous Cβ-CBulk C1Bulk C2Bulk C3Total Bulk C
Lab-14.535.4416.335.0727.8940.7473.63
Lab-225.995.12/29.6132.946.3468.89
Lab-341.6711.67/16.0230.64/46.66
Lab-449.9111.2/29.259.64/38.89
Table 4. The crystallite size of the fresh samples (oxide) and χ-Fe5C2 over the spent samples after FTS reaction (c.a. 280 h).
Crystallite Size, nm
Lab-1Lab-2Lab-3Lab-4
a Fresh samples<8<8<8<8
b χ-Fe5C212152041
a: confirmed by TEM; b: calculated by an XRD signal of (510) facet.
Table 5. MES spectrum analysis results of four spent catalysts with different potassium contents after the FTS reaction.
Cat. PhasesMossbauer ParametersPhase
Percentage (%)
IS (mm·s−1)QS (mm·s−1)Hhf (T)Area (%)
Lab-1Doublet1Fe3+ (spm)0.33780.602/6.16FH: 38.45
Doublet2Fe3+ (spm)0.33561.025/32.29/
Doublet3Fe2SiO41.1382.806/15.07Fe2SiO4: 15.07
Mixed M+Q (1)Fe3O4 (A)0.2940.007549.9815.78Fe3O4: 33.1
Mixed M+Q (2)Fe3O4 (B)0.617−0.06446.6117.32/
Mixed M+Q (3)χ-Fe5C20.109−0.065619.00913.38χ-Fe5C2: 13.38
Lab-2Doublet1Fe3+ (spm)0.3630.628/9.19FH: 46.86
Doublet2Fe3+ (spm)0.35651.014/37.67/
Doublet3Fe2SiO40.9882.392/4.15Fe2SiO4: 4.15
Mixed M+Q (1)Fe3O4 (A)0.314−0.036849.01512.73Fe3O4: 31.13
Mixed M+Q (2)Fe3O4 (B)0.671−0.027445.59918.39/
Mixed M+Q (3)χ-Fe5C20.19360.115518.5417.86χ-Fe5C2: 17.86
Lab-3Doublet1Fe3+ (spm)0.3450.695/14.88FH: 35.97
Doublet2Fe3+ (spm)0.35981.147/21.09/
Doublet3Fe2SiO40.95942.354/8.16Fe2SiO4: 8.15
Mixed M+Q (1)Fe3O4 (A)0.3089−0.023850.23521.49Fe3O4: 37.06
Mixed M+Q (2)Fe3O4 (B)0.68250.0148946.8315.57/
Mixed M+Q (3)χ-Fe5C2 (I)0.50390.24120.5797.87χ-Fe5C2: 18.82
Mixed M+Q (4)χ-Fe5C2 (II)0.0586−0.132419.92610.95/
Lab-4Doublet1Fe3+ (spm)0.3390.6685/5.49FH: 34.06
Doublet2Fe3+ (spm)0.35940.9918/28.57/
Doublet3Fe2SiO41.01442.2969/9.21Fe2SiO4: 9.21
Mixed M+Q (1)Fe3O4 (A)0.271−0.0677849.08917.98Fe3O4: 31.7
Mixed M+Q (2)Fe3O4 (B)0.7380.087946.53913.72/
Mixed M+Q (3)χ-Fe5C2 (I)0.4110.211520.52511.91χ-Fe5C2: 25.03
Mixed M+Q (4)χ-Fe5C2 (II)0.04487−0.0546519.74913.12/
Publisher’s Note: MDPI stays neutral with regard to jurisdictional claims in published maps and institutional affiliations.

