Article

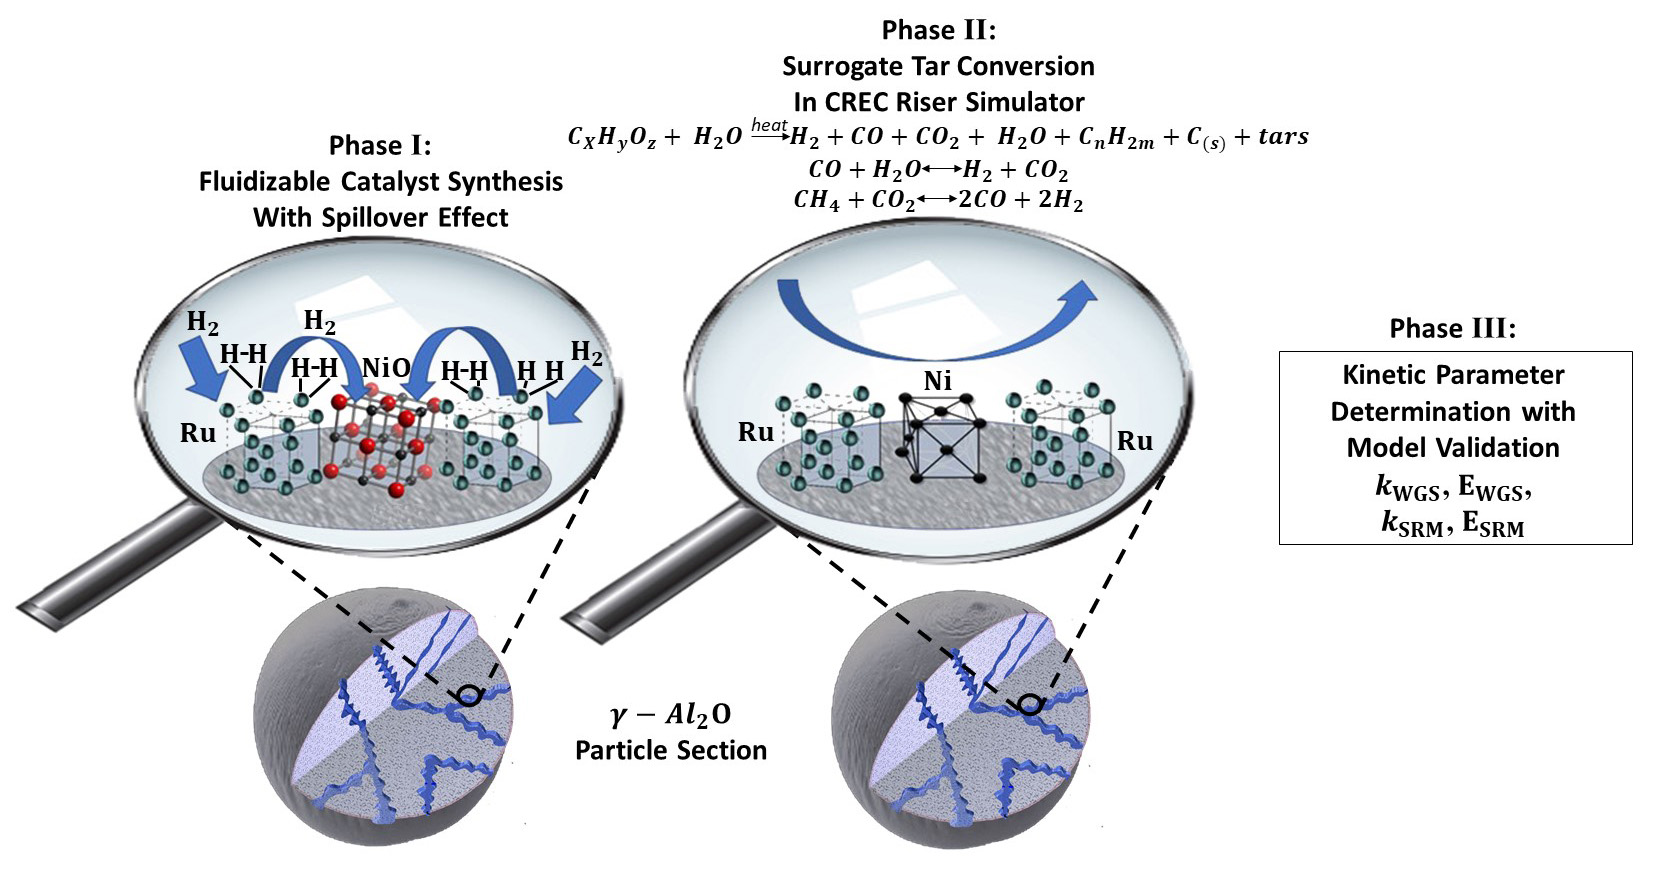
Kinetic Model of Catalytic Steam Gasification of 2-Methoxy-4-methylphenol Using 5% Ni–0.25% Ru/γAl2O3 in a CREC-Riser Simulator

by
Alán Rubén Calzada Hernandez
1,
Benito Serrano Rosales
1,2 and
Hugo de Lasa
3,*
1
DOCII, Unit of Electrical Sciences, Universidad Autonoma de Zacatecas, Campus UAZ Siglo XXI, Bldg 14, Carr. a Guadalajara Km. 7, Zacatecas 98160, Mexico
2
MCTQ, Unit of Chemical Sciences, Universidad Autonoma de Zacatecas, Campus UAZ Siglo XXI, Bldg. 5 & 6, Carr. a Guadalajara Km. 7, Zacatecas 98160, Mexico
3
Faculty of Engineering, Chemical Reactor Engineering Centre (CREC), Western University, London, ON N6A 5B9, Canada
*
Author to whom correspondence should be addressed.
Catalysts 2022, 12(3), 282; https://doi.org/10.3390/catal12030282
Submission received: 10 January 2022 / Revised: 12 February 2022 / Accepted: 20 February 2022 / Published: 2 March 2022

Abstract

:
Hydrogen is an energy vector with a great potential due its ample range of applications and clean combustion cycle. Hydrogen can be produced through biomass steam gasification, with novel catalysts being of significant value to implement this process. With this goal in mind, in the present study, 5 wt % Ni/γAl2O3 promoted with 0.25 wt % Ru was synthesized and characterized. It is assumed that ruthenium facilitates hydrogen transfer to nickel oxide sites, promoting a hydrogen spillover effect, with the H2 adsorbed on Ru being transported to Ni sites. To describe chemical changes, the present study considers a kinetic model involving Langmuir–Hinshelwood-based rate equations, as a sum of independent reactions, with this being applied to the steam gasification of 2-methoxy-4-methylphenol (2M4MP). This tar biomass surrogate was studied in a fluidized CREC (Chemical Reactor Engineering Centre) Riser Simulator reactor, at different reaction times (5, 20 and 30 s.) and temperatures (550 °C, 600 °C and 650 °C). The proposed kinetics model was fitted to the experimentally observed H2, CO2, CO, CH4 and H2O concentrations, with the estimated pre-exponential factors and activation energies being in accordance with the reported literature data. It is anticipated that the postulated model could be of significant value for the modeling of other biomass conversion processes for hydrogen production using other supported catalysts.

Graphical Abstract

1. Introduction

Nowadays, the world’s energy supply greatly depends on the use of fossil fuels, which are a finite resource. Extensive use of these fossil fuels is the origin of severe environmental problems. Thus, the transition to other types of alternative energies is a pressing issue. Biomass gasification is a viable option due the flexibility it has with handling various biomass feedstocks. Biomass gasification leads to the production of synthesis gas (H2 + CO), which can be used for energy production, in a CO2 overall emission neutral process. Hydrogen has a wide range of applications. It has a very clean combustion cycle and a calorific value of 120 MJ/kg, which is 2.7 greater than the one for gasoline [1].
Currently, one of the main challenges of biomass gasification is to achieve a high biomass conversion into synthesis gas (H2 and CO), while avoiding the production of unwanted tars. As an alternative, catalytic biomass gasification allows one to achieve these goals with a significant reduction of tars.
The biomass used in small-scale gasifiers is frequently of the wood-derived waste-type, which consists mainly of hemicellulose (12.7–23.2% w/w), cellulose (36.4–50.3% w/w) and lignin (16.6–28.6% w/w) [2]. Of the three main biomass components, lignin produces the highest quantity of tars during steam gasification [3]. To be able to study tar catalytic conversion, 2M4MP has been frequently selected as a tar surrogate molecule [4,5].
Ni-based catalysts have a high activity allowing the breaking of C–C, C–H, C–O and O–H bonds, as well as allowing H atoms to form H2 molecules. Unfortunately, nickel-based catalysts suffer from significant coke deposition, which blocks the active sites, decreasing catalytic activity [6,7]. To address this issue, our team proposed in our previous studies [8] a stable fluidizable Ni–Ru/γAl2O3 catalyst, active for the steam gasification of 2M4MP. This fluidizable catalyst was characterized by our team, in terms of XRD, N2 adsorption–desorption (BET, BJH), TPR, TPD and H2 chemisorption, as reported in a recent article [8].
This catalyst was evaluated in a fluidizable CREC riser simulator reactor. These studies reported that the Ru on Ni/γAl2O3, is suitable for lignin surrogate steam gasification, displaying an 80% 2M4MP conversion, at 600 °C, with a significant reduction in coke formation, when compared to that of a Ni/γ-Al2O3 catalyst. It is worth mentioning that for all the catalysts studied by our team [8], the H2, CO2 and CO molar fractions were above and the methane fraction was below the thermodynamic equilibrium values. This finding was assigned to the significant role of the methane reforming reaction CH 4 + H 2 O CO + 3 H 2 , with methane being consumed, and H2 and CO2 molar fractions increasing
Concerning the development and implementation of biomass gasifier units, one can mention that this requires a suitable kinetics [9]. In the present study, a kinetic model is proposed, using data obtained during the gasification of 2M4MP, in a fluidized CREC riser simulator, and while using the 5% Ni–0.25% Ru/γAl2O3 catalyst. With this end, a set of three independent reactions are considered: water–gas shift, reforming with methane steam and carbon gasification. The reaction rates are expressed using Langmuir–Hinshelwood-based equations, which include adsorption parameters and intrinsic reaction constants. The net reaction rates of formation and consumption of the chemical species are accounted for as an algebraic addition of the independent reaction rates [2,4]. The kinetic parameters (reaction kinetic constants, activation energies and pre-exponential factors) obtained are estimated using experimental data at different temperatures (550 °C, 600 °C and 650 °C). It is anticipated that the reported kinetic model provides the basis for an original and valuable design of catalytic gasifiers of biomass waste.

2. Results and Discussion

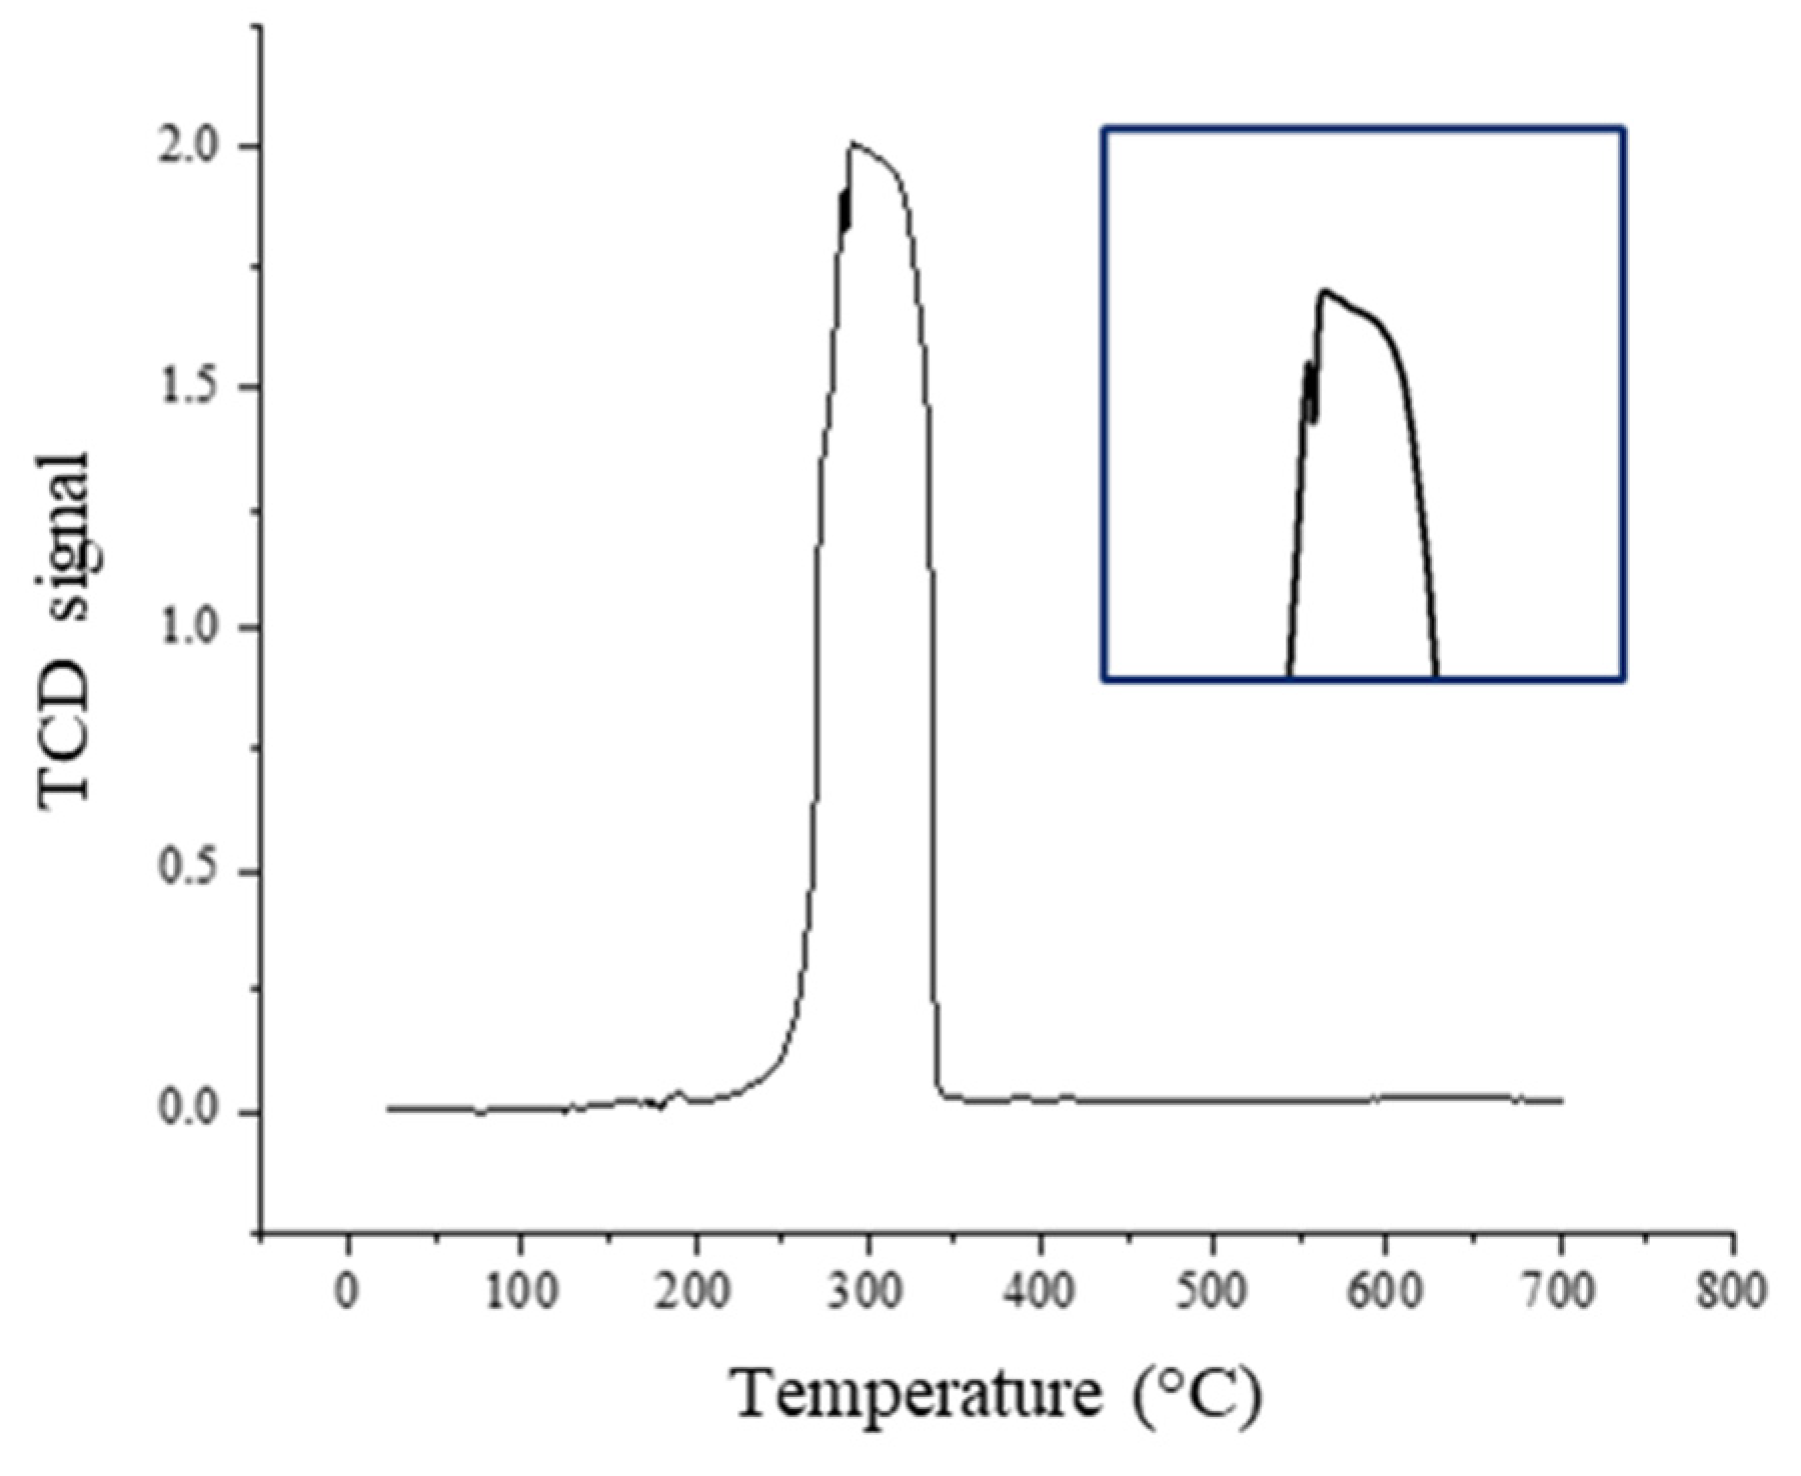
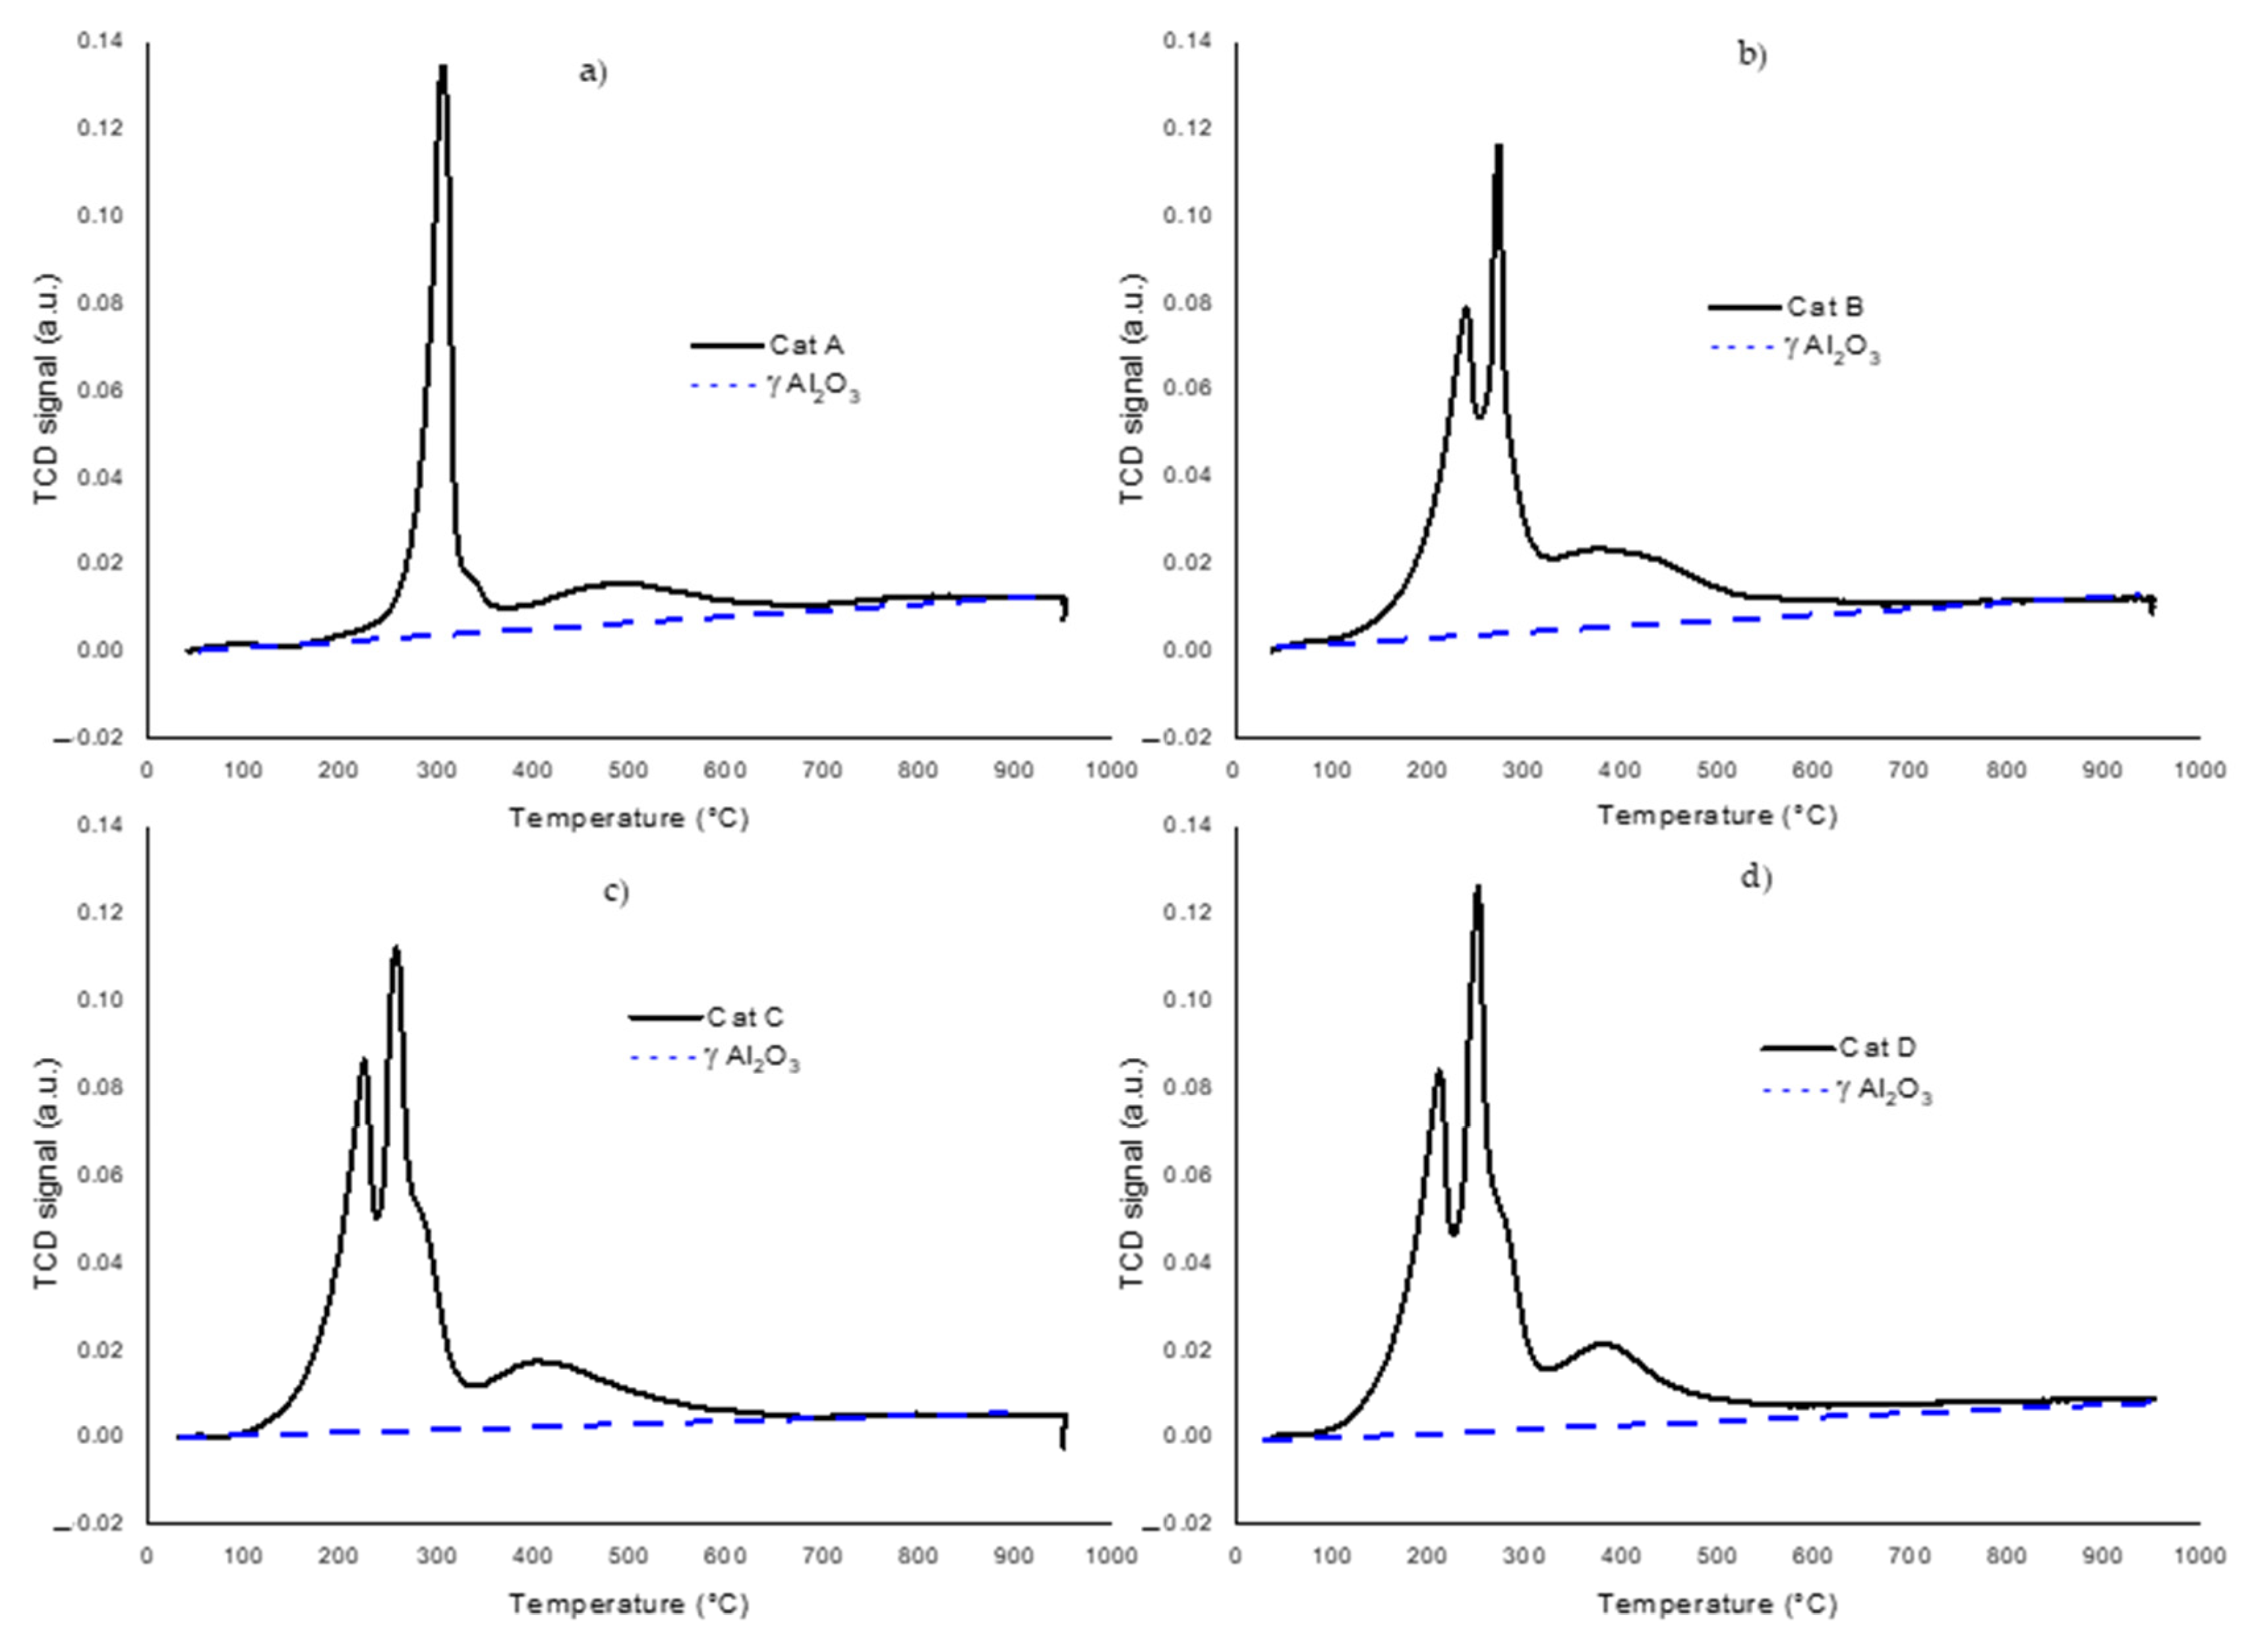
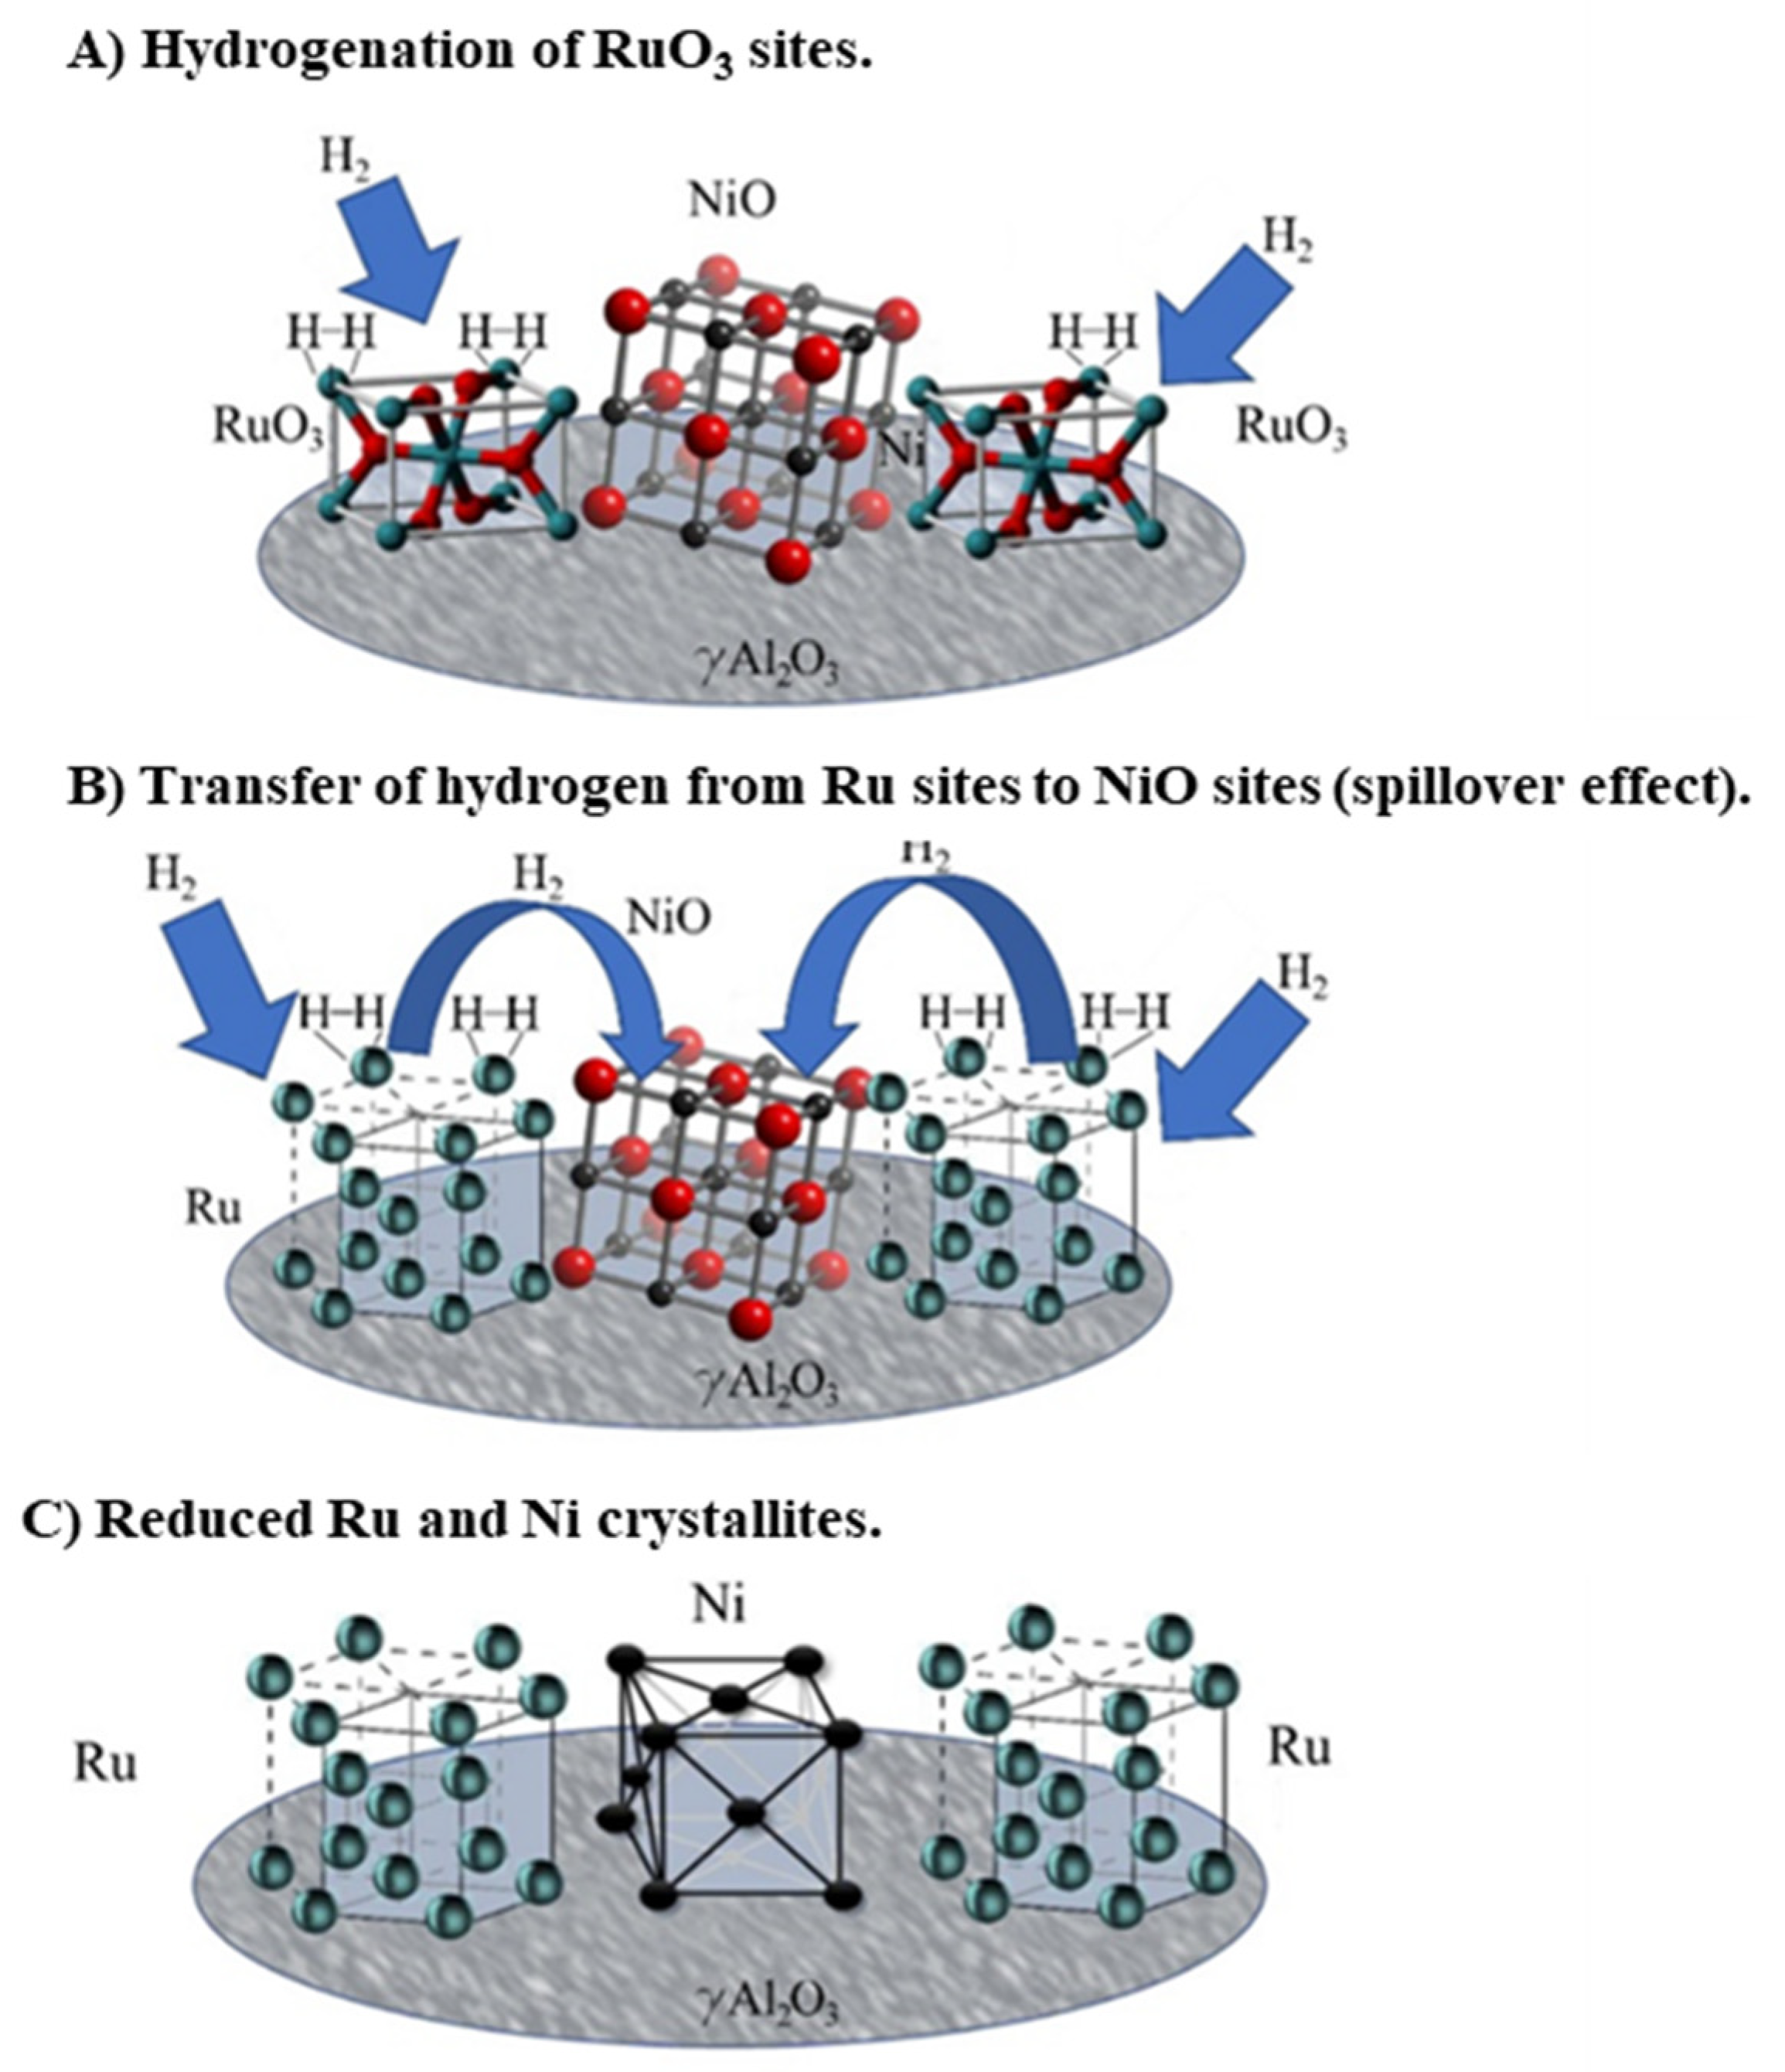
2.1. Spillover Effect from TPR Analysis

The reducibility of Ni and Ru oxides crystallites is a most relevant property of the prepared catalysts.
Ni and Ru reducibility can be assessed using temperature programmed reduction (TPR) peaks, which reflect H2 consumption at various thermal levels.
Figure 1 reports the TPR profile of the Ni precursor salt, Ni(NO3)2, evaluated prior to the impregnation of the support. Ni(NO3)2 TPR yields a broad peak, which can be used as a reference for the comparison with the TPR of various nickel impregnated catalysts.
Figure 1 reports a broad TPR peak suggesting two close and overlapped TPR signals. The first TPR peak is located at 285 °C and can be assigned to the thermal decomposition of the Ni(NO3)2 as in Equation (1):
2 Ni ( NO 3 ) 2 ,   ( s ) Δ 2 NiO ( s ) + 4 NO 2 , ( g ) + O 2 , ( g )
with the thermal conductivity detector (TCD) recording the NOx and O2 formed species.
The second TPR peak is positioned at 292 °C, with the TCD signals reflecting hydrogen consumption given the Ni oxide reduction as per the following Equation (2),
NiO + H 2 Ni + H 2 O
Figure 2 reports the TPR profiles for the alumina support (straight dotted line), and those for the monometallic Ni and bimetallic Ni-Ru catalysts as follows: (a) Cat A: 5% Ni/γAl2O3, (b) Cat B: 5% Ni–0.25% Ru/γAl2O3, (c) Cat C: 5% Ni–0.5% Ru/γAl2O3, (d) Cat D: 5% Ni–1.0% Ru/γAl2O3. One can see that in the case of γAl2O3, there are no TPR recorded peaks. Consequently, one can conclude that there are no reducible species available in the γAl2O3.
Table 1 reports the decomposition temperatures of Ni(NO3)2, and the reduction temperatures for several of the NiO and RuO3 prepared catalysts.
In Figure 2a, for Cat A, one can observe two TPR peaks: (a) a first TPR peak at 303 °C, which can be associated with the Ni(NO3)2 thermal decomposition and (b) a second TPR peak at 488 °C, which can be attributed to the NiO reduction to Ni.
One can also notice that in Figure 2b–d, for the catalysts with added Ru, a new TPR peak appears in the 210–245°C range. This new TPR peak can be assigned to the RuO3 reduction, with metallic Ru species being formed according to reaction 4 (Table 2). One should also note that RuO3 is produced during the catalyst synthesis, following the RuCl3•x H2O drying [10].
Furthermore, when analyzing the TPRs for the catalysts with different Ru loadings (0.25 wt %, 0.5 wt % and 1.0 wt %) and with 5 wt % Ni, it was observed, as reported in Table 3, that there is an increase in the TPR hydrogen consumption as the Ru loadings rise. The NiO and RuO3 reduction temperatures both gradually decrease at higher Ru, as reported in Table 1. For instance, when 1 wt % Ru was added, the Ni(NO3)2 decomposition temperature decreased from 303 °C to 248 °C and the NiO reduction temperature in turn decreased from 488 °C to 380 °C. One should notice that by knowing the H2 consumed, one can calculate the percentages of both Ni and Ru reduced metals, using the stoichiometries reported in Table 2.
Thus, it appears that a Ru addition favors the hydrogen spillover effect with the H2 chemisorbed on the Ru being transferred to the NiO sites. This hydrogen spillover eases NiO reduction conditions and increases, as a result, the nickel reduction at lower temperatures [11,12,13].
Figure 3 provides a schematic description of the hydrogen spillover effect, with the following steps being hypothesized: (a) Step 1: H2 chemisorbs on RuO3, forming Ru crystallites, with nitrate decomposing into O2g, NO2g and NiOs, (b) Step 2: H2 chemisorbed hydrogen on Ru migrates to the NiO sites, (c) Step 3: H2 chemisorbed on NiO yields Ni crystallite particles.
Regarding the spillover effect and its importance in the present study, it is observed that the addition of Ru enhances consistently Ni reducibility, with the 0.25 wt % Ru (catalyst B), 0.5 wt % Ru (catalyst C) and 1.0 wt % Ru (catalyst D). As shown in Table 3, catalysts B, C and D yield 34%, 56% and 92% increased amounts of consumed hydrogen, versus the TPR for catalyst A without Ru [13,14].

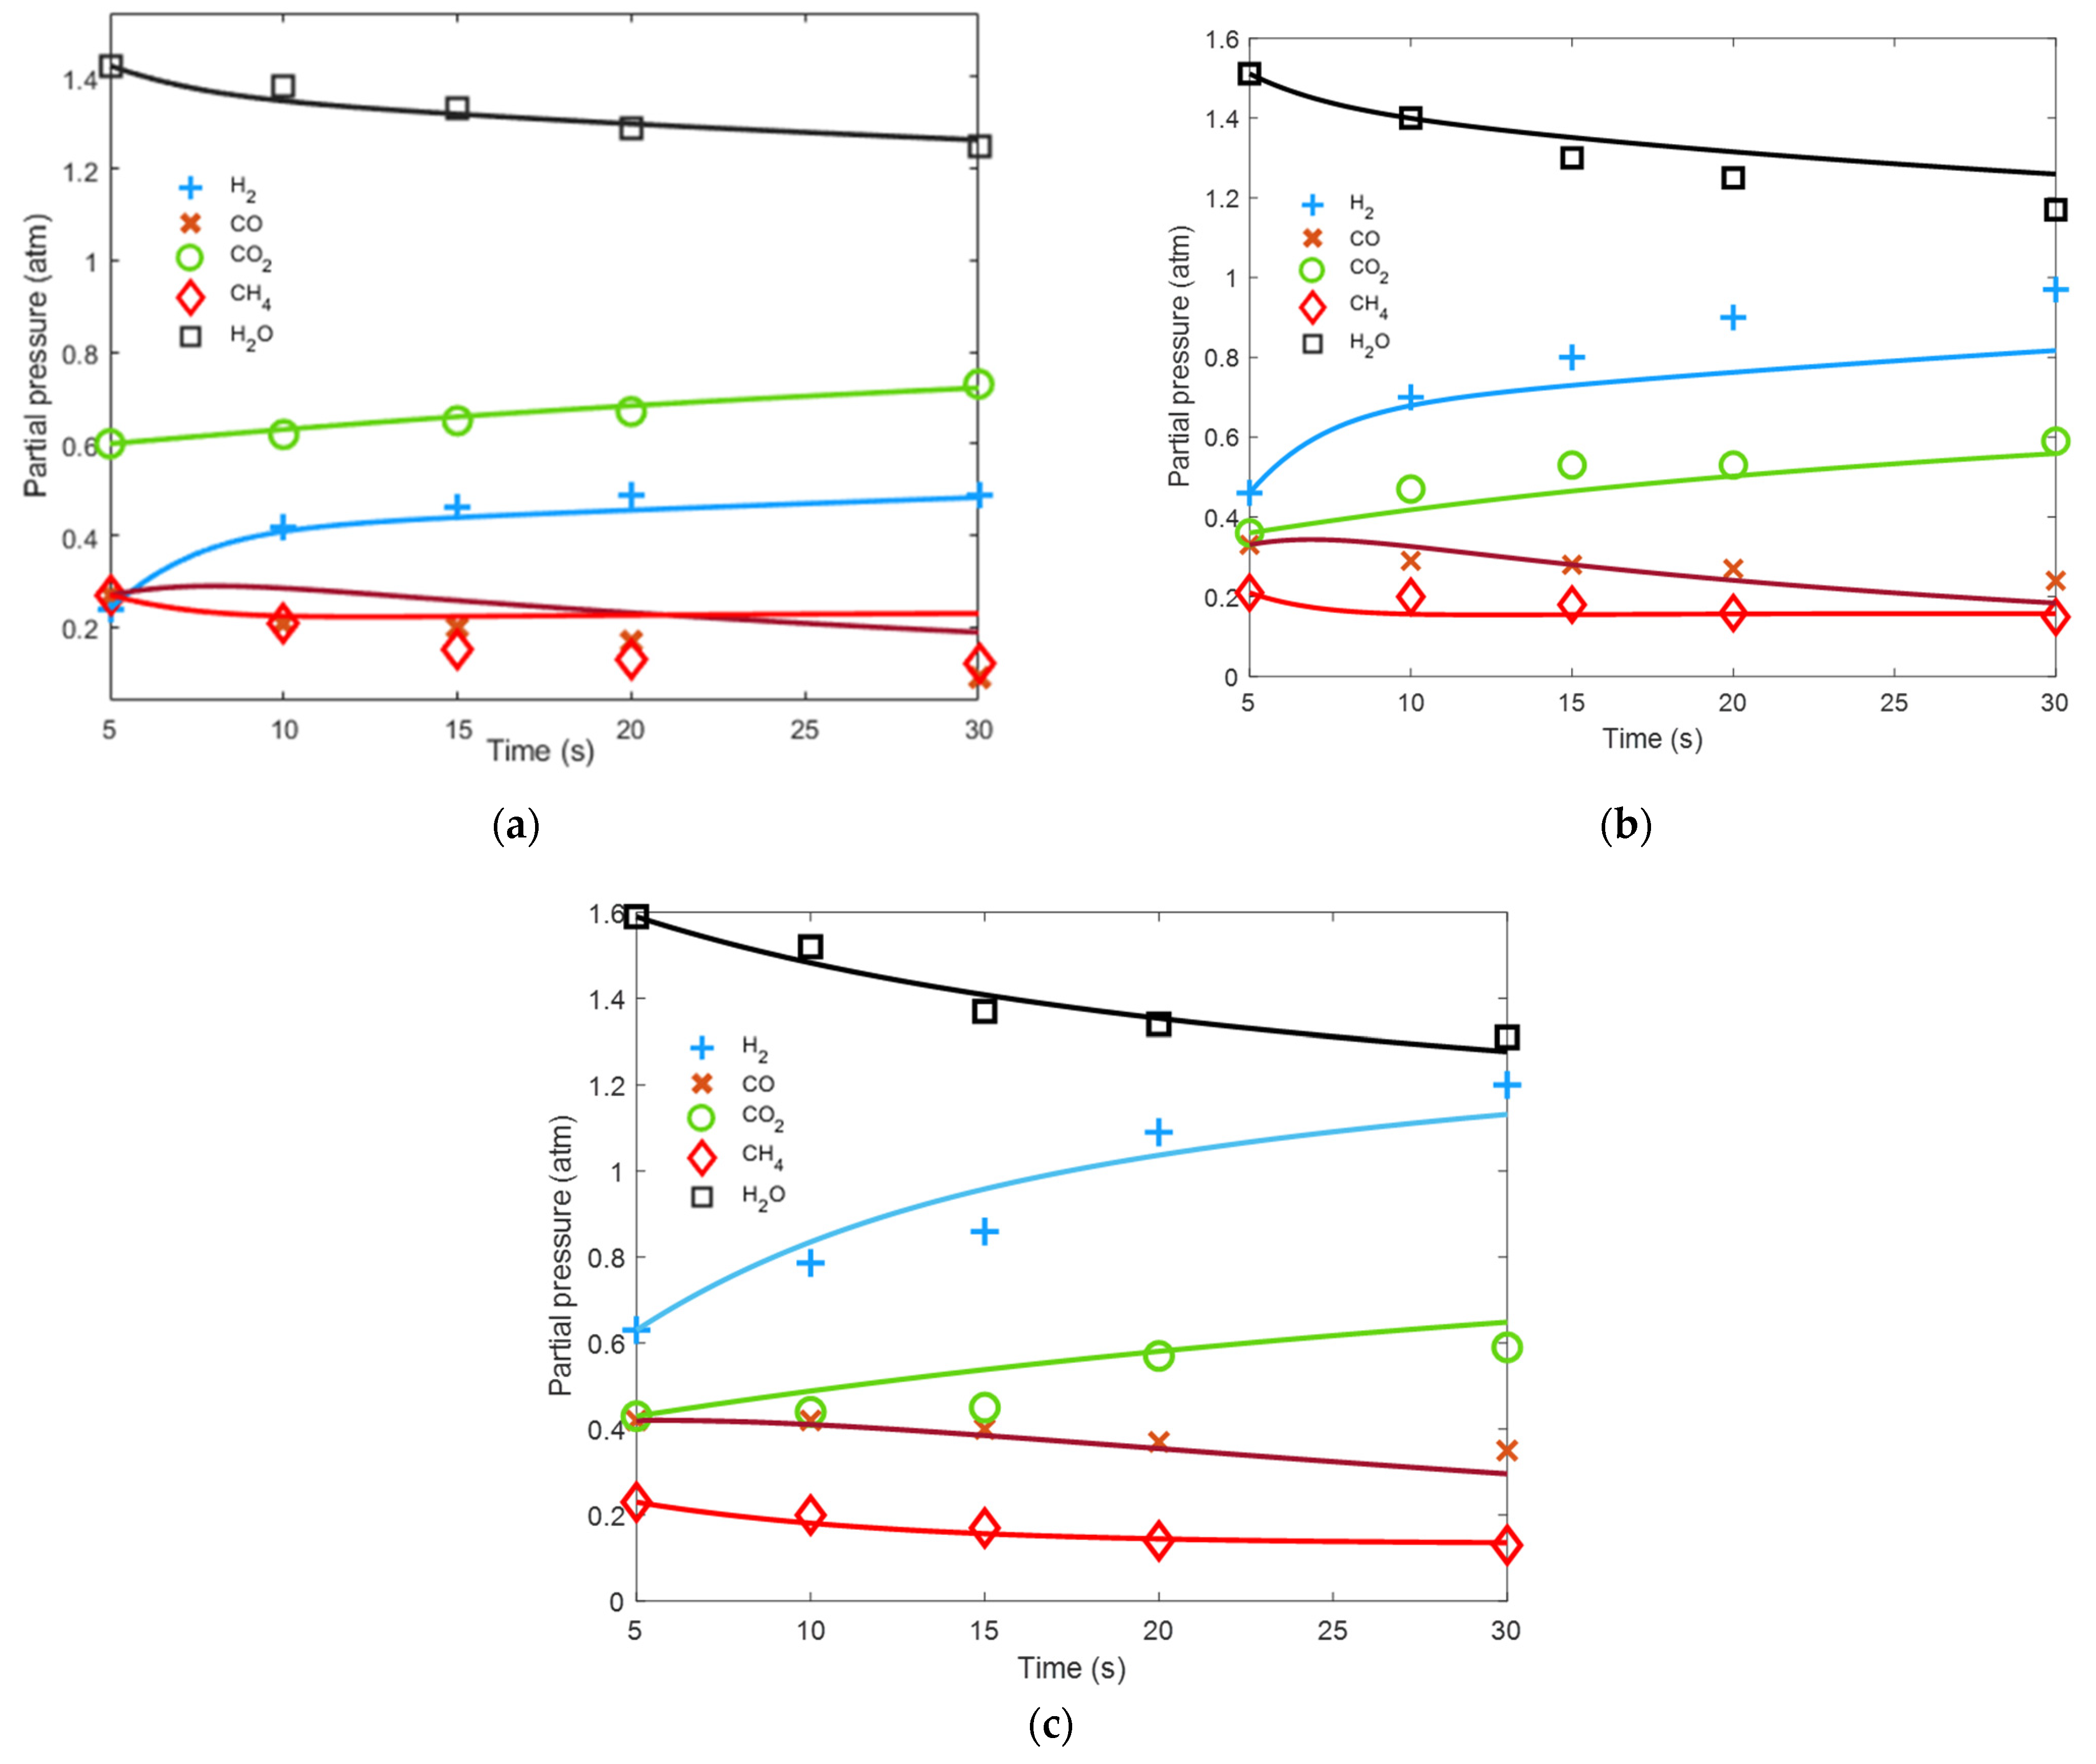
2.2. Experimental Gasification Results

Gasification runs in the CREC riser simulator with the GC system allowed us to identify and quantify H2, CO, CO2, CH4, C and H2O as the main products, with aromatic compounds detected in very low amounts [8].
Table 4 reports the various partial pressures of the main product species at the three temperatures and five reaction times.
The experimental data obtained were used to validate a kinetic model and fit the various kinetic parameters, as is shown in the upcoming section.

3. Model Development

The present study reports a kinetic model suitable for a 5% Ni–0.25% Ru/γAl2O3 (Table 4) catalyst. Biomass steam gasification can be described via a primary reaction (Equations (5a,b)) and secondary reactions (Equations (7)–(12)).
These reactions transform biomass into permanent gases (CO, CO2 and H2), light hydrocarbons (methane, ethylene), solid coke and undesirable tars.
C x H y O z + H 2 O   heat H 2 + CO + CO 2 + H 2 O + C n H 2 m + C ( S ) + tars
The light CnH2m hydrocarbons can subsequently be transformed with steam into synthesis gas:
C n H 2 m + nH 2 O   nCO + ( n + m ) H 2
The combination of Equations (5a,b) can be used to describe the 2M4MP gasification as follows:
C 8 H 10 O 2 + ε H 2 O α H 2 + β CO + γ CO 2 + δ H 2 O +   CH 4 + η C ( S )
with ε ,   α , β, γ, δ, φ and η representing the stoichiometric coefficients for the various chemical species
Given the primary gasification reactions are essentially complete (100% 2M4MP conversion) under the conditions of the present study, the product gas composition is determined by the secondary reactions, as shown in Table 5:
One can also notice that from these six possible reactions, only three are independent as can be shown using the Gauss–Jordan method. On this basis, Equations (7), (8) and (10) were selected as independent for further analysis.
Equations (6) and (10)–(12) involve coke formed and consumed. One should note that with the Ru–Ni–γAl2O3 catalyst of the present study, the observed amount of coke formed was negligible in all cases [8]. As a result, coke gasification, coke hydrogenation and Boudouard gasification reactions were disregarded, and only two independent equations reactions were considered (Equations (7) and (8)). In addition, given the negligible amounts of coke formed with the developed catalyst, one can anticipate a catalyst operation without catalyst deactivation by coke.
Thus, and on this basis, the overall reaction rate for each compound, ri, can be expressed as the algebraic addition of the rates of the two dominant independent reactions: water gas shift (WGS) and steam reforming of methane (SRM) [2].
r i = ν j , i r j = ν WGS , i r WGS + ν SRM , i r SRM
where ν j , i is the stoichiometric coefficient of species “i” in reaction “j” and r j is the “j” reaction rate.
In addition, and for each one of the reaction rates considered, a Langmuir–Hinshelwood model can be adopted involving the adsorption constants of the various chemical species involved [2,15,16] as,
r i = k i K i A p i ( 1 + j = 1 n K j A p j ) m
where, ri is the reaction rate of component “i” in mol/gcat s, ki is the kinetic constant of the “i” component in mol/gcat s, K i A is the equilibrium adsorption constant for the “i” component in 1/bar and pi is the partial pressure of “i” component in bar. The term “n” is the number of chemical species; “j” is a subscript used to denote each species in the denominator term; “m” is the number of catalyst sites involved in the catalytic reaction.

3.1. Water–Gas Shift Mechanism

In the specific case of the water–gas shift reaction (Equation (7)), the chemical change can be considered to involve a sequence of adsorption–surface reaction–desorption steps, represented by the Equations (15)–(19):
CO + S CO S
H 2 O + S H 2 O S
CO · S   +   H 2 O · S CO 2 · S   +   H 2 · S
CO 2 + S CO 2 S
H 2 · S H 2 + S
At 550–650 °C, the adsorption or desorption steps can be considered at adsorption equilibrium with the surface reaction as the controlling step, as reported in [17]. On this basis a reaction rate model can be obtained as:
r WGS = k WGS p CO p H 2 O ( 1 + K CO A p CO + K H 2 O A p H 2 O + K H 2 A p H 2 + K CH 4 A p CH 4 ) 2 ( 1 p CO 2 p H 2 K WGS p CO p H 2 O )
For derivation details for Equation (20), refer to the Supplementary Material S1.

3.2. Methane Steam Reforming Mechanism

For steam methane reforming (Equation (8)), a sequence of adsorption–surface reaction–desorption steps can be described as follows:
CH 4 + S CH 4 S
H 2 O + S H 2 O S
CH 4 S + H 2 O · S + 2 S 3 H 2 S + CO S
3 H 2 S 3 H 2 + 3 S
CO S CO + S
Considering again adsorption and desorption steps at equilibrium and the surface reaction as the controlling step due analogous arguments to those of WGS reaction, a rate expression for methane steam reforming can be obtained as:
r SRM = k SRM p CH 4 p H 2 O ( 1 + K CH 4 p CH 4 + K CO 2 p CO 2 + K H 2 O A p H 2 O + K H 2 A p H 2 + K CO A p CO ) 4 ( 1 p CO p H 2 3 K SRM p CH 4 p H 2 O )
Regarding Equation (26), its mechanistic basis can be obtained using a similar methodology than the one for the water gas shift reaction as reported in the Supplementary Material S1.

3.3. Gasification in the CREC Riser Simulator

The CREC riser simulator reactor operates as an isothermal minifluidized batch reactor with good mixing. This allows to postulate the following rate expression:
r i = V W d ( p i RT ) dt
where V is the volume of the reactor, W is the weight of the catalysts in the reaction, T is the temperature and R is the universal gas constant, and all of them are constants. Also, using the Equations (14) and (27), it results,
dp i dt = V W RTk i i p i ( 1 + j = 1 n K j A p j ) m
Previous studies of our research group show that the adsorptions of CH4, CO, H2 and H2O are negligible [12,18] with CO2 adsorption being the only phenomenon to be considered [2].
Therefore, and for each one of the species under consideration, the following differential equations can be postulated:
dp H 2 dt = W V RTk WGS p CO p H 2 O ( 1 + K CO 2 A p CO 2 ) 2 ( 1 p CO 2 p H 2 K WGS p CO p H 2 O ) + 3 W V RTk SRM p CH 4 p H 2 O ( 1 + K CO 2 A p CO 2 ) 4 ( 1 p CO p H 2 3 K SRM p CH 4 p H 2 O )
dp CO dt = W V RTk WGS p CO p H 2 O ( 1 + K CO 2 A p CO 2 ) 2 ( 1 p CO 2 p H 2 K WGS p CO p H 2 O ) + W V RTk SRM p CH 4 p H 2 O ( 1 + K CO 2 A p CO 2 ) 4 ( 1 p CO p H 2 3 K SRM p CH 4 p H 2 O )
dp CO 2 dt = W V RTk WGS p CO p H 2 O ( 1 + K CO 2 A p CO 2 ) 2 ( 1 p CO 2 p H 2 K WGS p CO p H 2 O )
dp CH 4 dt = W V RTk SRM p CH 4 p H 2 O ( 1 + K CO 2 A p CO 2 ) 4 ( 1 p CO p H 2 3 K SRM p CH 4 p H 2 O )
dp H 2 O dt = W V RTk WGS p CO p H 2 O ( 1 + K CO 2 A p CO 2 ) 2 ( 1 p CO 2 p H 2 K WGS p CO p H 2 O ) W V RTk SRM p CH 4 p H 2 O ( 1 + K CO 2 A p CO 2 ) 4 ( 1 p CO p H 2 3 K SRM p CH 4 p H 2 O )

3.4. CO2 Adsorption Constant

The CO2 adsorption constant was determined experimentally in the CREC riser simulator reactor, in which adsorption studies can be performed and this is one of its advantages. CO2 adsorption experiments were performed using the 5% Ni–0.25% Ru/γAl2O3 catalyst measuring the amount of CO2 adsorbed. This was accomplished by injecting different CO2 volumes in the reactor CREC riser simulator unit at 500 °C, 550 °C, 600 °C and 650 °C.
Table 6 reports the adsorption parameters obtained for CO2 with the methodology described in Supplementary Material S3.
The results obtained are close to those reported by Mazumder et al. 2014, who obtained adsorption parameters K CO 2 ° and Δ H CO 2 ads of 0.5643 atm−1 and −20.97 kJ/mol, respectively, with a 20% Ni–5% La2O3/γAl2O3 catalyst [18]; this indicates that CO2 adsorption is an exothermic process due to the negative value of the enthalpy.
It is important to mention that once the CO2 adsorption parameters are calculated, they can be used in the following step as set values, breaking in this manner the cross-correlation between k WGS and k SRM constants and adsorption parameters.

3.5. Kinetic Parameters Calculations

Intrinsic kinetic parameters of the kinetic model, were estimated using 2-methoxy-4-methylphenol, gasification experiments were performed using the 5% Ni-0.25%Ru/γAl2O3 catalyst, at 5, 10, 15, 20 and 30 s, reaction times and 550, 600 and 650 °C temperatures. The Steam/2M4MP ratio was set at 1 g/g and the Catalyst/2M4MP ratio at 2.63 g/g. Each experiment was performed at least in triplicate to ensure reproducibility. The various experimental species partial pressures at 5 s, were used as initial values to solve the system of differential equations.
The subroutine ODE45 was used to solve the model differential equations (Equations (29)–(33)), using the fourth-order Runge–Kutta method at 600 °C. Then, the calculated species’ partial pressures were fitted to the experimental data at different reaction times, to estimate k WGS and k SRM   kinetic   constants , using the MATLAB integrated function LSQCURVEFIT (least square curve fitting function) (Table 7).
Once the kWGS and kSRM kinetic parameters at 600 °C were calculated, the k i ° pre-exponential factor and Ej activation energy for each relevant reaction were estimaed using the Arrhenius expression centered at 600 °C:
k j = k j ° exp ( E j R ( 1 T 1 T avg ) )
where k j is the rate constant, k i ° is a pre-exponential frequency factor and E j is the activation energy, for the “j” reaction. Therefore, by substituting Equation (34) into the differential equations of the partial pressures (29)–(33), a system of equations as reported in -the Supplementary Materials S2 for the intrinsic parameters can be obtained (B.1–B.5).
Regarding the kinetic constants at 600 °C, in Table 7 they were used as initial guesses for the pre-exponential factors to fit the model derived species partial pressure (differential equations reported in the Supplementary Materials S2) to the experimental data from Table 4. Furthermore for the activation energies, for the water-to-gas shift reaction (WGS) and steam methane reforming (SRM) 30 and 70 kJ/mol respectively, were considered as initial guess from typical technical literature [18]. One the other hand, for the pre-exponential factors, the initial values were obtained from Arrhenius Equation (34), at 600 °C.
Thus, and on this basis the k i ° and E i parameters were estimated using the Matlab integrated function LSQCURVEFIT (least square curve fitting function) and the ODE45 subroutine which solves the differential equations (reported in the Supplementary Material S2), using the fourth order Runge Kutta method at 550 °C, 600 °C and 650 °C.
Figure 4 shows the fitting of the equations reported in the Supplementary Material S2, to the H2, CO, CO2, CH4 and H2O, experimental measured partial pressures.
The four estimated intrinsic parameters ( k WGS ° ,   k SRM   ° ,   E WGS   y   E SRM ) obtained in the present study are reported in Table 8 and compared with values obtained in previous studies by our research team (17,18), using glucose and 2-methoxy-4-methylphenol and 20% Ni/5% La2O3–γAl2O3 and 2.5% Ni–αAl2O3 catalysts.
Table 8 shows that the 5% Ni-0.25%Ru/γAl2O3 catalyst provides for the water gas shift reaction significantly higher k WGS °   and   k SRM   ° values and this while compared to those obtained by Mazmunder et al 2014 and Salaices et al 2011 [2,19]. Regarding the magnitude of the activation energy for the water-gas shift, a value of 20.21 kJ/mol was estimated in the present study, which is within the range of the activation energies reported in the literature (17.5-26.6 kJ/mol) [20,21].
Table 8 also reports k SRM ° for steam methane reforming reaction with values larger than those reported by Mazumder et al [18] and significantly bigger than those from Salaices et al [19]. On the other hand, the activation energy value of 63.9 kJ/mol s obtained which is close to the range reported in the literature (70-141 kJ/mol) [21,22,23,24,25,26].
In summary, while the activation energies for both water gas shift and methane reforming are in the range reported in the literature [18,19], the catalyst of the present study displays a larger energy of activation for methane reforming versus the water gas shift reaction, favoring CO and H2 selectivities at higher temperatures of 650°C.
Furthermore, the calculated kinetic parameters with narrow 95% confidence intervals as reported in Table 8, also shows the adequacy of the proposed kinetic model as an algebraic sum of water gas shift and methane steam reforming rates to describe the high catalytic activity of the 5% Ni-0.25%Ru/γAl2O3 material.

4. Experimental Methods

4.1. Catalyst Preparation and Characterization

The catalysts of the present study were prepared using incipient wet impregnation. To accomplish this, a γAl2O3 (Sasol Catalox SSCa5/200) fluidizable support was impregnated with aqueous solutions containing both Ni and Ru. Impregnation was achieved by successive γAl2O3 support wetting with Ni(NO3)2·6H2O (CAS 13,478-00-7) and with Sigma Aldrich’s RuCl3 precursors. While the total nickel content was left at 5% w/w, Ru was changed as follows: 0%, 0.25%, 0.5% and 1% w/w.
Following support impregnation, a fixed-bed quartz reactor was used for thermal treatment of a set weight of, e.g., 1 g. To accomplish this, the catalyst precursor was dried first at 120 °C under air flow. Then, the catalyst was reduced with a H2 gas blend as follows: (a) using a 5 °C/min ramp from 120 °C to 250 °C, (b) keeping the temperature at 250 °C for 30 min, (c) increasing the temperature from 250 °C to 450 °C using a 5 °C/min ramp and (d) keeping a 450 °C temperature during 5 h. Prior to every reaction run, a 90% Ar and 10% H2 blend was contacted with the catalyst at 600 °C for an extra 25 min, to ensure the full reduction of Ni and Ru species. Thus, both catalyst preparation and catalyst regeneration conditions were specifically selected while keeping in mind the need to limit the catalyst exposure under air flow to 120 °C, preventing any Ru oxides losses by vaporization as advised in [27].

4.2. Temperature Programmed Reduction (TPR)

TPR runs were conducted in a Micromeritics 2720 unit (Norcross, GA, USA) using 25–30 mg catalyst samples that were preheated first for line conditioning, under 50 mL/min nitrogen flow for a 30 min period. Then, the temperature was increased up to 250 °C and held for 30 min. This allowed the humidity removal of the catalyst sample’s moisture, the sample holder and the connecting lines. Following this, a 10%H2/90%Ar blend at 50 mL/min flow rate was contacted with the catalyst with the temperature being increased at a 10 °C/min rate until it reached 950 °C. The hydrogen uptake was recorded using a thermal conductivity detector (TCD, Micromeritics, Norcross, GA, USA).

4.3. Biomass Gasification

Performance of the Ni–Ru supported in γAl2O3 catalyst samples was evaluated in a CREC riser simulator, using 2-metoxy-4-methylphenol, at different conditions: (a) temperatures: 550 °C, 600 °C and 650 °C; (b) steam/biomass ratio: 1.0; (c) times of reaction: 10, 15, 20, 30 and 40 s; (d) catalyst/biomass (Cat/2M4MP): 2.63. The reactor system was sealed, leak-tested and heated at the selected reaction temperature with the catalyst sample being in an argon atmosphere.
Prior to every experiment the CREC riser simulator turbine was set to “on”, and the catalyst was fluidized as a result. The reagents were injected and the catalytic reactions were carried out during a preset time under the selected conditions (temperature, initial pressure, reaction time and fluidization velocity). Once the preset reaction time was reached, the reaction products were evacuated and analyzed online using gas chromatography.
The GC system was equipped with a packed bed column (HaysSep® D) and a capillary column (BPX5). The packed bed column was connected to a thermal conductivity detector (TCD) while the capillary column was connected to a flame ionization detector. After the reaction, the reactor was purged with the flow of He at 20 psia for 20 min.

4.4. CO2 Adsorption Constant

The same reactor was used to perform the CO2 adsorption runs using the 5% Ni–0.25% Ru/γAl2O3 catalyst. To perform the adsorption experiments, the methodology proposed in the literature [28] was used, where 0.5 g of catalyst were placed in the reactor, the temperature was raised to 500 °C and different volumes of CO2 were injected at an initial argon pressure close to 1 atmosphere. Additional details regarding the CO2 adsorption experiments are provided in the Supplementary Materials S4.

5. Conclusions

  • A 5% Ni–0.25% Ru/γAl2O3 fluidizable catalyst with intrinsic H2 spillover ability can be successfully used for 2M4MP gasification.
  • The performance of this 5% Ni–0.25% Ru/γAl2O3 catalyst can be described using a comprehensive kinetics.
  • This kinetic model can be set as the addition of water–gas shift and steam methane reforming reactions.
  • This postulated kinetics can be established neglecting char gasification given the minimal amounts of coke-on-catalyst observed.
  • The kinetic parameter estimations can benefit from the uncoupling of intrinsic kinetics and CO2 adsorption, yielding parameters with narrow 95% confidence intervals and low parameter cross-correlation.
  • The energies of activation obtained are in line with those reported in the technical literature, while the pre-exponential factors reflect the significantly enhanced activity of the 5% Ni–0.25% Ru/γAl2O3 catalyst.

Supplementary Materials

The following supporting information can be downloaded at: https://www.mdpi.com/article/10.3390/catal12030282/s1, Figure S1: CO2 adsorption isotherm at 500 °C, catalyst 5%Ni-0.25%Ru/γAl2O3, Figure S2: Fitting of linearized CO2 adsorption isotherm to the experimental data at different temperatures, for parameter estimation, Table S1: CO2 adsorption constants at different temperatures and Table S2. Degree of coverage and partial pressure of CO2 at different injected amounts of CO2.

Author Contributions

Validation, scientific guide, conceptualization, investigation and supervision, funding acquisition project administration, review and editing—B.S.R. and H.d.L. Proposed methodology, experimental work, validation, formal analysis, software and writing, methodology, data curation and software—A.R.C.H. All authors have read and agreed to the published version of the manuscript.

Funding

This research was funded by 221690-CB-2013 CONACYT-Mexico grant awarded to Benito Serrano Rosales and the RGPIN-2021-03743 Natural Sciences and Engineering Research Council of Canada (NSERC) grant awarded to Hugo de Lasa. Alan Ruben Calzada Hernandez would like to thank the National Council for Science and Technology (CONACyT), México, for the scholarship (297035).

Data Availability Statement

Not applicable.

Acknowledgments

We thank Florencia de Lasa for the provided help in editing this paper, Jose Muñoz for the technical support in the TPR analysis and Daniel Alejandro Palacios Velazquez for his collaboration in the experimental work.

Conflicts of Interest

The authors declare no conflict of interest.

References

  1. Dafedar, A.A.; Verma, S.S.; Yadav, A. Hydrogen Storage Techniques for Stationary and Mobile Applications: A Review. In Proceedings of the Recent Advances in Sustainable Technologies; Jha, K., Gulati, P., Tripathi, U.K., Eds.; Springer: Singapore, 2021; pp. 29–40. [Google Scholar]
  2. De Lasa, H.; Salaices, E.; Mazumder, J.; Lucky, R. Catalytic Steam Gasification of Biomass: Catalysts, Thermodynamics and Kinetics. Chem. Rev. 2011, 111, 5404–5433. [Google Scholar] [CrossRef] [PubMed]
  3. Yu, H.; Zhang, Z.; Li, Z.; Chen, D. Characteristics of Tar Formation during Cellulose, Hemicellulose and Lignin Gasification. Fuel 2014, 118, 250–256. [Google Scholar] [CrossRef]
  4. Salaices, E.; Serrano, B.; de Lasa, H. Biomass Catalytic Steam Gasification Thermodynamics Analysis and Reaction Experiments in a CREC Riser Simulator. Ind. Eng. Chem. Res. 2010, 49, 6834–6844. [Google Scholar] [CrossRef]
  5. Mazumder, J.; de Lasa, H.I. Catalytic Steam Gasification of Biomass Surrogates: Thermodynamics and Effect of Operating Conditions. Chem. Eng. J. 2016, 293, 232–242. [Google Scholar] [CrossRef]
  6. Chen, J.; Sun, J.; Wang, Y. Catalysts for Steam Reforming of Bio-Oil: A Review. Ind. Eng. Chem. Res. 2017, 56, 4627–4637. [Google Scholar] [CrossRef]
  7. Ochoa, A.; Bilbao, J.; Gayubo, A.G.; Castaño, P. Coke Formation and Deactivation during Catalytic Reforming of Biomass and Waste Pyrolysis Products: A Review. Renew. Sustain. Energy Rev. 2020, 119, 109600. [Google Scholar] [CrossRef]
  8. Calzada Hernandez, A.R.; Gibran González Castañeda, D.; Sánchez Enriquez, A.; de Lasa, H.; Serrano Rosales, B. Ru-Promoted Ni/γAl2O3 Fluidized Catalyst for Biomass Gasification. Catalysts 2020, 10, 316. [Google Scholar] [CrossRef] [Green Version]
  9. Ren, J.; Cao, J.-P.; Zhao, X.-Y.; Yang, F.-L.; Wei, X.-Y. Recent Advances in Syngas Production from Biomass Catalytic Gasification: A Critical Review on Reactors, Catalysts, Catalytic Mechanisms and Mathematical Models. Renew. Sustain. Energy Rev. 2019, 116, 109426. [Google Scholar] [CrossRef]
  10. Sharma, S.; Hines, L. Oxidation of Ruthenium. IEEE Trans. Compon. Hybrids Manuf. Technol. 1983, 6, 89–92. [Google Scholar] [CrossRef]
  11. Katheria, S.; Deo, G.; Kunzru, D. Rh-Ni/MgAl2O4 Catalyst for Steam Reforming of Methane: Effect of Rh Doping, Calcination Temperature and Its Application on Metal Monoliths. Appl. Catal. A Gen. 2019, 570, 308–318. [Google Scholar] [CrossRef]
  12. Kosukegawa, T.; Takao, T. Synthesis of a Heterometallic Spiked Tetrahedral Cluster of Ruthenium and Nickel Containing Multiple Hydrido Ligands and Its Degradation to a Tetrahedral NiRu3 Cluster. J. Organomet. Chem. 2019, 882, 70–79. [Google Scholar] [CrossRef]
  13. Sermon, P.A.; Bond, G.C. Hydrogen Spillover. Catal. Rev. 1974, 8, 211–239. [Google Scholar] [CrossRef]
  14. Mazumder, J.; de Lasa, H.I. Fluidizable La2O3 Promoted Ni/γ-Al2O3 Catalyst for Steam Gasification of Biomass: Effect of Catalyst Preparation Conditions. Appl. Catal. B Environ. 2015, 168–169, 250–265. [Google Scholar] [CrossRef]
  15. Atias, J.A.; de Lasa, H. Adsorption and Catalytic Reaction in FCC Catalysts Using a Novel Fluidized CREC Riser Simulator. Chem. Eng. Sci. 2004, 59, 5663–5669. [Google Scholar] [CrossRef]
  16. Escobedo, S.; Serrano, B.; Calzada, A.; Moreira, J.; de Lasa, H. Hydrogen Production Using a Platinum Modified TiO2 Photocatalyst and an Organic Scavenger. Kinetic Modeling. Fuel 2016, 181, 438–449. [Google Scholar] [CrossRef]
  17. Fogler, H.S.; Fogler, S.H. Elements of Chemical Reaction Engineering; Pearson Educación: London, UK, 1999; ISBN 978-970-26-0079-4. [Google Scholar]
  18. Mazumder, J.; de Lasa, H.I. Steam Gasification of a Cellulosic Biomass Surrogate Using a Ni/La2O3-ΓAl2O3 Catalyst in a CREC Fluidized Riser Simulator. Kinetics and Model Validation. Fuel 2018, 216, 101–109. [Google Scholar] [CrossRef]
  19. Salaices, E.; de Lasa, H.; Serrano, B. Steam Gasification of a Cellulose Surrogate over a Fluidizable Ni/α-Alumina Catalyst: A Kinetic Model. AIChE J. 2012, 58, 1588–1599. [Google Scholar] [CrossRef]
  20. Xu, J.; Froment, G.F. Methane Steam Reforming, Methanation and Water-Gas Shift: I. Intrinsic Kinetics. AIChE J. 1989, 35, 88–96. [Google Scholar] [CrossRef]
  21. Mark, M.F.; Maier, W.F.; Mark, F. Reaction Kinetics of the CO2 Reforming of Methane. Chem. Eng. Technol. 1997, 20, 361–370. [Google Scholar] [CrossRef]
  22. Maestri, M.; Vlachos, D.G.; Beretta, A.; Groppi, G.; Tronconi, E. Steam and Dry Reforming of Methane on Rh: Microkinetic Analysis and Hierarchy of Kinetic Models. J. Catal. 2008, 259, 211–222. [Google Scholar] [CrossRef]
  23. Spencer, M.S. On the Activation Energies of the Forward and Reverse Water-Gas Shift Reaction. Catal. Lett. 1995, 32, 9–13. [Google Scholar] [CrossRef]
  24. Ahmed, K.; Foger, K. Kinetics of Internal Steam Reforming of Methane on Ni/YSZ-Based Anodes for Solid Oxide Fuel Cells. Catal. Today 2000, 63, 479–487. [Google Scholar] [CrossRef]
  25. Jarosch, K.; El Solh, T.; de Lasa, H.I. Modelling the Catalytic Steam Reforming of Methane: Discrimination between Kinetic Expressions Using Sequentially Designed Experiments. Chem. Eng. Sci. 2002, 57, 3439–3451. [Google Scholar] [CrossRef]
  26. Shido, T.; Iwasawa, Y. Reactant-Promoted Reaction Mechanism for Water-Gas Shift Reaction on Rh-Doped CeO2. J. Catal. 1993, 141, 71–81. [Google Scholar] [CrossRef]
  27. Matus, L.; Hozer, Z.; Toth, B.; Ver, N.; Kunstar, M.; Pinter, A.; Osan, J. Oxidation and Release of Ruthenium from White Inclusions; EUR 22730 EN. JRC36911; European Commission: Brussels, Belgium, 2007. [Google Scholar]
  28. Rostom, S. Propane Oxidative Dehydrogenation Under Oxygen-Free Conditions Using Novel Fluidizable Catalysts: Reactivity, Kinetic Modeling and Simulation Study; Electronic Thesis and Dissertation Repository; Western Libraries: London, ON, Canada, 2018. [Google Scholar]
Figure 1. TPR Peak for Ni(NO3)2. Note: the framed section of the TPR signal (right-hand side of the figure) shows an enlarged view of the TPR peak’s top section.
Catalysts 12 00282 g001
Figure 2. TPRs for fresh catalysts: (a) Cat A: 5% Ni/γAl2O3, (b) Cat B: 5% Ni–0.25% Ru/γAl2O3, (c) Cat C: 5% Ni–0.5% Ru/γAl2O3, (d) Cat D: 5% Ni–1.0% Ru/γAl2O3 (heating ramp of 50 °C/min using 10% H2/90% He). Note: broken lines represent γAl2O3.
Catalysts 12 00282 g002
Figure 3. Schematic description of the spillover effect of H2 on the Ru–Ni surface catalyst. (A) H2 chemisorbs on RuO3, forming Ru crystallites, (B) H2 chemisorbed on Ru migrates to the NiO sites, (C) Reduced Ru and Ni crystallites are ready for gasification.
Catalysts 12 00282 g003
Figure 4. Model fitting to experimental partial pressures of H2, CO, CO2, CH4 and H2O during steam gasification of 2-methoxy-4-methyl phenol with the catalyst 5% Ni–0.25% Ru/γAl2O3 (Cat B) with S/2M4MP = 1 g/g and Cat/2M4MP = 2.63, R2 = 0.9931. (a) 550 °C, (b) 600 °C y (c) 650 °C.
Catalysts 12 00282 g004
Table 1. Decomposition temperatures of Ni(NO3)2 and reduction temperatures of NiO and RuO3.
CatalystDecomposition Temperatures of Ni(NO3)2 (°C)Reduction Temperatures (°C)
NiRu
Cat A: 5%Ni/γAl2O3303488---
Cat B: 5%Ni-0.25%Ru/γAl2O3268400245
Cat C: 5%Ni-0.5%Ru/γAl2O3252390223
Cat D: 5%Ni-1.0%Ru/γAl2O3248380210
Table 2. Reactions to obtain Ni and Ru.
Reactions
Decomposition of nickel nitrate. 2 Ni ( NO 3 ) 2 Δ 2 NiO + 4 NO 2 + O 2 (1)
Reduction of nickel oxide. NiO + H 2 Ni + H 2 O (2)
Formation of ruthenium oxide. 2 RuCl 3 + 3 O 2 Δ 2 RuO 3 + 3 Cl 2 (3)
Reduction of ruthenium oxide. RuO 3 + 3 H 2 Ru + 3 H 2 O (4)
Table 3. NiO and RuO3 hydrogen consumption and reducible Ni and Ru fractions.
CatalystsH2 Consumption (cm3/g STP) for NiOReducible Ni
(wt %)
H2 Consumption (cm3/g STP) for RuO3Reducible Ru (wt %)
Cat A: 5% Ni/γAl2O37.732.02
Cat B: 5% Ni–0.25% Ru/γAl2O310.122.712.20.33
Cat C: 5% Ni–0.5% Ru/γAl2O312.073.163.210.48
Cat D: 5% Ni–1.0% Ru/γAl2O314.863.894.130.77
Note: all reported percentual fractions are based on the catalyst unit weight.
Table 4. Experimental partial pressures of the compounds obtained during the experiments with the catalyst 5% Ni–0.25% Ru.
Time (s)Partial Pressure (atm)
550 °C600 °C650 °C
H2COCO2CH4H2OH2COCO2CH4H2OH2COCO2CH4H2O
50.240.270.60.271.420.460.330.360.211.510.630.420.430.231.59
100.420.210.620.211.380.70.290.470.21.40.780.420.440.21.52
150.460.20.650.151.330.80.280.530.181.30.850.40.450.171.37
200.490.170.670.131.290.90.270.530.151.251.090.370.570.141.34
300.490.090.730.121.250.970.240.590.141.171.20.350.590.131.31
Table 5. Secondary reactions of stem gasification of biomass.
Water Gas Shift (WGS) CO + H 2 O H 2 + CO 2 (7)
Steam reforming of methane (SRM) CH 4 + H 2 O CO + 3 H 2 (8)
Dry reforming of methane (DRM) CH 4 + CO 2 2 CO + 2 H 2 (9)
Char gasificaton C ( s ) + H 2 O H 2 + CO (10)
Boudouard gasification C ( s ) + CO 2 2 CO (11)
Hydrogenating gasification C ( s ) + 2 H 2 CH 4 (12)
Note: C(s) represents a solid carbonaceous deposit which is referred to in the process industry as “coke”.
Table 6. CO2 adsorption parameters with the catalyst 5% Ni–0.25% Ru/γAl2O3.
ParameterValue
K CO 2 ° (1/atm)0.49
Δ H CO 2 ads (kJ/mol)−35.63
Table 7. Estimated kinetic constants at 600 °C.
Kinetic ConstantsValue
k WGS (mol gcat−1 s−1 atm−2)4.5 × 10⁻⁴ ± 3.1 × 10⁻⁵
k SRM (mol gcat−1 s−1 atm−2)1.16 × 10⁻³ ± 2.3 × 10⁻⁴
Table 8. Estimated kinetic parameters in the steam gasification of 2-methoxy-4-methylphenol with the catalyst 5% Ni–0.25% Ru/γAl2O3.
ParametersCatalyst
5% Ni–0.25% Ru/γAl2O3
Mazumder et al. [18] *
20% Ni/5% La2O3-γAl2O3
Salaices et al. [19]
2.5% Ni–αAl2O3
Value95% Confidence Intervals ValueValue
k WGS °
(mol gcat−1 s−1 bar−2)
4.1 × 10⁻⁴±2.3 × 10−56.1 × 10−51.0 × 10⁻⁶
EWGS
(kJ/mol)
20.2± 5.333.323.4
k SRM °
(mol gcat−1 s−1 bar−2)
2.5 × 10⁻³±6.8 × 10−41.1 × 10−42.4 × 10⁻⁹
ESRM (kJ/mol)63.9± 7.168.132.5
* Steam gasification of glucose.
Publisher’s Note: MDPI stays neutral with regard to jurisdictional claims in published maps and institutional affiliations.

