Article

Hydrogen Pressure as a Key Parameter to Control the Quality of the Naphtha Produced in the Hydrocracking of an HDPE/VGO Blend

1
Department of Chemical Engineering, University of the Basque Country UPV/EHU, P.O. Box 644, 48080 Bilbao, Spain
2
Department of Chemical and Environmental Engineering, University of the Basque Country UPV/EHU, Plaza Ingeniero Torres Quevedo 1, 48013 Bilbao, Spain
*
Author to whom correspondence should be addressed.
Catalysts 2022, 12(5), 543; https://doi.org/10.3390/catal12050543
Submission received: 22 April 2022 / Revised: 11 May 2022 / Accepted: 13 May 2022 / Published: 16 May 2022

Abstract

:
The hydrocracking of high-density polyethylene (HDPE) blended with vacuum gas oil (VGO) has been studied to assess the effect of H2 pressure on the yield and composition of the products and with the aim of obtaining commercial fuels, mainly naphtha. The experiments have been performed using a PtPd/HY catalyst in a semibatch reactor under the following conditions: H2 pressure, 20–110 bar; 440 °C; catalyst to feed ratio, 0.1 gcat (gfeed)−1; HDPE to total feed ratio, 0.2 gHDPE (gfeed)−1; and reaction time, 2 h. The composition of the main fractions produced (gas, naphtha, and light cycle oil) reveals the interest in carrying out the process at 110 bar. Thus, conversions of 96 and 79% for the removal of heavy hydrocarbons and the removal of HDPE molecules have been obtained, respectively, together with a yield of naphtha of 53.4 wt%. This naphtha is mainly paraffinic, and it has a RON of 91.5 (within the commercial standards). Furthermore, three fractions have been observed in the analysis (temperature-programmed oxidation) of the coke. This analysis reveals that at 110 bar, the coke retained in the HY zeolite cages is less developed and burns at a moderate temperature.

1. Introduction

Hydrocracking is a key process in refineries for the conversion of heavy oil fractions into low-molecular-weight streams, at the same time undesirable molecules are removed, in particular S, N, and metals. Thus, after subsequent reforming and conditioning stages, hydrocracked streams are suitable for being used in the blending of commercial naphtha and medium distillates [1,2]. In addition, the versatility of the hydrocracking process places it at the forefront of the intensification processes that aim for the direct production of fuels with the composition established by legal requirements [3]. This way, hydrocracking processes have been widely used in the valorization of different secondary refinery streams, such as vacuum residue [4], light cycle oil [5], and vacuum gas oil [6]. In addition, its use has also been proposed for treating bio-oil [7], which is a liquid product obtained in the fast pyrolysis of lignocellulosic biomass, as well as wastes from the consumers’ society (mainly waste plastics and end-of-life tires) and the oil obtained in the pyrolysis of these wastes [8,9]. The co-feeding of these wastes to refinery units (Waste-Refinery) is an innovative management strategy that is receiving increasing attention in the literature [10]. The Waste-Refinery proposal has the attraction of bringing the Circular Economy strategy closer to the oil industry, which will entail important savings in raw materials and financing the inventory required for the valorization of wastes. In parallel, it will contribute to solving the environmental issues derived from landfilling [11] or incineration [12] of these wastes. However, the industrial scale-up of this strategy requires establishing the appropriate operating conditions and adapting the catalysts for this specific goal.
The hydrocracking of waste plastic into fuels has received less attention than other thermochemical processes, such as thermal and catalytic cracking. Thermal cracking is particularly interesting for the recovery of monomers from styrene [13], polymethyl methacrylate (PMMA) [14], and polyolefins [15]. In contrast, catalytic cracking over zeolite-based catalysts (HZSM-5 being the most studied one) is interesting for the selective production of light olefins [16]. Nonetheless, under the conditions required for the production of fuels (high temperatures and high contents of strong acid sites in the zeolite), the composition of the liquid product obtained presents high contents of olefins and aromatics that impede the direct use of this liquid as automotive fuel [17], requiring a subsequent adaptation of its composition by hydroprocessing.
The hydrocracking of polyolefins (LDPE, HDPE, and PP) over a Pt/Beta catalyst at 330 °C and 20 bar H2 resulted in an excessive production of gases (C3–C4) [18], which is attributed to the diffusional limitations and overcracking of the macromolecules. Nevertheless, the use of Pt catalysts supported on USY zeolites increased remarkably the yield of naphtha (C5–C12) and medium distillates (C13–C20) [19].
The co-feeding of plastic together with a refinery stream, such as VGO (benchmark feed of hydrocracking units), shows important advantages [9]. Firstly, it facilitates the extent of the hydrocracking reactions, increasing the level of conversion attained. Secondly, the presence of HDPE in the reaction medium leads to the production of a less aromatic and more paraffinic naphtha fraction. Moreover, a previous work [20] investigated the effect of the temperature on the performance of a PtPd/HY catalyst (activity and selectivity) in the hydrocracking of HDPE blended with VGO (20/80 in mass) and found that this catalyst was appropriate for maximizing the yield of naphtha at 420 °C. In addition, this temperature was appropriate for achieving high rates in the reactions that lead to the formation of olefins from the HDPE (by means of a free radical mechanism) and to their subsequent protonation. The synergistic effects between the hydrocracking mechanisms entailed an increase in the conversion achieved with respect to that obtained in the hydrocracking of neat VGO. The composition of the naphtha lump obtained in the hydrocracking of the HDPE/VGO blend was also more favourable for being added to the lump of commercial gasoline since it had an important concentration of paraffins and a low concentration of aromatics. Equally, in the LCO fraction obtained in the hydrocracking of the blend at 420 °C, the concentration of paraffins is higher than that obtained in the hydrocracking of VGO, whereas that of aromatics is lower. It means a higher interest in being valorized within the diesel pool.
In this context, this work assesses the effect of the H2 pressure used in the hydrocracking of a blend of HDPE and VGO since this parameter will undoubtedly condition the economy of the process. Even though the relevant effect of this variable on the yields and product distribution has been widely demonstrated [21], few authors have tackled its direct study in the hydrocracking of waste plastics. The aim of the work is to obtain detailed information about the effect of H2 pressure on the yields, selectivities, and composition of the fractions with commercial interest obtained in the hydrocracking of the HDPE/VGO blend. For this purpose, the products have been lumped into different fractions as is customary in the oil industry: heavy cycle oil (HCO), light cycle oil (LCO), naphtha, liquefied petroleum gas (LPG), dry gas, and coke. Furthermore, in view of the importance of catalyst deactivation by coke deposition, the effect of H2 pressure on the content and nature of the coke has also been studied.

2. Results and Discussion

2.1. Catalyst Properties

The main characterization results have been summed up in Table 1. A more detailed description of the techniques, equipment, and experimental procedures used in catalyst characterization can be found in previous work [20]. The channel structure of the Y zeolite can be seen in the TEM image at 100 nm (Figure 1a), while in the image at 50 nm (Figure 1b), the good dispersion of Pt and Pd particles (dark spots) on the support can be observed.

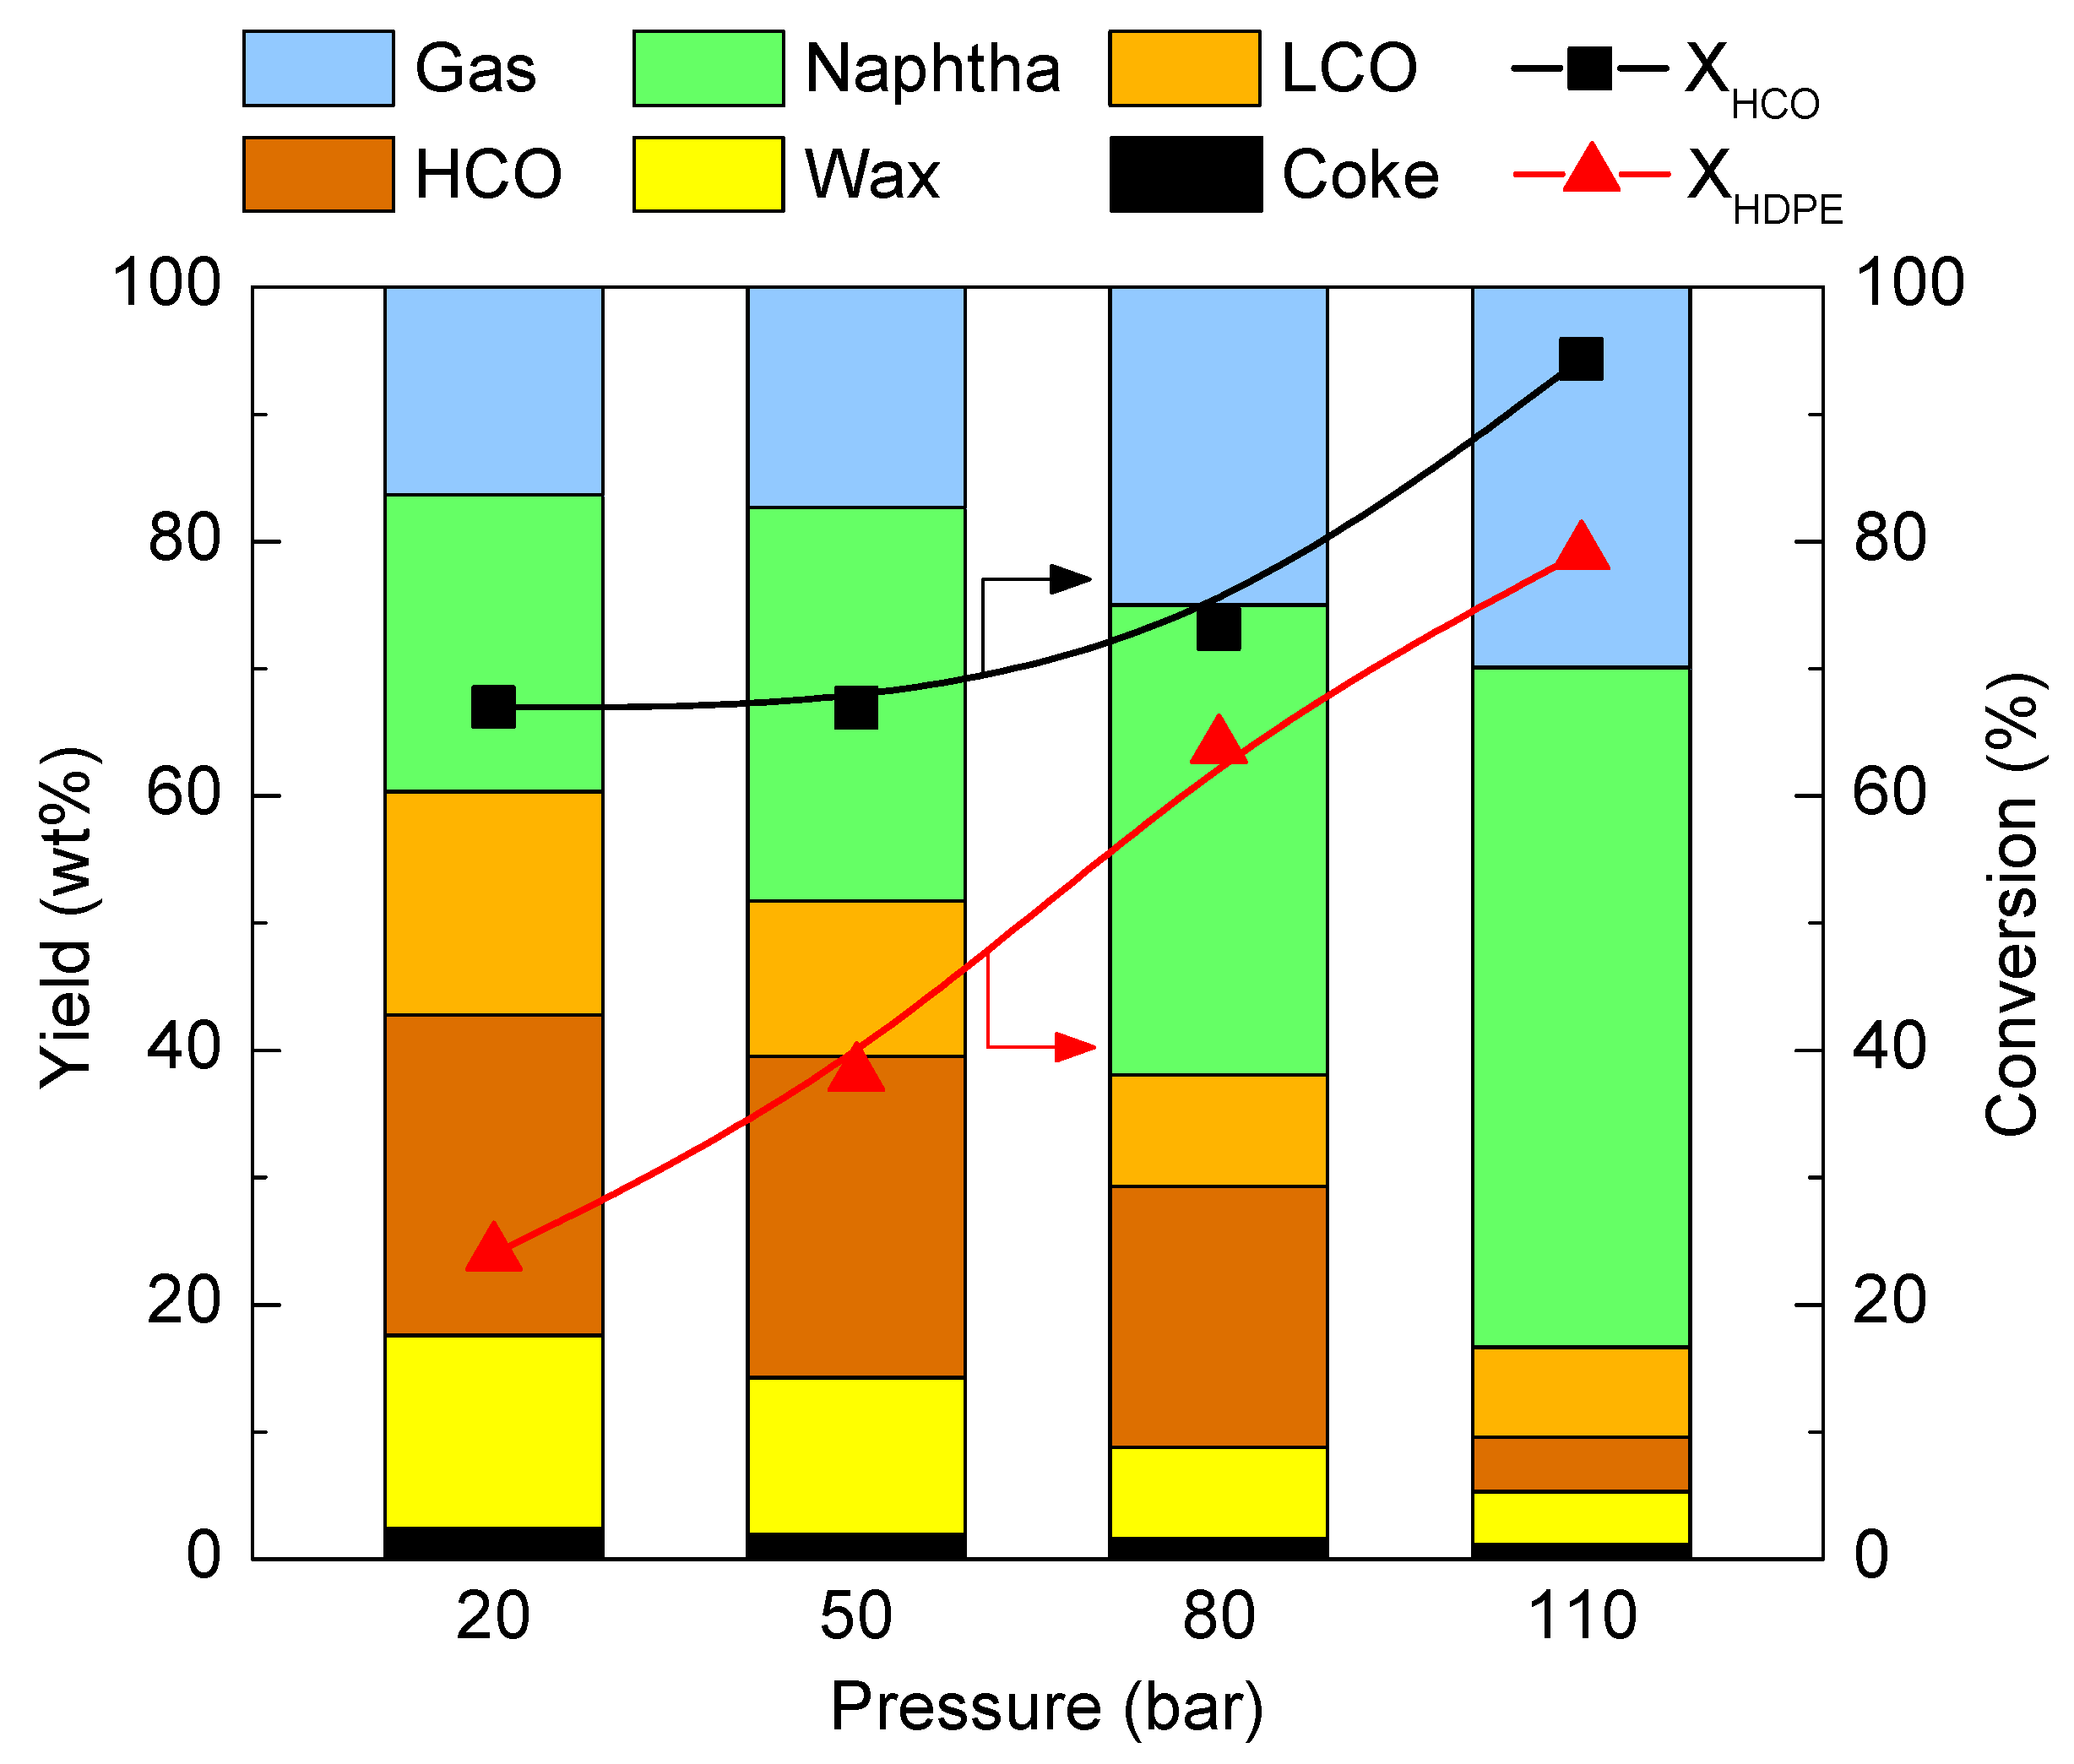
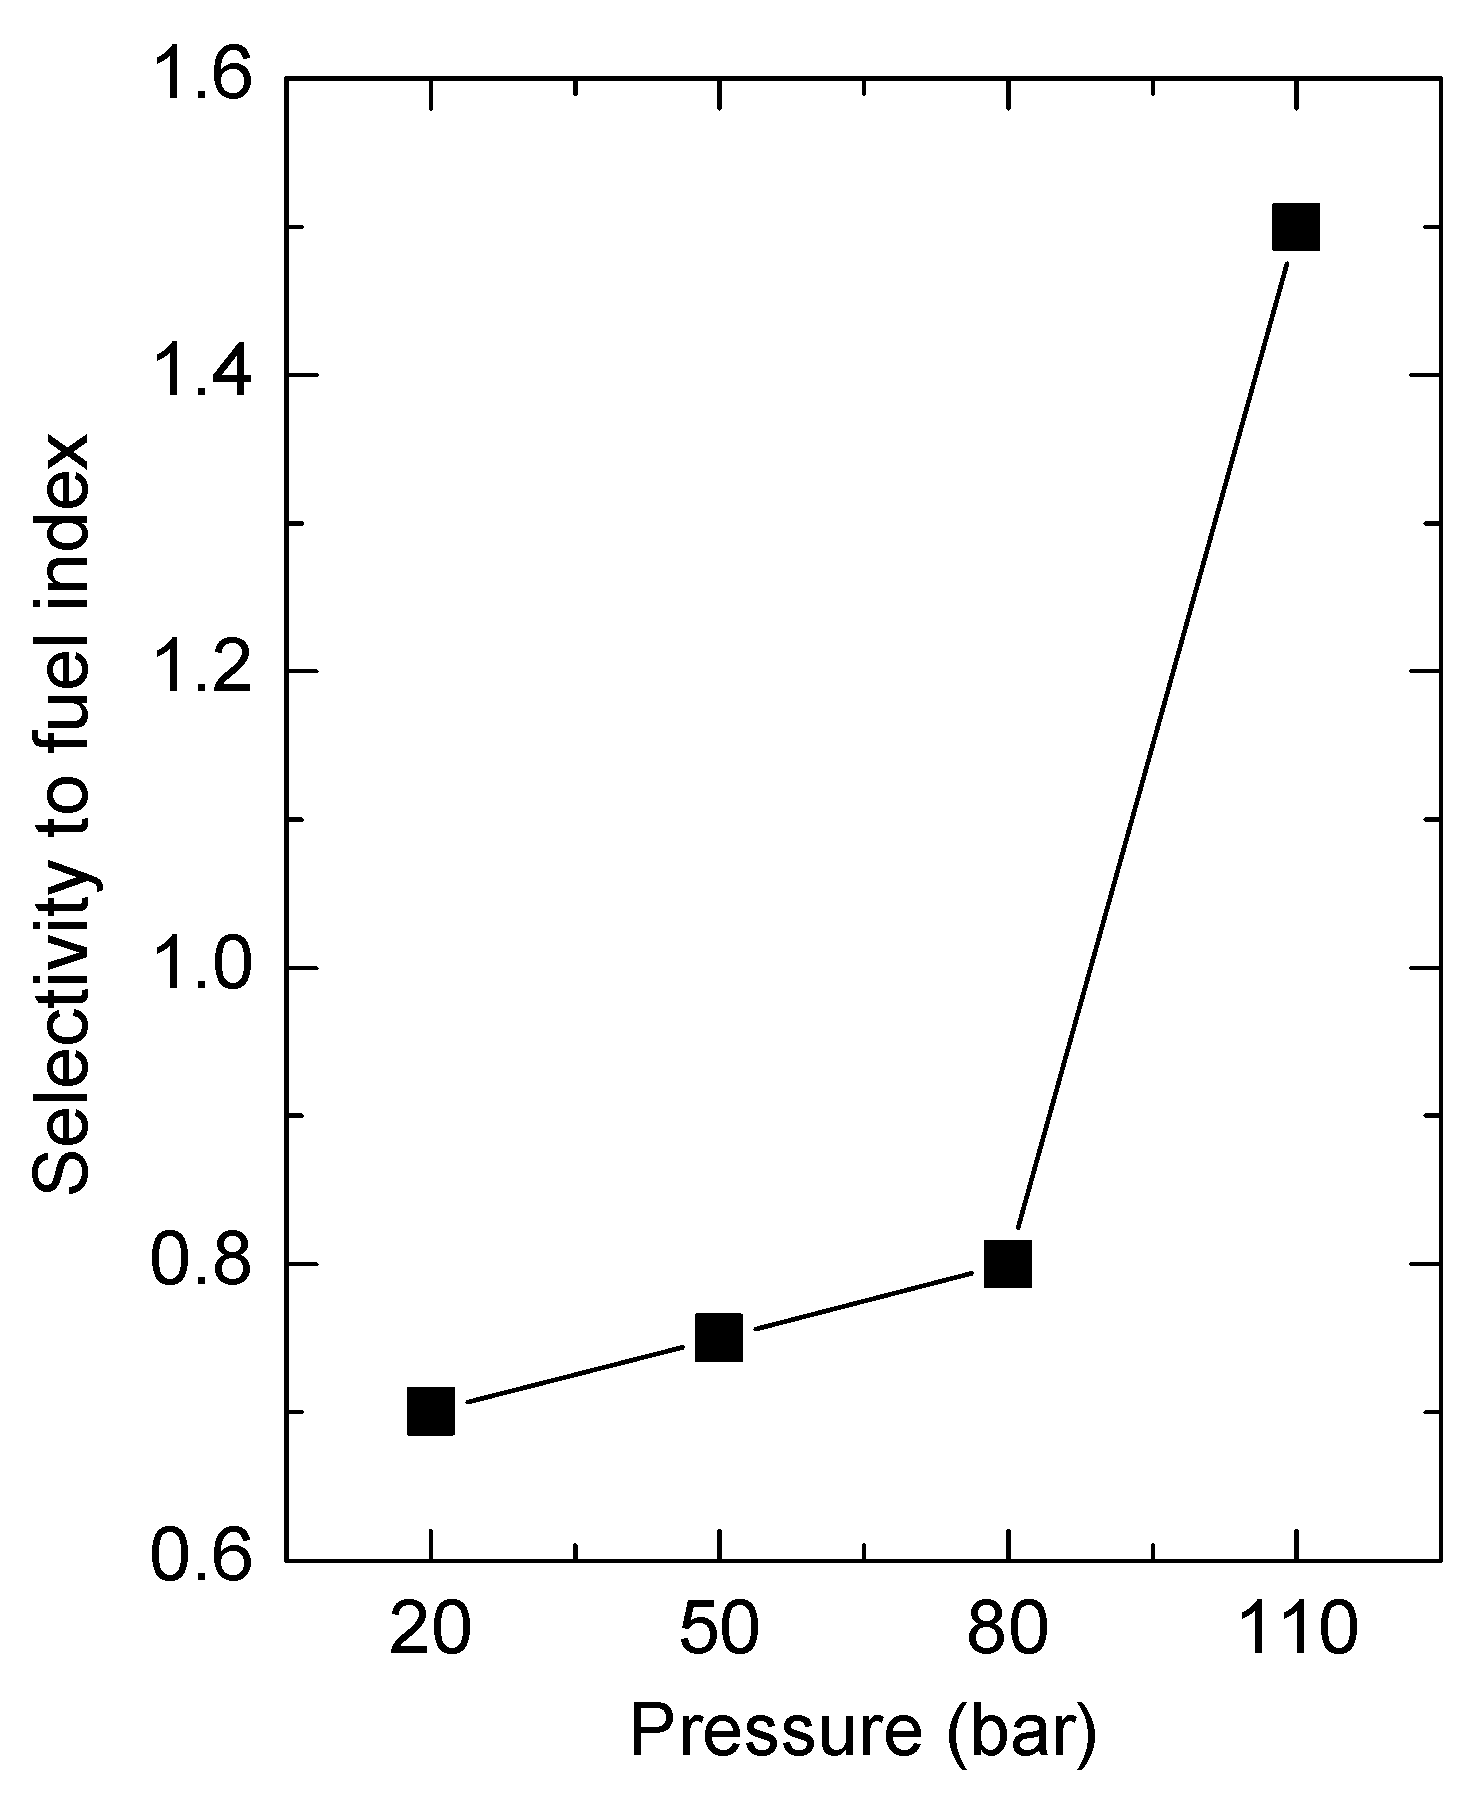
2.2. Hydrocracking Yields and Conversion

The effect of H2 pressure on the yields of products and the extent of conversion attained is depicted in Figure 2. Overall, an increase in the H2 pressure favours the conversion of both HDPE and HCO, as well as the formation of light products, mainly naphtha and gases. In addition, an important reduction in the yield of coke should be highlighted that passes from 2.4 wt% at 20 bar to a yield of 1.1 wt% at 110 bar.
The yield obtained at 20 bar for the HCO fraction was 25.2 wt%, which corresponds to a conversion level of 67%. With regard to the yield of products, a balanced distribution has been obtained for the yield of gas, naphtha, and LCO fractions (16, 18, and 23 wt%, respectively). An increase in the H2 pressure up to 50 bar has not affected the HCO conversion, but it has affected product distribution. The yields of naphtha and gas fractions have increased (up to 31 and 17 wt%, respectively) to the detriment of LCO (12 wt%). A further increase in the H2 pressure to 80 bar has revealed the important role of this parameter. This way, the HCO conversion has increased up to 73%, and the yields of both HCO and LCO fractions have decreased down to 9 and 21 wt%, respectively. Consequently, the yields of the light fractions have continued increasing, reaching a value of 37 wt% for the naphtha and 25 wt% for the gas. Finally, at the highest working H2 pressure (110 bar), the lowest yields of LCO and HCO fractions have been obtained, which correspond to almost total HCO conversion (94%). Attending to the yields of products, naphtha is by far the main one (53 wt%), even though an important production of gases has also been obtained (30 wt%).
Additionally, a remarkable positive effect of the H2 pressure on the HDPE conversion attained can be observed in Figure 2. Thus, an increase in the H2 pressure entails a linear increase in the HDPE conversion. This way, it has gone from a relatively moderate value of 24% for 20 bar to a very attractive conversion level of 79% at 110 bar.
The product distribution obtained is reflected in the evolution of the selectivity to fuel index (Figure 3). Therefore, an increase in the H2 pressure from 20 to 80 bar brings a stepwise increase in this index from 0.7 to 0.8 because of the increase in the yield of naphtha and the decrease in the yields of HCO and wax. In addition, the abrupt change that has taken place in product distribution when increasing the H2 pressure from 80 to 110 bar (Figure 2) has caused a sharp increase in the selectivity to fuel index reaching its maximum value of 1.5.
To explain these results, the effect of the H2 pressure on the hydrocracking mechanism must be analysed in detail. It is well established that in the hydrocracking of hydrocarbons and polyolefins, the cracking takes place via carbenium ions. Moreover, under the reaction conditions employed (420 °C), the extent of thermal cracking reactions, with free radicals as intermediates, also has to be considered [21]. Afterwards, the hydrocarbons are dehydrogenated over the metal sites producing olefins, which are subsequently protonated and isomerised over the acid sites. In addition, if the catalyst has a sufficient density of strong acid sites (as occurs with HY zeolites), the cracking takes place by β-scission of the protonated and branched olefins, forming unsaturated species that are, in turn, saturated over the hydrogenation sites [22,23]. In the hydrocracking of polyolefins, the presence of strong acidic sites favours the formation of tertiary carbenium ions that are cracked by β-scission reactions resulting in olefins and carbenium ions of lower molecular weight, which are also cracked in subsequent stages. The olefins formed are protonated to paraffins by metathesis reactions in the presence of H2 in the reaction medium [24,25]. There is also evidence of the existence of synergistic effects between the thermal and catalytic hydrocracking mechanisms because the former leads to the formation of molecules that are more reactive in the latter [26,27].
The aforementioned characteristics of the mechanisms highlight the role of the H2 pressure, which attenuates the formation of free radicals and favours the extent of the hydrocracking of hydrocarbons and polyolefins. Studies of the effect of H2 pressure on the hydrocracking of different polyolefins have shown that, in general, increasing the pressure of H2 increases the conversion and the yield of liquid products. However, this effect is progressively smaller as the pressure of H2 increases [24,28,29,30]. The effect on the gas yield is uneven, although it decreases with pressure. The explanation is that an increase in the H2 pressure favours the catalytic hydrocracking mechanism with respect to the thermal one, to which the attenuation of the formation of free radicals in the presence of H2 contributes.
In addition, the rates of the olefins cyclization and polyaromatics condensation reactions are also attenuated at high H2 pressures, leading to a lesser coke formation [31]. A similar result was obtained by Akah et al. [30] in the hydrocracking of postconsumer plastics. Consequently, the lower catalyst deactivation may explain some of the results displayed in Figure 2 that can be considered unexpected. Some of them would be the constant gas production observed when increasing the H2 pressure from 20 to 50 bar [28], as well as the product distribution that has remained unaltered [32]. Apart from the attenuation of the deactivation, the side effects of the partial pressure of H2 that strongly affect the composition of the products will contribute to the difficult interpretation of the results. Therefore, their reactivity in cracking and hydrogenation reactions will be different. Other factors that will condition the results depicted in Figure 2 will be (i) the different diffusivity of the reaction mixture in the different hydrocracking stages, which will be crucial for the HDPE-derived macromolecules and the heavy molecules within the HCO fraction of the VGO, and (ii) the synergistic effects in the hydrocracking mechanisms between the VGO and the HDPE-derived molecules.

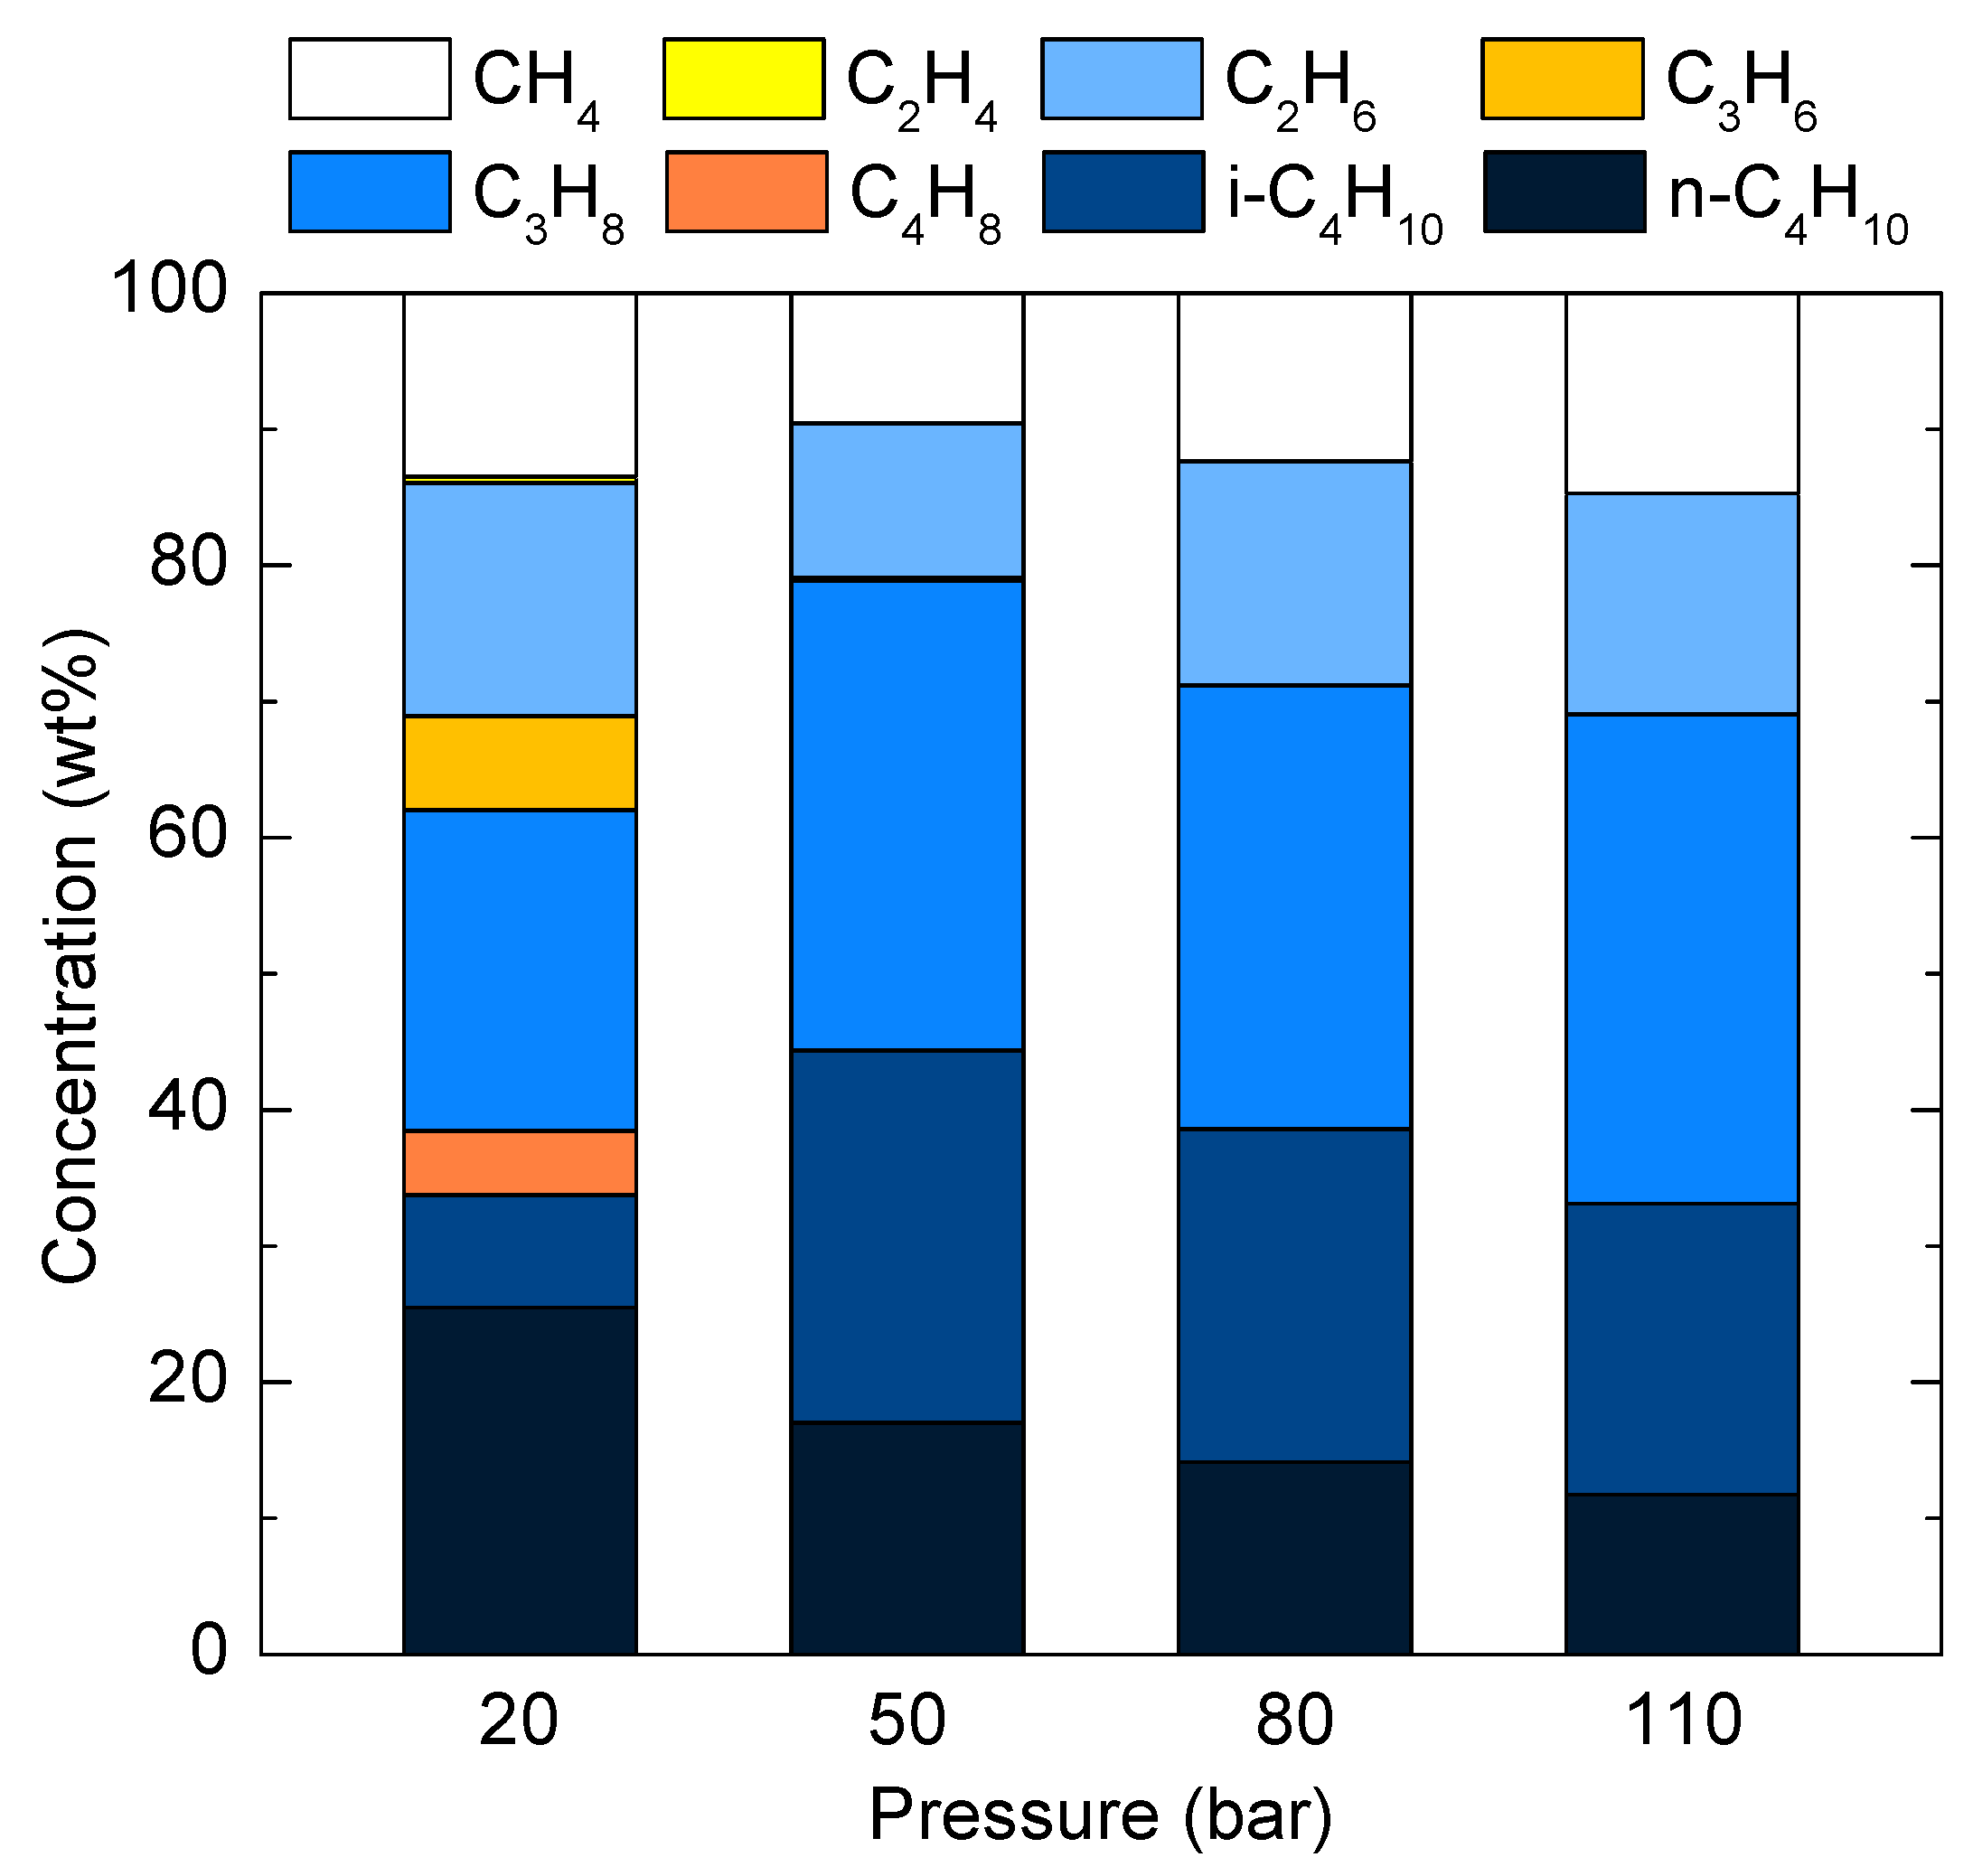
2.3. Composition of the Gas Fraction

The effect of the H2 pressure on the composition of the gas fraction is depicted in Figure 4. The gas fraction is composed of hydrocarbons between one and four carbon atoms (CH4, C2H4, C2H6, C3H6, C3H8, i-C4H10, C4H8, and n-C4H10). One should note that an H2 pressure of 20 bar is not high enough for saturating all the light olefins. Indeed, hydrogenation is an exothermic reaction favoured at low temperatures and high H2 pressures. Therefore, small concentrations of ethylene, propylene and butylenes (0.4, 6.9 and 4.7 wt%, respectively) have been detected in the gas fraction. Splitting the gas fraction into dry gas (C1–C2) and LPG (C3–C4), the concentration of the latter is by far higher as it accounts for 68.9 wt%, its main compounds being propane and n-butane (25.5 and 23.6 wt%, respectively). Regarding the composition of the dry gas fraction, it is almost totally composed of methane and ethane (13.5 and 17.1 wt%, respectively).
An increase in the pressure up to 50 bar brings a marked change in the composition of the gas fraction, led by an almost total olefins disappearance and a boosting of the isomerization reactions. Furthermore, the yield of the dry gas fraction is also reduced at the same time as C3 and C4 products became the main ones. Indeed, the lowest concentration of the dry gas fraction has been attained at this pressure reaching just a value of 20.8 wt%. Regarding LPG fraction, propane continues to be the main product (34.5 wt%), followed by iso-butane (27.3 wt%), whereas the concentration of n-butane has been reduced down to 16.9 wt%. Morawski and Mosio-Mosiewski [33] also observed the same trends for the dry gas and LPG fractions when increasing the H2 pressure from 20 to 50 bar in the hydrocracking of vacuum residue over a NiMo/Al2O3 catalyst.
However, a further increase in the H2 pressure to 80 bar has caused a moderate increase in the concentration of the dry gas fraction, principally to the detriment of the C4 compounds and, to a lesser extent, the C3 compounds. Indeed, propane is still the main compound (35.9 wt%). In addition, no olefins have been detected at this pressure because the hydrogenation of the components within the LGP fraction has been greatly favoured. At the highest H2 pressure (110 bar), the concentration of dry gas has increased up to 30.9 wt%—the concentrations of ethane and methane at 16.2 and 14.7 wt%, respectively. Concerning the LPG, the largest concentration corresponds to propane (35.9 wt%), followed by iso- and n-butane (21.4 and 11.8 wt%, respectively). The increase observed in the concentration of dry gas at high H2 pressures results from a high level of thermal cracking being maintained.

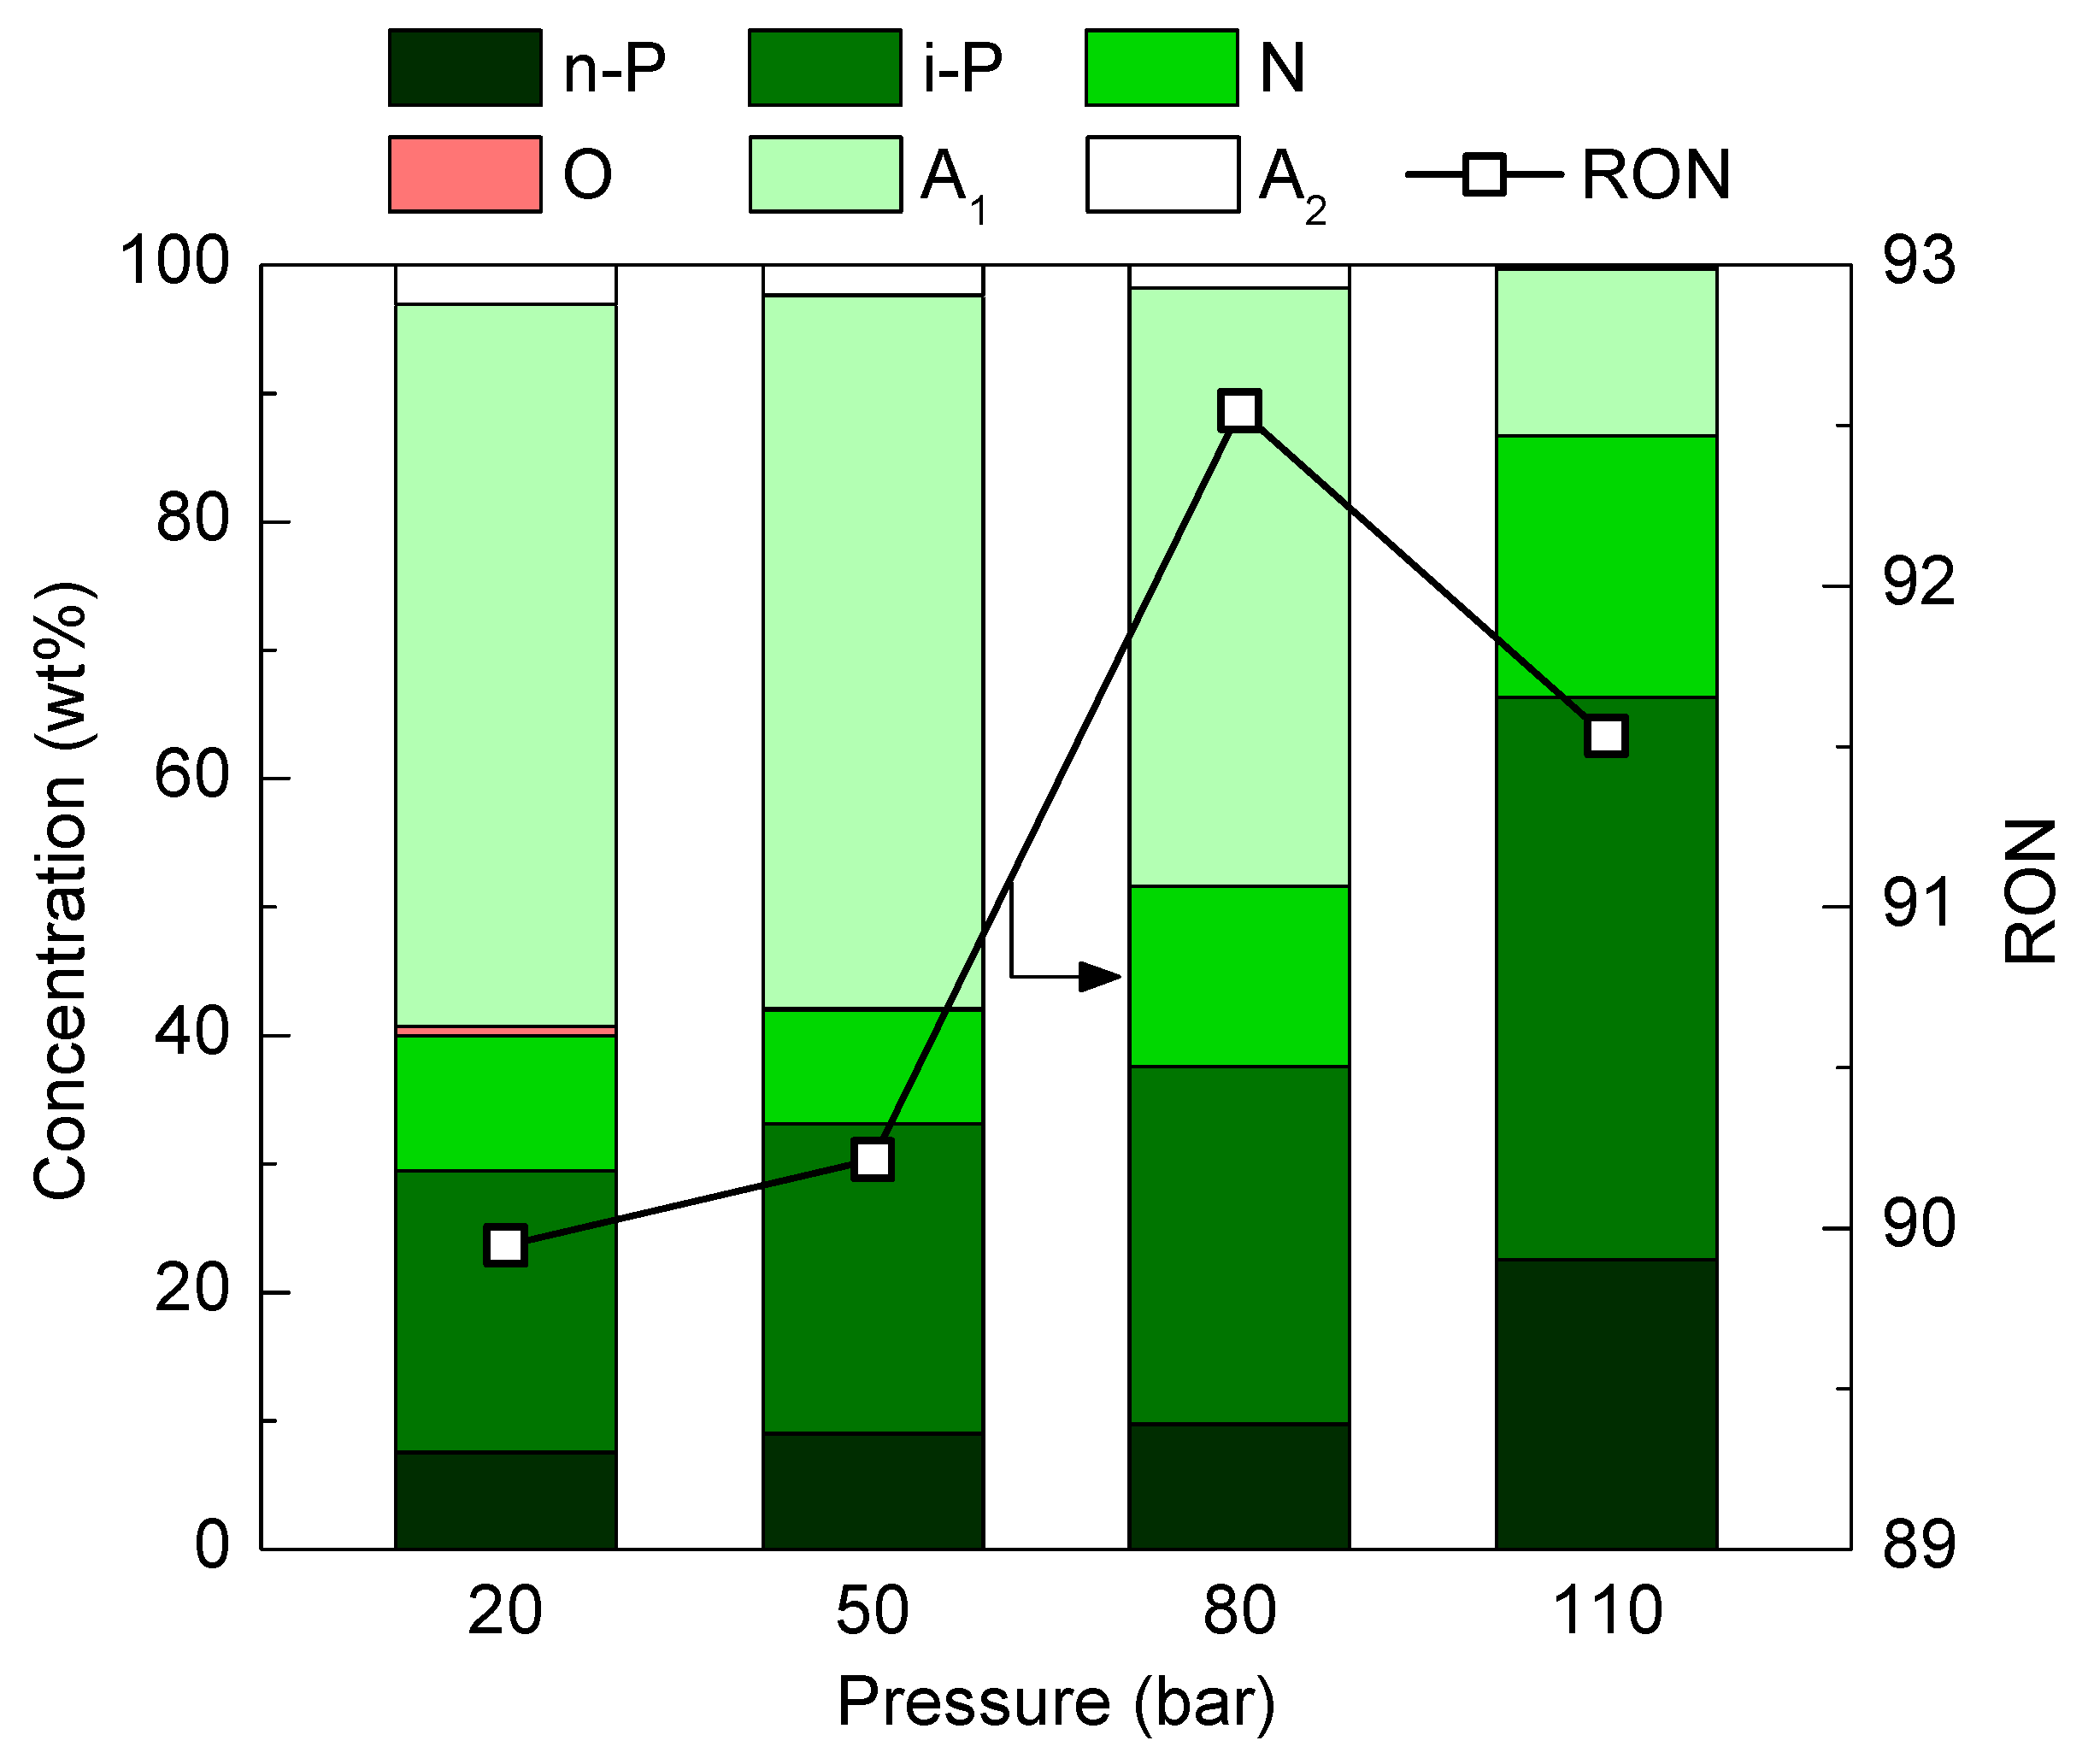
2.4. Composition and RON of the Naphtha Fraction

The composition of the naphtha fraction, together with its research octane number (RON), is collected in Figure 5. At low H2 pressure (20 bar), the naphtha is mainly aromatic because of the aromatics already present in the VGO (Table S1) and the limited extent of the hydrogenation reactions that can be achieved under these conditions. Aromatics are the predominant compounds (59.3 wt%), the alkylbenzenes (A1) being the most abundant compounds (56.2 wt%). The concentration of 2-ring aromatics (A2) is 3.1 wt%, and naphthenic compounds are in a relatively low amount (10.5 wt%). A small quantity of olefins, 0.7 wt%, has also been detected. Linear paraffins account for almost 3 wt% of naphtha, whereas ramified paraffins account for 21.9 wt%.
An increase in the H2 pressure promotes the extent of the hydrogenation reactions reducing the concentration of aromatics and increasing that of naphthenes [21]. However, the boosting of the rate of hydrogenation reactions is not directly proportional to the increase in pressure. This way, an increase in the H2 pressure from 20 to 50 bar has a subtle effect on the composition of the naphtha fraction. The total concentration of aromatics has barely decreased to 57.9 wt%, causing a slight increase in the aliphatic compounds (up to 41.9 wt%). It should also be highlighted that the concentration of olefins has been notably reduced (0.12 wt%), exposing that an H2 pressure of 50 bar is not high enough to saturate all the olefins, as aforementioned for the gas fraction (Figure 4). Nevertheless, an increase in the H2 pressure to 80 bar significantly modifies the composition of the naphtha fraction. The concentration of all the saturated compounds has increased, reaching concentrations of 9.8, 27.8, and 14.0 wt% for the n-paraffins, i-paraffins, and naphthenes, respectively. Consequently, the concentration of the aromatic compounds has been reduced to 48.4 wt%, the mono-aromatics being the clear predominant ones (46.6 wt%). Note that olefins are no longer detected in the naphtha fraction. An additional increase in the H2 pressure to 110 bar has exposed the key role of this parameter in the hydrocracking of the HDPE/VGO blend. Thus, the concentration of both ramified and linear paraffins has increased significantly (43.8 and 22.6 wt%, respectively). Indeed, isoparaffins have clearly become the predominant compounds. In the same line, the concentration of naphthenes has increased, reaching a value of 20.4 wt%, which is the maximum concentration obtained for this family of compounds in the whole range of H2 pressure studied. With regard to aromatic compounds, the concentration of 2-ring aromatics has been significantly reduced to an almost symbolic value (0.3 wt%), and that of 1-ring aromatics has reached its minimum value (13.0 wt%). A similar trend has been reported in the literature in the hydrocracking of different feeds [33,34], in which a substantial H2 pressure is required to totally remove olefins and achieve remarkable concentrations of aliphatic compounds.
As the RON strongly depends on the composition of the naphtha fraction, the value obtained for this parameter has remained almost similar for H2 pressures of 20 and 50 bar (89.9 and 90.2, respectively). However, when the pressure is raised to 80 bar, there is a considerable increase in the RON, reaching a value of 92.5. This result lies in the increase in the concentrations of isoparaffins since this family of compounds has a markedly positive effect on this index. Nonetheless, an increase in the pressure to values above 80 bar decreases the value obtained for the RON, as the concentration of aromatic compounds has been importantly reduced. Thus, at the highest pressure (110 bar), the RON decreases slightly to 91.5. A positive effect of the H2 pressure has also been reported in the hydrocracking of heavy oils and petroleum residues regarding RON of the naphtha fraction operating at pressures below 75 bar [35].

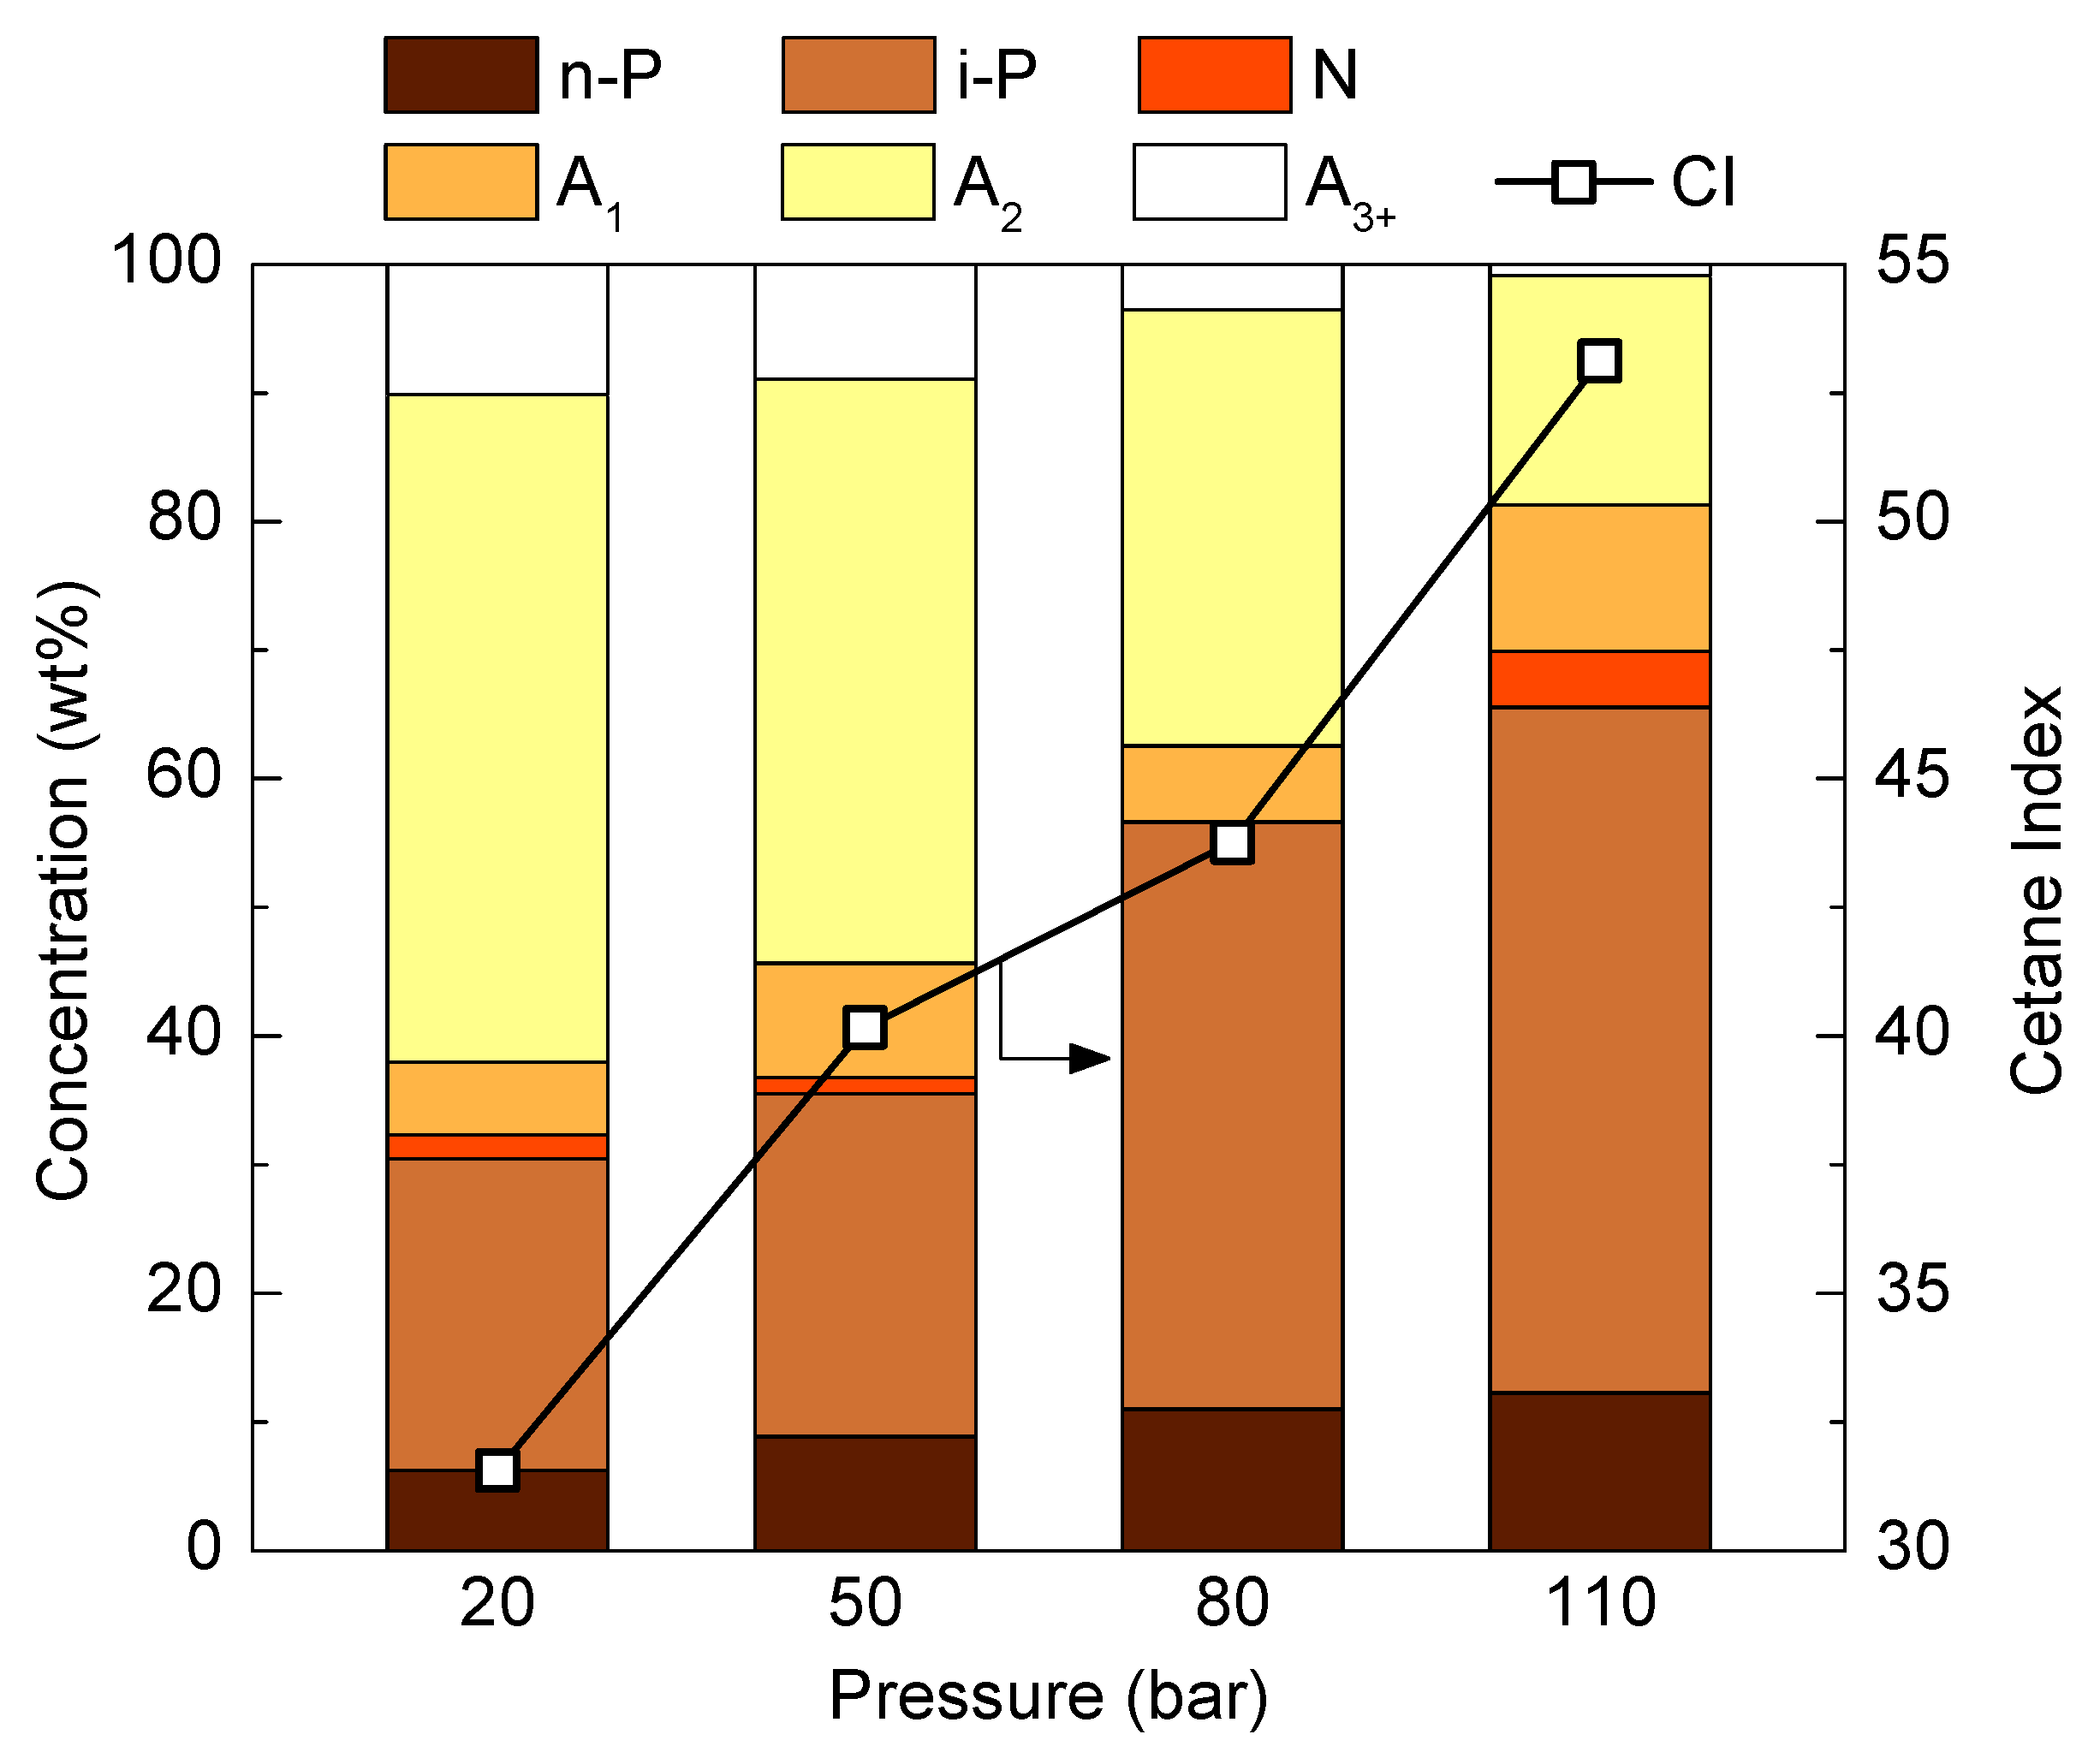
2.5. Composition and Cetane Index of the LCO Fraction

The composition of the LCO fraction for the different H2 pressures studied is displayed in Figure 6. In addition, the cetane index (CI) has been calculated in order to compare the effect of the pressure on the quality of the LCO fraction. Overall, a clear influence of the H2 pressure on the composition of the LCO fraction can be observed. This way, high pressures increase the concentration of saturated compounds, mainly that of isoparaffins, whereas the concentration of 1-, 2-, and 3+-ring aromatics decreases.
At a pressure of 20 bar, a low concentration of total paraffins has been obtained (30.5 wt%), where isoparaffins are in a greater amount than normal paraffins (24.2 vs. 6.2 wt%, respectively). Naphthenes are the less important compounds accounting for just a 1.9 wt%. Therefore, aromatics are the predominant compounds with a total concentration of 67.7 wt%, the di-aromatics being the main ones (51.9 wt%), followed by poly- and mono-aromatics (10.1 and 5.6 wt%, respectively).
An increase in the H2 pressure modifies the composition of the LCO fraction in the same way that has modified the composition of the naphtha fraction (Figure 5). Looking more closely at the concentration of the different families, it can be seen that the concentration of isoparaffins has increased exponentially with H2 pressure, whereas that of n-paraffins has risen more linearly. Furthermore, naphthenes have decreased for pressures below 80 bar, but at 110 bar, they have achieved their maximum concentration (4.4 wt%). Regarding the trends of the different aromatic compounds, the concentration of 2-ring and 3+-ring aromatics has decreased with pressure, causing an increase in the mono-aromatics when increasing H2 pressure. This result shows that an increase in the H2 pressure promotes the hydrodearomatization reactions, but it also shows that 2-ring and 3+-rings aromatics are partially hydrogenated, leading to the formation of 1-ring aromatics. Subsequently, these mono-aromatics will be hydrogenated, forming totally saturated naphthenes, which are easily cracked into ramified paraffins. This mechanism was also observed by Palos et al. [36] in the hydrotreating of a highly aromatic stream obtained as a by-product of the FCC unit. Moreover, the significantly high acidity of the catalyst (Table 1) promotes the isomerization and skeletal rearrangement reactions between the paraffins and to a larger extent as the H2 pressure is increased, leading to the formation of isoparaffins. In addition, the acidic properties of the catalyst will also boost the hydrogenolysis reactions as the pressure is increased, obtaining even a higher dehydroaromatization degree [37].
According to the described trend, at an H2 pressure of 110 bar, the concentration of all the families of aliphatic compounds achieves its maximum value. Thus, the concentration of normal paraffins and naphthenes has increased up to 12.3 and 4.4 wt%, whereas isoparaffins have become by far the predominant compounds (53.3 wt%) in the LCO fraction. At the same time, the concentration of total aromatics has been decreased down to 30.1 wt%, with specific values of 11.4, 17.8, and 0.87 wt% for mono-, di-, and poly-aromatics, respectively.
Regarding the cetane index, there is a clear effect of H2 pressure on it because of the compositional changes obtained when raising the pressure. At the lowest H2 pressure (20 bar), the LCO fraction has the poorest cetane index (31.6). However, when pressure rises, the cetane index also increases, achieving its maximum value of 53.1 at 110 bar. This result can be correlated with the contents of paraffins and aromatics. Thus, the greater the paraffin concentration, the higher the cetane index. However, attending to the LCO fraction operating at such high pressures is not required. The quality of the LCO fraction obtained at both 50 and 80 bar is high enough to enable the use of this fraction in the blending of commercial diesel in refineries.

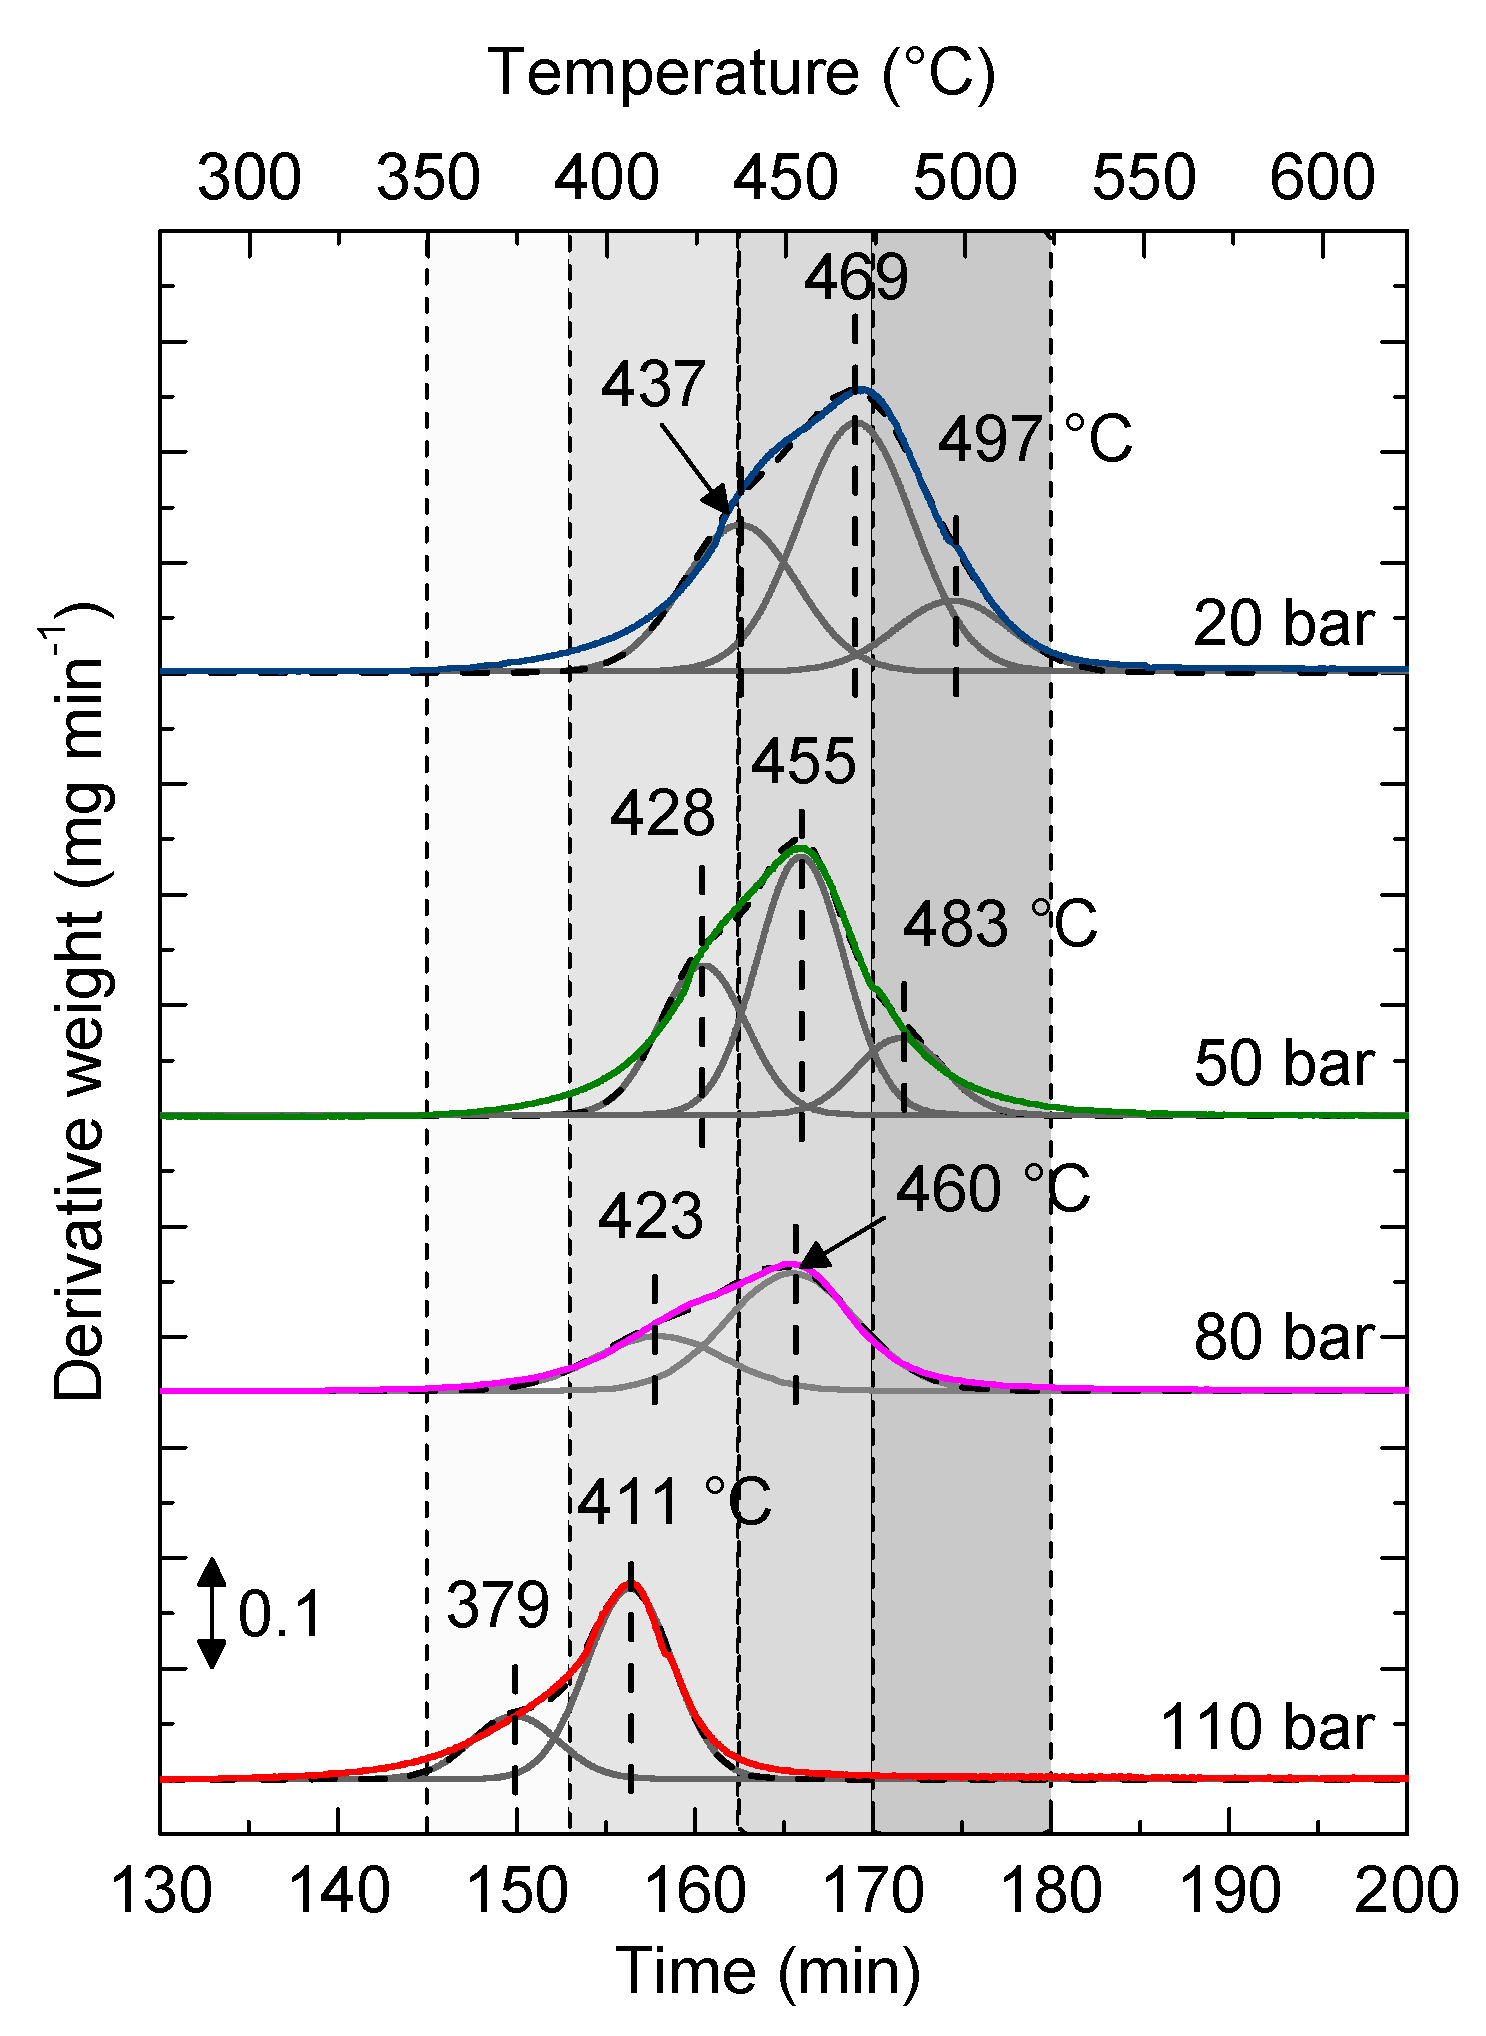
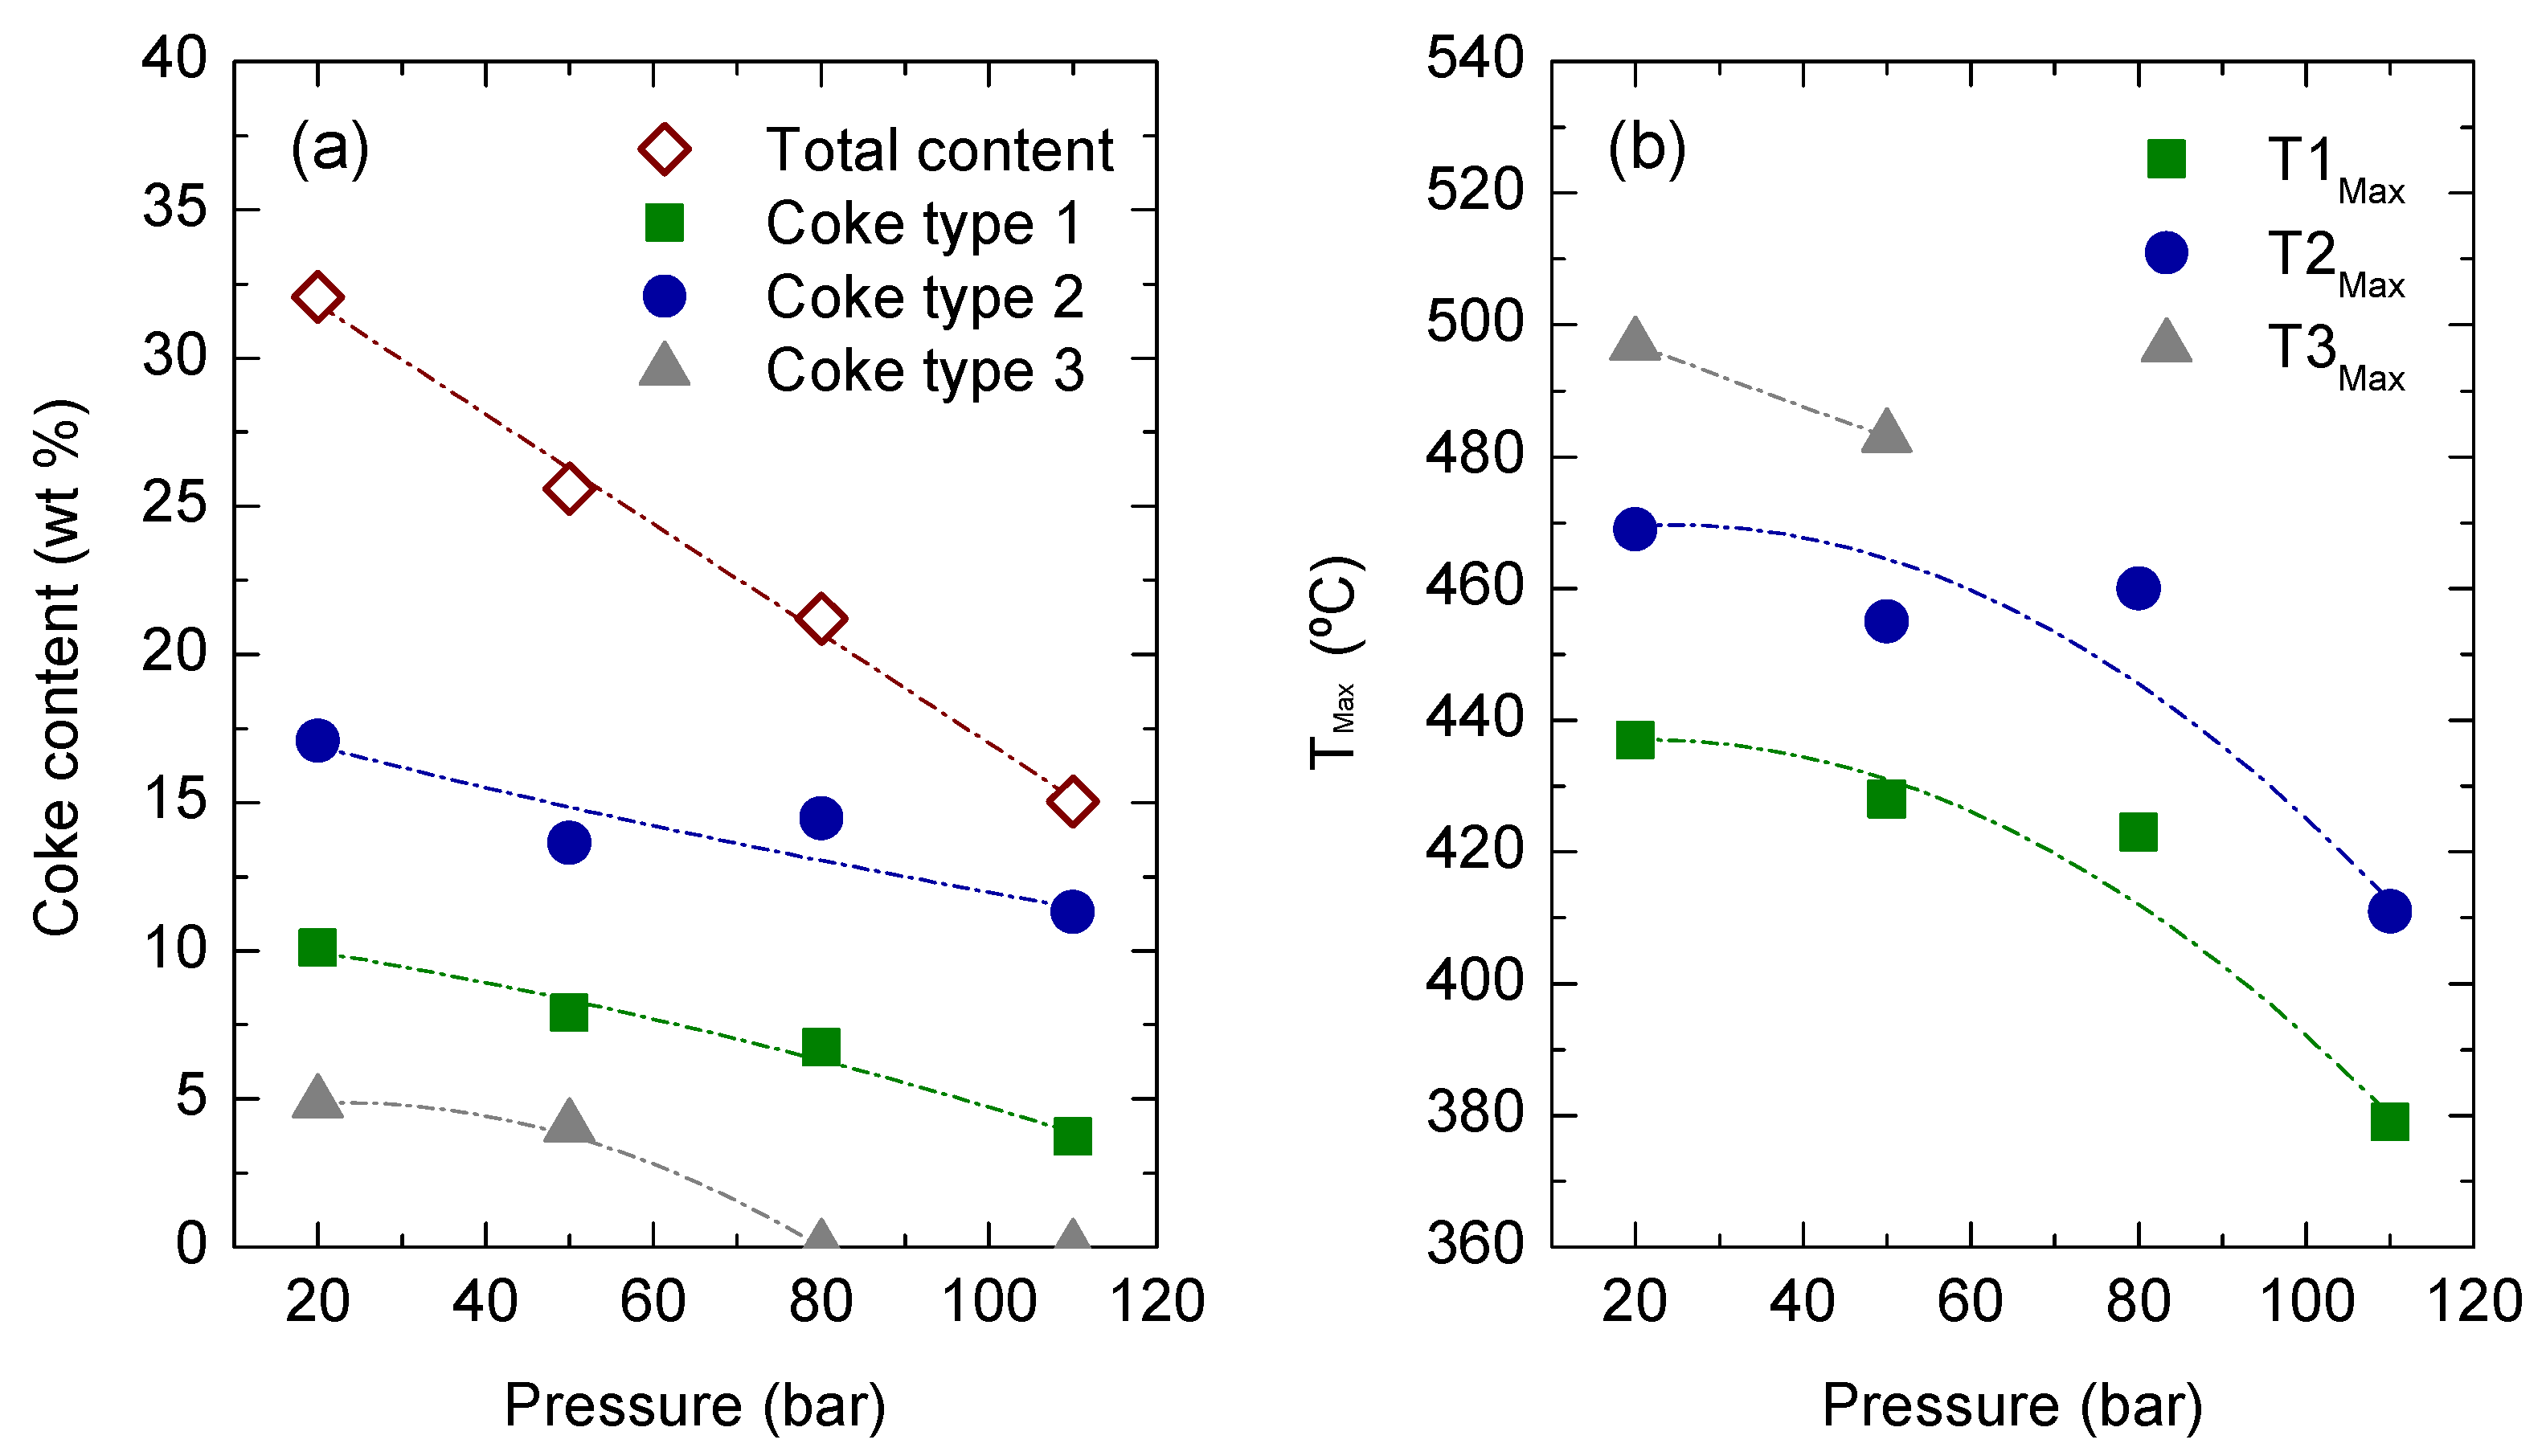
2.6. Coke Deposition

The effect of H2 pressure on the deposition of coke on the catalyst has been studied by temperature-programmed oxidation (TPO) analysis, and obtained results are depicted in Figure 7. This analysis is suitable for quantifying the amount of coke deposited but also for identifying its nature and location in the catalyst particle [38]. Therefore, the temperature corresponding to the maximum combustion rate (TMax) is a parameter that can be used as an index for assessing the ease of combustion. It depends on [39] (i) the nature of the coke because combustion takes place at a lower temperature in a poorly structured coke (with a high H/C ratio), and (ii) the location of the coke, since the coke located on the outside of the catalyst particle and on the outside of the zeolite micropores will be burnt faster (combustion takes place without diffusional limitations). Likewise, combustion occurs at a lower TMax when the coke is deposited on a metallic particle that catalyzes its combustion. Therefore, the deconvolution of the TPO profile allows for identifying different coke fractions located in different positions of the catalyst particles according to their different combustion rates [40]. With the aim of characterising the different coke fractions, the TPO profiles (coloured lines in Figure 7) have been deconvoluted. The results of the deconvolution, together with the temperature at which the combustion rate is maximized, the percentage of each type of coke, and total coke content have been collected in Figure 8.
The position of the combustion peaks in Figure 7 shows that increasing H2 pressure results in less condensed coke since it burns at a lower temperature. As it can be seen in Figure 8a, H2 pressure has a relevant effect on the content of coke, so that as the pressure increases from 20 to 110 bar, the total coke content decreases linearly from 32.1 to 15.0 wt%, respectively. This trend has been observed in the literature [30], and it is attributed to the ability of the metallic phase of the catalyst (PtPd, in this case) to activate the hydrogenation of coke precursors, attenuating their condensation rate to form the polyaromatics that are retained in the cages of the zeolite [21,41].
According to the deconvolution of the TPO profiles in Figure 7, three different coke fractions can be identified in the spent catalyst obtained for H2 pressures of 20 and 50 bar. They have been named coke 1, 2, and 3 according to the increasing order of their combustion temperature. In contrast, at 80 and 110 bar, only two coke fractions that burn at a lower temperature can be identified. Focusing on the sample obtained at 20 bar, the TPO has been deconvoluted into three Gaussian corresponding to TMax 437, 469, and 497 °C. These fractions can be related to the coke deposited on the outside of the catalyst particles, in the mesopores of the zeolite and in the micropores of the zeolite, respectively, in concordance with the criteria established in the literature to assess the TPOs of deactivated catalysts [42].
By relating these coke fractions to the concentration of the components in the reaction medium (Figure 2), the fractions that act as precursors of each type of coke can be identified. The so-called coke 3 burns at the highest temperature (497 °C) because it will be presumably deposited in the cages of the zeolite. Thus, its combustion will be hindered by severe diffusional limitations. Furthermore, its content in the spent catalyst (4.9 wt%) is high enough for physically blocking these cages. Attending to the burning temperature of this coke type 3, it will have a highly developed structure that has been formed by condensation reactions that convert light olefins, whose concentration in the gas stream is noticeable at 20 bar (Figure 4), into polyaromatic structures. The trend to form a similar type of coke in the micropores of an HY zeolite used in the cracking of HDPE pyrolysis waxes has also been observed in the literature [43]. It can be seen in Figure 8a that the content of this coke type 3 (4.0 wt%) decreases when increasing H2 pressure up to 50 bar, and it is not present in the spent catalysts obtained at 80 and 110 bar because under these conditions, there are no olefins in the product streams. It is also noteworthy that increasing the H2 pressure from 20 to 50 bar decreases the temperature corresponding to the maximum combustion rate of coke 3, from 493 to 483 °C, which is explained by the attenuation of the coke condensation reactions as this variable increases. The role of the presence of H2 in attenuating coke deposition is a well-established phenomenon [31].
Coke types 1 (10.1 wt%) and 2 (17.1 wt%) deposited at 20 bar are located on the outside of the catalyst particles and in the mesopores of the HY zeolite, respectively. The components that will act as precursors of these types of coke will be the macromolecular chains derived from the cracking of the HDPE and the heavy components within the VGO. This way, coke type 1 will be formed by the physical adsorption of those molecules on the outer surface of the catalyst particles, whereas coke type 2 requires the chemisorption of the aforementioned molecules on the acid sites located either on the outside of the catalyst particles or on the mesopores of the zeolite. Note that given the bulkiness of these molecules, they will not be capable of reaching the micropores of the zeolite. The polyaromatic hydrocarbons found in the VGO will be the compounds affected to a greater extent by the steric hindrance of the zeolite. The deposition of coke in the outer surface of the crystalline structure of the zeolite is a well-established phenomenon in catalytic cracking [43]. As H2 pressure increases, the amount of these coke fractions decreases because of the lower concentration of the corresponding precursors—heavy components whose conversion is notably increased (Figure 2). Moreover, the combustion of these types of coke takes place at lower temperatures (Figure 8b), which shows a relevant effect of H2 pressure in attenuating their condensation towards graphitic structures and reducing the level of blocking of the zeolite mesopores. It can be noted that at the highest H2 pressure (110 bar), the content of coke type 1 has been limited (3.7 wt%), but there is still a notable content of coke confined in the catalyst (coke 2, 11.3 wt%). Coke type 2 will undoubtedly affect the activity of the catalyst, even though its moderate combustion temperature (411 °C) shows that the mesoporous structure of zeolite has not been totally blocked and that the smallest compounds could reach the micropores. In addition, this low temperature required for the combustion of the coke is of interest to facilitate the regeneration of the catalyst.

3. Materials and Methods

3.1. Vacuum Gas Oil (VGO) and High-Density Polyethylene (HDPE)

The main physicochemical properties of the VGO (supplied by Petronor Refinery sited in Muskiz, Spain), which have been determined using different techniques described in detail elsewhere [37], have been summarized in Table S1. Briefly, the distribution obtained in the simulated distillation analysis shows that the VGO has a 4.5 wt% of light cycle oil (LCO) (216–350 °C) and a 95.4 wt% of heavy cycle oil (HCO) (>350 °C). This distribution is in accordance with the composition obtained by chromatographic means since the majority of the compounds in the VGO are aromatics (48.4 wt%), followed by naphthenes (35.3 wt%). Regarding the aromatics, the main fraction is the mono-aromatic one (41.9%), although the sum of di- and polyaromatics accounts for up to 58% of the total aromatics. It can be observed that a small proportion of sulfur-containing compounds, 2.3 wt%, which translates into 510 ppm of elemental sulfur (according to elemental analysis).
The HDPE has been purchased from Dow Chemical (Tarragona, Spain). Its main properties, i.e., average molecular weight, dispersity, density, and higher heating value, determined according to methods described in previous work [44], are also shown in Table S1. The plastic, provided in the form of 4 mm pellets, was ground under cryogenic conditions (size < 0.5 mm) before being blended with the VGO.

3.2. Catalyst

The catalyst selected for performing the current study has been a PtPd/HY catalyst since it offered a good catalytic behaviour in previous work [20]. The procedure followed for its preparation can be found elsewhere [45]. In order to correlate its catalytic behaviour with its main physicochemical properties, the catalyst has been characterised by several techniques. The textural properties of the catalyst, i.e., specific surface, pore volume and pore size distribution, have been determined in a Micromeritics ASAP 2010 apparatus (Norcross, GA, USA). An assessment of the surface of the catalyst has been performed by means of transmission electron microscopy (TEM) in a SuperTwin CM200 Philips microscope (Eindhoven, Netherlands) (acceleration voltage, 200 kV; resolution, 0.235 nm) equipped with a lanthanum hexaboride filament. The metal content of the catalyst has been quantified by inductively coupled plasma with atomic emission spectroscopy (ICP-AES, Thermo Fischer Scientific, Waltham, MA, USA). The acidic properties of the catalyst have been determined by two different techniques. On one hand, total acidity and acid strength have been calculated by temperature-programmed desorption (TPD) using tert-butylamine (t-BA) as the probe molecule in a Setaram TG-DSC 111 calorimeter (Sophia Antipolis, France) connected in line with a ThermoStar mass spectrophotometer (Balzers Instruments, Pfäffikon SZ, Switzerland). On the other hand, Fourier-transform infrared spectroscopy (FTIR) of adsorbed pyridine has been used to identify the nature of the acidic sites (Brønsted or Lewis). This essay has been carried out in a Thermo Nicolet 6700 (Thermo Fischer Scientific, Waltham, MA, USA) apparatus.

3.3. Reaction Setup and Conditions

Hydrocracking runs have been carried out in a 100 mL stainless steel stirred tank reactor (Parker Autoclave Engineers, Erie, PA, USA) operating in a semi-batch regime, discontinuous for the liquid feedstock and with a continuous flow of H2 that keeps the pressure constant during the reaction. The reactor operates together with other supplementary extra items, such as two gas cylinders (H2 and N2) connected to a gas mass flow control system, a temperature controller that acts over an electrical heating jacket, and a cooling system that ensures the condensation of the lightest liquid products, among others. A scheme of the reaction setup is shown in Figure S1, and a detailed explanation of the reaction procedure can be found elsewhere [9,20].
Hydrocracking runs have been carried out at 420 °C and at a reaction time of 120 min with 40 g of total feed, the HDPE to VGO ratio being 1:5. The total pressure has varied from 20 to 110 bar. Stirring speed has been established at 1300 rpm in order to ensure a perfect stirring of gas and liquid phases and, consequently, the absence of diffusional limitations [46]. Moreover, a catalyst to feed mass ratio (C/F) has been established at 0.1 gcatalyst gfeed−1.
At the end of the reaction, the reactor has been cooled down following a heating rate of 20 °C min−1 using an open water system. The gases have been collected in a sampling bag and analyzed by gas chromatography. The liquids have been separated following the solvent fractionation method summarized in Figure S2, and, subsequently, they have been analysed as follows.

3.4. Analysis of the Products

Obtained products have been lumped into the six different fractions: (i) gas (<35 °C); (ii) naphtha (35–216 °C); (iii) light cycle oil (LCO, 216–350 °C); (iv) heavy cycle oil (HCO, > 350 °C); (v) wax (unconverted HDPE); and (vi) coke (carbonaceous deposit). When analyzing the composition of the gas fraction, C1–C2 compounds have been considered dry gas and C3–C4 as liquefied petroleum gases (LPG).
As aforementioned, the composition of the gas fraction has been determined by chromatography means. The analysis has been carried out in an Agilent Technologies 6890 GC equipped with a 100% dimethylpolysiloxane capillary column (HP-PONA, 50 m × 0.2 mm) and an FID detector.
The distribution of the fractions in the liquid product has been determined by simulated distillation analysis according to ASTM D2887 Standard. An Agilent Technologies 6890 GC equipped with a 100% dimethylpolysiloxane semicapillary column (Agilent J&W DB-2887, 10 m × 0.53 mm) and an FID detector has been used. In addition, two-dimensional gas chromatography has been employed to determine the composition of the naphtha and LCO fractions. The compounds have been grouped according to their nature into (i) n-paraffins (n-P), (ii) isoparaffins (i-P), (iii) olefins (O), (iv) naphthenes (N), (v) 1-ring aromatics (A1), (vi) 2-ring aromatics (A2), and, (vii) 3+-ring aromatics (A3+). These latter analyses have been carried out in an Agilent 7890A Series GC Systems coupled with an Agilent 5975C Series GC/MSD mass spectrometer. The configuration of this equipment has been already detailed in our previous works [20,37].
The amount and nature of the coke deposited on the catalyst have been determined by temperature-programmed oxidation (TPO) in a TA Instruments TGA-Q 5000 thermobalance. The procedure followed has consisted of (i) N2 sweeping up to 550 °C, (ii) combustion with air up to 550 °C using a temperature ramp of 5 °C·min−1, followed by 90 min of isothermal conditions (to ensure complete combustion of coke), and (iii) cooling of the sample to room temperature.
As the feed is a mixture of HDPE and VGO, the conversion can refer either to the plastic or to the heavy HCO fraction within the VGO. These fractions can be either converted into light products or condensed into coke. So, two conversion indices have been established:
HCO   conversion :   X HCO = ( m HCO ) initial ( m HCO ) final ( m HCO ) initial 100
HDPE   conversion :   X HDPE = ( m HDPE ) initial ( m HDPE ) final ( m HDPE ) initial 100
where (mHCO)initial and (mHCO)final are the mass of the HCO fraction in the feedstock and the products, respectively, and (mHDPE)initial and (mHDPE)final are the amount of HDPE in the feedstock and the unconverted HDPE in the products (wax), respectively.
The yield of each lump (Yi) has been defined as the mass ratio of each particular lump, which is referred to as the total amount of feed used:
Y i = m i ( m VGO + m HDPE ) initial 100
where mi is the mass of fraction i and the term in the denominator for the total amount of mass fed to the reactor.
As the main objective is to maximize the yields of naphtha and LCO fractions, the selectivity to fuels (SF) with regard to all other products has also been calculated [47]:
S F = Y Naphtha + Y LCO Y Gas + Y HCO + Y Wax + Y Coke
where YNaphtha, YLCO, YGas, YHCO, YWax, and YCoke are the yields of naphtha, LCO, Gas, HCO, unconverted HDPE, and coke, respectively.
The research octane number (RON) has been calculated from chromatographic analysis according to the Anderson–Sharkey–Walsh method [48]. This method divides the naphtha lump into 31 groups of compounds, assigning to each one a value of RON. The groups are chosen in such a way that each one has a small boiling point range and contains similar chemical compounds. In fact, some of these groups are made up of a single component. According to the mass percentage reported for each group, the RON can be estimated by means of a weighted sum:
RON = j = 1 32 w j RON j
where wj is the mass fraction of group j, obtained from the chromatographic analysis, and RONj is the RON of the mixture of group j, defined in the method for each group.
The cetane index has been calculated using the ASTM D-4737 standard. This standard estimates the cetane index as a function of density and distillation recovery temperature measurements.

4. Conclusions

H2 pressure has been proven to be an important operating variable to take into account for HDPE/VGO hydrocracking. In general, high H2 pressure has a positive effect. Thus, under the conditions studied (PtPd/HY catalyst, 420 °C, 0.1 C/F ratio, and 120 min), an H2 pressure of 110 bar is required to achieve a conversion of the HCO fraction in the VGO of 94% and HDPE of 79 wt%. Under these conditions, a high fuel yield is obtained with a high naphtha yield (53 wt%), while the yield of LCO lump is very low (7 wt%), even lower than the gas yield (30 wt%), and a negligible coke yield (1.1 wt%) has been obtained.
The effects on the composition of the naphtha fraction are also important because an increase in the H2 pressure decreases significantly the content of aromatics at the same time as the content of saturated compounds increases. Hence, at 110 bar, the concentration of normal and isoparaffins accounted for 22.5 and 43.7 wt%, respectively. Naphthenes have been boosted up to 20.5 wt%, whereas aromatics have been reduced to 20.4 wt%, and practically they are all 1-ring aromatics. Finally, the RON of this fraction is 91.5. The LCO fraction obtained at 110 bar is also mainly paraffinic, with concentrations of ramified and normal paraffins of 53.3 and 12.3 wt%. In addition, naphthenes account for 4.4 wt%. The remaining compounds are aromatics, with concentrations of 11.4, 17.8, and 9 wt% for mono-, di-, and poly-aromatics, respectively. The composition of this fraction entails that the cetane index is 53.1. With regard to the gas fraction, LPG is the predominant one with concentrations of propane, iso- and n-butane of 35.9, 21.4, and 11.8 wt%, respectively, while the rest corresponds to ethane (16.21 wt%) and methane (14.7 wt%).
The effects of the H2 pressure on coke deposition should also be highlighted because above 80 bar, the formation of coke inside the micropores of the zeolite used as support is prevented, and coke combustion is facilitated. The analysis of the coke deposited at 110 bar, in which both the contents of external (3.73 wt%) and internal (11.3 wt%) cokes have been reduced, shows that the combustion can be performed at a lower temperature (<411 °C). This result allows for predicting a reduced deactivation of the catalyst and a fast regeneration by combustion of the coke since no evident sintering problems of the Pt and Pd particles have been detected.
These results are encouraging for progressing in the study of the hydrocracking of waste plastics together with secondary refinery streams, such as VGO, as a suitable strategy to properly manage these wastes. In addition, attaching to the strategy described in the Waste-Refinery concept, a large-scale valorization of these wastes could be performed in the short mid-term.

Supplementary Materials

The following supporting information can be downloaded at: https://www.mdpi.com/article/10.3390/catal12050543/s1, Figure S1: schematic representation of the hydrocracking unit, Figure S2: solvent fractionation method followed, Table S1: properties of vacuum gas oil (VGO) and high-density polyethylene (HDPE).

Author Contributions

Conceptualization: F.J.V., R.P., J.B., J.M.A. and A.G.; formal analysis, F.J.V., R.P., J.B., J.M.A. and A.G.; investigation, methodology, and data curation, F.J.V., R.P. and A.G.; writing—original draft preparation, F.J.V., R.P. and A.G.; writing—review and editing, R.P., J.B., J.M.A. and A.G.; supervision, project administration, and funding acquisition, J.B., J.M.A. and A.G. All authors have read and agreed to the published version of the manuscript.

Funding

This work has been carried out with financial support of the Ministry of Science, Innovation and Universities (MICIU) of the Spanish Government (grant RTI2018-096981-B-I00), the European Union’s ERDF funds and Horizon 2020 research and innovation program under the Marie Skłodowska-Curie Actions (grant No 823745) and the Basque Government (grant IT1645-22).

Acknowledgments

The authors are thankful for the technical and human support provided by SGIker of UPV/EHU and European funding (ERDF and ESF). The authors also acknowledge Petronor Refinery for providing the vacuum gasoil used in this work.

Conflicts of Interest

The authors declare no conflict of interest.

References

  1. Al-Samhan, M.; Al-Fadhli, J.; Al-Otaibi, A.M.; Al-Attar, F.; Bouresli, R.; Rana, M.S. Prospects of Refinery Switching from Conventional to Integrated: An Opportunity for Sustainable Investment in the Petrochemical Industry. Fuel 2022, 310, 122161. [Google Scholar] [CrossRef]
  2. Marafi, A.; Albazzaz, H.; Rana, M.S. Hydroprocessing of Heavy Residual Oil: Opportunities and Challenges. Catal. Today 2019, 329, 125–134. [Google Scholar] [CrossRef]
  3. Stratiev, D.; Shishkova, I.; Tankov, I.; Pavlova, A. Challenges in Characterization of Residual Oils. A Review. J. Pet. Sci. Eng. 2019, 178, 227–250. [Google Scholar] [CrossRef]
  4. Kim, C.H.; Hur, Y.G.; Lee, K.-Y. Relationship between Surface Characteristics and Catalytic Properties of Unsupported Nickel-Tungsten Carbide Catalysts for the Hydrocracking of Vacuum Residue. Fuel 2022, 309, 122103. [Google Scholar] [CrossRef]
  5. Peng, C.; Liu, B.; Feng, X.; Du, Y.; Fang, X. Engineering Dual Bed Hydrocracking Catalyst towards Enhanced High-Octane Gasoline Generation from Light Cycle Oil. Chem. Eng. J. 2020, 389, 123461. [Google Scholar] [CrossRef]
  6. Dik, P.P.; Danilova, I.G.; Golubev, I.S.; Kazakov, M.O.; Nadeina, K.A.; Budukva, S.V.; Pereyma, V.Y.; Klimov, O.V.; Prosvirin, I.P.; Gerasimov, E.Y.; et al. Hydrocracking of Vacuum Gas Oil over NiMozeolite-Al2O3: Influence of Zeolite Properties. Fuel 2019, 237, 178–190. [Google Scholar] [CrossRef]
  7. Cordero-Lanzac, T.; Rodríguez-Mirasol, J.; Cordero, T.; Bilbao, J. Advances and Challenges in the Valorization of Bio-Oil: Hydrodeoxygenation Using Carbon-Supported Catalysts. Energy Fuels 2021, 35, 17008–17031. [Google Scholar] [CrossRef]
  8. Hita, I.; Arabiourrutia, M.; Olazar, M.; Bilbao, J.; Arandes, J.M.; Castaño, P. Opportunities and Barriers for Producing High Quality Fuels from the Pyrolysis of Scrap Tires. Renew. Sustain. Energy Rev. 2016, 56, 745–759. [Google Scholar] [CrossRef]
  9. Vela, F.J.; Palos, R.; Trueba, D.; Bilbao, J.; Arandes, J.M.; Gutiérrez, A. Different Approaches to Convert Waste Polyolefins into Automotive Fuels via Hydrocracking with a NiW/HY Catalyst. Fuel Process. Technol. 2021, 220, 106891. [Google Scholar] [CrossRef]
  10. Palos, R.; Gutiérrez, A.; Vela, F.J.; Olazar, M.; Aandes, J.M.; Bilbao, J. Waste Refinery: The Valorization of Waste Plastics and End-of-Life Tires in Refinery Units. A Review. Energy Fuels 2021, 35, 3529–3557. [Google Scholar] [CrossRef]
  11. Xu, A.; Shi, M.; Xing, X.; Su, Y.; Li, X.; Liu, W.; Mao, Y.; Hu, T.; Qi, S. Status and Prospects of Atmospheric Microplastics: A Review of Methods, Occurrence, Composition, Source and Health Risks. Environ. Pollut. 2022, 303, 119173. [Google Scholar] [CrossRef]
  12. Yang, Z.; Lü, F.; Zhang, H.; Wang, W.; Shao, L.; Ye, J.; He, P. Is Incineration the Terminator of Plastics and Microplastics? J. Hazard. Mater. 2021, 401, 123429. [Google Scholar] [CrossRef] [PubMed]
  13. Artetxe, M.; Lopez, G.; Amutio, M.; Barbarias, I.; Arregi, A.; Aguado, R.; Bilbao, J.; Olazar, M. Styrene Recovery from Polystyrene by Flash Pyrolysis in a Conical Spouted Bed Reactor. Waste Manag. 2015, 45, 126–133. [Google Scholar] [CrossRef] [PubMed]
  14. Lopez, G.; Artetxe, M.; Amutio, M.; Elordi, G.; Aguado, R.; Olazar, M.; Bilbao, J. Recycling Poly-(Methyl Methacrylate) by Pyrolysis in a Conical Spouted Bed Reactor. Chem. Eng. Process. Process. Intensif. 2010, 49, 1089–1094. [Google Scholar] [CrossRef]
  15. Artetxe, M.; Lopez, G.; Elordi, G.; Amutio, M.; Bilbao, J.; Olazar, M. Production of Light Olefins from Polyethylene in a Two-Step Process: Pyrolysis in a Conical Spouted Bed and Downstream High-Temperature Thermal Cracking. Ind. Eng. Chem. Res. 2012, 51, 13915–13923. [Google Scholar] [CrossRef]
  16. Elordi, G.; Olazar, M.; Artetxe, M.; Castaño, P.; Bilbao, J. Effect of the Acidity of the HZSM-5 Zeolite Catalyst on the Cracking of High Density Polyethylene in a Conical Spouted Bed Reactor. Appl. Catal. A Gen. 2012, 415–416, 89–95. [Google Scholar] [CrossRef]
  17. Jahirul, M.I.; Rasul, M.G.; Schaller, D.; Khan, M.M.K.; Hasan, M.M.; Hazrat, M.A. Transport Fuel from Waste Plastics Pyrolysis—A Review on Technologies, Challenges and Opportunities. Energy Convers. Manag. 2022, 258, 115451. [Google Scholar] [CrossRef]
  18. Bin Jumah, A.; Anbumuthu, V.; Tedstone, A.A.; Garforth, A.A. Catalyzing the Hydrocracking of Low Density Polyethylene. Ind. Eng. Chem. Res. 2019, 58, 20601–20609. [Google Scholar] [CrossRef]
  19. Bin Jumah, A.; Tedstone, A.A.; Garforth, A.A. Hydrocracking of Virgin and Post-Consumer Polymers. Microporous Mesoporous Mater. 2021, 315, 110912. [Google Scholar] [CrossRef]
  20. Vela, F.J.; Palos, R.; Bilbao, J.; Arandes, J.M.; Gutiérrez, A. Effect of Co-Feeding HDPE on the Product Distribution in the Hydrocracking of VGO. Catal. Today 2020, 353, 197–203. [Google Scholar] [CrossRef]
  21. Munir, D.; Irfan, M.F.; Usman, M.R. Hydrocracking of Virgin and Waste Plastics: A Detailed Review. Renew. Sustain. Energy Rev. 2018, 90, 490–515. [Google Scholar] [CrossRef]
  22. Galadima, A.; Muraza, O. Hydrocracking Catalysts Based on Hierarchical Zeolites: A Recent Progress. J. Ind. Eng. Chem. 2018, 61, 265–280. [Google Scholar] [CrossRef]
  23. Thybaut, J.W.; Marin, G.B. Multiscale Aspects in Hydrocracking: From Reaction Mechanism over Catalysts to Kinetics and Industrial Application. Adv. Catal. 2016, 59, 109–238. [Google Scholar] [CrossRef]
  24. Ding, W.; Liang, J.; Anderson, L.L. Hydrocracking and Hydroisomerization of High-Density Polyethylene and Waste Plastic over Zeolite and Silica—Alumina-Supported Ni and Ni-Mo Sulfides. Energy Fuels 1997, 11, 1219–1223. [Google Scholar] [CrossRef]
  25. Shabtai, J.; Xiao, X.; Zmierczak, W. Depolymerization−liquefaction of Plastics and Rubbers. 1. Polyethylene, Polypropylene, and Polybutadiene. Energy Fuels 1997, 11, 76–87. [Google Scholar] [CrossRef]
  26. Liu, K.; Meuzelaar, H.L.C. Catalytic Reactions in Waste Plastics, HDPE and Coal Studied by High-Pressure Thermogravimetry with on-Line GC/MS. Fuel Process. Technol. 1996, 49, 1–15. [Google Scholar] [CrossRef]
  27. Mosio-Mosiewski, J.; Warzala, M.; Morawski, I.; Dobrzanski, T. High-Pressure Catalytic and Thermal Cracking of Polyethylene. Fuel Process. Technol. 2007, 88, 359–364. [Google Scholar] [CrossRef]
  28. Luo, M.; Curtis, C.W. Effect of Reaction Parameters and Catalyst Type on Waste Plastics Liquefaction and Coprocessing with Coal. Fuel Process. Technol. 1996, 49, 177–196. [Google Scholar] [CrossRef]
  29. Ochoa, R.; Van Woert, H.; Lee, W.H.; Subramanian, R.; Kugler, E.; Eklund, P.C. Catalytic Degradation of Medium Density Polyethylene over Silica—Alumina Supports. Fuel Process. Technol. 1996, 49, 119–136. [Google Scholar] [CrossRef]
  30. Akah, A.; Hernandez-Martinez, J.; Rallan, C.; Garforth, A.A. Enhanced Feedstock Recycling of Post-Consumer Plastic Waste. Chem. Eng. Trans. 2015, 43, 2395–2400. [Google Scholar] [CrossRef]
  31. Wang, W.; Cai, X.; Hou, H.; Dong, M.; Li, Z.; Liu, F.; Liu, Z.; Tian, S.; Long, J. Different Mechanisms of Coke Precursor Formation in Thermal Conversion and Deep Hydroprocessing of Vacuum Residue. Energy Fuels 2016, 30, 8171–8176. [Google Scholar] [CrossRef]
  32. Zmierczak, W.; Xiao, X.; Shabtai, J. Depolymerization-Liquefaction of Plastics and Rubbers. 2. Polystyrenes and Styrene-Butadiene Copolymers. Fuel Process. Technol. 1996, 49, 31–48. [Google Scholar] [CrossRef]
  33. Morawski, I.; Mosio-Mosiewski, J. Effects of Parameters in Ni-Mo Catalysed Hydrocracking of Vacuum Residue on Composition and Quality of Obtained Products. Fuel Process. Technol. 2006, 87, 659–669. [Google Scholar] [CrossRef]
  34. Escola, J.M.; Aguado, J.; Serrano, D.P.; Briones, L.; Díaz de Tuesta, J.L.; Calvo, R.; Fernandez, E. Conversion of Polyethylene into Transportation Fuels by the Combination of Thermal Cracking and Catalytic Hydroreforming over Ni-Supported Hierarchical Beta Zeolite. Energy Fuels 2012, 26, 3187–3195. [Google Scholar] [CrossRef]
  35. Gutiérrez, A.; Arandes, J.M.; Castaño, P.; Olazar, M.; Bilbao, J. Effect of Pressure on the Hydrocracking of Light Cycle Oil with a PtPd/HY Catalyst. Energy Fuels 2012, 26, 5897–5904. [Google Scholar] [CrossRef]
  36. Palos, R.; Gutiérrez, A.; Hita, I.; Castaño, P.; Thybaut, J.W.; Arandes, J.M.; Bilbao, J. Kinetic Modeling of Hydrotreating for Enhanced Upgrading of Light Cycle Oil. Ind. Eng. Chem. Res. 2019, 58, 13064–13075. [Google Scholar] [CrossRef]
  37. Palos, R.; Gutiérrez, A.; Arandes, J.M.; Bilbao, J. Catalyst Used in Fluid Catalytic Cracking (FCC) Unit as a Support of NiMoP Catalyst for Light Cycle Oil Hydroprocessing. Fuel 2018, 216, 142–152. [Google Scholar] [CrossRef]
  38. Vivas-Báez, J.C.; Servia, A.; Pirngruber, G.D.; Dubreuil, A.C.; Pérez-Martínez, D.J. Insights in the Phenomena Involved in Deactivation of Industrial Hydrocracking Catalysts through an Accelerated Deactivation Protocol. Fuel 2021, 303, 120681. [Google Scholar] [CrossRef]
  39. Trueba, D.; Palos, R.; Bilbao, J.; Arandes, J.M.; Gutiérrez, A. Product Composition and Coke Deposition in the Hydrocracking of Polystyrene Blended with Vacuum Gasoil. Fuel Process. Technol. 2021, 224, 107010. [Google Scholar] [CrossRef]
  40. Vivas-Báez, J.C.; Pirngruber, G.D.; Servia, A.; Dubreuil, A.-C.; Pérez-Martínez, D.J. Impact of Feedstock Properties on the Deactivation of a Vacuum Gas Oil Hydrocracking Catalyst. Energy Fuels 2021, 35, 12297–12309. [Google Scholar] [CrossRef]
  41. Castaño, P.; Gutiérrez, A.; Hita, I.; Arandes, J.M.; Aguayo, A.T.; Bilbao, J. Deactivating Species Deposited on PtPd Catalysts in the Hydrocracking of Light-Cycle Oil. Energy Fuels 2012, 26, 1509–1519. [Google Scholar] [CrossRef]
  42. Ochoa, A.; Valle, B.; Resasco, D.E.; Bilbao, J.; Gayubo, A.G.; Castaño, P. Temperature Programmed Oxidation Coupled with in Situ Techniques Reveal the Nature and Location of Coke Deposited on a Ni/La2O3-αAl2O3 Catalyst in the Steam Reforming of Bio-Oil. ChemCatChem 2018, 10, 2311–2321. [Google Scholar] [CrossRef]
  43. Rodríguez, E.; Elordi, G.; Valecillos, J.; Izaddoust, S.; Bilbao, J.; Arandes, J.M.; Castaño, P. Coke Deposition and Product Distribution in the Co-Cracking of Waste Polyolefin Derived Streams and Vacuum Gas Oil under FCC Unit Conditions. Fuel Process. Technol. 2019, 192, 130–139. [Google Scholar] [CrossRef]
  44. Palos, R.; Gutiérrez, A.; Vela, F.J.; Maña, J.A.; Hita, I.; Asueta, A.; Arnaiz, S.; Arandes, J.M.; Bilbao, J. Assessing the Potential of the Recycled Plastic Slow Pyrolysis for the Production of Streams Attractive for Refineries. J. Anal. Appl. Pyrolysis 2019, 142, 104668. [Google Scholar] [CrossRef]
  45. Gutiérrez, A.; Arandes, J.M.; Castaño, P.; Olazar, M.; Bilbao, J. Preliminary Studies on Fuel Production through LCO Hydrocracking on Noble-Metal Supported Catalysts. Fuel 2012, 94, 504–515. [Google Scholar] [CrossRef]
  46. Angeles, M.J.; Leyva, C.; Ancheyta, J.; Ramírez, J. A Review of Experimental Procedures for Heavy Oil Hydrocracking with Dispersed Catalyst. Catal. Today 2014, 220–222, 274–294. [Google Scholar] [CrossRef]
  47. Al-Attas, T.A.; Zahir, M.H.; Ali, S.A.; Al-Bogami, S.A.; Malaibari, Z.; Razzak, S.A.; Hossain, M.M. Novel (Co-,Ni)-p—Tert-Butylcalix[4]Arenes as Dispersed Catalysts for Heavy Oil Upgrading: Synthesis, Characterization, and Performance Evaluation. Energy Fuels 2019, 33, 561–573. [Google Scholar] [CrossRef]
  48. Anderson, P.C.; Sharkey, J.M.; Walsh, R.P. Calculation of the Research Octane Number of Motor Gasolines from Gas Chromatographic Data and a New Approach to Motor Gasoline Quality Control. J. Inst. Pet. 1972, 58, 83–94. [Google Scholar]
Figure 1. Transmission electron microscopy (TEM) at 100 nm (a), and at 50 nm (b) of fresh PtPd/HY catalyst.
Catalysts 12 00543 g001
Figure 2. Effect of H2 pressure on product yields and conversions.
Catalysts 12 00543 g002
Figure 3. Effect of H2 pressure on selectivity to fuel index.
Catalysts 12 00543 g003
Figure 4. Effect of H2 pressure on the composition of the gas fraction.
Catalysts 12 00543 g004
Figure 5. Effect of H2 pressure on the composition of the naphtha fraction. Key: n-P—n-paraffins; i-P—isoparaffins; N—naphthenes; O—olefins; A1—1-ring aromatics; A2—2-ring aromatics.
Catalysts 12 00543 g005
Figure 6. Effect of H2 pressure on the composition of the LCO fraction. Key: n-P—n-paraffins; i-P—isoparaffins; N—naphthenes; A1—1—ring aromatics; A2—2—ring aromatics; A3+—3+—ring aromatics.
Catalysts 12 00543 g006
Figure 7. Effect of pressure on the TPO profile of coke.
Catalysts 12 00543 g007
Figure 8. Effect of H2 pressure on the (a) total coke and fractions coke contents and the (b) maximum coke combustion temperature.
Catalysts 12 00543 g008
Table 1. Textural properties, chemical composition, and acidic properties of the PtPd/HY catalyst.
PropertyPtPd/HY
SBET (m2 g−1)620
Smicropore (m2 g−1)543
Smesopore (m2 g−1)77
Vpore (cm3 g−1)0.39
dpore (nm)8.44
Pt (wt%)1.19
Pd (wt%)0.53
AT (mmolt-BA g−1) 11.69
AS (kJ molt-BA−1) 2135
B/L ratio1.53
1 Total acidity; 2 average acidic strength.
Publisher’s Note: MDPI stays neutral with regard to jurisdictional claims in published maps and institutional affiliations.

