Article

Methane-Assisted Iron Oxides Chemical Looping in a Solar Concentrator: A Real Case Study

1
Department of Energy (DENERG), Politecnico di Torino, Corso Duca degli Abruzzi 24, 10129 Turin, Italy
2
Energy Center, Politecnico di Torino, Via Paolo Borsellino 38/16, 10138 Turin, Italy
*
Author to whom correspondence should be addressed.
Catalysts 2022, 12(11), 1477; https://doi.org/10.3390/catal12111477
Submission received: 30 September 2022 / Revised: 23 October 2022 / Accepted: 27 October 2022 / Published: 19 November 2022
(This article belongs to the Special Issue Advanced Catalysis for Green Fuel Synthesis and Energy Conversion)

Abstract

:
Recent interest in hydrogen as an alternative fuel for lowering carbon emissions is funding the exploration of new ways to cleanly produce this molecule. Iron oxides can be used within a process of chemical looping. More specifically, they can lose oxygens at extremely high temperature in an inert atmosphere. An alumina receiver could not stand the extreme thermal stress, while steel (AISI 316 and Inconel Hastelloy c-276) lasted enough for the reaction to start, even if at the end of the process the receiver melted. Operating at a temperature above 1000 K helped the reaction switch from methane chemical looping combustion to chemical looping reforming, thus favouring H2 and CO yields. The gas flow outlet from the reactor reached a percentage up to 45% of H2 and 10% of CO. Carbon dioxide instead reached very low concentrations. While CO and CO2 reached a peak at the beginning of the experiment and then decreased, H2 was oscillating around a stable value. Unreacted methane was detected. The temperatures recorded in the reactor and the gas mixture obtained were used to validate a multiphysical model. The heat transfer and the chemistry of the experiment were simulated.

1. Introduction

The necessity of finding innovative ways for producing alternative fuels is becoming more and more urgent as the climate crisis is showing its effects. By signing the “2030 Climate Target Plan”, Europe committed to reduce greenhouse gases emissions by 55% by 2030, and subsequently to becoming climate neutral by 2050 [1,2] on the path of keeping global warming under 1.5 °C [3]. At the same time, renewable energy usage and improvements in energy efficiency are expected to rise by 32% and 32.5%, respectively [4]. The urge for a change is visible in every field of our societies; not only the power production sector but also other industrial sectors feel the need to switch to less carbon-intense processes. An option for achieving this goal is the use of abundant renewable energies for the production and conversion of chemical substances into useful alternative fuels that have a lower impact on our atmosphere than conventional fuels. Although fossil fuels have played an important role in technological development, they continue to alter the carbon cycle. When burning, they release into the atmosphere additional quantities of CO2 which are not fully reabsorbed by plants and fixed into organic carbon. On the contrary, they continue to remain in a gaseous form, increasing the atmosphere’s ability to reflect surface infrared radiation, i.e., heat, and subsequently increasing the average temperature of the planet [5]. In contrast, fuels from biomass, water and solar energy use carbon that is already included in the cycle and does not represent an additional source [6,7,8,9]. An example of this process is to use a CSP system to reach high temperatures using CL reactions to produce solar syngas [10,11]. In fact, with suitable conditions, OC can change its oxidation state and can interact with other substances to modify its chemical composition [12,13].
In a CL process, the OC is first reduced, losing part of its oxygen atoms (thanks to an external source of energy, such as the Sun), and it is then oxidized to absorb oxygen from another substance, such as H2O or CO2 for producing H2 or CO, i.e., a solar syngas [10].
Following the review work by Tang et al. (2015) [14], recent developments of oxygen carriers were summarised, among which metal oxides, in which iron oxides are found, appear to be promising candidates based on their relatively low price, large distributed material availability and low toxicity [15,16].
When pure iron (a multivalent transition metal) is mixed with oxygen, three different oxides can be formed:
  • Hematite, i.e., Fe2O3, where iron is at the highest state of oxidation, 3 (Fe3+);
  • Magnetite, i.e., Fe3O4, with a state of oxidation of 2.6 (mixture of Fe2+ and Fe3+);
  • Wüstite, i.e., FeO, where iron is at the lowest state of oxidation, 2 (Fe2+).
Reducing hematite and magnetite into lower oxidation state oxides consists of high-temperature endothermic reactions. At 1400 K, the reaction of the reduction of magnetite into wüstite requires 55 kcal, and Δ G reaches zero at around 2500 K [17]. Iron oxide reduction has been studied under many different operational circumstances, leading to different results. A first literature review would suggest several factors involved in this reaction. One of the first experimental trials was conducted in the Laboratoire PROcédés, Matériaux et Energie Solaire (PROMES) in Odeillo, France [18]. It has been demonstrated that the temperature for the reduction was higher than the melting temperature of magnetite Fe3O4 (1808 K) and wüstite FeO (1643 K) [18]. Sibieude et al. [19] have shown that a sample of magnetite reached 80% conversion after 5 min at 2000 °C under a flow rate of 20 l/h of argon. The same experiment in air reached only 40% conversion [19]. Agrafiotis et al. [20] explained how surpassing the melting temperature causes additional issues: the liquid phase immediately reduced the surface of the material, thus causing the deactivation of the reaction. Moreover, the sample melting requires grinding and sieving after every reduction. Therefore, many efforts have been made to decrease the temperature level for the reduction reaction. In practice, it is possible to alleviate this problem by reducing the oxygen partial pressure inside the reactor [21]. Additional evidence has been presented by the experiment of Charvin et al. [22] in 2007. They started from hematite and reduced it to wüstite, trying to obtain the purest oxide possible. They performed cycles by reducing water to yield hydrogen and magnetite and repeated the reduction under different operating conditions. At 1700 °C, the reduction of hematite into wüstite reached 100% of completion (and subsequent melting of the sample). Operating conditions were 0.1 bar of pressure with an inert atmosphere [22]. Other interesting results showed how to reach a high level of conversion (90%) of hematite into wüstite at 1600 °C at very low total pressure [22]. If the reduction takes place in a non-inert atmosphere (air), the chemical reaction changes. Examples found in the literature suggest using methane as a reducing agent. This option was considered to make the reaction in the solar concentrator (SC) easily reproducible. Methane interacts with oxygen in the iron lattice, thus initiating methane reforming with complete or partial combustion. CLPO is the most interesting process for obtaining a syngas mixture, even in the reduction stage. The most general indication is given by Najera et al. [23], which explores the range of temperature between 600 and 1000 °C. Therefore, several examples are given to explain how and why these reactions can take place at different temperature ranges and with different yields [24,25]. Monazam et al. [24] claimed to reach 60% conversion of the oxide (hematite) at 825 °C after 45 min. Lu et al. [25] instead operated at higher temperatures, around 1000 °C, and noted a higher level of conversion in a shorter time as the temperature increased; 80% was reached between 20 and 50 min, depending on the type of magnetite used and the temperature (1223 to 1298 K) [25]. Observing the hydrogen yields per mass of iron oxide, 4.94 mmol/g was found for original magnetite and 5.25 mmol/g for calcined magnetite [25]. In any case, all these temperatures are far from the melting point and can therefore be reached more easily in a solar concentrator. In particular, the work of Monazam et al. [24] was extensively used to investigate the objectives of the present work. They investigated the reaction of iron oxides with a mixture of inert gas and different percentages of methane (15–35%) between 700 and 825 °C, using a sample of 60 mg and a total gas flow rate of 45 cm3/s [24]. Studying the kinetics of the reaction, the group concluded that a higher temperature causes a greater drift in the degree of conversion during the initial minutes of reduction [24].
The main objective of the work is to study the reduction reactions within a receiver placed in the focus of a solar concentrator under real conditions, using iron oxide. To support the preparation of the experiment under real conditions, two simulations were carried out using a multiphysical model. A thermal model was used to identify the temperature distribution in the reactor. The zone with the highest temperature was highlighted. The chemical simulation provided information on the reaction state of the mixture components at different temperature levels. The experimental results showed that several obstacles had to be overcome due to unstable atmospheric conditions and the strength of the materials used in the case study. Difficulties were found on the part of the receiver materials to behave stably at varying thermal gradients, both with regard to the ceramic oxides and the metallic alloys used.

2. Material and Methods

Experimental tests to study the hematite reduction reaction inside a solar concentrator under real conditions were conducted at the Energy Center of Turin, Politecnico di Torino, Italy (45.0676 N, 7.6563 E). The concentrator consists of a single solar dish with an aperture of approximately 2.4 m (Elma net. Srl, TN). The system is equipped with two motors able to control the azimuth and the elevation of the dish to follow the Sun’s movements in the sky. Other useful geometric and technical parameters are listed in Table 1 [26]. To further investigate the effect of methane on hematite, reduction tests were carried out in the focal reactor by decreasing the required temperature level.
The machine is designed to contain tube-shaped reactors, as already reported in the literature from a previous study [27]. This reactor was positioned perpendicular to the axis of the dish in the fire. Reactors of different sizes and materials were used (99.7% sintered alumina (Almath crucibles, Newmarket, UK), AISI 316 stainless steel, Inconel Hastelloy c-276). Glass wool was used to retain iron oxides in reactors with a metal rod. Commercial hematite (Merck KGaA, Wilmington, DE, USA) was weighed using a precision balance (Sartorius, DE, USA) to select the amount of powder sufficient to meet the L/D ratio of 1.5. The material used is a powder with particle size measurements <5 mm and >96%; the formula weight is 159.69 g/mol with CAS n° 1309-37-1. Finally, the reactor was sealed by inserting another glass wool plug and placing the sample in the desired position. The experimental setup was equipped with a gas analyser (X-STREAM (Emerson, St. Louis, MO, USA)) for evaluating the gaseous mixture composition from the reactor. It works for multi-component analysis, using non-dispersive infrared, ultraviolet, and visible photometry (NDIR/UV/VIS), paramagnetic and electrochemical oxygen (pO2/eO2), and thermal conductivity (TCD) sensor technologies, as well as trace oxygen (trace O2) and trace moisture (trace H2O). The calibration of the system was assessed using the Definer 220 instrument (Mesa Labs, US), with a volumetric flow accuracy of 0.75% [28]. The mass flow controllers used were able to send inert and gas mixtures to the reactor receiver with a range of 0–500 NmL/min (Bronkhorst Mod F-201CV-1K0-AGD-33-V, NL). Two thermocouples were used for temperature monitoring during the experimental test. A B-type (Tersid srl, IT) thermocouple was placed on the outer surface, reaching the focal point with its tip. This is exposed to the strongest and most intense heat flux, as well as to variable weather conditions. An N-type thermocouple (Tersid srl, IT) was inserted into the reactor to monitor the internal temperature. The reactor was mounted on the supporting structure with Swagelok fittings (NL) using Teflon tape to ensure proper sealing. In fact, at higher temperatures Teflon adheres to extreme connections.
All tests were carried out using a similar procedure. The preferred day to start the experimental test has to have few cloud formations, high irradiation, low wind speed, low humidity, and low air pollution. Before starting the test, the 0.3 kW vacuum pump (model N86 KNF, DE) is activated to extract all residual gases from the line. Once the set-up is ready, the solar concentrator is switched to automatic mode, tracking the receiver towards the sun. Once a suitable temperature range (above 750 °C) is reached, the reactor is ready to receive the reducing atmosphere of 65% N2 and 35% CH4. The first element to be sent to the line is N2, while methane is added when the temperature is reached. It is important to record the values of the gas mixture released from the reactor after this point. Table 2 contains some of the most important parameters for the tests.
Together with the experimental tests, two simulations were performed with COMSOL Multiphysics. A thermal simulation was required to understand the temperature distribution inside the powder bed. In this region, it is not possible to obtain data directly from the thermocouple due to the limited volume. To understand the quality of the simulations, real data detected during the tests were compared to the temperature values obtained by the simulation in the same position. The comparison of these values suggests the goodness of the thermal simulation. As every test apart from #1 and #2 had some different parameters, 4 different geometries and simulations were performed. As the main scope of these simulations is to achieve a distribution of temperature inside and on the external surface of the reactor. The only two physics used in the software were “Heat Transfer in Porous Media” for obtaining the heat transfers and temperature distribution and “Chemistry” for the thermochemical properties of the ideal gas mixture. The fluid dynamic part of the simulation was intentionally neglected, even though it influenced the flow velocity inside the pipe. In fact, due to the low flow rate imposed in the tests and the enormous amount of solar power collected, the effect on the temperature distribution appeared to be negligible. Indeed, when starting the flowrate of N2, no significant decrease in temperature was noticed. Therefore, the simulations were run without the fluid dynamics physics in order to maintain a much lower computational cost. The general equations used are the following listed [29]:
( ρ C p ) e f f δ T 2 δ t + ρ f C p , f u T 2 + q = Q + Q v d
q = k e f f T 2
where ( ρ C p ) e f f is the effective volumetric heat capacity at constant pressure, and u is the velocity imposed considering the mass conservation. Q is the heat source, i.e., the incoming solar power, while q is the heat flux generated in the medium because of the conduction of heat. Qvd is the heat generated for viscous dissipation. Different equations were used for the solid, fluid and porous domains of the system:
ρ C p δ T 2 δ t + ρ C p u T 2 + q = Q + Q t e d
q = k e f f T 2
Qted is the heat generated for thermoelastic damping. In the case of the fluid, it must be remembered that the density is obtained through the ideal gas equation:
ρ = p a R s T
For the porous medium the complete equation is Equation (1), considering that both heat capacity and conductivity are weighted on the solid and fluids parts, and that θ is the volume fraction of solid material in porous media and ε is the porosity.
( ρ C p ) e f f = θ s ρ s C p , s + ε ρ f C p , f
and
k e f f = θ s k s + ε p k f + k d i s p
The boundary conditions are listed below:
  • The incoming energy flow on the focal area has a circular shape located at the midpoint of the tube. This energy flow comes from the second derivative of the heat flow on the surface. The value set in each simulation depends on the detected direct radiation value.
  • An outward convective scattering flow was imposed on the outer surface section of the receiver, considering the average wind speed.
  • The gas insertion and outflow were imposed in the outer section of the pipe. Due to the low pressures at which the system is operating, the gas can be considered almost uncompressed.
The control volume and geometry domain has been set to be as close as possible to the real case:
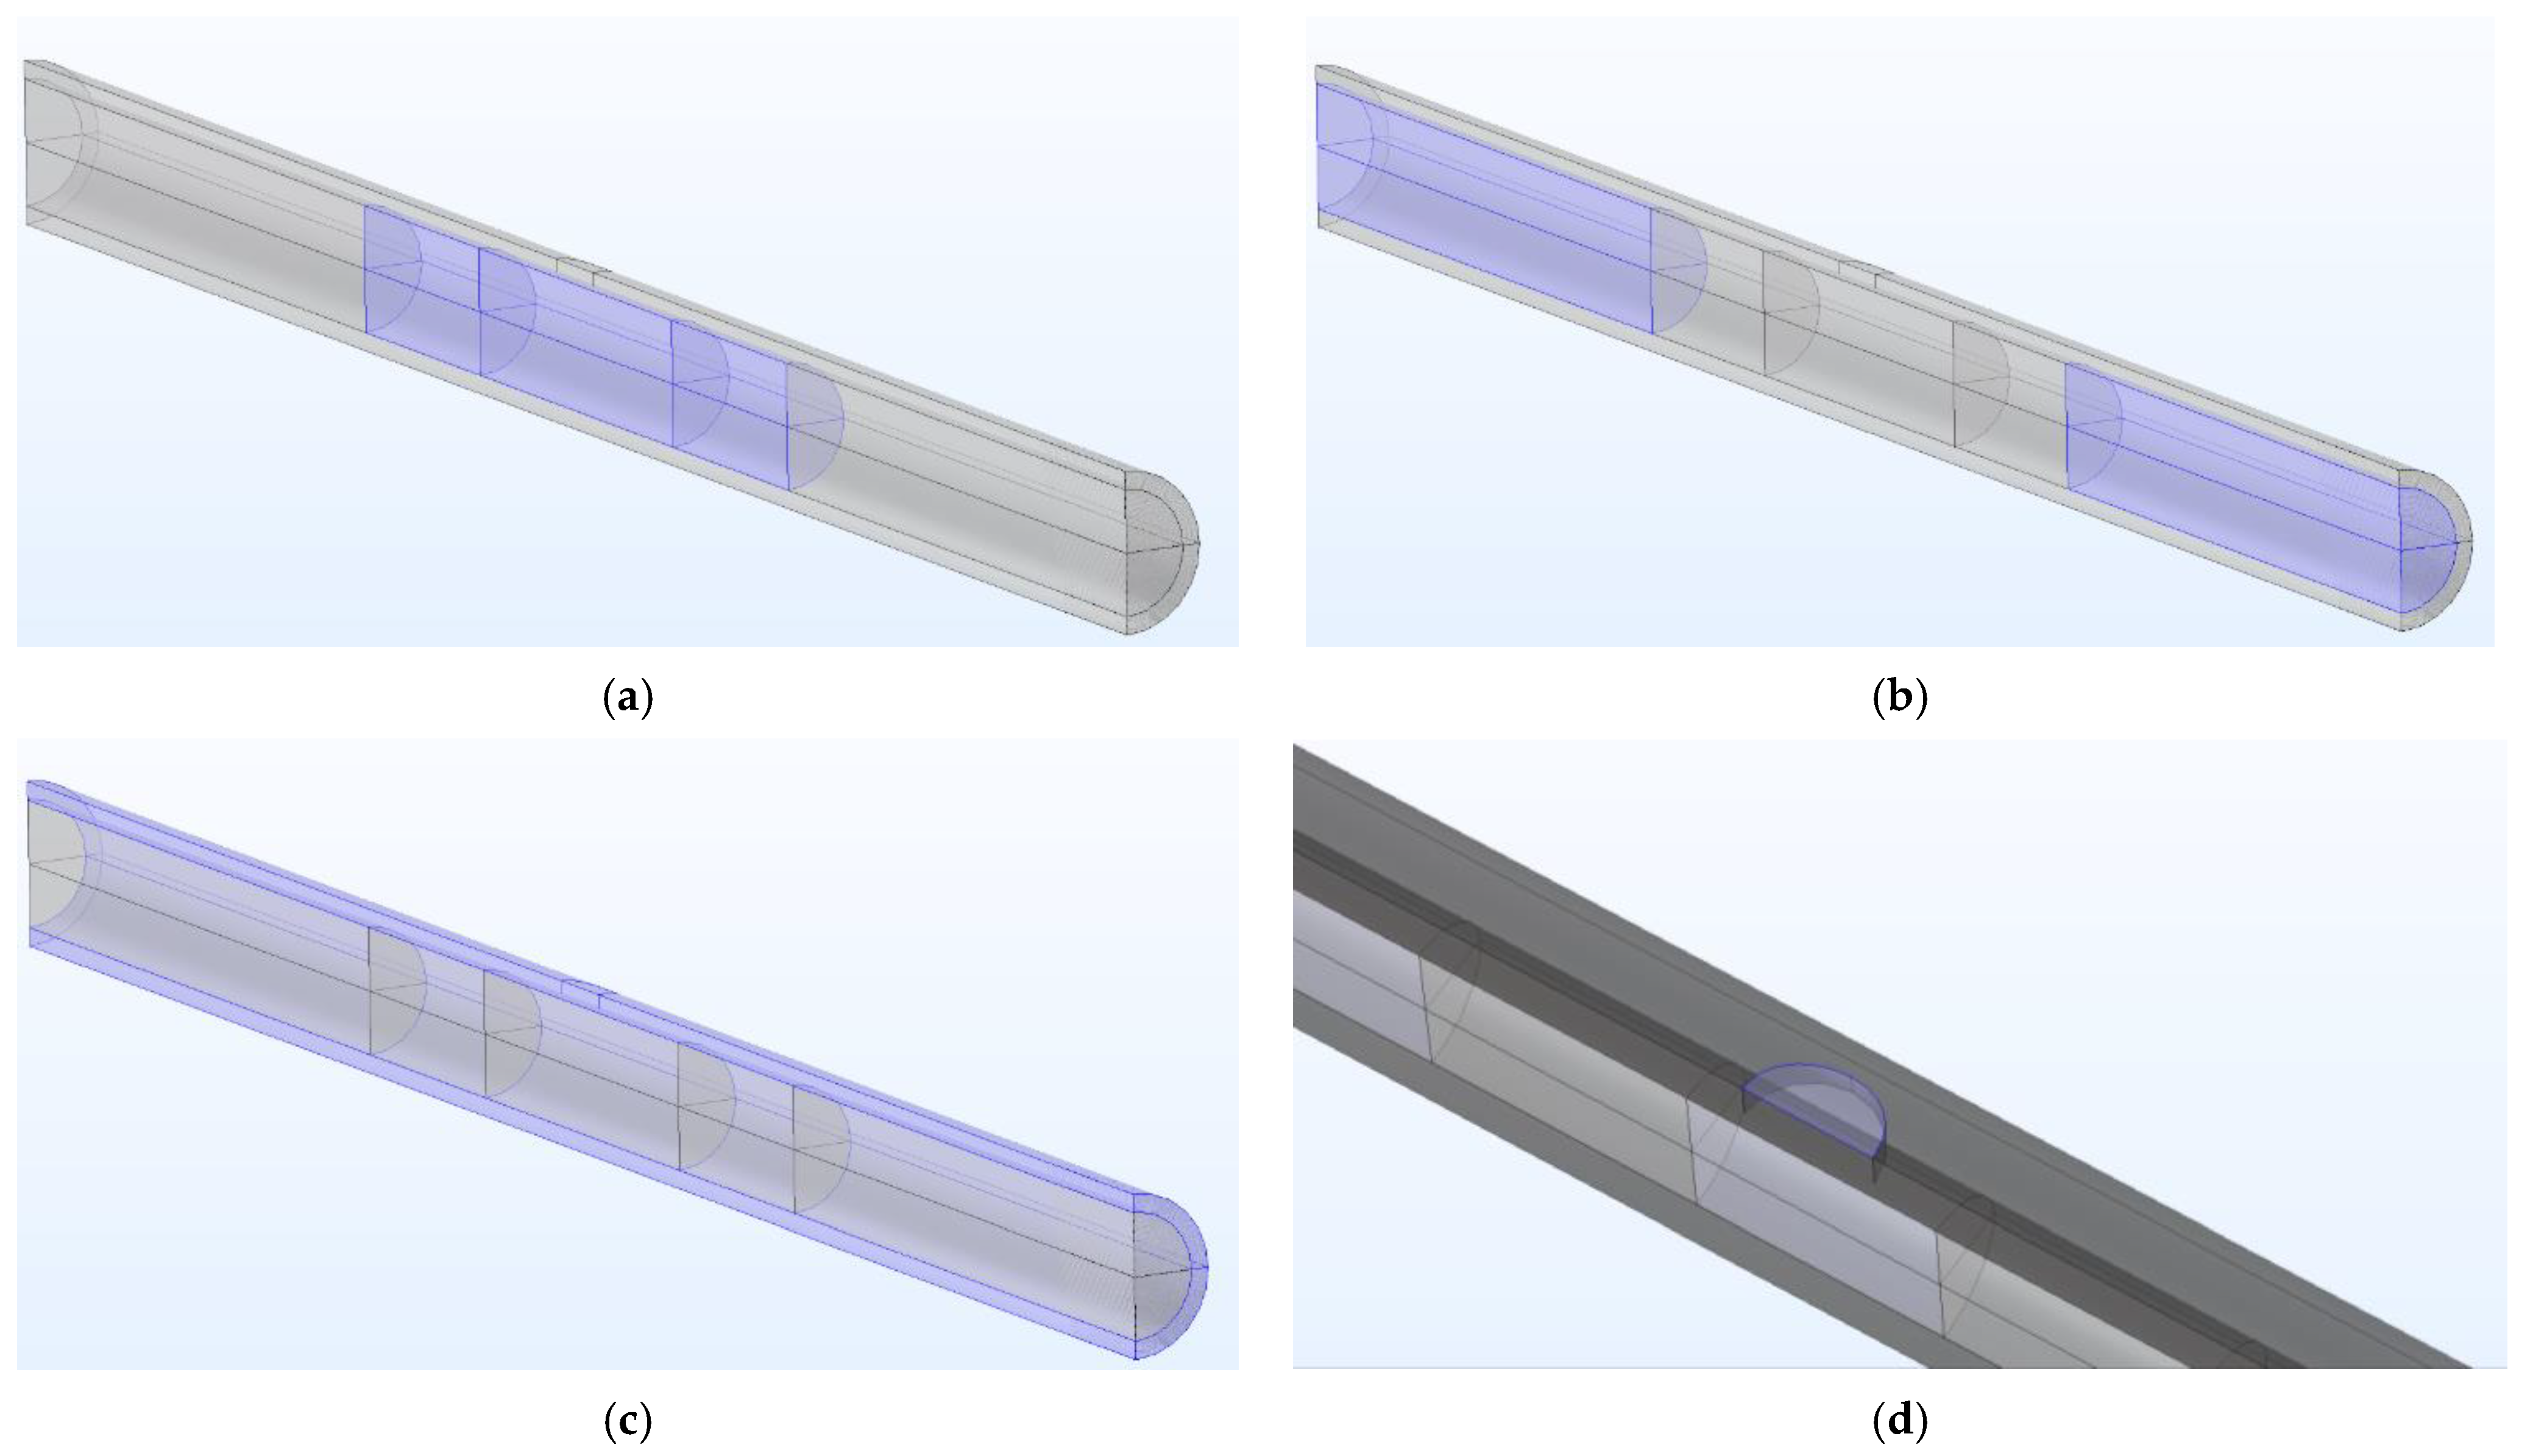
  • The central part, hosting the powder, has the shape of a short cylinder with an L/D ratio of 1.5. The quantity of charged powders follows, considering hematite powder density. It has been modelled as a porous medium, as can be seen in Figure 1a.
  • Two cylinders of glass wool hold the powder in the central part. They are 2.5 cm long in each geometry and modelled as a porous medium (Figure 1a).
  • The remaining internal part of the pipe is modelled as a fluid (nitrogen) with a velocity in the axial direction; see Figure 1b.
  • The pipe itself is considered as solid. The material depends on the simulation; see Figure 1c, while the area exposed to the heat solar flux is reported in Figure 1d.
A second modelling campaign was carried out to reproduce the study of the chemical reactions of the experiment inside the solar receiver. The model chosen is 0-dimensional. The initial model was only loaded with the complete reaction proposed by Monazam et al. [24], following Equation (14). Nevertheless, the reaction alone was not effective in reproducing the empirical results. The proposed stoichiometry does not come close to the measured quantities of gas leaving the mixture: more CO was produced than CO2. A more detailed model should then consider all the parallel reactions taking place. The physics of reaction engineering must first select the type of reactor used and the temperature at which it operates. For this simulation, the reactor selected had a constant volume. It is assumed that the gas flow is perfectly mixed in the reactor volume. The temperature was set to approximately 950 °C, due to the results obtained from the thermal distribution. The chemical and gaseous composition of the mixture was obtained by working on specific parameters.
k = A ( T T r e f ) n e x p ( E R g T )
The Arrhenius expression is representing the reaction constant by making use of three parameters [30]:
  • A, which is the frequency factor, indicates the frequency of collisions between reactant molecules at a standard concentration, and it depends on the temperature and the activation energy. Moreover, it depends on the rate at which molecules collide and on the relative orientation.
  • n expresses the dependency over temperature change. It can be set to zero.
  • E is the activation energy. It is the minimum amount of energy that must be provided to compounds to result in a chemical reaction [31].
The equilibrium of the reaction is reached when the Gibbs free energy is minimized. The Gibbs free energy is defined by the following equation (Equation (9)), where U is the internal energy, P is pressure, V is volume, T is temperature, S is entropy and H is the enthalpy of the system.
G ( T , P ) = U + P V T S = H T S
For reaching the minimum, it is necessary to equal the derivative to 0, and with a close system:
d U = δ Q + δ W = T d S P d V
where δQ is (reversible) heat transfer to the fluid and δW is (pressure) work in the system.
d G = T d S P d V + P d V + V d P T d S + S d T = V d P S d T
Regarding the CSTR with constant volume, the governing equations are:
d ( c i V r ) d t = m v f , m c f , m v c i + R i V r
The reactor volume as a function of time should be:
d V r d t = m v f , m v + v p
As indicated above, the volume is constant and therefore the reactor volume, Vr, can be removed from Equation (10). Ri, expressed in mol/(m3 s), is the species rate expression, while cf,m (SI unit: mol/m3) is the species molar concentration of the associated feed inlet stream vf,m (SI unit: m3/s). vp (SI unit: m3/s) denotes the volumetric production rate and is defined by Equation (14), where Mi, in kg/mol, expresses the molecular weight of species i.
v p = v r R i M i ρ i = R g T p V r i R i
Finally, v is the volumetric outlet rate, defined by the following equation.
v = m v f , m + v p
7 C H 4 + 27 F e 2 O 3 10 F e 3 O 4 + 24 F e O + 4 C O 2 + 3 C O + 6 H 2 O + 8 H 2
The hematite reduction reaction proceeds via two parallel paths, according to Monazam [24]. The overall reaction (Equation (16)) was used twice with different parameters operating with different kinetics: a topo-chemical process, nucleation and a growth process. The former has a frequency factor of 4.759*yCH40.636, while the latter has a frequency factor of 1.33*yCH41.06, where yCH4 is the molar fraction of methane in the input mixture [24]. However, it was decided not to use the activation energies provided by Monazam, but rather to choose the minimum value provided by Lu et al. [25] of 74 kJ/mol. Indeed, the activation energy may depend on many properties of the powder, such as grain size and the type of heat treatment undergone. Therefore, very different values can be found in the literature as a function of various parameters. The value given by Lu et al. [25] was used for calcined magnetite, a process similar to the heat treatment with which the powders used for the experiment were prepared.
Partial oxidation reactions must also be considered to consider not only the complete oxidation. The reactions have theoretical chemical formulas, according to Lu et al. [25].
F e 2 O 3 + C H 4 ( g ) 2 F e O + C O ( g ) + 4 H 2 ( g )
F e 3 O 4 + C H 4 ( g ) 3 F e O + C O ( g ) + 2 H 2 ( g )
Methane decomposition or cracking (Equation (17)) happens at high temperatures when the methane molecule is directly broken into molecular hydrogen and solid carbon, which is deposited on the substrate.
C H 4 C + 2 H 2
The effect of the above reaction increases the amount of hydrogen released into the mixture, while it may partially inactivate the powders due to carbon formation. Values for the pre-exponential factor and activation energy were retrieved from [32], being 1.3 × 10⁷ mol/(m2/s) and 214 kJ/mol. This reaction usually happens at quite high temperatures, but the presence of hematite can act as a catalyst for the reaction. The indicated value for energy activation and reaction constant were measured in the presence of hematite and is therefore useful for this simulation.
C + H 2 O C O + H 2
Alternatively, carbon gasification (Equation (20)) can help to clean the substrate by eliminating solid carbon from the powder by releasing hydrogen and carbon monoxide. The preexponential factor over hematite is 1.8 × 10⁴ m/s, and activation energy is 172 kJ/mol [32].
C + C O 2 2 C O
The Boudouard reaction (Equation (21)) is positively affecting the system as it helps to clean the substrate from solid carbon depositions, transforming CO2 into more useful CO. It involves atomic oxygen adsorbed at the surface as an agent. The value for the pre-exponential factor is 1.2 × 10⁶ mol/(m2/s), while activation energy is 185 kJ/mol [32]. However, the influence of this reaction (also called char gasification) is insignificant under 1000 K [33].
C H 4 + H 2 O 3 H 2 + C O
Steam reforming (Equation (22)) converts CH4 into H2 and CO using H2O. Being endothermic, the reaction is favoured at high temperatures. The values of pre-exponential factor and energy activation over a ferrite are 1.3 × 10⁷ mol/(m2 s) and 214 kJ/mol, respectively [32].
Additionally, the software required some other input parameters for successfully running the simulation. The model was built with the reactor volume settled to 4.278 × 10⁻⁶ m3, calculated considering the diameter of the pipe as 1.537 cm and an L/D ratio of 1.5. The reacting surface was calculated considering hematite particles with spherical surfaces. The average size of each particle has been considered to be around 20 μm, according to Lu et al. [25]. Equation (23) was used to calculate the number of spheres in the control volume [34].
N s p h e r e s = 6 ( 1 ε ) V t o t π d 3
Once the number of particles has been calculated, it can be multiplied by the area of each spherical particle. The total area of reaction obtained is therefore 0.89 m2. The concentrations of the reactant gases are initialised at zero, thanks to the contribution of the vacuum pump. The initial surface concentrations are instead calculated by considering the number of moles placed in the tube, divided by the reaction surface. Having a powder amount of 2.7 g, the surface concentrations should be 0.05 mol/m2. Nevertheless, the number of reactive sites is higher, as every molecule of hematite contains 3 oxygens. The value for moles per surface is multiplied by 3 and set to 1.5 mol/m2. The model is also settled with a feed inlet of a mixture of CH4 in N2 in the same proportions as in the experiment (35% CH4 and 65% N2).

3. Results and Discussion

Not all the tests saw the reaction happen. Technical issues made it difficult in some cases to observe the chemical reaction. Test #1 and test #2 used alumina pipes, which experienced ruptures, most probably because of thermal stress. The tubes broke with a sharp fracture in the ceramic, explaining why the system’s analytics measured oxygen in the gas mixture. The reason for the failure of the test is related to the extremely rapid heating of the reactor. Heating ramps with a maximum rate of 150 °C/min have been followed in the literature [35]. The achieved heating ramp generated in the solar concentrator, before reaching a stable temperature value, is approximately 500 °C/min, with a peak of more than 800 °C/min during the first minute. To avoid strong thermal stress in time, test #2 was performed with some precautions. The reactor was prepared and assembled the evening before the test day. The concentrator could follow the natural path of the sun in the sky from sunrise to sunset. No heating rate peaks were recorded in the early stages of testing. In addition, the reflective surfaces of the mirrors were partially covered to bias the power of the concentrator. This decreased the incoming heat flow to the fire and then, by slowly removing the cover, allowed a controlled increase in temperature. In each case, the tube broke again, as explained above. The thermal gradient along the length of the tube and the asymmetry of the heating were considered responsible, along with the thermal properties of the alumina. The other tests were more successful, with test #3 collecting most of the data. The other tests were performed using different types of steel. Despite Inconel Hastelloy being known for its better thermal properties, the thickness of the pipe also played an important role [36,37]. Test #3 was run with the thickest pipe. After a variable amount of time, however, all the metal tubes melted. While AISI 316 melted with the formation of a liquid phase, Inconel Hastelloy c-276 underwent a flaking process. The pipe wall started peeling off, losing layers of material. Data collected during test #3 can be found in Figure 2 and Figure 3. Errors in temperature monitoring due to probable thermocouple damage can be noted. Comparing the values of temperatures measured by the thermocouples with the simulations lead to having very similar numbers in every geometry. Therefore, simulations can be trusted for determining the right temperature values, even where there is no sensor available, such as in the powder area.
Concerning the chemical simulation of the receiver-solar concentrator coupling, the selected model was a time-dependent scenario to calculate the progress of the reaction inside the reactor. The comparison with the data collected during test #3 is shown in Figure 3. The most interesting aspect of the project is to find common patterns between the real and simulated data, as well as highlighting any differences. First, at the beginning of methane injection, there is a sudden increase in the relative amounts of all other gases. H2 oscillates between 40% and 45% in the real case, while in the simulation results it grows from a bit less than 40% up to 50%. As previously explained, the sudden decrease in H2 concentration in Figure 2 is explicated by the rupture of the pipe and has nothing to do with the chemistry of the untouched reactor. CO also shows an immediate peak between 10 and 15% (a bit delayed in the simulation) and then decreases towards very low fractions. CO2 follows a similar pattern as CO in both figures but starts from a much lower peak. The main difference is represented by the methane concentration. In fact, in the real experiment, the gas analyser was detecting a fraction of unreacted methane in the flue mixture, while this is not happening in the simulation. This might be due to the more idealistic nature of the chemical reaction in the software that might not be considering other forms of imperfections, such as cold spots and unreacted gas molecules. The presence of CO, H2 and CO2, although in very small quantities, is in line with Monazam et al. [24] as CLC and CLPO are happening at the same time.
Figure 4 plotted simulated and experimental gas concentrations. The order of magnitude is respected for most gas compounds, especially for products such as hydrogen and carbon monoxide. Figure 5 shows how the concentrations of solid reactants and reaction products change over time. The most obvious aspect is that the amount of haematite decreases. At the same time, FeO and Fe3O4 are produced, but in different quantities: wüstite is more abundant, while magnetite is produced less. Therefore, at this temperature level and with this amount of CH4 as a reducing gas, total carrier reduction prevails over partial reduction. Furthermore, an increase in carbon deposition, i.e., the surface concentration of solid carbon on the carrier, is plausibly observed [38]. Cheng et al., (2021) showed carbon deposition in the form of polycrystalline graphite on the hematite substrate [38]. This could happen because methane cracking (Equation (17)) is favoured in this temperature range. This could explain why, while hematite decreases and CO and CO2 are produced in smaller quantities, H2 does not follow the same behaviour [39,40]. Instead, H2 is maintained at a stable amount that does not decrease over the 30 min of the simulation. Comparable results can be found in Sajjadi et al. (2021), where a techno-economic study is presented, highlighting a similar H2 production behaviour [41]. H2 levels remain stable; this could be due to CH4 molecules being broken up due to the suitable temperature range and the catalytic action of the haematite.
The next generation of Concentrated Solar Power (CSP) plants is expected to operate at higher temperatures than those currently in use, for improved efficiency and reduced cost of power generation. Thermal fatigue and creep have been recognised as the main mechanisms leading to the failure of the receiver, the section most affected by heat flow.
Moreover, the receiver is exposed to the risk of extreme temperature changes that might cause a thermal shock. In fact, according to Ruys [42], the maximum thermal shock resistance of alumina is between 200 and 300 °C, depending on the test. Moreover, its low thermal conductivity (between 16 and 35 W/mK [42]), combined with its coefficient of thermal expansion (between 7.2 and 8.3 μm/mK, comparable to the value of steels [42]), can cause extremely strong and localized thermal stress that can fail the sample. Therefore, if alumina material is used, a different shape of the receiver should be adopted. The reactor must be heated up as homogeneously as possible on all its faces, to avoid localized hot spots.
One solution could be to use a secondary concentrator to catch the light collected by the first reflecting surface and redistribute it. Compound parabolic concentrators (CPCs) must be placed instead of the receiver but can direct the light in their central area (depending on the type) [43] to achieve a homogeneous heating of the sample.
The metals used in these tests (steel AISI 316 and Inconel Hastelloy) did not present the structural fragility of alumina but underwent melting and consequent loss of material in the area hit by the concentrated radiation. A more distributed heating up of the sample might allow it not to reach extremely high temperatures in small points, but to reach the suitable temperature for the reaction over a wider area.
Further research on the proposed list could result in a better understanding of the interaction between candidate structural materials and environmental conditions in the next generation of CSP plants [37]. The high temperatures in the receiver can also be a problem for the creation of iron oxide agglomerates [14,44]. Possible counter measures could involve moving the material in the receiver, intervening in the fluid dynamics of the system [45], or using protective coatings to increase the melting point [46,47].

4. Conclusions

To optimize the use of SC, not only the knowledge of solar geometry but also the observation of empirical aspects turned out to be extremely important. The experimental approach encountered other problems. The materials used for the reactor were not performing as well as foreseen. They experienced quick thermal degradation and loss of structural integrity. Alumina was cracking during every test, especially when the solar radiation reached summer levels. The cause of the failure was deemed to be the high-temperature gradient to which the receiver was exposed. Therefore, for the following tests, the reactor was changed to a metallic type. The metallic pipe, in Inconel Hastelloy, was not suffering from thermal gradients and was keeping its structural integrity longer. However, no material used in this series of experiments was able to sustain those conditions for longer than one cycle (only considering the reduction). As a result of the intensive work, the reduction reaction was finally carried out in the SC on the rooftop of the Energy Centre. This achievement demonstrated the feasibility of the reaction in real conditions. Moreover, the work allowed us to gain much deeper knowledge on the issues that might hamper the efficacy of the process and their effect.
The main takeaways can be summarized as follows:
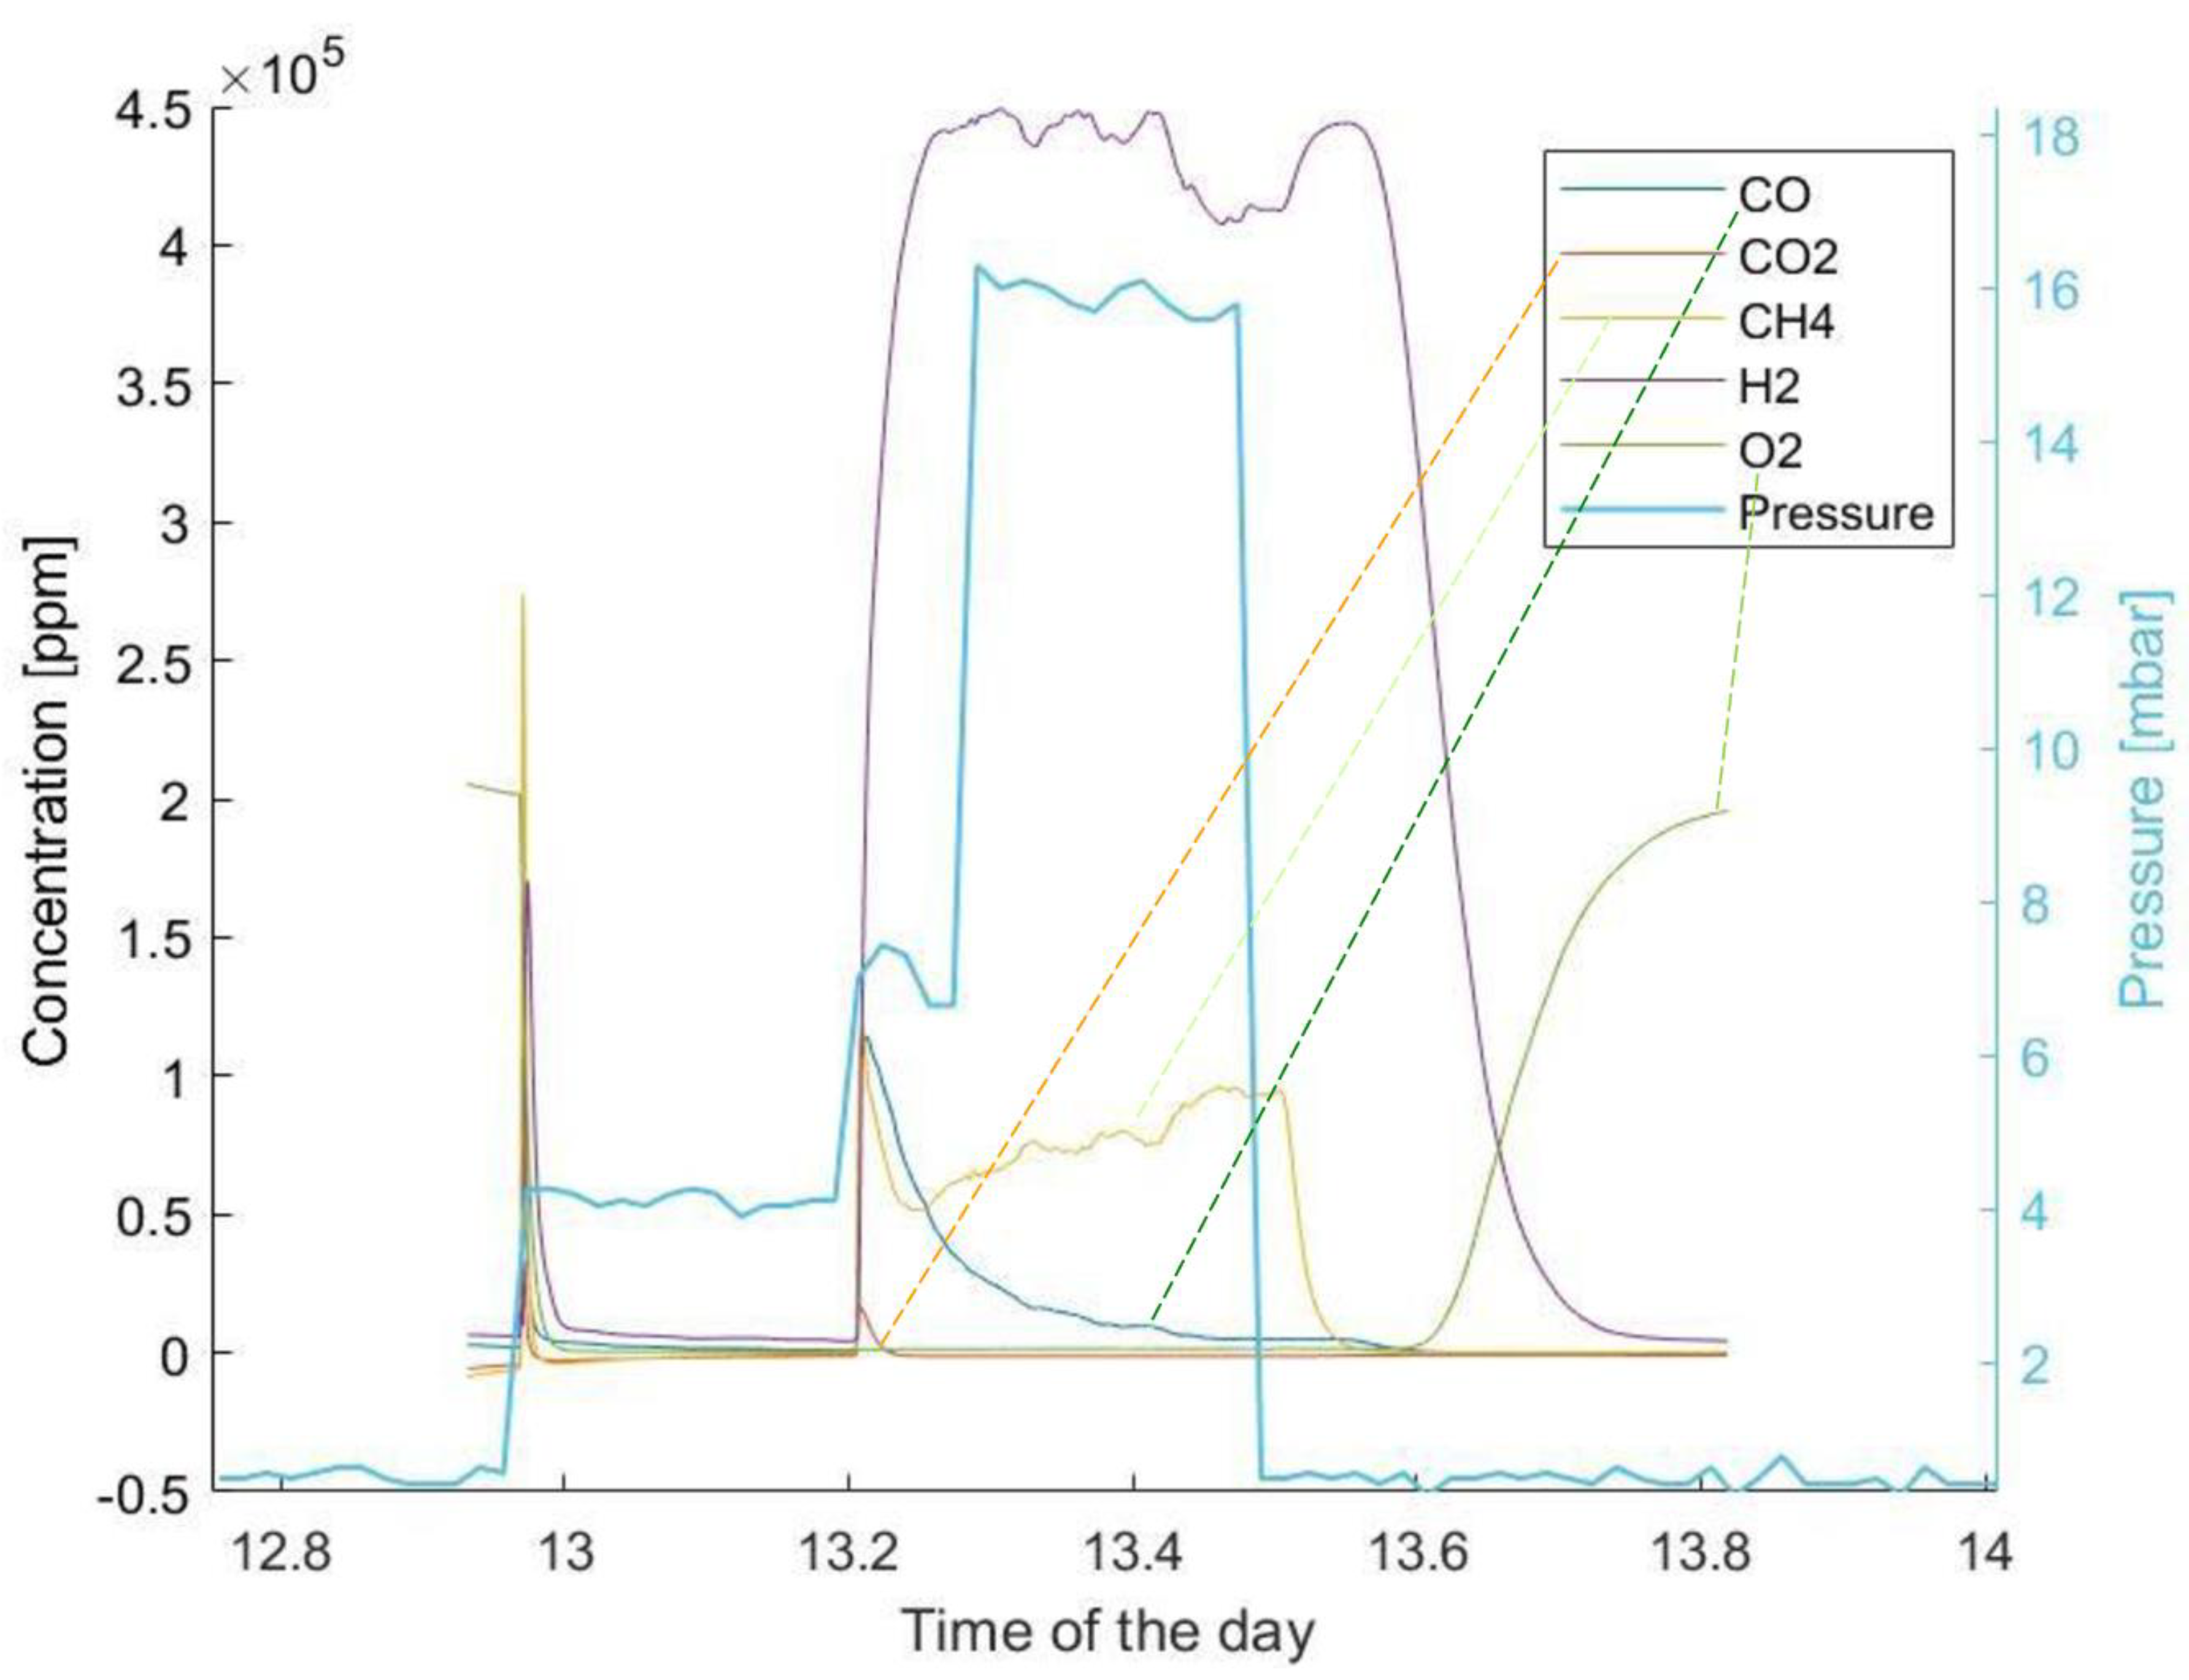
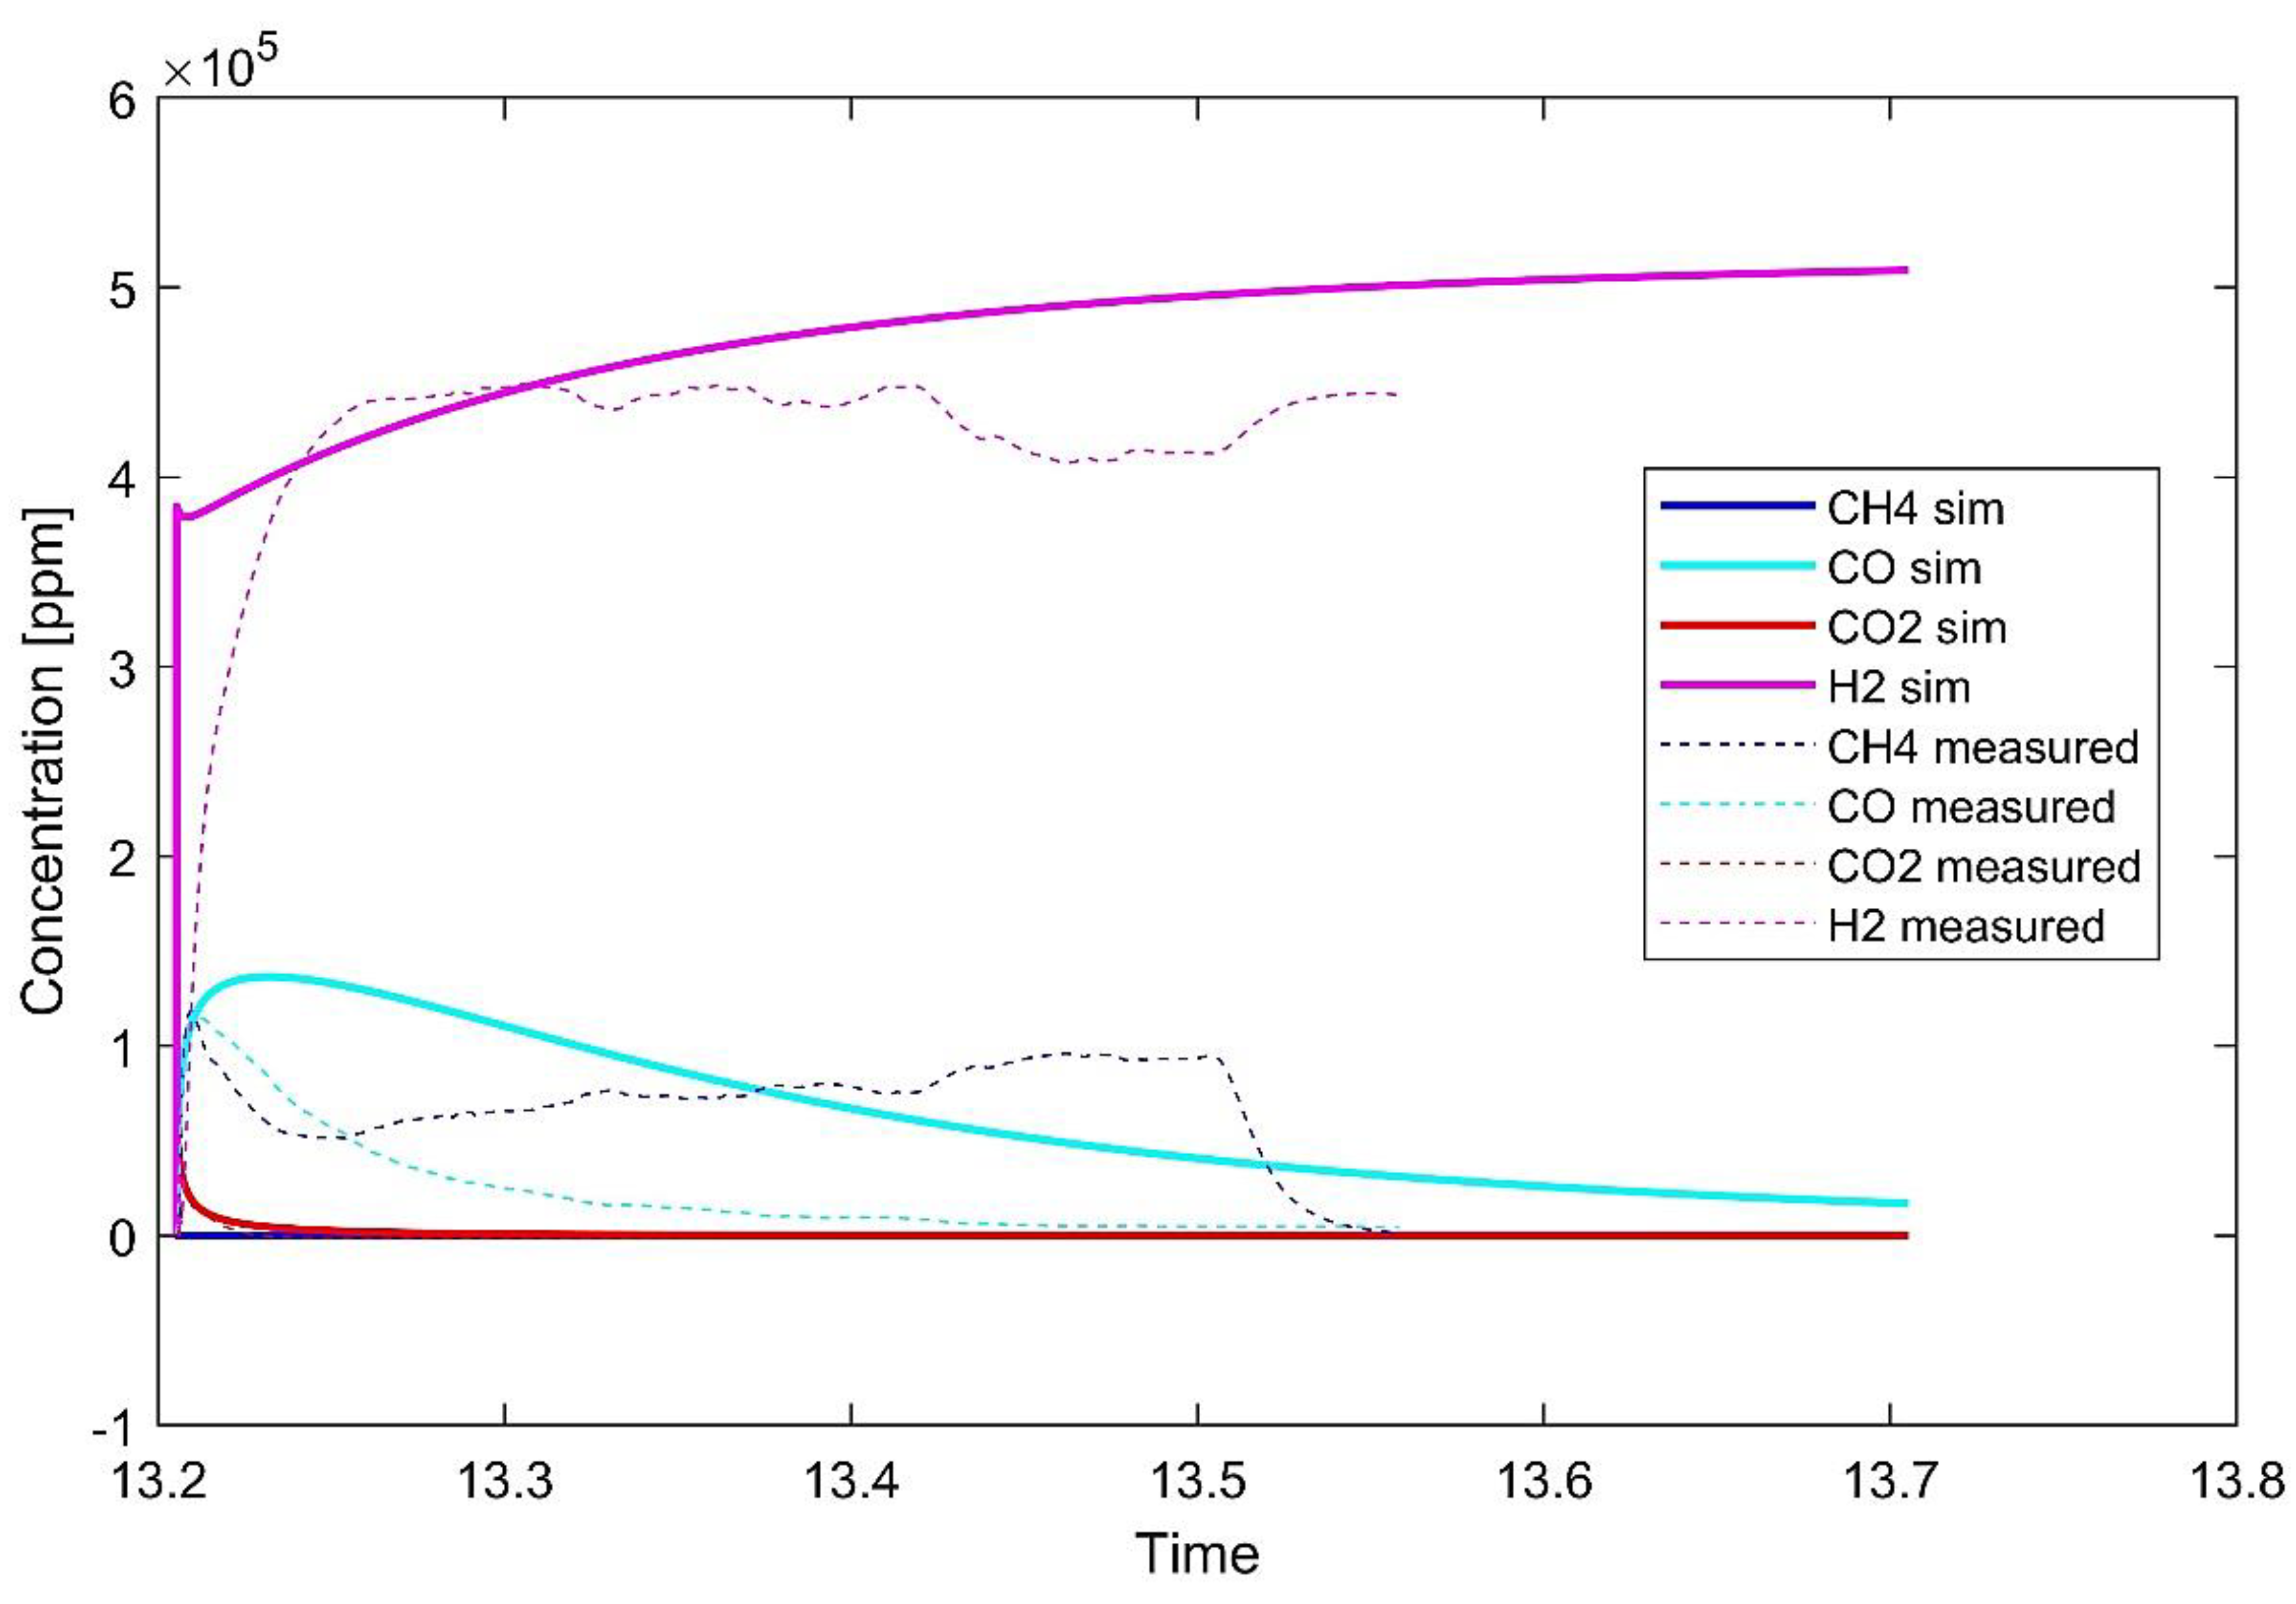
  • The production of hydrogen is already relevant in the reduction phase of chemical looping. It might be possible to lower the quantity of unreacted CH4 in real condition experiments by varying the fraction of the gas in the inlet feed or the relative quantity of powder.
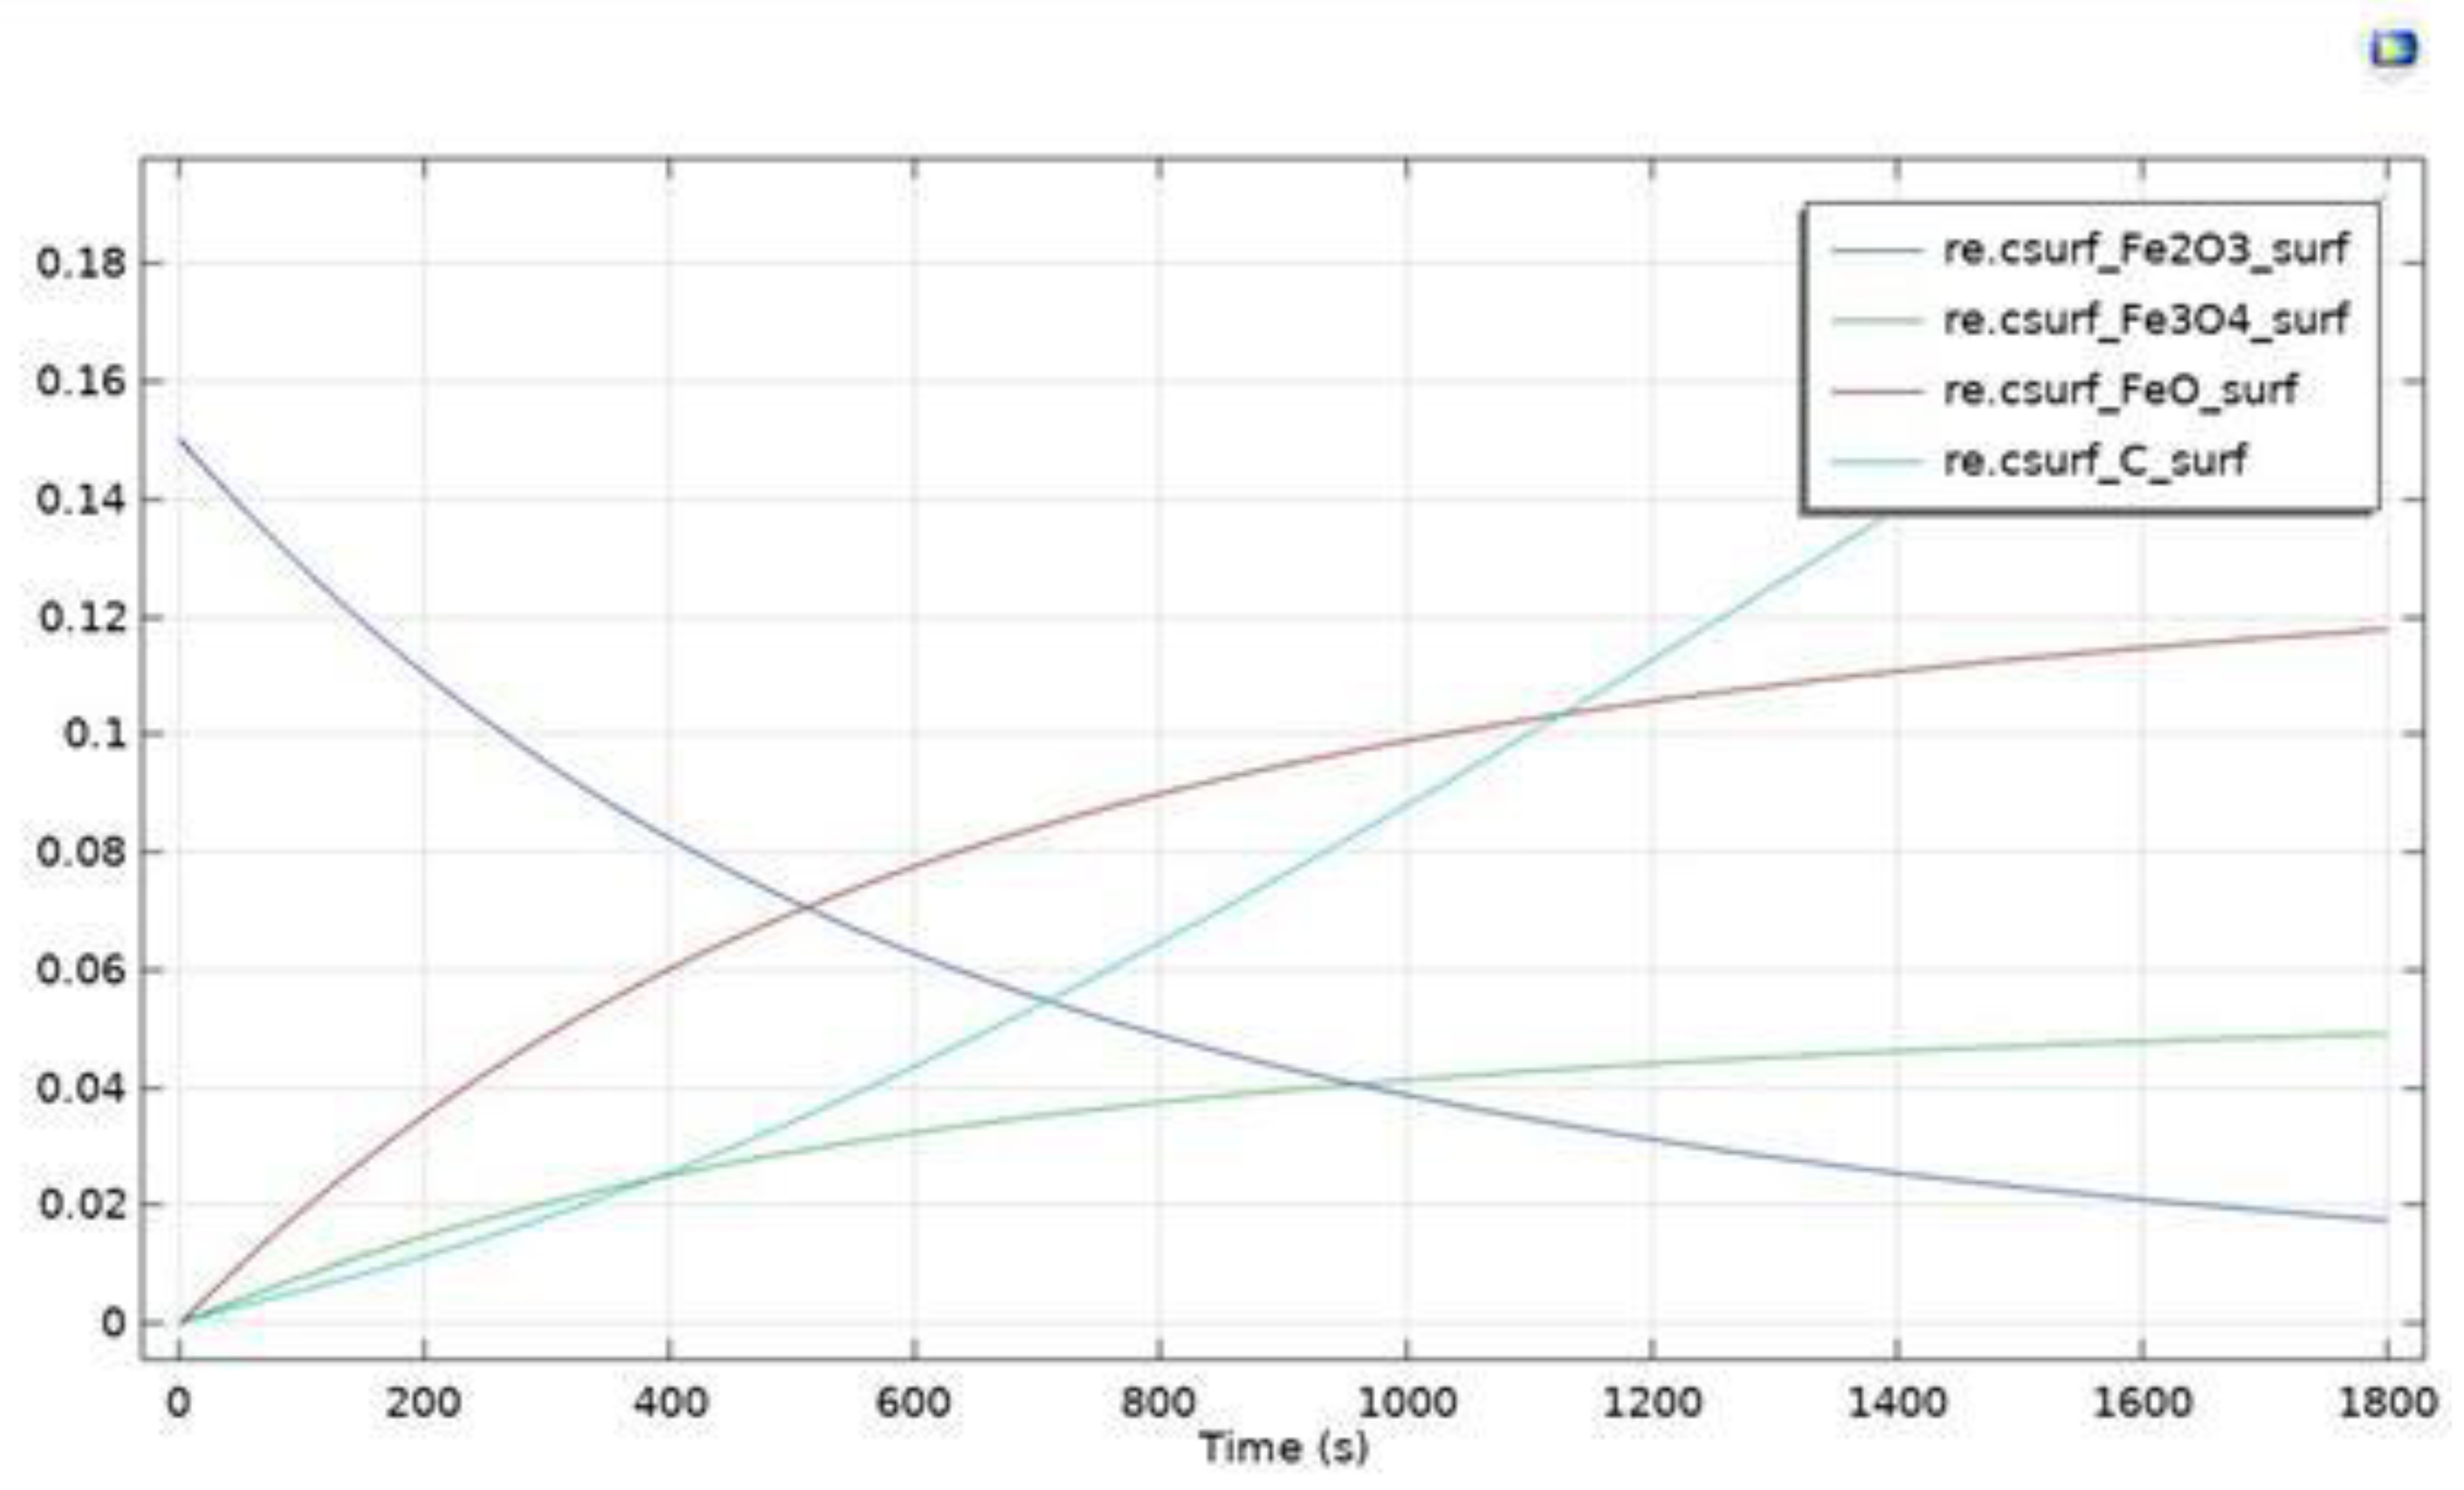
  • Flue gases from the experiments highlight that partial oxidation overcame total oxidation, especially as the reaction proceeded. This result is in accordance also with what was found by Monazam et al. [24]. The simulation highlighted the occurence of strong carbon deposition over the carrier. In fact, despite the quantities of the CO and CO2 produced decreasing with the proceeding of the reaction and subsequent exhaustion of hematite, H2 levels were not altered significantly. This might be happening as the molecules of CH4 are cracked due to the suitable temperature range and catalytic action of hematite.
  • The concentration of sunbeams on the external surface of a horizontal cylinder poses several threats to the efficacy of the receiver. As the radiation hits the pipe asymmetrically, the material is placed under stress that might hinder its structural properties.
  • A solution could be to use a secondary concentrator to catch the light collected by the first reflecting surface and redistribute it.
  • On the other hand, if a metallic material is used, an alloy able to operate at extremely high temperature must be selected.
  • The extreme variability of the weather can cause a sudden decrease in temperature, even on sunny days. This can not only cause the reaction to stop, but can also cause thermal shocks to the receiver. In the case of wind gusts, the receiver can be cooled down extremely quickly and experience a too-strong quench (if ceramic).
The current work leaves space for further exploration of the topic. Regarding the SC on the Energy Center rooftop, more studies on type of receiver should be made. These include both the choice of a more appropriate shape that can better stand thermal stresses, together with a material able to resist those extreme temperatures. The pipe reactor poses severe limitations on the applicability of the technology. The reactors broke down too quickly to allow us to study the complete reaction. Along with this, some sort of protection against adverse weather conditions would have to be implemented to avoid abrupt temperature changes. One possible way could be to store thermal energy to increase reactor inertia and even higher thermal peaks.
As far as the cycle is concerned, the paper dealt with the reduction phase. The oxidation phase has not yet been implemented in the solar plant and may be the subject of further exploration.

Author Contributions

Methodology, L.B., M.B. and D.P.; Formal analysis, L.B. and D.P.; Investigation, D.P.; Data curation, L.B. and D.P.; Supervision, D.F., M.S. and D.P. All authors have read and agreed to the published version of the manuscript.

Funding

This research receives no external funding.

Conflicts of Interest

The authors declare no conflict of interest.

Nomenclature

( ρ C p ) e f f effective volumetric heat capacity at constant pressure (kJ/m3/K)
AArea of the concentrator (m2)
CLChemical Looping
CLCChemical Looping Combustion
CLPOChemical Looping Partial Oxidation
CLRMChemical Looping Reforming of Methane
CoOptical Concentration ratio
CSPConcentrated Solar Power
CSTRContinuously stirred reactor
DcDiameter of the dish (mm)
dfDiameter of the focal point (mm)
fFocal distance (mm)
lLength of the receiver (mm)
OCOxygen Carrier
PPower of the concentrator (kW)
qHeat flux generated in the medium due to conduction
QIncoming solar power (kW)
QtedHeat generated for thermoelastic damping
QvdHeat generated for viscous dissipation
SCSolar Concentrator
uVelocity (m/s)
yRDepth (mm)
εPorosity
θVolume fraction of solid material in porous media
φRRim angle
ρ Density (kg/m3)

References

  1. 2030 Climate Target Plan. Available online: https://ec.europa.eu/clima/eu-action/european-green-deal/2030-climate-target-plan_en (accessed on 28 October 2021).
  2. Stocker, M.; Qin, T.F.; Plattner, D. IPCC (2013). Climate Change 2013: The Physical Science Basis. Contribution of Working Group I to the Fifth Assessment Report of the Intergovernmental Panel on Climate Change; Cambridge University: Cambridge, UK; New York, NY, USA, 2013; p. 28. [Google Scholar]
  3. Intergovernmental Panel on Climate Change Global Warming of 1.5 °C. 2018. Available online: http://www.ipcc.ch/report/sr15/ (accessed on 11 November 2021).
  4. Tzelepi, V.; Zeneli, M.; Kourkoumpas, D.-S.; Karampinis, E.; Gypakis, A.; Nikolopoulos, N.; Grammelis, P. Biomass Availability in Europe as an Alternative Fuel for Full Conversion of Lignite Power Plants: A Critical Review. Energies 2020, 13, 3390. [Google Scholar] [CrossRef]
  5. FAQ 1.3—AR4 WGI Chapter 1: Historical Overview of Climate Change Science. Available online: https://archive.ipcc.ch/publications_and_data/ar4/wg1/en/faq-1-3.html (accessed on 11 November 2021).
  6. Srivastava, R.K.; Shetti, N.P.; Reddy, K.R.; Kwon, E.E.; Nadagouda, M.N.; Aminabhavi, T.M. Biomass utilization and production of biofuels from carbon neutral materials. Environ. Pollut. 2021, 276, 116731. [Google Scholar] [CrossRef] [PubMed]
  7. Lin, H.; Luo, S.; Zhang, H.; Ye, J. Toward solar-driven carbon recycling. Joule 2022, 6, 294–314. [Google Scholar] [CrossRef]
  8. Lu, Y.; Zhu, L.; Agrafiotis, C.; Vieten, J.; Roeb, M.; Sattler, C. Solar fuels production: Two-step thermochemical cycles with cerium-based oxides. Prog. Energy Combust. Sci. 2019, 75, 100785. [Google Scholar] [CrossRef]
  9. Mustafa, A.; Lougou, B.G.; Shuai, Y.; Wang, Z.; Tan, H. Current technology development for CO2 utilization into solar fuels and chemicals: A review. J. Energy Chem. 2020, 49, 96–123. [Google Scholar] [CrossRef]
  10. Chuayboon, S.; Abanades, S.; Rodat, S. Syngas production via solar-driven chemical looping methane reforming from redox cycling of ceria porous foam in a volumetric solar reactor. Chem. Eng. J. 2019, 356, 756–770. [Google Scholar] [CrossRef]
  11. Liu, X.; Zhang, H.; Hong, H.; Jin, H. Experimental study on honeycomb reactor using methane via chemical looping cycle for solar syngas. Appl. Energy 2020, 268, 114995. [Google Scholar] [CrossRef]
  12. Cao, Y.; Alsharif, S.; Attia, E.-A.; Shamseldin, M.A.; Ibrahim, B.F. A conceptual process design towards CO2 emission reduction by integration of solar-based hydrogen production and injection into biomass-derived solid oxide fuel cell. Process Saf. Environ. Prot. 2022, 164, 164–176. [Google Scholar] [CrossRef]
  13. Pan, H.; Li, Y.; Zhu, L.; Lu, Y. Solar-driven H2O/CO2 conversion to fuels via two-step electro-thermochemical cycle in a solid oxide electrochemical cell. Energy Convers. Manag. 2022, 259, 115578. [Google Scholar] [CrossRef]
  14. Tang, M.; Xu, L.; Fan, M. Progress in oxygen carrier development of methane-based chemical-looping reforming: A review. Appl. Energy 2015, 151, 143–156. [Google Scholar] [CrossRef]
  15. Abad, A.; Adánez, J.; García-Labiano, F.; de Diego, L.F.; Gayán, P.; Celaya, J. Mapping of the range of operational conditions for Cu-, Fe-, and Ni-based oxygen carriers in chemical-looping combustion. Chem. Eng. Sci. 2007, 62, 533–549. [Google Scholar] [CrossRef] [Green Version]
  16. Ksepko, E.; Sciazko, M.; Babinski, P. Studies on the redox reaction kinetics of Fe2O3-CuO/Al2O3 and Fe2O3/TiO2 oxygen carriers. Appl. Energy 2014, 115, 374–383. [Google Scholar] [CrossRef]
  17. Nakamura, T. Hydrogen production from water utilizing solar heat at high temperatures. Sol. Energy 1977, 19, 467–475. [Google Scholar] [CrossRef]
  18. Tofighi, A.; Sibieude, F. Note on the condensation of the vapor phase above a melt of iron oxide in a solar parabolic concentrator. Int. J. Hydrog. Energy 1980, 5, 375–381. [Google Scholar] [CrossRef]
  19. Sibieude, F.; Ducarroir, M.; Tofighi, A.; Ambriz, J. High temperature experiments with a solar furnace: The decomposition of Fe3O4, Mn3O4, CdO. Int. J. Hydrog. Energy 1982, 7, 79–88. [Google Scholar] [CrossRef]
  20. Agrafiotis, C.; Roeb, M.; Sattler, C. A review on solar thermal syngas production via redox pair-based water/carbon dioxide splitting thermochemical cycles. Renew. Sustain. Energy Rev. 2015, 42, 254–285. [Google Scholar] [CrossRef]
  21. Scheffe, J.R.; Steinfeld, A. Oxygen exchange materials for solar thermochemical splitting of H2O and CO2: A review. Mater. Today 2014, 17, 341–348. [Google Scholar] [CrossRef]
  22. Charvin, P.; Abanades, S.; Flamant, G.; Lemort, F. Two-step water splitting thermochemical cycle based on iron oxide redox pair for solar hydrogen production. Energy 2007, 32, 1124–1133. [Google Scholar] [CrossRef]
  23. Najera, M.; Solunke, R.; Gardner, T.; Veser, G. Carbon capture and utilization via chemical looping dry reforming. Chem. Eng. Res. Des. 2011, 89, 1533–1543. [Google Scholar] [CrossRef]
  24. Monazam, E.R.; Breault, R.W.; Siriwardane, R.; Richards, G.; Carpenter, S. Kinetics of the reduction of hematite (Fe2O3) by methane (CH4) during chemical looping combustion: A global mechanism. Chem. Eng. J. 2013, 232, 478–487. [Google Scholar] [CrossRef]
  25. Lu, C.; Li, K.; Wang, H.; Zhu, X.; Wei, Y.; Zheng, M.; Zeng, C. Chemical looping reforming of methane using magnetite as oxygen carrier: Structure evolution and reduction kinetics. Appl. Energy 2018, 211, 1–14. [Google Scholar] [CrossRef]
  26. El. Ma, MANUALE USO E MANUTENZIONE Concentratore Solare a Disco Matr. 10434 2019. Available online: https://webthesis.biblio.polito.it/19993/1/tesi.pdf (accessed on 30 September 2022).
  27. Papurello, D.; Bertino, D.; Santarelli, M. CFD Performance Analysis of a Dish-Stirling System for Microgeneration. Processes 2021, 9, 1142. [Google Scholar] [CrossRef]
  28. DefinerTM 220 Series User Manual. Available online: https://manualzilla.com/doc/6878716/definer%E2%84%A2-220-series-user-manual (accessed on 30 October 2021).
  29. HeatTransferModuleUsersGuide.pdf. Available online: https://doc.comsol.com/5.4/doc/com.comsol.help.heat/HeatTransferModuleUsersGuide.pdf (accessed on 11 November 2021).
  30. IUPAC—Modified Arrhenius Equation (M03963). Available online: https://goldbook.iupac.org/terms/view/M03963(accessed on 9 November 2021).
  31. Laidler, K.J. A glossary of terms used in chemical kinetics, including reaction dynamics (IUPAC Recommendations 1996). Pure Appl. Chem. 1996, 68, 149–192. [Google Scholar] [CrossRef] [Green Version]
  32. Slycke, J.T.; Mittemeijer, E.J.; Somers, M.A.J. 1—Thermodynamics and kinetics of gas and gas–solid reactions. In Thermochemical Surface Engineering of Steels; Mittemeijer, E.J., Somers, M.A.J., Eds.; Woodhead Publishing: Oxford, UK, 2015; pp. 3–111. ISBN 978-0-85709-592-3. [Google Scholar]
  33. Basu, P. Chapter 7—Gasification Theory. In Biomass Gasification, Pyrolysis and Torrefaction, 3rd ed.; Basu, P., Ed.; Academic Press: Cambridge, MA, USA, 2018; pp. 211–262. ISBN 978-0-12-812992-0. [Google Scholar]
  34. Neri, M.; Chiavazzo, E.; Mongibello, L. Numerical simulation and validation of commercial hot water tanks integrated with phase change material-based storage units. J. Energy Storage 2020, 32, 101938. [Google Scholar] [CrossRef]
  35. Nečina, V.; Pabst, W. Influence of the heating rate on grain size of alumina ceramics prepared via spark plasma sintering (SPS). J. Eur. Ceram. Soc. 2020, 40, 3656–3662. [Google Scholar] [CrossRef]
  36. Ho, C.K. Advances in central receivers for concentrating solar applications. Sol. Energy 2017, 152, 38–56. [Google Scholar] [CrossRef]
  37. Sarvghad, M.; Delkasar Maher, S.; Collard, D.; Tassan, M.; Will, G.; Steinberg, T.A. Materials compatibility for the next generation of Concentrated Solar Power plants. Energy Storage Mater. 2018, 14, 179–198. [Google Scholar] [CrossRef]
  38. Cheng, X.; Gu, Z.; Li, F.; Zhu, X.; Wei, Y.; Zheng, M.; Tian, D.; Wang, H.; Li, K. Enhanced resistance to carbon deposition in chemical-looping combustion of methane: Synergistic effect of different oxygen carriers via sequence filling. Chem. Eng. J. 2021, 421, 129776. [Google Scholar] [CrossRef]
  39. Keller, M.; Matsumura, A.; Sharma, A. Spray-dried Fe/Al2O3 as a carbon carrier for COx-free hydrogen production via methane cracking in a fluidized bed process. Chem. Eng. J. 2020, 398, 125612. [Google Scholar] [CrossRef]
  40. Keller, M.; Matsuzaki, Y.; Otomo, J. CO2 activation by methane in a dual-bed configuration via methane cracking and iron oxide lattice oxygen transport—Concept and materials development. Chem. Eng. J. 2018, 349, 249–259. [Google Scholar] [CrossRef]
  41. Sajjadi, B.; Chen, W.-Y.; Fan, M.; Rony, A.; Saxe, J.; Leszczynski, J.; Righetti, T.K. A techno-economic analysis of solar catalytic chemical looping biomass refinery for sustainable production of high purity hydrogen. Energy Convers. Manag. 2021, 243, 114341. [Google Scholar] [CrossRef]
  42. Bhattacharya, S.P.; Harttig, M. Control of agglomeration and defluidization burning high-alkali, high-sulfur lignites in a small fluidized bed combustor - Effect of additive size and type, and the role of calcium. Energy Fuels 2003, 17, 1014–1021. [Google Scholar] [CrossRef]
  43. Adanez, J.; Abad, A.; Garcia-Labiano, F.; Gayan, P.; de Diego, L.F. Progress in Chemical-Looping Combustion and Reforming technologies. Prog. Energy Combust. Sci. 2012, 38, 215–282. [Google Scholar] [CrossRef] [Green Version]
  44. Ruys, A. Processing, structure, and properties of alumina ceramics. In Alumina Ceramics; Ruys, A., Ed.; Woodhead Publishing Series in Biomaterials; Woodhead Publishing: Cambridge, UK, 2019; pp. 71–121. ISBN 978-0-08-102442-3. [Google Scholar]
  45. Kalogirou, S.A. Chapter 3—Solar Energy Collectors. In Solar Energy Engineering, 2nd ed.; Kalogirou, S.A., Ed.; Academic Press: Boston, MA, USA, 2014; pp. 125–220. ISBN 978-0-12-397270-5. [Google Scholar]
  46. Miao, Z.; Jiang, E.; Hu, Z. Review of agglomeration in biomass chemical looping technology. Fuel 2022, 309, 122199. [Google Scholar] [CrossRef]
  47. Ma, J.; Zhao, H.; Tian, X.; Wei, Y.; Rajendran, S.; Zhang, Y.; Bhattacharya, S.; Zheng, C. Chemical looping combustion of coal in a 5kWth interconnected fluidized bed reactor using hematite as oxygen carrier. Appl. Energy 2015, 157, 304–313. [Google Scholar] [CrossRef]
Figure 1. (a) Porous domain. (b) Fluid domain. (c) Solid domain. (d) Area exposed to the heat solar flux.
Catalysts 12 01477 g001
Figure 2. Internal and external temperature, direct radiation on the normal plane and pressure recorded during test #3.
Catalysts 12 01477 g002
Figure 3. ppm(v) concentration of the gaseous mixture outflowing the reactor during test #3.
Catalysts 12 01477 g003
Figure 4. Comparison of experimental results (test #3) and simulation.
Catalysts 12 01477 g004
Figure 5. Surface concentrations in mol/m2 of the solid components in the reactor.
Catalysts 12 01477 g005
Table 1. Features of the solar dish concentrator.
SymbolDescriptionValueU.m.
DcDiameter of the dish2370mm
fFocal distance958mm
yRDepth370mm
φ R Rim angle61.89°
CoOptical Concentration ratio8013-
dfDiameter of the focal point6.41mm
lLength of the receiver200mm
AArea of the concentrator4.5 m 2
PPower of the concentrator2.8kW
Table 2. Type of material used for the reactor, internal and external diameters of the pipes and gas speed.
TestReactor MaterialDI (cm)Do (cm)Gas Speed (m/s)
#1Alumina1.4021.8060.045
#2Alumina1.4021.8060.045
#3Steel AISI 3161.5372.1200.037
#4Steel AISI 3160.7711.260.15
#5Inconel Hastelloy c-2760.9001.3850.11
Publisher’s Note: MDPI stays neutral with regard to jurisdictional claims in published maps and institutional affiliations.

