Article

CdS Nanoparticles Decorated 1D CeO2 Nanorods for Enhanced Photocatalytic Desulfurization Performance

1
School of Material Science and Engineering, Yancheng Institute of Technology, Yancheng 224051, China
2
School of Material Science and Engineering, Suzhou University of Science and Technology, Suzhou 215009, China
*
Author to whom correspondence should be addressed.
Catalysts 2022, 12(11), 1478; https://doi.org/10.3390/catal12111478
Submission received: 16 October 2022 / Revised: 16 November 2022 / Accepted: 17 November 2022 / Published: 19 November 2022
(This article belongs to the Special Issue Synthesis and Application of Composite Photocatalysts)

Abstract

:
CdS nanoparticles were constructed onto one-dimensional (1D) CeO2 nanorods by a two-step hydrothermal method. The X-ray diffraction (XRD), transmission election microscopy (TEM), Raman spectra, X-ray photoelectron spectra (XPS) and UV-Vis diffuse reflection spectroscopy (DRS) techniques were used to characterize these CdS/CeO2 nanocomposites. It was concluded that when the molar ratio of CdS and CeO2 was 1:1, the nanocomposites exhibited the best photocatalytic desulfurization activity, reaching 92% in 3 h. Meanwhile, transient photocurrent (PT) measurement, photoluminescence (PL) spectra and electrochemical impedance spectroscopy (EIS) measurement indicated that the modification of CeO2 nanorods by CdS nanoparticles could significantly inhibit the recombination of photogenerated electrons and holes. In addition, the possible mechanism of photocatalytic oxidation desulfurization of the nanocomposites was proposed. This study may provide an effective CeO2-based photocatalyst for photocatalytic desulfurization applications.

1. Introduction

Sulfur oxides (SOx) emitted from vehicle fuel combustion have been shown to cause acid rain and haze, which has become a serious environmental pollution problem. Therefore, it is urgent to remove sulfur-containing organic compounds from fuel to reduce sulfur content [1,2]. Subsequently, a series of desulfurization technologies have been developed, such as hydrodesulfurization [3], oxidative desulfurization [4], adsorptive desulfurization [5] and biodesulfurization [6]. Among them, hydrodesulfurization is the predominant technology currently used in industry, which requires hydrogen consumption to achieve a high pressure and high temperature. In addition, it is difficult to remove dibenzothiophene (DBT) and its derivatives from fuel. Alternatively, photocatalytic desulfurization is a new desulfurization technology using a semiconductor photocatalyst for catalytic oxidation desulfurization, which has the advantages of mild reaction conditions, low energy consumption and environmental friendliness. In the process of photocatalytic desulfurization, DBT and its derivatives can be oxidized to corresponding sulfones, which have polarity and can be easily removed by solvent extraction [7,8]. In recent years, a series of photocatalytic desulfurization catalysts have been developed, such as a TiO2-based photocatalyst [9,10], bismuth series material [11,12], g-C3N4 framework material [13,14], metal organic framework material [15], etc.
CeO2 is an important rare earth oxide semiconductor material, which is commonly used as a photocatalyst for pollutant degradation and energy conversion. However, CeO2 is a wide band gap semiconductor, which usually responds in the ultraviolet region, and ultraviolet light only accounts for 5% of the sunlight, which greatly hinders its application [16,17,18]. Therefore, the heterojunction of CeO2 and another narrow band gap semiconductor is expected to improve the photocatalytic performance. Moreover, one-dimensional (1D) nanomaterials have attracted much attention in recent years due to their high length-to-diameter ratio, which facilitates the rapid charge transfer along the axial direction [19,20].
CdS is a narrow band gap semiconductor, which can effectively use visible light and is a promising material. Nevertheless, the rapid recombination of photogenerated carriers and severe photocorrosion hinder the further application of CdS [21,22]. Thus, the effective combination of CdS and CeO2 to form a heterojunction is expected to overcome these disadvantages.
Herein, in this work, we used CdS nanoparticles to decorate 1D CeO2 nanorods to prepare a well-defined interfacial heterojunction composite. Then the photocatalytic performance of the prepared photocatalysts was investigated by the photocatalytic degradation of dibenzothiophene (DBT) under visible irradiation. Finally, the enhancement mechanism of photocatalytic desulfurization was studied.

2. Results

2.1. Preparation of Samples

2.1.1. Synthesis of CeO2 Nanorods

A total of 0.02 mol Ce (NO3)3· 6H2O was dissolved in 5 mL deionized water, and then 35 mL 10 M NaOH solution was added. After being fully stirred, the mixture was transferred to a 50 mL Teflon hydrothermal reactor and heated to 110 °C for 10 h; the obtained products were centrifugally washed and dried, and then calcined at 400 °C for 2 h to obtain CeO2 nanorods.

2.1.2. Synthesis of CdS/CeO2 Composite

A certain amount of prepared CeO2 nanorod powders were ultrasonically dispersed in 20 mL of deionized water, and then 20 mL of 0.1 M CdCl2·2.5H2O solution was added. After full stirring, 20 mL of 0.1 M Na2S solution was slowly added, and then the mixture was transferred to a Teflon hydrothermal reactor and heated to 160 °C for 24 h; then the suspension was filtered, washed and dried to finally obtain the CdS/CeO2 composite. The molar ratios of CdS to CeO2 in the prepared samples were 1:2, 1:1 and 2:1, respectively.

2.2. Characterization

X-ray diffraction (XRD) measurement was performed on an X-ray diffractometer with Cu Ka radiation (Rigaku, D/max-RB, λ = 0.15406 nm); Raman spectra were measured by a Thermo Fisher Scientific DXR Raman spectrophotometer and the excitation laser wave length was 532 nm. The morphology was observed by a JEOL JEM-2100 transmission election microscope (TEM) equipped with Gatan 832 CCD operating at a voltage of 200 kV; X-ray photoelectron spectroscopy (XPS) analysis was carried out using a Thermo Fisher Scientific ESCALAB 250 spectrometer with the mono Al Kαradiation (1486.6 eV). Photoluminescence (PL) spectra were collected on a PerkinElmer LS45 fluorescence spectrometer with an excitation wavelength of 400 nm; ultraviolet–visible diffuse reflectance spectra (UV-Vis DRS) were measured by a Shimadzu UV-2450 spectrophotometer equipped with an integrating sphere.

2.3. Photoelectrochemical Measurements

The photoelectrochemical tests were carried out on an LK5600 photoelectrochemical workstation. For the photocurrent measurement, the prepared sample was deposited on the surface of FTO glass as the working electrode, the Ag/AgCl electrode as the reference electrode, the Pt plate as the counter electrode and the 0.1 M Na2SO4 solution as the supporting electrolyte, and the 300 W xenon lamp as the light source. For electrochemical impedance spectroscopy (EIS) measurements, the three electrodes system was also used. The electrolyte solution was 0.5 M KCl solution containing 0.01 M K3Fe(CN)6/K4Fe(CN)6 (molar ratio 1:1), performed at bias voltages 0.5 V, in the frequency range of 0.1 Hz–100 kHz with oscillation potential amplitudes of 0.01 V at room temperature.

2.4. Photocatalytic Desulfurization Measurement

A total of 0.08 g DBT was dissolved in 200 mL n-octane as model oil; subsequently, a 0.1 g photocatalyst was added under constant stirring, and then appropriate H2O2 was added (moral ratio of O/S = 4:1). After dark adsorption for 30 min, the photocatalytic desulfurization process was carried out in a photochemical reaction instrument with a xenon lamp (300 W, with ultraviolet cut-off filter (λ > 420 nm)). The dispersion was collected every 30 min and extracted with acetonitrile, and the sulfur content was determined on a UV fluorescent sulfur analyzer. The desulfurization rate D (%) was obtained according to the following formula: D = (1 − Ct/C0) × 100%, where C0 is the initial sulfur content and Ct is the sulfur content of the solution at reaction time t.

3. Discussion

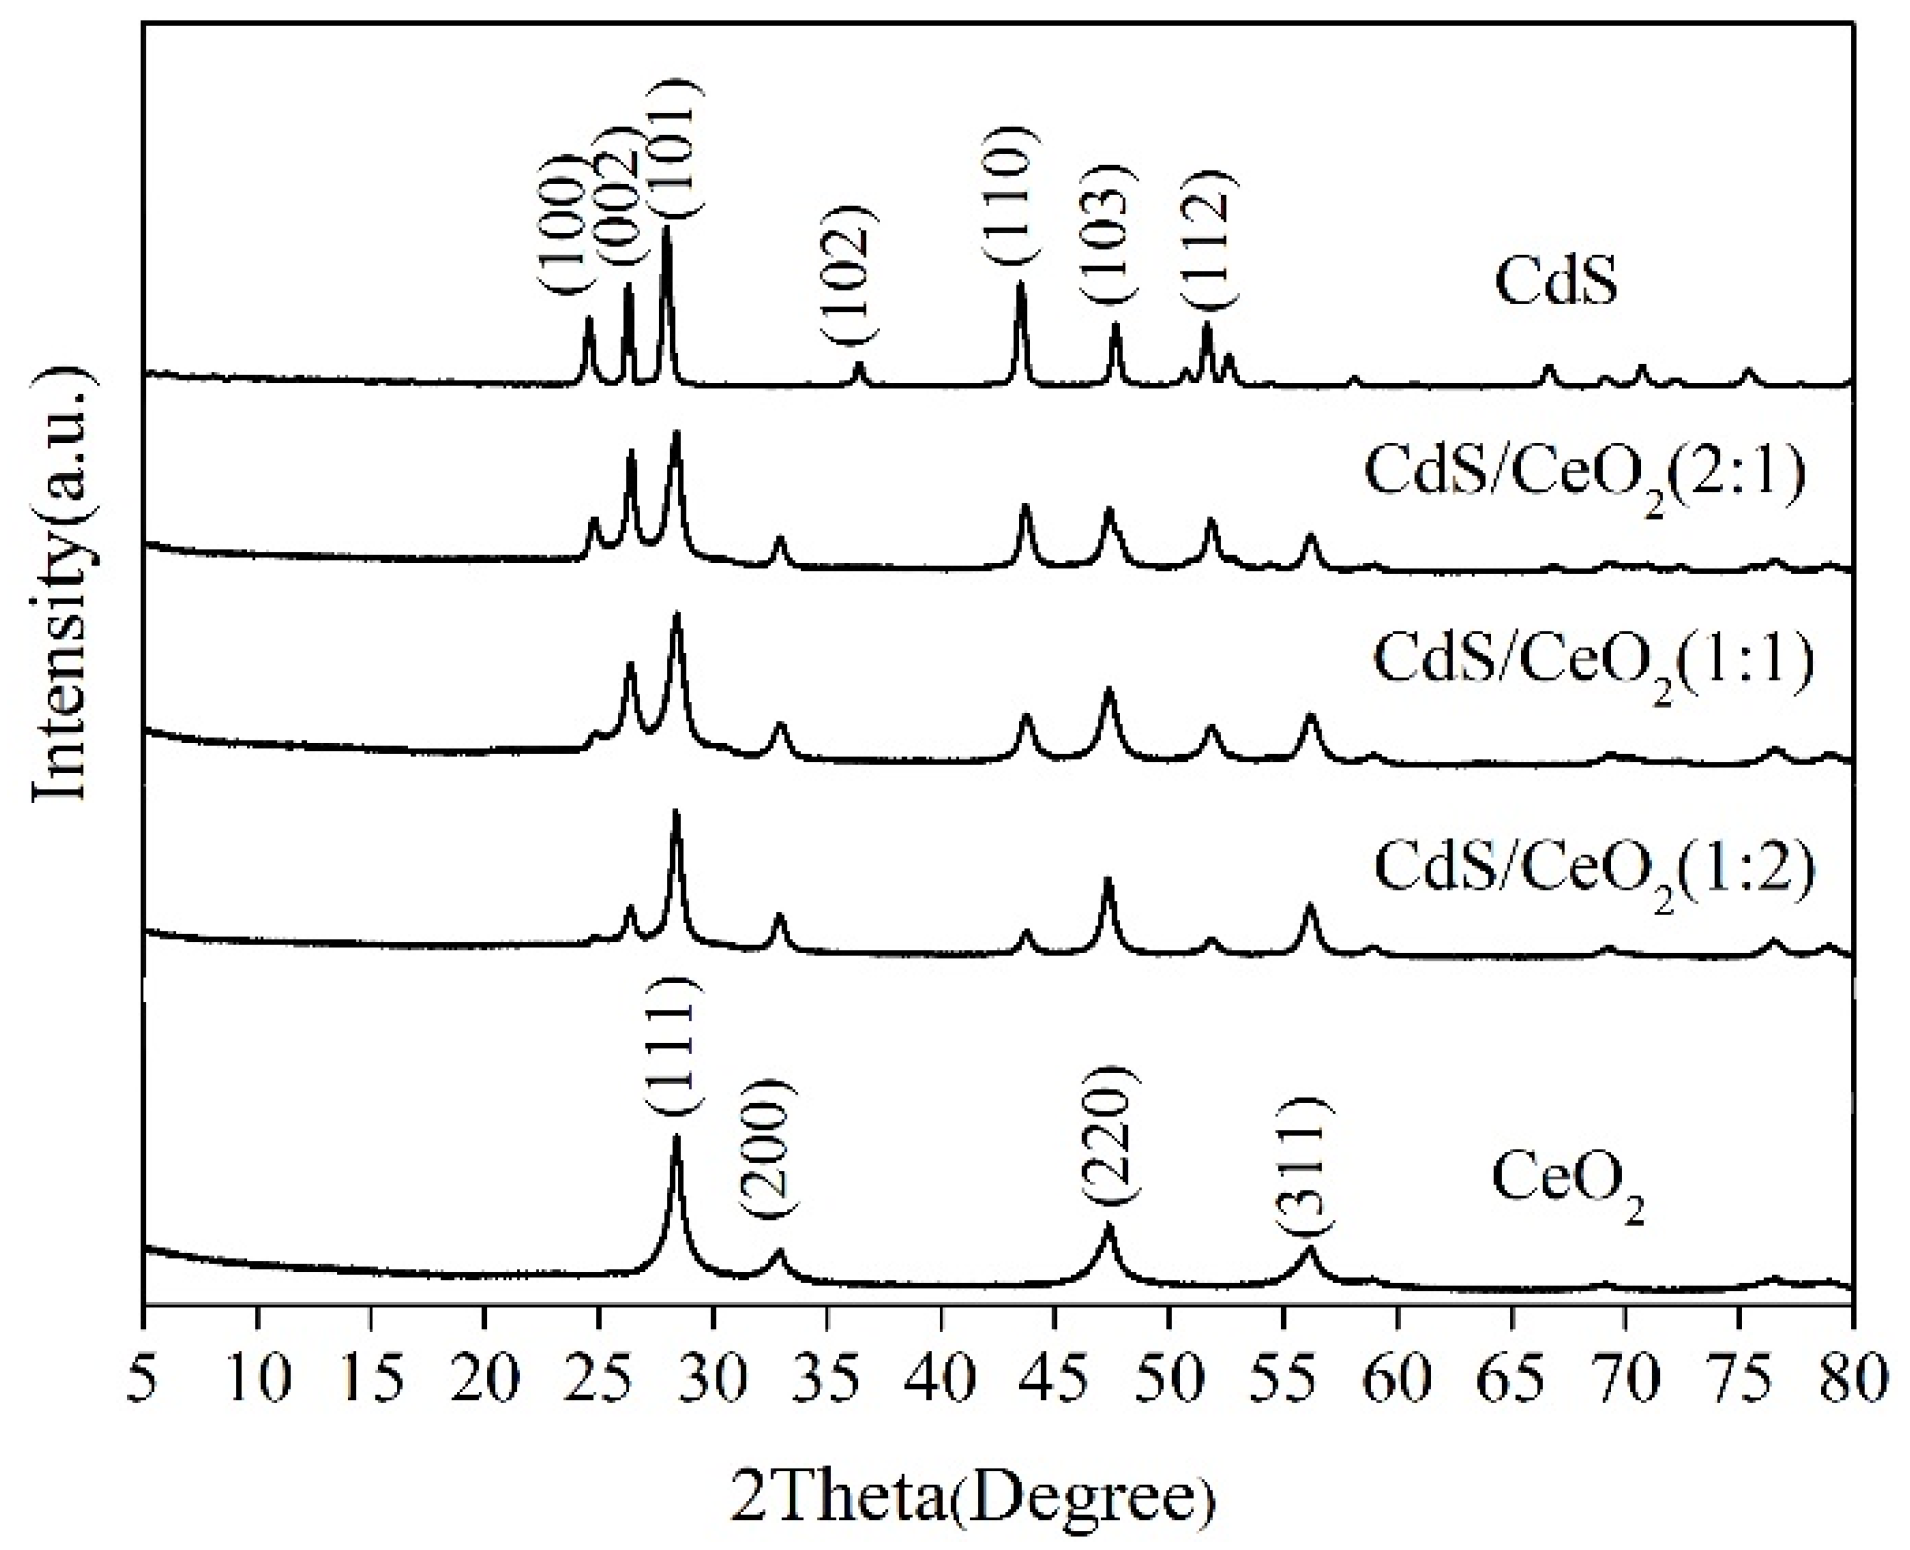
3.1. XRD Patterns Analysis

The structures of the samples are confirmed by XRD analysis in Figure 1. The characteristic diffraction peaks at 28.6°, 33.1°, 47.4° and 56.2° correspond to the (111), (200), (220) and (311) different crystal planes of cubic fluorite CeO2, respectively (JCPDS 34-0394), And the diffraction peaks at 24.6°, 26.4°, 28.0°, 36.5°, 43.6°, 47.7° and 51.7° are indexed to the (100), (002), (101), (102), (110),(103) and (112) crystal planes of the hexagonal structure CdS, respectively (JCPDS:41–1049). In addition, when CdS nanoparticles are deposited on CeO2 nanorods, the characteristic peaks of both cubic fluorite CeO2 and hexagonal CdS are observed in the composites. It is worth noting that by increasing the molar ratio of CdS to CeO2, the intensity of the characteristic peaks of CdS are enhanced in the composites. The results demonstrate that the CdS is successfully loaded on the surface of CeO2.

3.2. Raman Spectroscopy Analysis

Raman spectroscopy with an excitation wavelength of 532 nm was used to measure the structure and electronic properties of the materials. As shown in Figure 2, for pure CeO2, the peak at 465 cm−1 can be attributed to the F2g Raman active interior phonon mode of the fluorite cubic structure [23]. As for pure CdS, the two dominant peaks at 300 cm−1 and 600 cm−1 are attributed to the first-order longitudinal optical (1LO) and the second-order longitudinal optical (2LO) phonon modes of CdS, respectively [24]. Moreover, it can be observed that all the composites have peaks corresponding to both CeO2 and CdS with varying intensities. The Raman peak intensity of the CdS/CeO2 composites is lower than that of pure CeO2 or pure CdS. This may be attributed to the scattering loss caused by defects in the heterojunction [25,26]. With the increase in CeO2 content, the characteristic peak intensity of CeO2 in the CdS/CeO2 composite gradually increases. Therefore, the Raman measurement results further demonstrate the existence of CdS and CeO2 in the composite.

3.3. Morphological Analysis

Figure 3 shows TEM and HRTEM images of CeO2 nanorods and the CdS/CeO2(1:1) composite. It can be seen from Figure 3a that the prepared CeO2 presents a rod-like structure, with a diameter of 20–30 nm and a length of 50–100 nm. Moreover, the corresponding HRTEM image (Figure 3b) shows that the crystal plane spacing d = 0.31 nm corresponds to the (111) crystal plane of cubic fluorite CeO2. As shown in Figure 3c, CdS nanoparticles are deposited on the surface of CeO2 nanorods, and the structure of the CeO2 nanorods is not destroyed in the composite. It can be seen from Figure 3d that the two different crystal plane spacings are d = 0.315 nm and d = 0.31 nm, which, respectively, correspond to the (101) crystal plane of hexagonal CdS and the (111) crystal plane of cubic fluorite CeO2. The well-defined heterojunction structure may facilitate the separation of photogenerated electrons and holes, improving the photocatalytic efficiency.

3.4. XPS Spectra Analysis

The surface chemical states of the prepared samples are studied by XPS spectroscopy. The high-resolution XPS spectra of Ce 3d, O 1s, Cd 3d and S 2p are shown in Figure 4a–d, respectively. In Figure 4a, the characteristic peaks of Ce 3d are divided into eight fitting peaks, with the six peaks labeled as v, v2, v3, u, u2 and u3 representing Ce4+, and the other two peaks labeled as v1 and u1 corresponding to Ce3+, which indicates the presence of mixed Ce4+ and Ce3+ states in the samples [27]. According to the charge neutrality condition, the appearance of Ce3+ is an indicator of oxygen vacancies in CeO2.The binding energy peaks labeled at 529.6 eV, 530.6 eV and 531.7 eV correspond to lattice oxygen (OL), oxygen vacancies (VO) and chemisorbed oxygen (OA) in CeO2 nanorods, respectively (Figure 4b). Therefore, it indicates that there is a certain amount of VO in CeO2. When CdS is loaded, all Ce 3d and OL peaks shift slightly, indicating that there is charge transfer between CeO2 and CdS [28,29]. As can be seen in Figure 4c, the peaks at 404.7 eV and 411.6 eV correspond to the Cd 3d5/2 and Cd 3d3/2 of Cd (II) states in the CdS sample. As shown in Figure 4d, the XPS spectrum of S 2p exhibits two peaks at 161.5 and 162.6 eV, which are attributed to S 2p3/2 and S 2p1/2, respectively [30,31]. It is worth noting that the peaks of Ce 3d, O 1s, Cd 3d and S 2p are shifted slightly in CdS/CeO2(1:1) compared with pure CeO2 nanorods and CdS, indicating that a heterojunction is formed between CdS nanoparticles and CeO2 nanorods, which is conducive to the effective separation of photogenerated electrons and holes.

3.5. UV-Vis DRS Analysis

Figure 5 shows the ultraviolet–visible diffuse reflectance spectra (UV-Vis DRS) of CeO2, CdS and the CdS/CeO2 composites. As shown in Figure 5a, the absorption band edge of CeO2 is about 400 nm, and that of CdS is about 550 nm. For the CdS/CeO2 composites, the absorption edge is red shifted with the increase in the molar ratio of CdS. According to the Tauc plot of (αhυ)2 vs. (hυ), the band gap energy (Eg) values of CeO2, CdS/CeO2 (1:2), CdS/CeO2 (1:1), CdS/CeO2 (2:1) and CdS are estimated to be 3.1 eV, 2.45 eV, 2.4 eV, 2.36 eV and 2.3 eV (Figure 5b), respectively [32,33]. Therefore, CeO2 nanorods can only absorb UV light, and the increase in the CdS nanoparticles would result in the increase in light adsorption in the visible region.

3.6. Performance of Photocatalytic Desulfurization

Figure 6a shows the photocatalytic removal of dibenzothiophene (DBT) from model oil with different photocatalysts. Under dark conditions, all photocatalysts have low desulfurization capacity for DBT. When only H2O2 exits without any catalyst, the desulfurization percentage is only about 7.5%, indicating that H2O2 has a certain oxidation capacity but the efficiency is relatively low. The photocatalytic desulfurization activities of different samples are as follows: CdS/CeO2 (1:1) > CdS/CeO2 (2:1) > CdS > CdS/CeO2 (1:2) > CeO2, indicating that the heterojunction formed by CdS and CeO2 can significantly improve the photocatalytic desulfurization activity. When the molar ratio of CeO2 and CdS is 1:1, the highest desulfurization efficiency can reach 92% in 3 h. Meanwhile, the corresponding photocatalytic desulfurization kinetic curves over the prepared photocatalysts are shown in Figure 6c.The reaction data are fitted by a first-order model as depicted by the formula [34]: ln(C0/C) = kt + b, where k is the pseudo-first-order rate constant, and the relationship between ln(C0/C) and catalytic reaction time t is considered to be linear. The corresponding desulfurization rate constants (k) are estimated to be 0.08109 h−1, 0.27446 h−1, 0.22957 h−1, 0.57659 h−1 and 0.39763 h−1 for the CeO2, CdS, CdS/CeO2 (1:2), CdS/CeO2 (1:1) and CdS/CeO2 (2:1). It is clear that the photocatalyst CdS/CeO2 (1:1) displays the best photocatalytic activity among these prepared photocatalysts. The reusability of the CdS/CeO2 (1:1) composite is also investigated. As shown in Figure 6c, after repeated use for three times, the desulfurization percentage is about 75%, indicating that the prepared composite has relatively good stability. The desulfurization percentage decreases during the cycle may be attributed to the easy filling of the oxygen vacancy in the photocatalytic process [35].

3.7. Photoelectrochemical and PL Analysis

The photocurrent measurement (PM), electrochemical impedance spectroscopy (EIS) and photoluminescence spectroscopy (PL) are used to analyze photogenerated electrons and holes separation efficiency. As shown in Figure 7a, when the light is turned on, all samples generate photocurrent, indicating that all the samples have light response. It is worth noting that the photocurrent of the CdS/CeO2 composite sample is significantly higher than that of the pure CeO2 and CdS, indicating a higher charge separation efficiency [34,36]. The EIS Nyquist plots are displayed in Figure 7b; the arc radius of the CdS/CeO2 composite sample is obviously smaller than those of the CeO2 and CdS samples, indicating that the charge transfer resistance of the CdS/CeO2 composite is lower [37,38]. The PL spectra of CeO2, CdS and CdS/CeO2 (1:1) are shown in Figure 7c; the CdS/CeO2 composite exhibits weaker PL intensity than that of pure CeO2 and CdS, which indicates that the combination of CeO2 and CdS can effectively inhibit the recombination of electrons and holes [39,40]. Therefore, the well-defined heterojunction structure is conducive to the transportation and separation of photogenerated electrons–holes, and enhances the photocatalytic activity.

3.8. Photocatalytic Mechanism

In order to analyze the mechanism of photocatalytic desulfurization, it is necessary to determine the conduction band (CB) and valence band (VB) positions of the semiconductors. The value of the valence band (VB) and conduction band (CB) of the semiconductor can be obtained according to the following formula [37,41]: ECB = χ − E0 − 0.5Eg, where χ is the electronegativity of a semiconductor, the geometric mean of the electronegativity of the constituent atoms, E0 is the energy of free electrons on the hydrogen scale (4.5 eV) and Eg is the band gap of the semiconductor. DRS shows that the band gaps (Eg) of CeO2 and CdS are 3.1 and 2.3 eV, respectively. The calculated CB positions of CeO2 and CdS are −0.49 and −0.65 eV, respectively, and the calculated VB positions of CeO2 and CdS are about 2.61 and 1.65 eV, respectively. When the composite is irradiated under visible light, CdS can be activated, and the electrons in the full VB of CdS can migrate to the empty CB, leaving a considerable number of positively charged holes at the corresponding position. Due to the CB potential of CdS (−0.65 eV) being lower than that of CeO2 (−0.49 eV), the excited electrons in CdS are transferred to the CB of CeO2 through the heterojunction interface, which leads to the photogenerated electrons (e) and holes (h+) being effectively separated, inhibition of the recombination of photocarriers, and an improvement in the photocatalytic activity. At the same time, the photogenerated electrons react with H2O2 to generate hydroxyl radicals (•OH) and hydroxyl (-OH). However, since the VB potential of CdS (1.65 eV) is lower than the redox potential of -OH/•OH (1.99 eV), holes cannot react with hydroxyl (-OH) to form hydroxyl radicals (•OH) [42]. Hydroxyl radicals (•OH) and holes (h+) with strong oxidation can be oxidized with DBT into DBTO2. Finally, due to the strong polarity of DBTO2, it can be removed by extraction separation to achieve the purpose of desulfurization [2,7,43]. In addition, the surface VO of CeO2 plays an important role in the process of photocatalytic desulfurization. It not only serves as an electron reservoir to store the photogenerated electrons and inhibit the recombination of photogenerated electrons and holes, but also acts as an active site to promote the adsorption and activation of H2O/-OH [29,44]. Figure 8 illustrates the possible photocatalytic desulfurization mechanism.

4. Conclusions

In conclusion, one-dimensional CeO2 nanorods were modified by CdS nanoparticles to form a heterojunction photocatalyst. The nanocomposites show great enhanced photocatalytic activity for photocatalytic desulfurization, and CdS/CeO2 (1:1) shows the highest desulfurization rate of 92% in 3 h under visible light. The nanocomposites demonstrate outstanding photocatalytic activity, and the desulfurization rate reaches 92% for DBT in 3 h. The excellent photocatalytic desulfurization performance is attributed to the transfer of visible light excited electrons on CdS nanoparticles to CeO2 nanorods, which effectively inhibits the photocorrosion of CdS with narrow band gap and improves the light trapping ability of CeO2 with a broad band gap. This work may provide a new idea for the design and construction of photocatalytic deep desulfurization materials.

Author Contributions

Conceptualization, X.L. and H.H.; methodology, X.L. and J.Q.; validation, Z.L., X.Z. and H.H.; formal analysis, Z.L., W.X. and H.H.; investigation, X.L. and W.X.; resources, X.L.; data curation, X.Z. and W.X.; writing—original draft preparation, X.L. and Z.L.; writing—review and editing, H.H. and J.Q.; visualization, X.L. and X.Z.; supervision, X.L.; project administration, X.L.; funding acquisition, X.L. and H.H. All authors have read and agreed to the published version of the manuscript.

Funding

This research was supported by Industry-University-Institute Cooperation Project of Jiangsu Province (BY2022428), China; the Funding for school-level research projects of Yancheng Institute of Technology (xjr2019026); and the Natural Science Foundation of the Jiangsu Higher Education Institutions of China (Grant No. 19KJD430008).

Data Availability Statement

Data available on request from the authors.

Conflicts of Interest

The authors declare no conflict of interest.

References

  1. Lahieb Faisal, M.; Ali, S.A.K.; Al-Sharify, Z.T.; Ali, A. The Effect of Smoke from Factories, Electricity Generator and Vehicles on Human Health and Environment. A Review. Solid State Technol. 2020, 63, 21390–21398. [Google Scholar]
  2. Li, X.Z.; Li, F.H.; Lu, X.W.; Zuo, S.X.; Yao, C.; Ni, C.Y. Development of Bi2W1−xMoxO6/Montmorillonite nanocomposite as efficient catalyst for photocatalytic desulfurization. J. Alloys Compd. 2017, 709, 285–292. [Google Scholar] [CrossRef] [Green Version]
  3. Díaz de León, J.N.; Ramesh Kumar, C.; Antúnez-García, J.; Fuentes-Moyado, S. Recent insights in transition metal sulfide hydrodesulfurization catalysts for the production of ultra low sulfur diesel: A short review. Catalysts 2019, 9, 87. [Google Scholar] [CrossRef] [Green Version]
  4. Crucianelli, M.; Bizzarri, B.M.; Saladino, R. SBA-15 anchored metal containing catalysts in the oxidative desulfurization process. Catalysts 2019, 9, 984. [Google Scholar] [CrossRef] [Green Version]
  5. Ahmed, I.; Jhung, S.H. Adsorptive desulfurization and denitrogenation using metal-organic frameworks. J. Hazard. Mater. 2016, 301, 259–276. [Google Scholar] [CrossRef]
  6. Chen, S.Q.; Zang, M.; Li, L.; Chen, J.T.; Liu, Q.Y.; Feng, X.W.; Sun, S.; Zang, C.W.; Zhao, C.C. Efficient biodesulfurization of diesel oil by Gordonia sp. SC-10 with highly hydrophobic cell surface. Biochem. Eng. J. 2021, 174, 108094. [Google Scholar] [CrossRef]
  7. Li, X.Z.; Zhu, W.; Lu, X.W.; Zuo, S.X.; Yao, C.; Ni, C.Y. Integrated nanostructures of CeO2 /attapulgite/g-C3N4 as efficient catalyst for photocatalytic desulfurization: Mechanism, kinetics and influencing factors. Chem. Eng. J. 2017, 326, 87–98. [Google Scholar] [CrossRef]
  8. Zhou, X.Y.; Wang, T.Y.; Liu, H.; Gao, X.C.; Wang, C.Y.; Wang, G.X. Desulfurization through photocatalytic oxidation: A critical review. ChemSusChem 2021, 14, 492–511. [Google Scholar] [CrossRef]
  9. Hitam, C.N.C.; Jalil, A.A.; Triwahyono, S.; Rahman, A.F.A.; Hassan, N.S.; Khusnun, N.F.; Jamian, S.F.; Mamat, C.R.; Nabgan, W.; Ahmad, A. Effect of carbon-interaction on structure-photoactivity of Cu doped amorphous TiO2 catalysts for visible-light-oriented oxidative desulphurization of dibenzothiophene. Fuel 2018, 216, 407–417. [Google Scholar] [CrossRef]
  10. Zhang, G.; Gao, M.; Tian, M.; Zhao, W.F. In situ hydrothermal preparation and photocatalytic desulfurization per formance of graphene wrapped TiO2 composites. J. Solid State Chem. 2019, 279, 120953. [Google Scholar] [CrossRef]
  11. Mousavi-Kamazani, M. Cube-like Cu/Cu2O/BiVO4/Bi7VO13 composite nanoparticles: Facile sol-gel synthesis for photocatalytic desulfurization of thiophene under visible light. J. Alloys Compd. 2018, 823, 153786. [Google Scholar] [CrossRef]
  12. Ebadi, M.; Asri, M.; Beshkar, F. Novel Mo/Bi2MoO6/Bi3ClO4 heterojunction photocatalyst for ultra-deep desulfurization of thiophene under simulated sunlight irradiation. Adv. Powder Technol. 2021, 32, 2160–2170. [Google Scholar] [CrossRef]
  13. Li, B.L.; Song, H.Y.; Han, F.Q.; Wei, L.S. Photocatalytic oxidative desulfurization and denitrogenation for fuels in ambient air over Ti3C2/g-C3N4 composites under visible light irradiation. Appl. Catal. B 2020, 269, 118845. [Google Scholar] [CrossRef]
  14. Lu, X.W.; Chen, F.; Qian, J.C.; Fu, M.; Jiang, Q.; Zhang, Q.F. Facile fabrication of CeF3/g-C3N4 heterojunction photocatalysts with upconversion properties for enhanced photocatalytic desulfurization performance. J. Rare Earths 2021, 39, 1204–1210. [Google Scholar] [CrossRef]
  15. Bagheri, M.; Masoomi, M.Y.; Morsali, A. A MoO3-metal-organic framework composite as a simultaneous photocatalyst and catalyst in the PODS process of light oil. ACS Catal 2017, 7, 6949–6956. [Google Scholar] [CrossRef]
  16. Kusmierek, E. A CeO2 semiconductor as a photocatalytic and photoelectrocatalytic material for the remediation of pollutants in industrial wastewater: A review. Catalysts 2020, 10, 1435. [Google Scholar] [CrossRef]
  17. Wang, A.Q.; Zheng, Z.K.; Wang, H.; Yuwen Chen, Y.W.; Luo, C.H.; Liang, D.J.; Hu, B.W.; Qiu, R.L.; Yan, K. 3D hierarchical H2-reduced Mn-doped CeO2 microflowers assembled from nanotubes as a high-performance Fenton-like photocatalyst for tetracycline antibiotics degradation. Appl. Catal. B 2020, 277, 119171. [Google Scholar] [CrossRef]
  18. García-López, E.I.; Abbasi, Z.; Parrino, F.; La Parola, V.; Liotta, L.F.; Marcì, G. Au/CeO2 Photocatalyst for the Selective Oxidation of Aromatic Alcohols in Water under UV, Visible and Solar Irradiation. Catalysts 2021, 11, 1467. [Google Scholar] [CrossRef]
  19. Liu, J.W.; Zhang, L.; Sun, Y.F.; Luo, Y. Bifunctional Ag-decorated CeO2 nanorods catalysts for promoted photodegradation of methyl orange and photocatalytic hydrogen evolution. Nanomaterials 2021, 11, 1104. [Google Scholar] [CrossRef]
  20. Zhong, Y.; Peng, C.D.; He, Z.T.; Chen, D.M.; Jia, H.L.; Zhang, J.Z.; Ding, H.; Wu, X.F. Interface engineering of heterojunction photocatalysts based on 1D nanomaterials. Catal. Sci. Technol. 2021, 11, 27–42. [Google Scholar] [CrossRef]
  21. Alomar, M.; Liu, Y.L.; Chen, W.; Fida, H. Controlling the growth of ultrathin MoS2 nanosheets/CdS nanoparticles by two-step solvothermal synthesis for enhancing photocatalytic activities under visible light. Appl. Surf. Sci. 2019, 480, 1078–1088. [Google Scholar] [CrossRef]
  22. Ning, X.; Lu, G. Photocorrosion inhibition of CdS-based catalysts for photocatalytic overall water splitting. Nanoscale 2020, 12, 1213–1223. [Google Scholar] [CrossRef] [PubMed]
  23. Fang, J.; Bi, X.Z.; Si, D.J.; Jiang, Z.Q.; Huang, W.X. Spectroscopic studies of interfacial structures of CeO2–TiO2 mixed oxides. Appl. Surf. Sci. 2007, 253, 8952–8961. [Google Scholar] [CrossRef]
  24. Cui, H.J.; Li, B.B.; Zhang, Y.Z.; Zheng, X.D.; Li, X.Z.; Li, Z.Y.; Xu, S. Constructing Z-scheme based CoWO4/CdS photocatalysts with enhanced dye degradation and H2 generation performance. Int. J. Hydrogen Energy 2018, 43, 18242–18252. [Google Scholar] [CrossRef]
  25. Mani, A.D.; Nandy, S.; Subrahmanyam, C. Synthesis of CdS/CeO2 nanomaterials for photocatalytic H2 production and simultaneous removal of phenol and Cr (VI). J. Environ. Chem. Eng. 2015, 3, 2350–2357. [Google Scholar] [CrossRef]
  26. Xu, J.; Li, M.; Qiu, J.H.; Zhang, X.F.; Feng, Y.; Yao, J.F. PEGylated deep eutectic solvent-assisted synthesis of CdS@CeO2 composites with enhanced visible light photocatalytic ability. Chem. Eng. J. 2020, 383, 123135. [Google Scholar] [CrossRef]
  27. Maslakov, K.I.; Teterin, Y.A.; Popel, A.J.; Teterin, A.Y.; Ivanov, K.E.; Kalmykov, S.N.; Petrova, V.G.; Petrov, P.K.; Farnan, I. XPS study of ion irradiated and unirradiated CeO2 bulk and thin film samples. Appl. Surf. Sci. 2018, 448, 154–162. [Google Scholar] [CrossRef]
  28. Guo, C.F.; Chen, D.L.; Hu, Y. Perspective on Defective Semiconductor Heterojunctions for CO2 Photoreduction. Langmuir 2022, 38, 6491–6498. [Google Scholar] [CrossRef] [PubMed]
  29. Ni, M.M.; Zhang, H.Y.; Khan, S.; Chen, X.J.; Chen, F.; Guo, C.F.; Zhong, Y.J.; Hu, Y. In-situ photodeposition of cadmium sulfide nanocrystals on manganese dioxide nanorods with rich oxygen vacancies for boosting water-to-oxygen photooxidation. J. Colloid Interface Sci. 2022, 613, 764–774. [Google Scholar] [CrossRef] [PubMed]
  30. Wang, S.; Zhu, B.C.; Liu, M.J.; Zhang, L.Y.; Yu, J.G.; Zhou, M.H. Direct Z-scheme ZnO/CdS hierarchical photocatalyst for enhanced photocatalytic H2-production activity. Appl. Catal. B 2019, 243, 19–26. [Google Scholar] [CrossRef]
  31. Liu, C.; Zhang, Q.F.; Zou, Z.G. Recent advances in designing ZnIn2S4-based heterostructured photocatalysts for hydrogen evolution. J. Mater. Sci. Technol. 2022, 139, 167–188. [Google Scholar] [CrossRef]
  32. Makuła, P.; Pacia, M.; Macyk, W. How to correctly determine the band gap energy of modified semiconductor photocatalysts based on UV–Vis spectra. J. Phys. Chem. Lett. 2018, 9, 6814–6817. [Google Scholar] [CrossRef] [PubMed] [Green Version]
  33. Liu, C.; Zhang, Y.L.; Wu, J.X.; Dai, H.L.; Ma, C.J.; Zhang, Q.F.; Zou, Z.G. Ag-Pd alloy decorated ZnIn2S4 microspheres with optimal Schottky barrier height for boosting visible-light-driven hydrogen evolution. J. Mater. Sci. Technol. 2022, 114, 81–89. [Google Scholar] [CrossRef]
  34. Lu, X.W.; Li, X.Z.; Chen, F.; Chen, Z.G.; Qian, J.; Zhang, Q.F. Biotemplating synthesis of N-doped two-dimensional CeO2-TiO2 nanosheets with enhanced visible light photocatalytic desulfurization performance. J. Alloys Compd. 2020, 815, 152326. [Google Scholar] [CrossRef]
  35. Li, L.; Guo, C.F.; Ning, J.Q.; Zhong, Y.J.; Chen, D.L.; Hu, Y. Oxygen-vacancy-assisted construction of FeOOH/CdS heterostructure as an efficient bifunctional photocatalyst for CO2 conversion and water oxidation. Appl. Catal. B Environ. 2022, 613, 764–774. [Google Scholar] [CrossRef]
  36. Zhang, Y.; Zhou, H.H.; Wang, H.G.; Zhang, Y.C.; Dionysiou, D.D. Synergistic effect of reduced graphene oxide and near-infrared light on MoS2-mediated electrocatalytic hydrogen evolution. Chem. Eng. J. 2021, 418, 129343. [Google Scholar] [CrossRef]
  37. Lu, X.W.; Li, X.Z.; Qian, J.C.; Miao, N.M.; Yao, C.; Chen, Z.G. Synthesis and characterization of CeO2/TiO2 nanotube arrays and enhanced photocatalytic oxidative desulfurization performance. J. Alloys Compd. 2016, 661, 363–371. [Google Scholar] [CrossRef]
  38. Zhang, Y.; Hu, L.; Zhang, Y.C.; Wang, X.Z.; Wang, H.G. Snowflake-Like Cu2S/MoS2/Pt heterostructure with near infrared photothermal-enhanced electrocatalytic and photoelectrocatalytic hydrogen production. Appl. Catal. B Environ. 2022, 315, 121540. [Google Scholar] [CrossRef]
  39. Sun, J.B.; Han, N.; Gu, Y.; Lu, X.W.; Si, L.; Zhang, Q.F. Hole Doping to Enhance the Photocatalytic Activity of Bi4NbO8Cl. Catalysts 2020, 10, 1425. [Google Scholar] [CrossRef]
  40. Zhang, F.; Zhang, Y.C.; Wang, Y.Y.; Zhu, A.P.; Zhang, Y. Efficient photocatalytic reduction of aqueous Cr (VI) by Zr4+ doped and polyaniline coupled SnS2 nanoflakes. Sep. Purif. Technol. 2022, 283, 120161. [Google Scholar] [CrossRef]
  41. Guo, X.Y.; Chen, C.F.; Song, W.Y.; Wang, X.; Di, W.H.; Qin, W.P. CdS embedded TiO2 hybrid nanospheres for visible light photocatalysis. J. Mol. Catal. A Chem. 2014, 387, 1–6. [Google Scholar] [CrossRef]
  42. Lu, X.W.; Quan, L.M.; Hou, H.J.; Qian, J.C.; Liu, Z.W.; Zhang, Q.F. Fabrication of 1D/2D Y-doped CeO2/ZnIn2S4 S-scheme photocatalyst for enhanced photocatalytic H2 evolution. J. Alloys Compd. 2022, 925, 166552. [Google Scholar] [CrossRef]
  43. Wang, C.; Zhu, W.S.; Xu, Y.H.; Xu, H.; Zhang, M.; Chao, Y.H.; Yin, S.; Li, H.M.; Wang, J.G. Preparation of TiO2/g-C3N4 composites and their application in photocatalytic oxidative desulfurization. Ceram. Int. 2014, 40, 11627–11635. [Google Scholar] [CrossRef]
  44. Xiong, J.; Di, J.; Xia, J.X.; Zhu, W.S.; Li, H.M. Surface defect engineering in 2D nanomaterials for photocatalysis. Adv. Funct. Mater. 2018, 28, 1801983. [Google Scholar] [CrossRef]
Figure 1. XRD patterns of CdS, CeO2 and the various CdS/CeO2 composites.
Catalysts 12 01478 g001
Figure 2. Raman spectra of CdS, CeO2 and various CdS/CeO2 samples.
Catalysts 12 01478 g002
Figure 3. TEM and HRTEM images of CeO2 (a,b) and CdS/CeO2(1:1) composite (c,d).
Catalysts 12 01478 g003
Figure 4. High-resolution XPS spectra (a) Ce 3d, (b) O 1s, (c) Cd 3d and (d) S 2p of the samples.
Catalysts 12 01478 g004
Figure 5. (a) UV-Vis DRS of the photocatalysts; (b) plots of (αhv)2 vs photon energy (hv).
Catalysts 12 01478 g005
Figure 6. (a) Photocatalytic desulfurization rate of model oil by different photocatalysts; (b) kinetic curves for photocatalytic desulfurization over the prepared photocatalysts; (c) cycling runs of CdS/CeO2 (1:1) composite on the desulfurization rate.
Catalysts 12 01478 g006aCatalysts 12 01478 g006b
Figure 7. (a) Photocurrent response; (b) Nyquist impedance plots and (c) photoluminescence spectra of CeO2, CdS and CdS/CeO2 (1:1).
Catalysts 12 01478 g007aCatalysts 12 01478 g007b
Figure 8. Schematic illustration of photocatalytic desulfurization mechanism of CdS/CeO2 composite.
Catalysts 12 01478 g008
Publisher’s Note: MDPI stays neutral with regard to jurisdictional claims in published maps and institutional affiliations.

