Article

Photocatalytic Hydrogen Production from Urine Using Sr-Doped TiO2 Photocatalyst with Subsequent Phosphorus Recovery via Struvite Crystallization

by
Oranoot Sittipunsakda
1,2,
Patiya Kemacheevakul
3,4,
Navadol Laosiripojana
1,2 and
Surawut Chuangchote
4,5,*
1
The Joint Graduate School of Energy and Environment, King Mongkut’s University of Technology Thonburi, 126 Prachauthit Rd., Bangmod, Bangkok 10140, Thailand
2
Center for Energy Technology and Environment, Ministry of Education, 126 Prachauthit Rd., Bangmod, Bangkok 10140, Thailand
3
Department of Environmental Engineering, Faculty of Engineering, King Mongkut’s University of Technology Thonburi, 126 Prachauthit Rd., Bangmod, Bangkok 10140, Thailand
4
Research Center of Advanced Materials for Energy and Environmental Technology (MEET), King Mongkut′s University of Technology Thonburi, 126 Prachauthit Rd., Bangmod, Bangkok 10140, Thailand
5
Department of Tool and Materials Engineering, Faculty of Engineering, King Mongkut’s University of Technology Thonburi, 126 Prachauthit Rd., Bangmod, Bangkok 10140, Thailand
*
Author to whom correspondence should be addressed.
Catalysts 2021, 11(8), 1012; https://doi.org/10.3390/catal11081012
Submission received: 7 July 2021 / Revised: 26 July 2021 / Accepted: 4 August 2021 / Published: 22 August 2021
(This article belongs to the Special Issue Photocatalysis and Renewable Materials)

Abstract

:
Currently, the discharge of wastewater and utilization of phosphorus (P) in human activities cause some environmental problems, such as high organic pollutants in aquatic environments which results in dirty water sources, and a shortage of phosphate rock reserves due to the high demand of P. Therefore, fuel energy and struvite crystallization from waste sources can be considered interesting alternatives. In this work, the modified catalyst for hydrogen production, along with solving environmental problems, was examined. The strontium (Sr) doped-titanium dioxide (TiO2) nanoparticles were synthesized by wetness impregnation method. The synthesized catalyst was characterized using UV-vis spectroscopy (UV-vis), photoluminescence (PL), X-ray diffraction (XRD), photoluminescence (PL), and scanning electron microscopy with energy-dispersive X-ray spectroscopy (SEM-EDS). The Sr-doped TiO2 catalysts had been utilized as the photocatalyst for the hydrogen production from synthetic human urine (a representative of waste source). The doping content of Sr in TiO2 varied from 0.5, 1, 2, and 4%, and the photocatalytic performances were compared with pristine TiO2 nanoparticles. The results showed that 1% Sr-doped TiO2 had the highest photocatalytic activity for hydrogen production and decreased the amount of chemical oxygen demand (COD) in the synthetic human urine. Subsequently, P could be recovered from the treated human urine in the form of struvite.

1. Introduction

Currently, a rapidly growing population in the world leads to various environmental problems, especially wastewater. A huge amount of municipal wastewater is difficult to manage and affects aquatic environments. The major sources of municipal wastewater are households, institutions, and commercial buildings which contain organic compounds, heavy metals, and nutrients, especially nitrogen (N) and phosphorus (P). The treatments of municipal wastewater or domestic sewage are necessary for public health and aquatic environments. In general, municipal wastewater has been used in conventional wastewater treatment processes to remove suspended solids and organic compounds before releasing them to rivers and land for reuse [1].
Urine is a waste from living organisms which is rich in nutrients, especially N and P. The largest constituent of urine is urea [2]. In the environment, urine has some negative impacts such as eutrophication and pharmaceutical pollution problems [3]. However, urine has been used as a source of fertilizer which is more environmentally friendly than chemical fertilizer [4]. Moreover, many studies have reported that urine can be converted to hydrogen (H) which can mitigate energy problems. Therefore, wastewater (urine) can be applied as a source of energy production and nutrient recovery, which is very attractive due to low-cost consumption, availability, and positive net energy gain [5].
Hydrogen gas as an energy carrier is one of the major sources of clean energy for the future, and meets the demands of energy security, environmental quality, and economic competitiveness, because it has high energy content and can reduce greenhouse gas emission compared with fossil fuels [6]. Moreover, hydrogen gas can be used in fuel cells to generate electricity and is used for powering fuel sources. Hydrogen gas is generally produced by steam reforming of natural gas and by electrolysis of water, which are energy-intensive processes. Electrolysis is quite expensive, while the downside to steam reforming is producing a great deal of greenhouse gases such as carbon dioxide and carbon monoxide in the atmosphere, causing global warming [7]. Thus, the development of hydrogen gas production from a low cost and environmentally friendly process becomes an interesting topic to investigate. The attractive, alternative method is the application of semiconductor and solar energy for hydrogen separation from water molecules (so-called water splitting) via the photocatalytic process. The process is environmentally friendly and has a low production cost compared with the conventional processes [8].
The photocatalytic process is an efficient method in which a photocatalyst traps the photons to generate electron–hole pairs, which leads to chemical reactions at the surface. A promising photocatalyst that has been receiving attention is titanium dioxide (TiO2) because of its strong oxidizing power as well as physical and chemical stability [9]. TiO2 is a well-known photocatalytic material for hydrogen gas production, and it can also degrade the harmful pollutants in air and water because of its high stability, non-toxicity, and high performance [10]. However, TiO2 as a photocatalyst has limited usage, which only absorbs light under UV radiation. For the improvement of the photocatalytic activity of TiO2, the modification is essential for the shift of light absorption from UV to the visible region. There are various techniques to modify TiO2 for increased efficiency of photocatalysts, such as dye sensitization, doping, coupling, and capping of TiO2 [11,12]. Doping of transition and alkaline earth metals into TiO2 lattice by physical and chemical processes is a useful approach for obtaining visible light-sensitized catalysts [13].
Strontium (Sr) is a metal of the alkaline earth series. Many reports have mentioned that doping of Sr into the TiO2 nanoparticles can enhance photocatalytic activity compared with undoped TiO2 nanoparticles. Sood et al. (2015) reported that the Sr-doped TiO2 catalyst presented an excellent degradation efficiency of triarylmethane dye (96%) within 60 min of photocatalytic reaction because doping of TiO2 with Sr ions caused inhibition of recombination of photogenerated charge carriers, leading to high quantum efficiency [14]. Moreover, Sr in the lattice of TiO2 could bring isolated energy levels near conduction and valence bands, thus narrowing the bandgap [15].
Human urine can be utilized as a P source for nutrient recovery. P is an essential nutrient; it is, however, a non-renewable resource. Phosphate rock, the main source of P, is mainly used for agricultural fertilizer (80%), animal feed additions (5%), and industrial applications (15%) [16]. The demand for P is increasing while local production is not enough for world industry, which causes problems for a critical resource (P crisis) [17]. Therefore, P recovery from alternative waste sources is an attractive method to solve the P crisis. As mentioned above, human urine is an interesting resource for P recovery because it can increase the production of fertilizers and the reduction in eutrophication, which is caused by the overwhelming concentration of phosphate in the released effluent [18].
Many researchers have reported that phosphate can be recovered as struvite through struvite crystallization [19]. Struvite is a crystalline substance that contains magnesium (Mg), ammonium, and P in equal molar concentrations (MgNH4PO4•6H2 O) [20]. Struvite crystallization from human urine has been studied for a long time because urine has a high phosphate concentration [19]. The addition of small amounts of Mg to human urine is the most common method of P recovery and a significant amount of N is precipitated with crystalline struvite. The main factors that control struvite crystallization are the pH and molar ratio of Mg2+: NH4+: PO43-. Struvite is formed when Mg, ammonia, and phosphate ions exceed the solubility product of struvite, as explained in Equation (1) [21].
Mg2+ + NH4+ + PO4 3- + 6H2 O → MgNH4PO4•6H2 O (Struvite)
Wastewater is the main state problem in the environment. Therefore, the utilization of wastewater as a source for hydrogen energy production and P recovery was studied. In this work, synthetic human urine which contained a high concentration of N and P was utilized for hydrogen energy production and struvite crystallization. Hydrogen gas can be produced via a photocatalytic process with the use of TiO2 photocatalyst doped with alkaline earth metals (Sr) under visible light irradiation. Hydrogen production efficiencies of Sr-doped TiO2 photocatalysts at various Sr concentrations were examined. After the photocatalytic process, P was recovered from the synthetic human urine, which has never been reported before.

2. Results and Discussion

2.1. Characterizations

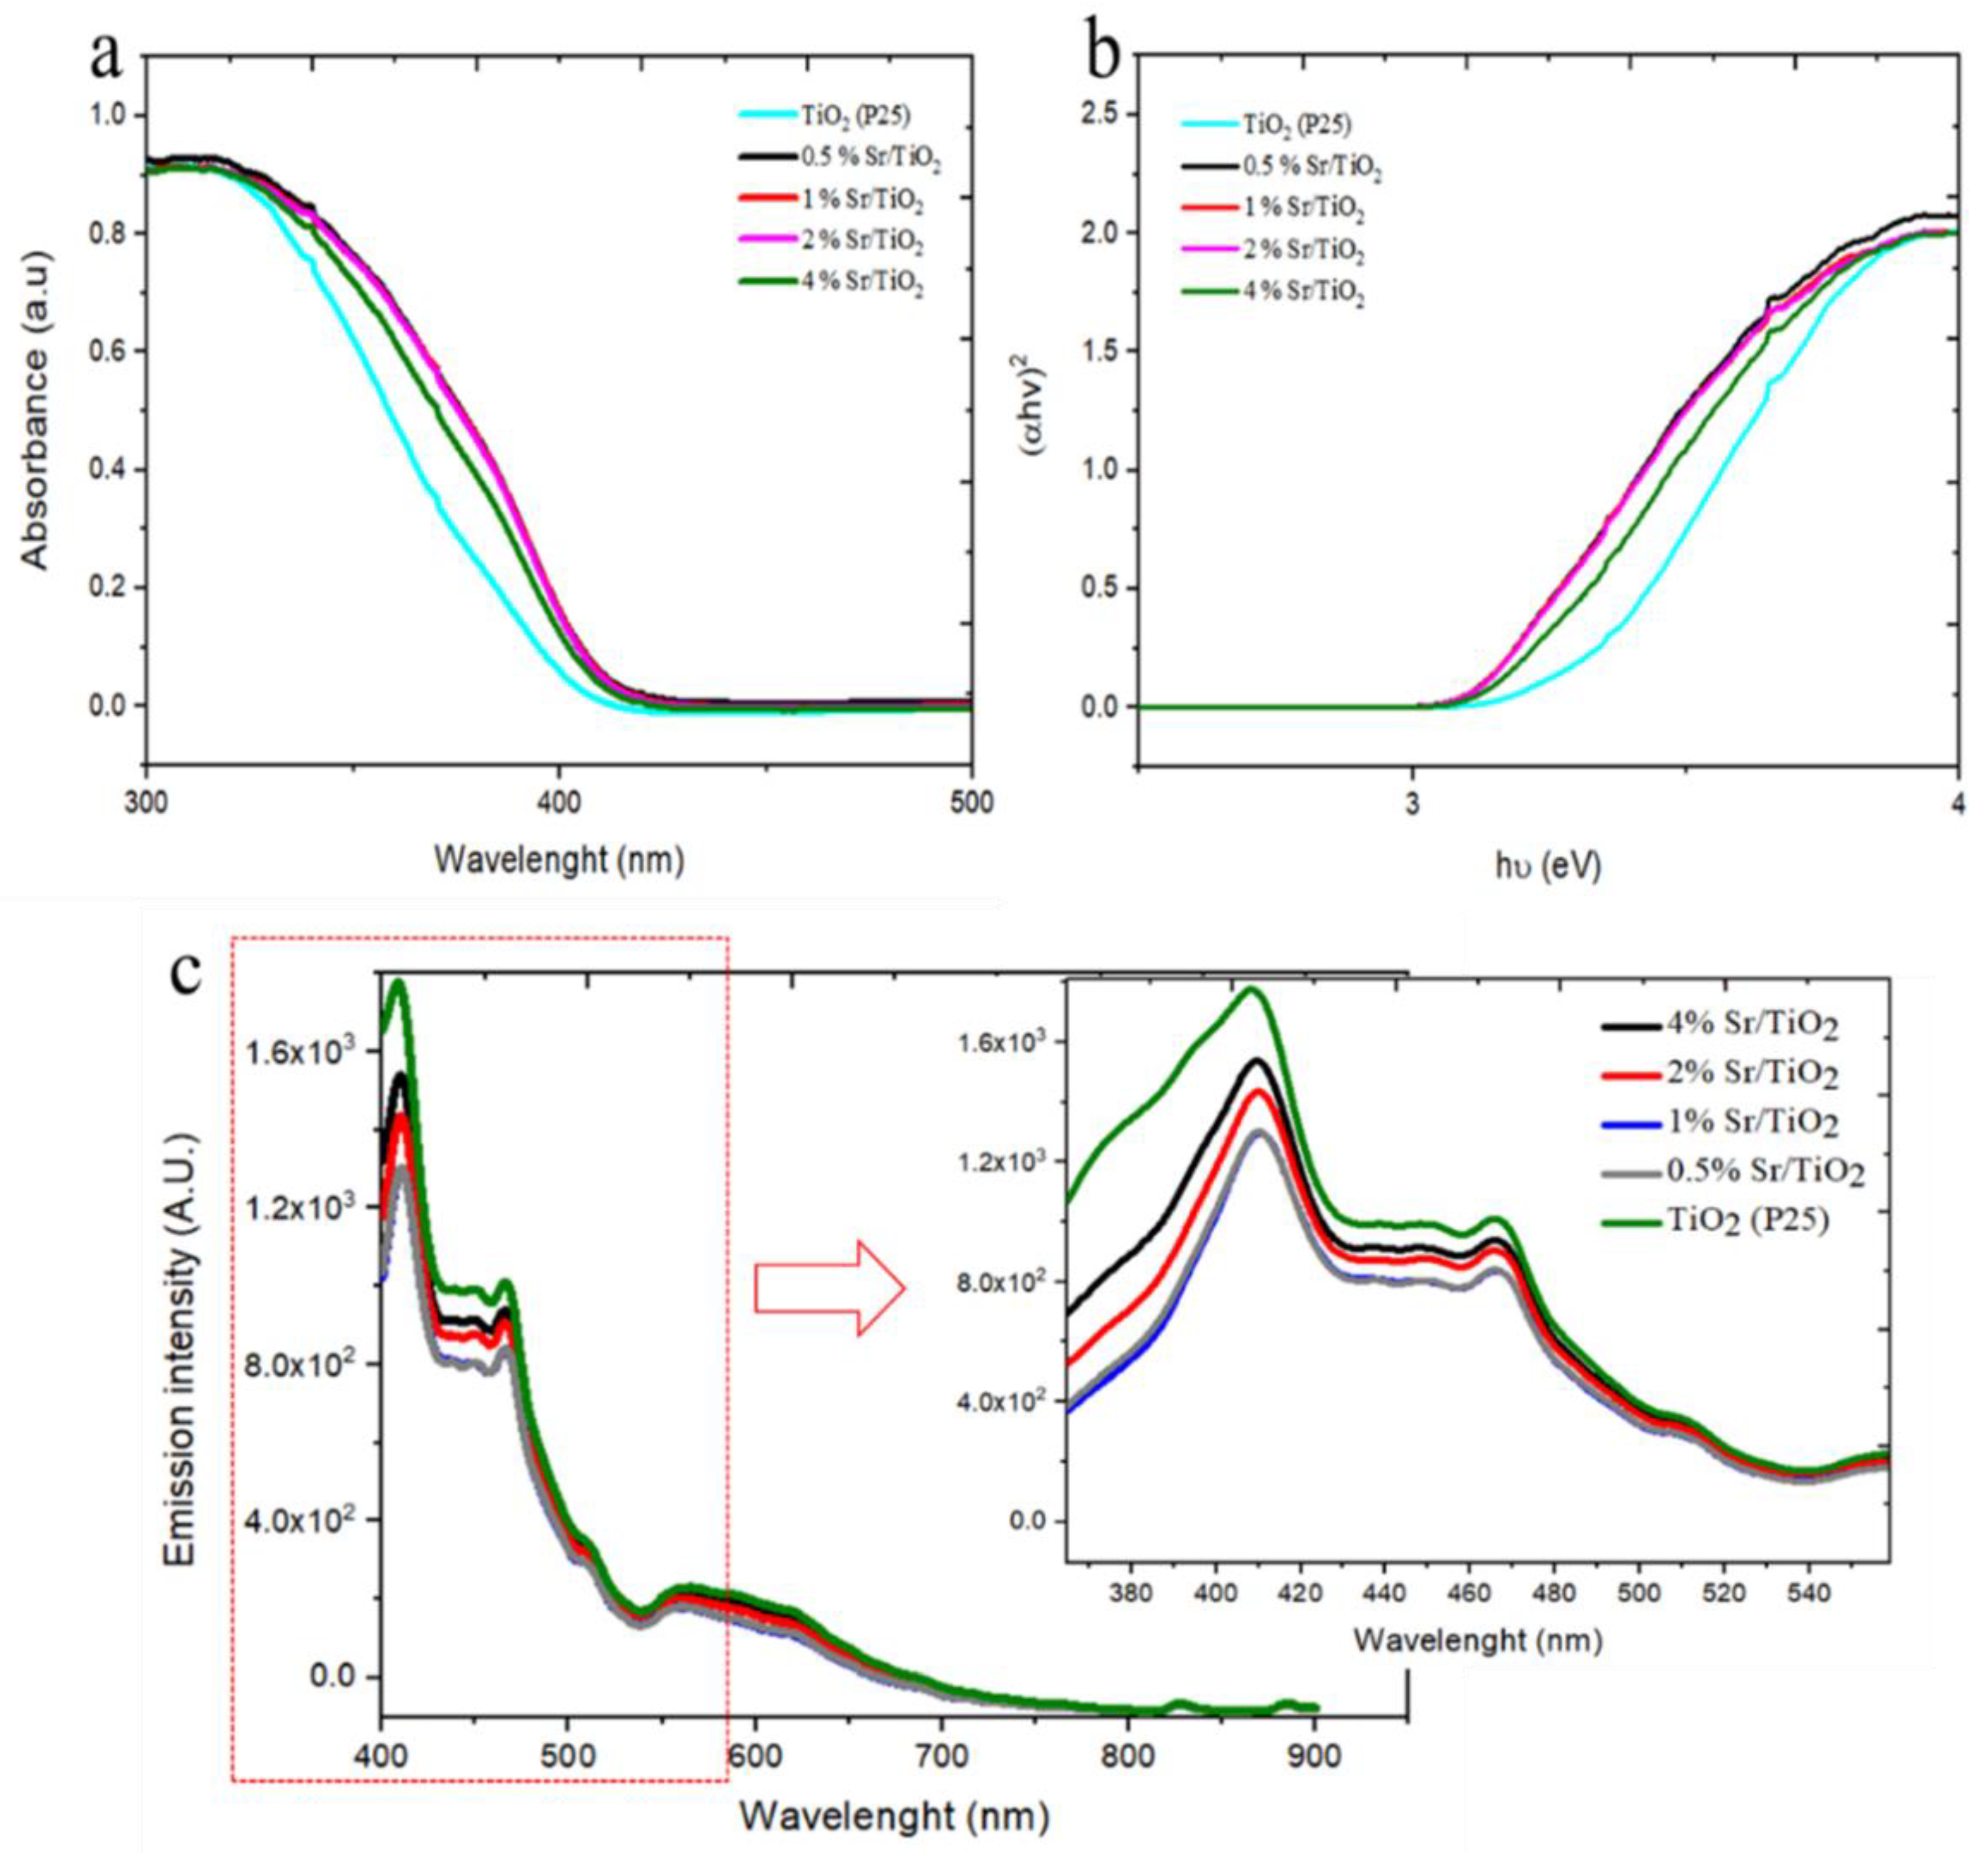
2.1.1. Optical Properties and Energy Bandgaps of Sr-Doped TiO2

UV-vis diffuse reflectance spectroscopy (DRS) was used for the investigation of an optical property, i.e., light absorption, of photocatalysts (Figure 1a). It was found that Sr-doped TiO2 could adsorb more light in the visible region (wavelengths less than 400 nm) compared with pristine TiO2. Energy bandgaps (Eg) of pristine TiO2 and Sr-doped TiO2 were studied from absorbance spectra using the Tauc plots [22] (Figure 1b). Energy bandgaps of Sr-doped TiO2 tended to decrease compared with pristine TiO2 as presented in Table 1, i.e., Sr concentrations in Sr-doped TiO2 of 0.5, 1, 2, and 4% narrowed the bandgaps of pristine TiO2 (3.29 eV) to 3.11, 3.11, 3.11, and 3.14 eV, respectively. Light absorption in the visible region and narrowed energy bandgaps by a metal modification will benefit the photocatalytic activity under the visible light irradiation [15,23]. Note that a trendy wider bandgap in 4% Sr-doped TiO2 compared with those in other Sr-doped TiO2 samples guides that 4% is too high a concentration for Sr doping.
Photoluminescence spectroscopy (PL) is generally used to determine the charge carrier trapping and to understand the behavior of the electron recombination, i.e., a low PL intensity indicates a low recombination rate [15]. Figure 1c shows PL spectra of TiO2 and Sr-doped TiO2 photocatalysts at an excitation wavelength of 320 nm. PL emission peaks corresponding to the inter-band recombination of TiO2 were observed at 410 nm. Compared with pristine TiO2, the emission peak intensity was found to significantly reduce in Sr-doped TiO2 samples. PL emission peaks are greatly quenched in 0.5% Sr-doped TiO2 and 1% Sr-doped TiO2. The result suggested that Sr doping had markedly improved the separation of charge carriers. Great separation of charge carriers (low charge recombination) will further govern high photocatalytic efficiency [14]. The PL quenching in Sr-doped TiO2 tended to decrease with increasing Sr concentrations to 2% and 4%. This is because the overloaded metal might act as a new recombination center (even though the recombination rates in 2% Sr-doped TiO2 and 4% Sr-doped TiO2 are lower than that in pristine TiO2).

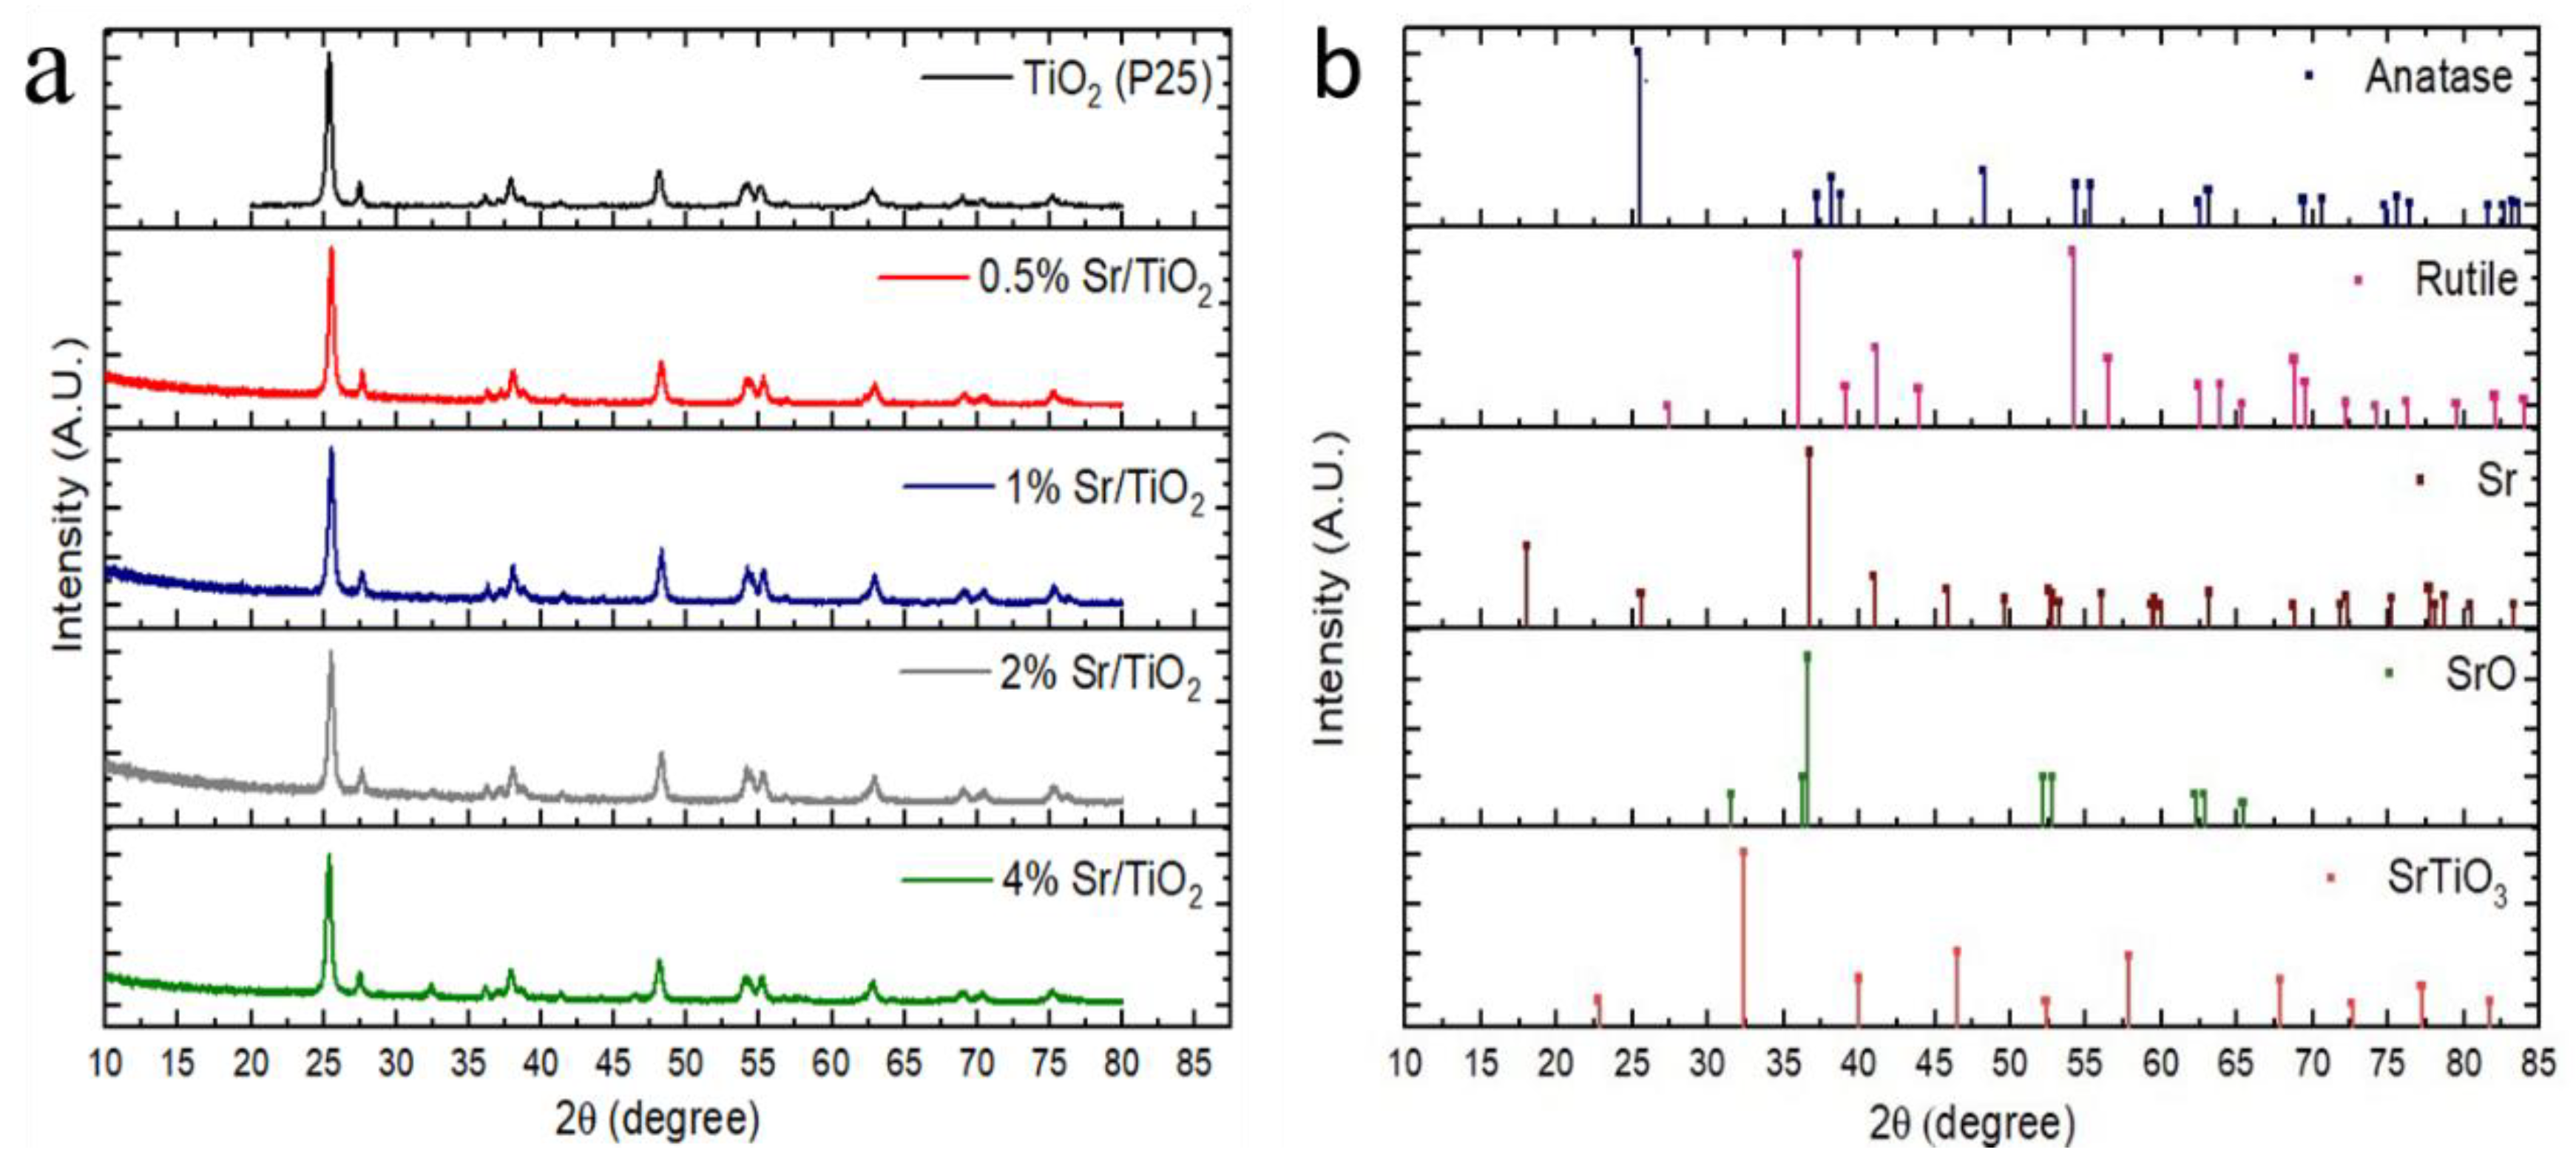
2.1.2. Crystalline Structure of Sr-Doped TiO2

X-ray Powder Diffraction (XRD) was performed in order to study the crystalline structures of pristine TiO2 and Sr-doped TiO2 samples (Figure 2). XRD patterns of all samples show the most intense peak observed at 2θ of ~25°, corresponding to the TiO2 anatase phase (JCPDS No. 21-1272), with the characteristic peaks of the mixed TiO2 rutile phase (JCPDS No. 21-1276), e.g., at 2θ of ~28°. There are small tracks of characteristic peaks of Sr and SrO (at 2θ of ~36.5°) in 0.5% Sr-doped TiO2 and 1% Sr-doped TiO2. It was reported that Sr2+ has difficulty displacing Ti4+ into the lattice because the ionic radius of Sr2+ is larger than Ti4+ [14,24], so the characteristic peak of SrTiO3 (JCPDS card no.35-734, i.e., 32.4°) is seemingly found in 2% Sr-doped TiO2 and stronger in 4% Sr-doped TiO2. This result is in line with the observations in UV-vis and PL spectra and indicates that the Sr-doped TiO2 with mixed anatase-rutile crystallite phases is successfully prepared in the 1% Sr-doped TiO2 sample, which may be beneficial to promote the photon-generated carrier transporting to increase the photocatalysis.
It was found that Sr-doped TiO2 samples show relatively wider anatase (101) 2θ (see Table 1), implying smaller crystallite sizes compared with pristine TiO2 as shown in [25,26]. The decreases in crystallite sizes of Sr-doped TiO2 indicates that the Sr can penetrate the TiO2 structure, forming some oxide forms (as found in XRD results), but anatase could still be formed, which is beneficial for the photocatalytic applications.

2.1.3. Brunauer–Emmett–Teller (BET) Surface Areas of Sr-Doped TiO2

BET surface area of pristine TiO2 was 46.74 m2/g. Doping with 0.5, 1, and 2% Sr could enhance the specific surface area of the photocatalysts to 57.47, 55.36, and 62.73 m2/g, respectively. This result is in line with the smaller crystallite sizes of Sr-doped TiO2 as discussed above. Unfortunately, with the too-high doping amount (4%), the specific surface area was found to reduce to 41.51 m2/g due to the formation of SrTiO3 as shown in XRD results. Note that the surface areas of the obtained Sr-doped TiO2 samples are relatively lower than those reported by Sood et al. (2015) (100.78 m2/g) [14]. This is because of the different Sr doping methods (i.e., wetness impregnation and hydrothermal treatment in this work and the previous report, respectively).

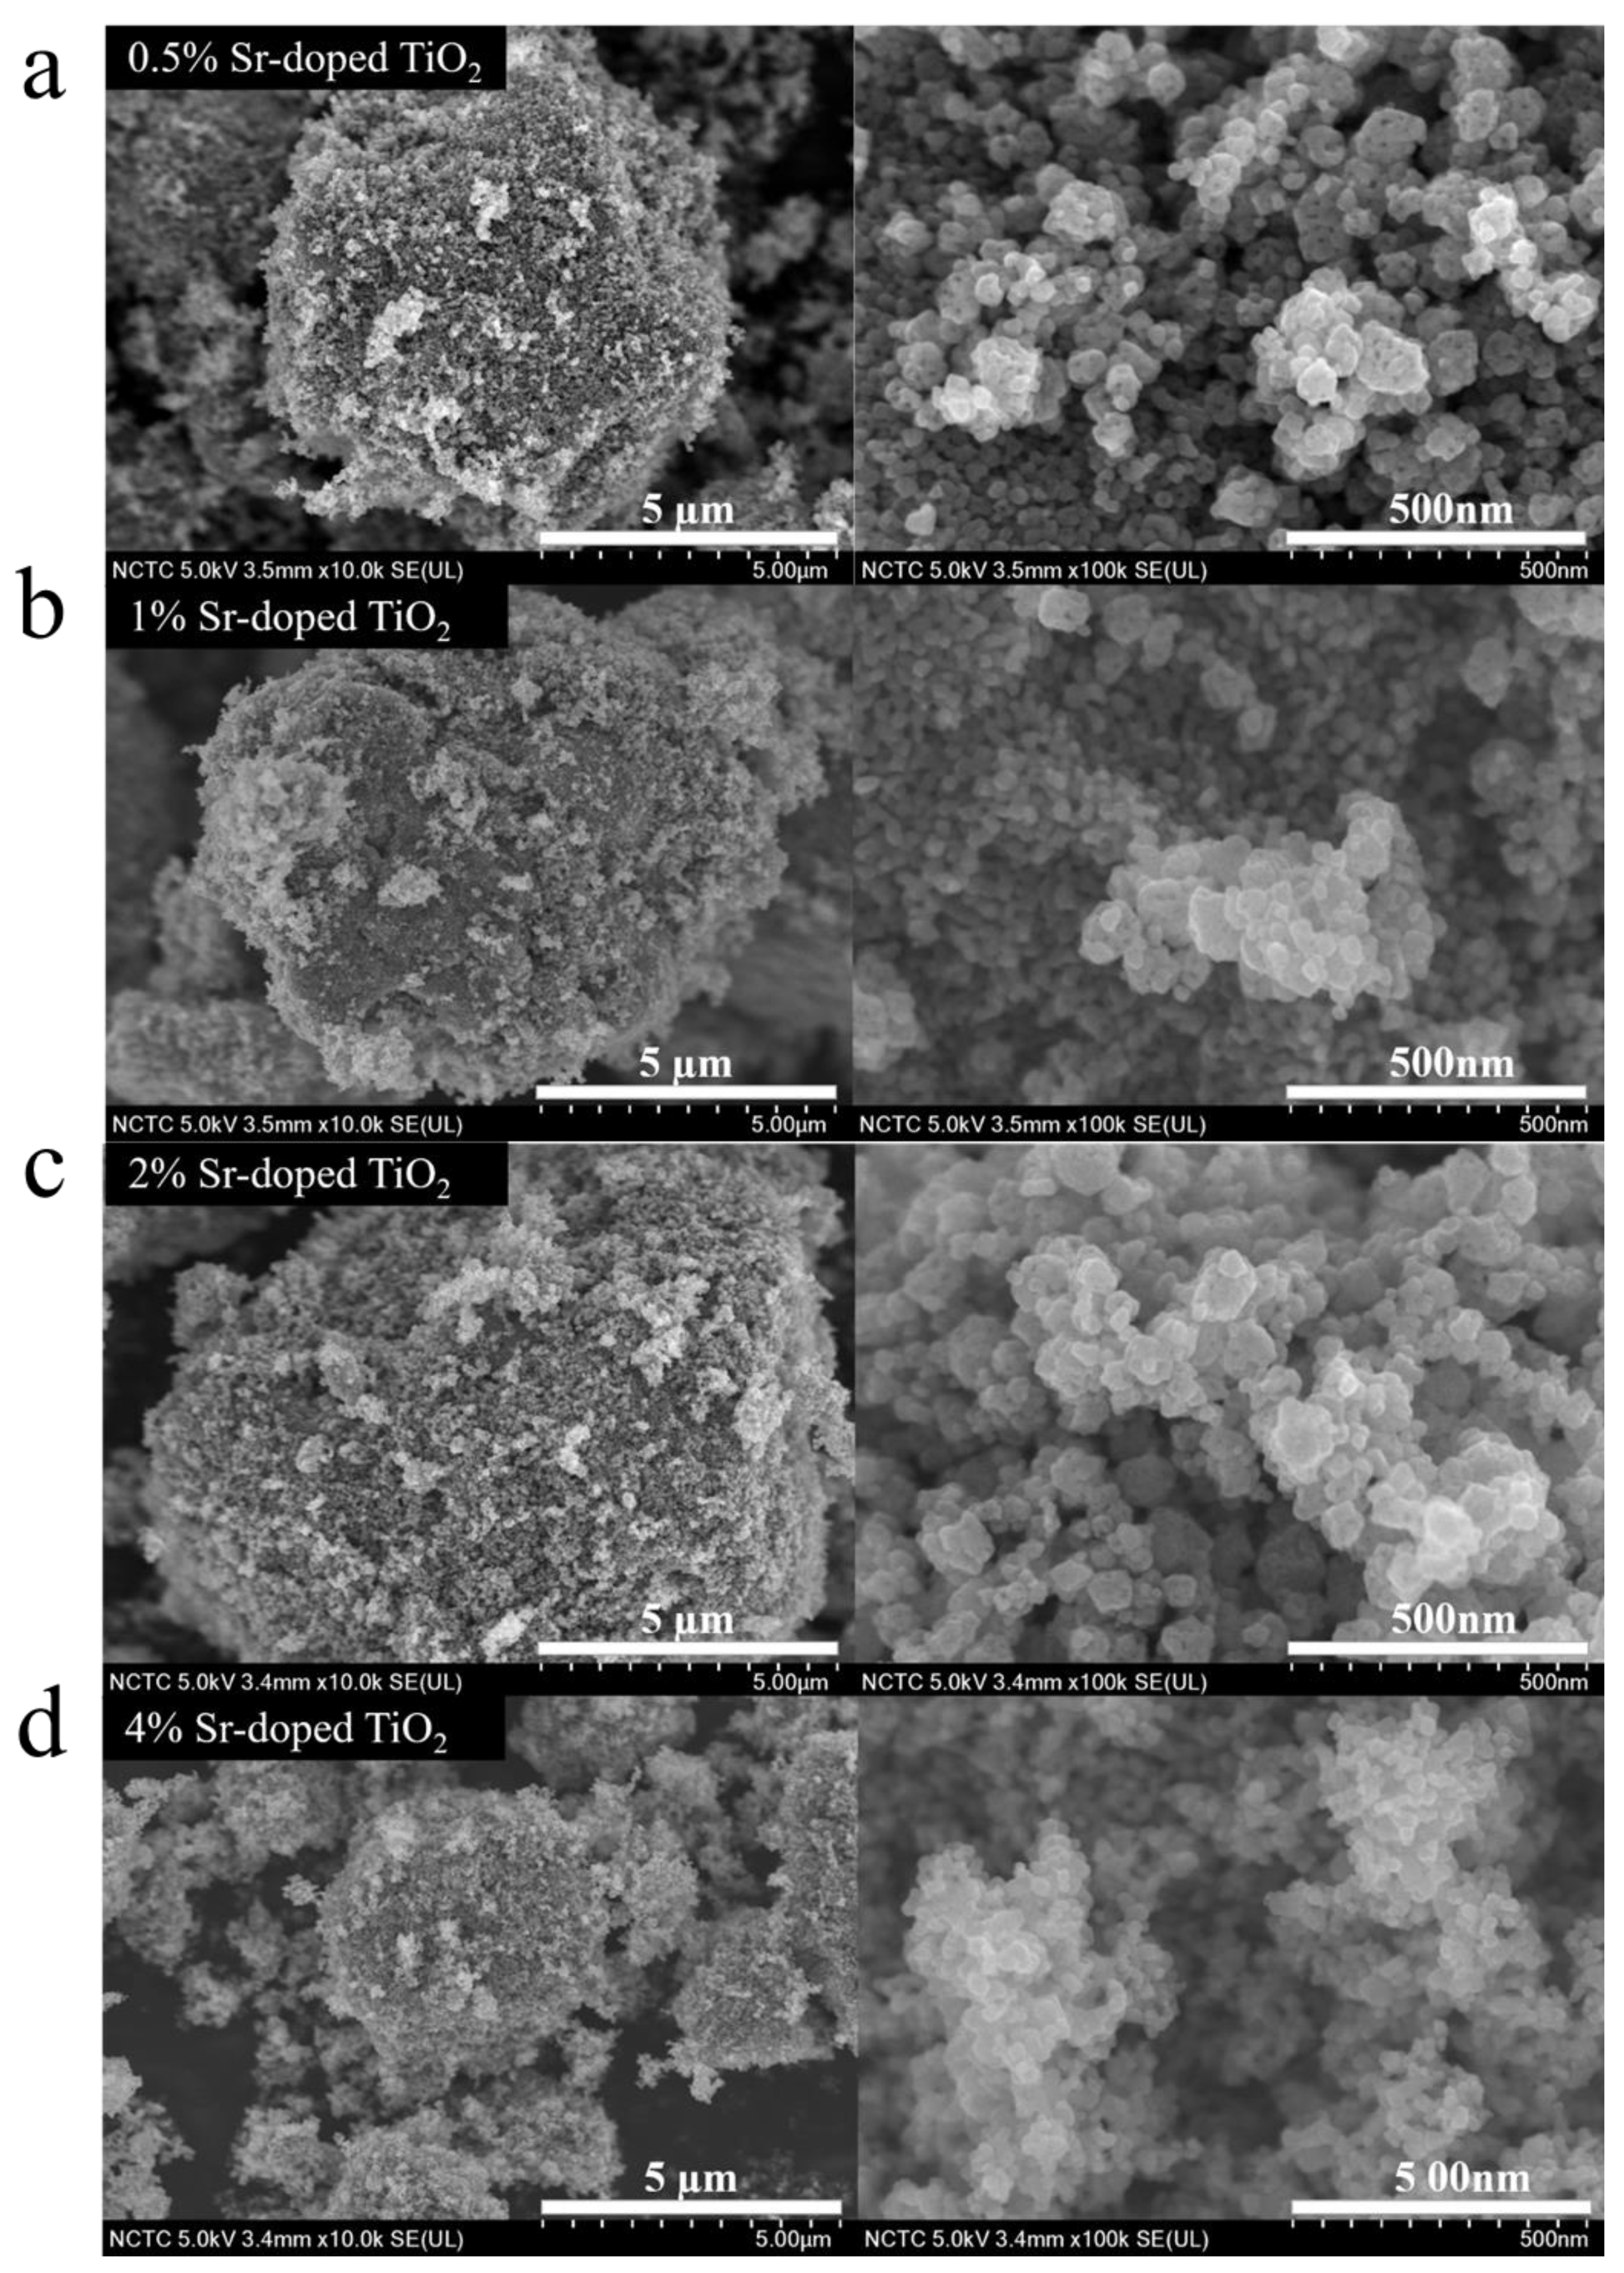
2.1.4. Morphology of Sr-Doped TiO2

Field Emission Scanning Electron Microscope and Energy Dispersive X-ray Spectrometer (FE-SEM with EDS) was utilized to observe the morphological appearances (Figure 3) and detect elemental compositions in the prepared samples. The FE-SEM images at the low magnification present the aggregated clusters of Sr-doped TiO2 nanoparticles similar to the doped TiO2 reported by Bakhshayesh and Bakhshayesh (2016) while the images at the higher magnification show the nanoparticle structures. Higher concentrations of Sr (2% and 4%) show more irregular clusters on the TiO2 surfaces due to the formation of SrO and SrTiO3. EDS analysis was used to determine the existence of Sr in the doped TiO2. The uniform dispersions of Sr in the samples were found in the elemental mapping results (not shown here). The elemental compositions of Sr in the doped TiO2 reasonably correspond with the Sr loading amounts (Table 2).

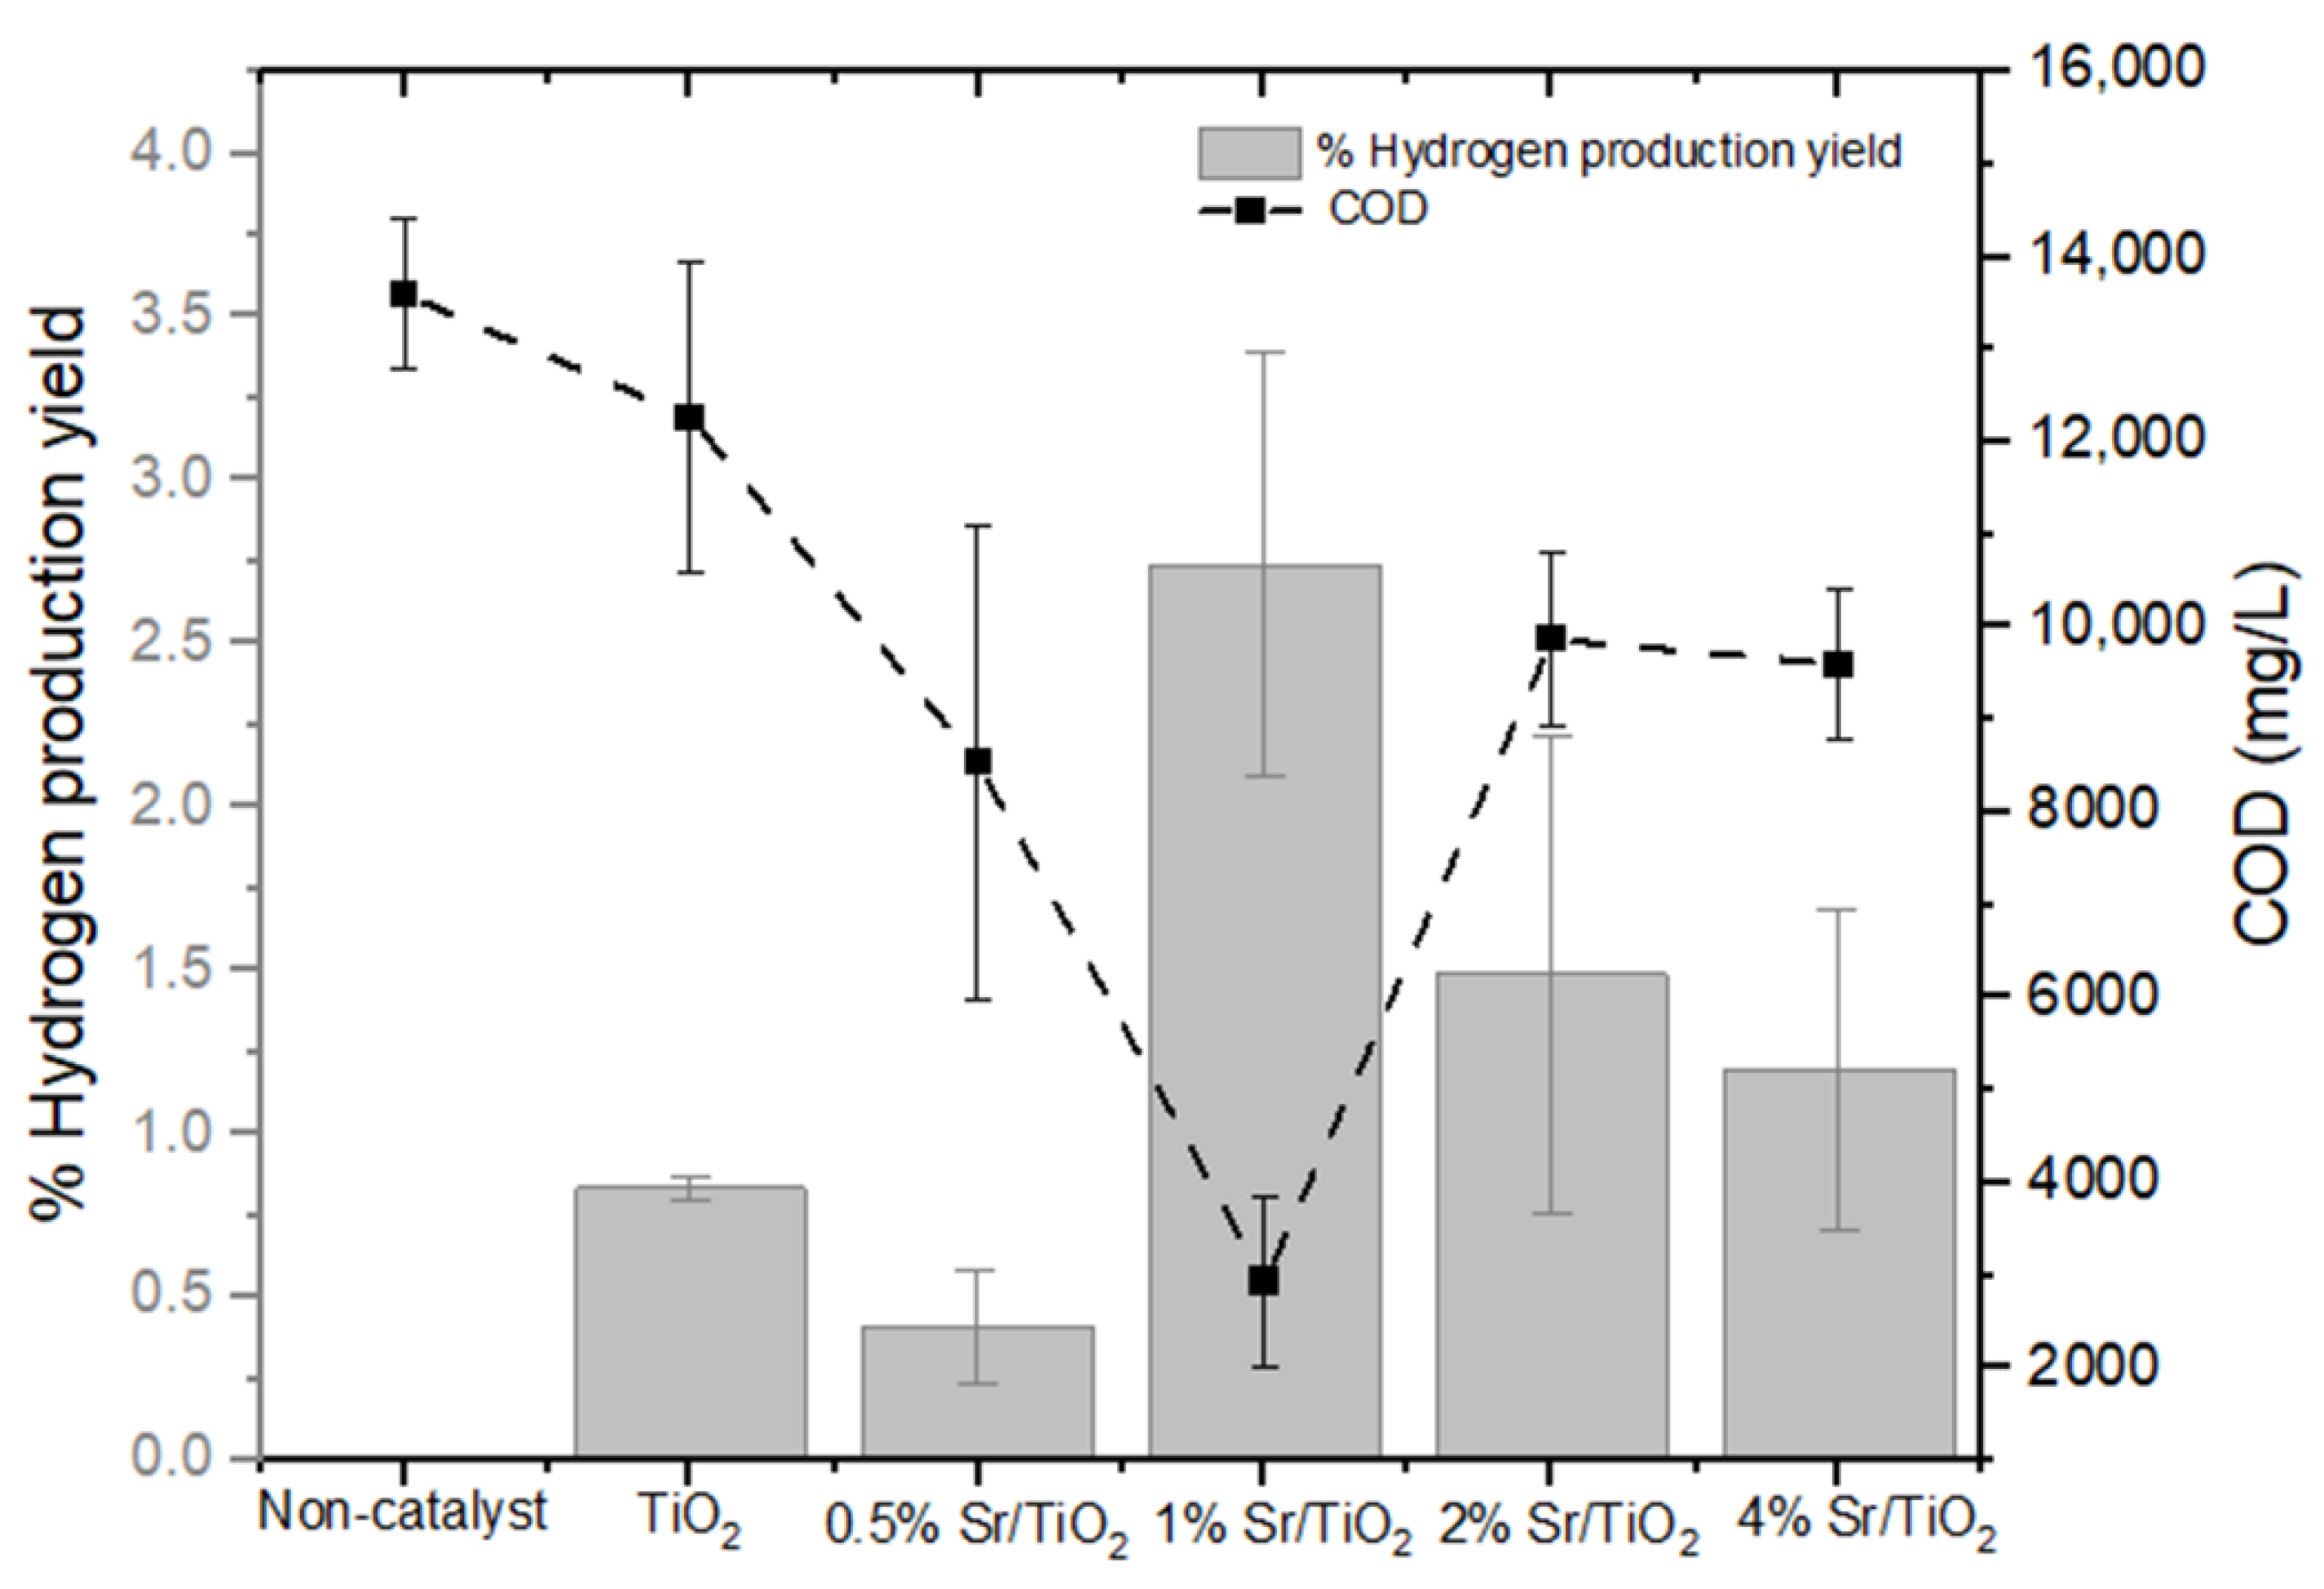
2.2. Photocatalytic Hydrogen Production from Synthetic Urine

To study the photocatalytic activities of Sr-doped TiO2, hydrogen productions from synthetic urine via photocatalysis using TiO2 and Sr-doped TiO2 photocatalysts (at various concentrations of Sr, i.e., 0.5, 1, 2, and 4%) were examined (Figure 4). The system with methanol as an electron donor (hole or OH radical scavengers) under UV-C irradiation (wavelength = 253.7 nm) at a mild temperature was carried out. COD value was analyzed to measure pollutants in wastewater by close reflux and titrimetric method both before and after the photocatalytic process. The pH values of all samples were found to be in the range of pH 5–7.
Without any photocatalyst, no hydrogen was found to be produced from water in urine, while pristine TiO2 achieved an H2 production yield of 0.8%. The yields of hydrogen with 0.5, 1, 2, and 4% Sr-doped TiO2 photocatalysts were found to be 0.4, 2.7, 1.5, and 1.2%, respectively.
The COD value of synthetic urine before the photocatalytic process was 14,400 mg/L and decreased to 13,600 mg/L after the process with pristine TiO2. The reduction in COD indicated a lower number of organics in urine after photocatalysis, so not only the production of hydrogen but also the quality of water increases after the process. In case of Sr-doped TiO2 with various concentrations (0.5, 1, 2, and 4%), the COD values after the photocatalytic process decreased to 5600, 2400, 10,400, and 9600 mg/L, respectively.
It was found that 1% Sr-doped TiO2 presented the highest H2 production yield (2.7%) which is significantly higher than the pristine TiO2 with the lowest COD value (reduction from 14,400 to 2400 mg/L). The result of 1% Sr-doped TiO2 may best describe the properties of Sr-doped TiO2, which can markedly improve the separation of charge carriers (according to PL spectra), resulting in higher photocatalytic efficiency [14].
After the photocatalytic hydrogen production, the photocatalysts as the heterogeneous catalysts were obviously precipitated from the synthetic urine. This showed the potential that the photocatalysts can be regenerated and reused.

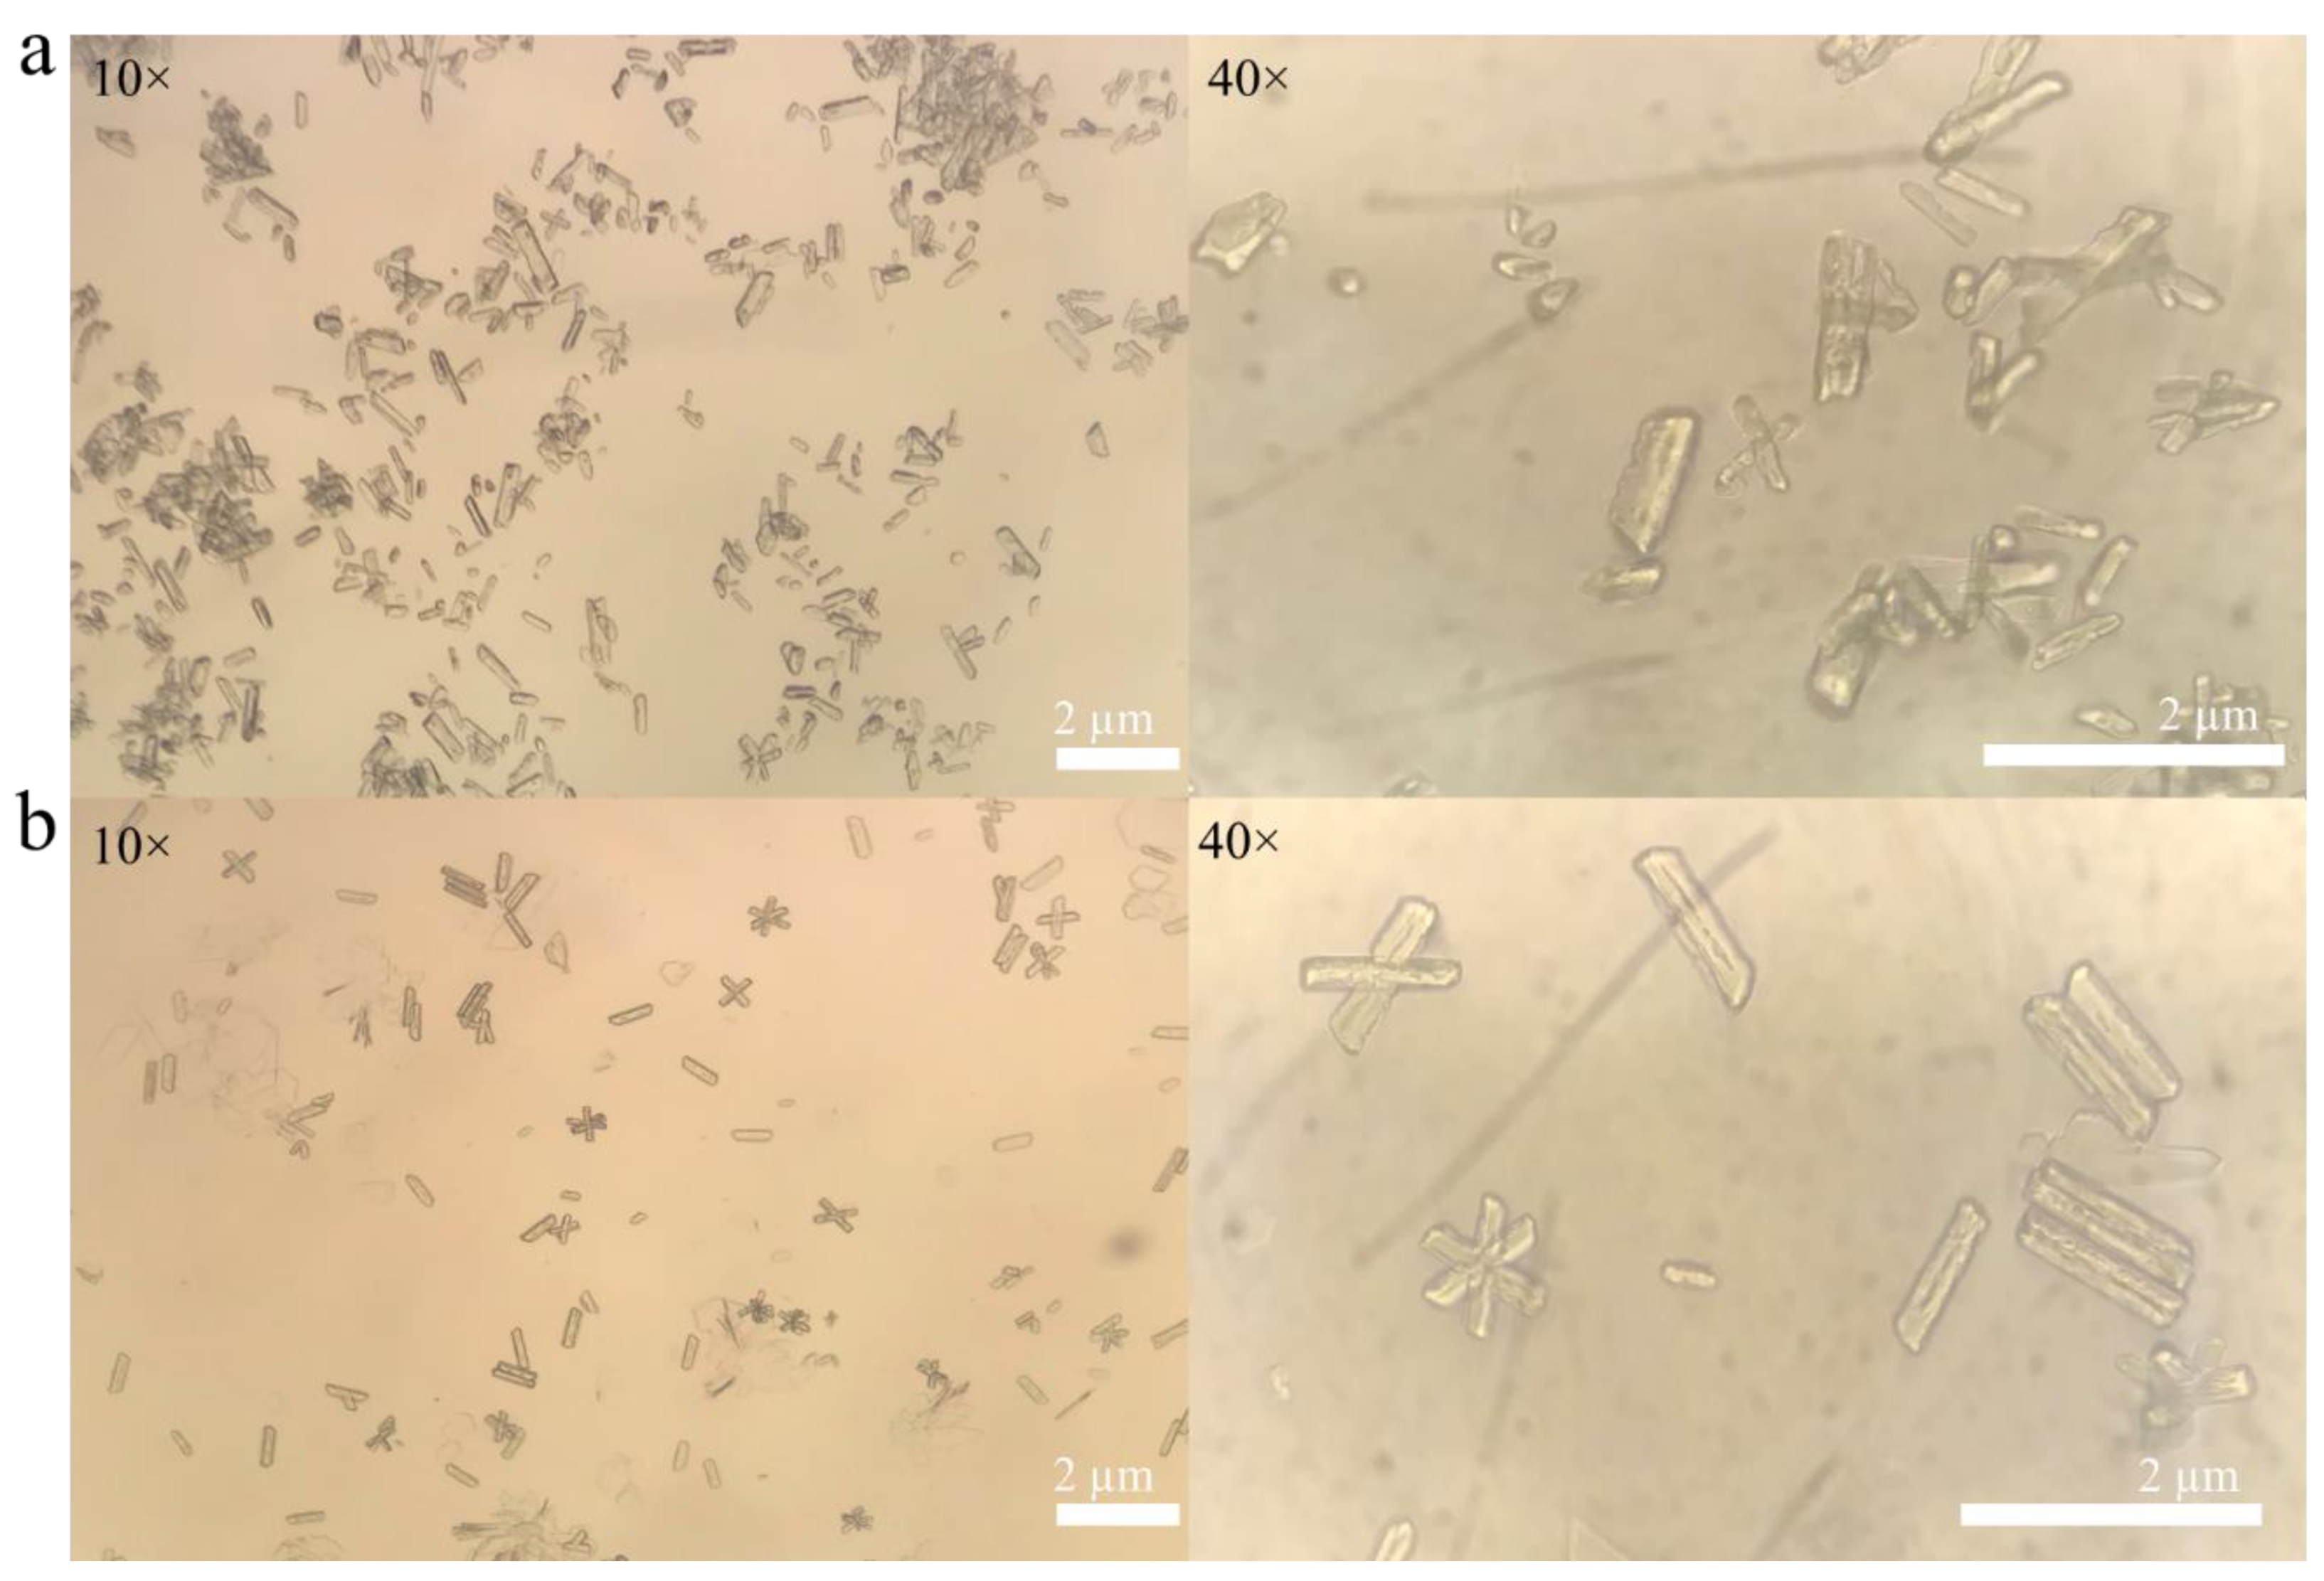
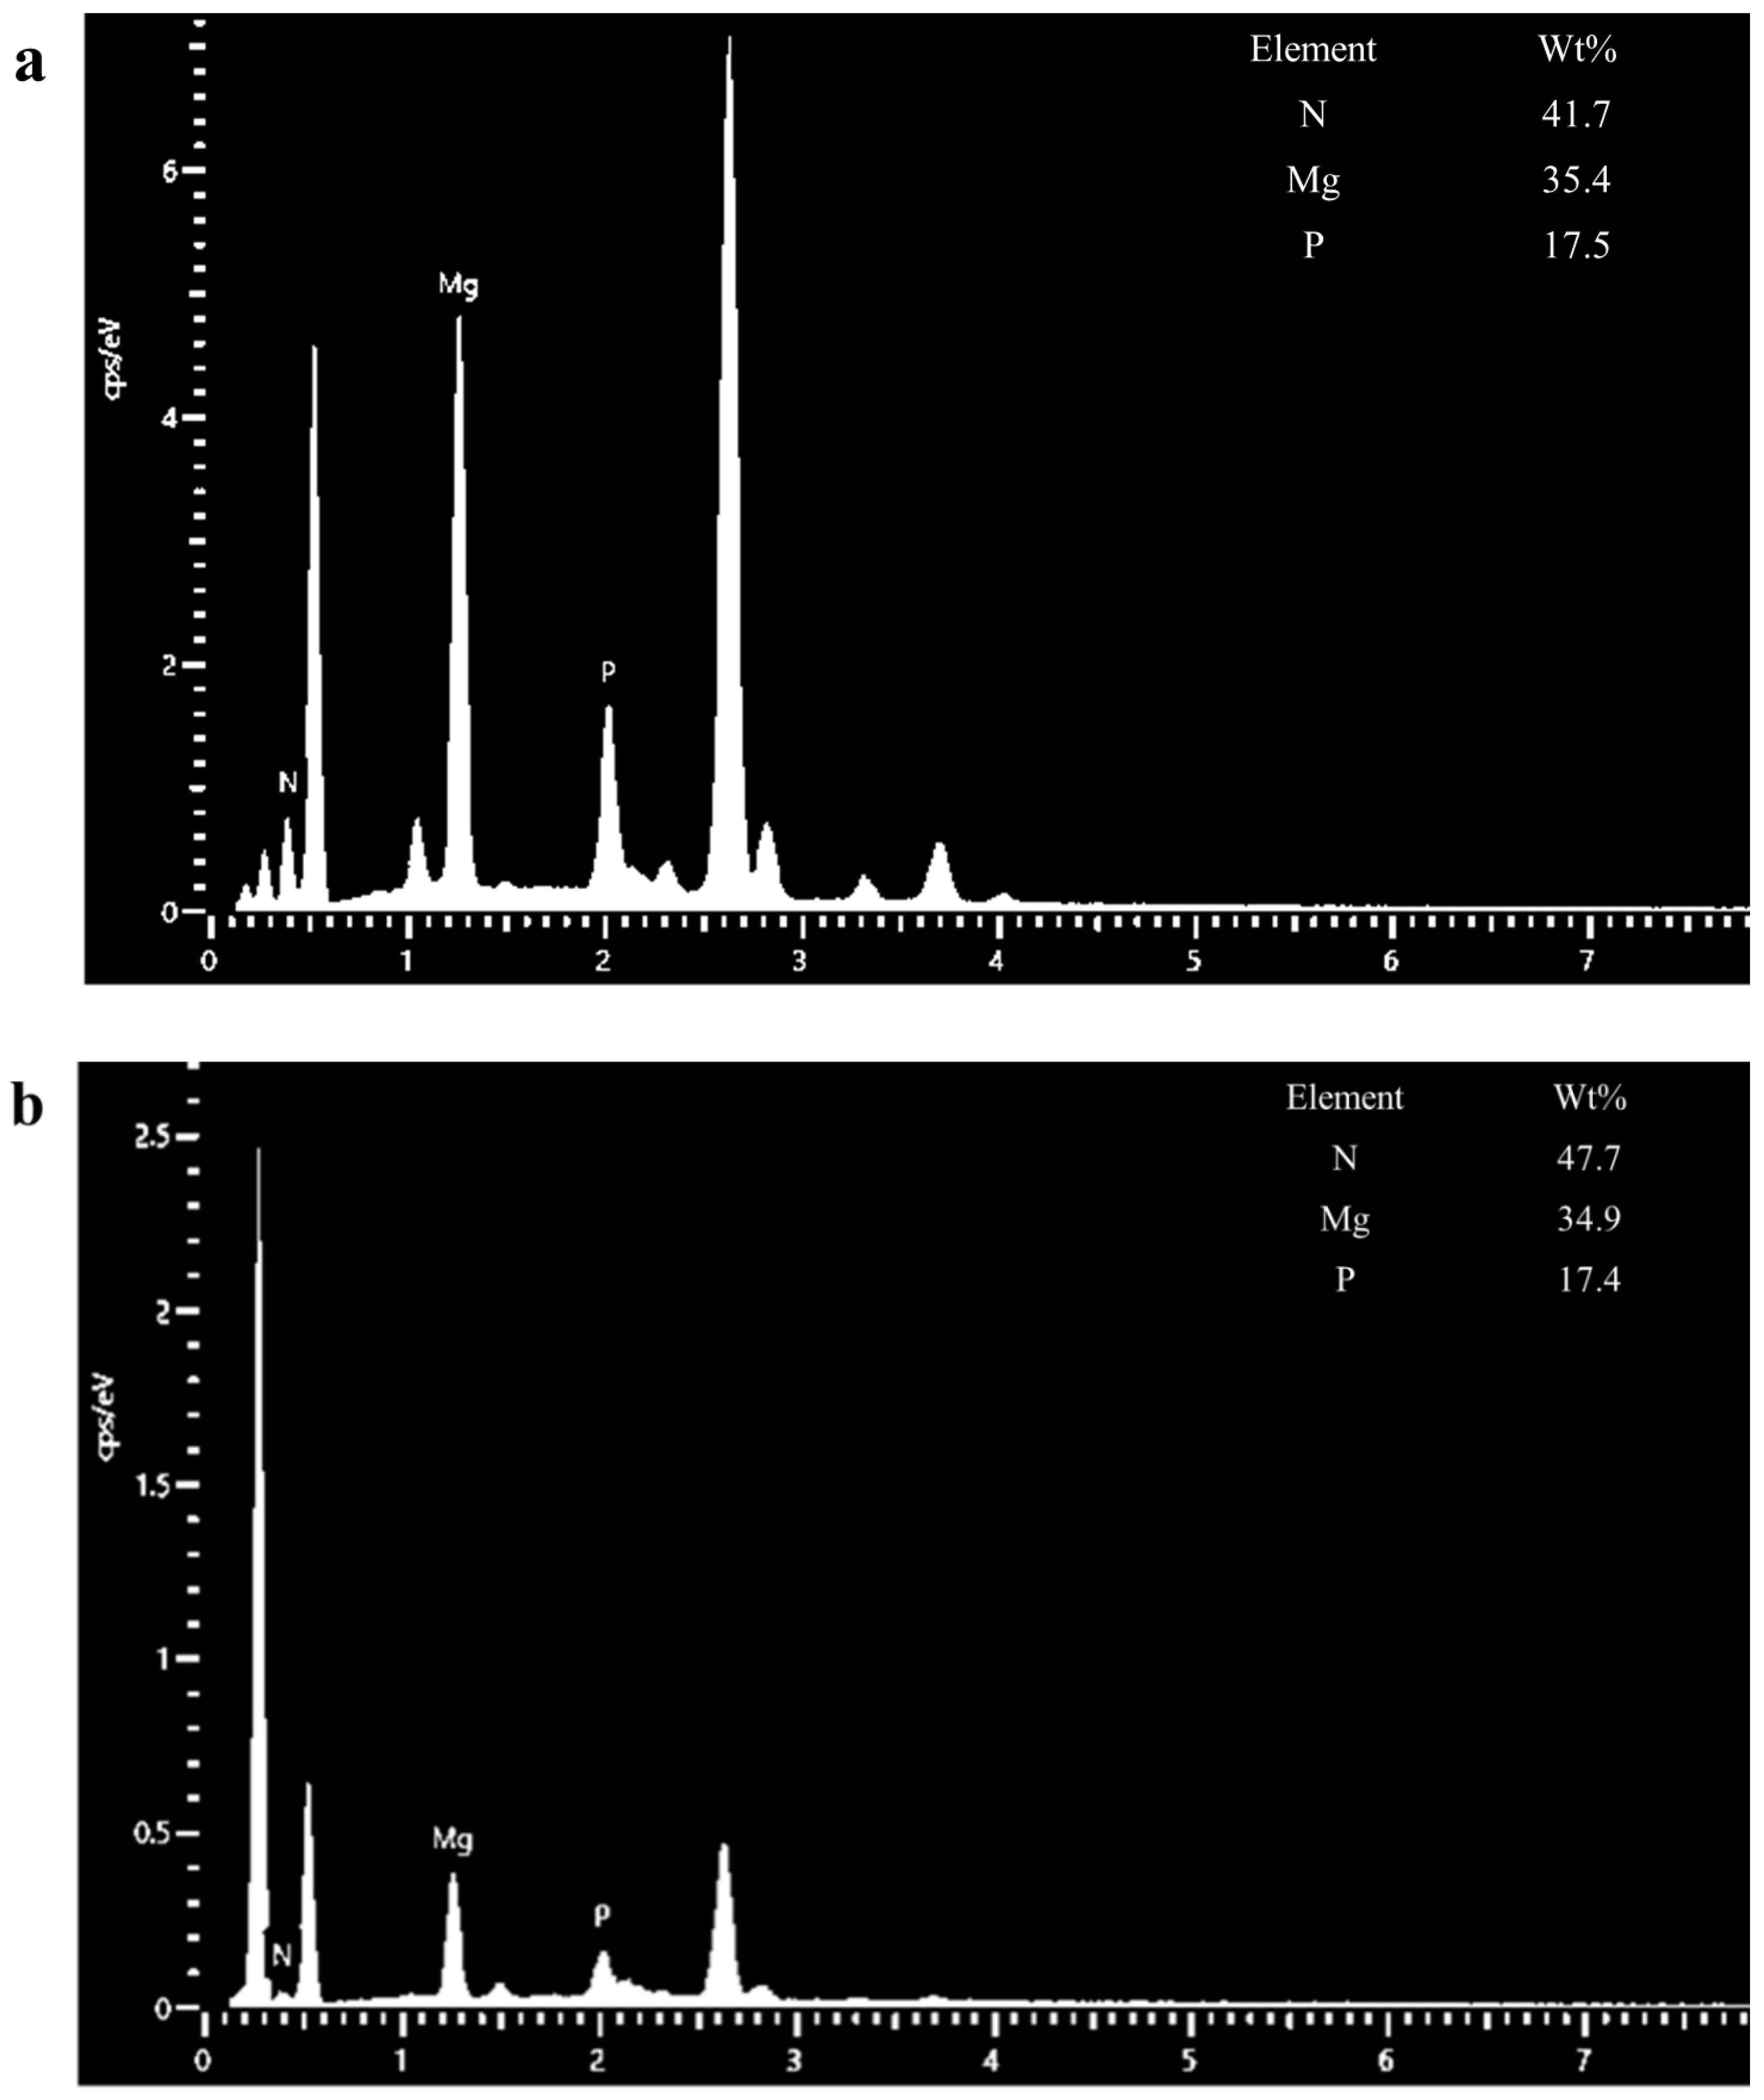
2.3. Struvite Crystallization from Urine

Samples were collected from the prepared synthetic urine and the synthetic urine after the photocatalytic process. The PO4-P concentration was analyzed by the ascorbic acid method before adjusting the pH and adding Mg. Light microscopy was used to study morphology and measure the crystal size of struvite formed from synthetic urine after the photocatalytic process. Figure 5 shows microscopy images of struvite crystals formed from synthetic urines before and after the photocatalytic process using 1% Sr-doped TiO2 photocatalyst. The typical radiating dendrite-like and hexagon-like shapes of the struvite crystals were observed [27]. The diameter of the struvite crystals was around 0.25–0.31 nm. EDS spectra of struvite crystals formed from synthetic urines before and after the photocatalytic process (using 1% Sr-doped TiO2 photocatalyst) are shown in Figure 6. The elements of the MgNH4PO4 (i.e., Mg, N, and P) are observed, confirming the formation of the struvite structure. The result observed confirmed that P recovery via struvite crystallization can be successfully carried out using the synthetic urine after the photocatalytic process as the source.

3. Materials and Methods

3.1. Materials

Titanium (IV) dioxide (TiO2) nanopowder (anatase phase, particle size <25 nm, 99.7% trace metals basis, Aldrich Chemistry (Darmstadt, Germany)) and strontium nitrate (ACS reagent, ≥99.0% (Sr (NO3)2), Sigma-Aldrich (Darmstadt, Germany)) were purchased. Methanol from RCI Labscan (Bangkok, Thailand) was added as an electron donor. N2 (99.995%) was used as the gas during the calcination of photocatalysts. Ar (99.995%) was used as the purge gas in the photocatalytic reactor. H2 (99.99999%) was used as the standard gas in gas chromatography (GC).
The synthetic urine consisted of calcium chloride dihydrate (CaCl2•2H2 O, Carlo Erba Reagents, Val de Reuil, France), magnesium chloride (MgCl2•6H2 O, Carlo Erba Reagents, Val de Reuil, France), sodium chloride (NaCl, Carlo Erba Reagents, Val de Reuil, France), sodium sulfate anhydrous crystals (Na2 SO4, Carlo Erba Reagents, Val de Reuil, France), tri-sodium citrate dehydrate (Na3 citrate•2H2O, Carlo Erba Reagents, Val de Reuil, France), sodium oxalate (Na2 oxalate, ACS reagent, ≥99.5%, Sigma-Aldrich, Darmstadt, Germany), potassium dihydrogen phosphate (KH2 PO4, Carlo Erba Reagents, Val de Reuil, France), potassium chloride (KCl, Carlo Erba Reagents, Val de Reuil, France), ammonium chloride (NH4Cl, Merck, Darmstadt, Germany), urea (NH2 CONH2, Univar, Ajax Finechem, Auckland, New Zealand), and creatinine (C4H7N3O, Sigma-Aldrich, Darmstadt, Germany).
For analysis of common parameters (i.e., orthophosphate (PO4-P) and chemical oxygen demand (COD)), the chemicals used consisted of sulfuric acid (H2 SO4, RCI Labscan, Bangkok, Thailand), antimony potassium tartrate (C4H4KO7Sb•½H2O), Carlo Erba Reagents, Val de Reuil, France), ammonium molybdate ((NH4)6Mo7O24•4H2 O, Carlo Erba Reagents, Val de Reuil, France), l(+) ascorbic acid, Carlo Erba Reagents, Val de Reuil, France), potassium dichromate 99.9% (K2 Cr2 O7) Loba Chemie, Mumbai, India), mercury(II) sulfate (HgSO4, Merck, Darmstadt, Germany), silver sulfate (Ag2 SO4), POCH, Gliwice, Poland), and ammonium ferrous sulfate ((NH4)2 SO4FeSO4•6H2 O), Univar, Ajax Finechem, Auckland, New Zealand).

3.2. Catalyst Preparation and Characterizations

Wetness impregnation was applied to prepare catalysts with a metal ion salt (Sr-doped TiO2). Pristine TiO2 was used as a catalyst host and Sr (NO3)2 was used as the precursor for Sr doping by dissolving in distilled water. Accordingly, the solutions with varying concentrations of Sr (%w/w) as 0.5, 1, 2, and 4% were dropped into the pristine TiO2 powders and stirred on a hotplate. After mixing, the solvent was slowly evaporated in a vacuum oven at 60 °C for 4 h. The samples were dried in an oven at 80 °C overnight and then calcined in a furnace under N2 condition at 400 °C for 4 h.
UV-vis spectroscopy (DRS, V-550 Jasco, Deutschland GmbH, Pfungstadt, Germany) was used to analyze the optical property of catalysts. Tauc plots were carried out to estimate energy bandgaps (Eg) using indirectly allowed transitions (Equation (2)):
αhν = A (Eg)1/2
where α is absorption coefficient, is photon energy, and A is a constant value. Graphs between (αhν)2 and were plotted. An optical energy bandgap was calculated by extrapolating a straight line to intersect the x-axis.
Photoluminescence (PL, FP8600 Jasco, Deutschland GmbH) was used for determining the recombination of charge carriers. The X-ray diffraction analysis (XRD, SmartLab Rigaku, Austin, TX, USA) was used to study the relative crystallinity of Sr-doped TiO2 catalysts to confirm the presence of metal oxide phases in the synthesized nanocatalysts. N2 adsorption (BEL Japan, BELSORP-mini, Osaka, Japan) was used to determine BET surface area. The morphology of microstructure and mapping for local elements of catalysts were analyzed by a field emission scanning electron microscope (FE-SEM, SU8230 Hitachi, Tokyo, Japan) with energy-dispersive X-ray spectroscopy (EDS).

3.3. Synthesis of Urine

In this study, batch experiments were performed using synthetic urine, which was prepared in distilled water according to the composition reported in Table 3 [28,29]. The pH of the obtained urine was 5.8.

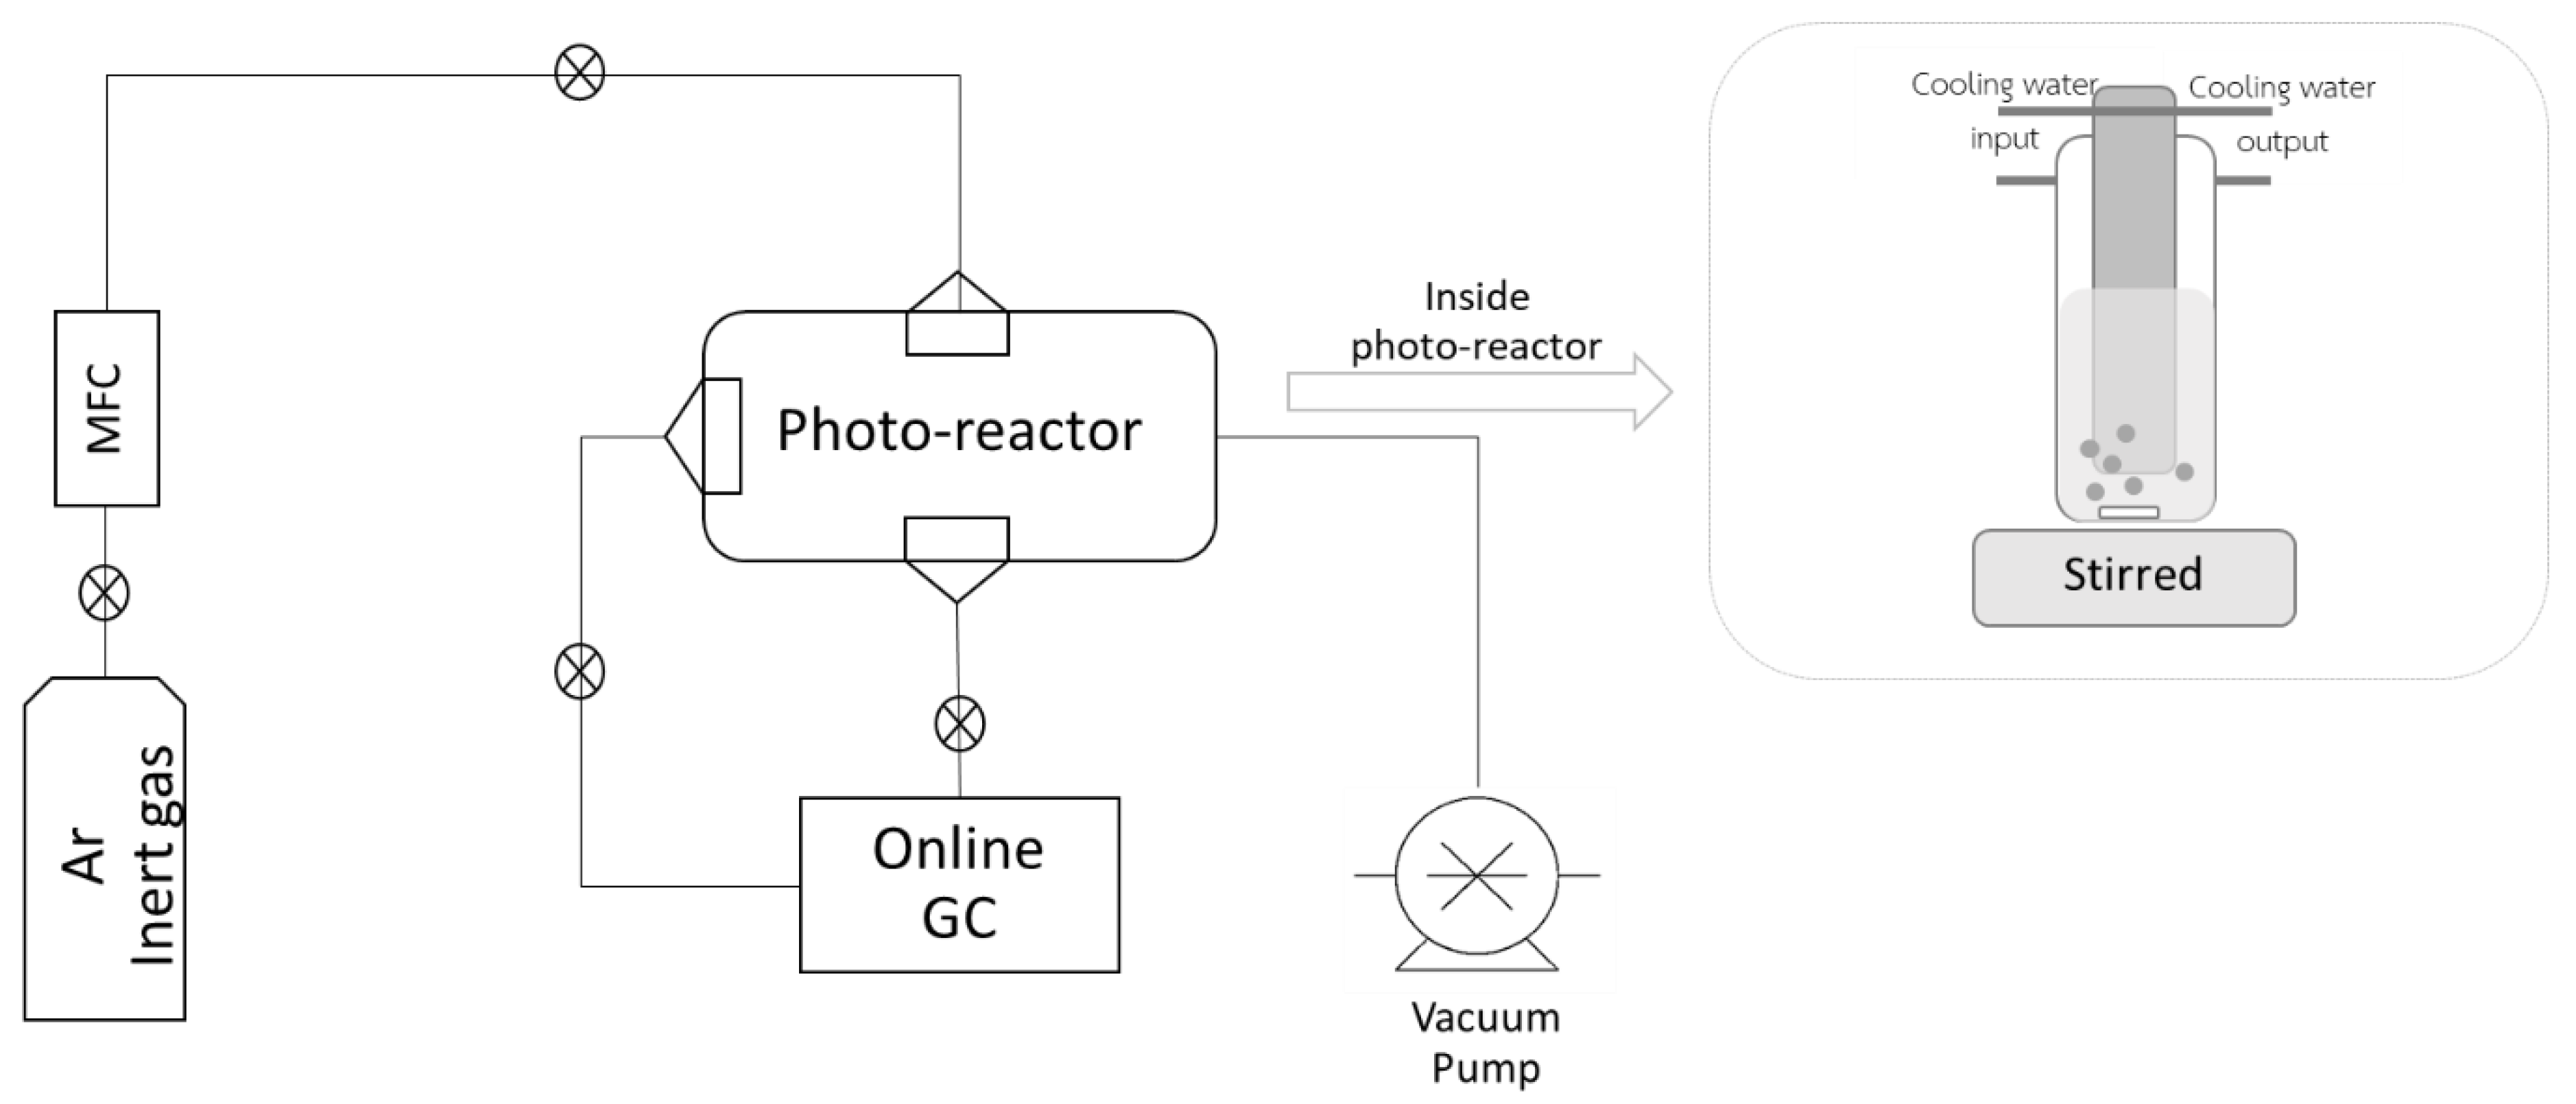
3.4. Photocatalytic Hydrogen Production

An experimental system for photocatalytic hydrogen production consisted of a photoreactor made from Pyrex glass as shown in Figure 7. The sample volume in the reactor was 600 mL. The reactor height and inner diameters were 30.0 cm and 7.0 cm, respectively. A Phillips TUV PL-S mercury lamp was used as a UV-C light source (λ =253.7 nm) with a power supply of 54W. A vacuum pump was installed to control the cooling water flow inside the photoreactor and maintain the reaction temperature. A gas chromatograph (GC) was connected with the photoreactor for the analysis of hydrogen gas.
The catalyst powders were suspended in the urine solution and mixed with methanol in the catalyst: urine: methanol ratio of 1:1000:100 [30]. The mixed sample was continuously stirred for a reaction time of 6 h. Ar was purged for 30 min prior to irradiation to remove dissolved oxygen. After 6 h of irradiation time, hydrogen gas was sampled from the headspace of the photoreactor. The amount of hydrogen gas was analyzed using an online GC (Shimadzu GC-2014, Kyoto, Japan) with both thermal conductivity (TCD) and flame ionization (FID) detectors, and a molecular sieve column. The photocatalytic hydrogen production activity was presented in terms of H2 yields. The calculations were defined as Equations (3)–(5).
NH4COONH2 (aq) ←→ 2NH2 (g) + CO2 (g)
2NH3(g) + CO2 (g) → N2 + 3H2 + CO2
H2 yield (%) = (Actual yield (mol of H2)/Theoretical yield (mol of H2)) × 100
Finally, liquid samples were filtered using a 0.46-µm PTFE syringe filter (VWR, Amsterdam, Netherlands) to remove Sr-doped TiO2 catalyst particles prior to the analysis. The common parameters (e.g., COD and pH) of the synthetic urine were measured before and after the photocatalytic process.

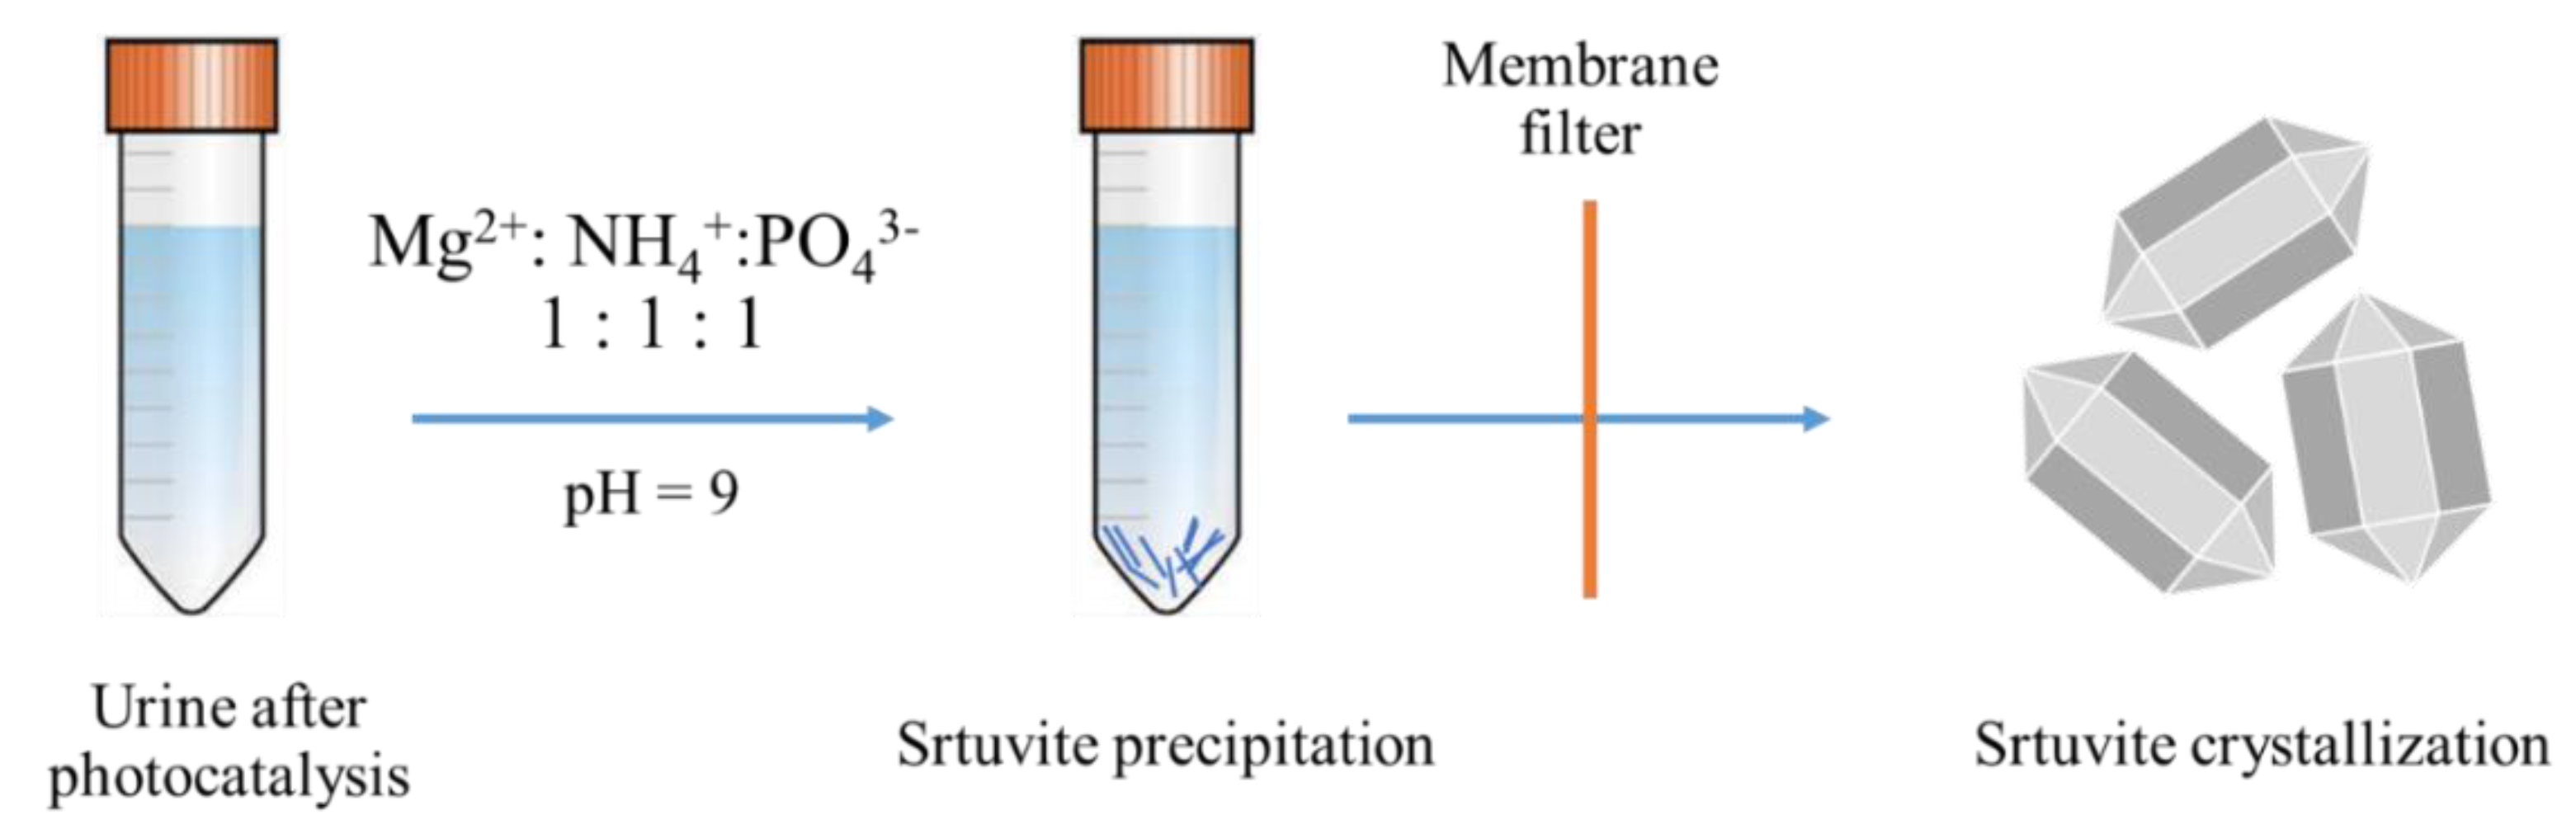
3.5. Struvite Crystallization

Liquid samples of synthetic urine after the photocatalytic process were collected for struvite precipitation (Figure 8). The suitable pH conditions for struvite crystallization are 7.5–9.0 [31]. Therefore, pH 9 was selected for this experiment. NaOH (15%) was added to the sample solution for the increase in pH value [32]. MgCl2 was added as an Mg source to the solution for adjustment of the molar ratio of Mg:P of 1:1 [29]. Struvite crystals were spontaneously precipitated. The samples were collected and characterized using a light microscope (Nikon Eclipse E200, Tokyo, Japan) and FE-SEM (SU5000 Hitachi, Tokyo, Japan) for the determination of morphologies and structures of the struvite crystals from the synthetic urine. Before morphology characterization, the samples were filtered by a Pall Supor®-450 (0.45 μm) membrane filter and dried in an oven at 105 °C for 1 h [29].

4. Conclusions

TiO2 photocatalyst modified with an alkaline earth metal ion (i.e., Sr2+) has been synthesized. Prepared Sr-doped photocatalysts were found to have great light absorption, great crystallinity, and quenched PL spectra. Photocatalytic hydrogen production from synthetic urine was carried out. From various doping contents of Sr in TiO2 (0.5, 1, 2, and 4%), it was found that 1% Sr-doped TiO2 presented the highest H2 production yield, which was significantly higher than the pristine TiO2 with the lowest COD value, implying a marked improvement in the separation of charge carriers (according to PL spectra). This suggests that the successfully doped photocatalyst can utilize light for the conversion of water in urine wastewater to hydrogen while also degrading the organic compounds in the wastewater. Moreover, the treated synthetic wastewater can be subsequently used as a resource for phosphorus recovery via the struvite crystallization process.

Author Contributions

Conceptualization—S.C.; Experiments and writing of the original manuscript—O.S.; Analysis and discussion of the characterization results—O.S., P.K., and S.C.; Supervision—S.C.; Manuscript corrections—O.S., P.K., N.L., and S.C. All authors have read and agreed to the published version of the manuscript.

Funding

Japan Science and Technology Agency (JST) (Collaboration Hubs for International Research Program (CHIRP) within the framework of the Strategic International Collaborative Research Program (SICORP)), and Research Strengthening Project of the Faculty of Engineering with Faculty of Science (King Mongkut′s University of Technology Thonburi) partly supported this work.

Acknowledgments

The authors wish to thank the National Center for Genetic Engineering and Biotechnology at National Science and Technology Development Agency (NSTDA) and the Graduate School of Energy Science, Kyoto University, for providing characterization instruments. O.S. would like to acknowledge The Joint Graduate School of Energy and Environment (JGSEE) and the Center for Energy Technology and Environment for her academic and financial supports.

Conflicts of Interest

The authors declare no conflict of interest.

References

  1. National Research Council. Use of Reclaimed Water and Sludge in Food Crop Production; The National Academies Press: Washington, DC, USA, 1996; p. 192. [Google Scholar]
  2. Boggs, B.K.; King, R.L.; Botte, G.G. Urea electrolysis: Direct hydrogen production from urine. Chem. Commun. 2009, 32, 4859–4861. [Google Scholar] [CrossRef]
  3. Corcoran, J.; Winter, M.J.; Tyler, C.R. Pharmaceuticals in the Aquatic Environment: A Critical Review of the Evidence for Health Effects in Fish. Crit. Rev. Toxicol. 2010, 40, 287–304. [Google Scholar] [CrossRef]
  4. Adetule, O.O.; Moreyibi, O.H.; Ogun, A.A.; Odeshi, T.A. Human Urine Utilization: A Waste Management Strategy. In Proceedings of the 2008 AIChE Annual Meeting, Philadelphia, PA, USA, 16–21 November 2008. [Google Scholar]
  5. Henze, M.; van Loosdrecht, M.C.; Ekama, G.A.; Brdjanovic, D. Biological Wastewater Treatment; IWA Publishing: London, UK, 2008. [Google Scholar]
  6. Yogeswari, M.K.; Dharmalingam, K.; Ronald Ross, P.; Mullai, P. Role of Iron Concentration on Hydrogen Production Using Confectionery Wastewater. J. Environ. Eng. 2016, 142, C4015017. [Google Scholar] [CrossRef]
  7. Winter, C.J. Into the hydrogen energy economy—Milestones. Int. J. Hydrogen Energy 2005, 30, 681–685. [Google Scholar] [CrossRef]
  8. Cargnello, M.; Gasparotto, A.; Gombac, V.; Montini, T.; Barreca, D.; Fornasiero, P. Photocatalytic H2 and Added-Value By-Products—The Role of Metal Oxide Systems in Their Synthesis from Oxygenates. Eur. J. Inorg. Chem. 2011, 28, 4309–4323. [Google Scholar] [CrossRef]
  9. Hashimoto, K.; Irie, H.; Fujishima, A. TiO2 photocatalysis: A historical overview and future prospects. Jpn. J. Appl. Phys. 2005, 44, 8269. [Google Scholar] [CrossRef]
  10. Herrmann, J.M. Heterogeneous photocatalysis: Fundamentals and applications to the removal of various types of aqueous pollutants. Catal. Today 1999, 53, 115–129. [Google Scholar] [CrossRef]
  11. Gupta, S.M.; Tripathi, M. A review of TiO2 nanoparticles. Chin. Sci. Bull. 2011, 56, 1639. [Google Scholar] [CrossRef] [Green Version]
  12. Payormhorm, J.; Chuangchote, S.; Laosiripojana, N. CTAB-assisted Sol-microwave Method for Fast Synthesis of Mesoporous TiO2 Photocatalysts for Photocatalytic Conversion of Glucose to Value-added Sugars. Mater. Res. Bull. 2017, 95, 546–555. [Google Scholar] [CrossRef]
  13. Zhao, W.; Ma, W.; Chen, C.; Zhao, J.; Shuai, Z. Efficient Degradation of Toxic Organic Pollutants with Ni2O3/TiO2-xBx under Visible Irradiation. J. Am. Chem. Soc. 2004, 126, 4782–4783. [Google Scholar] [CrossRef]
  14. Sood, S.; Umar, A.; Mehta, S.K.; Sinha, A.S.K.; Kansal, S.K. Efficient photocatalytic degradation of brilliant green using Sr-doped TiO2 nanoparticles. Ceram. Int. 2015, 41, 3533–3540. [Google Scholar] [CrossRef]
  15. Naraginti, S.; Thejaswini, T.V.L.; Prabhakaran, D.; Sivakumar, A.; Satyanarayana, V.S.V.; Prasad, A.A. Enhanced photo-catalytic activity of Sr and Ag co-doped TiO2 nanoparticles for the degradation of Direct Green-6 and Reactive Blue-160 under UV & visible light. Spectrochim. Acta Part A Mol. Biomol. Spectrosc. 2015, 149, 571–579. [Google Scholar]
  16. Smit, A.L.; Bindraban, P.S.; Schröder, J.J.; Conijn, J.G.; Van der Meer, H.G. Phosphorus in Agriculture: Global Resources, Trends and Developments: Report to the Steering Committee Technology Assessment of the Ministery of Agriculture, Nature and Food Quality, The Netherlands, and in Collaboration with the Nutrient Flow Task Group (NFTG), Supported by DPRN (Development Policy Review Network); Plant Research International: Wageningen, The Netherlands, 2009. [Google Scholar]
  17. Daneshgar, S.; Callegari, A.; Capodaglio, A.G.; Vaccari, D. The Potential Phosphorus Crisis: Resource Conservation and Possible Escape Technologies: A Review. Resources 2018, 7, 37. [Google Scholar] [CrossRef] [Green Version]
  18. Ye, Y.; Ngo, H.H.; Guo, W.; Liu, Y.; Li, J.; Liu, Y.; Zhang, X.; Jia, H. Insight into chemical phosphate recovery from municipal wastewater. Sci. Total. Environ. 2017, 576, 159–171. [Google Scholar] [CrossRef] [PubMed]
  19. Wilsenach, J.A.; Schuurbiers, C.A.H.; Van Loosdrecht, M.C.M. Phosphate and potassium recovery from source separated urine through struvite precipitation. Water Res. 2007, 41, 458–466. [Google Scholar] [CrossRef] [PubMed]
  20. Doyle, J.D.; Parsons, S.A. Struvite formation, control and recovery. Water Res. 2002, 36, 3925–3940. [Google Scholar] [CrossRef]
  21. Karunanithi, R.; Szogi, A.; Bolan, N.S.; Naidu, R.; Ok, Y.S.; Krishnamurthy, S.; Seshadri, B. Chapter 27—Phosphorus Recovery From Wastes. In Environmental Materials and Waste; Prasad, M.N.V., Shih, K., Eds.; Academic Press: San Diego, CA, USA, 2016; pp. 687–705. [Google Scholar]
  22. Tauc, J. Optical Properties of Amorphous Semiconductors. In Amorphous and Liquid Semiconductors; Tauc, J., Ed.; Springer: Boston, MA, USA, 1974; pp. 159–220. [Google Scholar]
  23. Bakhshayesh, A.M.; Bakhshayesh, N. Enhanced short circuit current density of dye-sensitized solar cells aided by Sr,V co-doped TiO2 particles. Mater. Sci. Semicond. Process. 2016, 41, 92–101. [Google Scholar] [CrossRef]
  24. Li, Y.; Peng, S.; Jiang, F.; Lu, G.; Li, S. Effect of doping TiO2 with alkaline-earth metal ions on its photocatalytic activity. J. Serb. Chem. Soc. 2007, 72, 393–402. [Google Scholar] [CrossRef]
  25. Scherrer, P. Determination of the size and internal structure of colloidal particles using X-rays. Nachr. Ges. Wiss. Göttingen 1918, 2, 98–100. [Google Scholar]
  26. Mehnane, H.F.; Wang, C.; Kondamareddy, K.K.; Yu, W.; Sun, W.; Liu, H.; Bai, S.; Liu, W.; Guo, S.; Zhao, X. Hydrothermal synthesis of TiO2 nanoparticles doped with trace amounts of strontium, and their application as working electrodes for dye sensitized solar cells: Tunable electrical properties & enhanced photo-conversion performance. R. Soc. Chem. Adv. 2017, 7, 2358–2364. [Google Scholar]
  27. Kemacheevakul, P.; Chuangchote, S.; Otani, S.; Matsuda, T.; Shimizu, Y. Effect of magnesium dose on amount of pharmaceuticals in struvite recovered from urine. Water Sci. Technol. 2015, 72, 1102–1110. [Google Scholar] [CrossRef] [Green Version]
  28. Griffith, D.P.; Musher, D.M.; Itin, C. Urease. The primary cause of infection-induced urinary stones. Investig. Urol. 1976, 13, 346–350. [Google Scholar]
  29. Kemacheevakul, P.; Chuangchote, S.; Otani, S.; Matsuda, T.; Shimizu, Y. Phosphorus recovery: Minimization of amount of pharmaceuticals and improvement of purity in struvite recovered from hydrolysed urine. Environ. Technol. 2014, 35, 3011–3019. [Google Scholar] [CrossRef] [PubMed]
  30. Chuangchote, S.; Jitputti, J.; Sagawa, T.; Yoshikawa, S. Photocatalytic Activity for Hydrogen Evolution of Electrospun TiO2 Nanofibers. ACS Appl. Mater. Interfaces 2009, 1, 1140–1143. [Google Scholar] [CrossRef] [PubMed]
  31. Hao, X.D.; Wang, C.C.; Lan, L.; Van Loosdrecht, M.C.M. Struvite formation, analytical methods and effects of pH and Ca2 +. Water Sci. Technol. 2008, 58, 1687–1692. [Google Scholar] [CrossRef]
  32. Buchanan, J.R.; Mote, C.R.; Robinson, R.B. Thermodynamics of Struvite Formation. Trans. Am. Soc. Assoc. Exec. 1994, 37, 617–621. [Google Scholar] [CrossRef]
Figure 1. (a) UV-vis absorption spectra; (b) Tauc plots from UV-vis absorption spectra of TiO2 and Sr-doped TiO2; and (c) PL spectra of TiO2 and Sr-doped TiO2 photocatalysts (excitation wavelength = 320 nm).
Catalysts 11 01012 g001
Figure 2. (a) XRD patterns of pristine TiO2 and Sr-doped TiO2 photocatalysts compared with (b) JCPDS reference patterns of anatase, rutile, Sr, SrO, and SrTiO3.
Catalysts 11 01012 g002
Figure 3. FE-SEM images at low (left side) and high (right side) magnifications of (a) 0.5% Sr-doped TiO2; (b) 1% Sr-doped TiO2; (c) 2% Sr-doped TiO2; (d) 4% Sr-doped TiO2.
Catalysts 11 01012 g003
Figure 4. Hydrogen productions from synthetic urine via photocatalysis using TiO2 and Sr-doped TiO2 photocatalysts (at various concentrations of Sr) with COD of the urine after the photocatalytic process.
Catalysts 11 01012 g004
Figure 5. Microscopy images (at 10 × and 40 × magnifications) of struvite crystals formed from synthetic urines (a) before and (b) after the photocatalytic process (using 1% Sr-doped TiO2 photocatalyst).
Catalysts 11 01012 g005
Figure 6. EDS spectra of struvite crystals formed from synthetic urines (a) before and (b) after the photocatalytic process (using 1% Sr-doped TiO2 photocatalyst).
Catalysts 11 01012 g006
Figure 7. The schematic diagram of the experimental photoreactor.
Catalysts 11 01012 g007
Figure 8. Image of struvite crystallization.
Catalysts 11 01012 g008
Table 1. Energy bandgaps and anatase (101) 2θ of XRD peaks of TiO2 and Sr-doped TiO2 photocatalysts.
PhotocatalystEnergy Bandgap (eV)Anatase (101) 2θ (Degree)
TiO2 (P25)3.2925.42
0.5% Sr/TiO23.1125.50
1% Sr/TiO23.1125.52
2% Sr/TiO23.1125.47
4% Sr/TiO23.1425.34
Table 2. Elemental composition of Sr detected from EDS analysis of Sr-doped TiO2 photocatalysts.
CatalystElemental Composition of Sr (%)
0.5% Sr/TiO20.9 ± 0.2
1% Sr/TiO21.0 ± 0.1
2% Sr/TiO21.9 ± 0.2
4% Sr/TiO23.8 ± 0.0
Table 3. Compositions of synthetic urine.
CompoundConcentration
g/Lmmol/L
CaCl2·2H2O0.65Ca: 4.3
MgCl2·6H2O0.651Mg: 3.2
NaCl4.6-
Na2SO42.3SO4: 1.6
Na3 citrate·2H2O0.65Citrate: 2.3
Na2 oxalate0.020Oxalate: 0.149
KH2PO42.8PO4: 20.5
KCl1.6-
NH4Cl1NH4: 19
HH2CONH2 (Urea)25-
C4H7N3O (Creatinine)1.1-
Publisher’s Note: MDPI stays neutral with regard to jurisdictional claims in published maps and institutional affiliations.

