
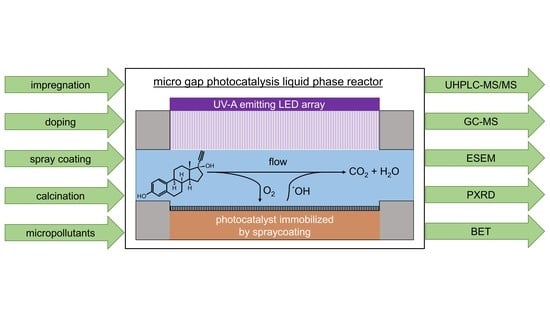
Development of a Novel Microgap Reactor System for the Photocatalytic Degradation of Micropollutants from Aqueous Solutions with TiO2-Based Photocatalysts Immobilized by Spray Coating


Abstract
:
1. Introduction
2. Results
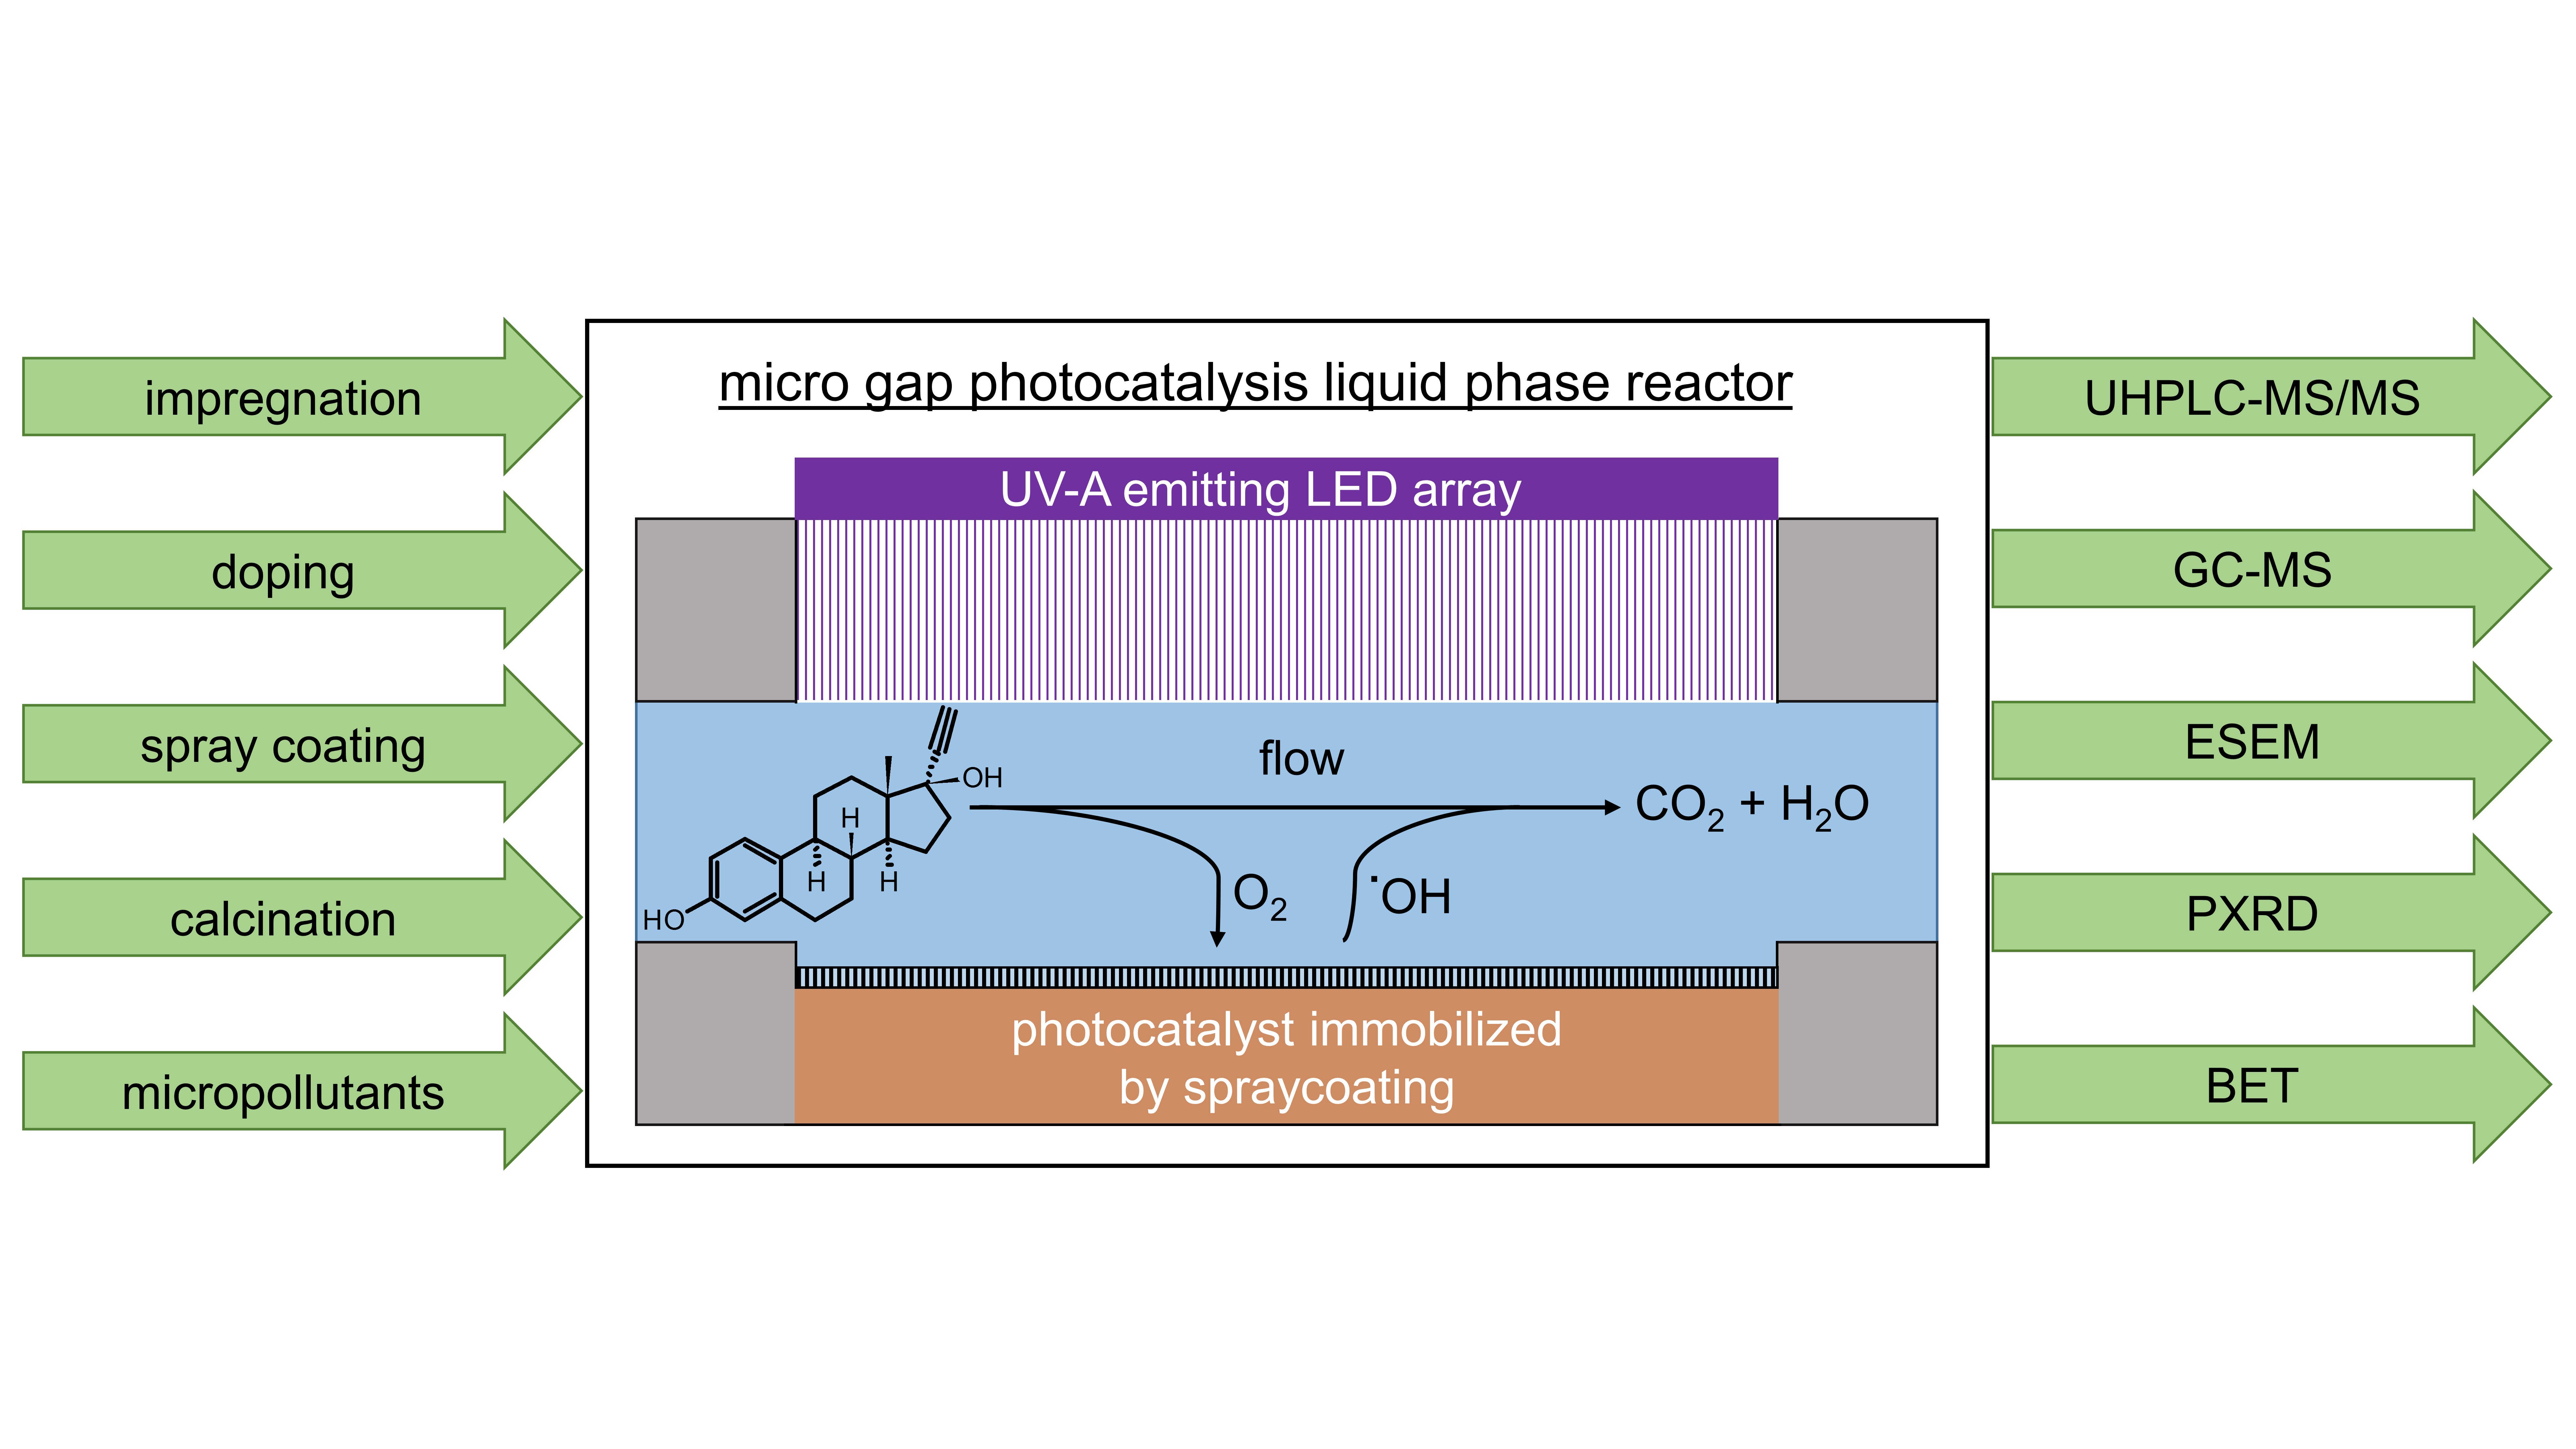
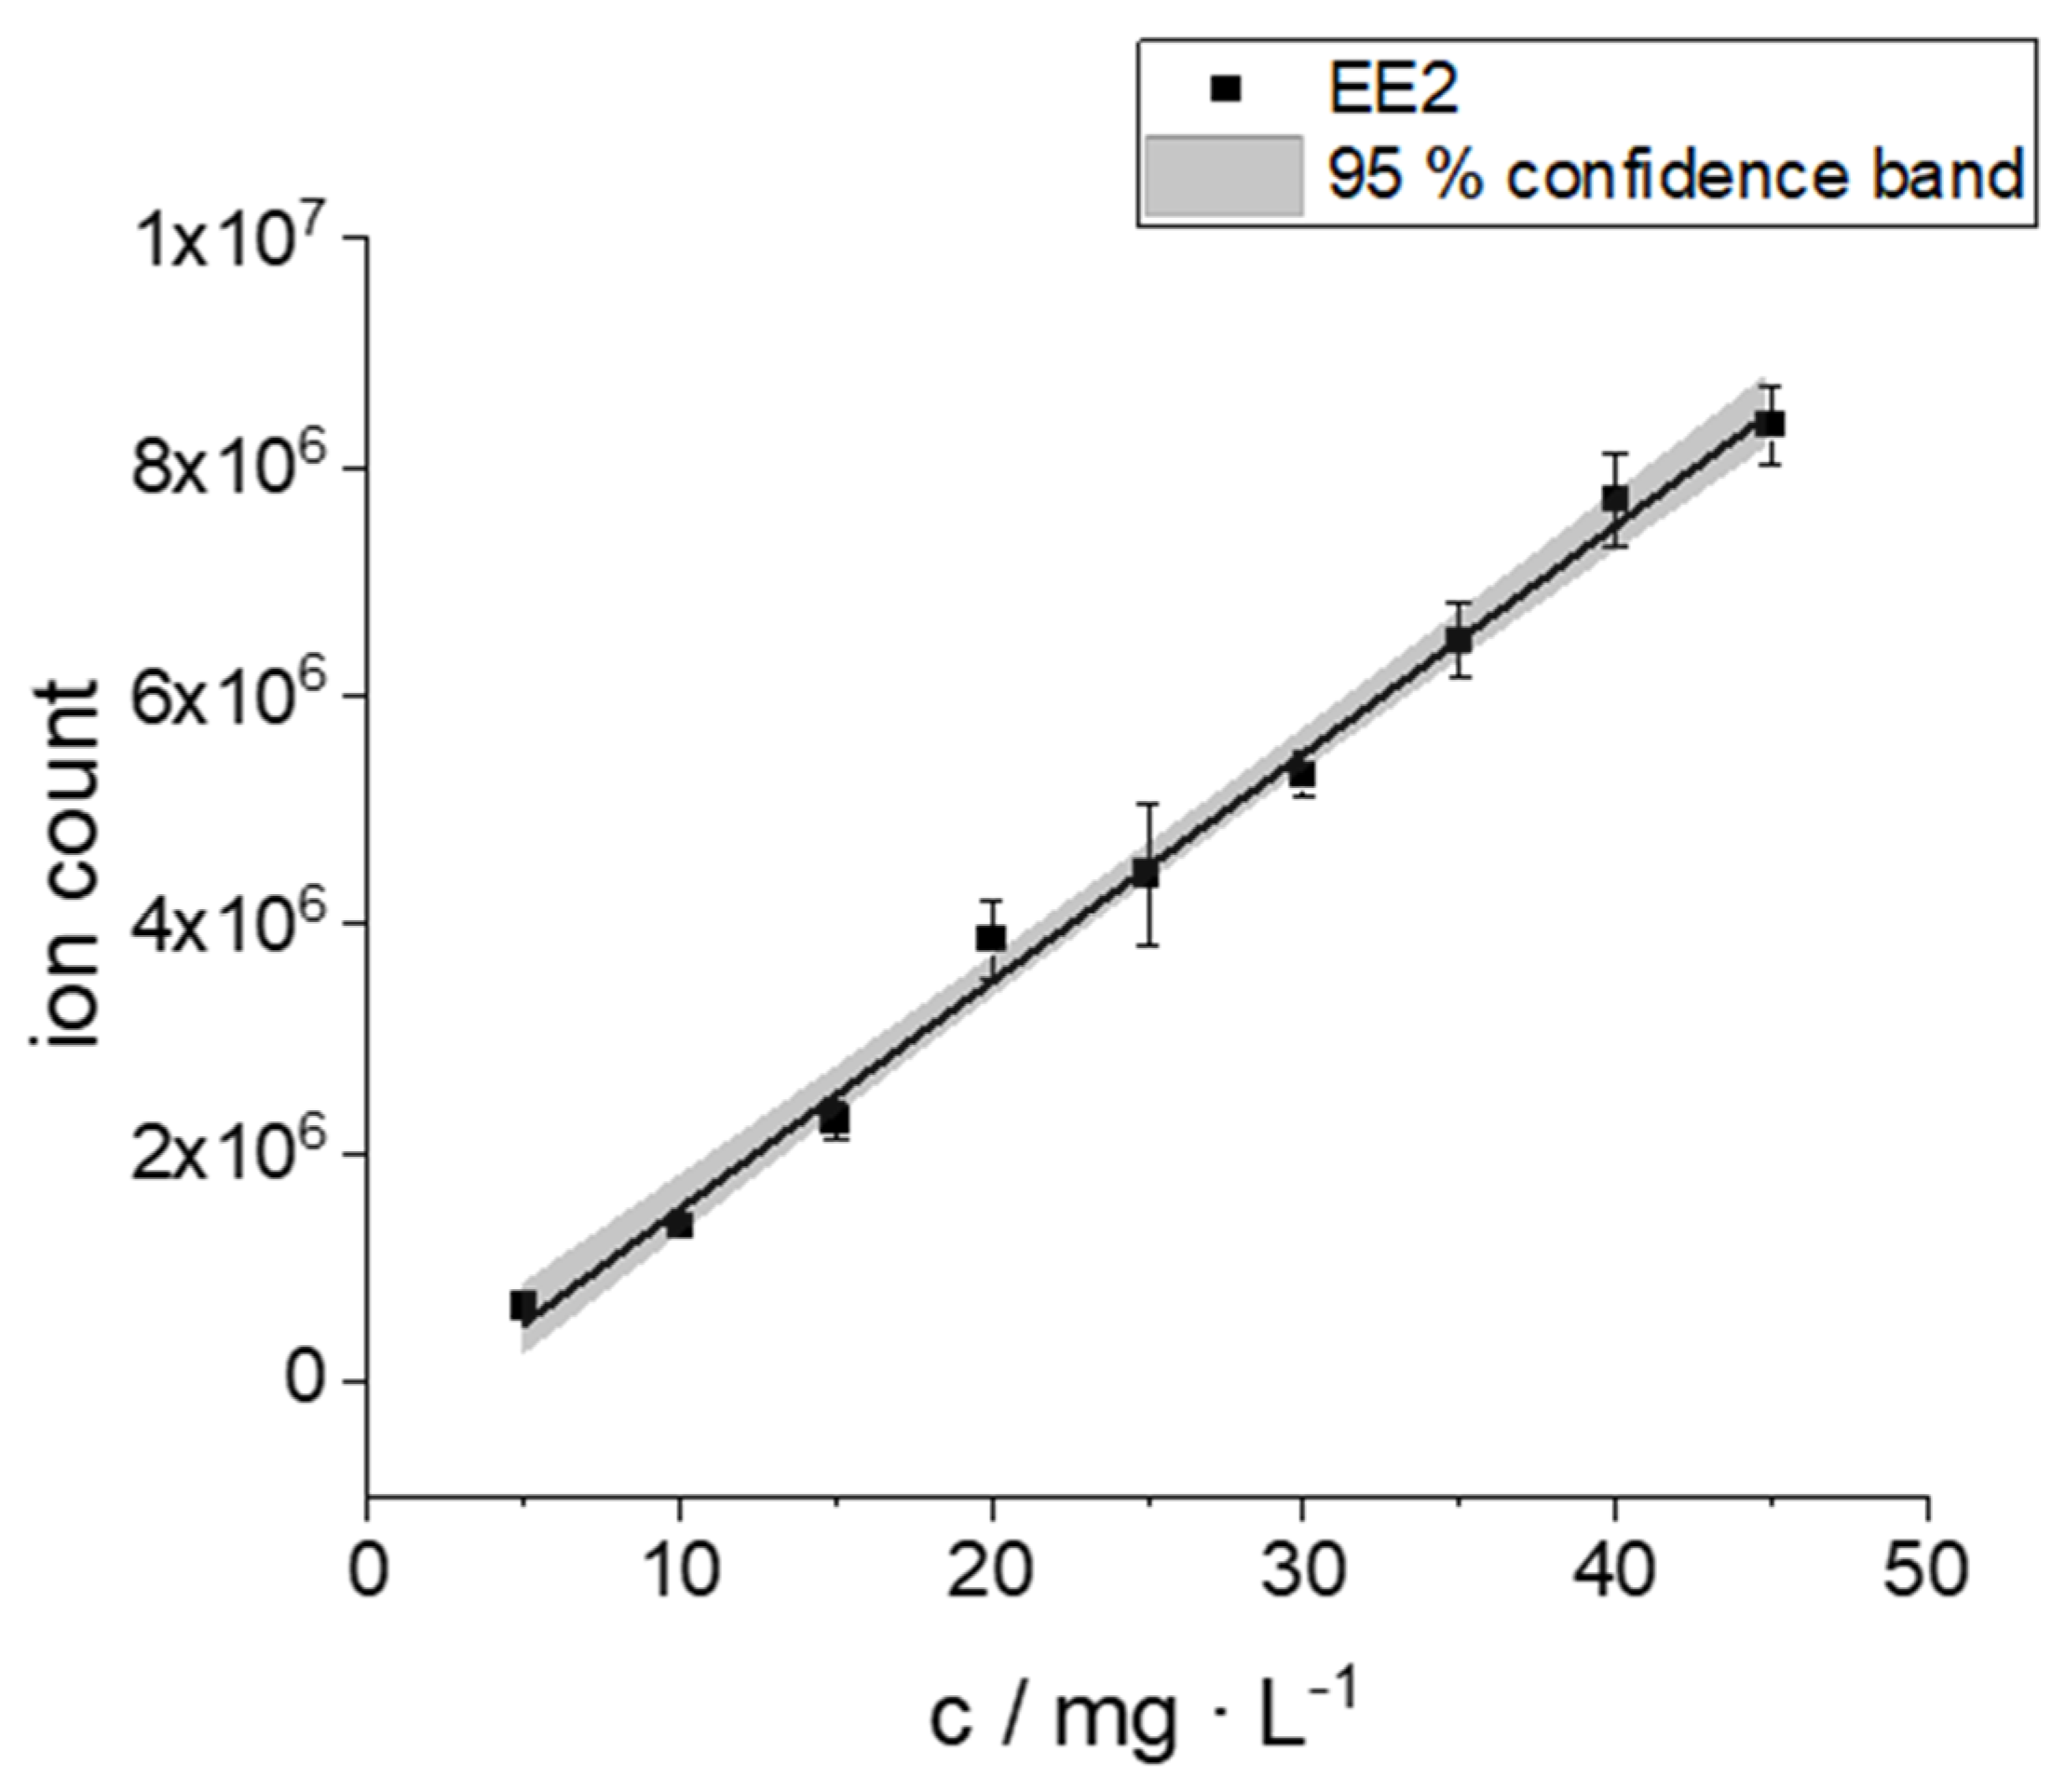
2.1. Calibaration
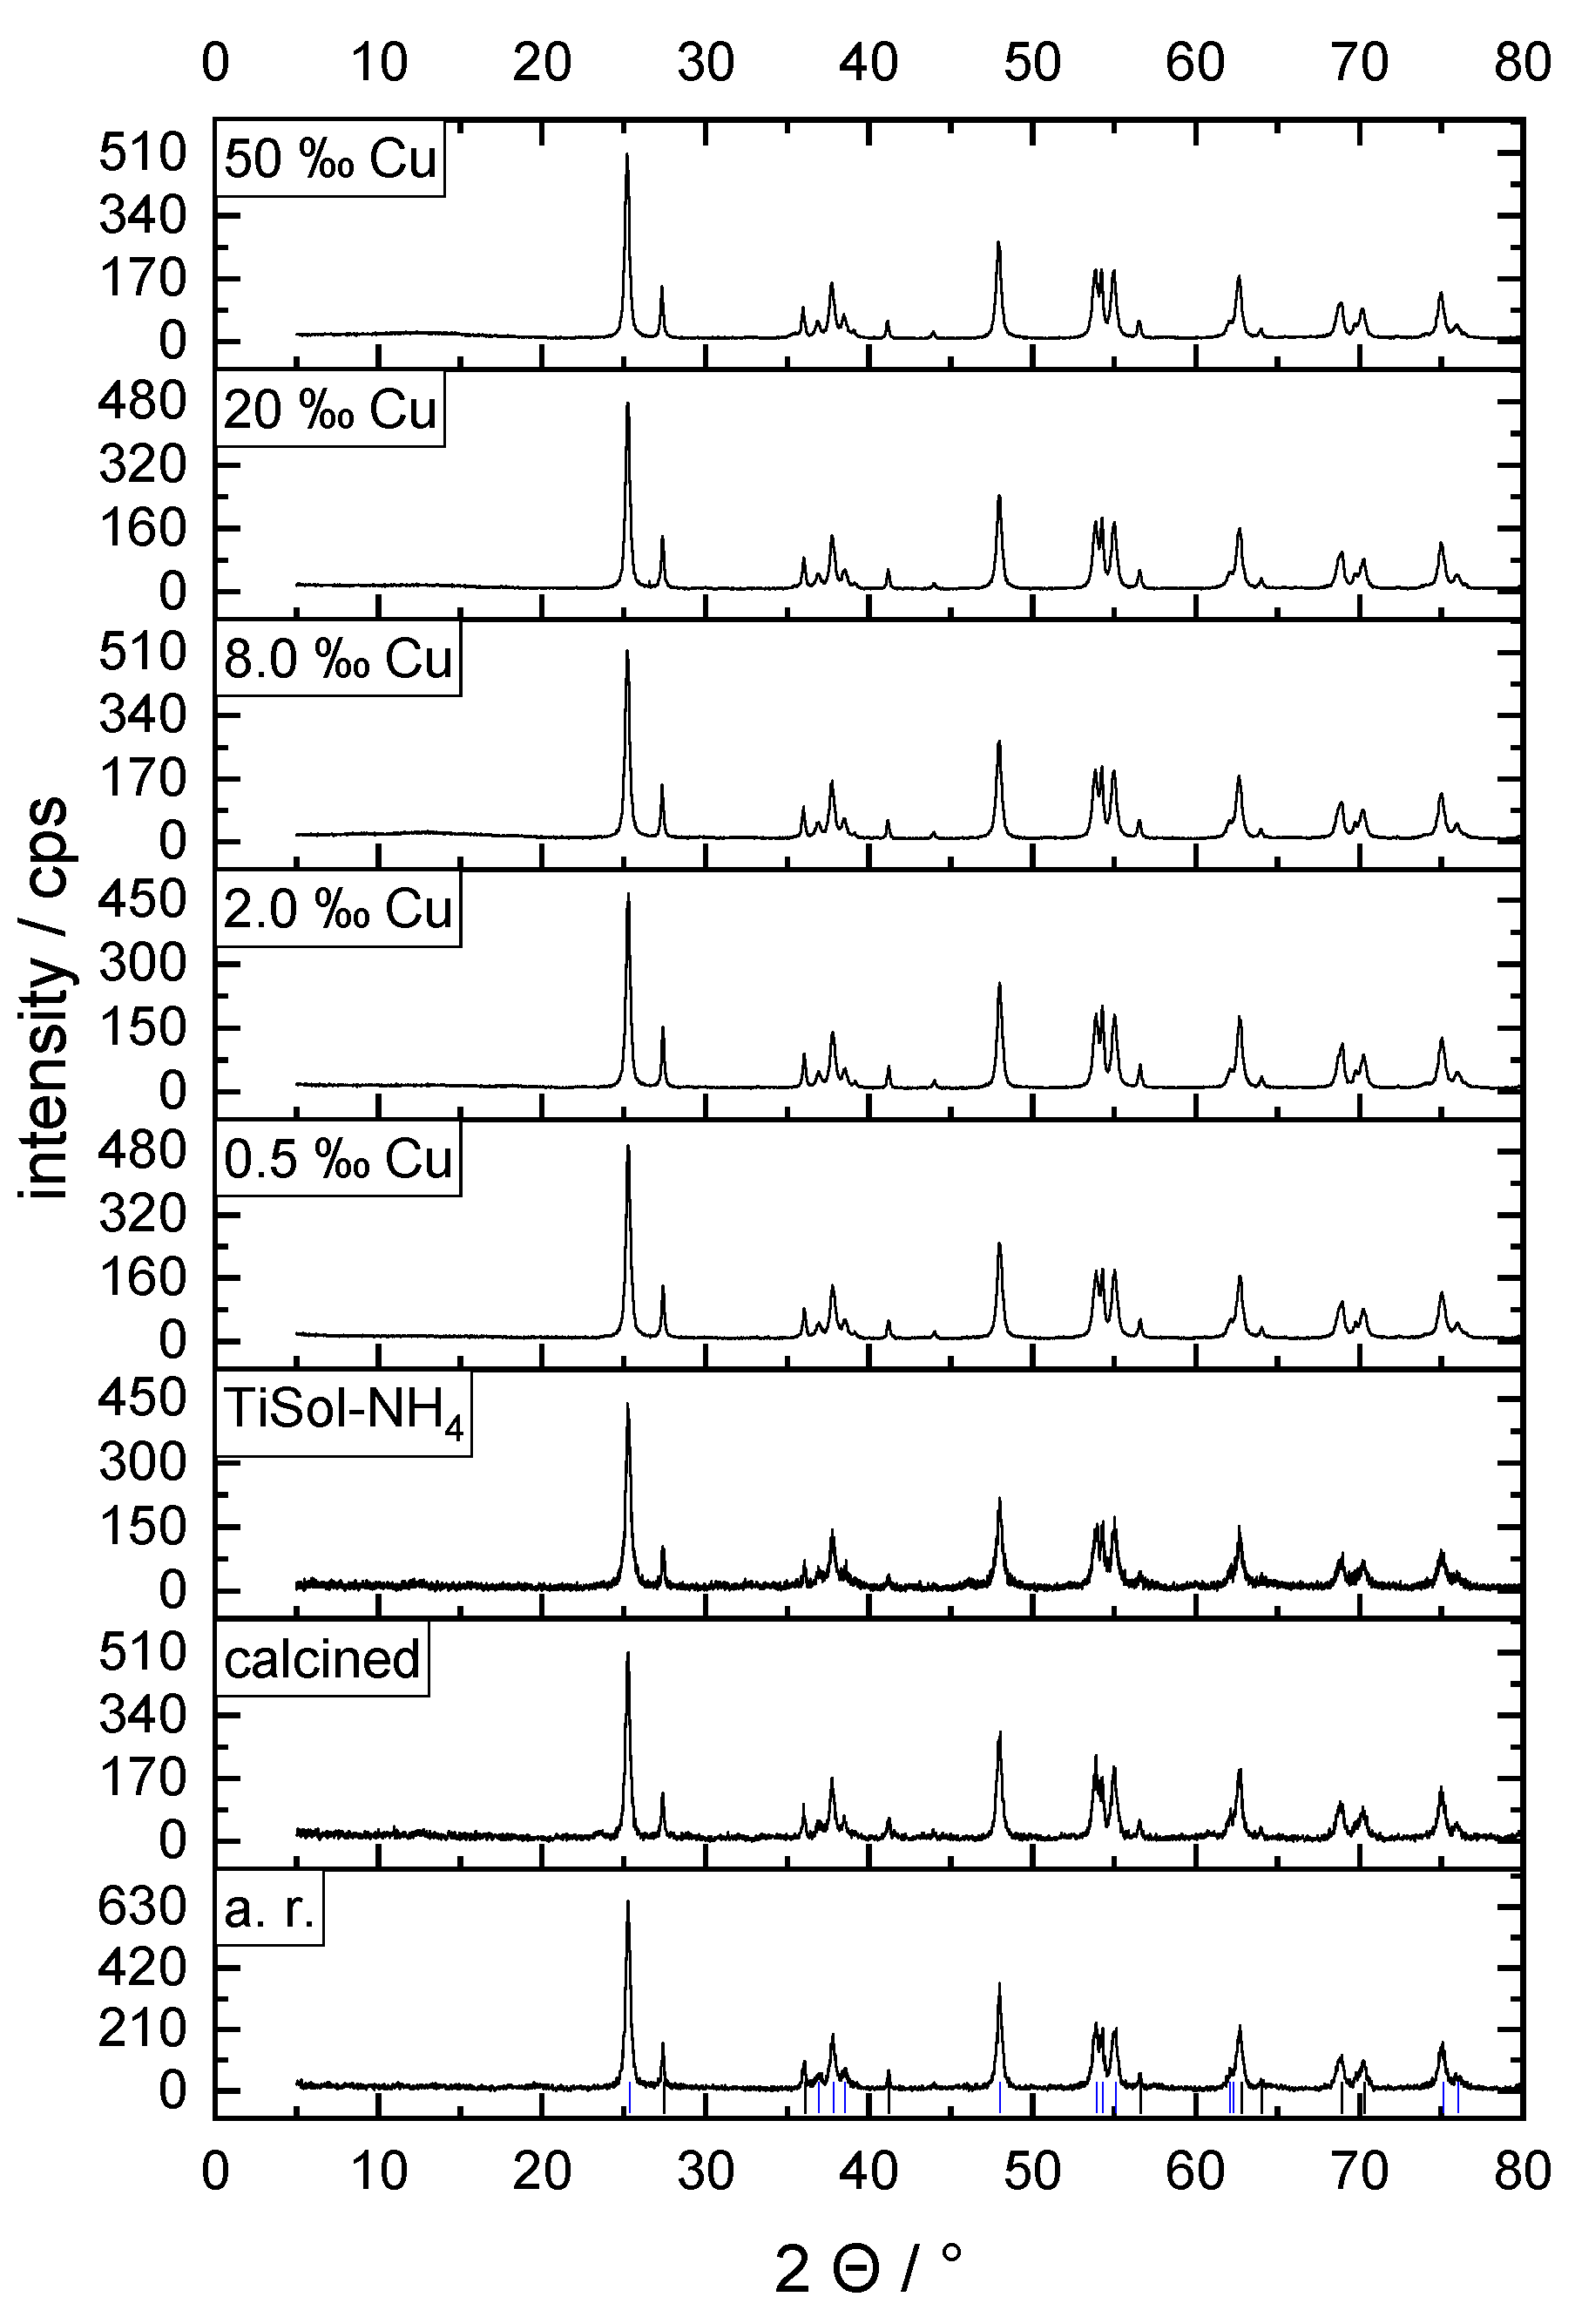
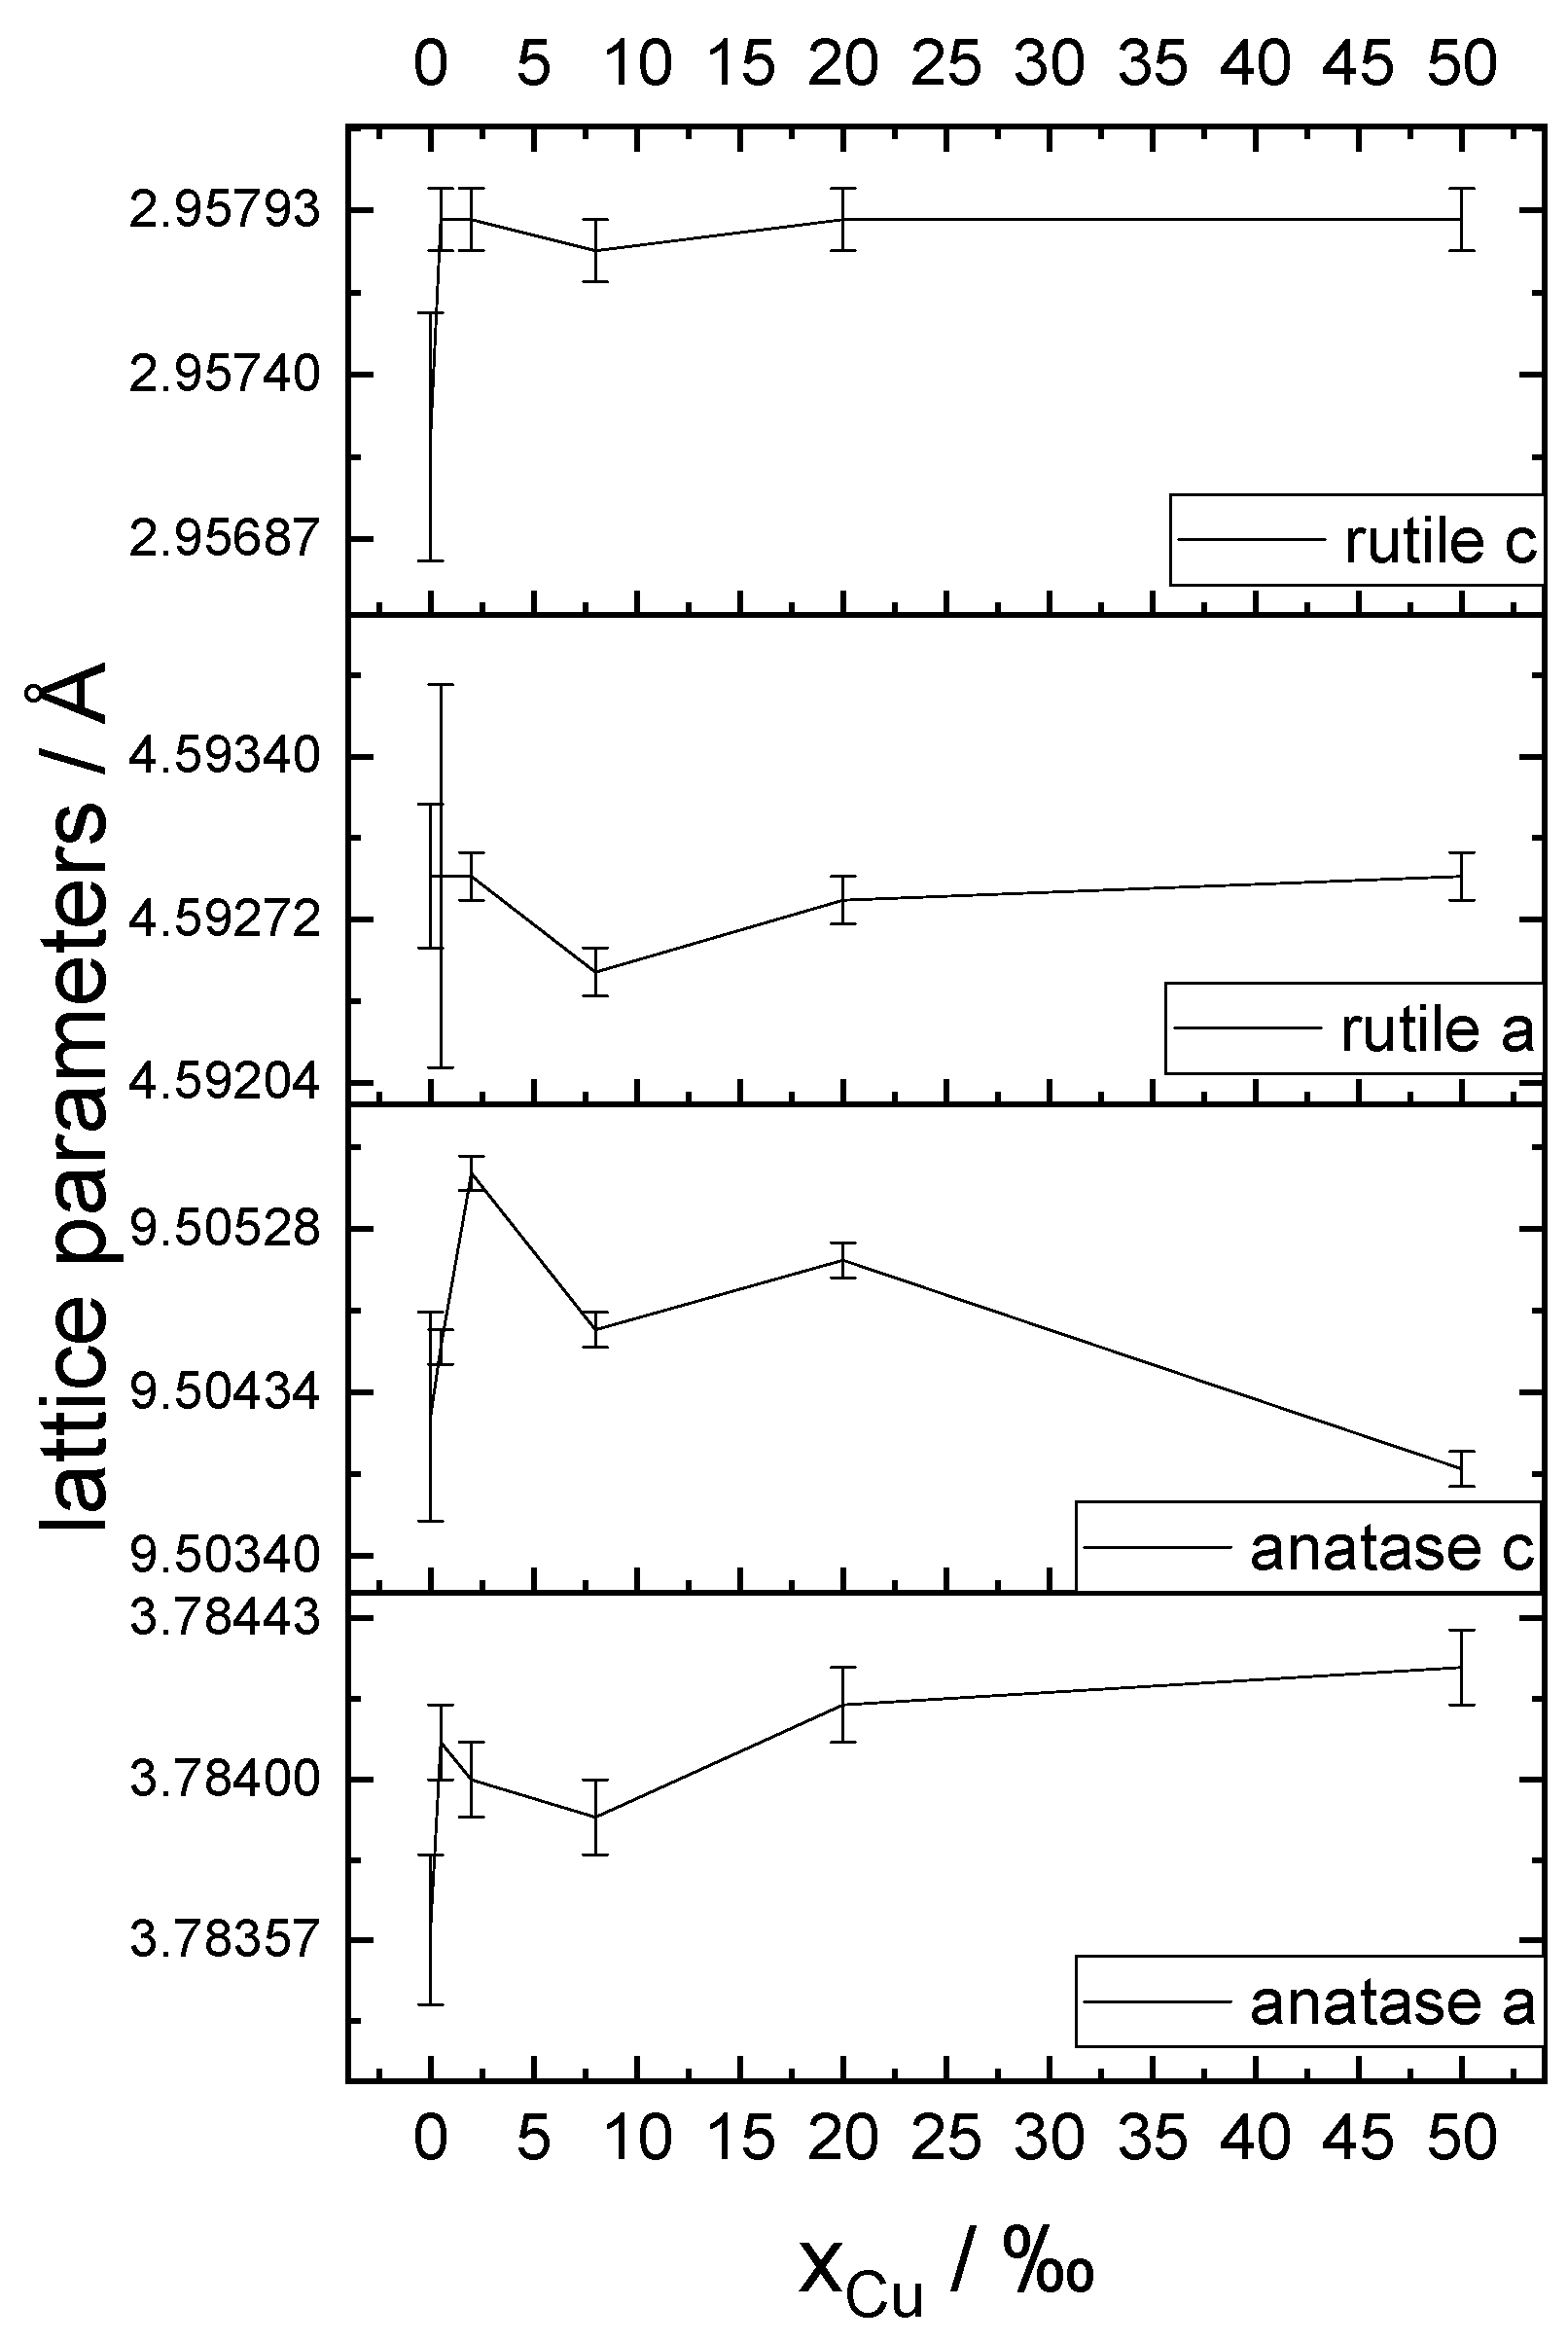
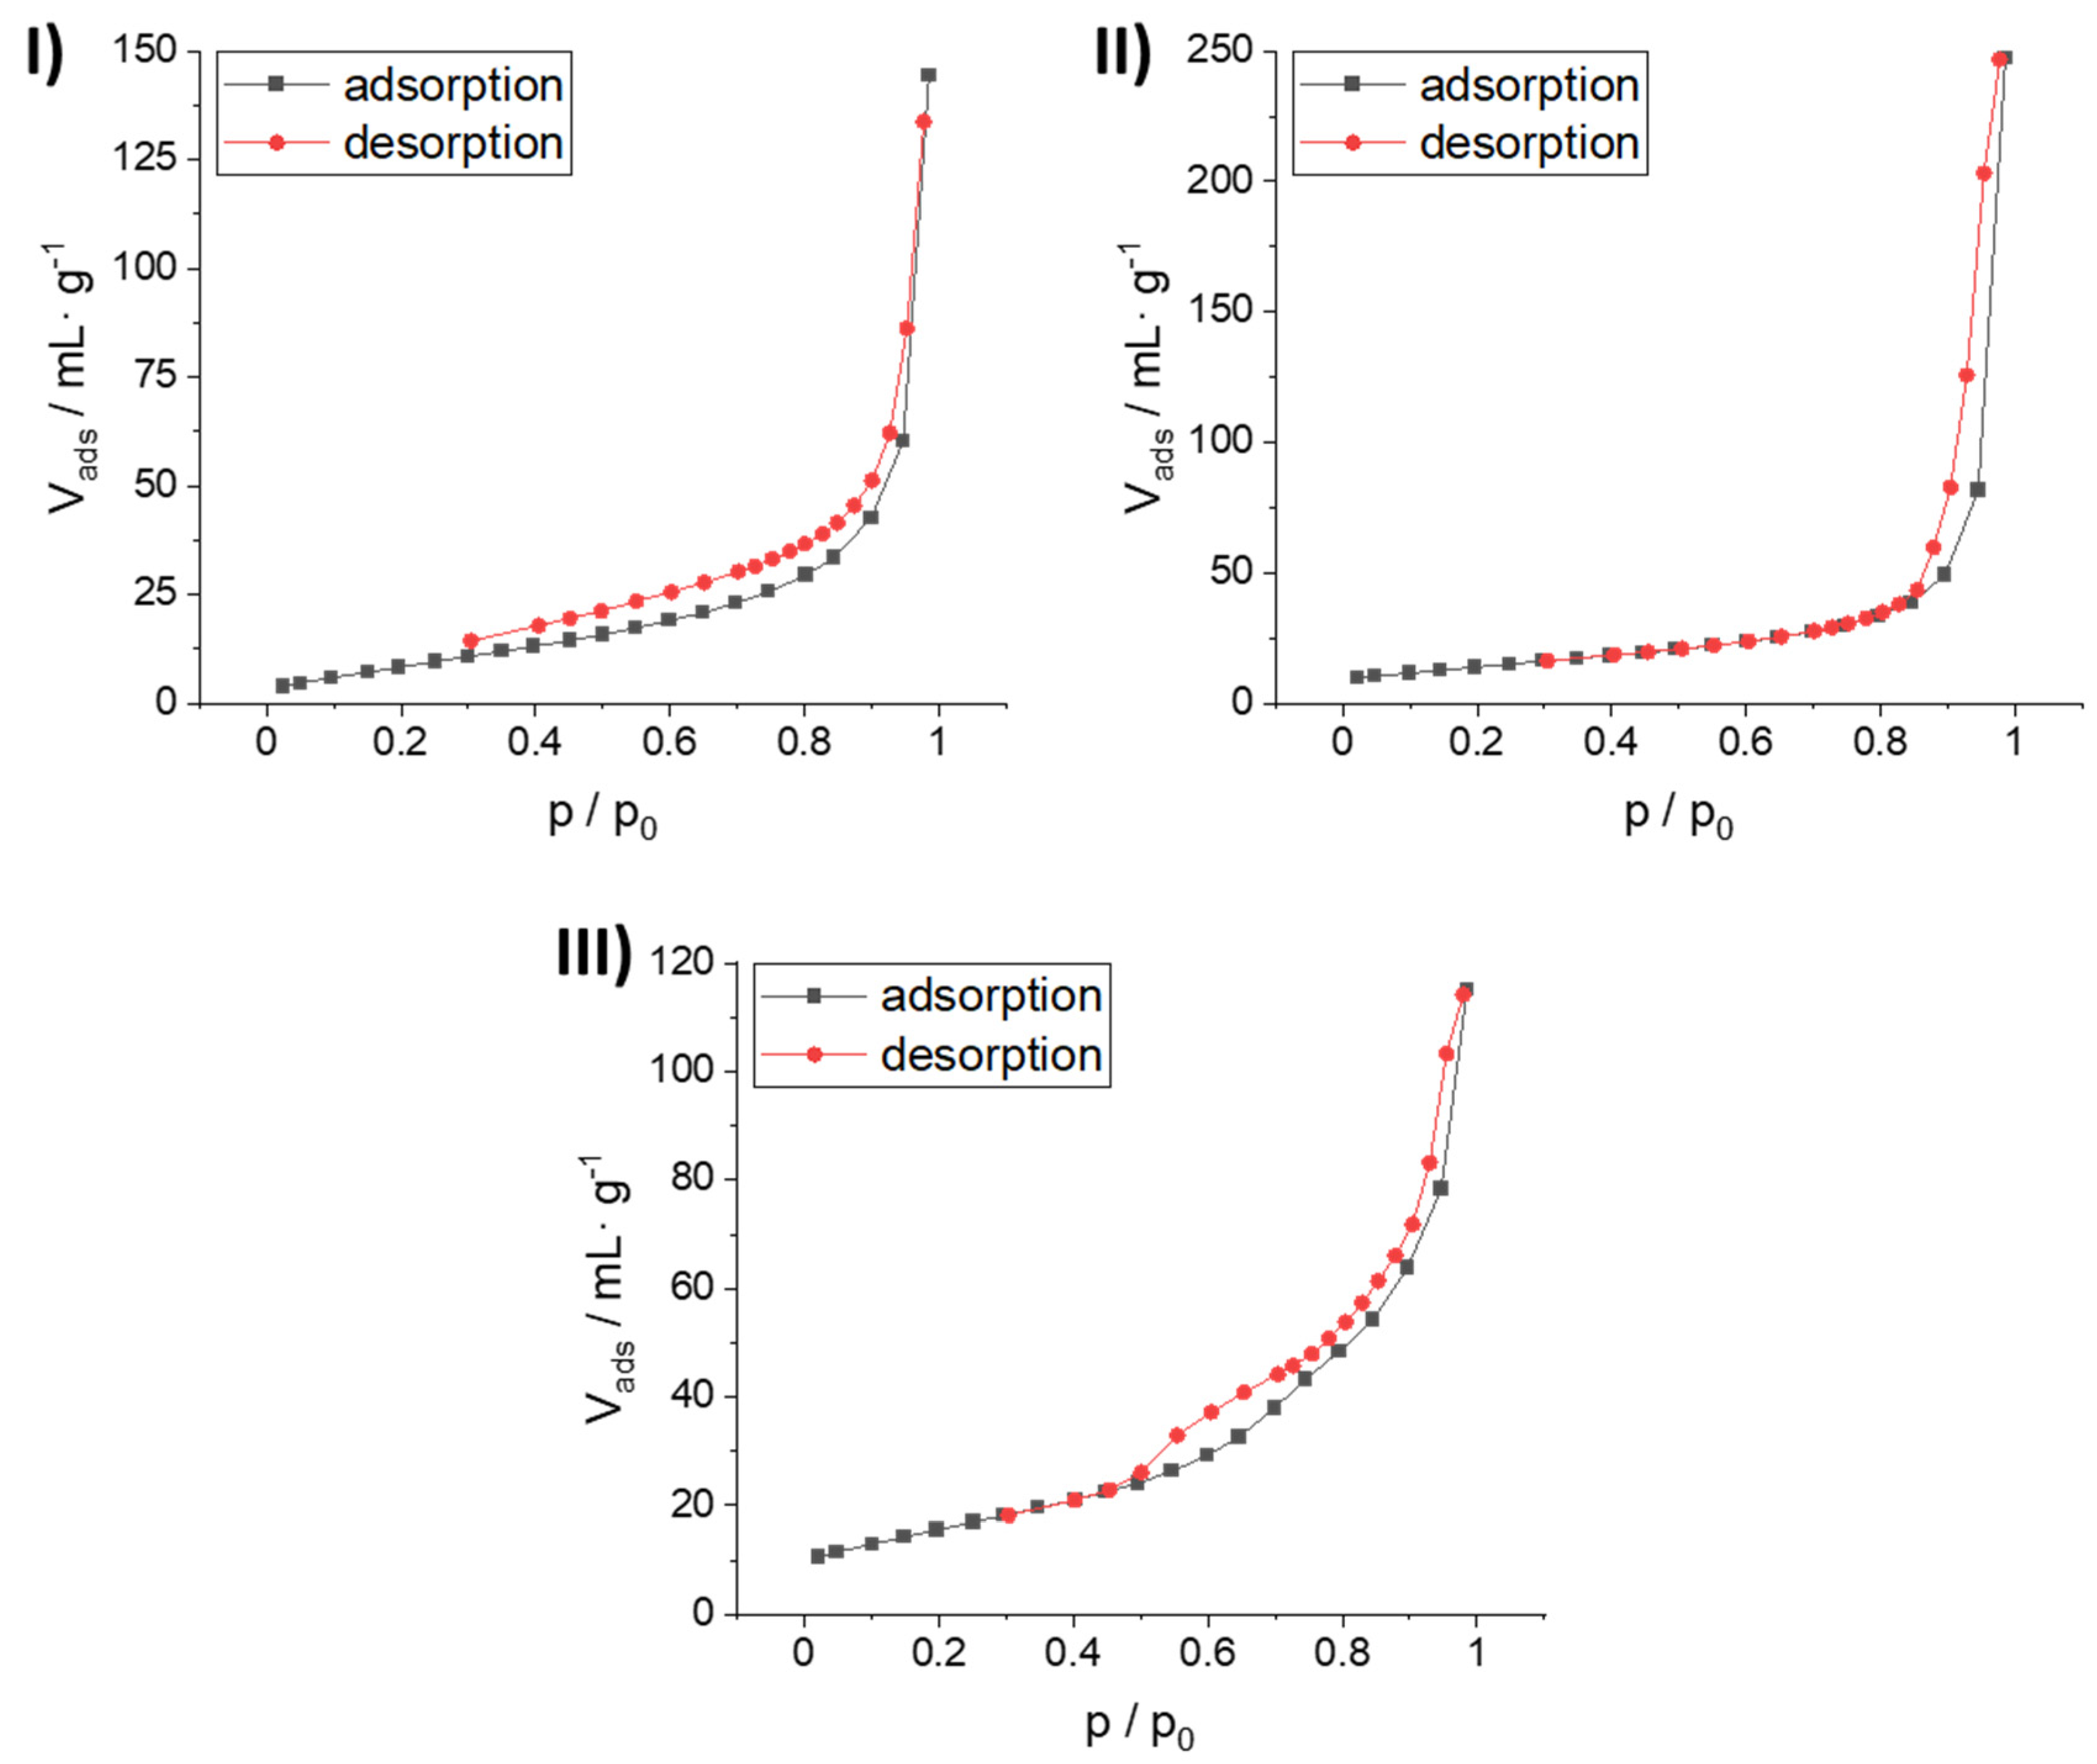
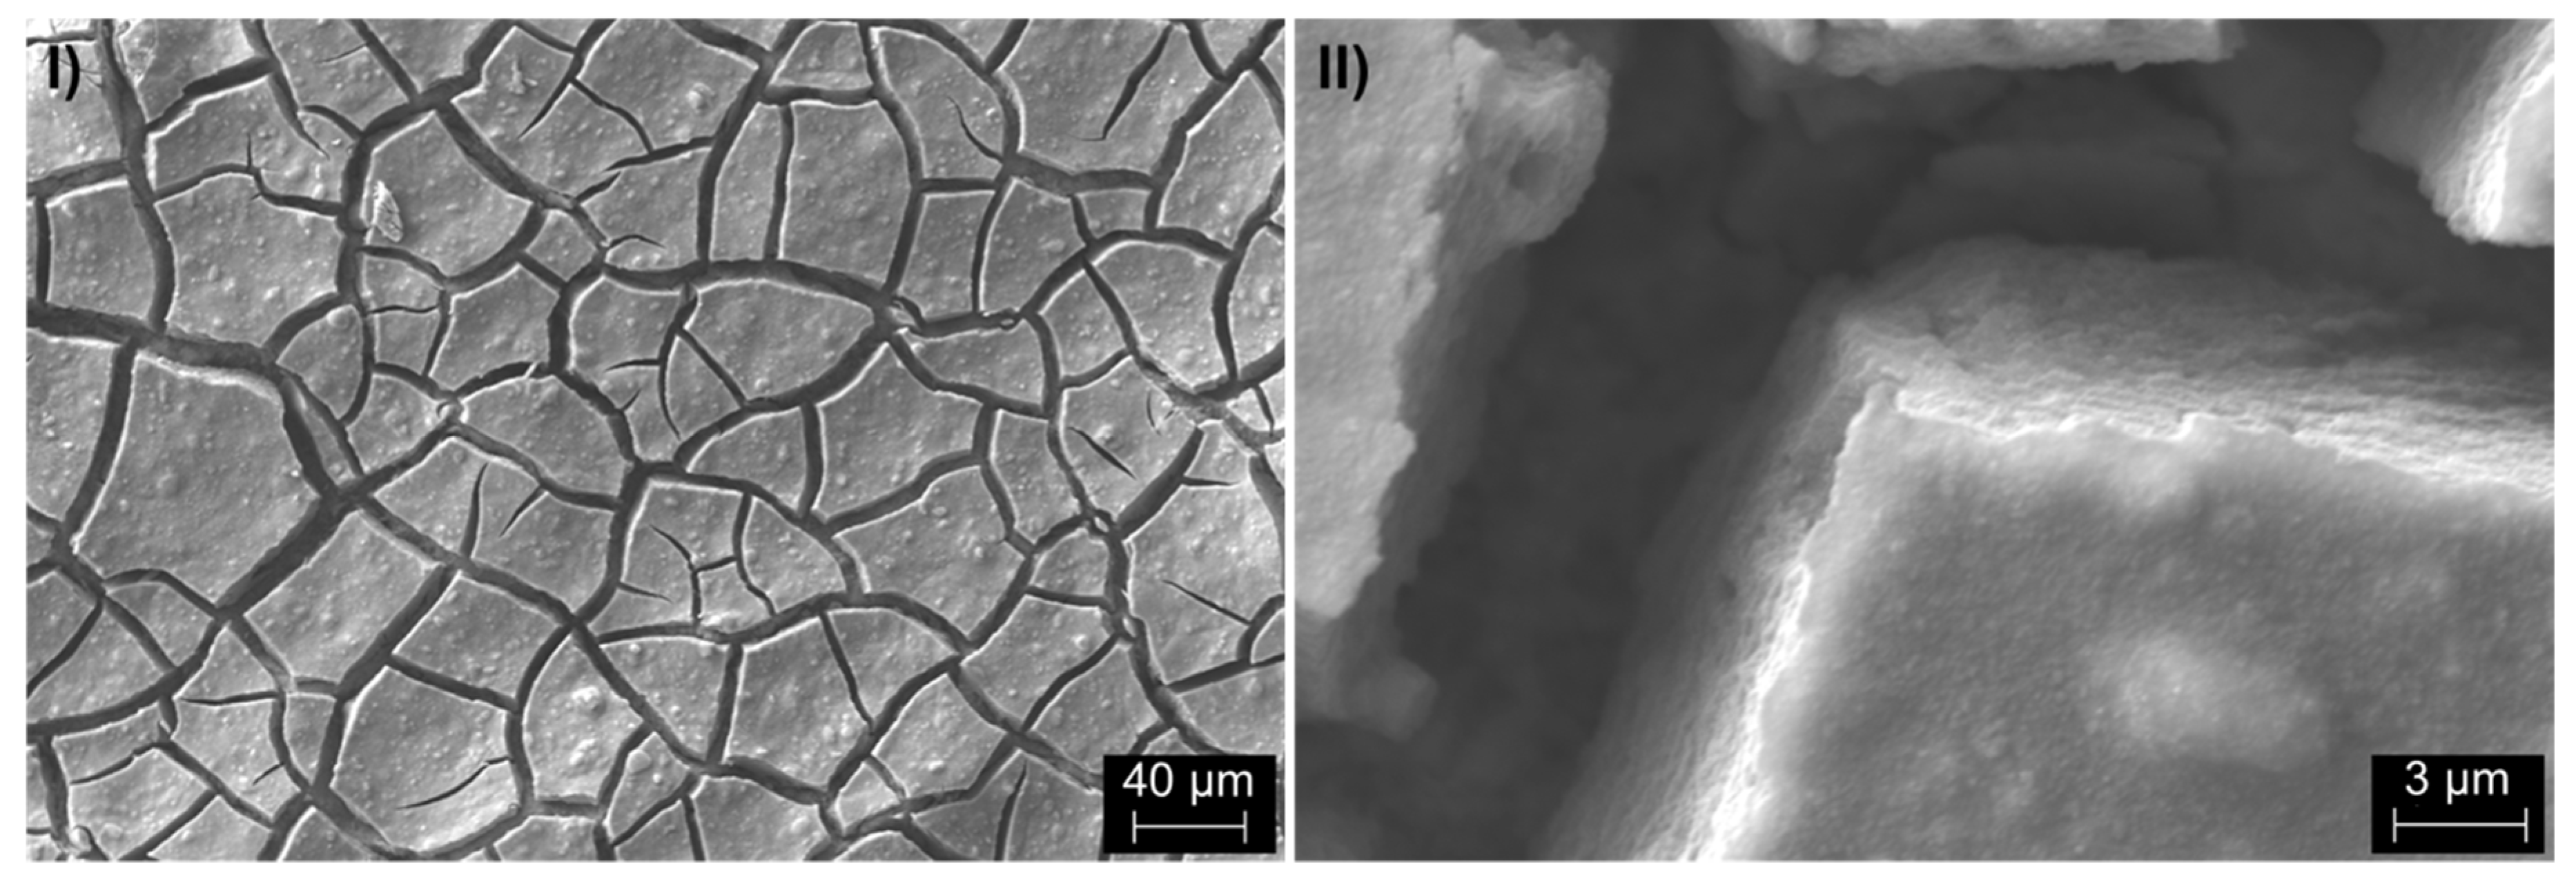
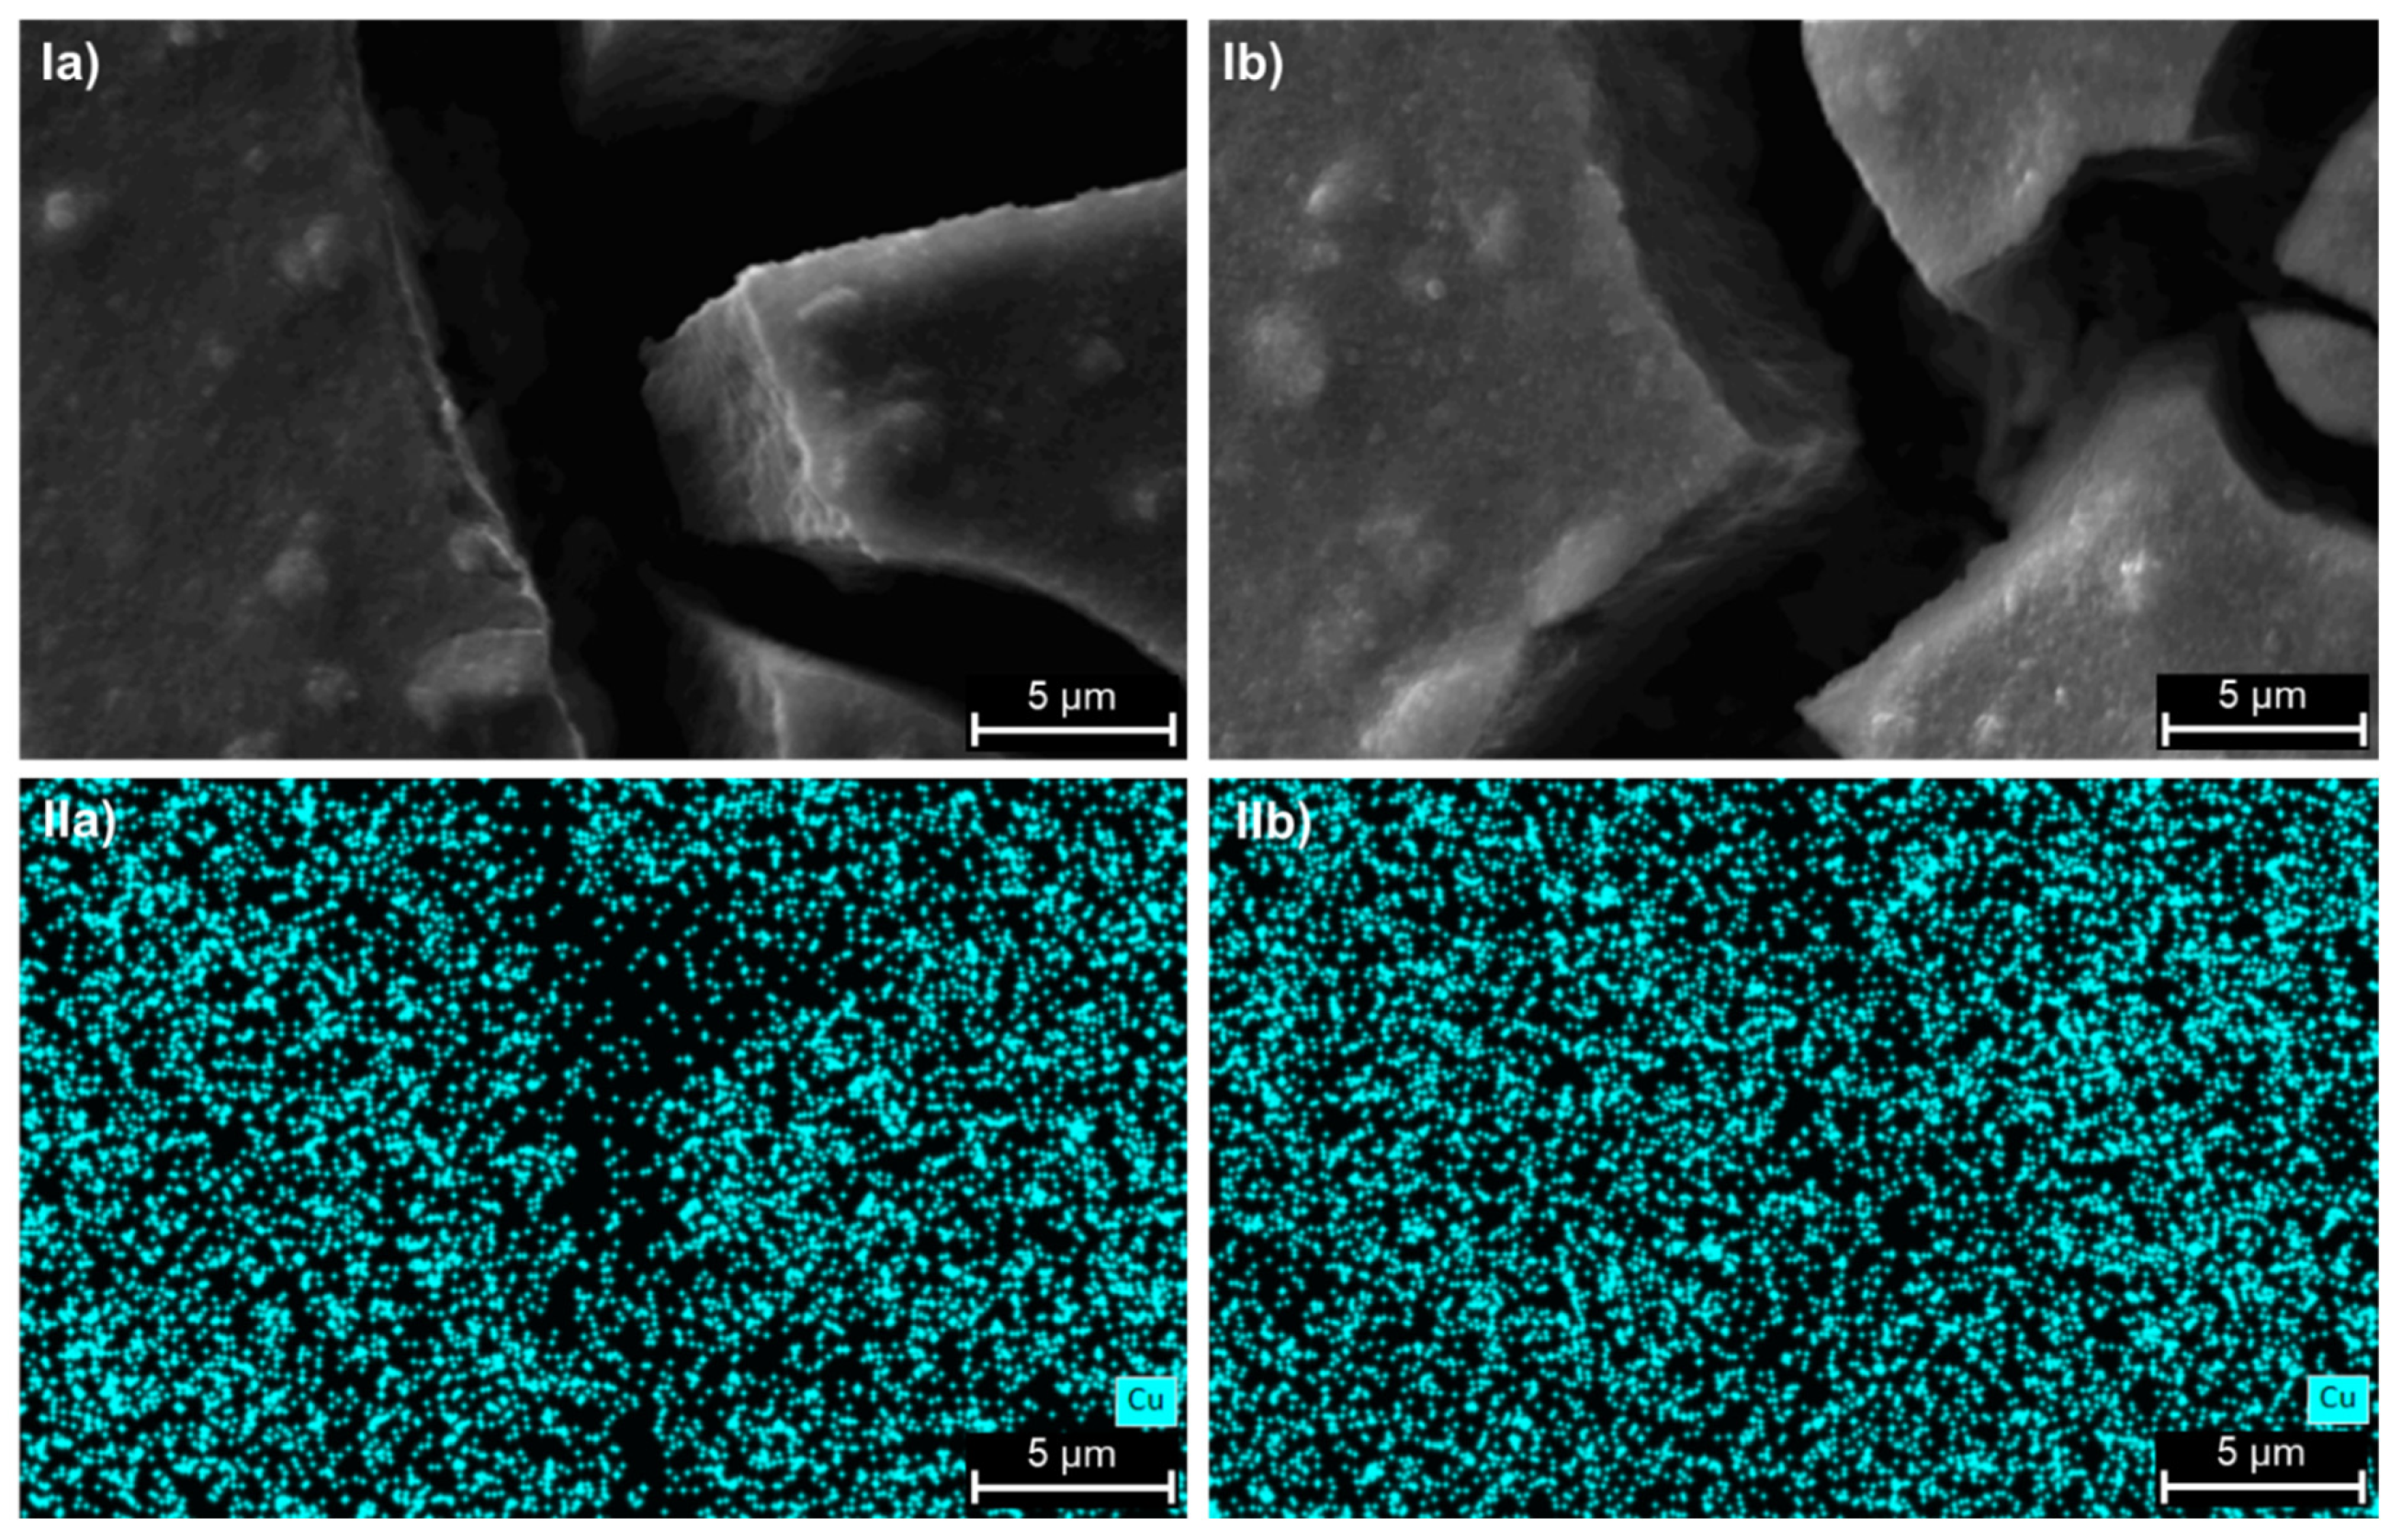
2.2. Catalyst Characterization
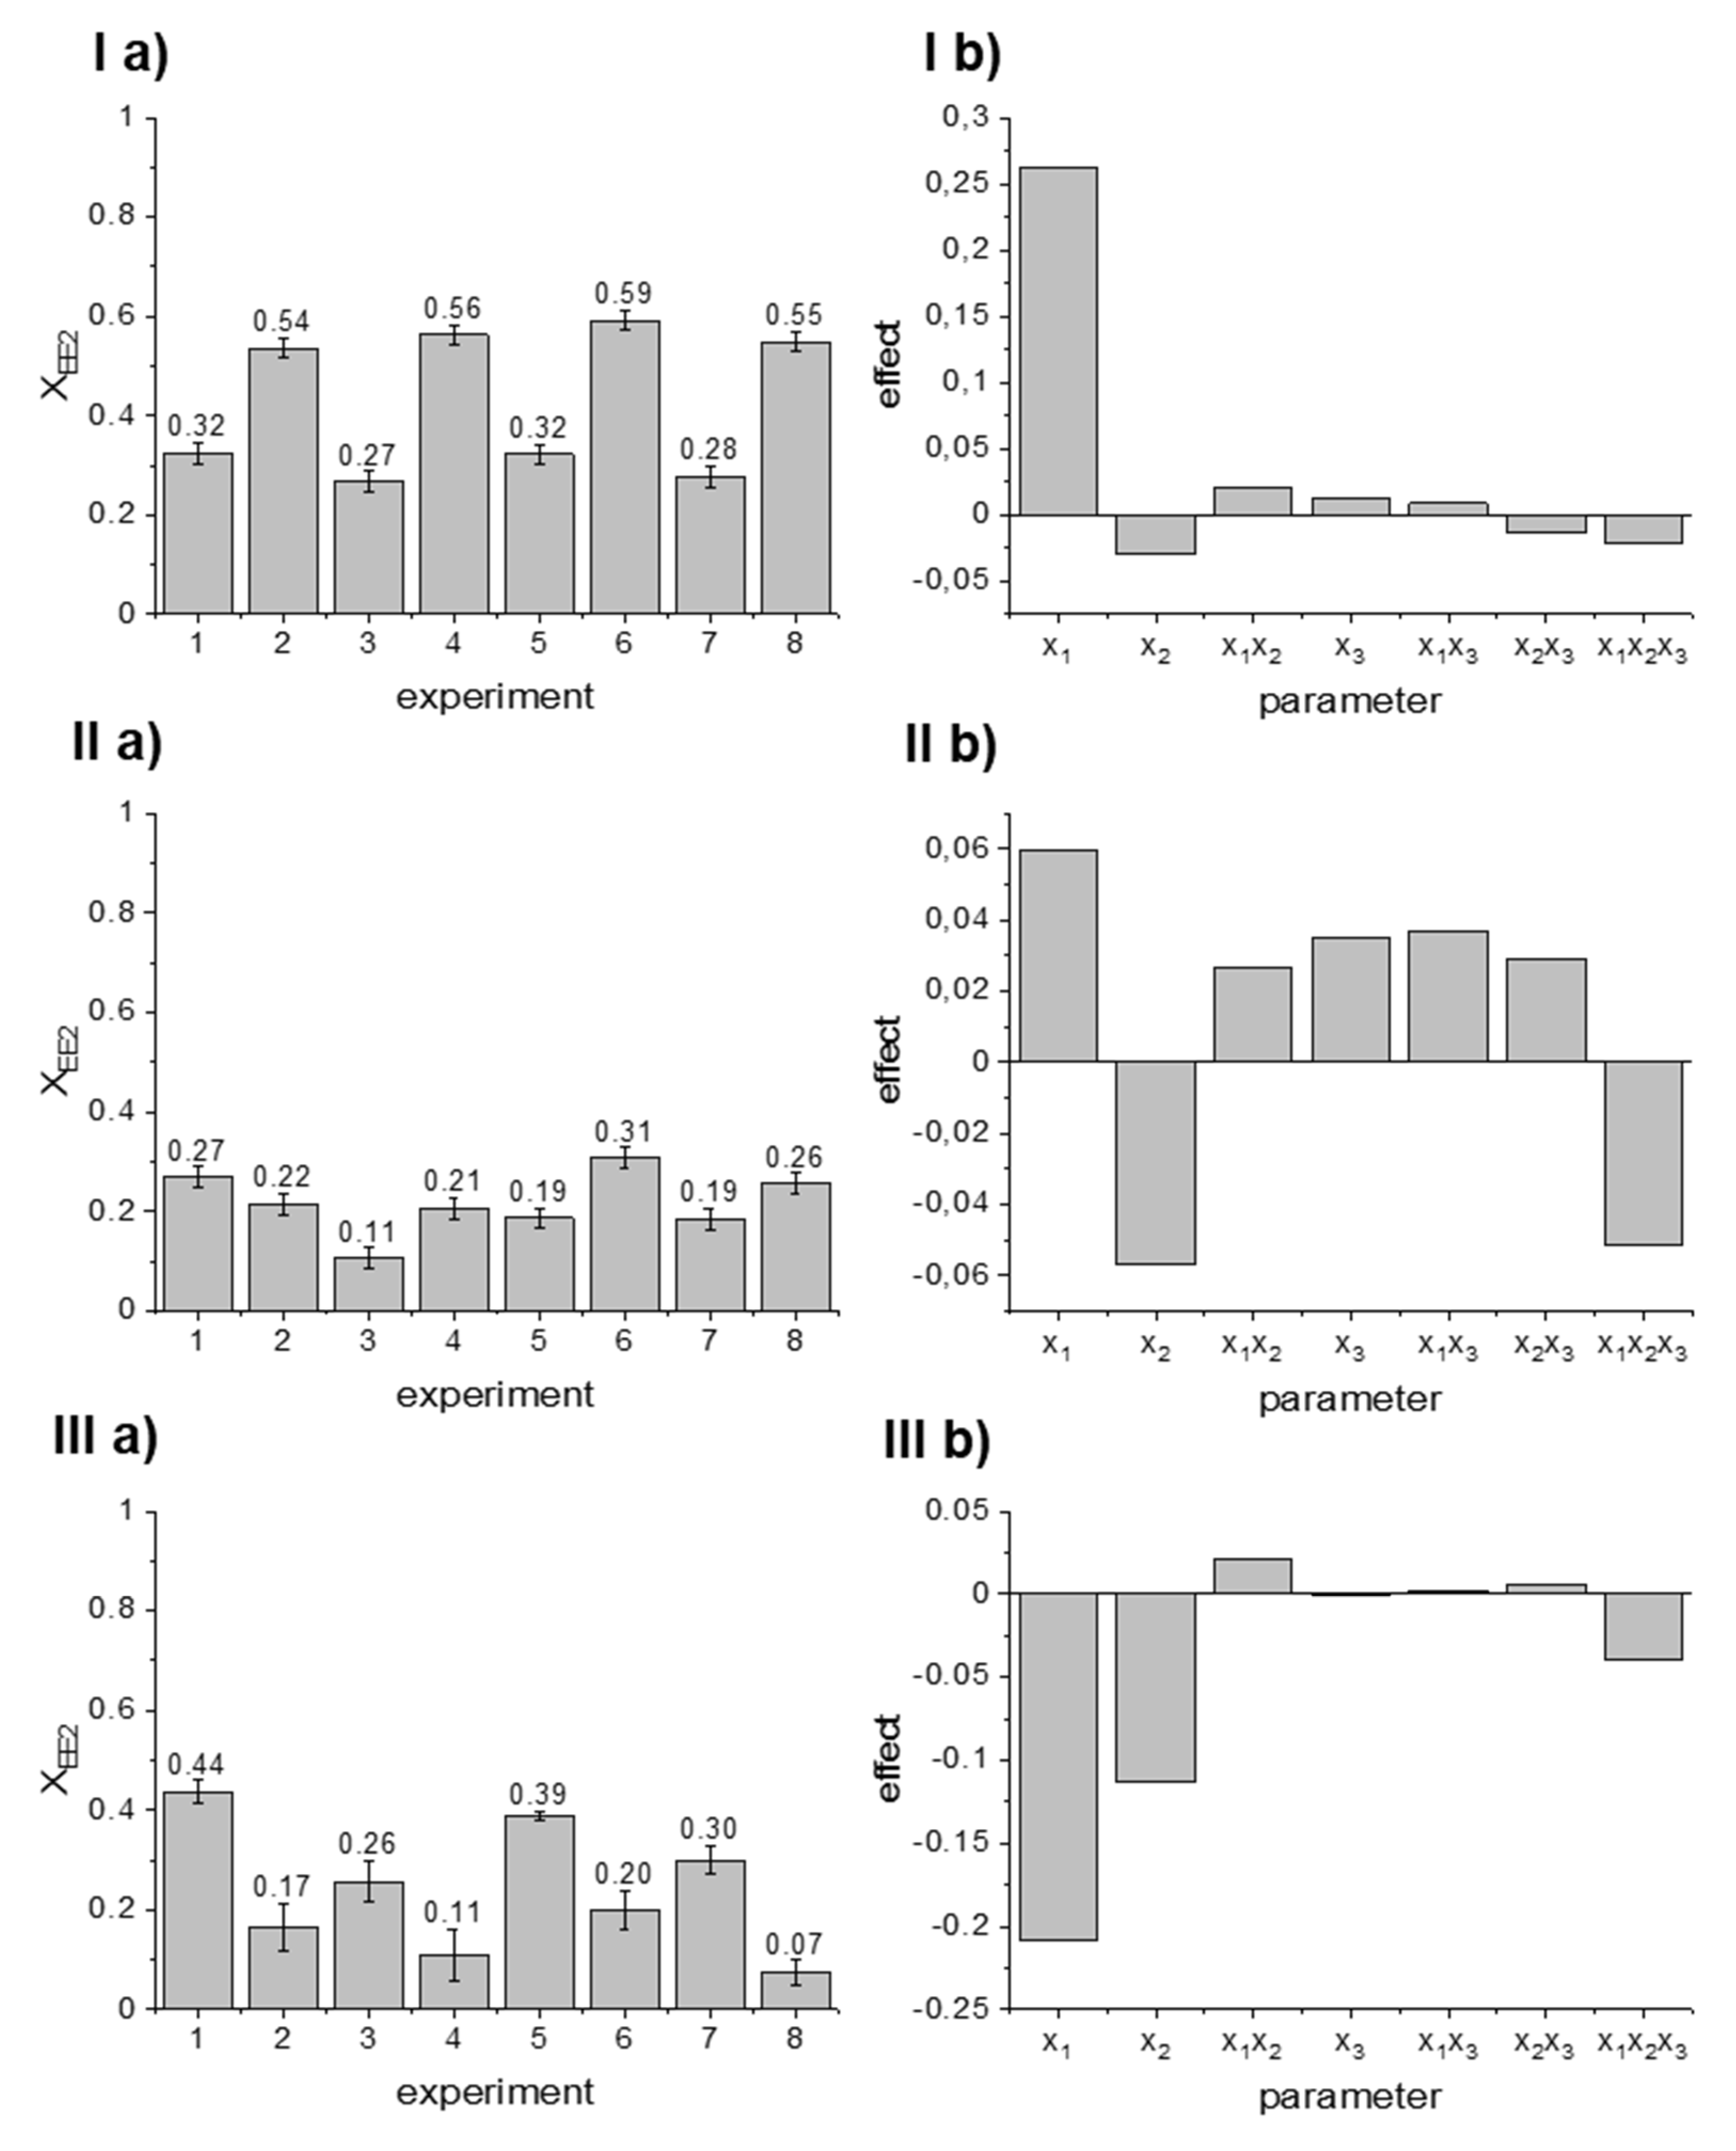
2.3. Optimization of Photocatalysis Parameters
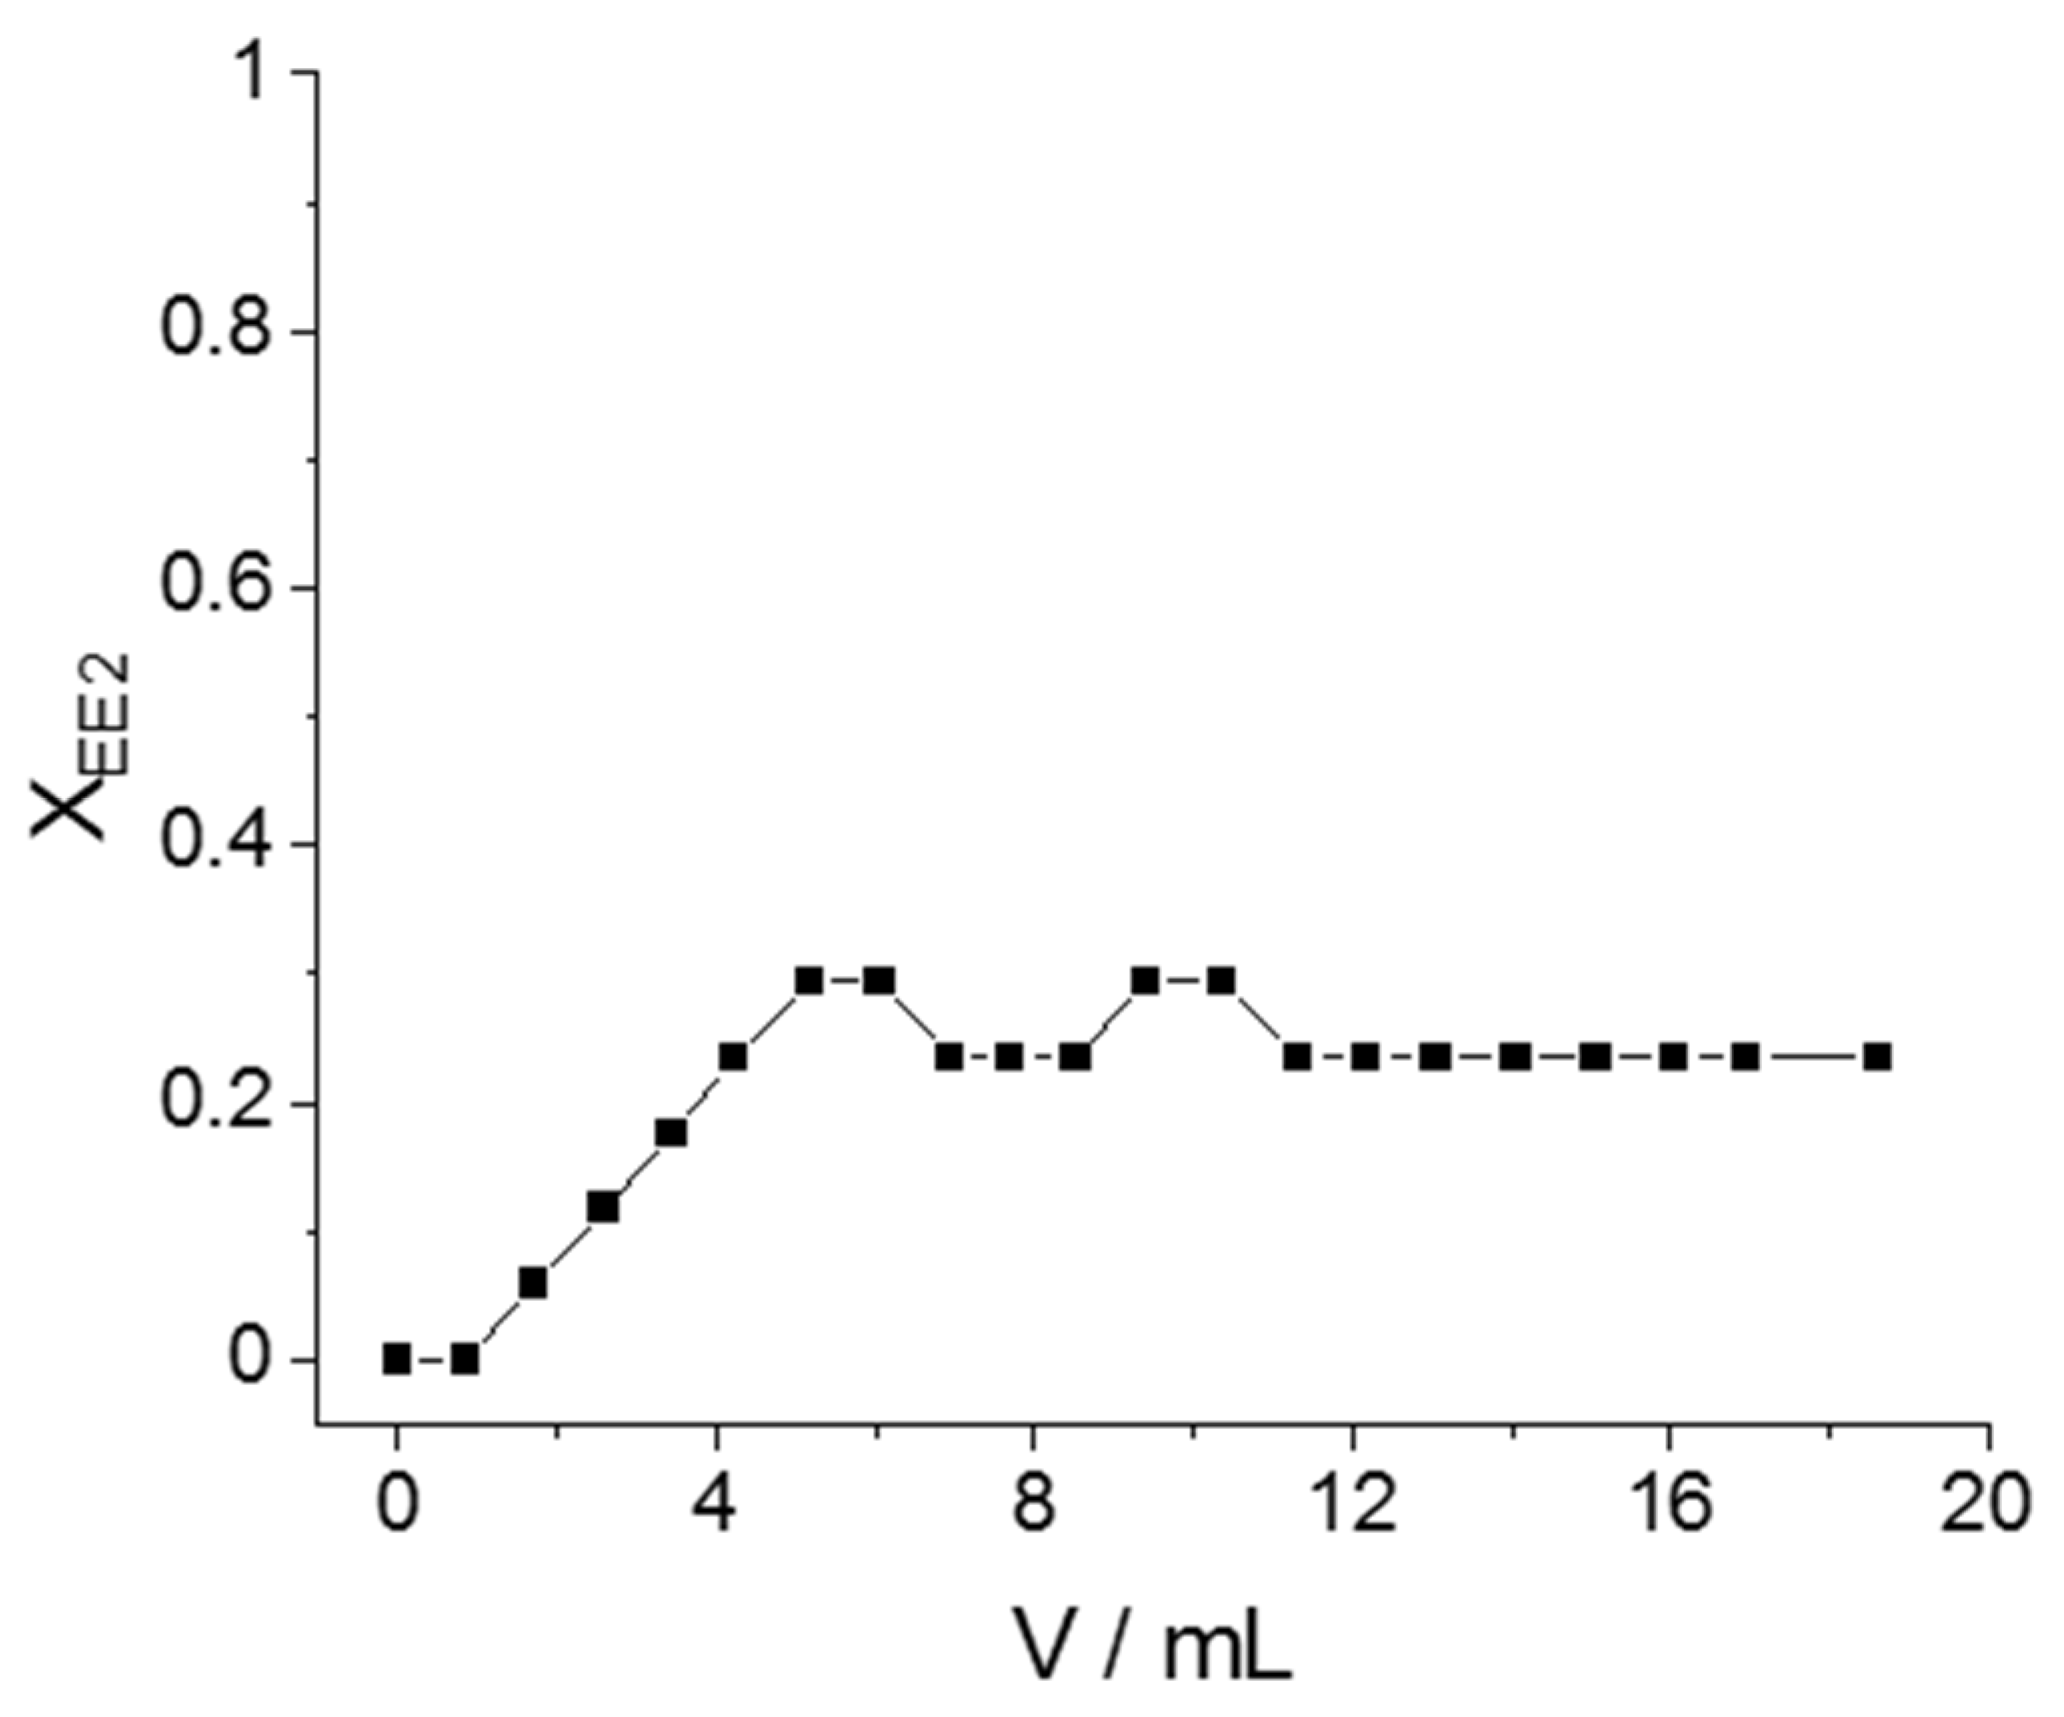
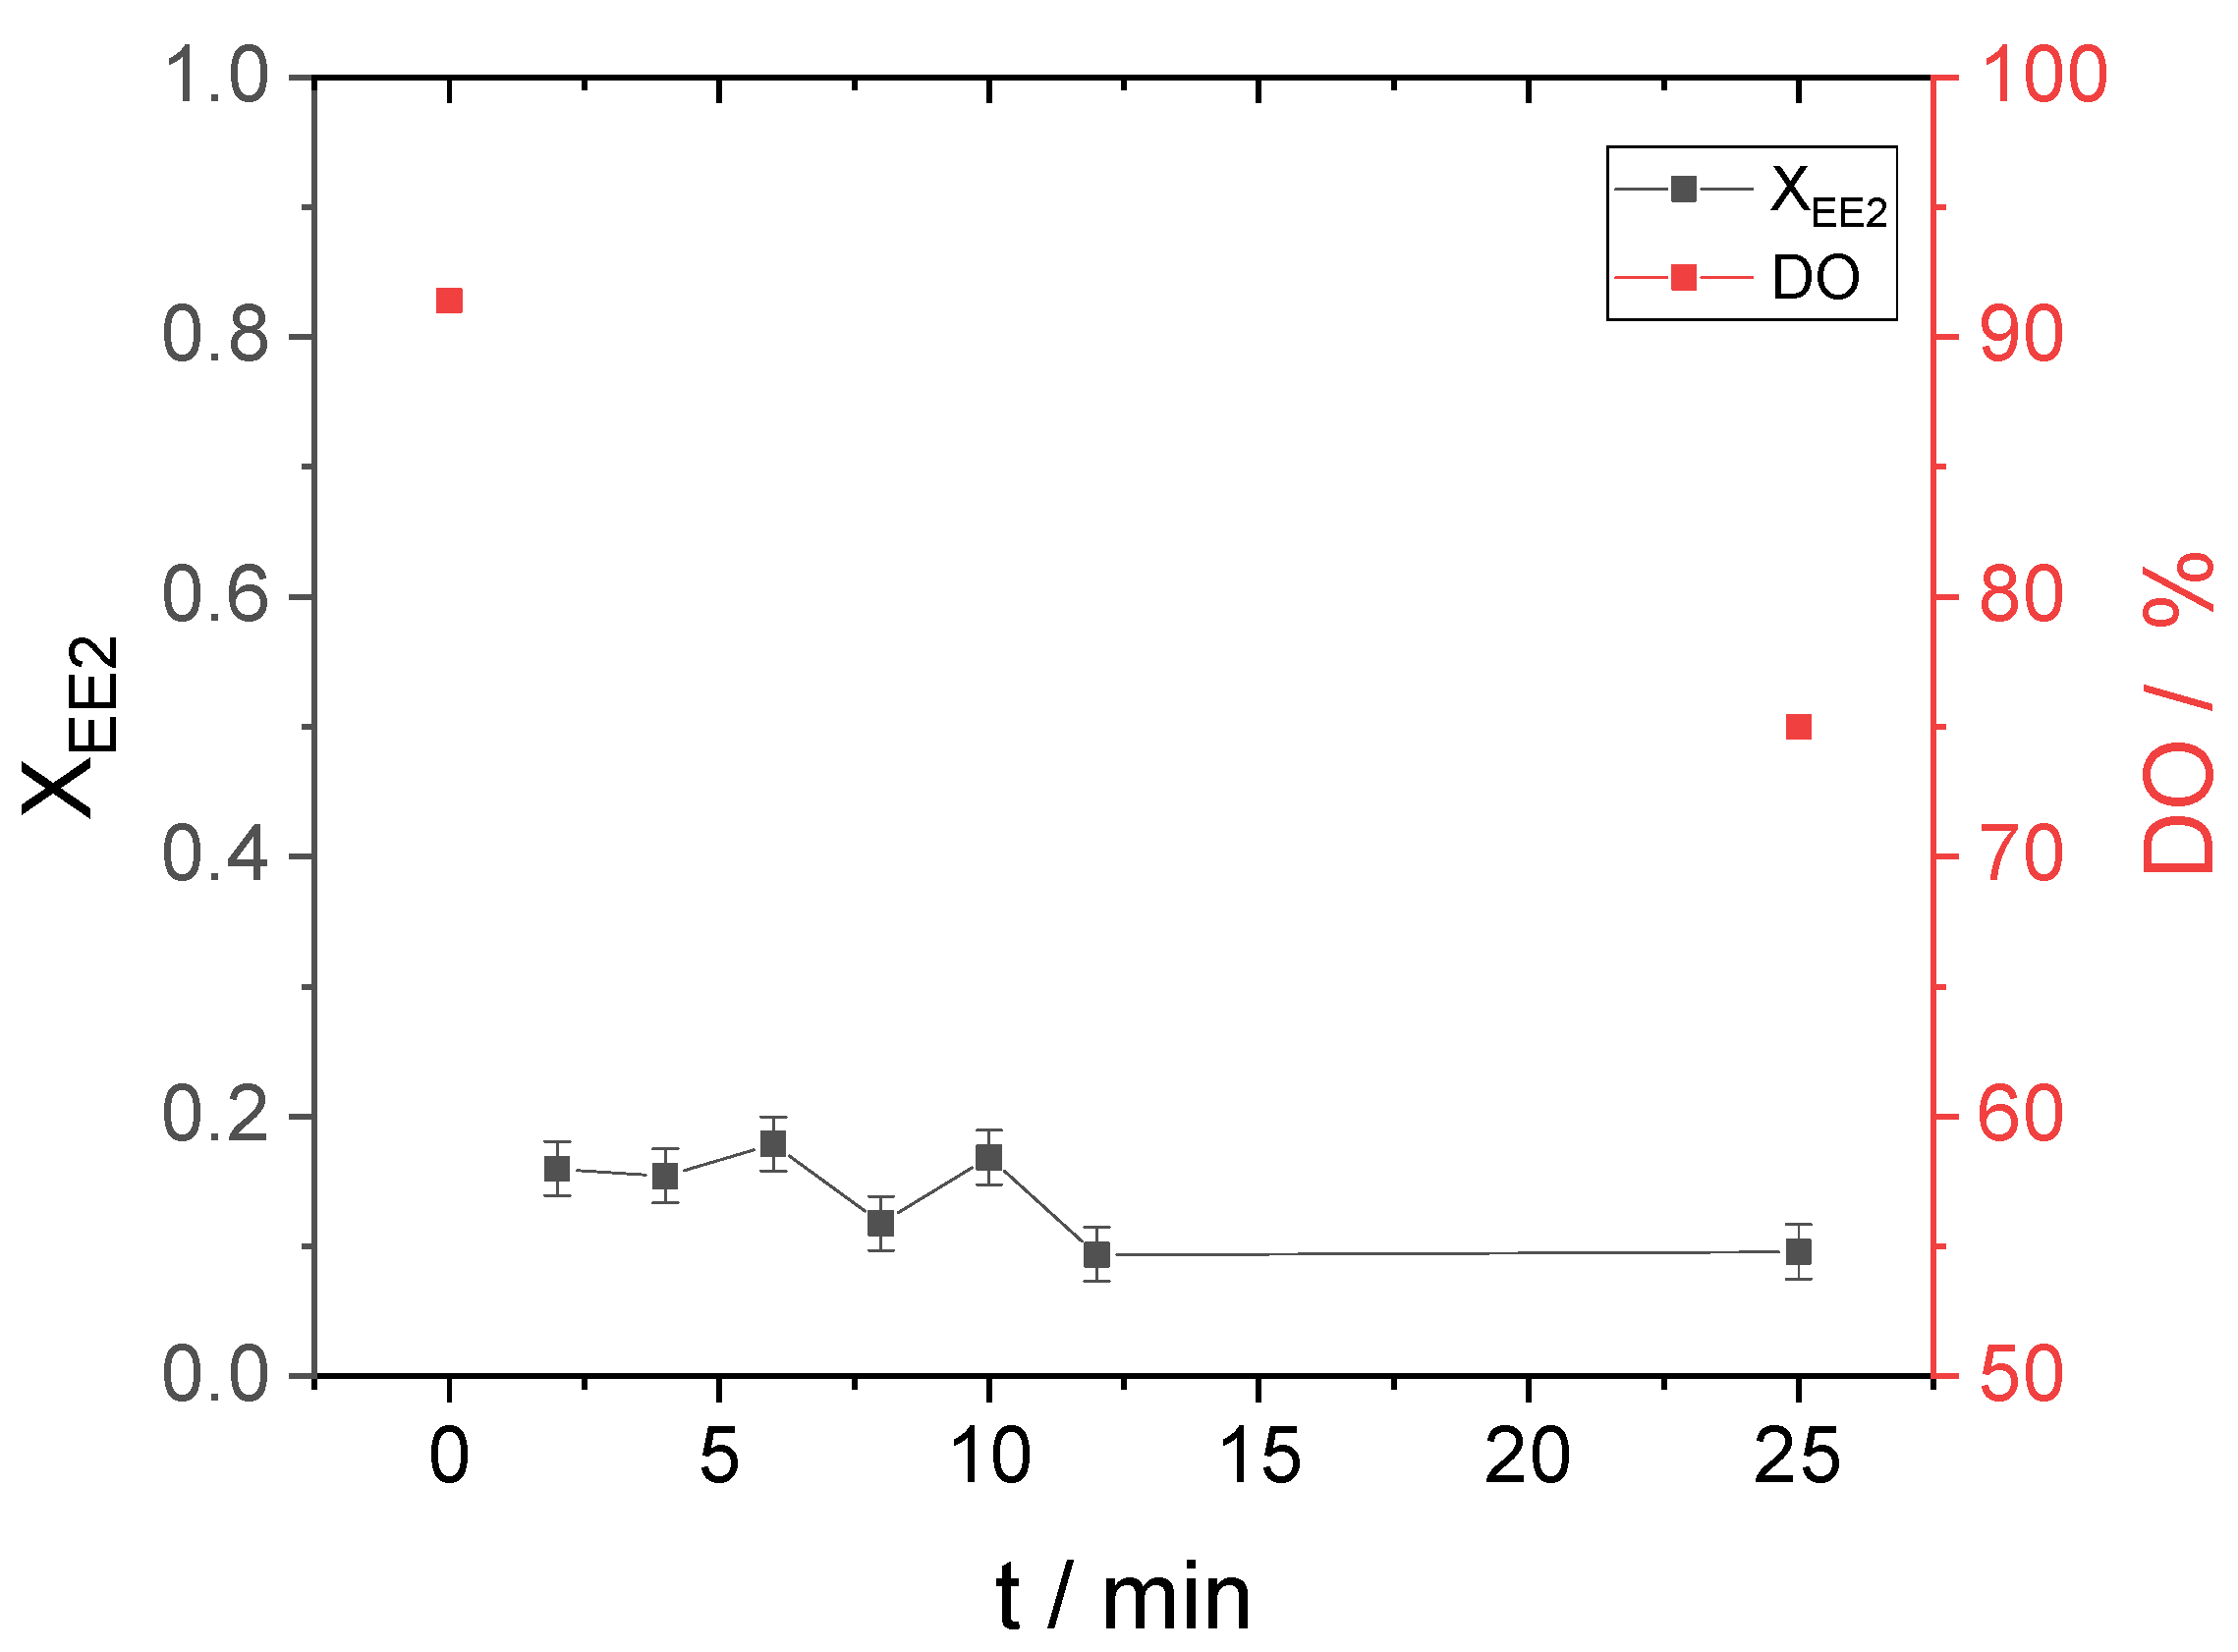
2.4. Start-up Behavior
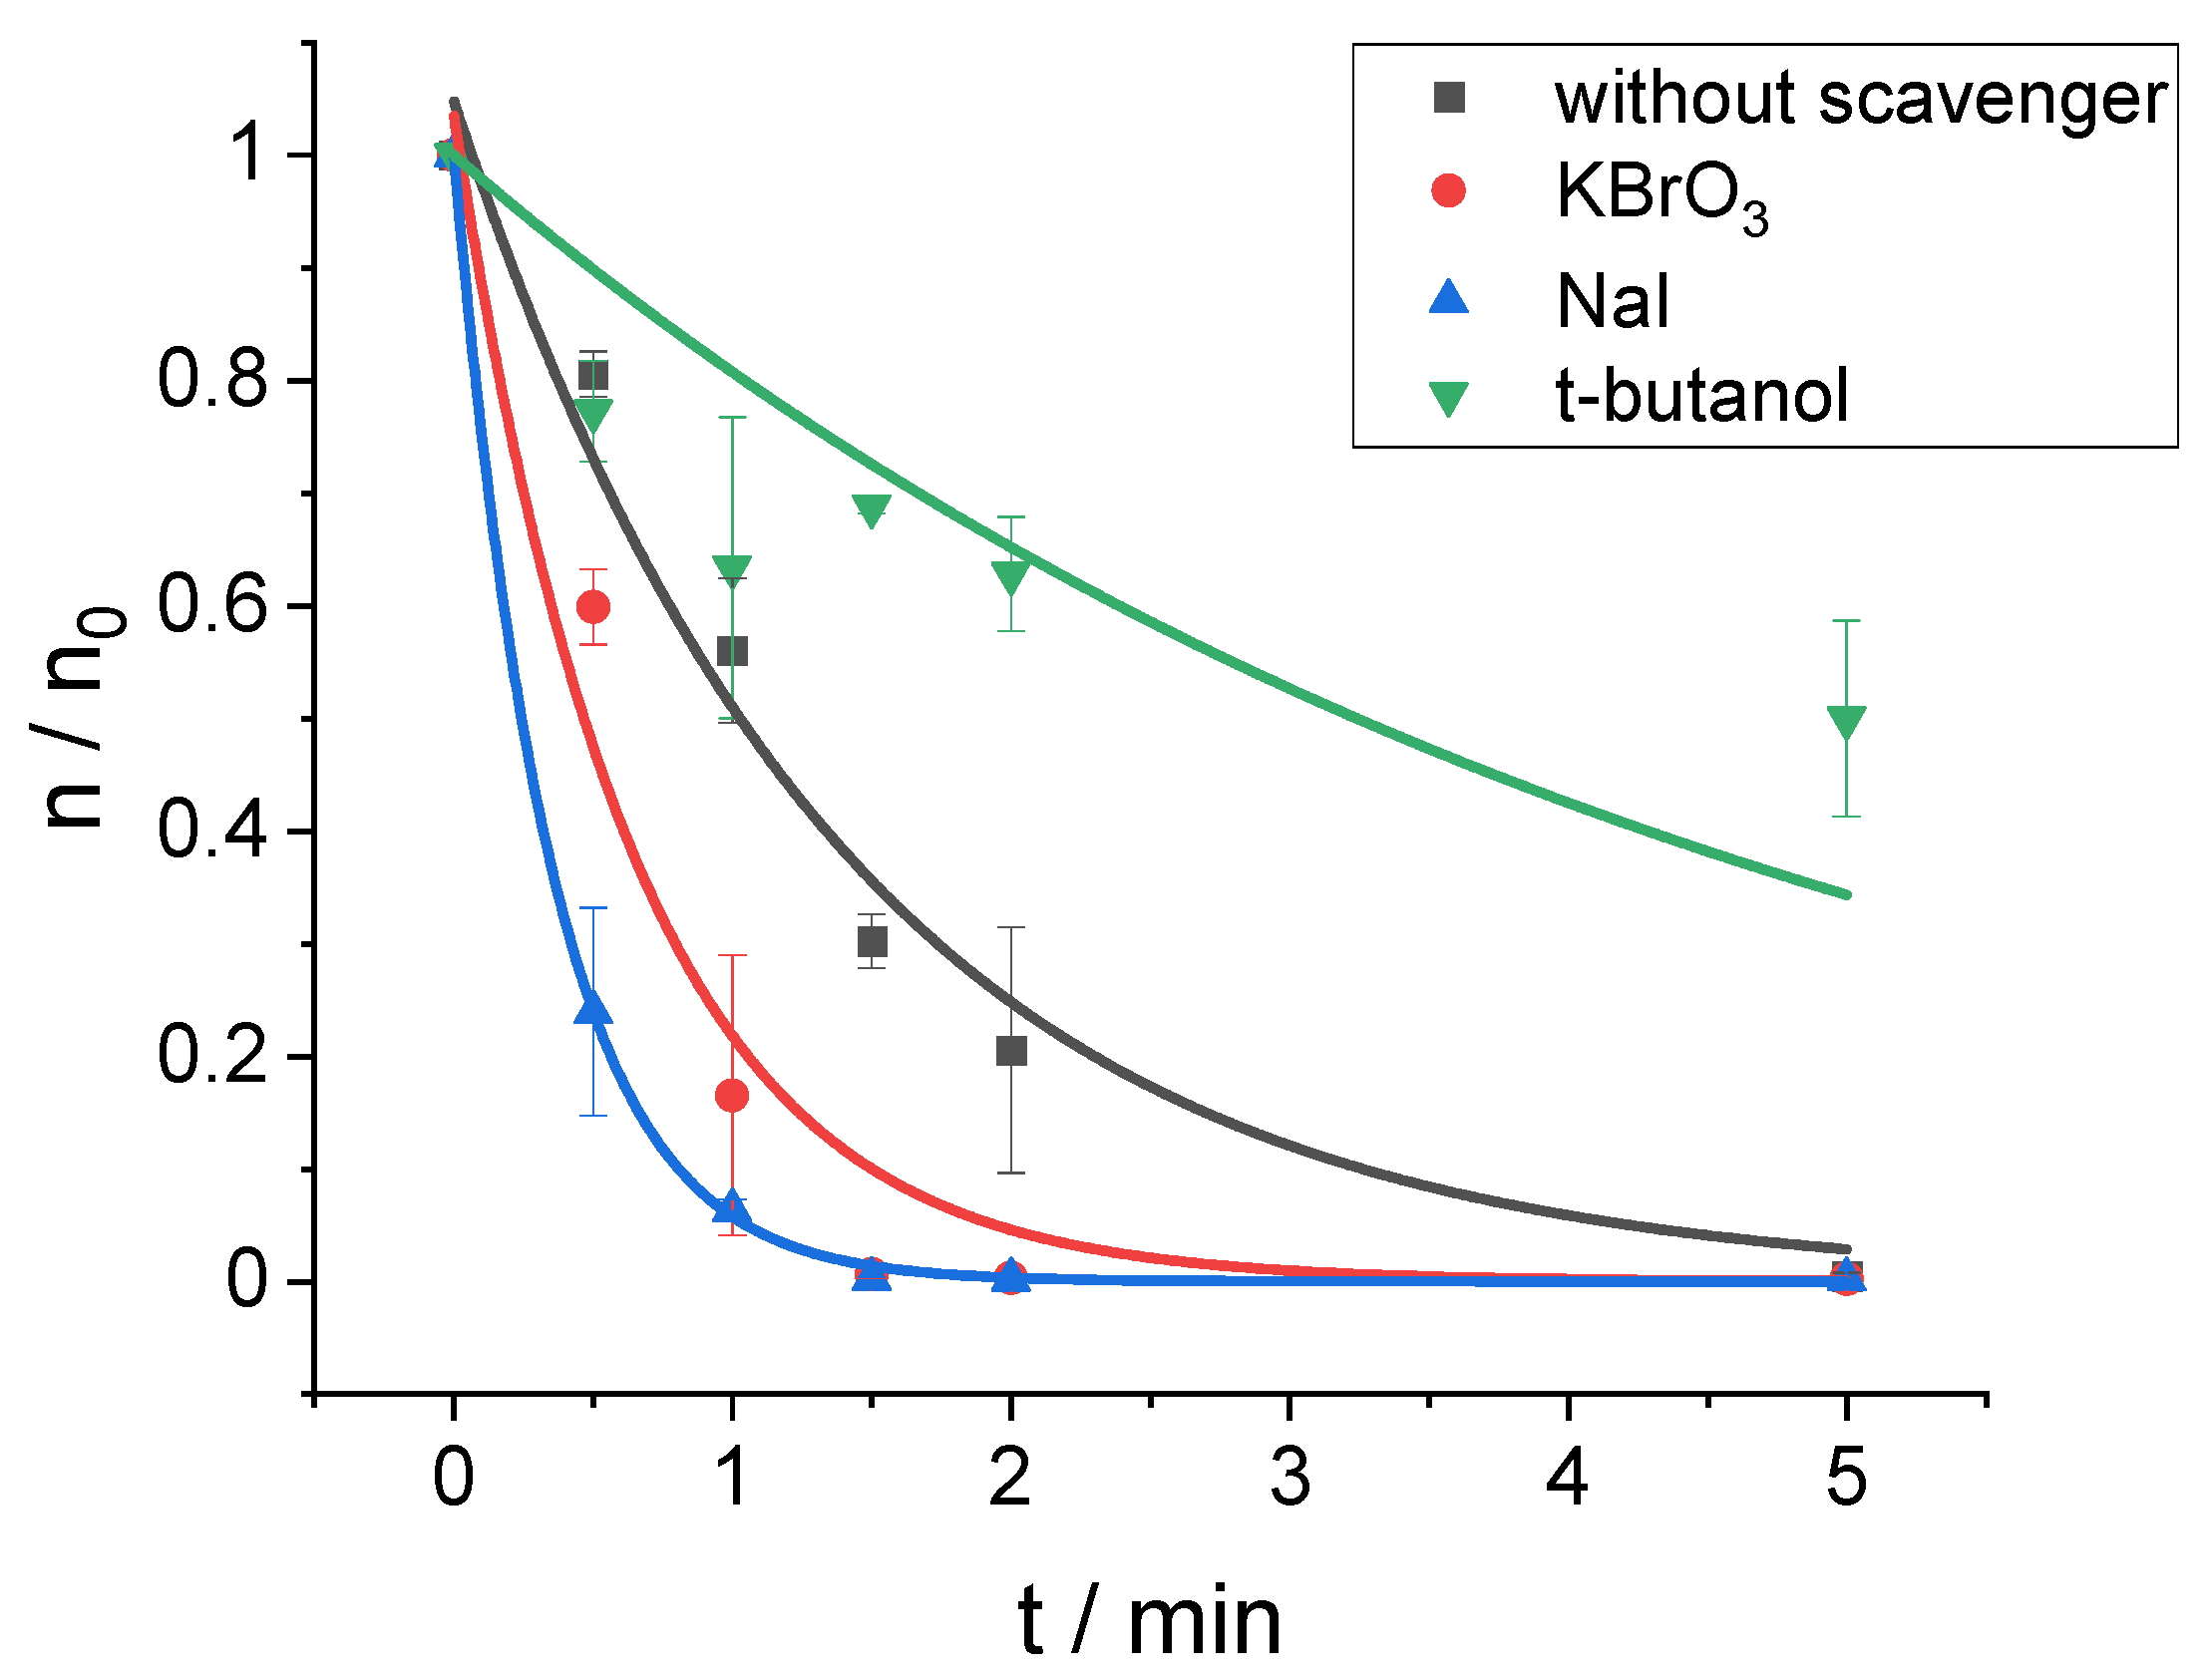
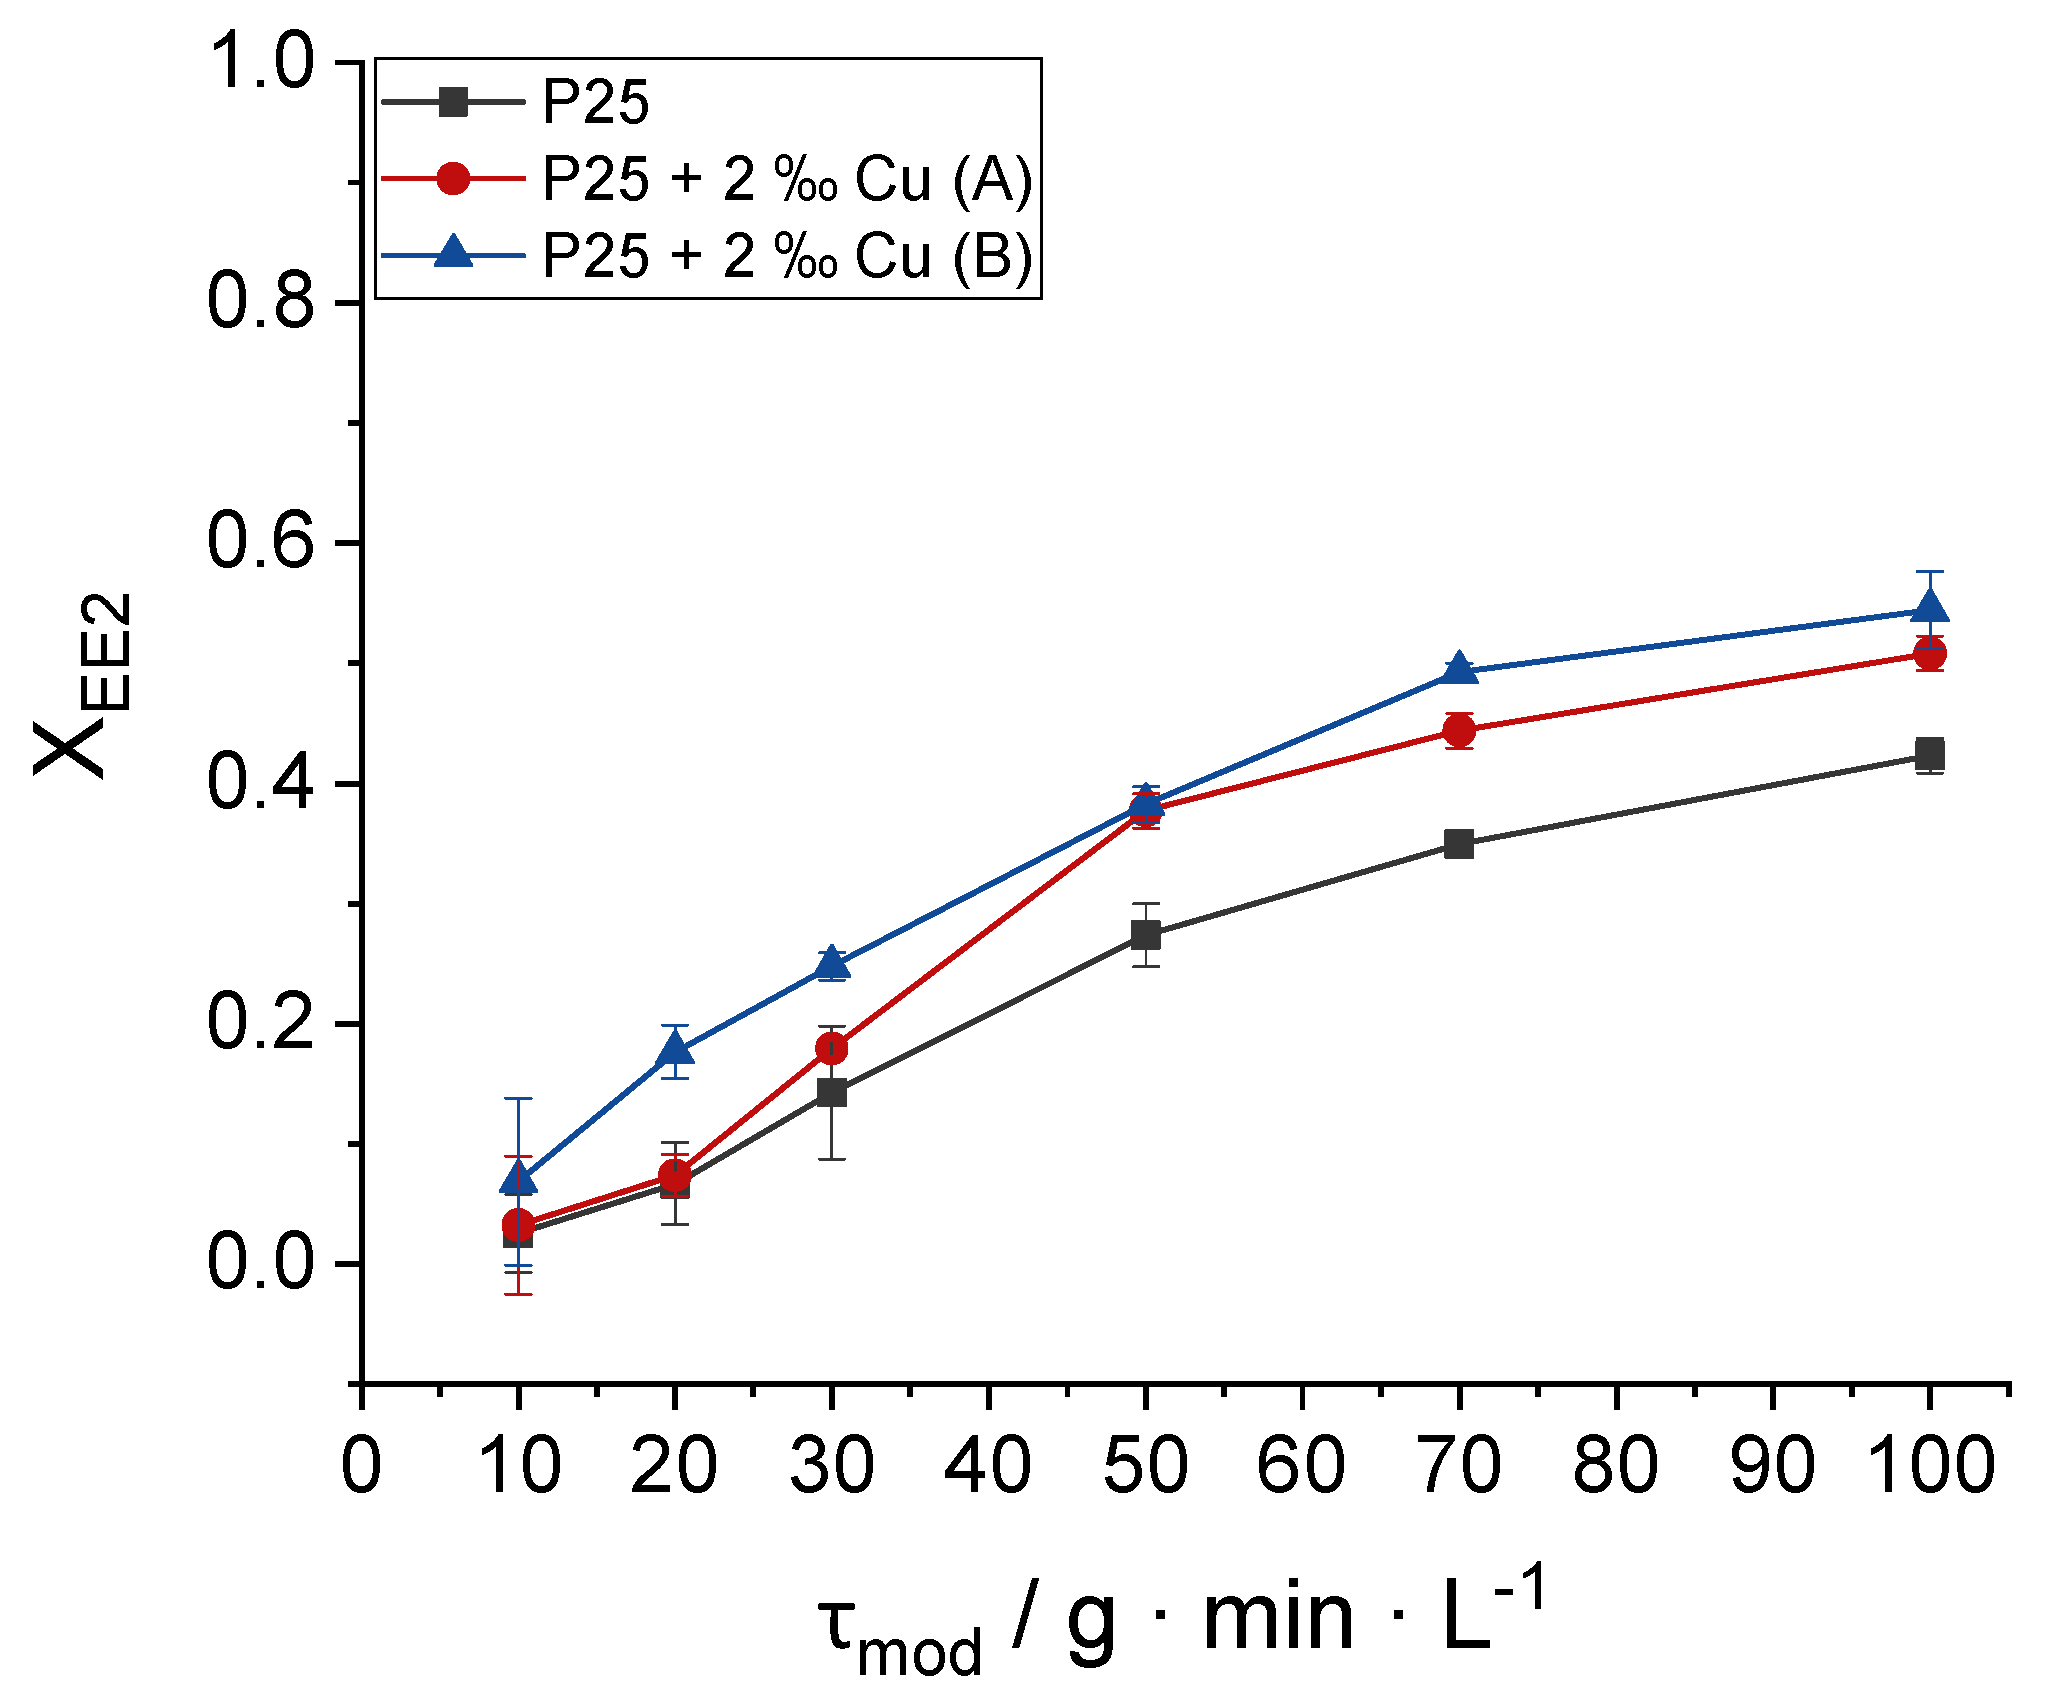
2.5. Macro Kinetics of EE2 Degradation
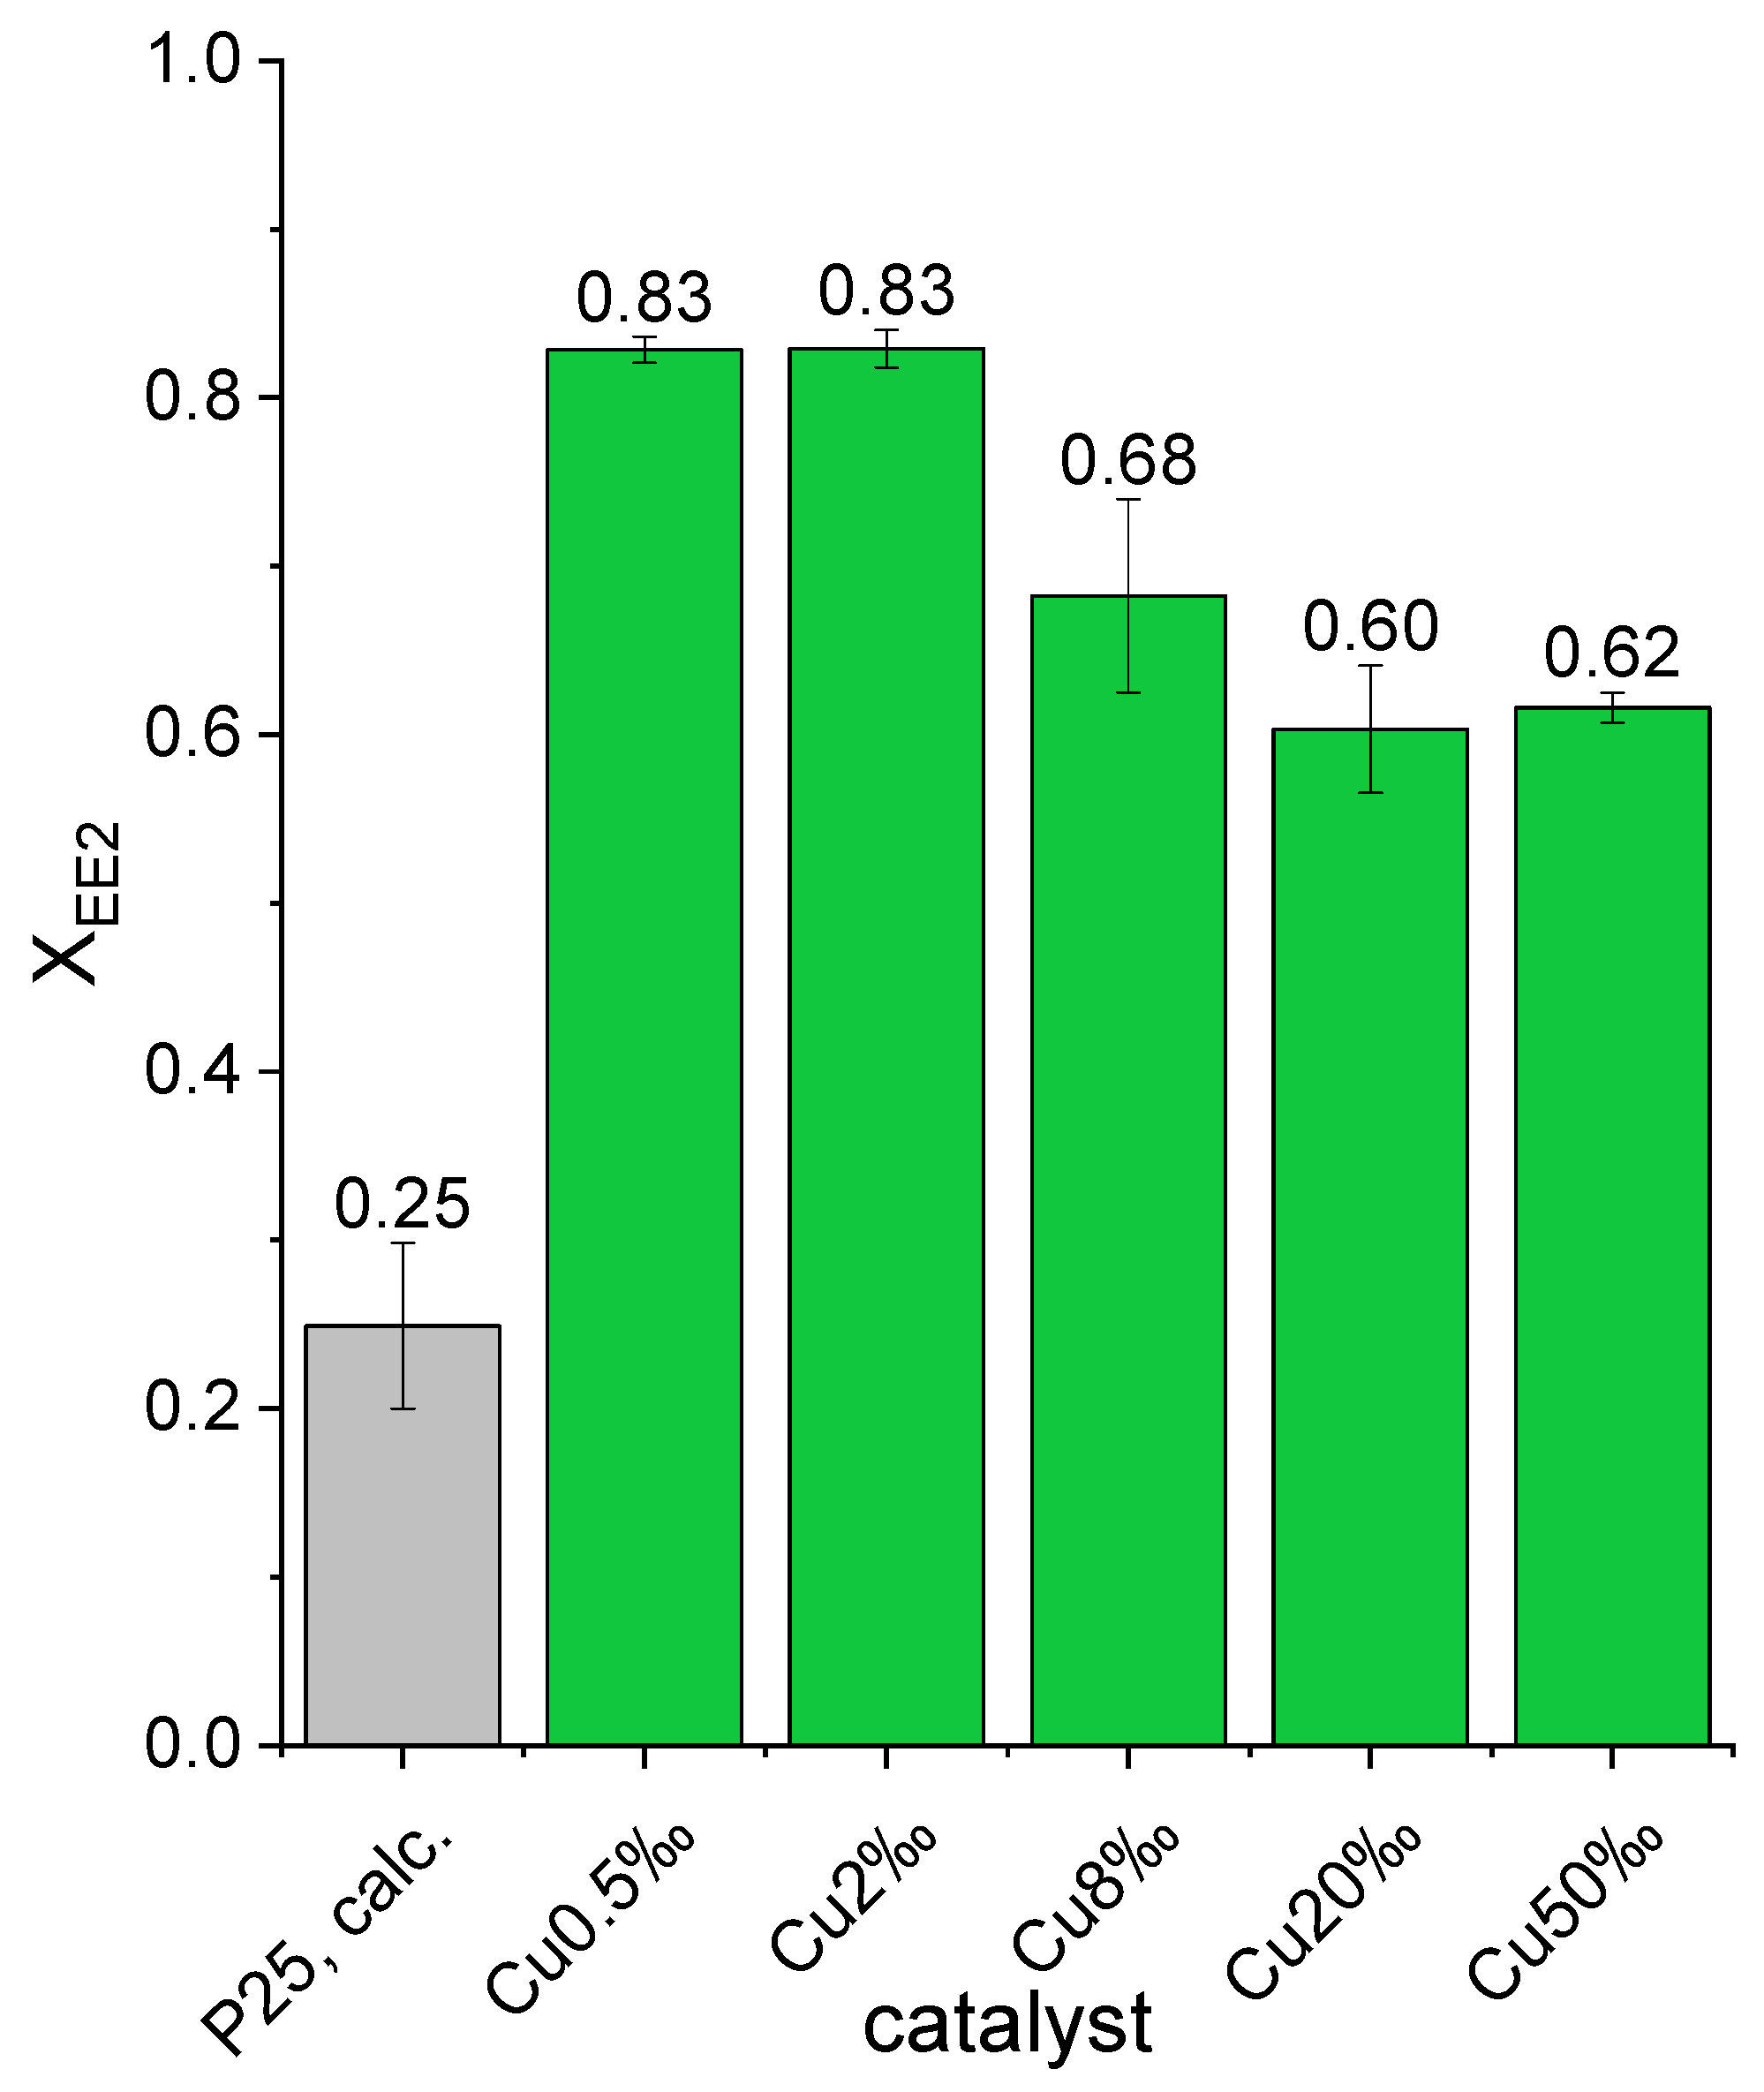
2.6. Influence of Doping Metals
3. Discussion
4. Materials and Methods
4.1. Materials
4.1.1. Chemicals
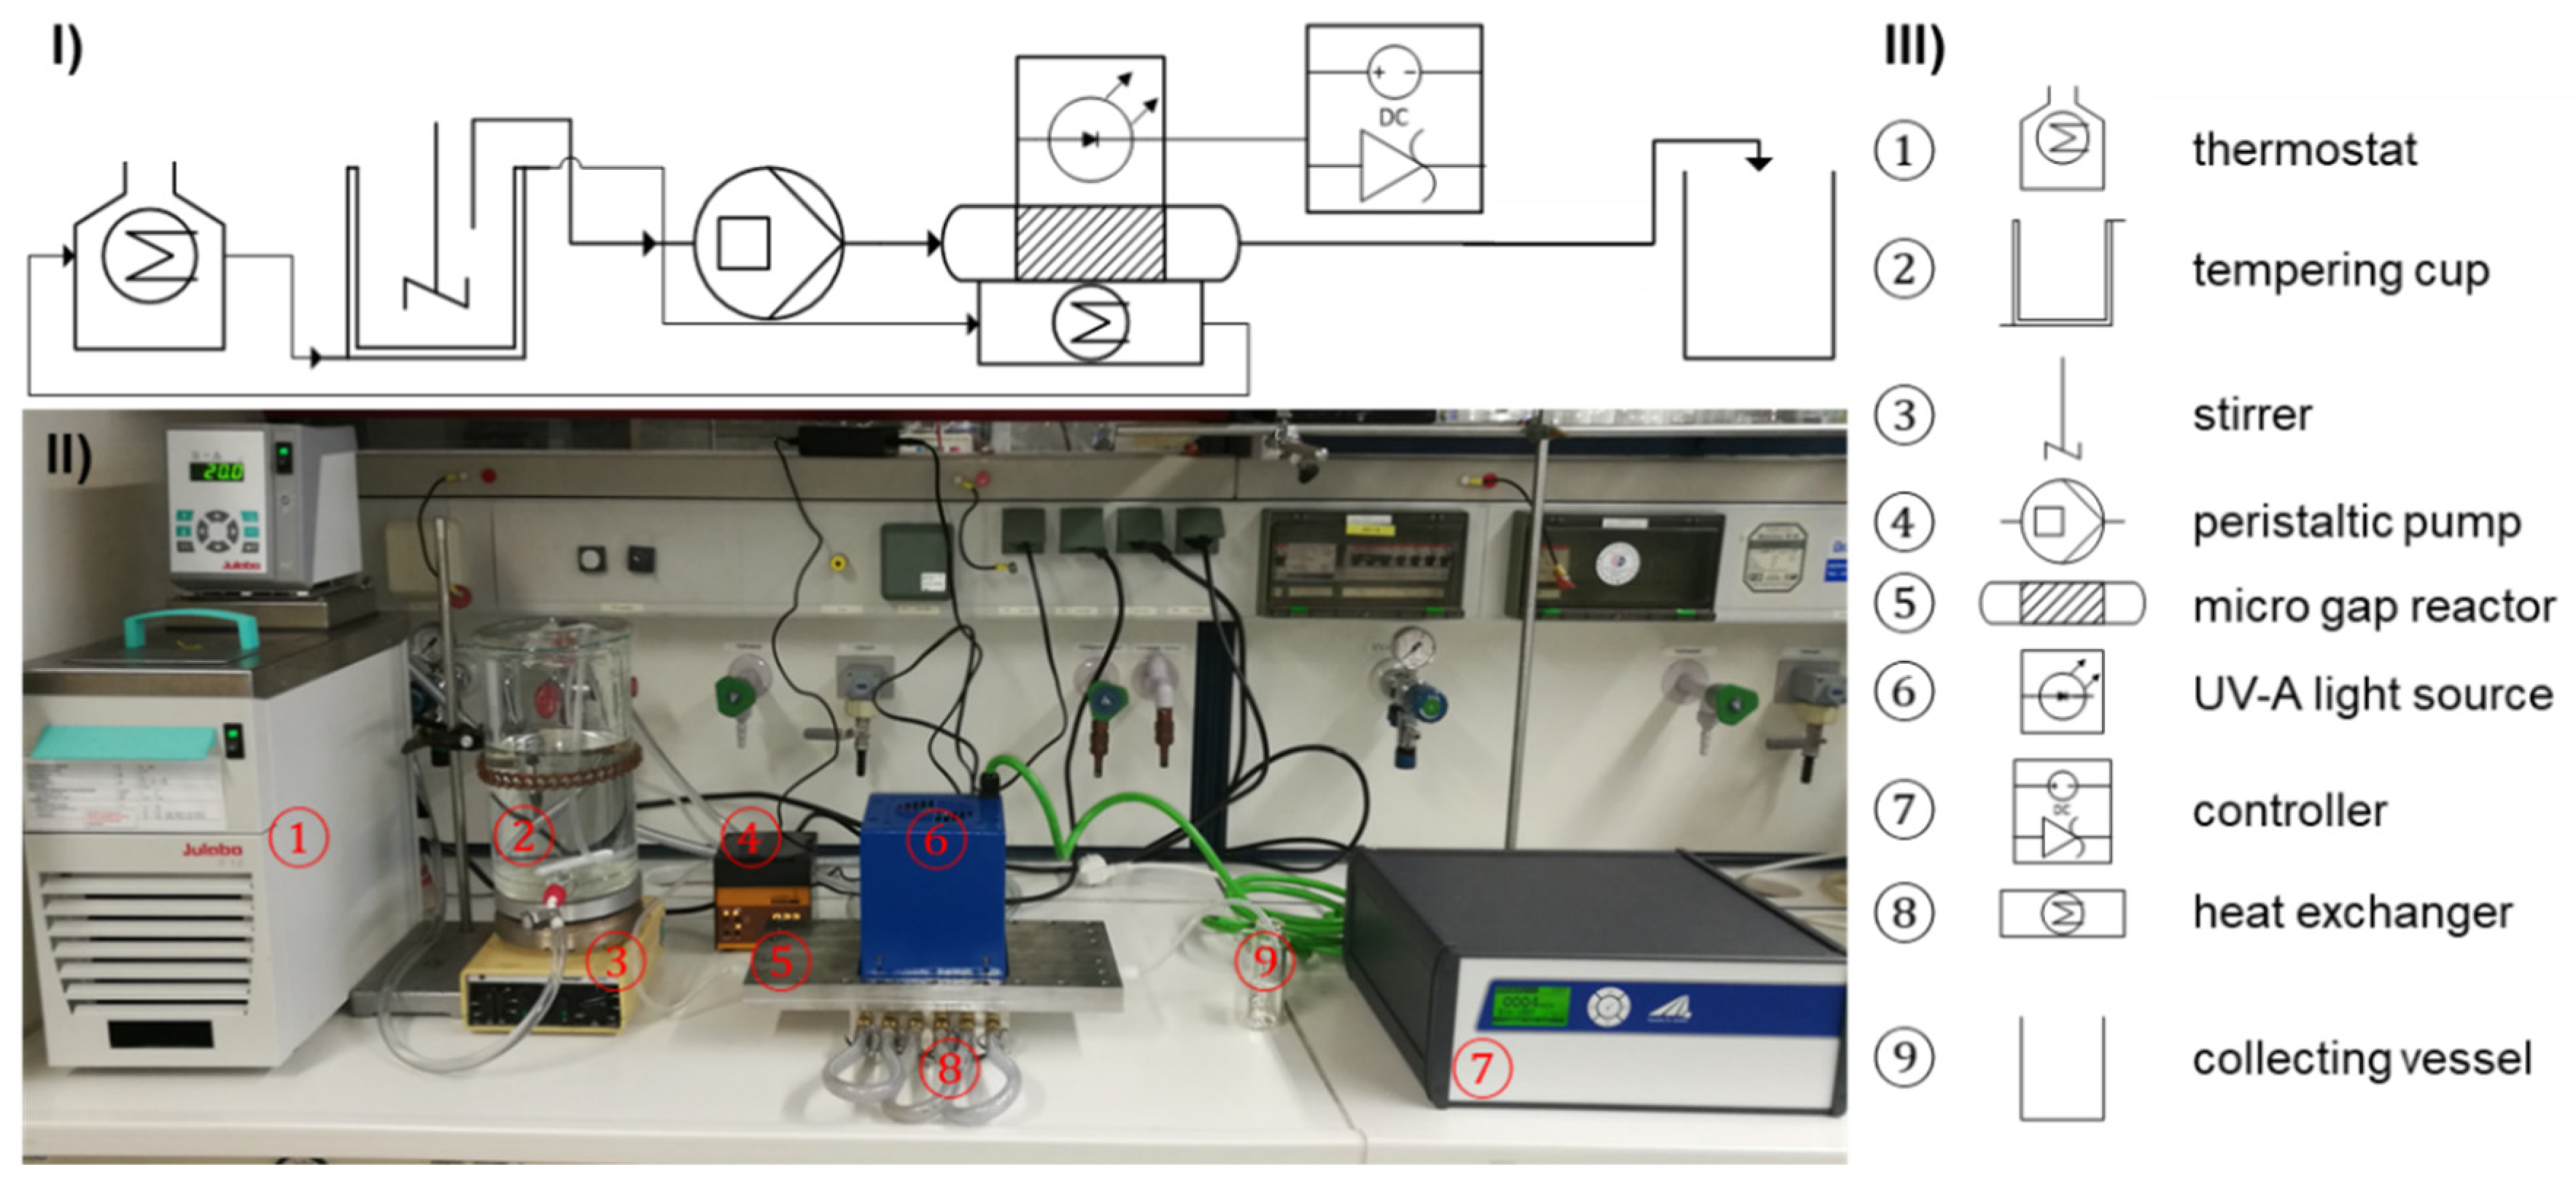
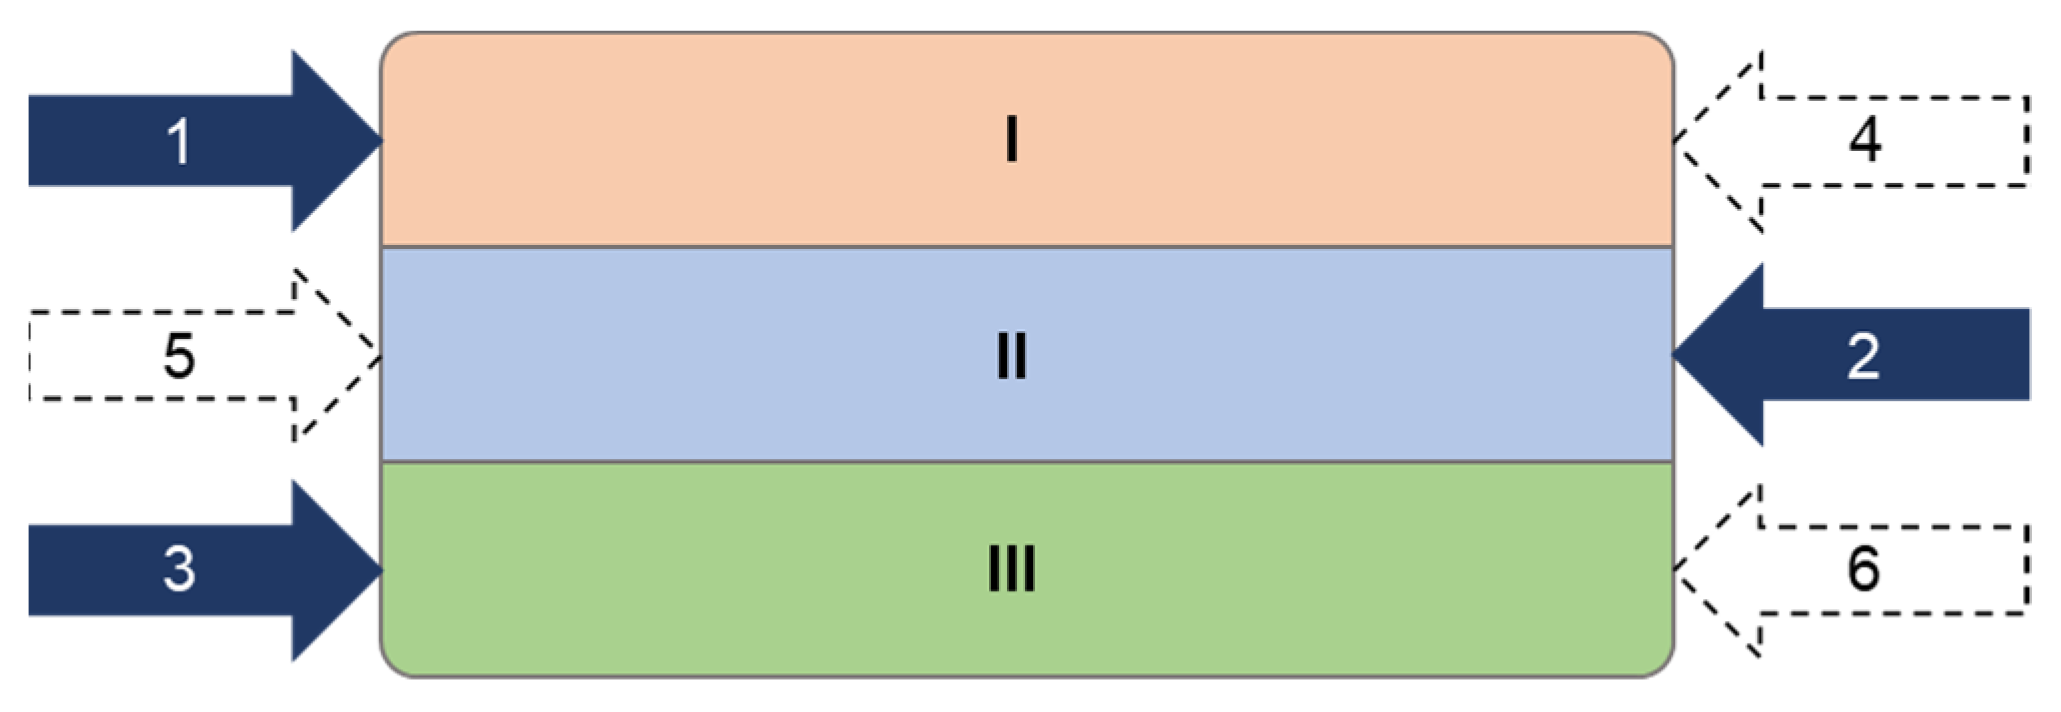
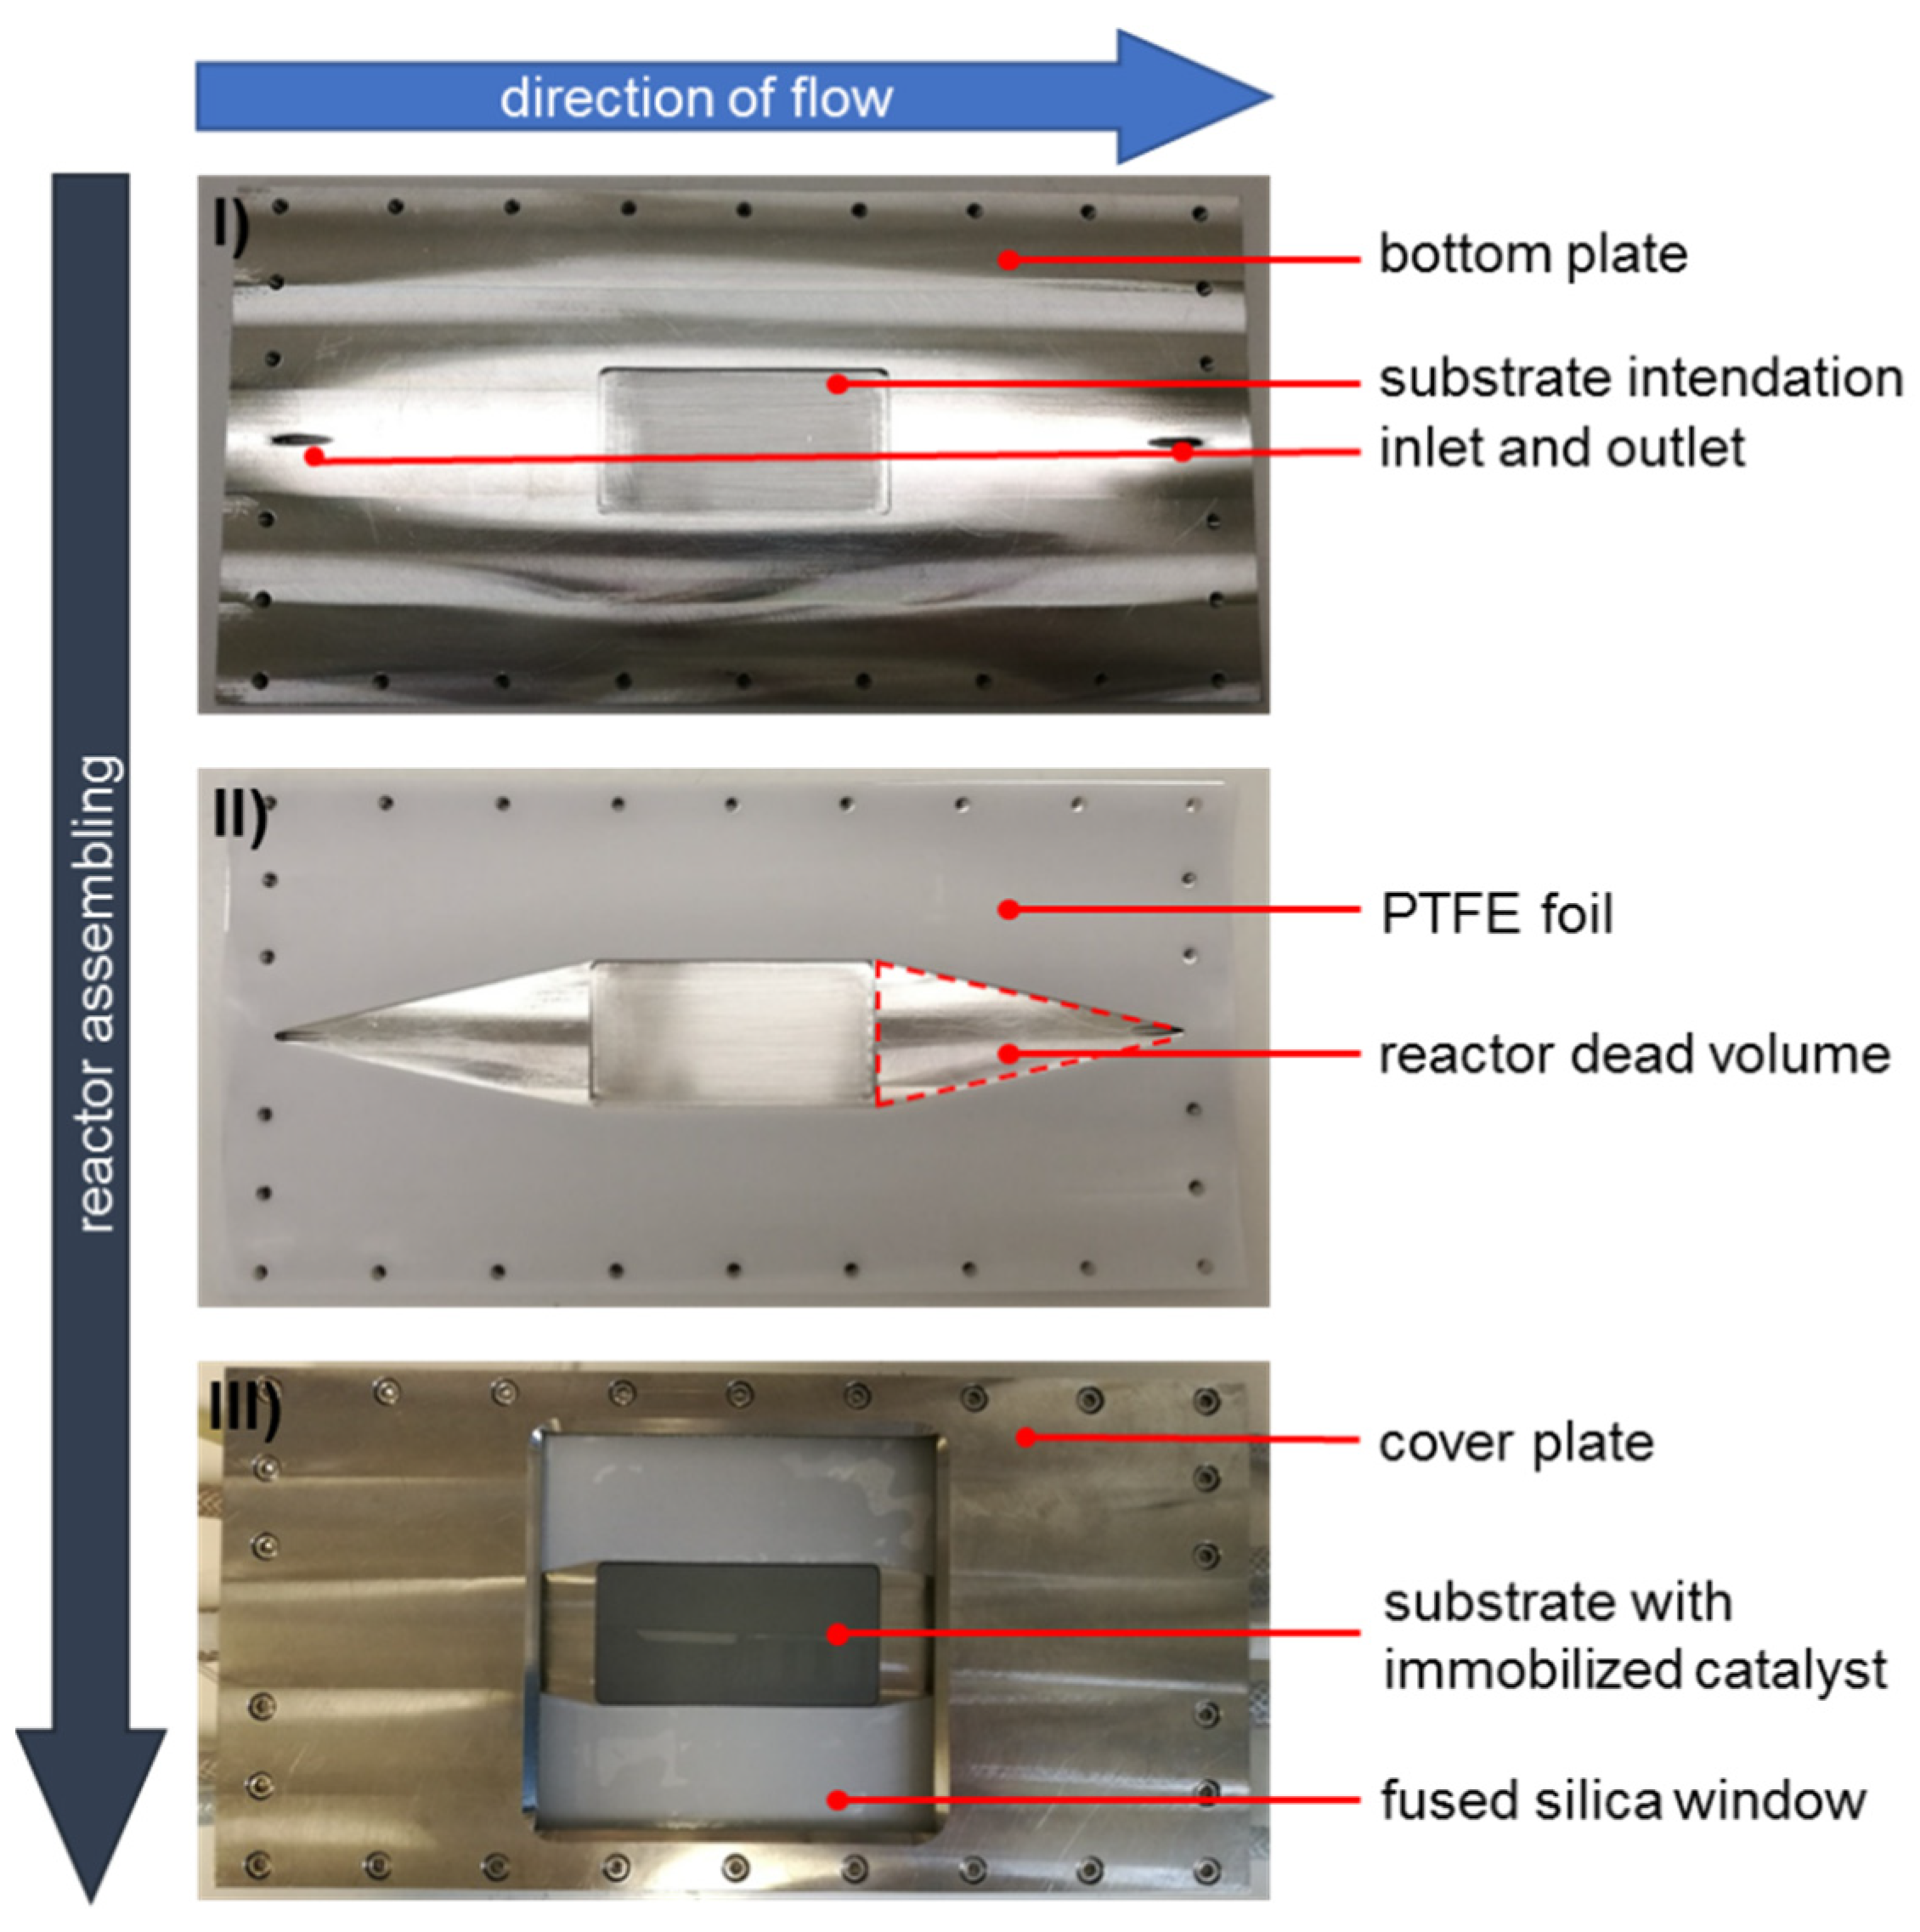
4.1.2. Photocatalysis Microgap Reactor
4.2. Methods
4.2.1. Catalyst Preparation
4.2.2. Substrate Preparation
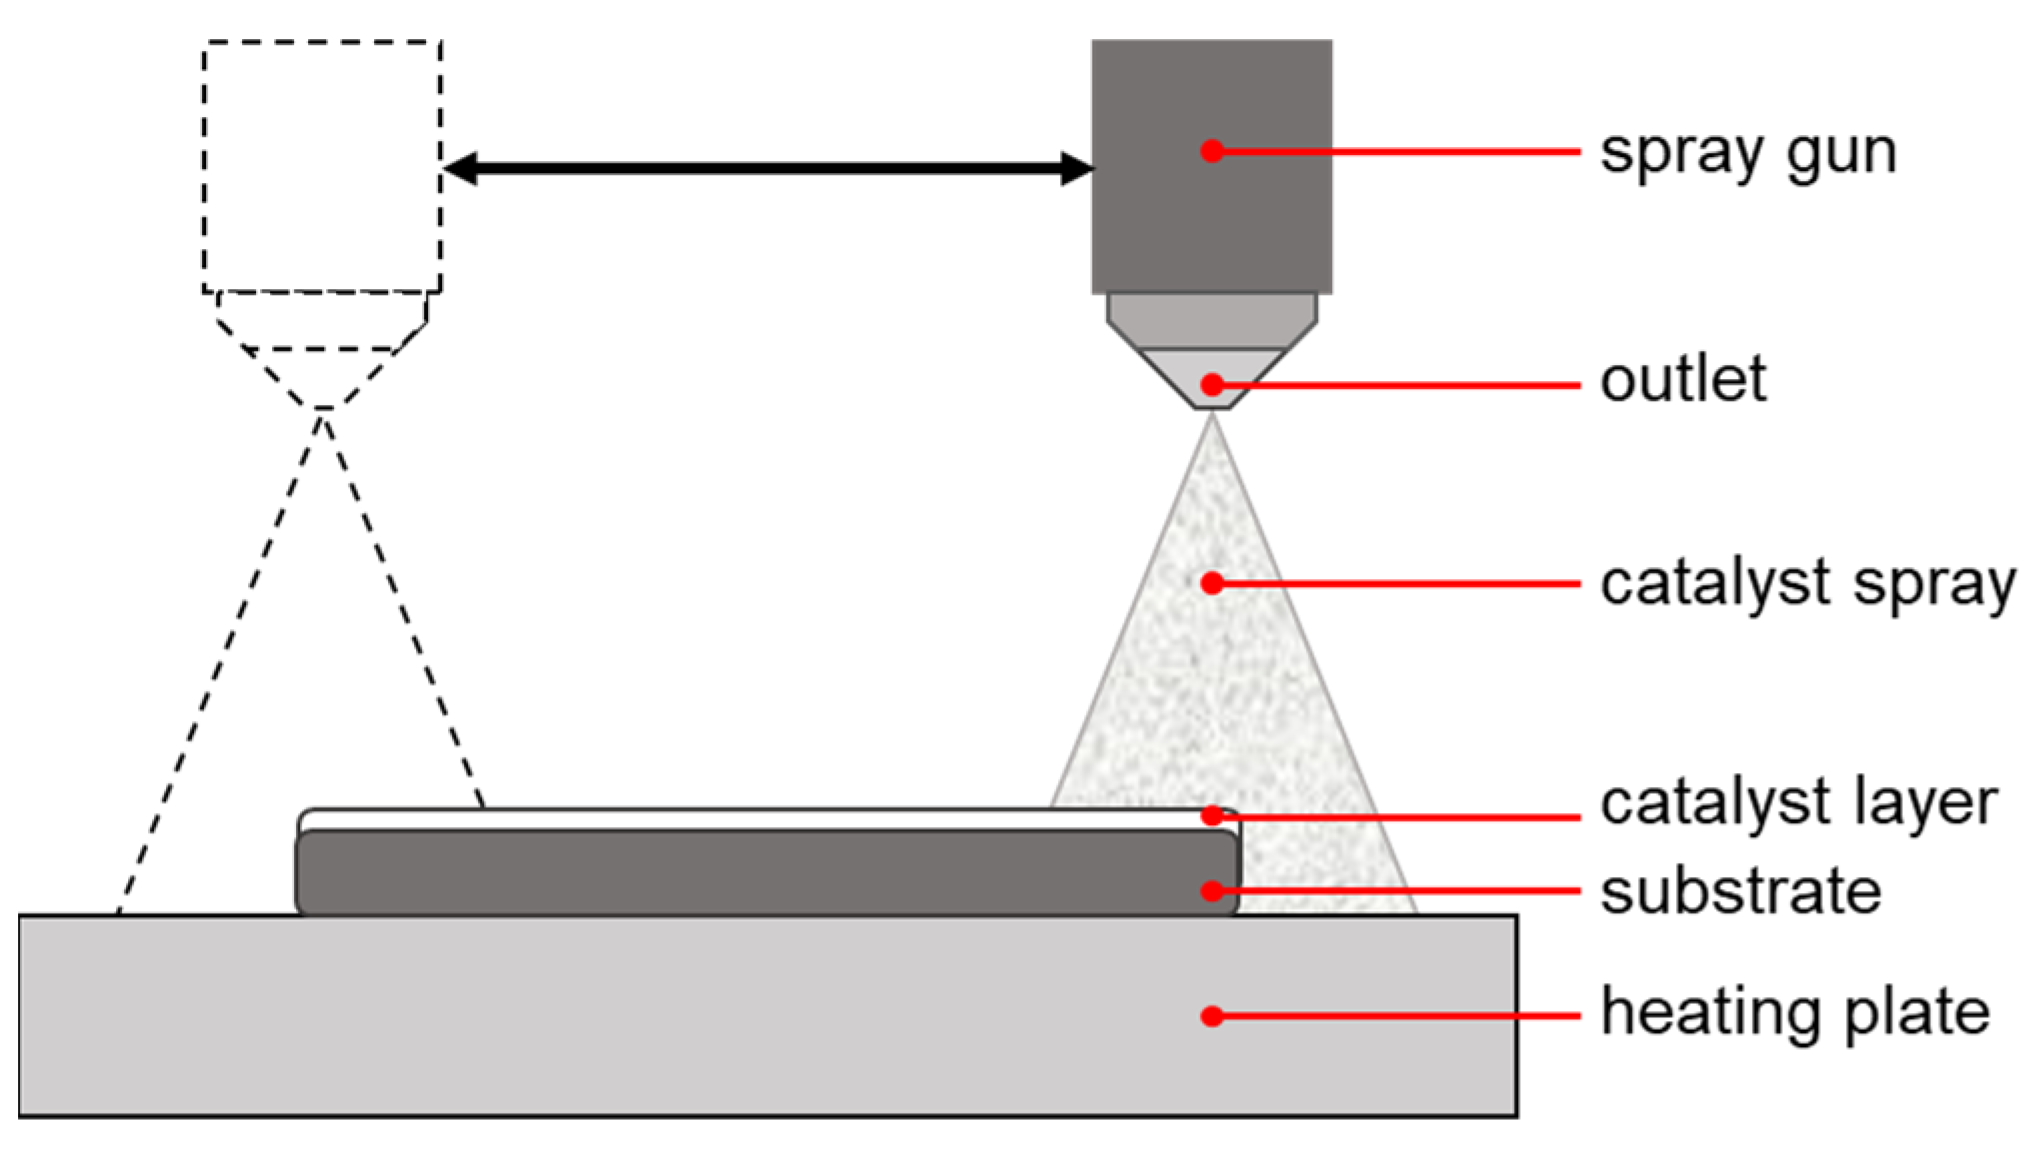
4.2.3. Catalyst Layer Preparation
4.2.4. Catalyst Characterization
4.2.5. Screening Experiments
4.2.6. Photocatalytic Experiments
4.2.7. GC-MS Analysis
4.2.8. UHPLC-MS/MS Analysis
4.2.9. Combinatorial Design
5. Conclusions
Author Contributions
Funding
Data Availability Statement
Conflicts of Interest
Abbreviations
| AOP | advanced oxidation process |
| BET | Brunauer–Emmett–Teller |
| c | concentration |
| cps | counts per second |
| d | thickness |
| DIN | Deutsches Institut für Normung |
| DMF | N, N-dimethyl formamide |
| DO | dissolved oxygen |
| E | irradiance |
| EE2 | 17 α-ethinyl estradiol |
| Eg | band gap energy |
| EIC | extracted ion current |
| ESEM | environmental scanning electron microscopy |
| frot | rotation speed |
| GC-MS | gas chromatography with mass spectrometry coupling |
| h | height |
| I | amperage |
| IUPAC | International Union of Pure and Applied Chemistry |
| UHPLC-MS/MS | ultra high performance liquid chromatography with tandem mass spectrometry coupling |
| LED | Light emitting diode |
| LOD | limit of detection |
| LOQ | limit of quantification |
| m | mass |
| MRM | multireaction monitoring |
| MSTFA | N-(trimethylsilyl)trifluoroacetamide |
| OOR | out of range |
| p | pressure |
| ppb | parts per billion |
| ppm | part per million |
| PSD | process standard deviation |
| PTFE | polytetrafluoroethylene |
| XRD | powder X-ray diffraction |
| Q | volume flow |
| R2 | coefficient of determination |
| Ra | mean roughness, span |
| Rz | mean roughness, arithmetical mean deviation |
| SSA | specific surface area |
| t | time |
| τ | residence time |
| TIC | total ion current |
| TOC | total organic content |
| U | voltage |
| UHPLC | ultra high performance liquid chromatography |
| UV-A | ultraviolet irradiation type A |
| V | volume |
| vf | feed rate |
| wt.% | weight fraction |
| x | mole fraction |
| ϑ | temperature |
| λ | wavelength |
| τmod | modified residence time |
References
- Raza, A.; Razzaq, A.; Mehmood, S.S.; Zou, X.; Zhang, X.; Lv, Y.; Xu, J. Impact of Climate Change on Crops Adaptation and Strategies to Tackle Its Outcome: A Review. Plants 2019, 8, 34. [Google Scholar] [CrossRef] [Green Version]
- Hailemariam, K. Impact of climate change on the water resources of Awash River Basin, Ethiopia. Clim. Res. 1999, 12, 91–96. [Google Scholar] [CrossRef] [Green Version]
- Goyal, M.K.; Surampalli, R.Y. Impact of Climate Change on Water Resources in India. J. Environ. Eng. 2018, 144, 04018054. [Google Scholar] [CrossRef]
- Cabral, H.; Fonseca, V.; Sousa, T.; Leal, M.C. Synergistic Effects of Climate Change and Marine Pollution: An Overlooked Interaction in Coastal and Estuarine Areas. Int. J. Environ. Res. Public Health 2019, 16, 2737. [Google Scholar] [CrossRef] [PubMed] [Green Version]
- Tarawneh, Q.Y.; Chowdhury, S. Trends of Climate Change in Saudi Arabia: Implications on Water Resources. Climate 2018, 6, 8. [Google Scholar] [CrossRef] [Green Version]
- Friedlingstein, P.; Jones, M.W.; O’Sullivan, M.; Andrew, R.M.; Hauck, J.; Peters, G.P.; Peters, W.; Pongratz, J.; Sitch, S.; Le Quéré, C.; et al. Global Carbon Budget 2019. Earth Syst. Sci. Data 2019, 11, 1783–1838. [Google Scholar] [CrossRef] [Green Version]
- Bernauer, T.; Böhmelt, T. International conflict and cooperation over freshwater resources. Nat. Sustain. 2020, 3, 350–356. [Google Scholar] [CrossRef]
- Deng, Y.; Zhao, R. Advanced Oxidation Processes (AOPs) in Wastewater Treatment. Curr. Pollut. Rep. 2015, 1, 167–176. [Google Scholar] [CrossRef] [Green Version]
- Ghernaout, D. Advanced Oxidation Processes for Wastewater Treatment: Facts and Future Trends. OALib 2020, 7, 1–15. [Google Scholar] [CrossRef]
- Prieto-Rodríguez, L.; Oller, I.; Klamerth, N.; Agüera, A.; Rodríguez, E.M.; Malato, S. Application of solar AOPs and ozonation for elimination of micropollutants in municipal wastewater treatment plant effluents. Water Res. 2013, 47, 1521–1528. [Google Scholar] [CrossRef]
- Vogelpohl, A. Applications of AOPs in wastewater treatment. Water Sci. Technol. 2007, 55, 207–211. [Google Scholar] [CrossRef]
- Herrmann, J.M. Photocatalysis. In Kirk-Othmer Encyclopedia of Chemical Technology; John Wiley & Sons, Inc.: Hoboken, NJ, USA, 2017; pp. 1–44. [Google Scholar]
- Grätzel, M.; Rotzinger, F.P. The influence of the crystal lattice structure on the conduction band energy of oxides of titanium(IV). Chem. Phys. Lett. 1985, 118, 474–477. [Google Scholar] [CrossRef]
- Jaiswal, R.; Bharambe, J.; Patel, N.; Dashora, A.; Kothari, D.; Miotello, A. Copper and Nitrogen co-doped TiO2 photocatalyst with enhanced optical absorption and catalytic activity. Appl. Catal. B Environ. 2015, 168, 333–341. [Google Scholar] [CrossRef]
- Mathew, S.; Ganguly, P.; Rhatigan, S.; Kumaravel, V.; Byrne, C.; Hinder, S.J.; Bartlett, J.; Nolan, M.; Pillai, S.C. Cu-Doped TiO2: Visible Light Assisted Photocatalytic Antimicrobial Activity. Appl. Sci. 2018, 8, 2067. [Google Scholar] [CrossRef] [Green Version]
- Ren, F.; Li, H.; Wang, Y.; Yang, J. Enhanced photocatalytic oxidation of propylene over V-doped TiO2 photocatalyst: Reaction mechanism between V5+ and single-electron-trapped oxygen vacancy. Appl. Catal. B Environ. 2015, 176, 160–172. [Google Scholar] [CrossRef]
- Kumaravel, V.; Rhatigan, S.; Mathew, S.; Bartlett, J.; Nolan, M.; Hinder, S.J.; Sharma, P.K.; Singh, A.; Byrne, J.A.; Harrison, J.; et al. Indium-Doped TiO2 Photocatalysts with High-Temperature Anatase Stability. J. Phys. Chem. C 2019, 123, 21083–21096. [Google Scholar] [CrossRef]
- Liqiang, J.; Xiaojun, S.; Baifu, X.; Baiqi, W.; Weimin, C.; Honggang, F. The preparation and characterization of La doped TiO2 nanoparticles and their photocatalytic activity. J. Solid State Chem. 2004, 177, 3375–3382. [Google Scholar] [CrossRef]
- Ahmed, S.N.; Haider, W. Heterogeneous photocatalysis and its potential applications in water and wastewater treatment: A review. Nanotechnology 2018, 29, 342001. [Google Scholar] [CrossRef] [PubMed] [Green Version]
- Loeb, S.K.; Alvarez, P.J.J.; Brame, J.A.; Cates, E.L.; Choi, W.; Crittenden, J.; Dionysiou, D.D.; Li, Q.; Puma, G.L.; Quan, X.; et al. The Technology Horizon for Photocatalytic Water Treatment: Sunrise or Sunset? Environ. Sci. Technol. 2018, 53, 2937–2947. [Google Scholar] [CrossRef] [PubMed]
- Orton, F.; Tyler, C.R. Do Hormone-Modulating Chemicals Impact on Reproduction and Development of Wild Amphibians? Biol. Rev. 2015, 90, 1100–1117. [Google Scholar] [CrossRef] [PubMed]
- Adeel, M.; Song, X.; Wang, Y.; Francis, D.; Yang, Y. Environmental impact of estrogens on human, animal and plant life: A critical review. Environ. Int. 2017, 99, 107–119. [Google Scholar] [CrossRef] [PubMed]
- Nasri, A.; Mezni, A.; Lafon, P.A.; Wahbi, A.; Cubedo, N.; Clair, P.; Harrath, A.H.; Beyrem, H.; Rossel, M.; Perrier, V. Ethinylestradiol (EE2) residues from birth control pills impair nervous system development and swimming behavior of zebrafish larvae. Sci. Total Environ. 2021, 770, 145272. [Google Scholar] [CrossRef]
- Aris, A.Z.; Shamsuddin, A.S.; Praveena, S.M. Occurrence of 17α-ethynylestradiol (EE2) in the environment and effect on exposed biota: A review. Environ. Int. 2014, 69, 104–119. [Google Scholar] [CrossRef]
- Murray, J.L.; Wriedt, H.A. The O−Ti (Oxygen-Titanium) system. J. Phase Equilibria Diffus. 1987, 8, 148–165. [Google Scholar] [CrossRef]
- Sclafani, A.; Herrmann, J.M. Comparison of the Photoelectronic and Photocatalytic Activities of Various Anatase and Rutile Forms of Titania in Pure Liquid Organic Phases and in Aqueous Solutions. J. Phys. Chem. 1996, 100, 13655–13661. [Google Scholar] [CrossRef]
- Shannon, R.D. Revised effective ionic radii and systematic studies of interatomic distances in halides and chalcogenides. Acta Crystallogr. Sect. A Cryst. Phys. Diffr. Theor. Gen. Crystallogr. 1976, 32, 751–767. [Google Scholar] [CrossRef]
- Thommes, M.; Kaneko, K.; Neimark, A.V.; Olivier, J.P.; Rodriguez-Reinoso, F.; Rouquerol, J.; Sing, K.S. Physisorption of gases, with special reference to the evaluation of surface area and pore size distribution (IUPAC Technical Report). Pure Appl. Chem. 2015, 87, 1051–1069. [Google Scholar] [CrossRef] [Green Version]
- Engelhardt, T.B.; Schmitz-Stöwe, S.; Schwarz, T.; Stöwe, K. Development of A Novel High Throughput Photo-catalyst Screening Procedure: UV-A Degradation of 17α-Ethinylestradiol with Doped TiO2-Based Photo-catalysts. Materials 2020, 13, 1365. [Google Scholar] [CrossRef] [Green Version]
- Abramović, B.; Despotović, V.; Šojić, D.; Finčur, N. Mechanism of clomazone photocatalytic degradation: Hydroxyl radical, electron and hole scavengers. React. Kinet. Mech. Catal. 2014, 115, 67–79. [Google Scholar] [CrossRef]
- Yanagida, S.; Nakajima, A.; Sasaki, T.; Kameshima, Y.; Okada, K. Processing and Photocatalytic Properties of Transparent 12 Tungsto(VI) Phosphoric Acid−TiO2 Hybrid Films. Chem. Mater. 2008, 20, 3757–3764. [Google Scholar] [CrossRef]
- Ohko, Y.; Hashimoto, K.; Fujishima, A. Kinetics of Photocatalytic Reactions under Extremely Low-Intensity UV Illumination on Titanium Dioxide Thin Films. J. Phys. Chem. A 1997, 101, 8057–8062. [Google Scholar] [CrossRef]
- Attri, P.; Kim, Y.H.; Park, D.H.; Park, J.H.; Hong, Y.J.; Uhm, H.S.; Kim, K.-N.; Fridman, A.; Choi, E.H. Generation mechanism of hydroxyl radical species and its lifetime prediction during the plasma-initiated ultraviolet (UV) photolysis. Sci. Rep. 2015, 5, srep09332. [Google Scholar] [CrossRef] [PubMed]
- Montgomery, D.C. Design and Analysis of Experiments, 7th ed.; Wiley: Hoboken, NJ, USA, 2009; ISBN 978-0-470-39882-1. [Google Scholar]


| System | PSD/µg L−1 | LOD/µg L−1 | LOQ/µg L−1 |
|---|---|---|---|
| GC-MS | 1.10 × 10³ | 2.84 × 10³ | 5.68 × 10³ |
| UHPLC-MS/MS | 0.099 | 0.69 | 1.39 |
| Lattice Parameters/Å | ||||||
|---|---|---|---|---|---|---|
| Phase Composition/wt.% | Anatase | Rutile | ||||
| Sample | Anatase | Rutile | a | c | a | c |
| a. r. | 84.54 ± 0.85 | 15.46 ± 0.15 | 3.7836(2) | 9.5042(6) | 4.5929(3) | 2.9572(4) |
| calcined | 83.19 ± 0.83 | 16.81 ± 0.17 | 3.7841(3) | 9.5057(7) | 4.5927(4) | 2.9587(4) |
| TiSol-NH4 | 87.60 ± 0.88 | 12.40 ± 0.12 | 3.7851(7) | 9.506(2) | 4.5935(8) | 2.9593(6) |
| 0.5‰ Cu | 82.69 ± 0.83 | 17.31 ± 0.17 | 3.7841(1) | 9.5046(1) | 4.5929(1) | 2.9579(1) |
| 2.0‰ Cu | 80.46 ± 0.80 | 19.54 ± 0.20 | 3.7840(1) | 9.5056(1) | 4.5929(1) | 2.9579(1) |
| 8.0‰ Cu | 82.53 ± 0.83 | 17.47 ± 0.17 | 3.7839(1) | 9.5047(1) | 4.5925(1) | 2.9578(1) |
| 20‰ Cu | 80.86 ± 0.81 | 19.14 ± 0.19 | 3.7842(1) | 9.5051(1) | 4.5928(1) | 2.9579(1) |
| 50‰ Cu | 82.28 ± 0.82 | 17.72 ± 0.18 | 3.7843(1) | 9.5039(1) | 4.5929(1) | 2.9579(1) |
| Analyte | of Transitions | Cone Voltage/V | Collision Energy/eV |
|---|---|---|---|
| 17 α-ethinyl estradiol | 295.10 > 143.00 | 40 | 47 |
| 295.10 > 145.00 | 40 | 36 | |
| 295.10 > 159.00 | 40 | 34 |
| Experiment | x1 | x2 | x3 |
|---|---|---|---|
| 1 | − | − | − |
| 2 | + | − | − |
| 3 | − | + | − |
| 4 | + | + | − |
| 5 | − | − | + |
| 6 | + | − | + |
| 7 | − | + | + |
| 8 | + | + | + |
Publisher’s Note: MDPI stays neutral with regard to jurisdictional claims in published maps and institutional affiliations. |
© 2021 by the authors. Licensee MDPI, Basel, Switzerland. This article is an open access article distributed under the terms and conditions of the Creative Commons Attribution (CC BY) license (https://creativecommons.org/licenses/by/4.0/).
Share and Cite
Engelhardt, T.B.; Zhu, M.; Heilmann, C.; Schmitz-Stöwe, S.; Schwarz, T.; Stöwe, K. Development of a Novel Microgap Reactor System for the Photocatalytic Degradation of Micropollutants from Aqueous Solutions with TiO2-Based Photocatalysts Immobilized by Spray Coating. Catalysts 2021, 11, 1351. https://doi.org/10.3390/catal11111351
Engelhardt TB, Zhu M, Heilmann C, Schmitz-Stöwe S, Schwarz T, Stöwe K. Development of a Novel Microgap Reactor System for the Photocatalytic Degradation of Micropollutants from Aqueous Solutions with TiO2-Based Photocatalysts Immobilized by Spray Coating. Catalysts. 2021; 11(11):1351. https://doi.org/10.3390/catal11111351
Chicago/Turabian StyleEngelhardt, Tony B., Minrui Zhu, Claudia Heilmann, Sabine Schmitz-Stöwe, Thomas Schwarz, and Klaus Stöwe. 2021. "Development of a Novel Microgap Reactor System for the Photocatalytic Degradation of Micropollutants from Aqueous Solutions with TiO2-Based Photocatalysts Immobilized by Spray Coating" Catalysts 11, no. 11: 1351. https://doi.org/10.3390/catal11111351