Article

Influence of rGO and Preparation Method on the Physicochemical and Photocatalytic Properties of TiO2/Reduced Graphene Oxide Photocatalysts

by
Agnieszka Wanag
*,
Ewelina Kusiak-Nejman
,
Adam Czyżewski
,
Dariusz Moszyński
and
Antoni W. Morawski
*
Department of Inorganic Chemical Technology and Environment Engineering, Faculty of Chemical Technology and Engineering, West Pomeranian University of Technology in Szczecin, Pułaskiego 10, 70-322 Szczecin, Poland
*
Authors to whom correspondence should be addressed.
Catalysts 2021, 11(11), 1333; https://doi.org/10.3390/catal11111333
Submission received: 3 October 2021 / Revised: 22 October 2021 / Accepted: 29 October 2021 / Published: 2 November 2021
(This article belongs to the Special Issue 10th Anniversary of Catalysts—Feature Papers in Photocatalysis)

Abstract

:
In this study, a series of TiO2/rGO photocatalysts were obtained with a two-step procedure: a solvothermal method and calcination at 300–900 °C in an argon atmosphere. It was noted that the presence of rGO in photocatalysts had an important role in the changes in crystallite size and specific surface area. In TiO2/rGO samples, different surface functional groups, such as C−Cgraph, C−Caliph, C−OH, C=O, and CO(O), were found. It was observed that rGO modification suppressed the anatase-to-rutile phase transformation. The photocatalytic activity of the obtained nanomaterials was investigated through the decomposition of methylene blue under UV and artificial solar light irradiation. It was found that the adsorption degree played an important role in methylene blue decomposition. The experimental results revealed that TiO2/rGO samples exhibited superior removal efficiency after calcination for methylene blue compared toTiO2 without rGO, as well as a commercial photocatalyst KRONOClean 7000. It was noted that photocatalytic activity increased with the increase in the calcination temperature. The highest activity was observed for the sample calcined at 700 °C, which consisted of 76% anatase and 24% rutile. This study clearly demonstrated that TiO2/rGO samples calcined in argon can be used as efficient photocatalysts for the application of methylene blue decomposition.

1. Introduction

Titanium dioxide is commonly used in the photocatalytic process of water purification for the decomposition of different types of organic pollutants, such as heavy metals, pesticides, dyes, and phenols [1,2]. Various modifications of pristine material by metals and non-metal species, or by coupling TiO2 with other semiconductors, have been conducted to obtain TiO2 photocatalysts with high photocatalytic activity [3,4,5]. One of the most promising and widely tested methods of preparation for highly active photocatalysts is modification with carbon due to the enhancement of the photocatalytic activity under visible light irradiation and the suppression of the recombination of the electron–hole pairs [6,7]. Carbon nanomaterials are an interesting group of carbon precursors that can be used in TiO2 modification due to their unique porous structure, electronic properties, and large adsorptive capacity [8]. Conventional carbon materials, such as carbon black, activated carbon, and graphite, as well as graphitized materials have been widely used in heterogeneous catalysis for many years [9]. Carbon nanomaterials in the form of carbon nanotubes, C60 fullerenes, or graphene provide new possibilities for TiO2 modification [10]. Graphene especially, as a two-dimensional novel carbon nanomaterial with zero band gap, large specific surface area, and excellent mechanical, electrical, optical, and thermal properties, has attracted the interest of many researchers [11,12]. Thanks to its unique electronic properties, modification with graphene brings many benefits, such as suppressing electron–hole pair recombination and increasing the specific surface area of tested photocatalysts.
In the literature, several methods of preparation for TiO2/graphene oxide (TiO2-GO) and TiO2/reduced graphene oxide (TiO2-rGO) photocatalysts have been presented. The most popular methods include simple mixing and/or sonication [13], the sol-gel process [14], and hydrothermal/solvothermal synthesis [15,16,17]. Other less common methods include electrolytic deposition [18], liquid-phase deposition [19], and synthesis using microwaves [20]. However, the most popular and most commonly used methods are solvothermal and hydrothermal methods. The hydrothermal/solvothermal process can be undertaken in one or two steps. The one-step process typically utilizes previously prepared TiO2 and graphene materials, while the two-step process involves TiO2 synthesis from different precursors [21,22]. The hydrothermal solvothermal process is usually undertaken at 120–180 °C for 1–36 h [23,24,25,26,27]. Both methods consist of reactions under controlled temperature and/or using water or organic solvents. Graphene oxide can be reduced during preparation by using these methods if a chemical reagent is added [28]. Additional steps in TiO2/graphene preparation may be involved. It is well-known that the calcination process significantly improves photocatalytic activity due to the increase in the crystallinity of TiO2 and the growth of anatase crystallites [29]. However, in the case of TiO2/graphene photocatalysts, there have only been a few reports of thermal treatment [30,31,32,33,34]. Generally, in these reports, the calcination was carried out in the range of 350–550 °C, probably because of concerns about the oxidation of rGO. Zhang et al. [30] synthesized TiO2/rGO samples using a hydrothermal method. They used graphene oxide (GO) and TiO2 from the sol-gel method as starting materials and ethanol-water solution as a solvent. The obtained photocatalysts were calcined at 450 °C for 30 min in an air atmosphere. Obtained samples were characterized by higher photoactivity than the material prepared with the one-step hydrothermal process. The increased photoactivity was attributed to the oxidation of residual organic compounds present in the sample and better crystallization of TiO2 particles. In contrast, Nguyen-Phan et al. [31] obtained TiO2/graphene photocatalysts by applying GO paste and TiO2 P25 and then heating the samples at 200, 400, and 600 °C under an argon atmosphere. The calcined photocatalysts showed higher activity compared to the starting material. However, a decrease in photocatalytic activity with an increase in calcination temperature was observed. It was attributed to the reduction of the surface area and the increase in the size of crystallites.
The motivation to undertake our research was the limited availability of information in the literature about the influence of the calcination step on the physicochemical and photocatalytic properties of TiO2 modified with rGO, probably because of concerns about oxidation. In our study, we decided to use argon as a calcination atmosphere to circumvent the problem concerning rGO oxidation. Furthermore, our previous study showed that the combination of rGO (1–8 wt.%) modification with calcination at 500 °C may have a substantial impact on the physicochemical properties, as well as photocatalytic activity, of the obtained photocatalysts [35]. In another study [36], it was found that EPR/FMR spectra for TiO2/rGO samples calcined at 400, 500, and 600 °C showed oxygen defects and a ferromagnetic ordering system connected with trivalent titanium ions. Taking the above into account, we decided to widen the scope of the study and thoroughly examine the impact of these methods on nanomaterial properties. In this work, we focused on a TiO2 combination with 8 wt.% graphene and calcination at 300–900 °C (Δt = 100 °C) in an argon atmosphere. It was found that both rGO modification and the calcination process strongly impacted the crystallite size, the changes in the crystal structure, and the specific surface area of the tested samples. The nanomaterials were tested with the photocatalytic decomposition of methylene blue under two types of irradiation: UV and artificial solar light.

2. Results and Discussion

2.1. Characterization of Photocatalysts

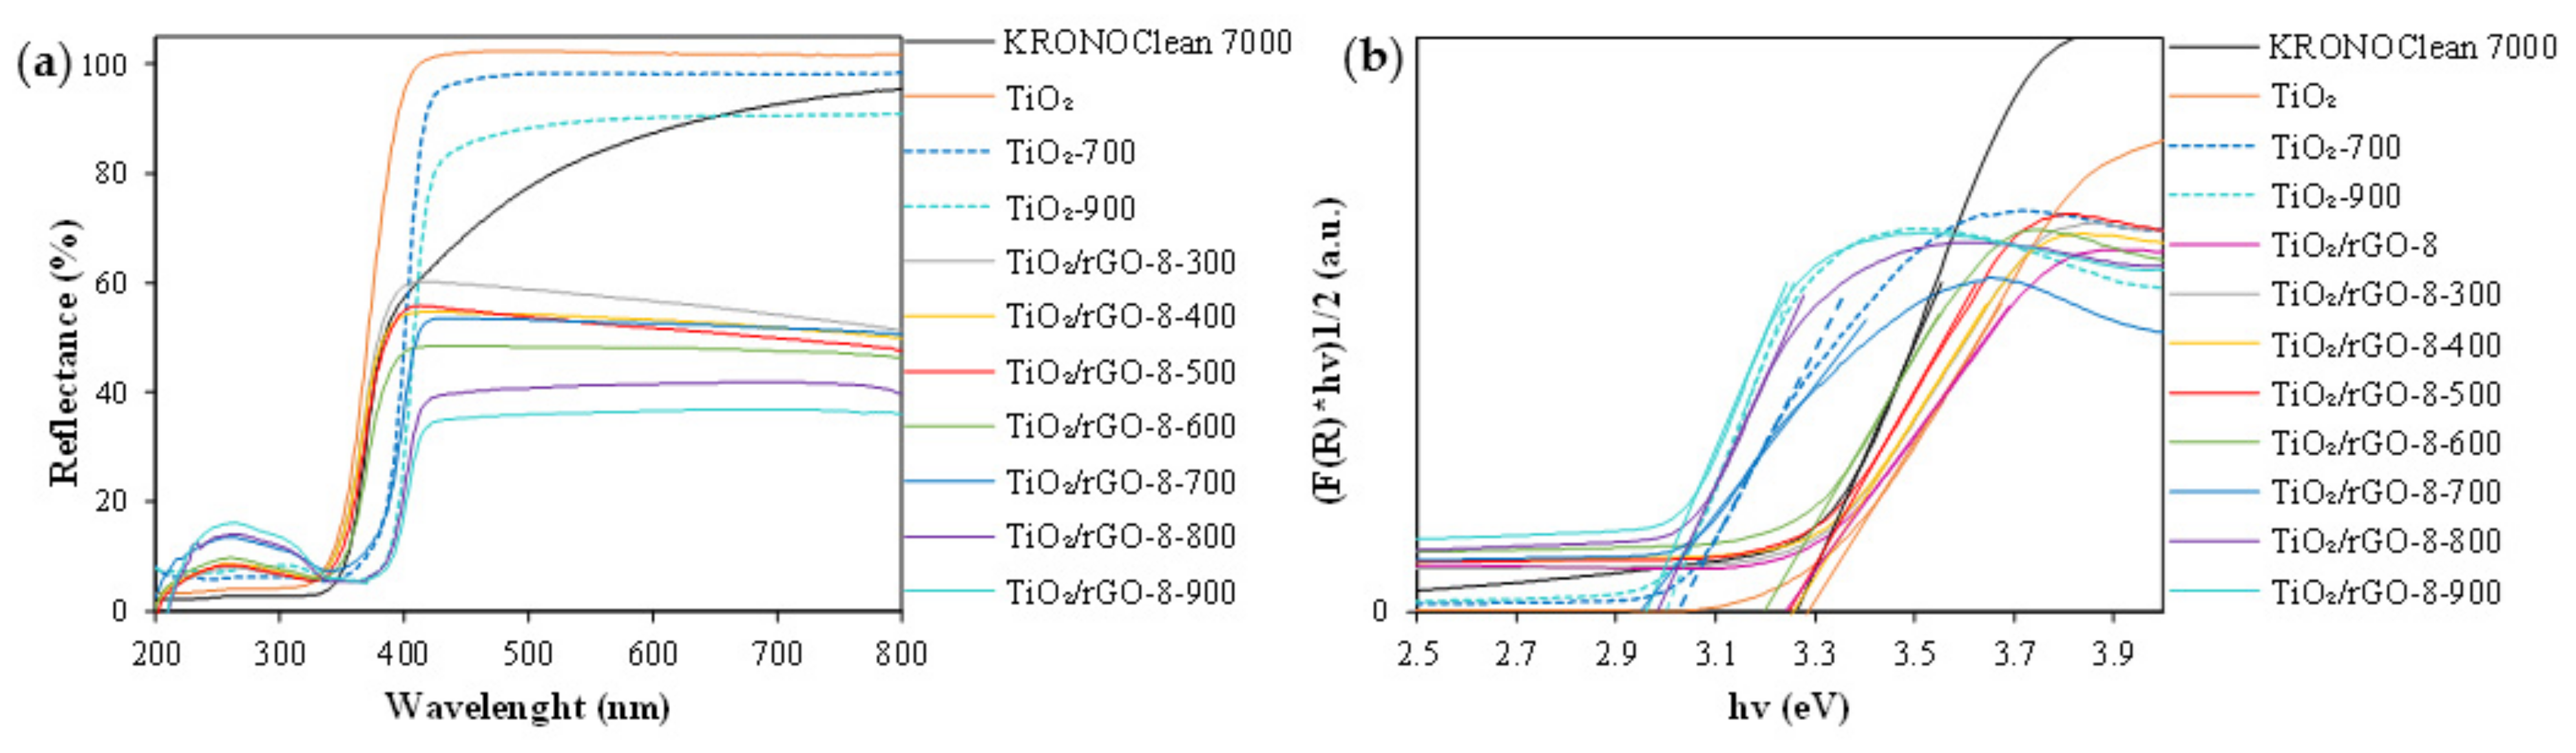
2.1.1. UV–Vis Diffuse Absorbance Spectroscopy

In Figure 1, the UV–Vis/DR spectra of TiO2/rGO-t samples, as well as control and reference KRONOClean 7000 samples, are presented. The TiO2 material presented typical absorption characteristics for a TiO2 semiconductor. The sample exhibited high absorption in the UV range and no absorption in the Vis region (above 400 nm). Strong absorption at around 380 nm was noticed, and this was related to the electron transition from the valence band (O 2p) to the conduction band (Ti 3d) [37]. A different situation could be observed for photocatalysts after modification. TiO2/rGO-t nanomaterials exhibited absorption in the visible region, which increased with the increase in the calcination temperature. The results were related to the colour changes after modification. The highest absorption of visible light was noted for the materials heated at 900 °C with the darkest colour. The dark colour of the sample facilitated visible light absorption [38]. The results showed that the samples calcined at 700, 800, and 900 °C exhibited a significant red-shift in the absorption edge, and this corresponded to the energy band-gap values. The band-gap values of the tested materials are presented in Table 1. The Eg values for TiO2/rGO-700, TiO2/rGO-800, and TiO2/rGO-900 photocatalysts were 3.09, 2.97, and 2.97 eV, respectively. Zhang et al. [39] found that the decrease in the band gap of samples with graphene is related to the formation of the Ti−O−C bond between TiO2 and the specific sites of carbon. A similar conclusion was proposed by Pastrana-Martínez et al. [40]. In order to confirm the rGO impact on changes in band-gap energy, the values of the Eg for TiO2 calcined at 700 and 900 °C (without rGO) were examined. The Eg values for these samples were 3.02 and 3.01 eV, respectively, and they were similar to the values for photocatalysts with rGO calcined at 700, 800, and 900 °C. Thus, narrowing of the band gap is mainly caused by calcination in an argon atmosphere rather than the incorporation of carbon from the graphene in the titanium dioxide structure. The red-shift in the adsorption edge and the narrowing of the band-gap energy has also been found to correspond to changes in the TiO2 phase composition, especially when rutile was present in the tested samples [41,42]. In addition, the intensive absorption peak located at 270 nm was observed for all TiO2/rGO-t photocatalysts. This peak was attributed to the π-π* transitions of C=C bonds characteristic for rGO [43,44].

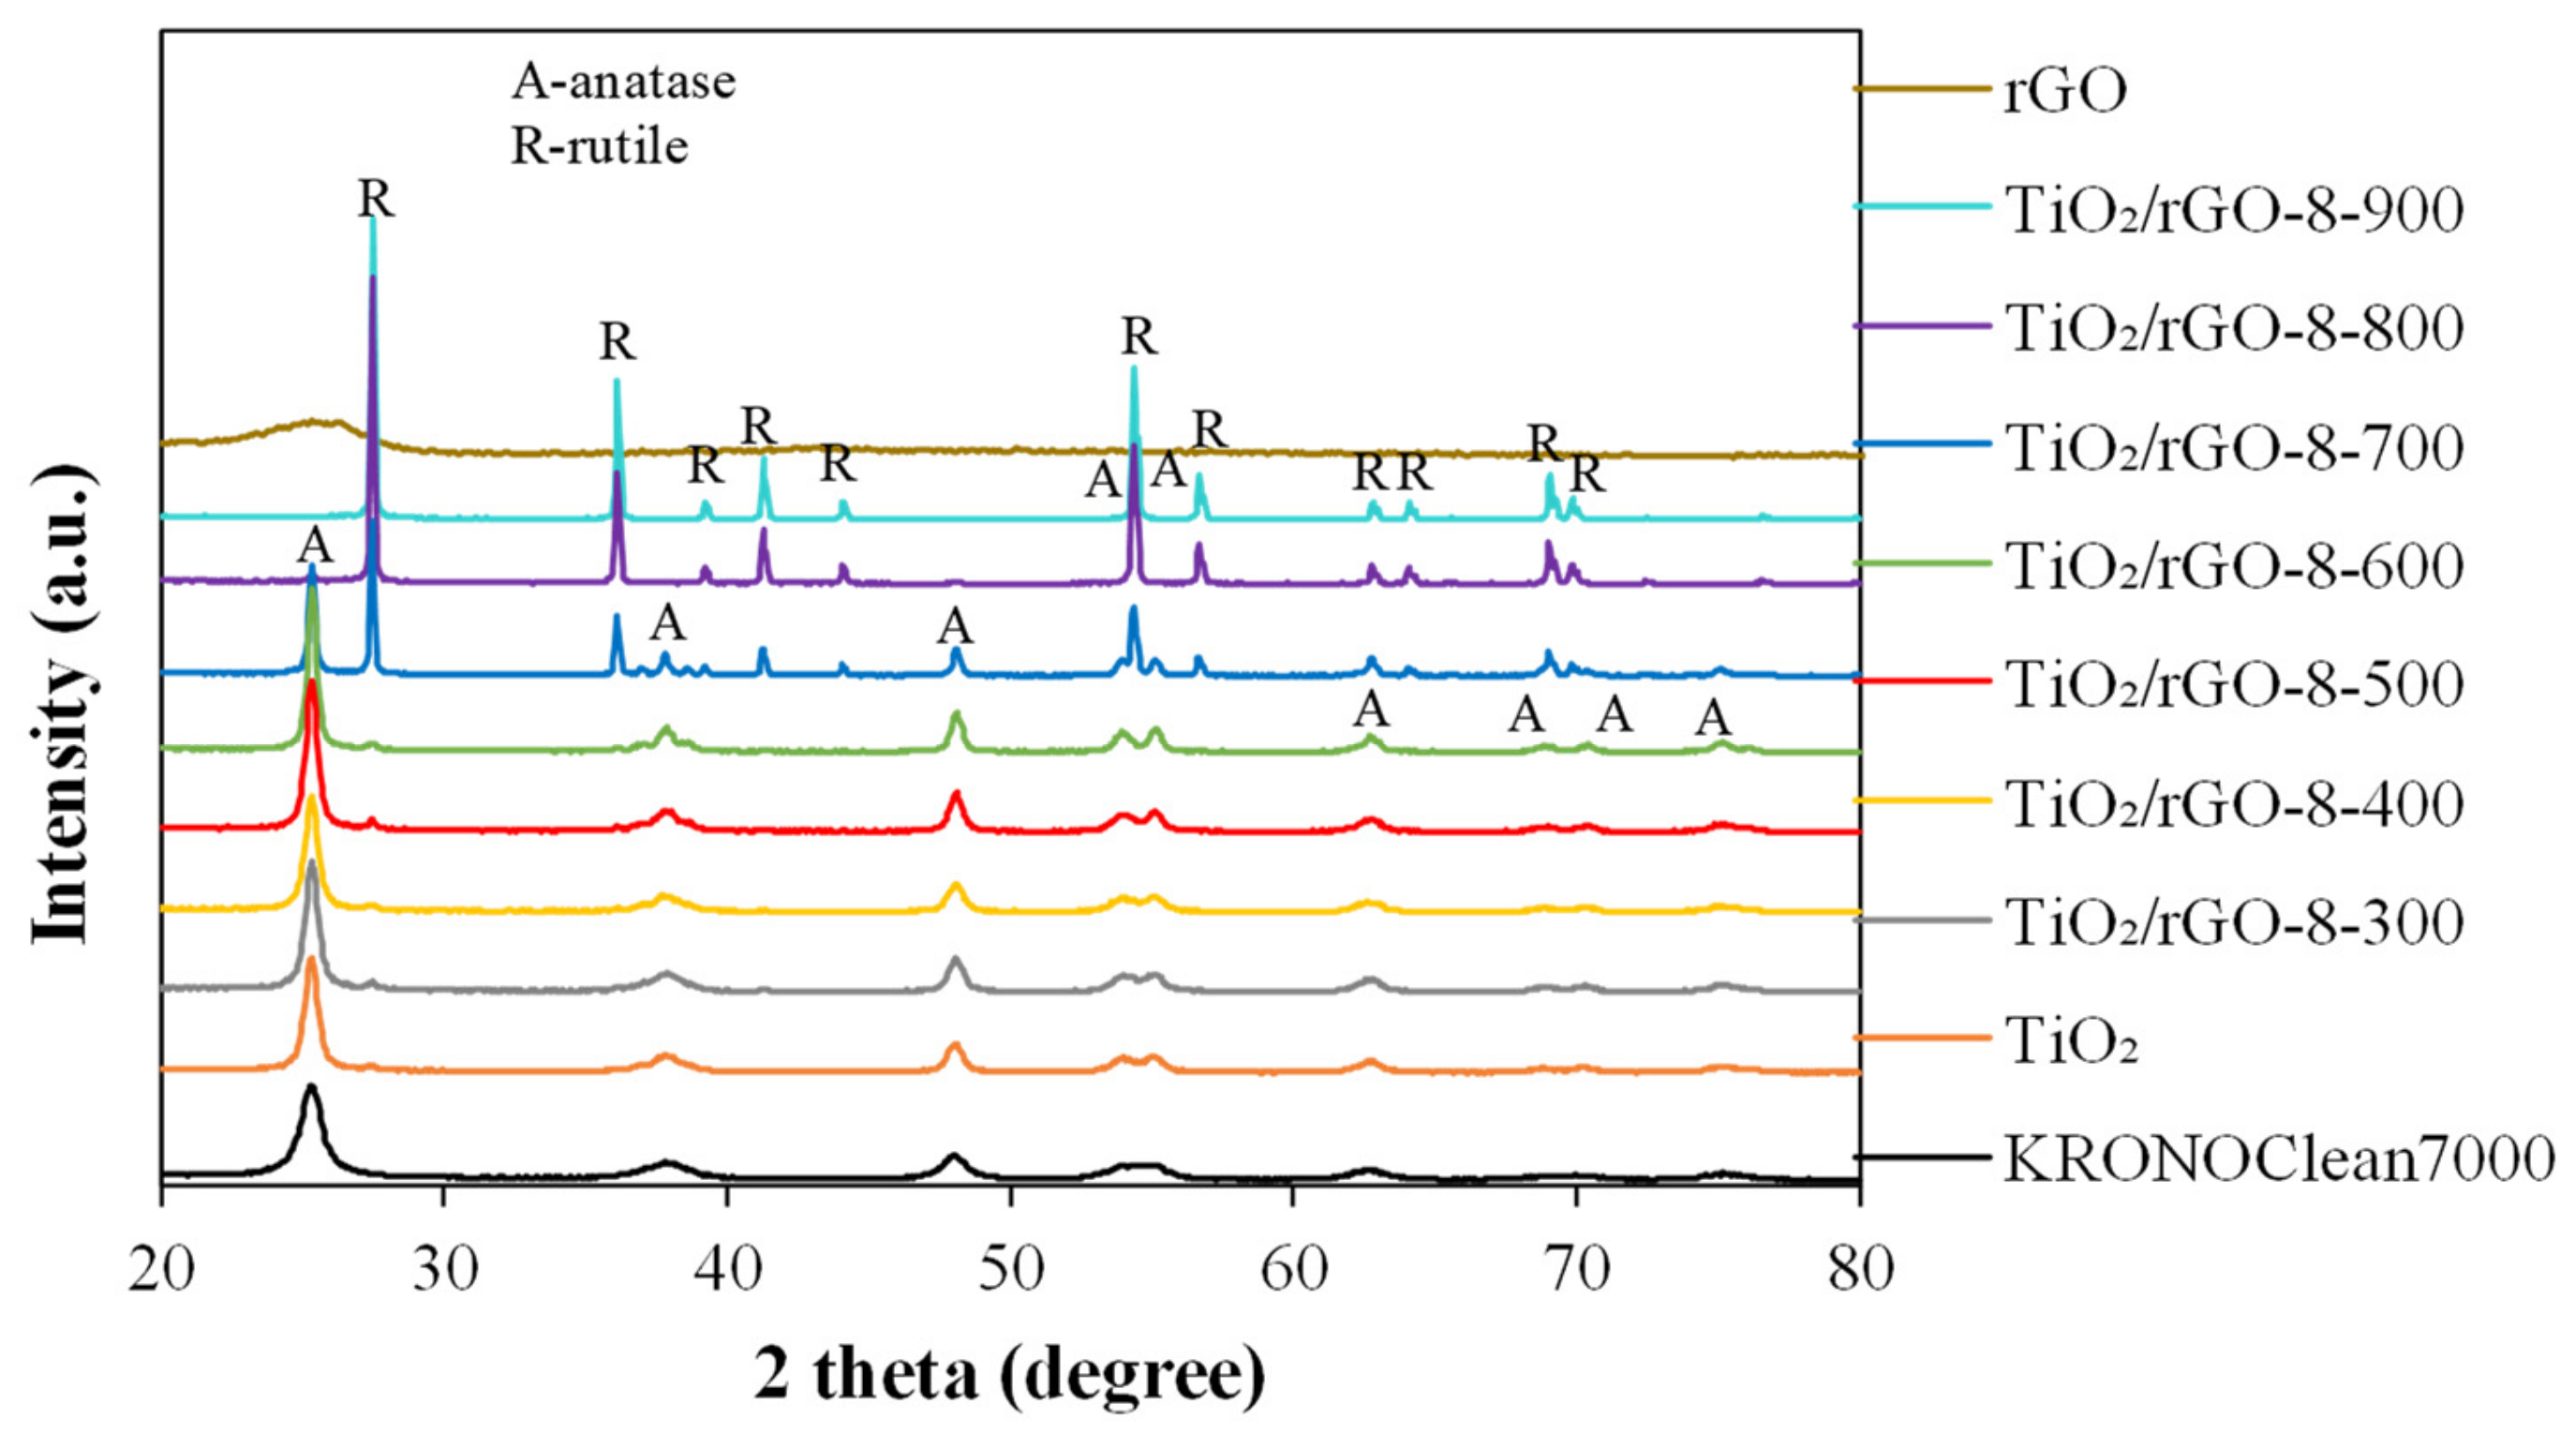
2.1.2. X-ray Diffraction Analysis
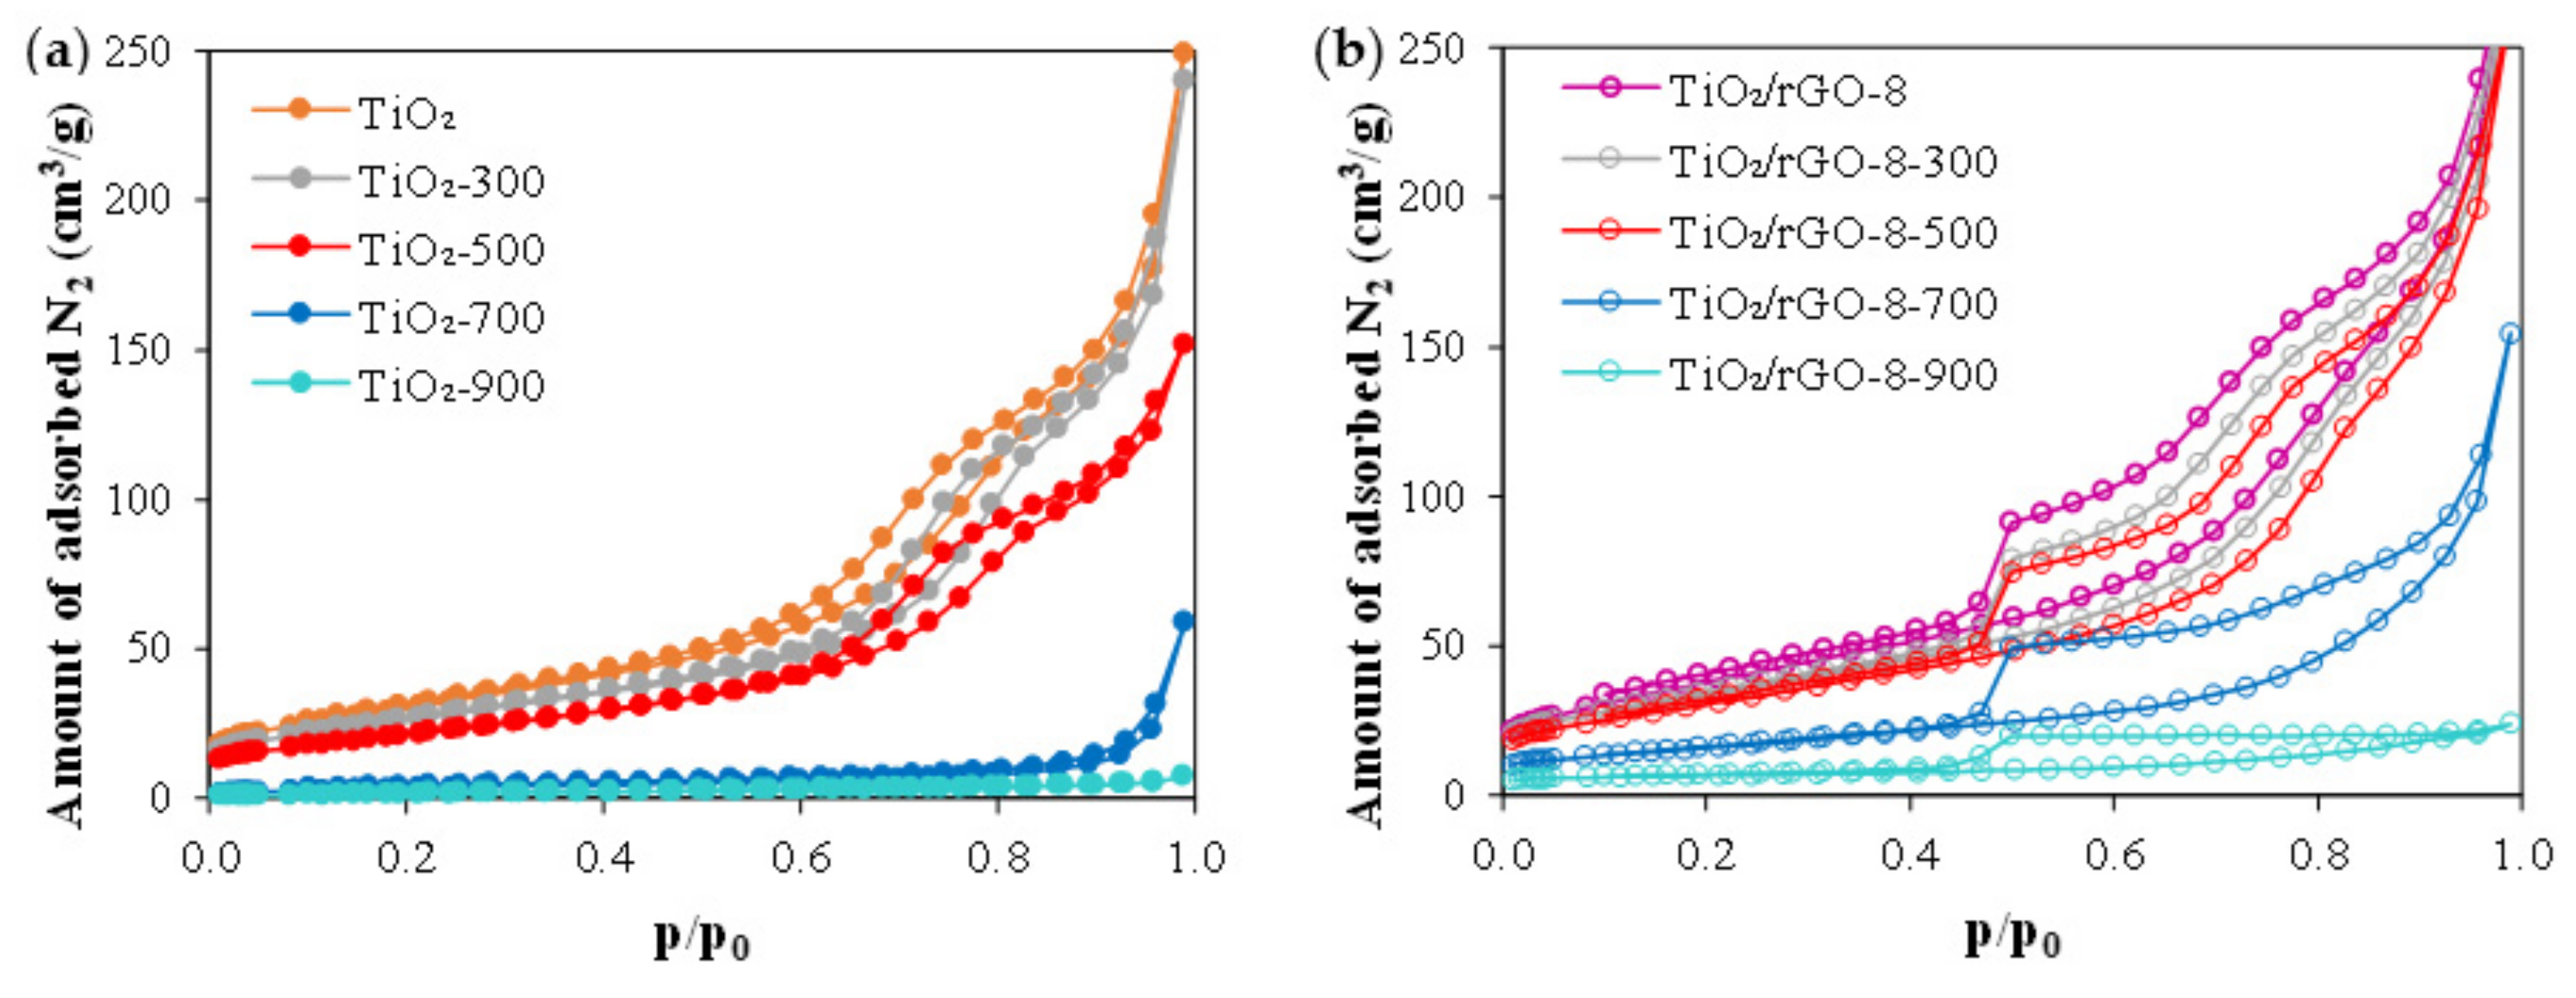
The XRD patterns of all tested photocatalysts are presented in Figure 2. Photocatalysts obtained at 300–600 °C, as well as the control and reference samples, consisted mainly of anatase phase (up to 98%). This materials exhibited reflection characteristics for the anatase phase—(101), (004), (200), (105), (211), (204), (116), (220), and (215) located at 25.3, 37.6, 47.8, 53.7, 54.8, 62.6, 68.7, 70.2, and 75.0°, respectively (JCPDS 01-070-7348)—and one small reflection characteristic for rutile (110) located at 27.1°. It should be noted that the presence of a low percentage of rutile in materials from the starting TiO2 was related to the TiO2 production process, not the phase transformation. In the case of photocatalysts calcined above 600 °C the characteristic reflections for rutile (110), (200), (111), (210), (211), (220), (002), (310), (301), and (112) located at 36.2, 39.8, 41.7, 44.3, 54.8, 56.8, 63.1, 64.7, 69.2, and 69.8° (JCPDS 01-076-0318) were observed. The presence of rutile reflection was related to the anatase-to-rutile phase transformation occurring at a higher temperature. Additionally, it was possible to observe an increase in the intensity of rutile reflection and the gradual disappearance of anatase reflection with the increase in the calcination temperature. A characteristic diffraction peak for reduced graphene oxide located at 24.2° [45] was not found. This was due to the small amount of graphene and its relatively low diffraction intensity, which was possibly shielded by the main peak of anatase TiO2 (101) located at 25.3° [46]. Similar observations were made by He et al. [47], Yang et al. [48], and other researchers [49,50].
As can be seen in Table 1, the calcination temperature had an important impact on the increase in the crystallite size of both anatase and rutile. The crystallite size increased with increasing calcination temperature. The crystallite sizes of anatase and rutile increased from 17 to 65 nm for anatase and from 27 to more than 100 nm for rutile. This indicated an increase in the crystallinity of the samples after calcination, which was also confirmed by the increase in the intensity of reflection for both anatase and rutile, as shown in Figure 2, and in the decrease in the value of the FWHM parameter for both mentioned phases, as well as the narrower reflections, the larger crystallite size, and the greater degree of crystallinity of the material [51]. As depicted in Figure 2, the anatase-to-rutile phase transformation, in this case, began at 600 °C, where additional reflections of rutile for TiO2/rGO-8-700 were observed. With the increase of the calcination temperature, the intensity of rutile reflection also increased. For example, photocatalyst calcined at 900 °C consisted only of rutile. Three reference photocatalysts (TiO2-700, TiO2-800, and TiO2-900) were analyzed to confirm that the modification of graphene contributes to the suppression of phase transition and sintering of TiO2 particles during temperature modification. Phase composition analysis showed that the TiO2-700 sample contained 28% anatase and the TiO2-800 sample only 1% (the content of anatase in the TiO2/rGO-700 sample was76% and in the TiO2/rGO-800 sample it was 3%). It should be pointed out that samples with rGO were characterized by smaller crystallite sizes than the materials without rGO. It can be concluded that the modification with reduced graphene oxide suppressed the phase transition as well as the sintering of TiO2 crystallites. In the case of the TiO2-900 sample, no effect of graphene on the phase composition was found. The calcination temperature was too high, so the presence of carbon in the form of rGO suppressed the anatase-to-rutile transformation.

2.1.3. BET Analysis

The SBET values and total pore volume of the tested nanomaterials, as well as the reference materials, are shown in Table 2. The SBET area and total pore volume of the control TiO2 sample were 97 m2/g and 0.40 cm3/g, respectively. After rGO modification (TiO2/rGO), the SBET area increased to 142 m2/g, and this was related to using rGO during preparation and its high SBET area (310 m2/g). Kim et al. [26] and Ruidíaz-Martínez et al. [52] also observed an increase of SBET area for samples after hydrothermal modification with rGO. For TiO2/rGO-t photocatalysts obtained with the calcination process, a decrease in the SBET area was observed. It is worth mentioning that the amount of rGO for this group of samples was the same, and it was assumed to be a mass of 8%. SBET area decreased after calcination from 142 m2/g for TiO2/rGO (starting material for calcination) to 21 m2/g for the sample heated at 900 °C. Furthermore, a correlation between increasing calcination temperature and decreasing surface area was observed. This was related to the sintering and agglomeration of TiO2 particles during calcination [53,54]. As was previously observed, the modification with graphene led to the increase of the SBET area. The SBET values for TiO2/rGO-t were compared with the values for photocatalysts for TiO₂-t materials to verify this phenomenon. It can be observed (see Table 2) that rGO modification caused a suppression of the decrease in SBET values after calcination. For example, the SBET area for TiO2-700 was 15 m2/g and for TiO2/rGO-700 it was 58 m2/g. The total pore volume also decreased with the increase in the calcination temperature, and this was a typical phenomenon related to the SBET value decreasing and the increasing crystallite size [7]. However, it was observed that rGO suppression also decreased pore volume. It can be noted that the total pore volume for the TiO2/rGO-700 samples was almost twice as high as for the sample calcined at the same temperature without rGO, and it was almost five times higher for TiO2/rGO-700 in comparison to TiO₂-700. It should be concluded that using rGO for preparation has an important influence on the suppression of the decrease in the SBET and total pore volume.
The influence of reduced graphene oxide on the structural properties of rGO-decorated TiO2 photocatalysts was also confirmed by studying the character of the adsorption–desorption isotherms presented in Figure 3. Based on the IUPAC classification, the isotherms of the tested photocatalysts exhibited characteristics of the type IV rank [55] attributed to mesoporous-like materials. Only the TiO2-700 sample demonstrated type II isotherm characteristics, associated with non-porous materials, for which the hysteresis loop does not appear. All tested photocatalysts presented the same H3-type hysteresis loop [56]. However, in the case of the samples with rGO, the value of the adsorbed N2 rapidly increased, and the hysteresis loop between the adsorption and desorption branches of the isotherm was wide. This type of enlargement of hysteresis, in the range of 0.45–0.7, is related to rGO content [57].

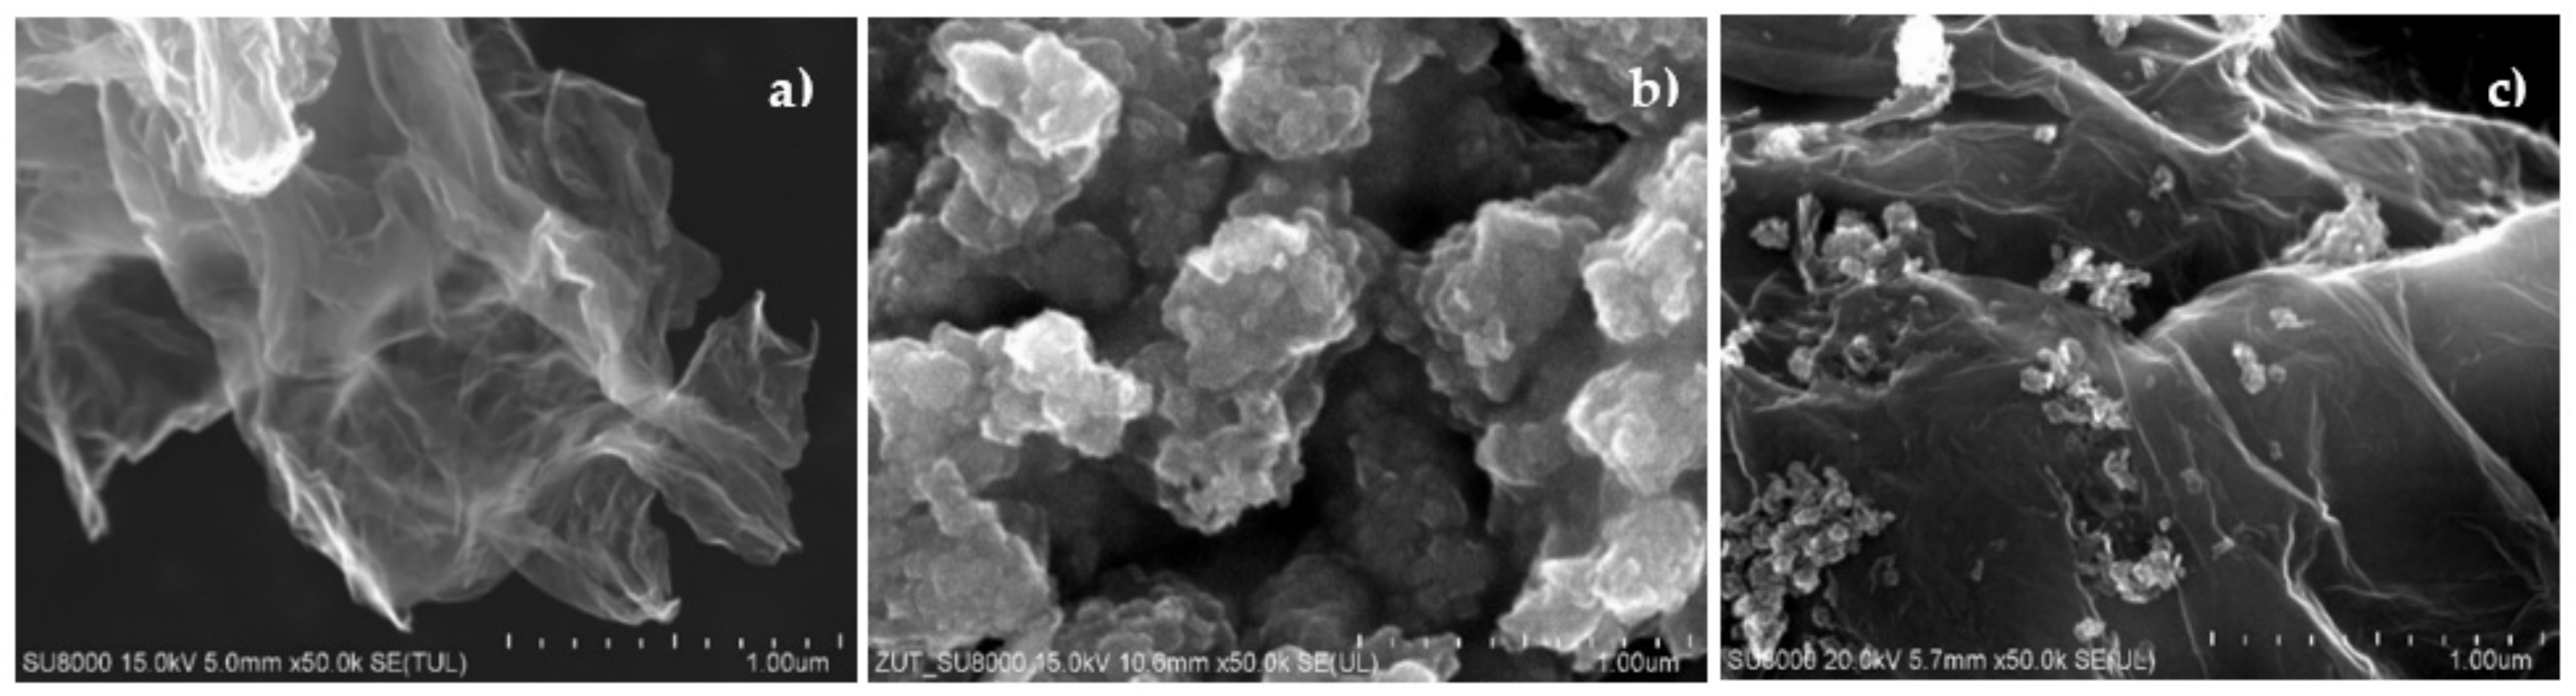
2.1.4. SEM Image Analysis

The presence of graphene flakes in the tested materials was proved by means of SEM microscopy. The SEM image in Figure 4a shows that the rGO sheet was wrinkled, transparent, and thin. The rGO surface was not covered by adsorbed contaminants. It can be noted that the rGO consisted of 2–4 layers according to the information given by the manufacturer [58]. Sample TiO2, shown in Figure 4b, consisted of particles that aggregated into a larger form. The grains presented a regular round shape. After calcination, a decrease in agglomerate size was observed (Figure 4c). Furthermore, the crystallites in TiO2/rGO-500 exhibited a more spherical shape. TiO2 nanoparticles were supported on the rGO sheets. Based on Figure 4c, it can also be concluded that a high calcination temperature does not cause any destruction in rGO sheets.

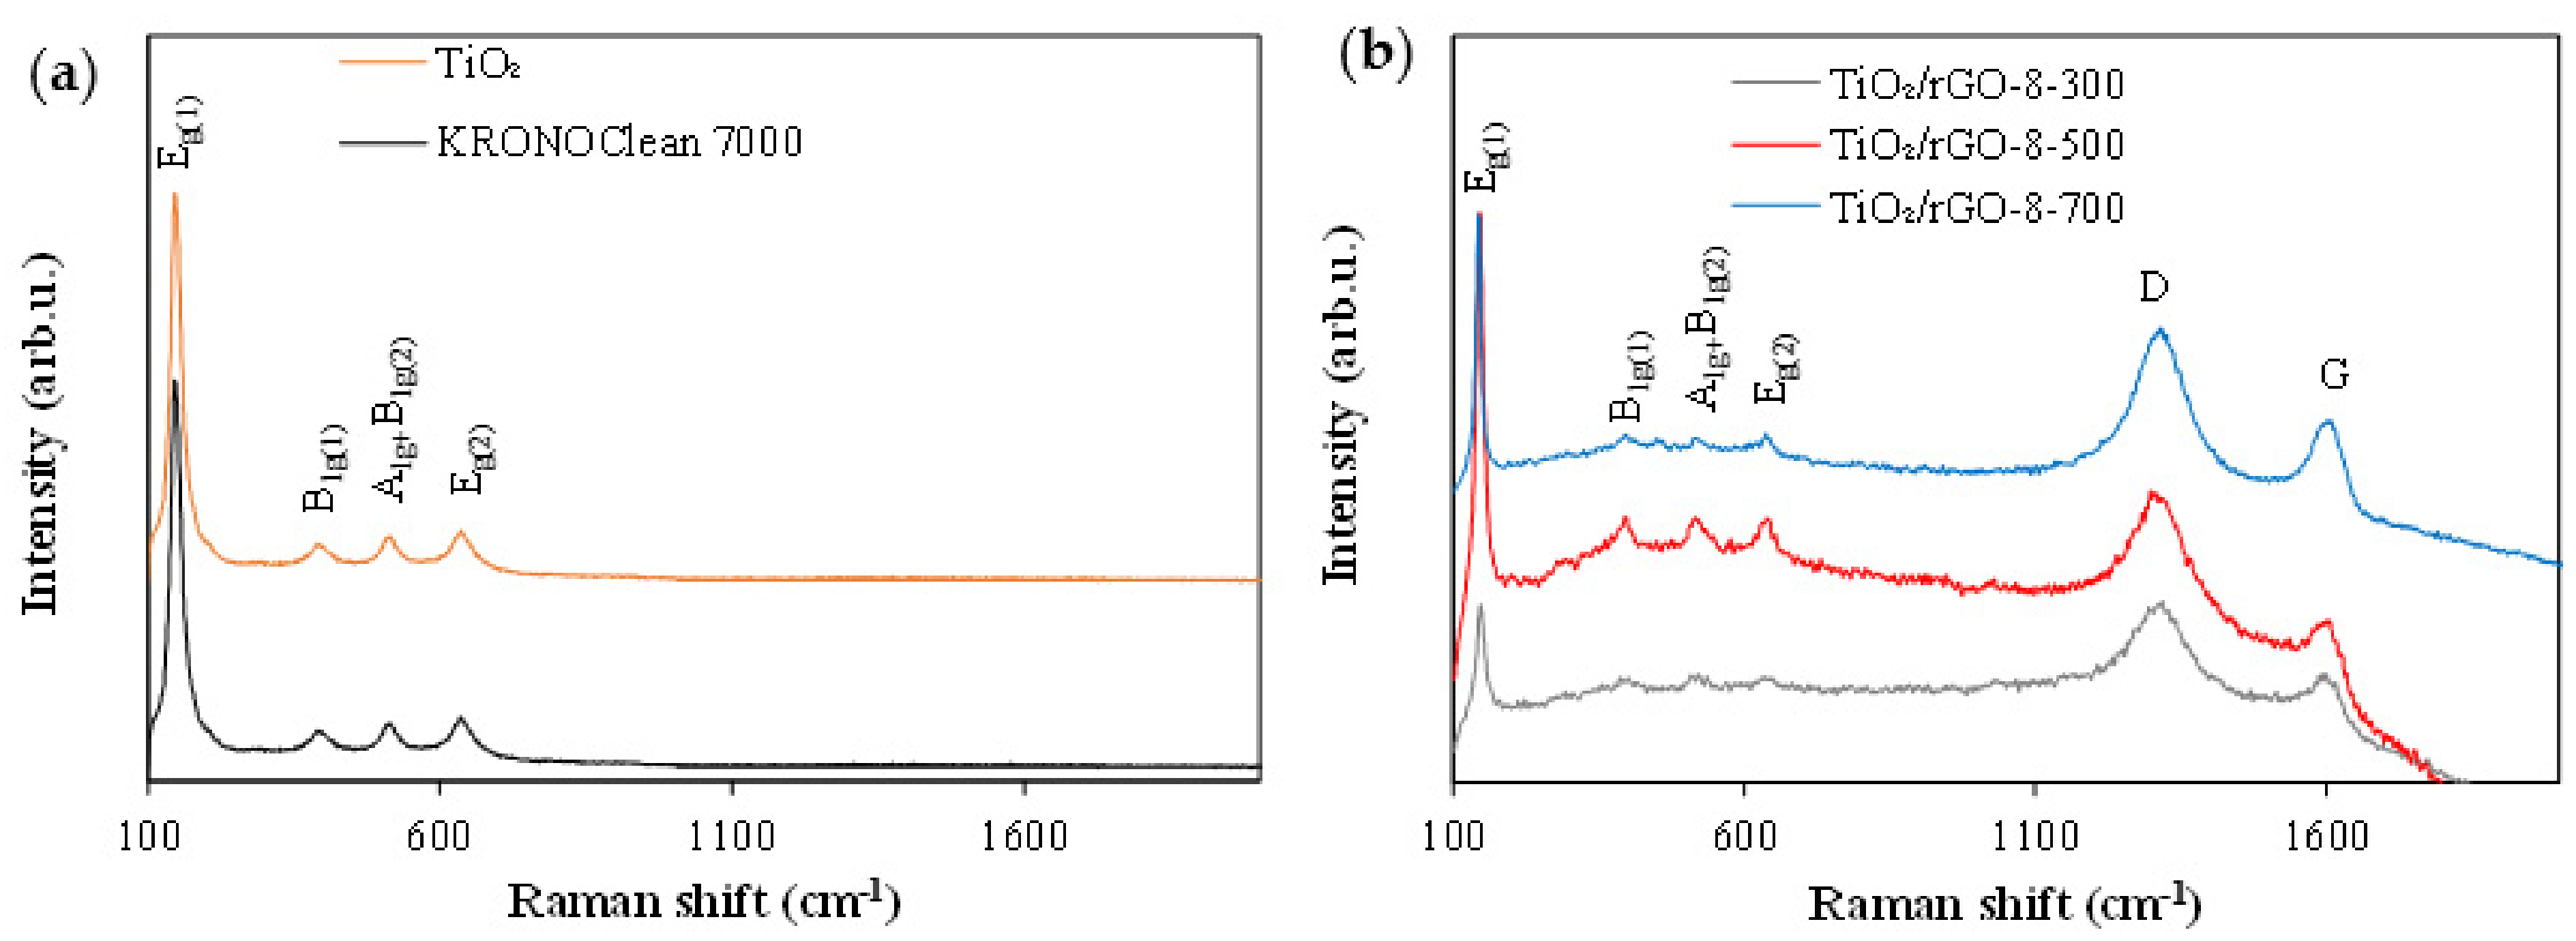
2.1.5. Raman Analysis

Raman spectroscopy was used as an additional means of confirmation of the presence of rGO in the TiO2 sample. Exemplary Raman spectra of TiO2/rGO-t samples calcined at 300, 500, and 700 °C, as well as the control and reference photocatalysts, are shown in Figure 5. For all analyzed samples, the characteristic bonds corresponding to the Eg(1), B1g(1), A1g+B1g(2), and Eg(2) modes of anatase located at 146, 395, 513, and 636 cm−1 were found [59]. The Eg band located at 448 cm−1 [60] characteristic of rutile was observed only for the TiO2/rGO-700 photocatalyst. However, it should be noted that rutile was also present in samples obtained at 800 and 900 °C, as was confirmed by XRD analysis. Due to the low rutile content present in the Raman spectra of the other samples, the characteristic bands are not indexed. Two characteristic peaks at about 1296 cm−1 and 1611 cm1 attributed to the D and G bands of the graphitized structure were noted for samples modified with rGO. The D band (disordered) was attributed to the edge or in-plane sp3 defect of carbon. The presence of this band provides information about defects, and it indicates internal structural defects, dangling bonds, and edge defects [61,62]. The G band (graphitic) was assigned to in-plane stretching vibrations of the symmetric sp2 C−C bonds, and it was indicated by the degree of organization of the aromatic structure [63]. These two types of bands confirmed the presence of reduced graphene oxide in the TiO2/rGO-t nanocomposites. In addition, the high-intensity ratio of D and G bands (ID/IG = 1.5) was attributed to the presence of smaller but more numerous sp2 domains in the carbon [64]. No characteristic peak corresponding to carbon was observed in the cases of TiO2 and KRONOClean 7000, despite carbon analysis confirming its presence in the samples (see Table 2). This was due to the presence of another kind of carbon group. The TiO2 photocatalyst contained alkyl groups from isopropanol, and KRONOClean 7000 had arylcarboxylate groups characteristic of the production process.

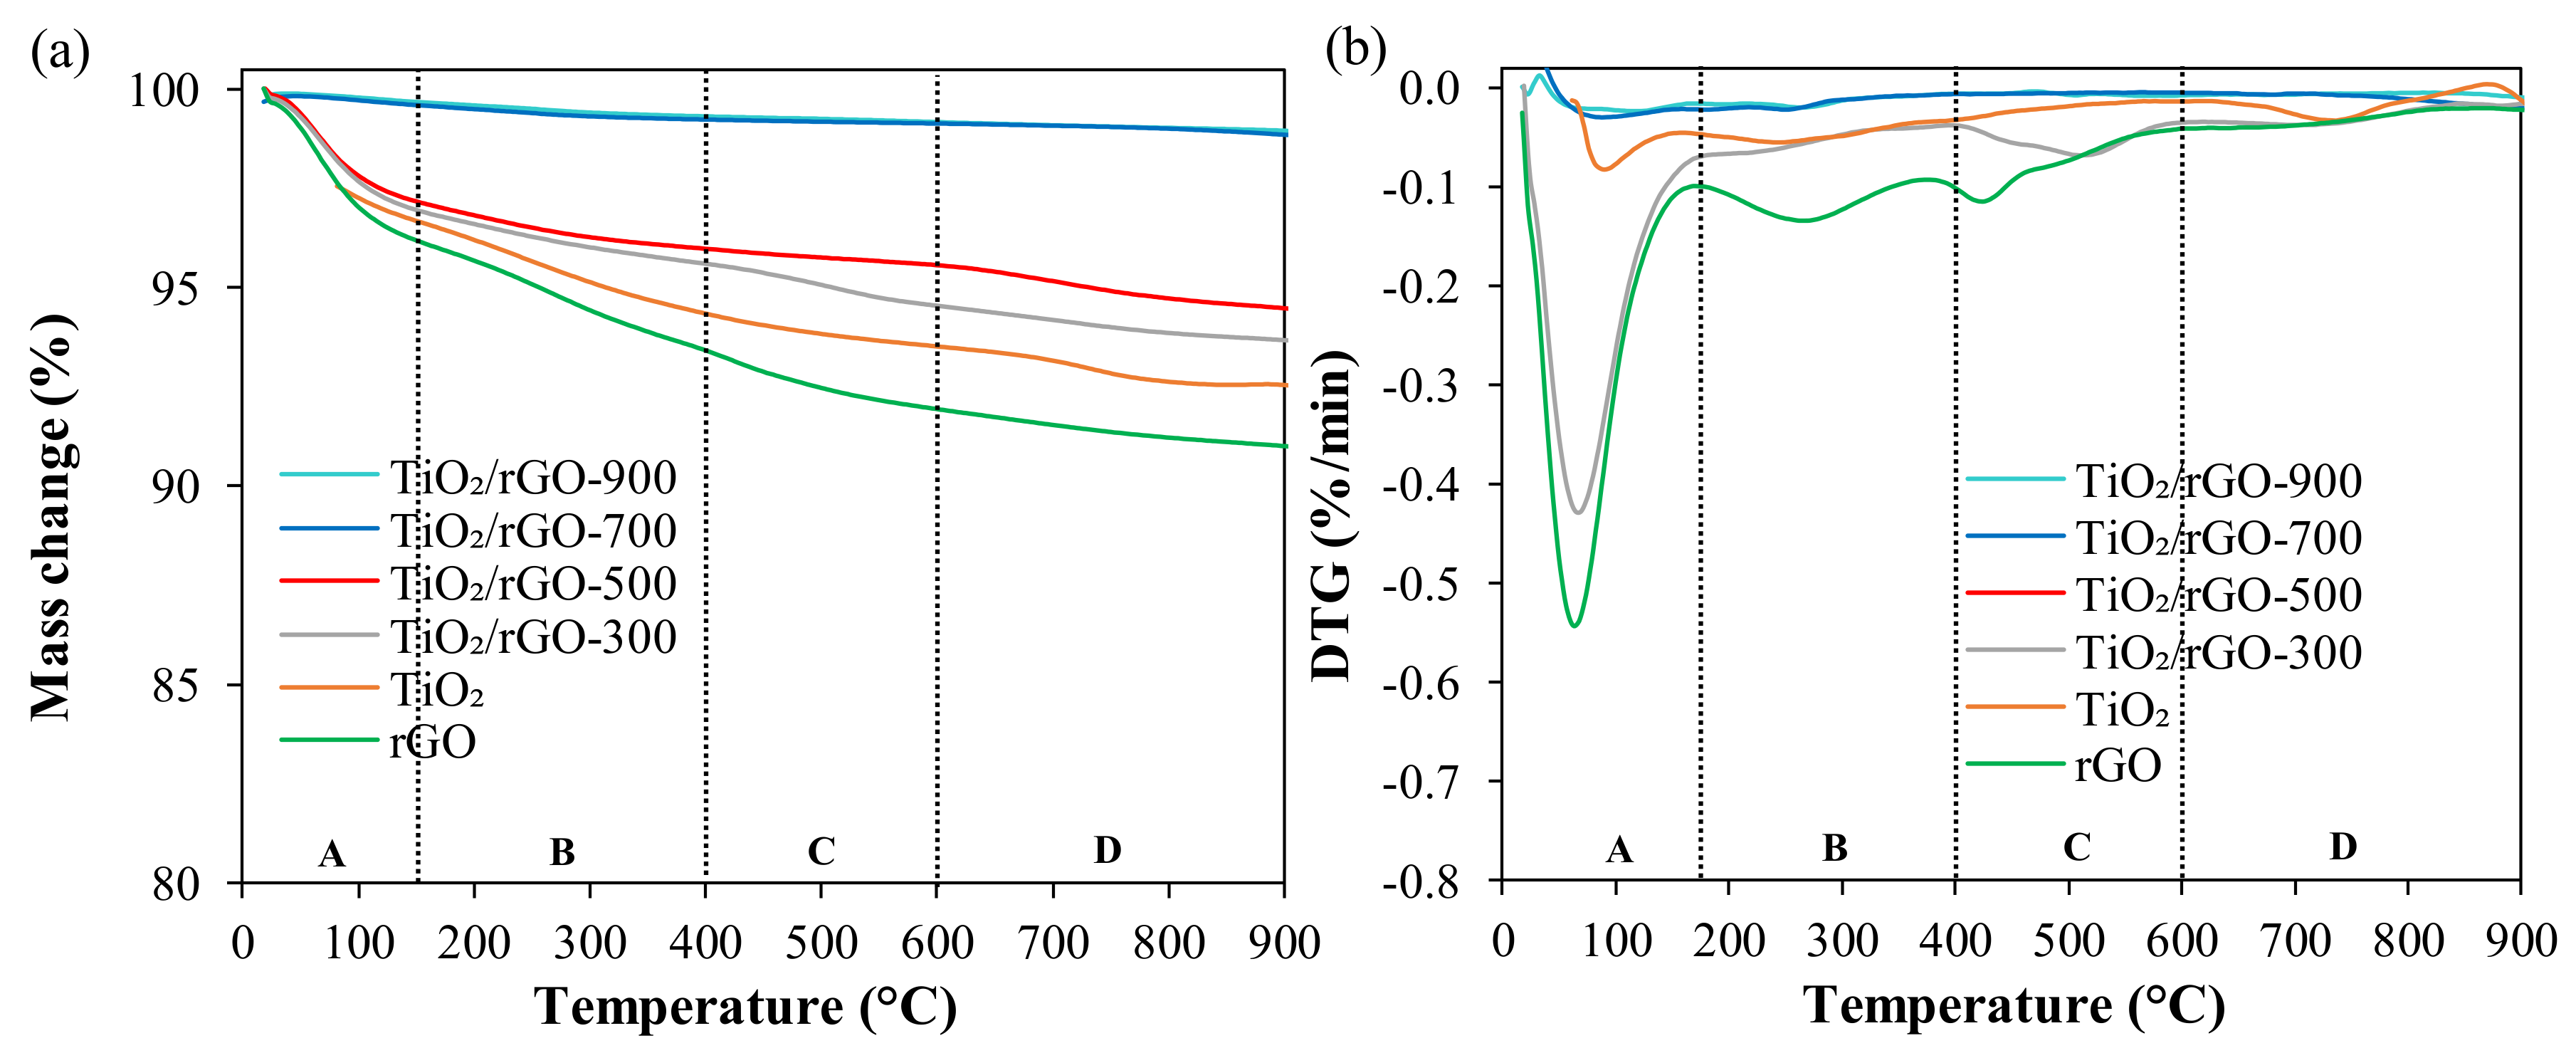
2.1.6. Thermal Analysis
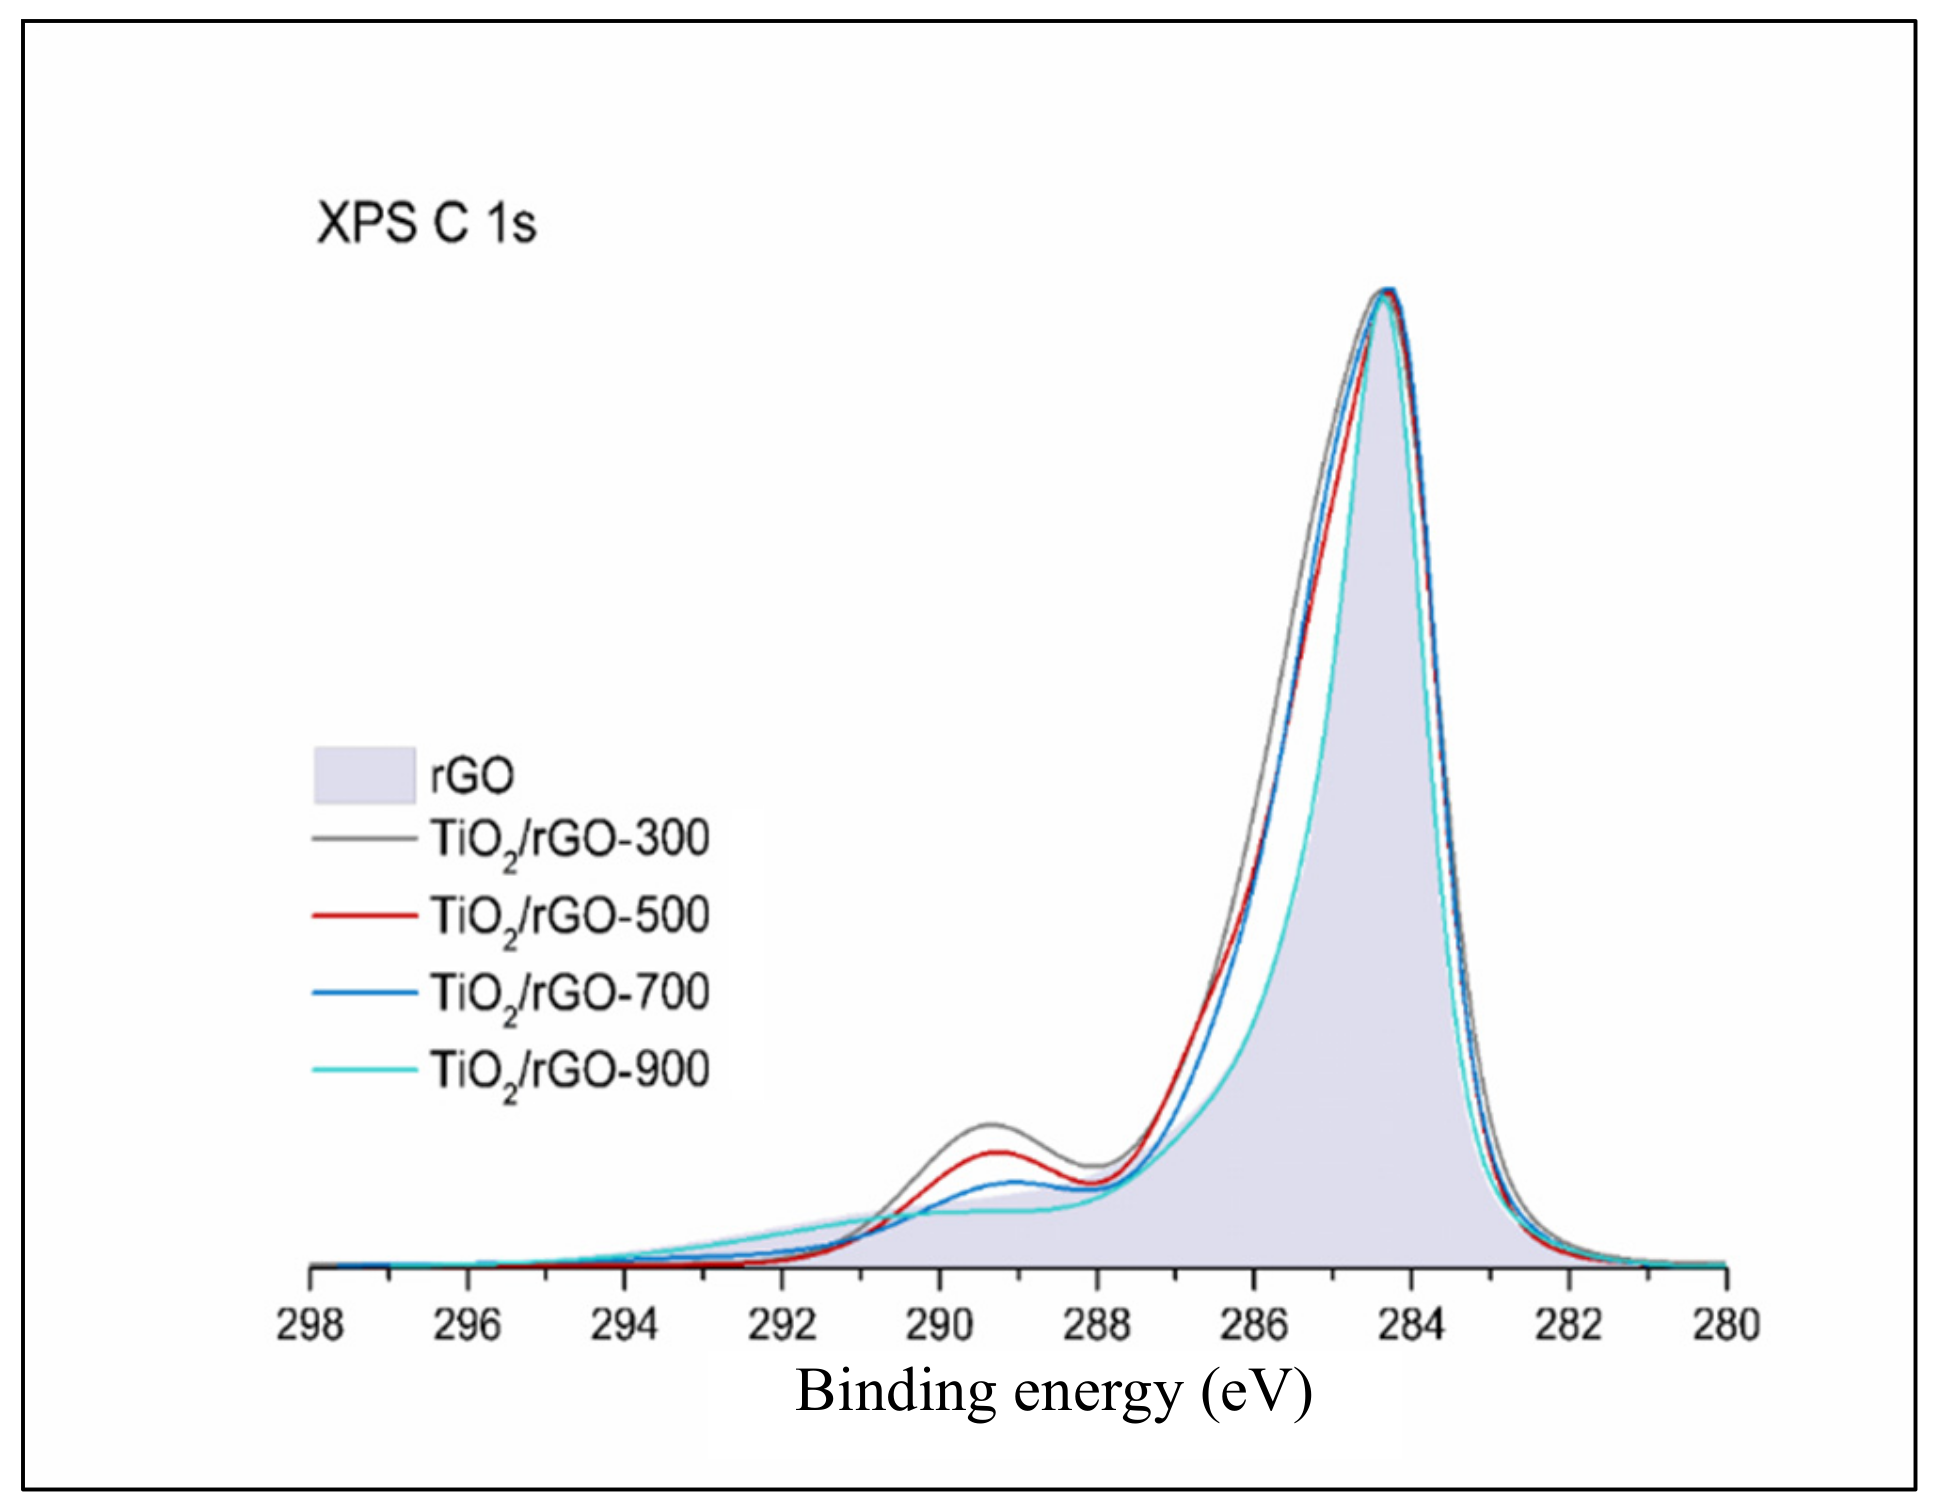
The TG and DTG curves of the rGO, TiO2, and TiO2/rGO photocatalysts are shown in Figure 6. The TG/DTG curves of the rGO and modified TiO2 samples were characterized by the presence of three distinct mass-loss stages. The first stage, located in the temperature range between ca. 20 and 150 °C (region A), was attributed to the vaporization of water and organic solvent (isopropanol) from the surfaces of the materials. The second mass-loss stage, located between ca. 150–400 °C (region B), was connected with the occurrence of two separate effects, characteristic of the respective materials. Thus, for the rGO material, the mass decline was associated with the decomposition of more labile groups (carboxylate and hydroxylate) and the removal of oxygen molecules [65]. In addition, and in contrast to the rGO material, the TiO2 sample was characterized by a noticeable mass decline located in region C (between ca. 400–600 °C). This change was attributed to the transformation of the amorphous part of the TiO2 into the crystalline phase [66,67]. It should also be noted that, above 600 °C (region D),the TG profile of the rGO material gradually declined, indicating the occurrence of high-temperature pyrolysis in the carbon skeleton [24].
Further TG/DTG profiles, presented in Figure 6a,b, were obtained for the exemplary TiO2/rGO composites calcined at 300, 500, 700, and 900 °C. The shapes of the profiles were clearly dependent on the calcination conditions applied during the material preparation process. Similarly, as in the case of the precursor materials, the TiO2/rGO-300 and TiO2/rGO-500 composites exhibited significant mass loss in region A, resulting from the vaporization of residual water and solvent molecules from the material surface. The samples also demonstrated noticeable mass drops in temperature regions B and D, which were ascribed to the thermal decomposition of more labile groups of the rGO component and the degradation of its carbon skeleton, respectively. Furthermore, for the TiO2/rGO-300 material, an additional mass loss was recorded between ca. 450–600 °C (region C). This change was ascribed to the occurrence of the heat-induced amorphous TiO2 crystallization process, which was also observed in the case of the TiO2 precursor sample. In contrast to the previously described counterparts, the remaining TiO2/rGO-700 and TiO2/rGO-900 composites exhibited higher thermal stability, which was reflected by the relatively stable progression of the TG curves and negligible weight loss of the materials. This trait was connected with the high-temperature heat treatment applied during the composite preparation process.

2.1.7. XPS Analysis

Further detailed characterization of the chemical composition of the TiO2/rGO-t samples calcined at 300, 500, 700, and 900 °C was provided by X-ray photoelectron spectroscopy. High-resolution spectra were acquired to evaluate the chemical states of the elements present on the surfaces of the samples. Only titanium, oxygen, and carbon atoms were identified in all these materials. In Figure 7, a binding-energy region characteristic for Ti 2p transition is depicted for the sample TiO2/rGO-900. Two peaks centered at 458.8 eV and 464.6 eV were noted, which corresponded to the Ti 2p3/2 and Ti 2p1/2 spin-orbit splitting photoelectrons in the Ti4+ state [68]. There were no differences for the location and shape of the XPS Ti 2p spectra originating from any of the TiO2/rGO-t samples. The position of the main maximum at a binding energy of 458.8 eV proved that titanium atoms were not involved in any kind of strong bond apart from the Ti−O bonds characteristic of TiO2. The results indicate that the chemical state of titanium atoms is not influenced by calcination at high temperatures.
Much more significant changes were observed in the XPS spectra obtained for the considered samples in the C 1s region (see Figure 8). A spectrum acquired for the rGO used for the preparation of hybrid materials was taken as a reference (the gray area). The maximum of the reference spectrum was located at the binding energy of 284.3 eV, a value characteristic of graphene and other graphite-like structures. The maxima of the TiO2/rGO-t samples were generally located at identical positions as in the rGO spectrum. The observed variations were within the experimental error (0.1 eV). The envelope of the XPS C 1s spectra obtained for the samples calcined at 300, 500, and 700 °C notably differed from the C 1s spectrum of reduced graphene oxide. The most prominent deviations were observed in two regions at about 286 eV and 289 eV. The former region is usually ascribed to the presence of C−O bonds, as in alcohols or ethers. The latter region is typical of carbon–oxygen bonds, where the carbon atom is accompanied by at least two oxygen atoms. Representative examples of such a chemical environment include carboxyl and carboalcoxy functional groups. The surfaces of the TiO2/rGO-t samples calcined at 300, 500, and 700 °C were abundant in carbon–oxygen bonds of different kinds.
To address this problem numerically, the deconvolution of the experimental data was undertaken by applying a model consisting of six basic components of C 1s transition. The first component, C−Cgraph, with a binding energy of 284.3 ± 0.1 eV, essentially corresponded to non-functionalized carbon atoms located in graphene rings. The second component, C−Caliph, with a binding energy of 285.3 ± 0.2 eV, was attributed to sp3 carbon atoms, bonded with either second carbon atoms or hydrogen atoms. Component C−OH, which shifted 2.2 ± 0.2 eV from component C−Cgraph in the direction of increasing binding energies, was ascribed to a group of carbon atoms linked to one atom of oxygen. The group comprised the following functional groups, which were presumably present in the studied materials: C−O−C and C−OH. The carbon denoted by the asterisk in the *C−O−C=O group could also have contributed to the signal of the component C-OH. The component C=O, which shifted 3.2 ± 0.2 eV from the first component in the direction of increasing binding energies, also corresponded to a set of functional groups: C=O or O−C−O. The fifth component, CO(O), which shifted 5.0 ± 0.2 eV from the component Cgraph, corresponded to a set of functional groups similar to carboxyl or carboalcoxy. The sixth peak in the C 1s spectra was a shake-up structure caused by the π→π*-transition in the graphite rings. The binding energy assignments described above are based on the energy shifts given in Appendix E of [69]. The results of the numerical deconvolution are shown in Table 3 and indicated a relative surface functional group composition. The total C 1s intensity was taken as 100. The comparison of the results for the samples calcined at different temperatures shown in Table 3 indicated relatively small variations for components C−Cgraph, C−Caliph, and C−OH. In general, the component C−Caliph was more prominent on the surfaces of the samples calcined at 300, 500, and 700 °C. It was ascribed to the presence of the isopropanol used during the preparation stage. The most crucial changes were observed for component CO(O), which was in accordance with the component C=O. About 11% of the surfaces of the samples TiO2/rGO-300 and TiO2/rGO-500 contained this component, which was observed as an intense local maximum at 289 eV. This component diminished with increasing calcination temperature and at 900 °C it was negligible. The surface of the sample calcined at 900 °C contained even fewer C−O bindings than observed for pure rGO.

2.1.8. Carbon Content

The carbon content in the TiO2/rGO-t samples is presented in Table 2. For comparison, carbon amounts in the TiO2, TiO2/rGO, and reference KRONOClean 7000 photocatalysts are also shown. According to the listed results, the commercial carbon-modified photocatalyst contained 0.96 wt.% carbon. The TiO2 control sample obtained according to the procedure for modification of TiO2/rGO-t photocatalysts but without the addition of rGO contained 0.6 wt.% carbon. The presence of carbon in this sample was related to the use of isopropanol in the modification process. It is worth mentioning that the starting TiO2 did not contain any carbon. TiO2/rGO, which was a starting material for the calcination process, contained 6.5 wt.% carbon, and this result was different from the theoretically assumed carbon amount used during the modification (8 wt.%). This difference was related to the type of graphene precursor used. The reduced graphene oxide used for modification contained approximately 75 wt.% carbon. Thus, the graphene used was in a form that was not entirely reduced and it had various types of functional groups on its surface (see Section 2.1.7). After the calcination process, the photocatalysts contained almost the same amounts of carbon (about 6 wt.%). However, it was possible to observe differences in the carbon content between TiO2/rGO and the samples after calcination, and these were related to the evaporation of the residual isopropyl alcohol used in the modification during the first step involving a pressure autoclave.

2.2. Adsorption Experiment

The adsorption properties and the time required to achieve the adsorption–desorption equilibrium between photocatalysts, surface, and contaminant were determined. In Figure 9, the adsorption of MB on the tested nanomaterials under dark conditions is presented. The adsorption–desorption equilibrium was achieved after 180 min. The adsorption degrees calculated for TiO2 and KRONOClean 7000 were negligible (1.49% and 2.44%, respectively). In contrast, the adsorption degree for the TiO2/rGO-t nanomaterials was approximately 50%. It is well-known that adsorption properties are related to high SBET values and porous structure. It should be noted that, in spite of decreasing SBET area after calcination, the adsorption properties remained at the same level for all photocatalysts. This was caused by strong π-π interactions between the dye molecules and aromatic regions of reduced graphene oxide [70]. It is also widely known that a negatively charged semiconductor surface has a higher potential for contact with positively charged MB molecules due to the electrostatic attractive interactions [71,72]. The zeta potential for KRONOClean 7000 was +20.64 mV, for TiO2 it was +12.41 mV, and for TiO2/rGO-8-800 it was −18.80 mV; thus, in this case, changing the surface charge of TiO2 from positive to negative after heating caused increases in the adsorption properties of the TiO2/rGO samples.

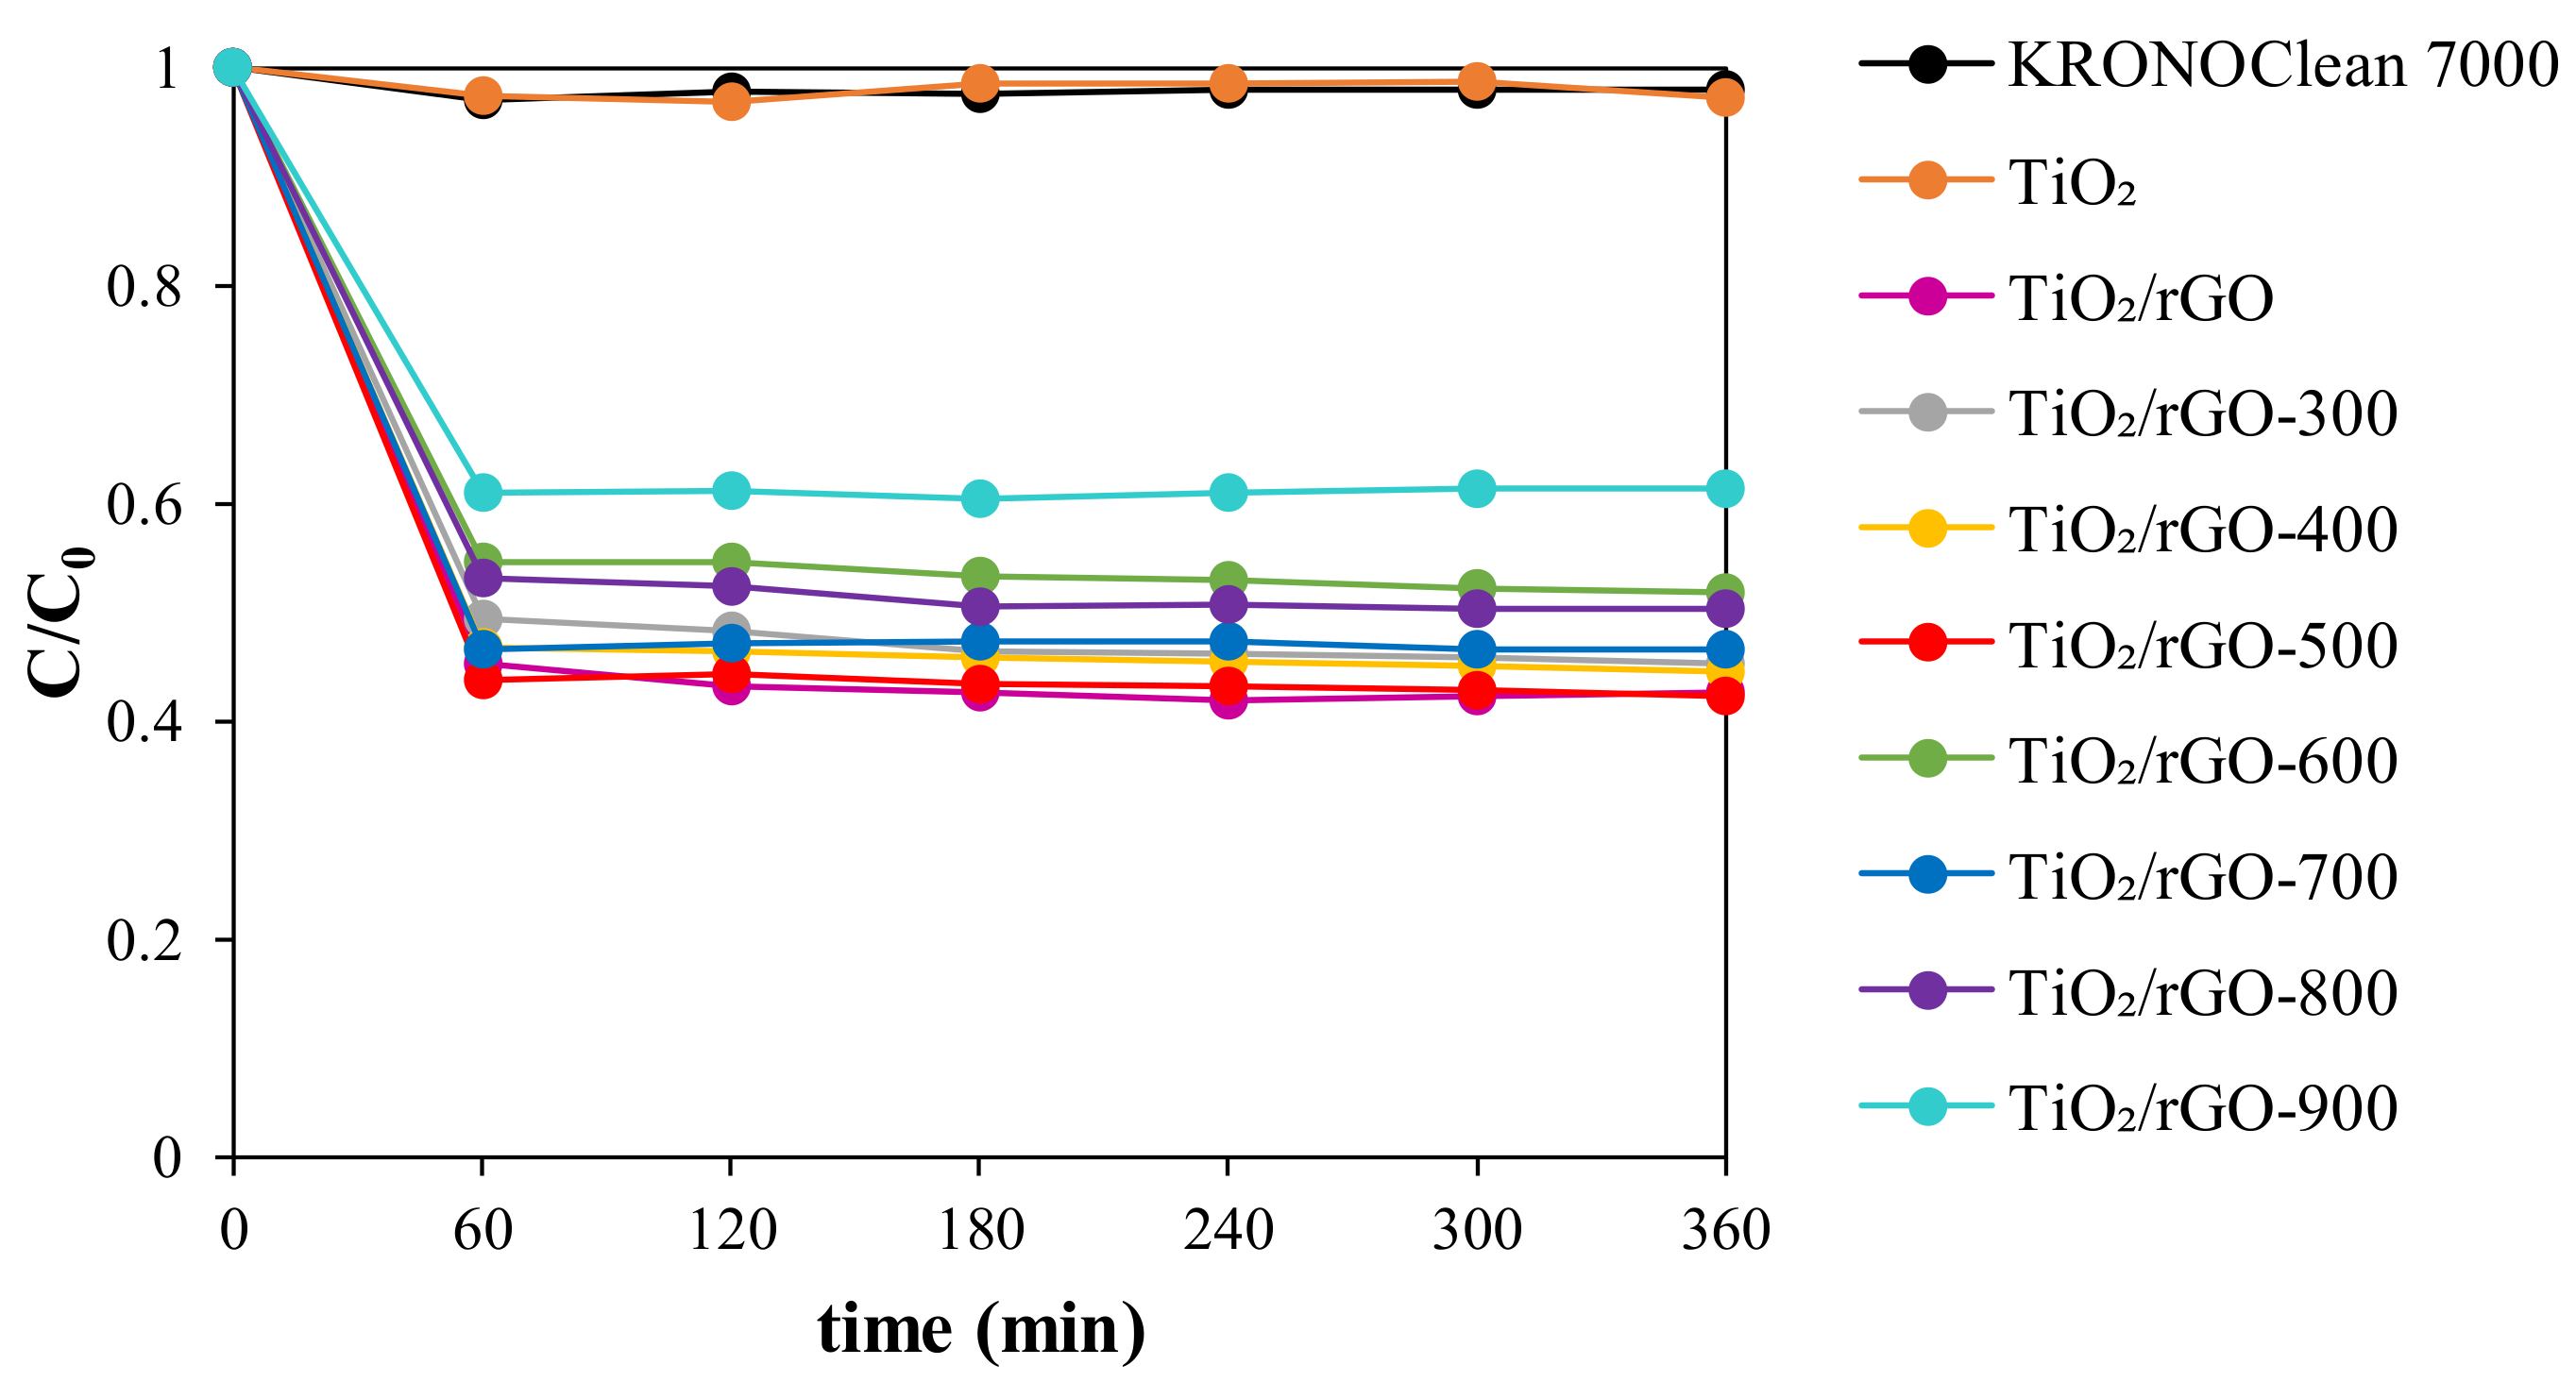
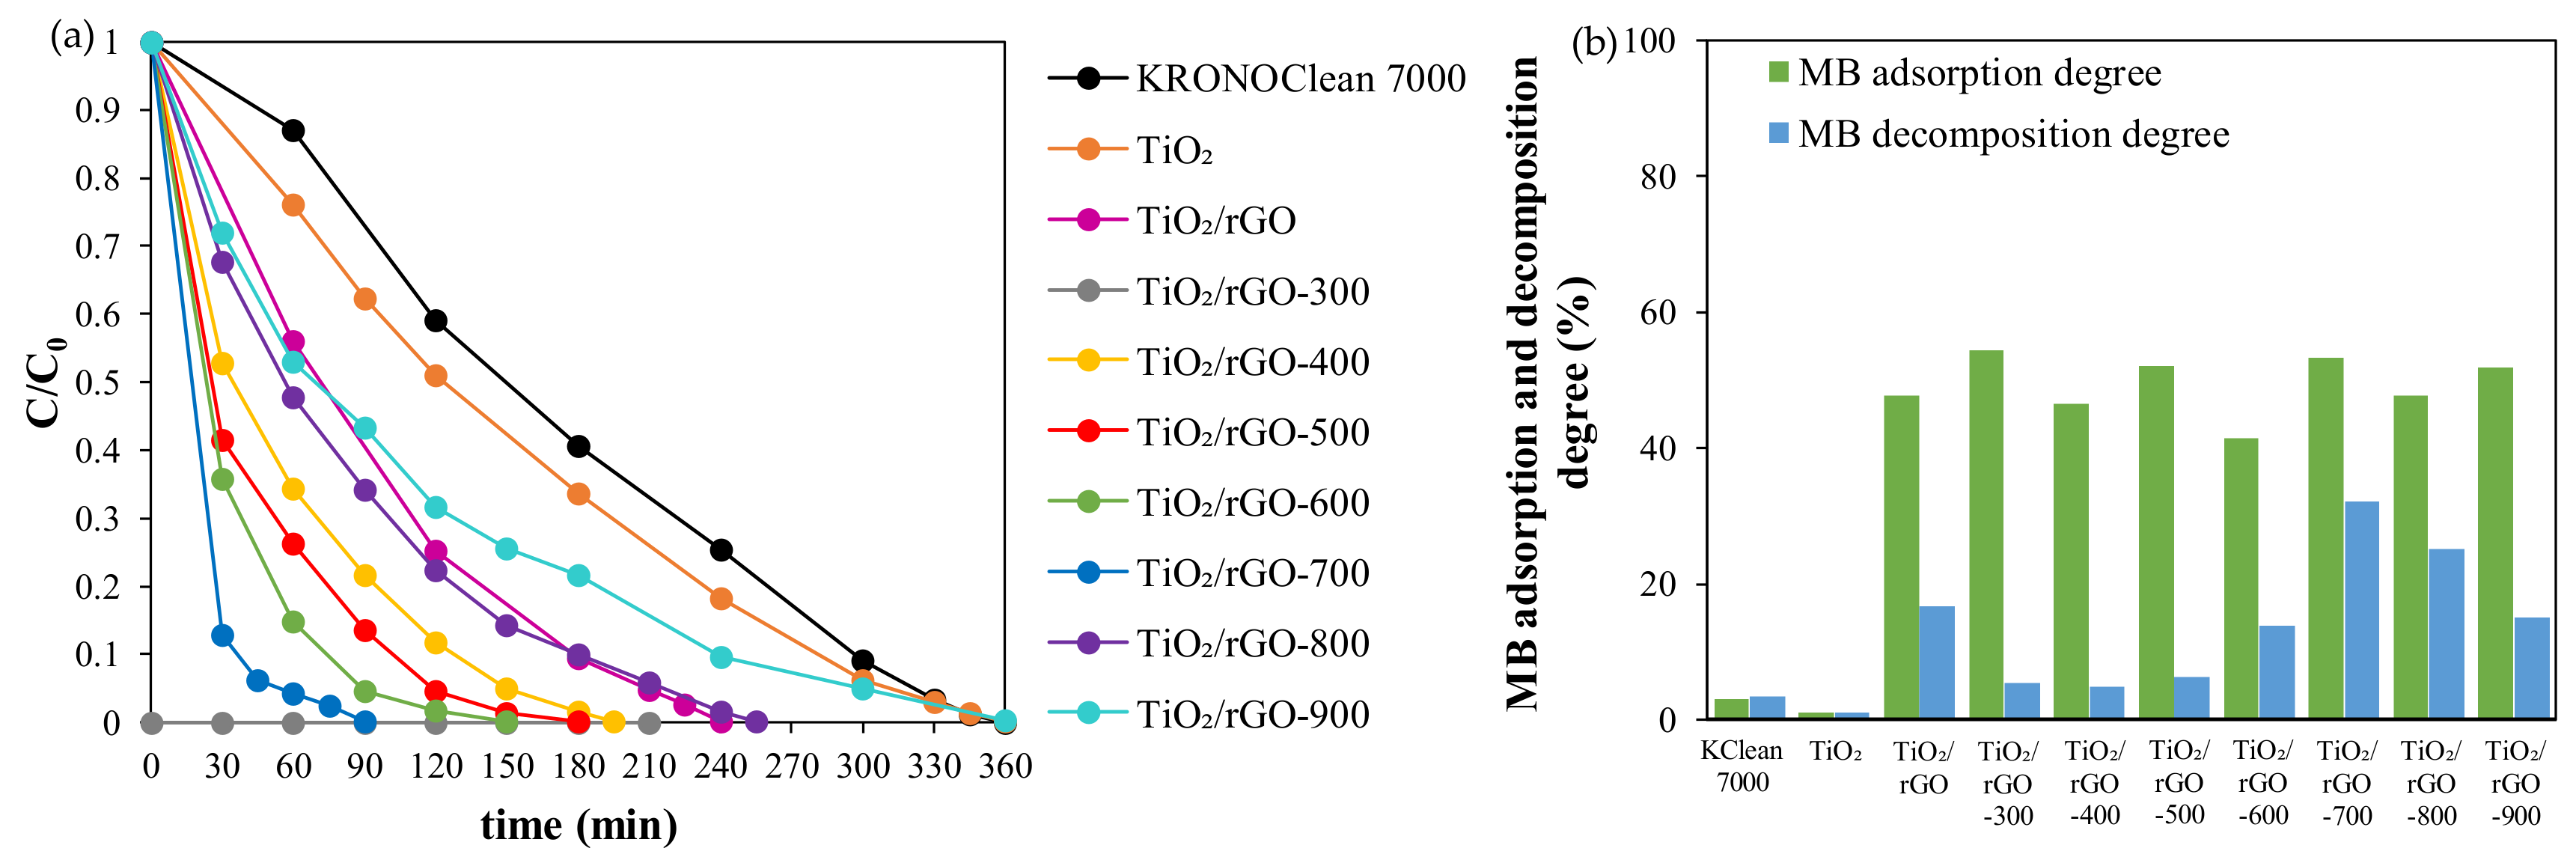
2.3. Photocatalytic Activity Test

The photoactivity of the TiO2 and rGO-modified samples in comparison with the commercial photocatalyst KRONOClean 7000 was determined on the basis of the degradation of MB under UV and artificial solar light irradiation. Figure 10 presents the efficiencies of all tested photocatalysts in methylene blue degradation under both types of irradiation. Generally, TiO2/rGO-t nanomaterials showed higher photoactivity in comparison with control and reference samples. The photocatalytic activity of TiO2 and KRONO-Clean 7000 was negligible, indicating that these samples do not act as effective photocatalysts. Complete MB removal for these samples was achieved after 360 min of irradiation under UV light. In the case of ASL, the decomposition degree was not more than 5%. In contrast, series composites after rGO modification exhibited clearly higher photocatalytic activity under both types of irradiation. It could easily be seen that the activity under UV irradiation increased with the increase of the heat treatment temperature up to 700 °C. This type of correlation was not observed in the case of degradation under artificial solar light. However, in both cases TiO2/rGO-700 nanomaterial had the highest photoactivity, with 100% MB decomposition in 90 min of UV irradiation and 31.3% MB decomposition in 300 min of ASL irradiation. It should be noted that adsorption did not have a significant effect on the improvement of activity in the rGO modified samples. Calcination temperature played a prominent role. To better visualize the impact of rGO modification on photoactivity, the results for TiO2/rGO-700 and TiO2-700 are presented in Table 4. The photocatalyst with rGO showed higher activity than the sample obtained through the same procedure without rGO. Several parameters, such as SBET area, crystal structure, and crystallite size, should be taken into account to explain this phenomenon. First of all, the TiO2/rGO-700 had a higher SBET area (58 m2/g) than the TiO2-700 sample (15 m2/g). It is well-known that large surface area and phase content have an important influence on the improvement of photocatalytic efficiency. The large surface area provides a number of active sites which can adsorb a large number of contaminant particles [29,73]. Samples containing more anatase than rutile generally exhibit higher activity, as shown in Figure 10. It is widely known that rutile is a less active phase of TiO2 than anatase due to the lower numbers of active sites and hydroxyl groups on the surface [74]. However, it is worth taking note of the relatively high activity under artificial solar light for the photocatalysts obtained at 800 and 900 °C, which consisted mainly of rutile phase. TiO2/rGO-800 and TiO2/rGO-900 nanomaterials showed higher activity than the samples modified at temperatures lower than 700 °C. In these cases, the higher photoactivity was related to the redshift edging toward visible light and the narrowing of the band-gap energy. Previous work has suggested that the best proportion between anatase and rutile phases is 75–85% anatase and 15–25% rutile, as in the case of the most popular commercial photocatalyst AEROXIDE® TiO2 P25. It has been stated that such proportions for the anatase-to-rutile ratio are desirable due to the better separation of charge carriers and higher activity [75,76]. A similar trend was observed for the TiO2/rGO-700 sample, which contained 85% anatase and 15% rutile and showed the highest photoactivity under both UV and ASL irradiation. The photoactivity also depends on the degree of crystallinity and the crystallite size: the better the crystallized material, the higher the photoactivity [77]. Thus, the samples with lower FWHM parameters demonstrated higher activity. With higher calcination temperatures, the FWHM parameter was lower and the crystallinity greater. Zhang et al. [30] found that the higher efficiency of samples modified with graphene and calcined was related to an increase in crystallinity. It is well-known that the optimal crystallinity size for better efficiency is 10 nm [78]. However, Almquist and Biswas [79] determined that photoefficiency is the highest when the crystallite size is between 25 and 40 nm, which is in concordance with our observations. In our case, the highest activity was associated with samples with crystallite sizes up to 47 nm.

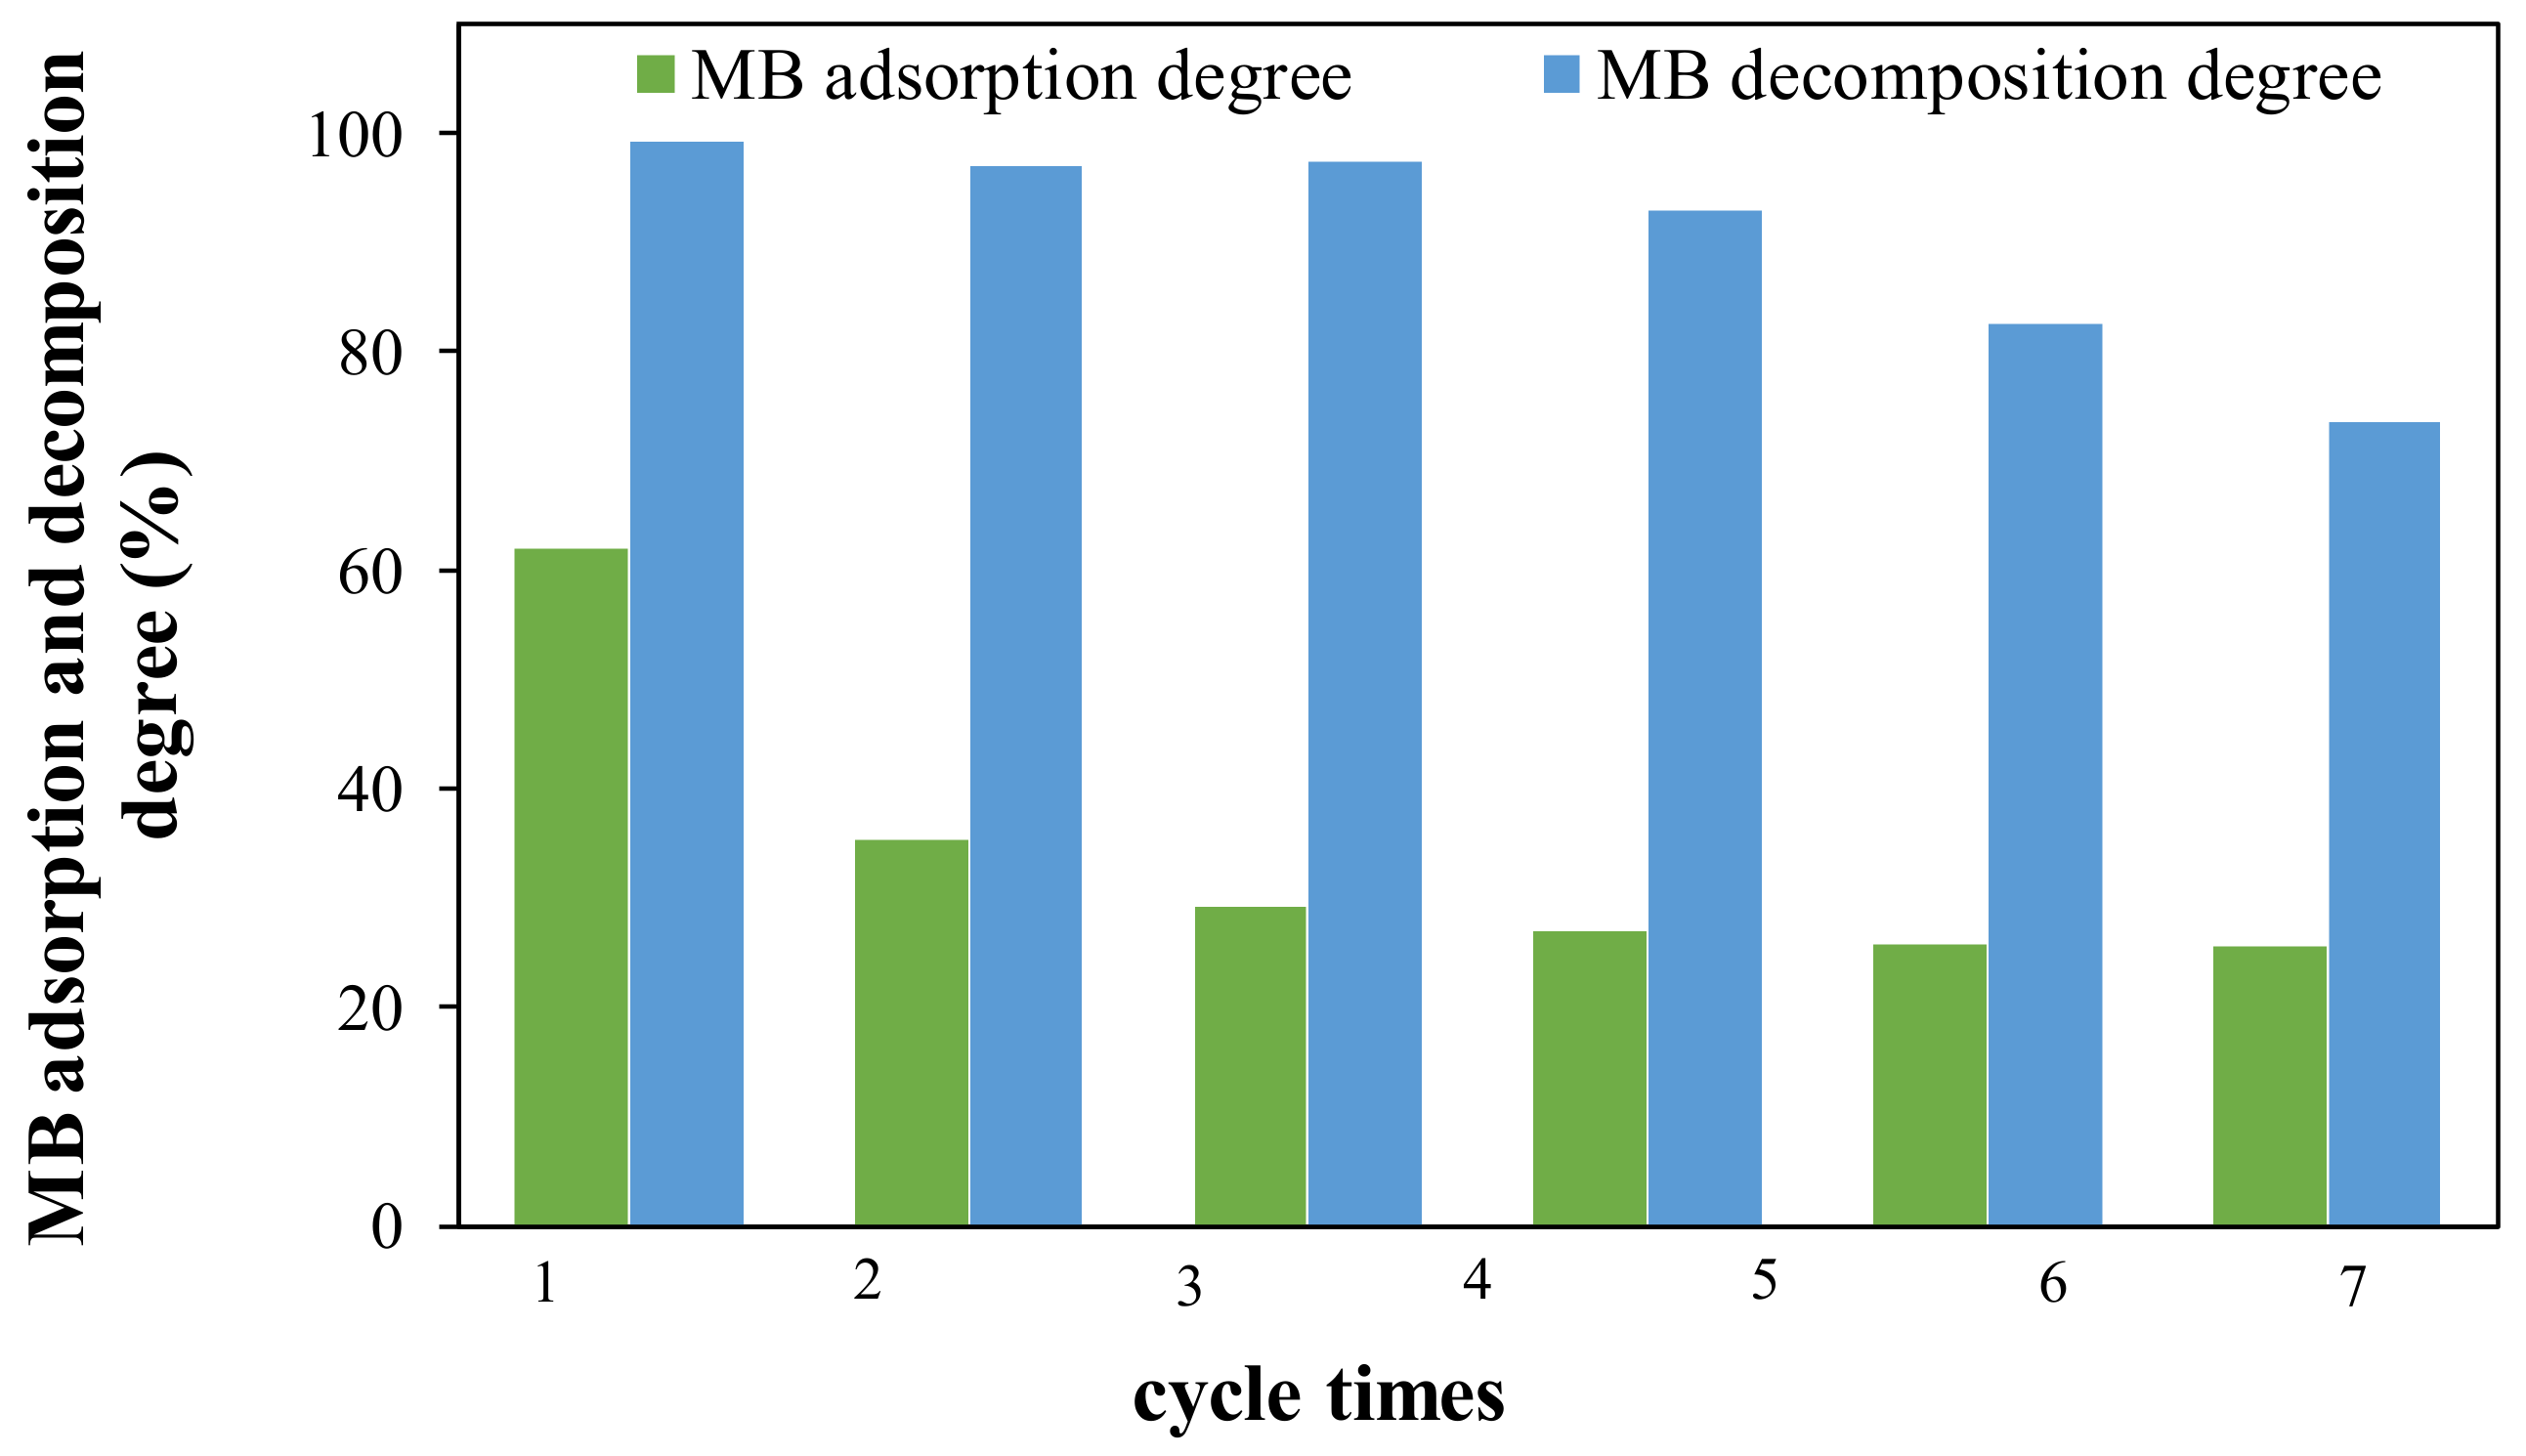
2.4. Photocatalyst Stability

The photoactivity of nanomaterials is an essential parameter from a practical application point of view. As it had the highest photoactivity, the TiO2/rGO-700 photocatalyst was used as the representative sample to examine the long-term stability under UV light irradiation. The results are presented in Figure 11. A slight decrease in activity after the first cycle was observed. It could have been caused by the blocking of active sites on the photocatalyst surface due to the adsorption dye molecules. Janus et al. suggested that carbon deposits from dye degradation can easily be deposited on the surface of tested material [80]. In the case of the TiO2/rGO-700, a change in the color of the photocatalyst to gray-blue indicated the presence of carbon deposits. However, the degree of activity was at the same level up to the third cycle. A decrease in the photoactivity was noted only after the seventh cycle, related to the distribution of carbon deposits adsorbed on the photocatalyst surface. The decomposition of the byproducts of the MB decomposition is a competitive process for the photoremoval of the main contaminant. The presented results indicate that the obtained sample exhibited relatively high stability during the photocatalytic decomposition.

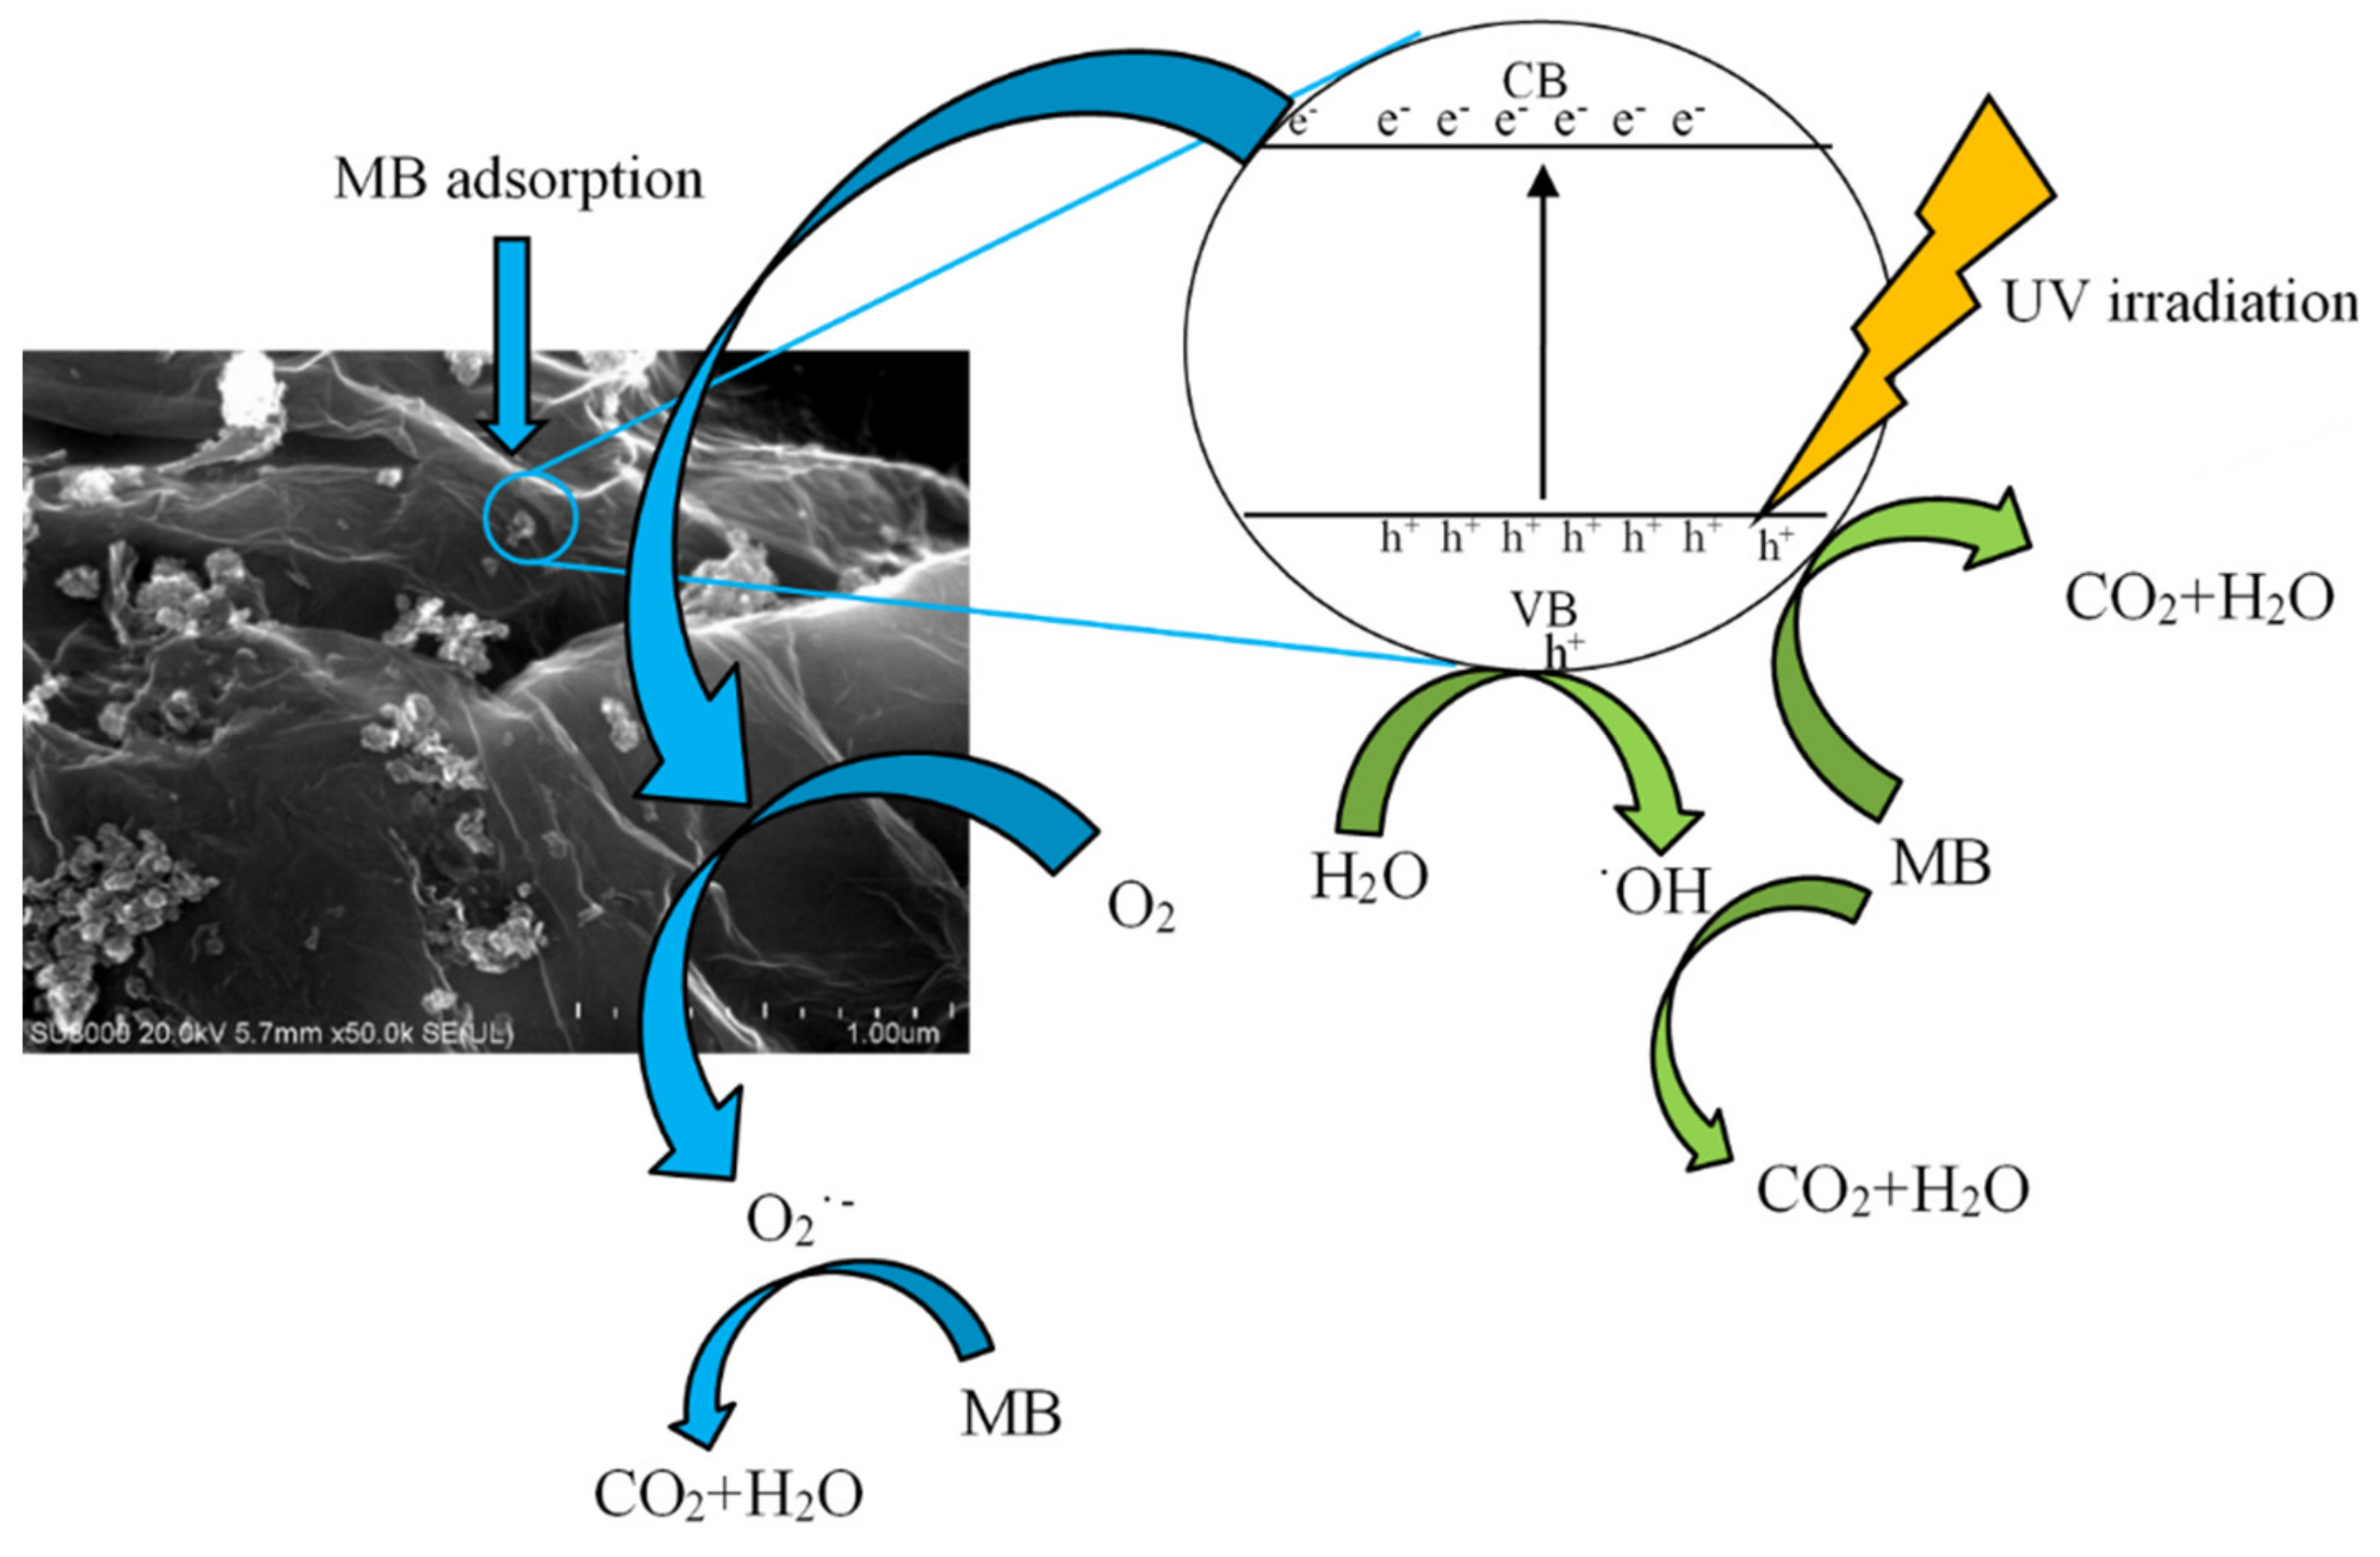
2.5. Photocatalytic Mechanism

The possible photocatalytic mechanism of TiO2/rGO nanomaterials is proposed in Figure 12. As a photon with energy higher than the band-gap energy of the semiconductor becomes adsorbed by the photocatalyst, electrons are excited and move from the valance band (VB) to the conduction band (CB), forming a hole. Generally, the generated charges recombine quickly and only a small fraction take part in the photodegradation of the pollutant, resulting in low photocatalytic efficiency. However, in the case of TiO2 modified with rGO, the electron–hole pair path is different. Due to excellent electronic conductivity, the formed electron is transferred to the graphene sheets, and the charges are well-separated. Thus electron–hole pair recombination is suppressed, and the photoactivity is highly improved. Then, photogenerated electrons react with dissolved oxygen molecules, forming superoxide radical anions (O), which directly degrade the MB. Eventually, the holes from the CB can react with the water molecule to create hydroxyl radicals (˙OH) and destroy MB. Another way is through direct decomposition of the reaction between the holes and MB molecules. In the case of ASL irradiation, the MB molecules also act as sensitizers and self-degradation can take place [81]. It is worth mentioning that adsorption also plays a significant role in photocatalytic mechanisms. Due to the high specific surface area of rGO and the strong π-π interaction between the dye molecules and aromatic regions of the reduced graphene oxide, the pollutants’ adsorption is enhanced. Taking this into account, the combination of TiO2 with rGO can effectively improve the adsorption of MB, as well as the charge transfer reaction [52].

3. Materials and Methods

3.1. Materials

Crude titanium dioxide supplied by Chemical Plant Grupa Azoty Zakłady Chemiczne “Police” S.A. (Poland) was used as a material for preparing photocatalysts. Taking into account the fact that the product contained 2.1 wt.% residual sulfur (from post-production sulfuric acid), pre-treatment was necessary. The pre-treatment process has been described in detail elsewhere [82]. The TiO2 used for modification was denoted as starting TiO2. Reduced graphene oxide prepared with a modified Hummer’s method was supplied by Nanomaterials LS (Poland). The isopropanol (pure p.a. 99.5%) used during the solvothermal treatment was purchased from Firma Chempur (Poland). The commercial photocatalyst KRONOClean 7000 (Kronos Worldwide, Inc., USA) was used as a reference carbon-modified titania nanomaterial. Ultrapure water from a Millipore Elix Advantage water purification system (Merck KGaA, Germany) with a conductivity of 0.04 μS/cm at 25 °C was used for experiments.

3.2. Preparation of Photocatalysts

TiO2/reduced graphene oxide (TiO2/rGO) photocatalysts were obtained in two steps: a solvothermal process and calcination. In the first step, 2 g of starting TiO2 with 8 wt.% reduced graphene oxide were mechanically mixed in a mortar and placed in a pressure reactor with 2 mL of isopropanol. The sample was modified at 180 °C for 4 h under autogenous pressure. Then, the valve in the reactor was opened, and the material was heated for 1 h without pressure to remove residual alcohol and water. Next, the reactor was cooled down to room temperature. The obtained nanomaterial was named TiO2/rGO-8 and was used as a control material. In the next step, the TiO2/rGO sample was calcined in an argon atmosphere (purity: 5.0, Messer Polska Sp. z o.o., Chorzów, Poland) in the temperature range of 300–900 °C (Δt = 100 °C) for 4 h in an Ar flow (60 mL/min). The heat treatment process was conducted in a GHC 12/900 horizontal furnace (Carbolite Gero Ltd, Sheffield. UK). Before the heating step, the argon was passed through the quartz tube for 30 min to remove the air present in the quartz tube. The obtained products were named TiO2/rGO-t, where t indicates the temperature of calcination. The other TiO2 control sample was received similarly but without the addition of reduced graphene oxide. The TiO2 sample was calcined under the same conditions as the photocatalysts with rGO (the samples were named TiO₂-t, where t indicates the temperature of calcination) in order to examine the influence of rGO modification.

3.3. Characterization of Photocatalysts

The crystalline phase and crystal structure were analyzed by XRD analysis (Malvern PANalytical Ltd., Almelo, The Netherlands) using Cu Kα radiation (λ = 1.54056 Å). The anatase and rutile amounts and the average crystallite size of anatase were calculated using the method described elsewhere [35]. The surface morphologies were observed using scanning electron microscopy (SU8020 Ultra-High Resolution Field Emission Scanning Electron Microscope; Hitachi Ltd, Japan). The Brunauer–Emmett–Teller (BET) surface area and pore size distribution were determined according to the N2 adsorption–desorption at −196 °C with a Quadrasorb evo™ Gas Sorption analyzer (Anton Paar GmbH, Graz, Austria; previously Quantachrome Instruments, USA). Prior to adsorption measurement, all samples were degassed at 100 °C under a high vacuum for 12 h in order to remove residual water and organic carbon residues adsorbed on the surfaces of the tested samples. The carbon content in the studied photocatalysts was calculated using a CN628 LECO elemental analyzer (LECO Corporation, St. Joseph, MI, USA). The certified EDTA standard (LECO Corporation, USA) containing 41.06 and 9.56 wt.% of carbon and nitrogen, respectively, was used for the preparation of a calibration curve. Raman spectra were recorded using an inVia Raman Microscope (Renishaw PLC, New Mills, Wotton-under-Edge, UK) with an excitation wavelength of 785 nm. The diffuse-reflectance UV–Vis spectra were recorded with a V-650 UV–Vis spectrophotometer (JASCO International Co., LTD., Tokyo, Japan) equipped with an integrating sphere accessory for studying DRS spectra. Barium sulfate was used as the reference material. The X-ray photoelectron spectroscopy (XPS) experiments were performed using Al Kα (hv = 1486.6 eV) radiation with a Scienta SES 2002 spectrometer (Scienta Scientific AB, Uppsala, Sweden) operating at constant transmission energy (Ep = 50 eV). The thermal stability of the obtained photocatalysts was investigated using thermogravimetric analysis (TGA). The thermal stability of the tested photocatalysts was investigated with a NETZSCH STA 449 C (NETZSCH-Gerätebau GmbH, Germany) TGA analyzer. A sample (ca. 10 mg) of the tested material was placed in an alumina crucible and heated in an inert (nitrogen) atmosphere up to 900 °C with a heating rate of 10 °C/min.

3.4. Adsorption Experiment

The adsorption abilities of all studied materials were examined to determine the adsorption properties of the samples and the moment of the liquid–solid equilibrium. The investigation was undertaken using methylene blue as a model organic contaminant. The experiment was carried out in a glass beaker (0.3 L) containing 0.8 g/L of photocatalyst and 0.2 L of contaminant aqueous solution. The starting concentration of the dye was 10 mg/L. The suspension was magnetically stirred without light until the adsorption equilibrium was established. During the experiment, the suspension solutions were centrifuged every 60 min to remove the TiO2 nanoparticles. The concentration of methylene blue in the solutions was measured using a UV–Vis V-630 spectrophotometer (JASCO International Co., LTD., Tokyo, Japan).

3.5. Photocatalytic Activity Measurements

The photocatalytic activity of the tested nanomaterials was determined according to the degradation process of methylene blue, which was used as a model organic water contaminant. It is remarkable that, although MB tends to absorb light itself, in this case self-degradation was negligible compared to decomposition in the presence of the photocatalyst. The experiments were conducted under UV–Vis light with high UV intensity (UV irradiation) and artificial solar light (ASL) in an air atmosphere. The photocatalytic reaction took place in a glass backer (0.3 L) containing 0.8 g/L of photocatalyst and 0.2 L of pollutant solution. The starting concentration of the dye was 10 mg/L. Before the irradiation, the suspension was stirred in the dark to ensure the establishment of the adsorption–desorption equilibrium. The adsorption time was determined individually for each contaminant based on the previously performed adsorption tests for the tested photocatalysts (as described in the previous section). After adsorption, the solution was irradiated using a suitable radiation source. A group of six lamps, each with a power of 20 W (Philips), was used as a UV light (310–430 nm), and the radiation intensity was about 110 W/m2 in the range of 280–400 nm and 115 W/m2 in the range of 300–2800 nm. A halogen lamp with a power of 60 W (Philips) and intensity of about 0.3 W/m2 (measured in the range of 280–400 nm) and 720 W/m2 (measured in the range of 300–2800 nm) was used as an artificial solar light source. The photocatalytic decomposition of model organic contaminants under UV irradiation was carried out until their concentration equaled zero. In the case of ASL, the degradation was carried out for 5 h. The concentration of methylene blue in the solutions was measured using a UV–Vis V-630 spectrophotometer (JASCO International Co., LTD., Tokyo, Japan). The degree of MB degradation is presented as C/C0, where C is the MB concentration at the irradiation time interval and C0 is the initial concentration of MB after the adsorption–desorption equilibrium is established. The recycling experiment for one selected sample was undertaken through the degradation of methylene blue over 120 min of irradiation. After each cycle, the material was removed by filtration and dried at 100 °C.

3.6. Reusability Test

The reusability test of the selected photocatalyst was carried out seven times under the same conditions as the photocatalytic test. However, after each cycle, the photocatalyst was separated by filtration, dried at 100 °C, and then added to a new portion of the MB solution.

4. Conclusions

In summary, novel TiO2/rGO-t photocatalysts were obtained in a two-step preparation process. The two preparation steps were connected: a solvothermal method and calcination in an inert gas atmosphere. The calcination process was conducted at 300–900 °C in an argon flow. The presence of rGO in the TiO2 samples after calcination was confirmed by Raman spectroscopy, SEM, XPS, and elemental analysis. It was found that both rGO modification and the calcination process impacted the crystallite size, the changes in the crystal structure, and the specific surface area of the nanomaterials. It was observed that rGO modification contributed to maintaining a relatively high surface as well as suppressing the phase transition after calcination. The photoactivity of the obtained photocatalysts was tested via the methylene blue decomposition under two types of irradiation: UV and artificial solar light. The influence of adsorption on photoactivity was also investigated. It was found that the photocatalytic activity increased with the modification temperature up to 700 °C. The best result was observed for the TiO2/rGO-700 photocatalyst, which contained 85% anatase and 15% rutile. Relatively high activity, especially under artificial solar light, was found for samples obtained at 800 and 900 °C due to the redshift edging towards visible light and the narrowing of the band-gap energy. The redshift was caused by the presence of the rutile phase. It was also noted that, in the case of methylene blue degradation, adsorption plays an important role due to π-π interactions between methylene blue molecules and aromatic regions of rGO.

Author Contributions

Conceptualization, A.W.; Funding acquisition, A.W.M.; Investigation, A.W., A.C., and D.M.; Methodology, A.W. and E.K.-N.; Supervision, A.W. and A.W.M.; Writing—original draft, A.W., A.C., and D.M.; Writing—review & editing, A.W.M. and E.K.-N. All authors have read and agreed to the published version of the manuscript.

Funding

This study was funded by the National Science Centre (Poland) grant no. DEC-2012/06/A/ST5/00226.

Data Availability Statement

Not applicable.

Conflicts of Interest

The authors have no competing interests to declare.

References

  1. Muñoz, I.; Gómez, M.; Molina-Díaz, A.; Huijbregts, M.; Fernández-Alba, A.; García-Calvo, E. Ranking potential impacts of priority and emerging pollutants in urban wastewater through life cycle impact assessment. Chemosphere 2008, 74, 37–44. [Google Scholar] [CrossRef]
  2. Wankhade Atul, V.; Gaikwad, G.S.; Dhonde, M.G.; Khaty, N.T.; Thakare, S.R. Removal of organic pollutant from water by heterogeneous photocatalysis: A review. Res. J. Chem. Environ. 2013, 17, 84–94. [Google Scholar]
  3. Grabowska-Musiał, E.; Marchelek, M.; Klimczuk, T.; Trykowski, G.; Zaleska-Medynska, A. Noble metal modified TiO2 microspheres: Surface properties and photocatalytic activity under UV–vis and visible light. J. Mol. Catal. A Chem. 2016, 423, 191–206. [Google Scholar] [CrossRef]
  4. Khedr, T.M.; El-Sheikh, S.M.; Hakki, A.; Ismail, A.A.; Badawy, W.A.; Bahnemann, D.W. Highly active non-metals doped mixed-phase TiO 2 for photocatalytic oxidation of ibuprofen under visible light. J. Photochem. Photobiol. A Chem. 2017, 346, 530–540. [Google Scholar] [CrossRef]
  5. Gupta, S.M.; Tripathi, M. A review of TiO2 nanoparticles. Chin. Sci. Bull. 2011, 56, 1639–1657. [Google Scholar] [CrossRef] [Green Version]
  6. Yun, S.-M.; Palanivelu, K.; Kim, Y.-H.; Kang, P.-H.; Lee, Y.-S. Preparation and characterization of carbon covered TiO2 using sucrose for solar photodegradation. J. Ind. Eng. Chem. 2008, 14, 667–671. [Google Scholar] [CrossRef]
  7. Shao, P.; Tian, J.; Zhao, Z.; Shi, W.; Gao, S.; Cui, F. Amorphous TiO2 doped with carbon for visible light photodegradation of rhodamine B and 4-chlorophenol. Appl. Surf. Sci. 2015, 324, 35–43. [Google Scholar] [CrossRef] [Green Version]
  8. Khalid, N.; Hong, Z.; Ahmed, E.; Zhang, Y.; Chan, H.; Ahmad, M. Synergistic effects of Fe and graphene on photocatalytic activity enhancement of TiO2 under visible light. Appl. Surf. Sci. 2012, 258, 5827–5834. [Google Scholar] [CrossRef]
  9. Rodriguez-Reinoso, F. The role of carbon materials in heterogeneous catalysis. Carbon 1998, 36, 159–175. [Google Scholar] [CrossRef]
  10. Leary, R.; Westwood, A. Carbonaceous nanomaterials for the enhancement of TiO2 photocatalysis. Carbon 2011, 49, 741–772. [Google Scholar] [CrossRef]
  11. Low, F.W.; Lai, C.W. Recent developments of graphene-TiO2 composite nanomaterials as efficient photoelectrodes in dye-sensitized solar cells: A review. Renew. Sustain. Energy Rev. 2018, 82, 103–125. [Google Scholar] [CrossRef]
  12. Štengl, V.; Popelková, D.; Vláčil, P. TiO2–Graphene Nanocomposite as High Performace Photocatalysts. J. Phys. Chem. C 2011, 115, 25209–25218. [Google Scholar] [CrossRef]
  13. Bell, N.J.; Ng, Y.H.; Du, A.; Coster, H.; Smith, S.; Amal, R. Understanding the Enhancement in Photoelectrochemical Properties of Photocatalytically Prepared TiO2-Reduced Graphene Oxide Composite. J. Phys. Chem. C 2011, 115, 6004–6009. [Google Scholar] [CrossRef]
  14. Mishra, A.K.; Ramaprabhu, S. Functionalized Graphene-Based Nanocomposites for Supercapacitor Application. J. Phys. Chem. C 2011, 115, 14006–14013. [Google Scholar] [CrossRef]
  15. Anjusree, G.S.; Nair, A.S.; Nair, S.V.; Vadukumpully, S. One-pot hydrothermal synthesis of TiO2/graphene nanocomposites for enhanced visible light photocatalysis and photovoltaics. RSC Adv. 2013, 3, 12933–12938. [Google Scholar] [CrossRef]
  16. Yadav, H.M.; Kim, J.-S. Solvothermal synthesis of anatase TiO2-graphene oxide nanocomposites and their photocatalytic performance. J. Alloy. Compd. 2016, 688, 123–129. [Google Scholar] [CrossRef]
  17. Monteagudo, J.; Durán, A.; Martínez, J.M.M.; Martín, I.S. Effect of reduced graphene oxide load into TiO2 P25 on the generation of reactive oxygen species in a solar photocatalytic reactor. Application to antipyrine degradation. Chem. Eng. J. 2019, 380, 122410. [Google Scholar] [CrossRef]
  18. De Oliveira, A.G.; Nascimento, J.P.; Gorgulho, H.D.F.; Martelli, P.; Furtado, C.A.; Figueiredo, J.L. Electrochemical synthesis of TiO2/Graphene oxide composite films for photocatalytic applications. J. Alloy. Compd. 2016, 654, 514–522. [Google Scholar] [CrossRef]
  19. Jiang, G.; Lin, Z.; Chen, C.; Zhu, L.; Chang, Q.; Wang, N.; Wei, W.; Tang, H. TiO2 nanoparticles assembled on graphene oxide nanosheets with high photocatalytic activity for removal of pollutants. Carbon 2011, 49, 2693–2701. [Google Scholar] [CrossRef]
  20. Shanmugam, M.; Alsalme, A.; Alghamdi, A.; Jayavel, R. In-situ microwave synthesis of graphene–TiO2 nanocomposites with enhanced photocatalytic properties for the degradation of organic pollutants. J. Photochem. Photobiol. B Biol. 2016, 163, 216–223. [Google Scholar] [CrossRef]
  21. Li, J.; Zhou, S.L.; Hong, G.-B.; Chang, C.-T. Hydrothermal preparation of P25–graphene composite with enhanced adsorption and photocatalytic degradation of dyes. Chem. Eng. J. 2013, 219, 486–491. [Google Scholar] [CrossRef]
  22. Liu, Y. Hydrothermal synthesis of TiO2–RGO composites and their improved photocatalytic activity in visible light. RSC Adv. 2014, 4, 36040–36045. [Google Scholar] [CrossRef]
  23. Hu, C.; Chen, F.; Lu, T.; Lian, C.; Zheng, S.; Zhang, R. Aqueous production of TiO2–graphene nanocomposites by a combination of electrostatic attraction and hydrothermal process. Mater. Lett. 2014, 121, 209–211. [Google Scholar] [CrossRef]
  24. Shen, J.; Yan, B.; Shi, M.; Ma, H.; Li, N.; Ye, M. One step hydrothermal synthesis of TiO2-reduced graphene oxide sheets. J. Mater. Chem. A 2011, 21, 3415–3421. [Google Scholar] [CrossRef]
  25. Wang, Y.; Li, Z.; He, Y.; Li, F.; Liu, X.; Yang, J. Low-temperature solvothermal synthesis of graphene–TiO2 nanocomposite and its photocatalytic activity for dye degradation. Mater. Lett. 2014, 134, 115–118. [Google Scholar] [CrossRef]
  26. Kim, M.; Hong, W.H.; Kim, W.; Park, S.H.; Jo, W.K. 2D reduced graphene oxide–titania nanocomposites synthesized under different hydrothermal conditions for treatment of hazardous organic pollutants. Particuology 2018, 36, 165–173. [Google Scholar] [CrossRef]
  27. Hu, J.; Li, H.; Muhammad, S.; Wu, Q.; Zhao, Y.; Jiao, Q. Surfactant-assisted hydrothermal synthesis of TiO2/reduced graphene oxide nanocomposites and their photocatalytic performances. J. Solid State Chem. 2017, 253, 113–120. [Google Scholar] [CrossRef]
  28. Torres, S.M.; Pastrana-Martínez, L.M.; Figueiredo, J.; Faria, J.L.; Silva, A. Design of graphene-based TiO2 photocatalysts—a review. Environ. Sci. Pollut. Res. 2012, 19, 3676–3687. [Google Scholar] [CrossRef] [PubMed]
  29. Carp, O. Photoinduced reactivity of titanium dioxide. Prog. Solid State Chem. 2004, 32, 33–177. [Google Scholar] [CrossRef]
  30. Zhang, Y.; Hou, X.; Sun, T.; Zhao, X. Calcination of reduced graphene oxide decorated TiO2 composites for recovery and reuse in photocatalytic applications. Ceram. Int. 2017, 43, 1150–1159. [Google Scholar] [CrossRef]
  31. Nguyen-Phan, T.-D.; Pham, V.H.; Yun, H.; Kim, E.J.; Hur, S.H.; Chung, J.S.; Shin, E.W. Influence of heat treatment on thermally-reduced graphene oxide/TiO2 composites for photocatalytic applications. Korean J. Chem. Eng. 2011, 28, 2236–2241. [Google Scholar] [CrossRef]
  32. Gao, Y.; Pu, X.; Zhang, D.; Ding, G.; Shao, X.; Ma, J. Combustion synthesis of graphene oxide–TiO2 hybrid materials for photodegradation of methyl orange. Carbon 2012, 50, 4093–4101. [Google Scholar] [CrossRef]
  33. Ismail, A.A.; Geioushy, R.; Bouzid, H.; Al-Sayari, S.A.; Al-Hajry, A.; Bahnemann, D.W. TiO2 decoration of graphene layers for highly efficient photocatalyst: Impact of calcination at different gas atmosphere on photocatalytic efficiency. Appl. Catal. B Environ. 2013, 129, 62–70. [Google Scholar] [CrossRef]
  34. Chun, H.-H.; Jo, W.-K. Adsorption and photocatalysis of 2-ethyl-1-hexanol over graphene oxide–TiO2 hybrids post-treated under various thermal conditions. Appl. Catal. B Environ. 2016, 180, 740–750. [Google Scholar] [CrossRef]
  35. Kusiak-Nejman, E.; Wanag, A.; Kozar, J.K.; Kowalczyk, Ł.; Zgrzebnicki, M.; Tryba, B.; Przepiórski, J.; Morawski, A.W. Methylene blue decomposition on TiO2/reduced graphene oxide hybrid photocatalysts obtained by a two-step hydrothermal and calcination synthesis. Catal. Today 2019, 357, 630–637. [Google Scholar] [CrossRef]
  36. Guskos, N.; Zolnierkiewicz, G.; Gusko, A.; Aidinis, K.; Wanag, A.; Kusiak-Nejman, E.; Narkiewicz, U.; Morawski, A.W. Magnetic moment centers in titanium dioxide photocatalysts loaded on reduced graphene oxide flakes. Rev. Adv. Mater. Sci. 2021, in press. [Google Scholar]
  37. Zhang, W.; Guo, H.; Sun, H.; Zeng, R.-C. Hydrothermal synthesis and photoelectrochemical performance enhancement of TiO2/graphene composite in photo-generated cathodic protection. Appl. Surf. Sci. 2016, 382, 128–134. [Google Scholar] [CrossRef]
  38. Dubey, P.K.; Tripathi, P.; Tiwari, R.; Sinha, A.; Srivastava, O. Synthesis of reduced graphene oxide–TiO2 nanoparticle composite systems and its application in hydrogen production. Int. J. Hydrog. Energy 2014, 39, 16282–16292. [Google Scholar] [CrossRef]
  39. Zhang, Y.; Tang, Z.-R.; Fu, X.; Xu, Y.-J. TiO2−Graphene Nanocomposites for Gas-Phase Photocatalytic Degradation of Volatile Aromatic Pollutant: Is TiO2−Graphene Truly Different from Other TiO2−Carbon Composite Materials? ACS Nano 2010, 4, 7303–7314. [Google Scholar] [CrossRef]
  40. Pastrana-Martínez, L.M.; Morales-Torres, S.; Likodimos, V.; Figueiredo, J.; Faria, J.; Falaras, P.; Silva, A. Advanced nanostructured photocatalysts based on reduced graphene oxide–TiO2 composites for degradation of diphenhydramine pharmaceutical and methyl orange dye. Appl. Catal. B Environ. 2012, 123–124, 241–256. [Google Scholar] [CrossRef]
  41. Reyescoronado, D.; Gattorno, G.R.; Espinosa-Pesqueira, M.E.; Cab, C.; De Coss, R.; Oskam, G. Phase-pure TiO2 nanoparticles: Anatase, brookite and rutile. Nanotechnology 2008, 19, 145605–145615. [Google Scholar] [CrossRef] [PubMed]
  42. Hussain, M.; Russo, N.; Saracco, G. Photocatalytic abatement of VOCs by novel optimized TiO2 nanoparticles. Chem. Eng. J. 2011, 166, 138–149. [Google Scholar] [CrossRef]
  43. Fan, Z.; Wu, T.; Xu, X. Synthesis of Reduced Grapheme Oxide as A Platform for loading β-NaYF4:Ho3+@TiO2Based on An Advanced Visible Light-Driven Photocatalyst. Sci. Rep. 2017, 7, 13833. [Google Scholar] [CrossRef] [Green Version]
  44. Sriwong, C.; Choojun, K.; Tejangkura, W.; Prasanseang, W. Preparation and Photocatalytic Activities of TiO2-rGO Nanocomposite Catalysts for MB Dye Degradation over Sunlight Irradiation. Mater. Sci. Forum 2018, 936, 47–52. [Google Scholar] [CrossRef]
  45. Trapalis, A.; Todorova, N.; Giannakopoulou, T.; Boukos, N.; Speliotis, T.; Dimotikali, D.; Yu, J. TiO2/graphene composite photocatalysts for NOx removal: A comparison of surfactant-stabilized graphene and reduced graphene oxide. Appl. Catal. B Environ. 2016, 180, 637–647. [Google Scholar] [CrossRef]
  46. Rong, X.; Qiu, F.; Zhang, C.; Fu, L.; Wang, Y.; Yang, D. Preparation, characterization and photocatalytic application of TiO2–graphene photocatalyst under visible light irradiation. Ceram. Int. 2015, 41, 2502–2511. [Google Scholar] [CrossRef]
  47. He, Y.; Zhang, Y.; Huang, H.; Zhang, R. Synthesis of titanium dioxide–reduced graphite oxide nanocomposites and their photocatalytic performance. Micro Nano Lett. 2013, 8, 483–486. [Google Scholar] [CrossRef]
  48. Yang, Y.; Luo, L.; Xiao, M.; Li, H.; Pan, X.; Jiang, F. One-step hydrothermal synthesis of surface fluorinated TiO2/reduced graphene oxide nanocomposites for photocatalytic degradation of estrogens. Mater. Sci. Semicond. Process. 2015, 40, 183–193. [Google Scholar] [CrossRef]
  49. Tayel, A.; Ramadan, A.R.; El Seoud, O.A. Titanium Dioxide/Graphene and Titanium Dioxide/Graphene Oxide Nanocomposites: Synthesis, Characterization and Photocatalytic Applications for Water Decontamination. Catalysts 2018, 8, 491. [Google Scholar] [CrossRef] [Green Version]
  50. Ganguly, A.; Sharma, S.; Papakonstantinou, P.; Hamilton, J. Probing the Thermal Deoxygenation of Graphene Oxide Using High-Resolution In Situ X-ray-Based Spectroscopies. J. Phys. Chem. C 2011, 115, 17009–17019. [Google Scholar] [CrossRef] [Green Version]
  51. Park, M.-S.; Kang, M. The preparation of the anatase and rutile forms of Ag–TiO2 and hydrogen production from methanol/water decomposition. Mater. Lett. 2008, 62, 183–187. [Google Scholar] [CrossRef]
  52. Ruidíaz-Martínez, M.; Álvarez, M.A.; López-Ramón, M.V.; Cruz-Quesada, G.; Rivera-Utrilla, J.; Sánchez-Polo, M. Hydrothermal Synthesis of rGO-TiO2 Composites as High-Performance UV Photocatalysts for Ethylparaben Degradation. Catalysts 2020, 10, 520. [Google Scholar] [CrossRef]
  53. Nyamukamba, P.; Tichagwa, L.; Greyling, C. The Influence of Carbon Doping on TiO2 Nanoparticle Size, Surface Area, Anatase to Rutile Phase Transformation and Photocatalytic Activity. Mater. Sci. Forum 2012, 712, 49–63. [Google Scholar] [CrossRef]
  54. Wanag, A.; Kusiak-Nejman, E.; Kowalczyk, Ł.; Kapica-Kozar, J.; Ohtani, B.; Morawski, A.W. Synthesis and characterization of TiO2/graphitic carbon nanocomposites with enhanced photocatalytic performance. Appl. Surf. Sci. 2018, 437, 441–450. [Google Scholar] [CrossRef]
  55. Sing, K.S.W. Reporting physisorption data for gas/solid systems with special reference to the determination of surface area and porosity (Provisional). Pure Appl. Chem. 1982, 54, 2201–2218. [Google Scholar] [CrossRef]
  56. Leofanti, G.; Padovan, M.; Tozzola, G.; Venturelli, B. Surface area and pore texture of catalysts. Catal. Today 1998, 41, 207–219. [Google Scholar] [CrossRef]
  57. Shi, R.; Ren, M.; Li, H.; Zhao, J.; Liu, S.; Li, Z.; Ren, J. Graphene supported Cu nanoparticles as catalysts for the synthesis of dimethyl carbonate: Effect of carbon black intercalation. Mol. Catal. 2018, 445, 257–268. [Google Scholar] [CrossRef]
  58. Available online: http://www.nanomaterials.pl/properties (accessed on 1 October 2021).
  59. Coi, H.C.; Jung, Y.M.; Kim, S.B. Size effect in the Raman spectra of TiO2 nanoparticles. Vib. Spectrosc. 2005, 37, 33–38. [Google Scholar] [CrossRef]
  60. Ma, H.; Yang, J.; Dai, Y.; Zhang, Y.; Lu, B.; Ma, G. Raman study of phase transformation of TiO2 rutile single crystal irradiated by infrared femtosecond laser. Appl. Surf. Sci. 2007, 253, 7497–7500. [Google Scholar] [CrossRef]
  61. Tan, L.-L.; Ong, W.-J.; Chai, S.-P.; Mohamed, A.R. Reduced graphene oxide-TiO2 nanocomposite as a promising visible-light-active photocatalyst for the conversion of carbon dioxide. Nanoscale Res. Lett. 2013, 8, 465. [Google Scholar] [CrossRef] [Green Version]
  62. Liang, D.; Cui, C.; Hu, H.; Wang, Y.; Xu, S.; Ying, B.; Li, P.; Lu, B.; Shen, H. One-step hydrothermal synthesis of anatase TiO2/reduced graphene oxide nanocomposites with enhanced photocatalytic activity. J. Alloy. Compd. 2014, 582, 236–240. [Google Scholar] [CrossRef]
  63. How, G.T.S.; Pandikumar, A.; Ming, H.N.; Ngee, L.H. Highly exposed {001} facets of titanium dioxide modified with reduced graphene oxide for dopamine sensing. Sci. Rep. 2014, 4, 5044. [Google Scholar] [CrossRef] [PubMed] [Green Version]
  64. Lambert, T.N.; Chavez, C.A.; Hernandez-Sanchez, B.; Lu, P.; Bell, N.S.; Ambrosini, A.; Friedman, T.; Boyle, T.J.; Wheeler, D.R.; Huber, D. Synthesis and Characterization of Titania−Graphene Nanocomposites. J. Phys. Chem. C 2009, 113, 19812–19823. [Google Scholar] [CrossRef]
  65. Huang, N.M.; Chang, B.Y.S.; An’Amt, M.N.; Marlinda, A.R.; Norazriena, Y.; Muhamad, M.R.; Harrison, I.; Lim, H.N.; Chia, C.H. Facile hydrothermal preparation of titanium dioxide decorated reduced graphene oxide nanocomposite. Int. J. Nanomed. 2012, 7, 3379–3387. [Google Scholar] [CrossRef] [PubMed] [Green Version]
  66. Mathews, N.; Morales, E.R.; Cortés-Jacome, M.; Antonio, J.A.T. TiO2 thin films – Influence of annealing temperature on structural, optical and photocatalytic properties. Sol. Energy 2009, 83, 1499–1508. [Google Scholar] [CrossRef]
  67. Ma, Y.-J.; Lu, F.; Xiang, B.-X.; Zhao, J.-L.; Ruan, S.-C. Fabrication of TiO2 thin films with both anatase and rutile structures together using the ion-implantation method. Opt. Mater. Express 2018, 8, 532–540. [Google Scholar] [CrossRef]
  68. Dolat, D.; Mozia, S.; Wróbel, R.; Moszyński, D.; Ohtani, B.; Guskos, N.; Morawski, A.W. Nitrogen-doped, metal-modified rutile titanium dioxide as photocatalysts for water remediation. Appl. Catal. B Environ. 2015, 162, 310–318. [Google Scholar] [CrossRef]
  69. Briggs, D.; Grant, J.T. Surface Analysis by Auger and X-ray Photoelectron Spectroscopy in; IM publications and Surface Spectra Limited: Manchester, UK, 2003. [Google Scholar]
  70. Wen, Y.; Ding, H.; Shan, Y. Preparation and visible light photocatalytic activity of Ag/TiO2/graphene nanocomposite. Nanoscale 2011, 3, 4411–4417. [Google Scholar] [CrossRef] [PubMed]
  71. Wang, S.; Zhu, Z.; Coomes, A.; Haghseresht, F.; Lu, G. The physical and surface chemical characteristics of activated carbons and the adsorption of methylene blue from wastewater. J. Colloid Interface Sci. 2005, 284, 440–446. [Google Scholar] [CrossRef]
  72. Beegam, M.S.; Ullattil, S.G.; Periyat, P. Selective Solar Photocatalysis by High Temperature Stable Anatase TiO2. Sol. Energy 2018, 160, 10–17. [Google Scholar] [CrossRef]
  73. Alvaro, M.; Aprile, C.; Benitez, M.; Carbonell, E.; Garcia, H. Photocatalytic Activity of Structured Mesoporous TiO2 Materials. J. Phys. Chem. B 2006, 110, 6661–6665. [Google Scholar] [CrossRef]
  74. Herrmann, J.-M. Heterogeneous photocatalysis: Fundamentals and applications to the removal of various types of aqueous pollutants. Catal. Today 1999, 53, 115–129. [Google Scholar] [CrossRef]
  75. Zhang, H.; Lv, X.-J.; Li, Y.; Wang, Y.; Li, J. P25-Graphene Composite as a High Performance Photocatalyst. ACS Nano 2009, 4, 380–386. [Google Scholar] [CrossRef]
  76. Siah, W.R.; Lintang, H.O.; Shamsuddin, M.; Yuliati, L. High photocatalytic activity of mixed anatase-rutile phases on commercial TiO2 nanoparticles. IOP Conf. Ser. Mater. Sci. Eng. 2016, 107, 012005. [Google Scholar] [CrossRef]
  77. Ohtani, B.; Ogawa, A.Y.; Nishimoto, S.-I. Photocatalytic Activity of Amorphous−Anatase Mixture of Titanium(IV) Oxide Particles Suspended in Aqueous Solutions. J. Phys. Chem. B 1997, 101, 3746–3752. [Google Scholar] [CrossRef] [Green Version]
  78. Zhang, Z.; Wang, C.-C.; Zakaria, A.R.; Ying, J. Role of Particle Size in Nanocrystalline TiO2-Based Photocatalysts. J. Phys. Chem. B 1998, 102, 10871–10878. [Google Scholar] [CrossRef]
  79. Almquist, C.B.; Biswas, P. Role of Synthesis Method and Particle Size of Nanostructured TiO2 on Its Photoactivity. J. Catal. 2002, 212, 145–156. [Google Scholar] [CrossRef]
  80. Janus, M.; Kusiak-Nejman, E.; Choina, J.; Morawski, A.W. Lifetime of Carbon-Modified TiO2 Photocatalysts Under UV Light Irradiation. Catal. Lett. 2009, 131, 606–611. [Google Scholar] [CrossRef]
  81. Watanabe, M. Dye-sensitized photocatalyst for effective water splitting catalyst. Sci. Technol. Adv. Mater. 2017, 18, 705–723. [Google Scholar] [CrossRef] [Green Version]
  82. Kusiak-Nejman, E.; Wanag, A.; Kozar, J.K.; Morawski, A.W. Preparation and characterisation of TiO2 thermally modified with cyclohexane vapours. Int. J. Mater. Prod. Technol. 2016, 52, 286–297. [Google Scholar] [CrossRef]
Figure 1. UV–Vis/DR spectra (a) and Tauc plot (b) for reference, control, and obtained photocatalysts.
Catalysts 11 01333 g001
Figure 2. XRD patterns of reference, control, and obtained photocatalysts.
Catalysts 11 01333 g002
Figure 3. Adsorption–desorption isotherms for (a) reference, control, and (b) obtained photocatalysts.
Catalysts 11 01333 g003
Figure 4. SEM images of (a) rGO, (b) TiO2, and (c) TiO2/rGO-8-300.
Catalysts 11 01333 g004
Figure 5. Raman spectra of (a) reference, control, and (b) exemplary obtained photocatalysts.
Catalysts 11 01333 g005
Figure 6. TG (a) and DTG (b) curves for control and obtained photocatalysts.
Catalysts 11 01333 g006
Figure 7. X-ray photoelectron spectrum of Ti 2p transition for TiO2/rGO-8-900 sample.
Catalysts 11 01333 g007
Figure 8. X-ray photoelectron spectra of C 1s transition for reduced graphene oxide (rGO) and selected TiO2 and rGO hybrid materials.
Catalysts 11 01333 g008
Figure 9. Methylene blue adsorption on the surfaces of reference, control, and prepared photocatalysts.
Catalysts 11 01333 g009
Figure 10. Degree of methylene blue decomposition under (a) UV light and (b) artificial solar light.
Catalysts 11 01333 g010
Figure 11. Cycling stability of adsorption and decomposition of methylene blue for the TiO2/rGO-8-700 sample under UV light.
Catalysts 11 01333 g011
Figure 12. The reaction mechanism for photocatalytic degradation of MB with TiO2/rGO photocatalyst under UV irradiation.
Catalysts 11 01333 g012
Table 1. XRD phase compositions and crystallite sizes for reference, control, and obtained photocatalysts.
Sample CodeCrystalline Phase Participation (%)AnataseRutileEg
(eV)
AnataseRutile FWHM 2θ = 25.4
(°)
dA a
(nm)
FWHM 2θ = 27.7
(°)
dR a
nm)
KRONOClean 700010000.8811--3.29
TiO29820.55180.34323.28
TiO2/rGO9910.58170.37273.28
TiO2/rGO-300 9820.53190.34333.27
TiO2/rGO-4009820.53190.32293.28
TiO2/rGO-5009630.47220.24933.28
TiO2/rGO-6009730.38290.30140 *3.26
TiO2/rGO-70076240.31380.13176 *2.99
TiO2/rGO-8003970.22650.12272 *2.97
TiO2/rGO-9000100--0.12281 *2.97
TiO2-3009910.55180.35323.27
TiO2-5009910.42260.27473.29
TiO₂-70028720.24580.13235 *3.02
TiO₂-8001990.171050.12338 *3.01
TiO2-9000100--0.11423 *-
a Mean anatase and rutile crystallite size. * Determination of crystallites above 100 nm was subject to large errors. However, these results are presented for comparative purposes.
Table 2. Specific surface area and pore size distribution of studied reference, control, and prepared photocatalysts.
Sample CodeSBET
(m2/g)
Vtotal a
(cm3/g)
Vmicro b (cm3/g)Vmeso c (cm3/g)Carbon Content
(wt%)
KRONOClean 70002490.370.09 0.28 0.96
TiO2970.400.04 0.36 0.6
TiO2/rGO1420.420.04 0.38 6.5
TiO2/rGO-3001340.440.04 0.40 5.8
TiO2/rGO-4001170.350.04 0.31 5.9
TiO2/rGO-5001140.410.04 0.37 5.9
TiO2/rGO-600630.750.03 0.72 6.0
TiO2/rGO-700580.240.02 0.22 5.7
TiO2/rGO-800230.080.01 0.07 5.9
TiO2/rGO-900210.040.01 0.03 5.4
TiO2-3001120.300.04 0.26 -
TiO2-500780.230.03 0.20 -
TiO₂-700150.050.004 0.046 -
TiO2-90040.040.01 0.03 -
rGO3100.320.120.2075
a Total pore volume determined by the signal-point nitrogen adsorption isotherms at relative pressures p/p0 = 0.989. b Micropore volume estimated using the Dubinin–Radushkevich method. c Mesopore volume determined as the difference between Vtotal and Vmicro.
Table 3. The relative surface functional group composition of the total C 1s signal.
Sample CodeC 1s Components (Total C 1s Intensity = 100)
C−CgraphC−CaliphC−OHC=OCO(O)π→π*
rGO57218446
TiO2/rGO-30054266311-
TiO2/rGO-50053277211-
TiO2/rGO-7005629717-
TiO2/rGO-90060217327
Table 4. Degree of methylene blue adsorption and decomposition.
Sample CodeUV IrradiationArtificial Solar Light
Degree of Adsorption (%)Degree of MB Decomposition after
90 min (%)
Degree of Adsorption (%)Degree of MB Decomposition after
300 min (%)
KRONOClean 70002.129.143.013.36
TiO22.938.781.111.02
TiO2/rGO-70062.29100.0053.3732.13
TiO2-70011.7886.489.247.11
Publisher’s Note: MDPI stays neutral with regard to jurisdictional claims in published maps and institutional affiliations.

