New Phosphorous-Based [FeFe]-Hydrogenase Models


Abstract
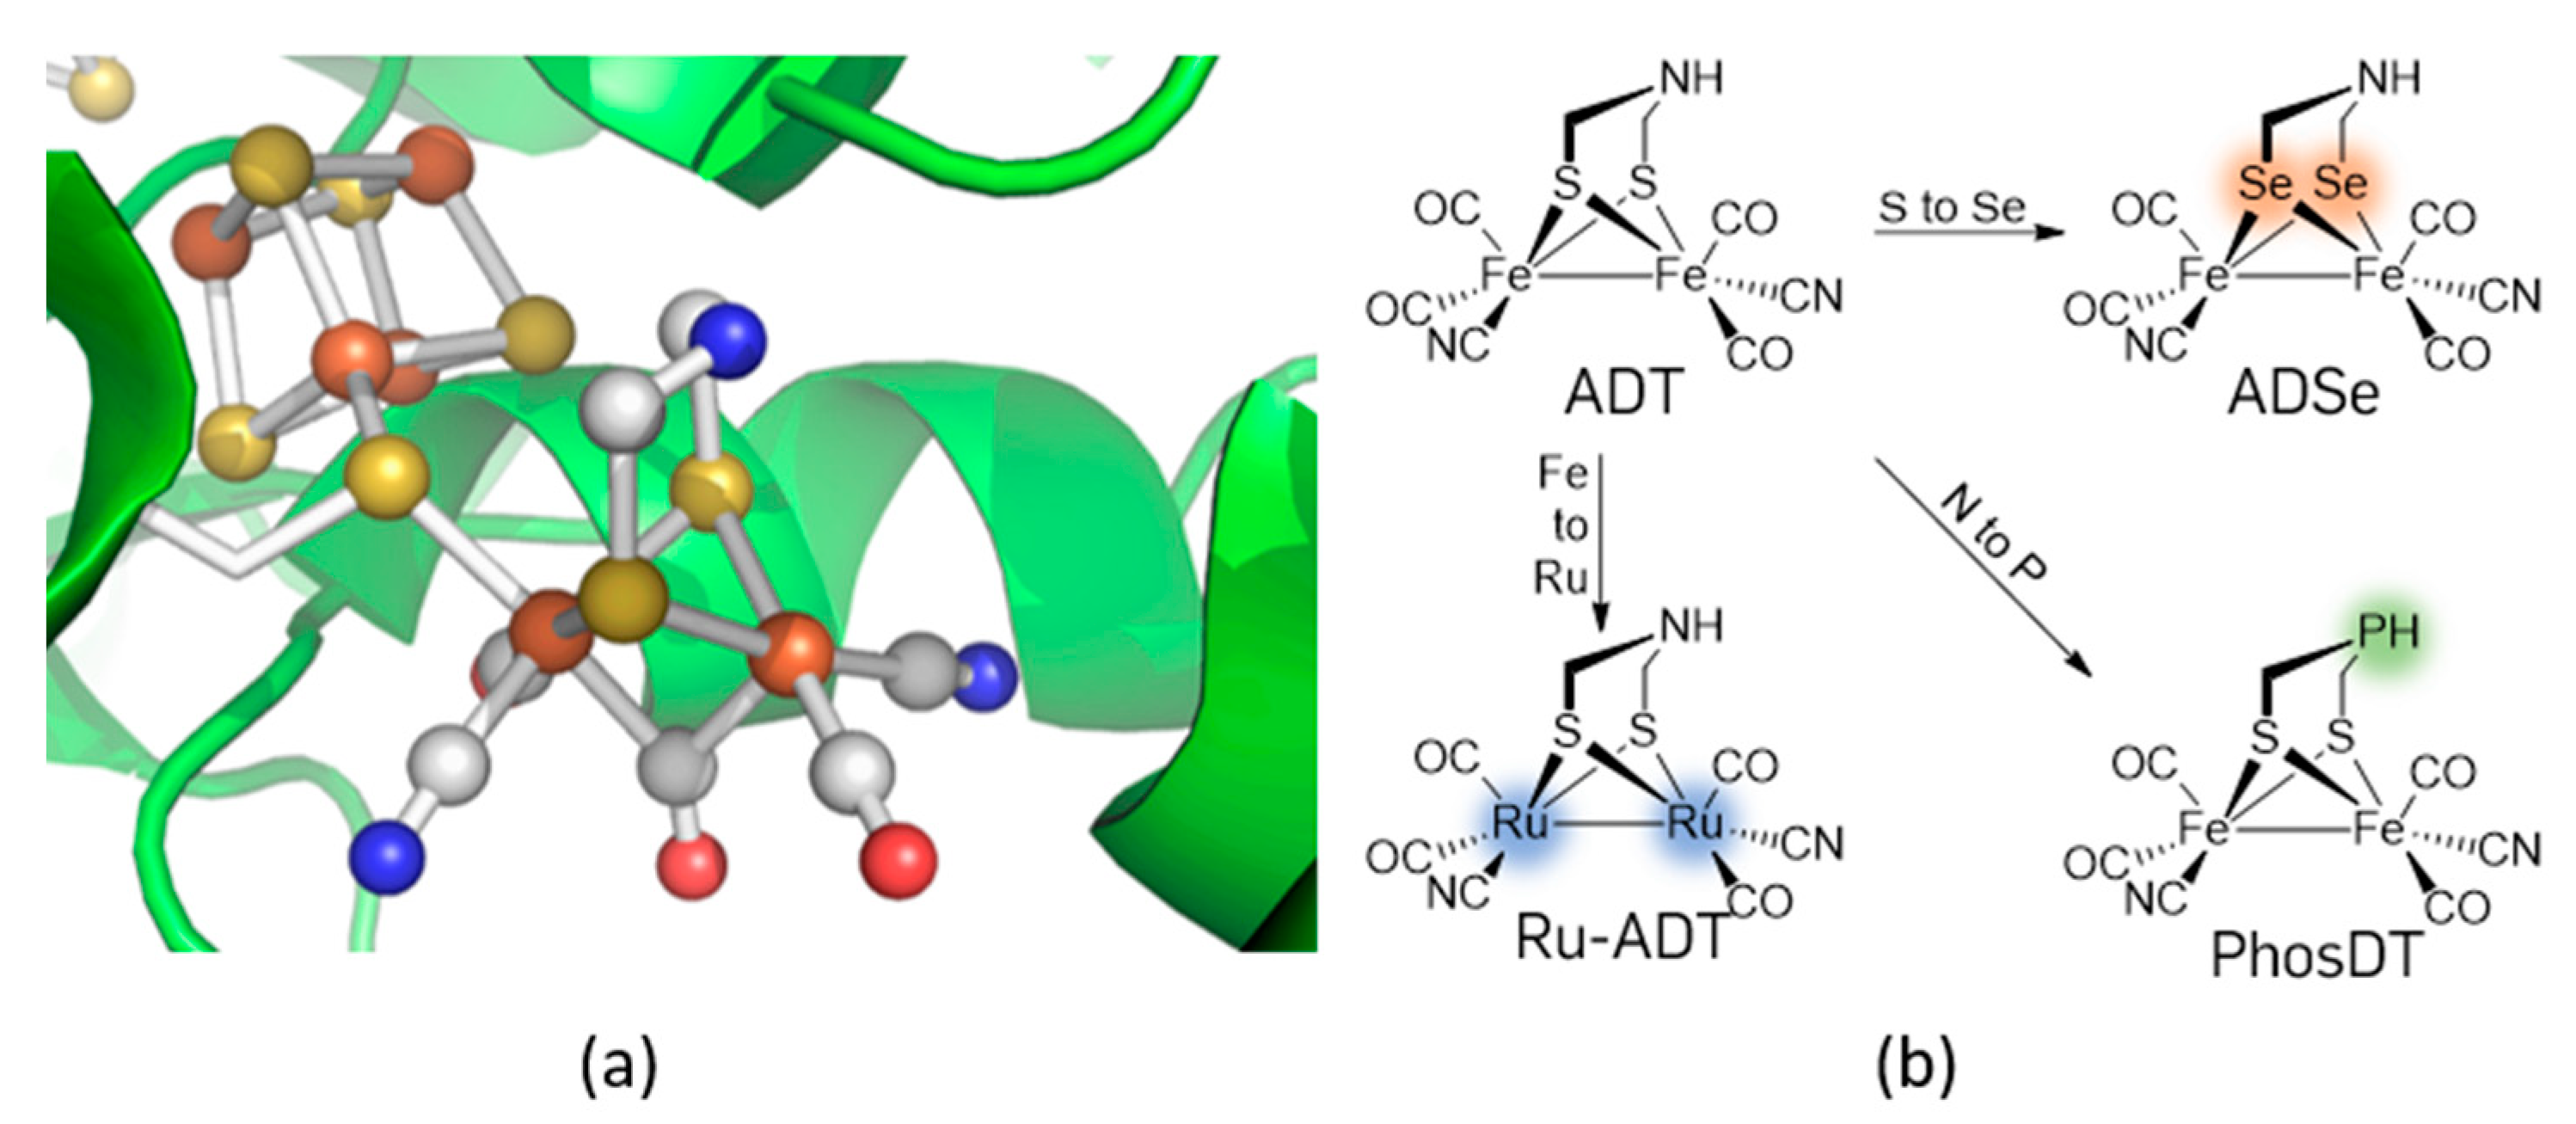
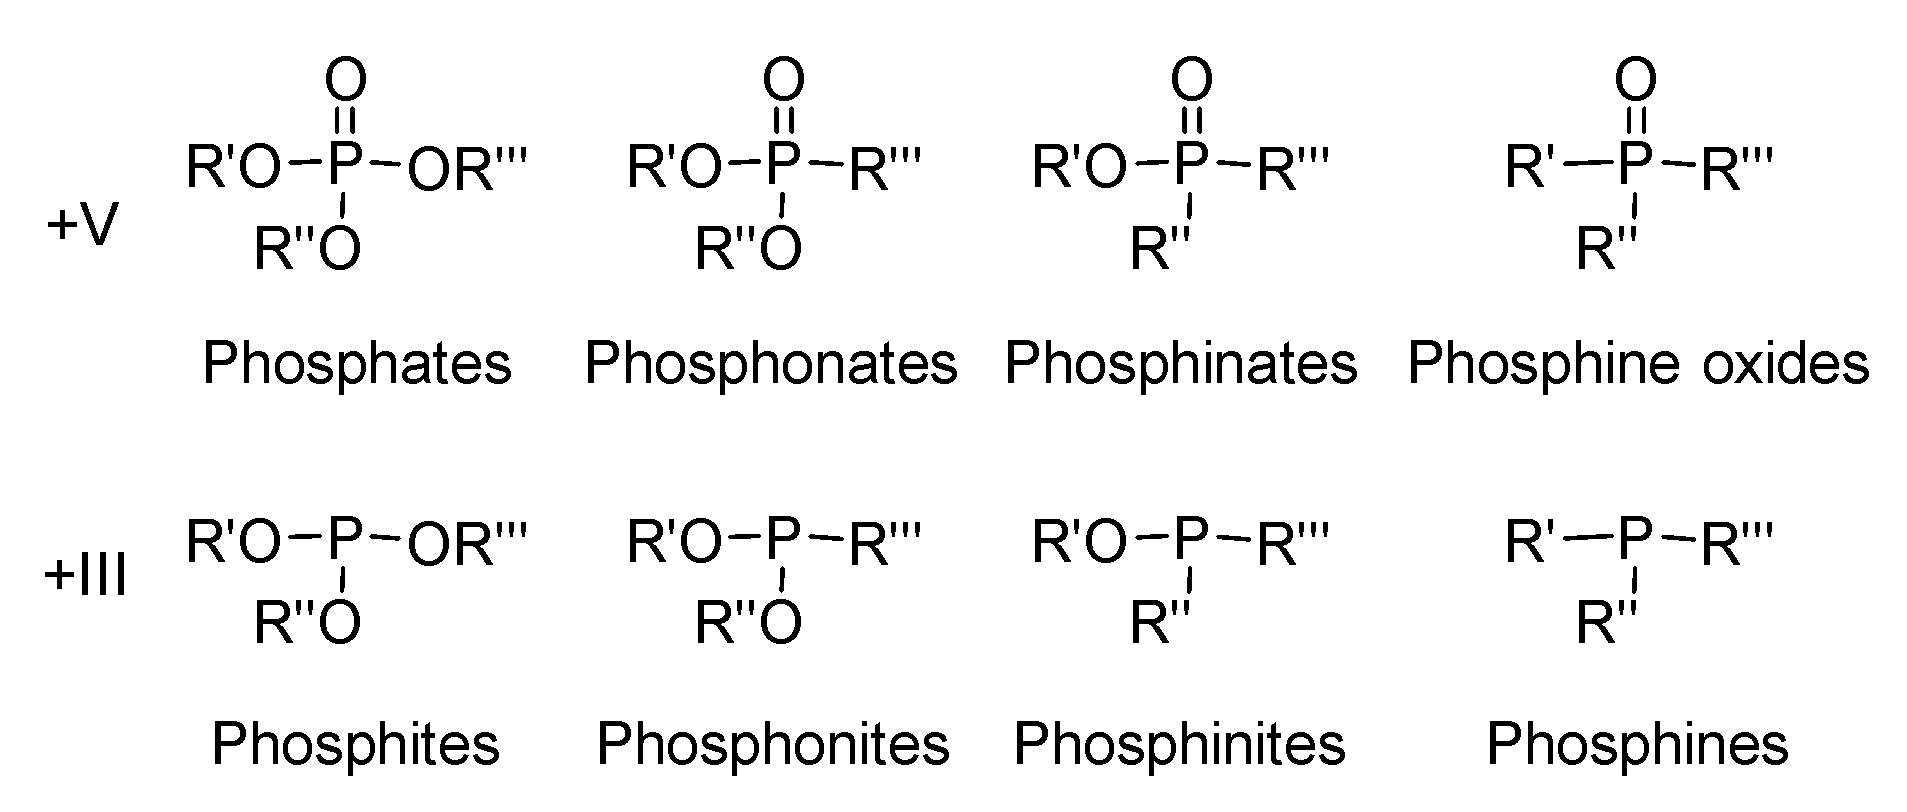
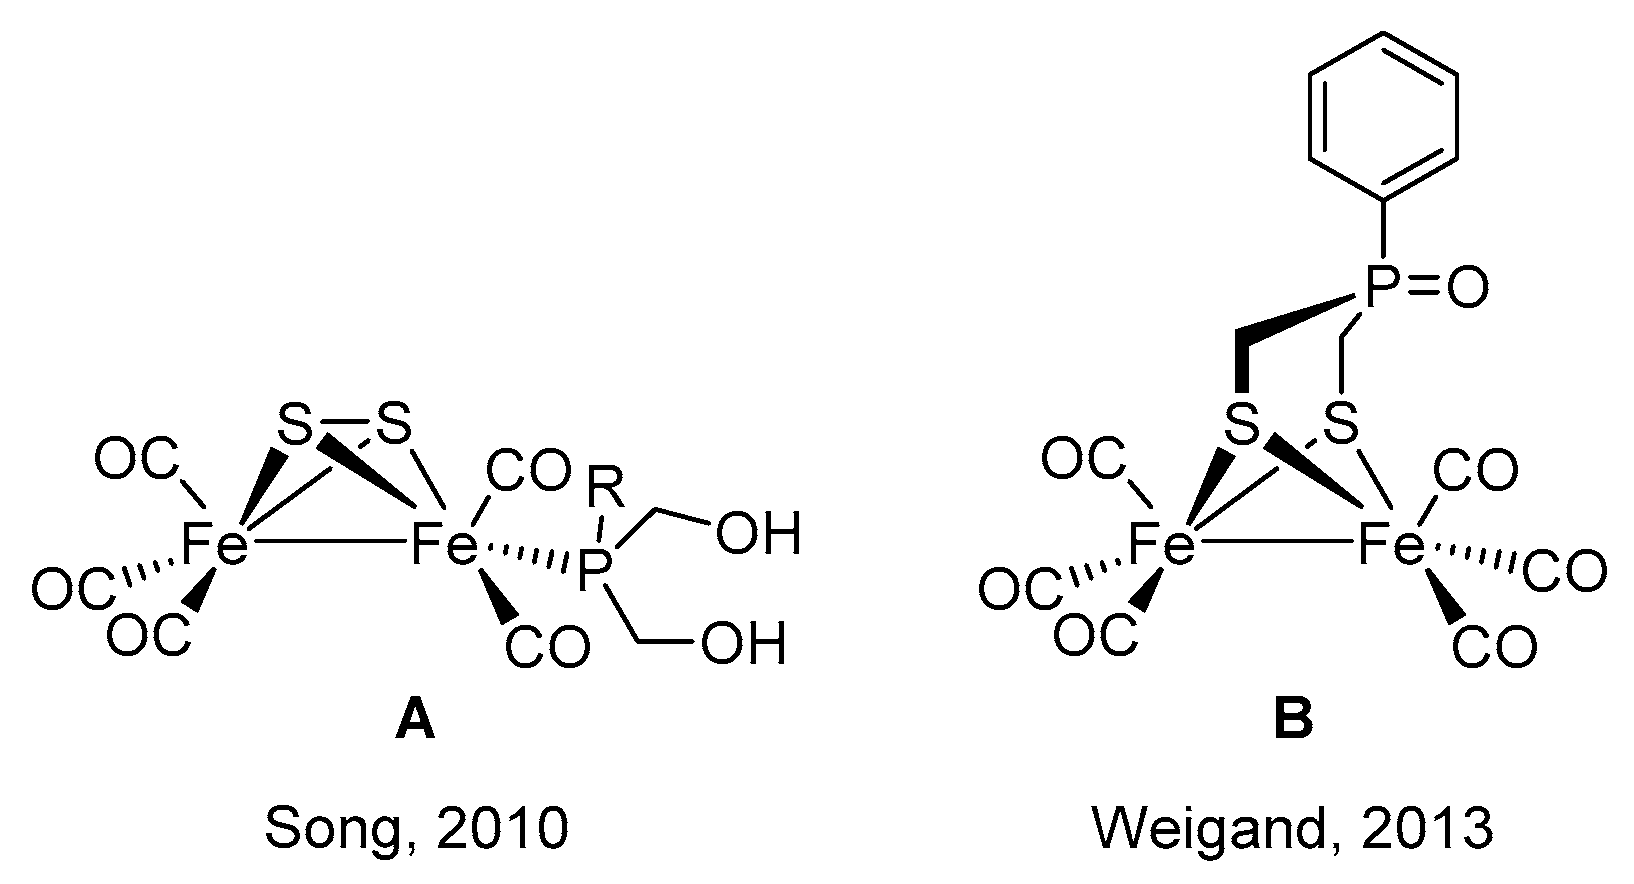
:1. Introduction
2. Results
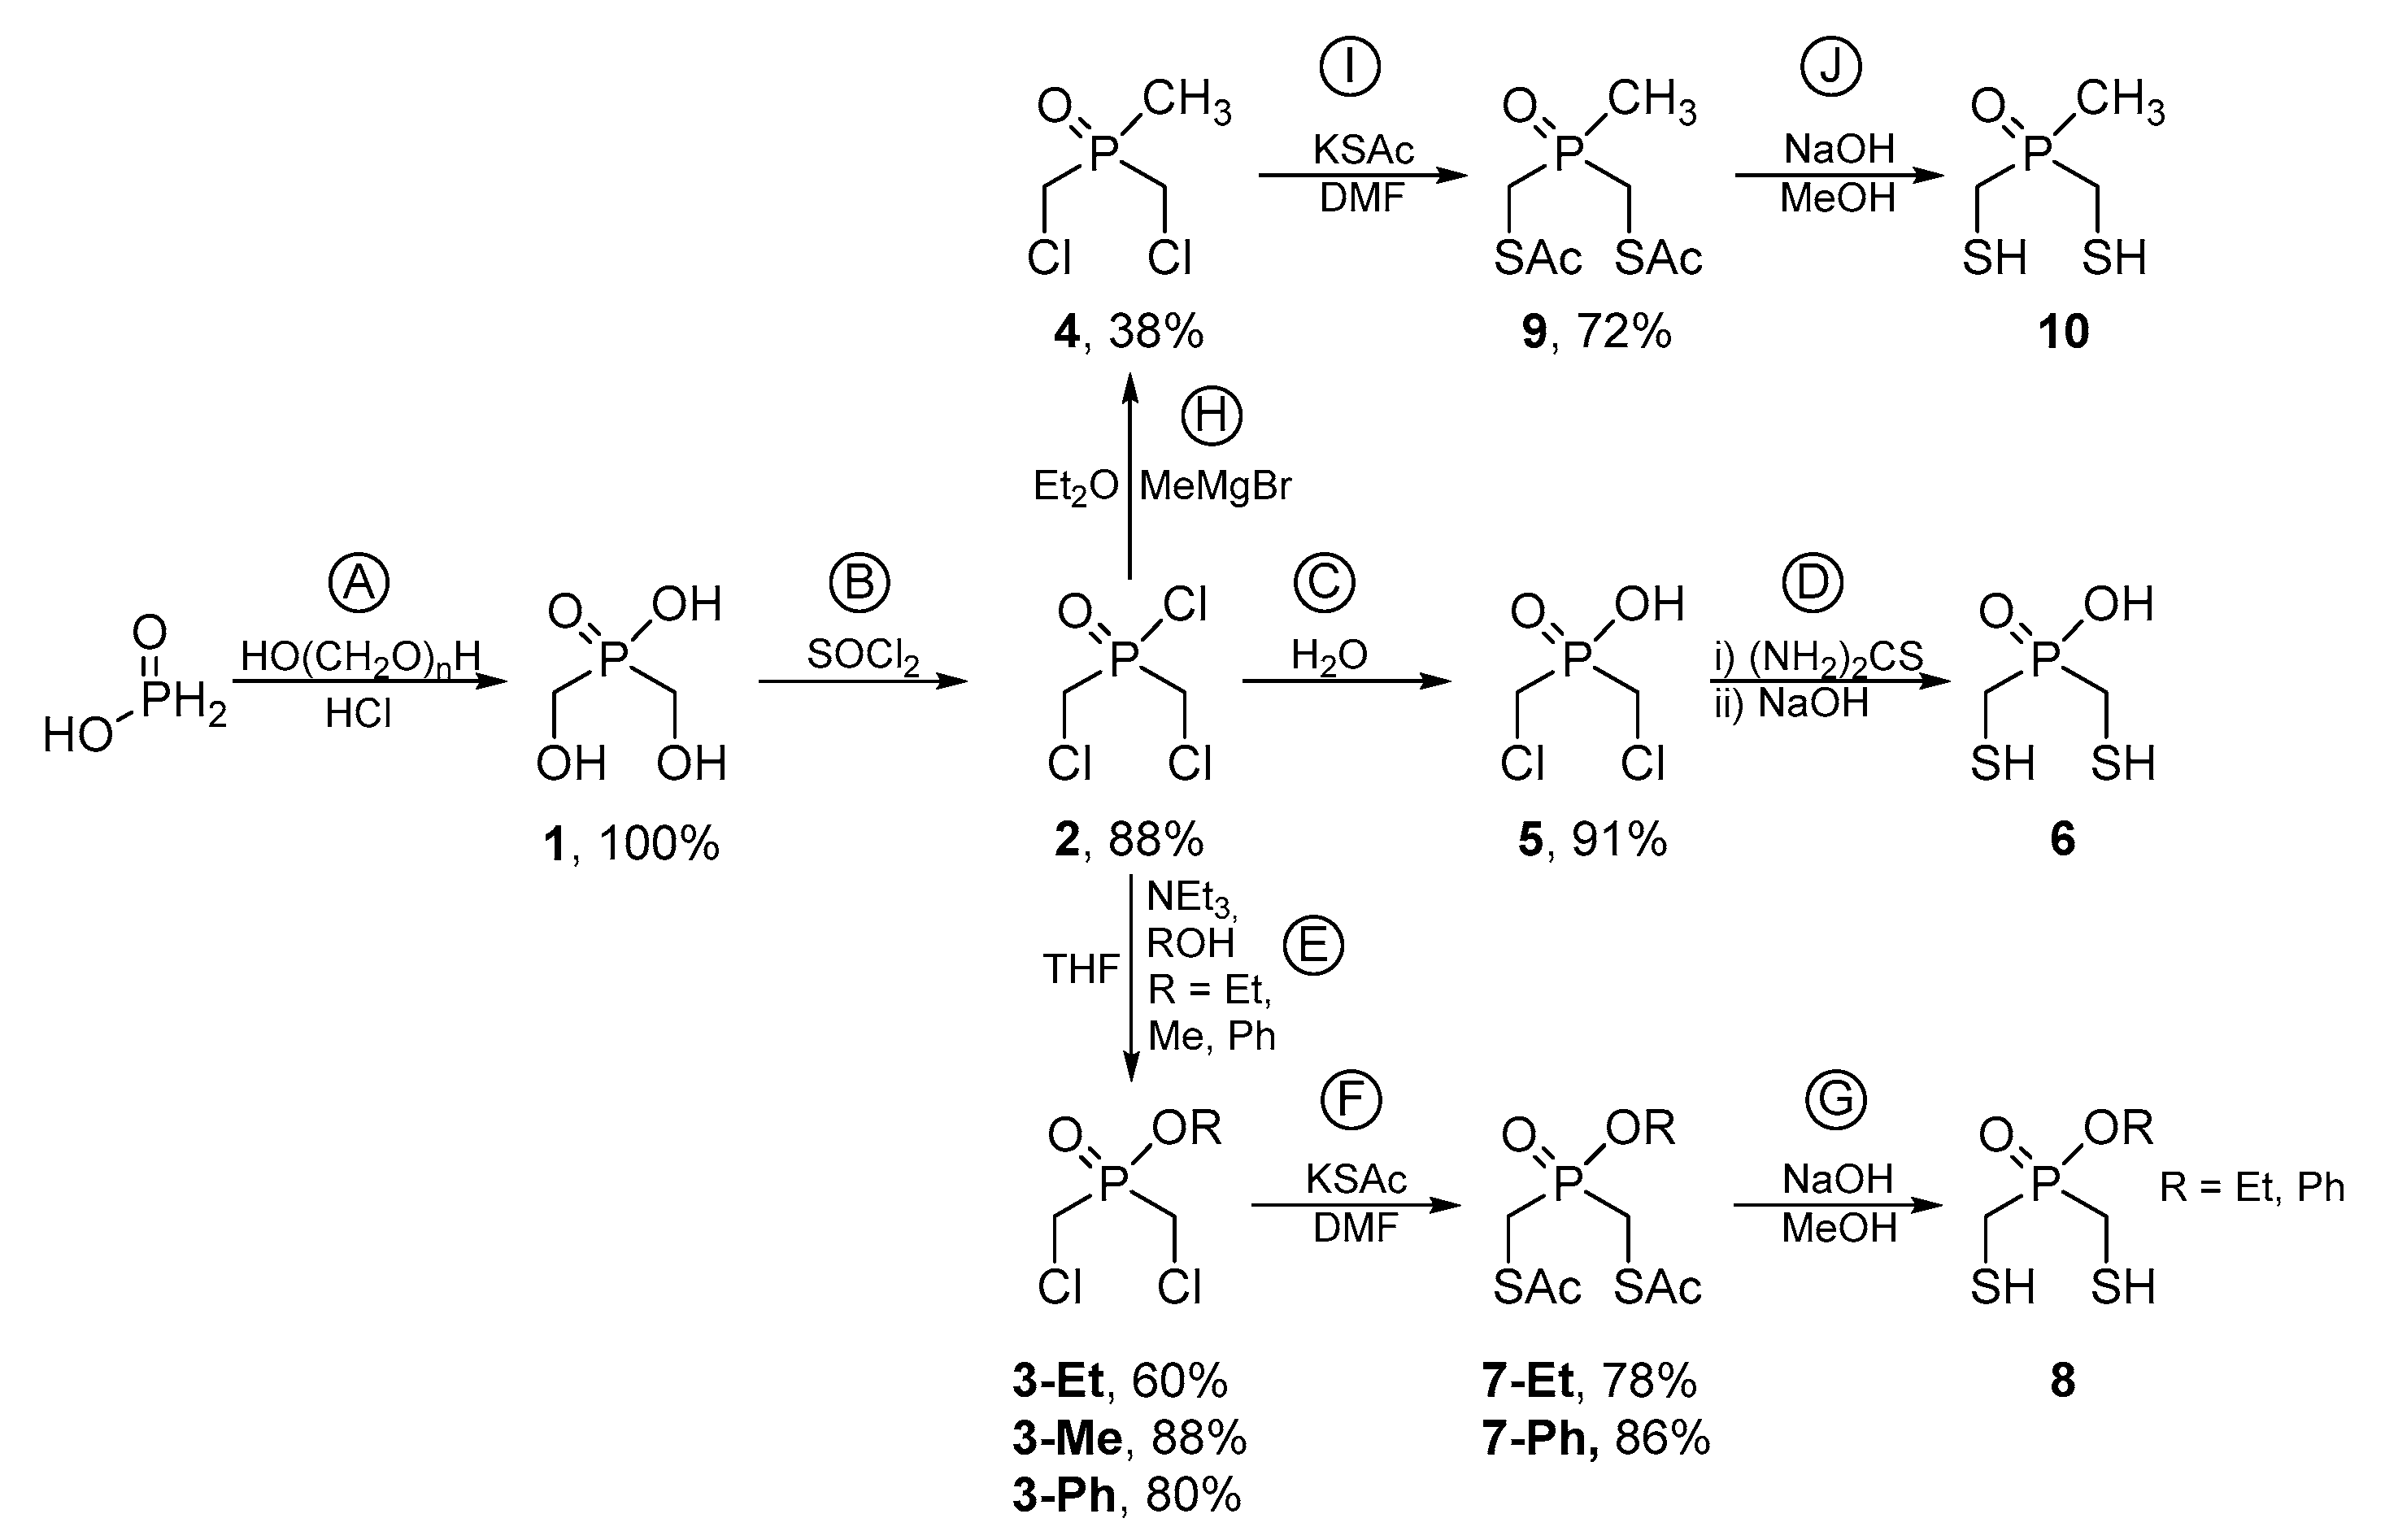
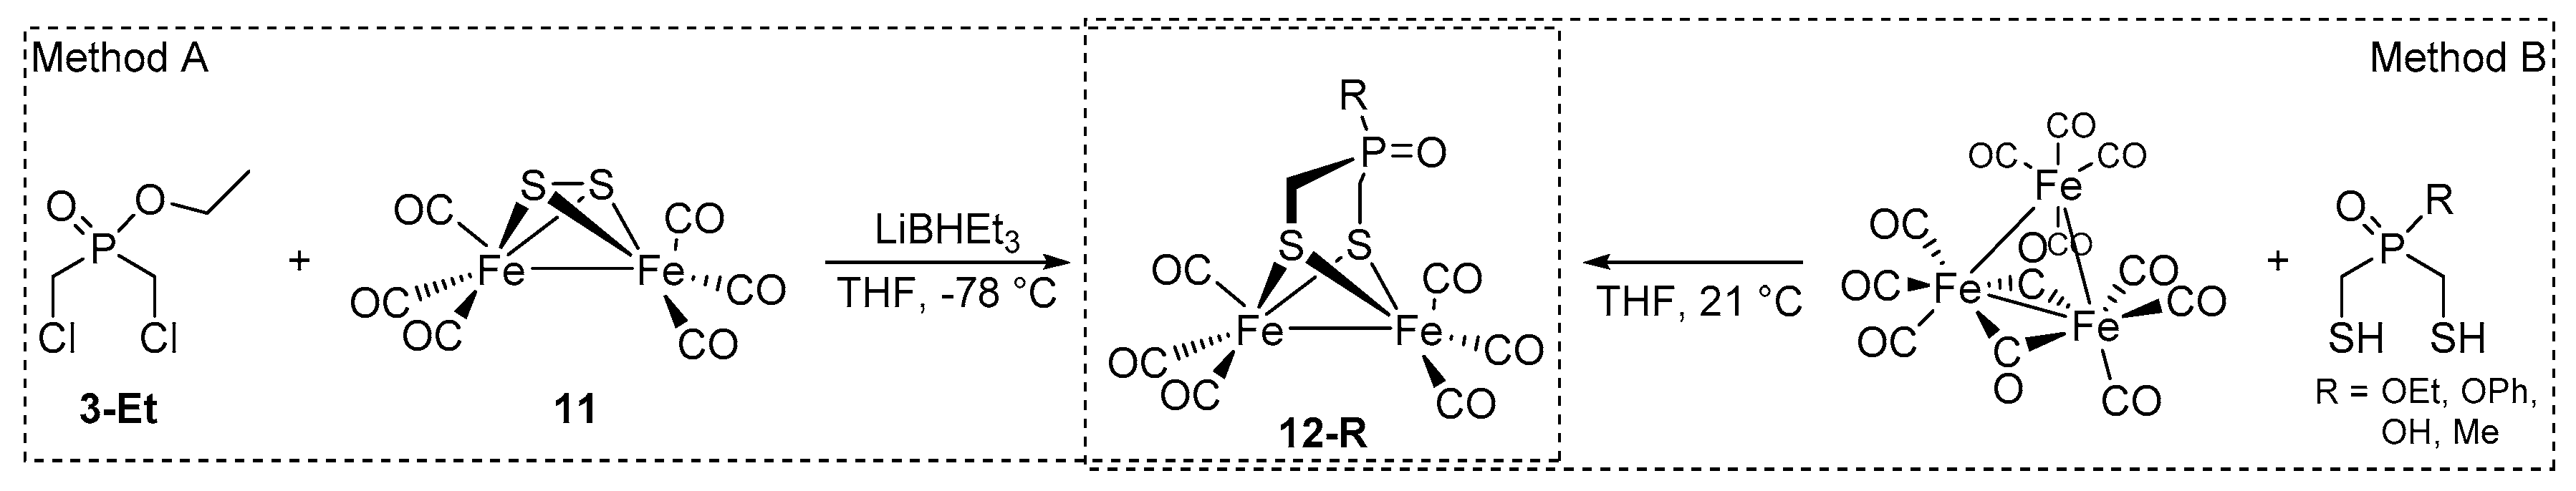
2.1. Synthesis of Phosphinates and Phosphine Oxides as Well as the Iron Carbonyl Complexes Thereof
2.2. Spectroscopic Properties of Compounds 12-R
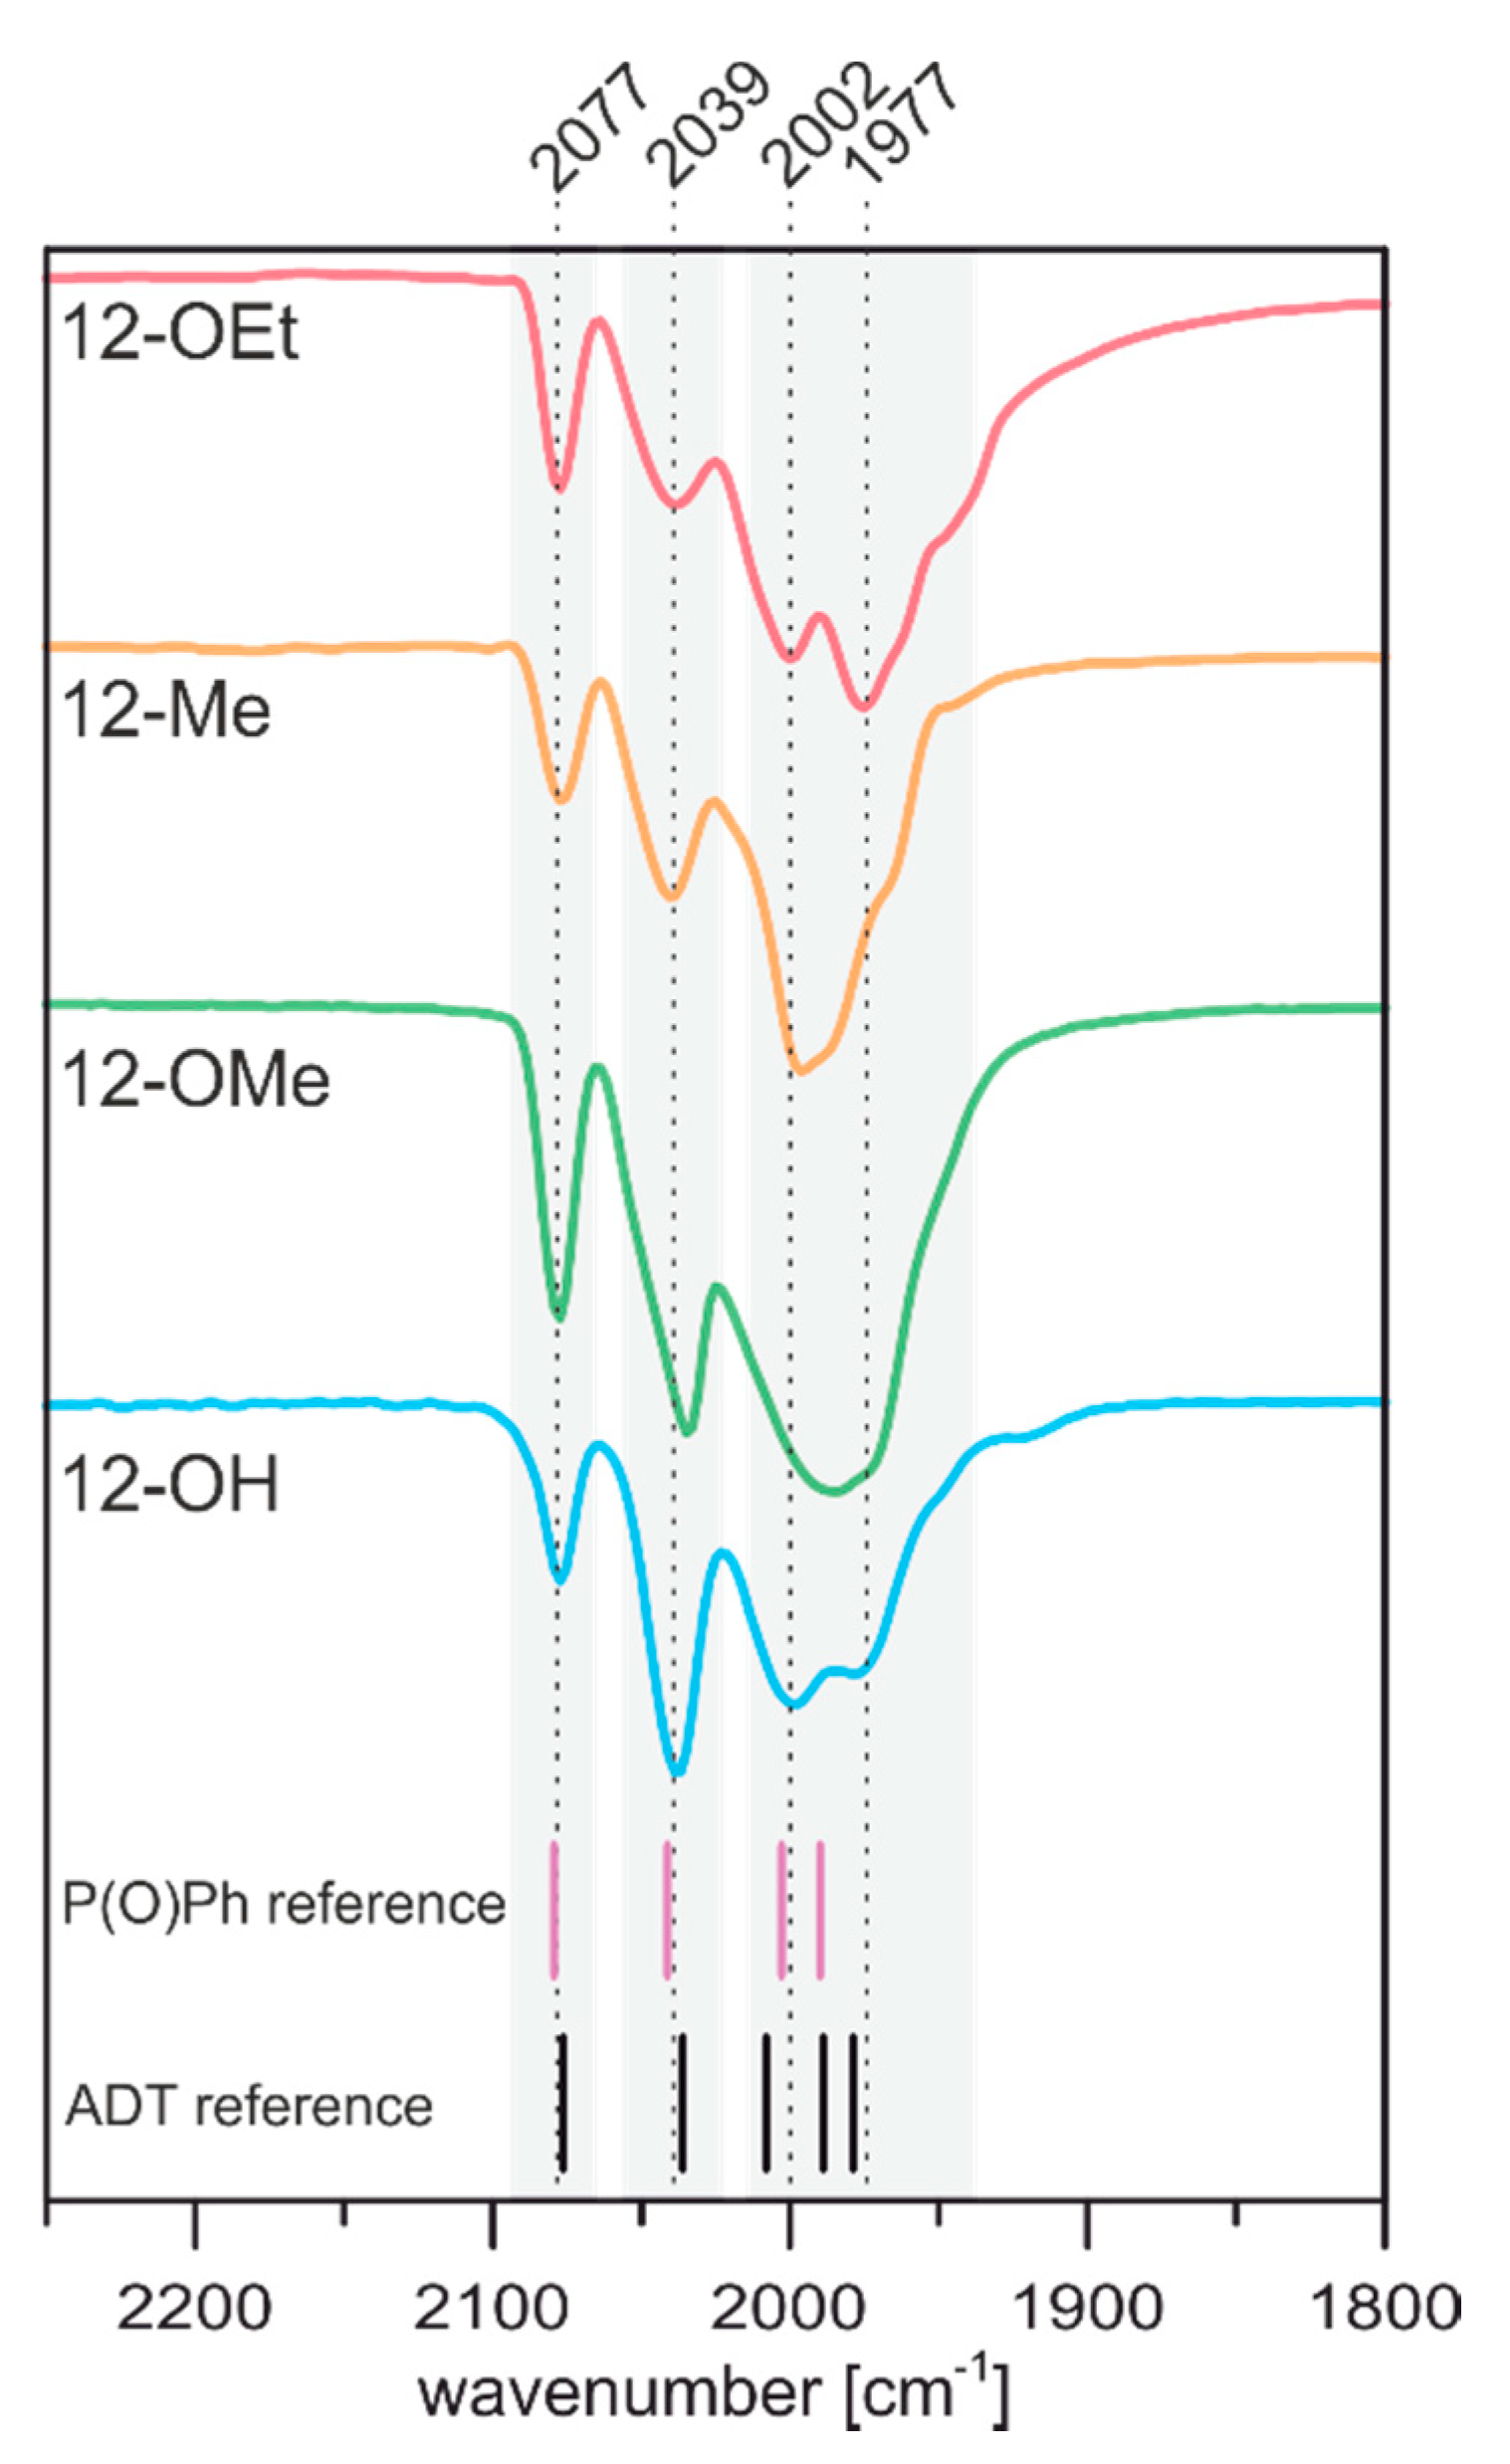
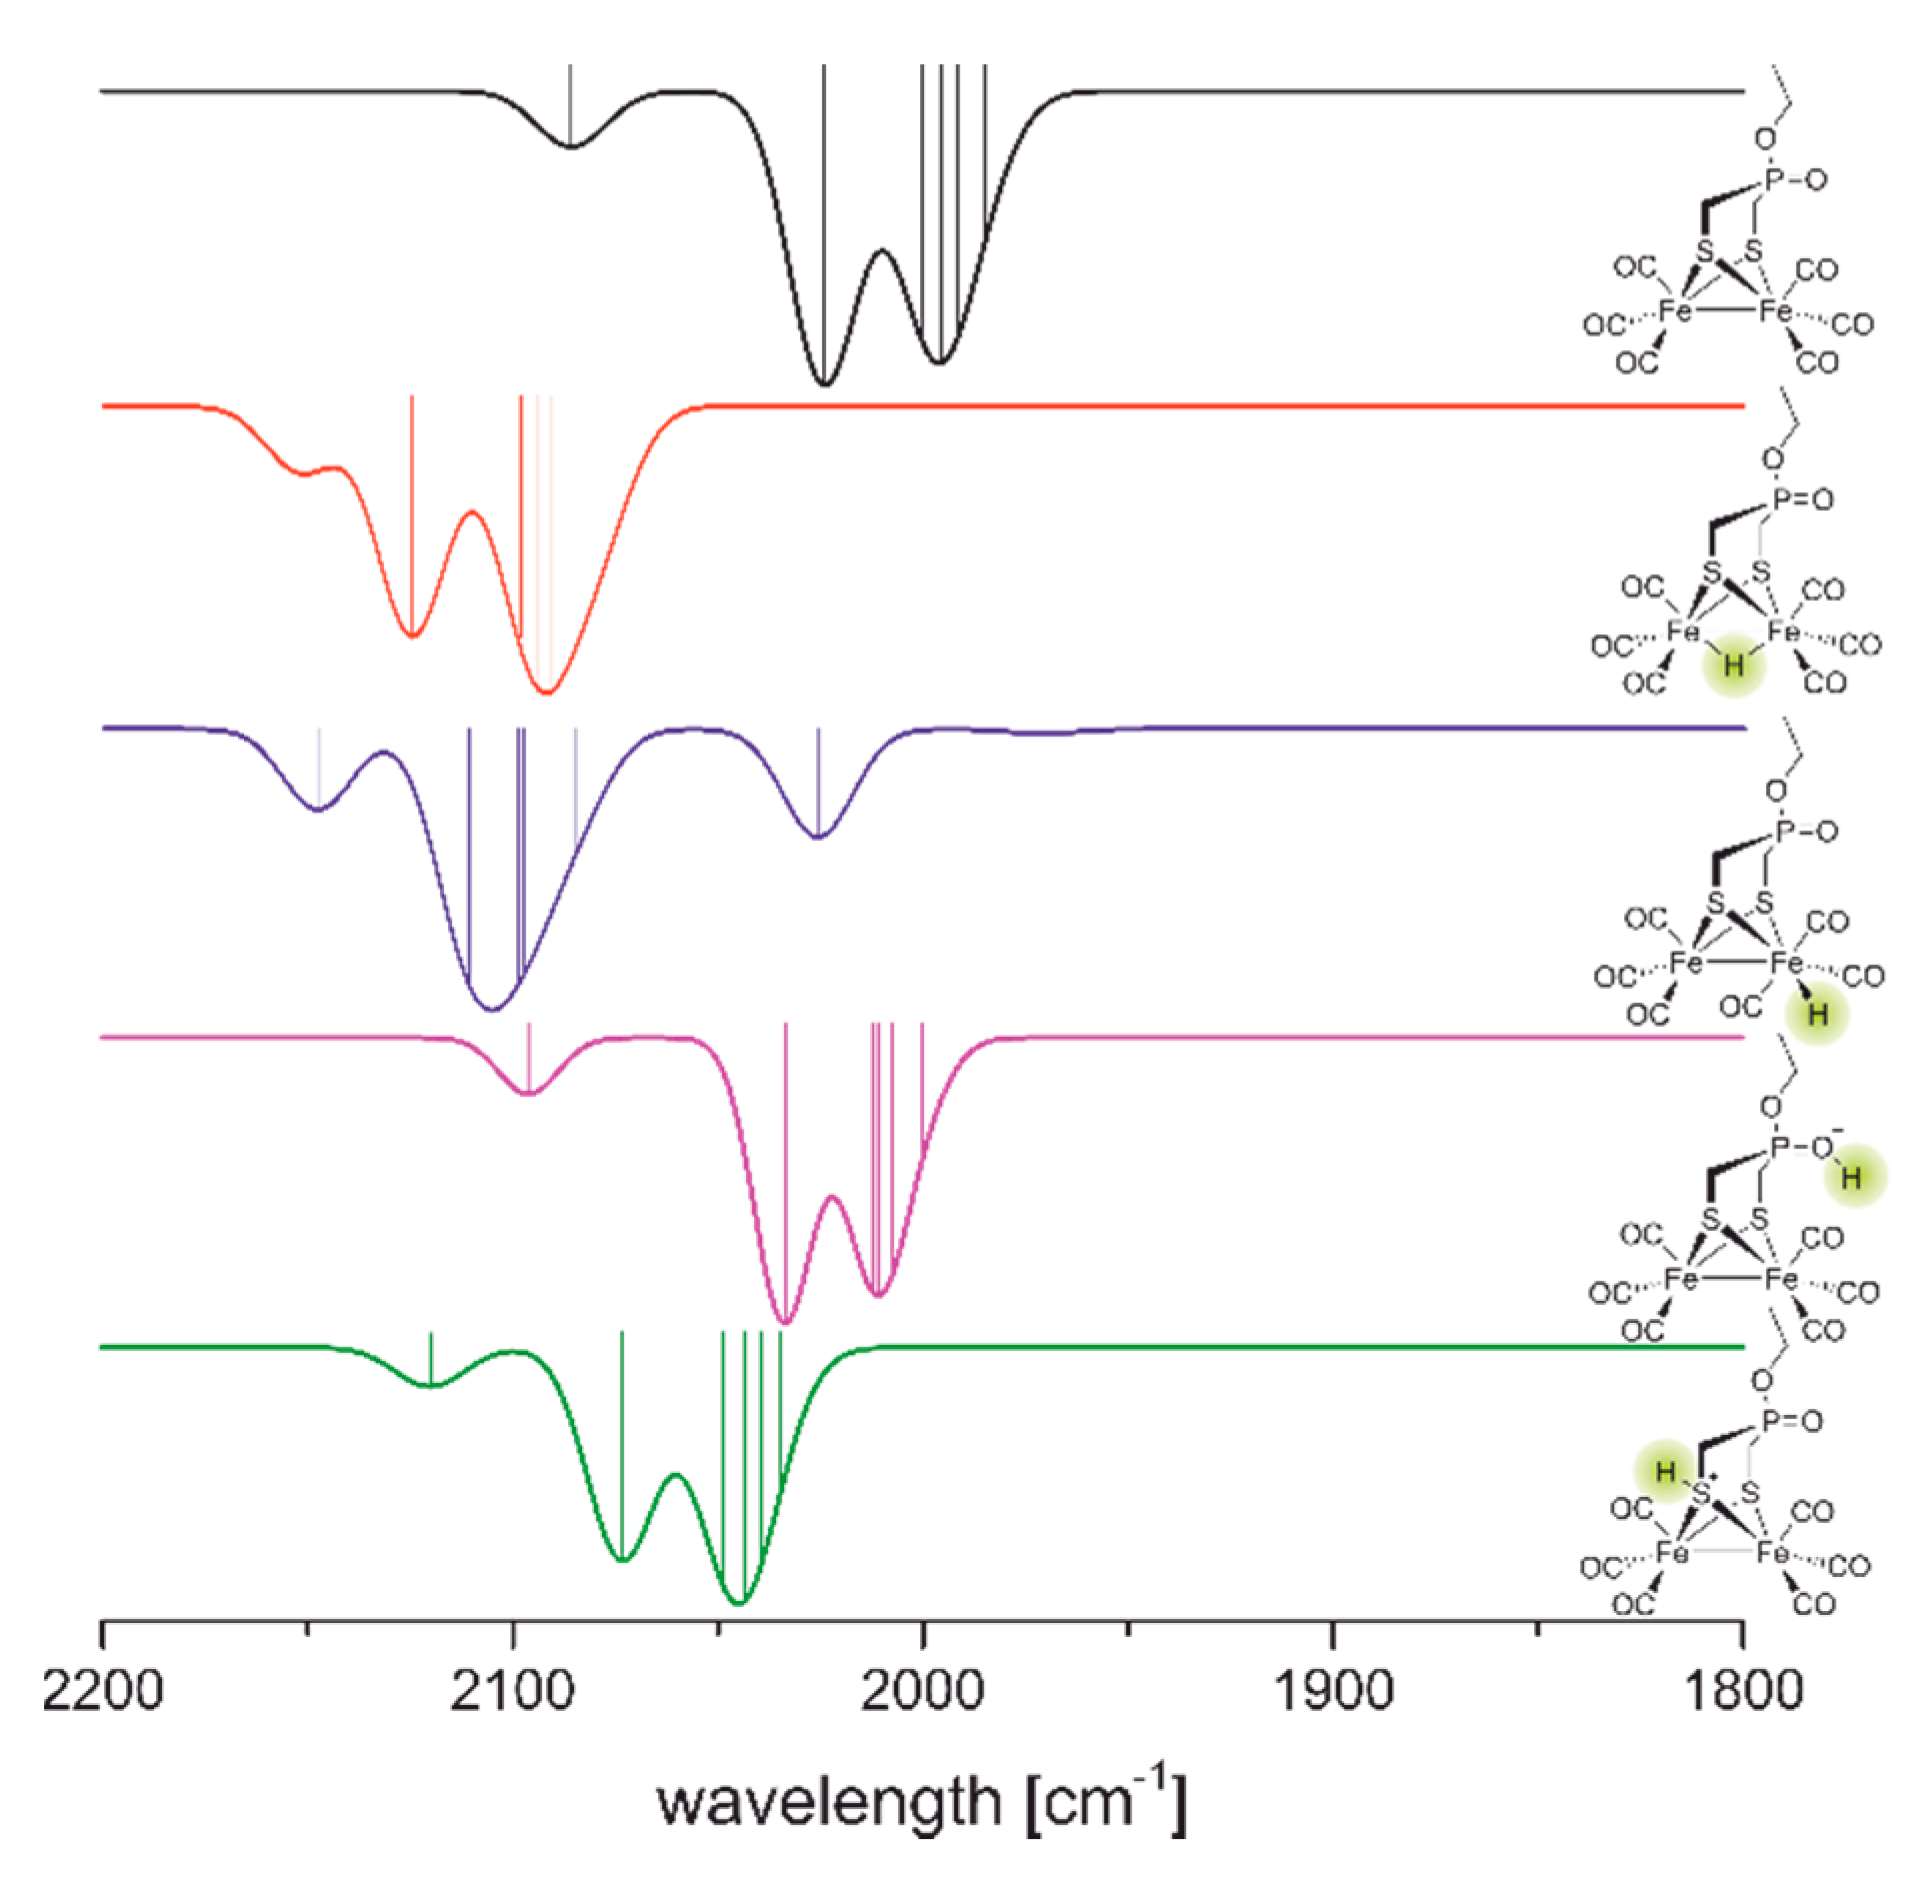
2.2.1. Infrared Spectroscopy
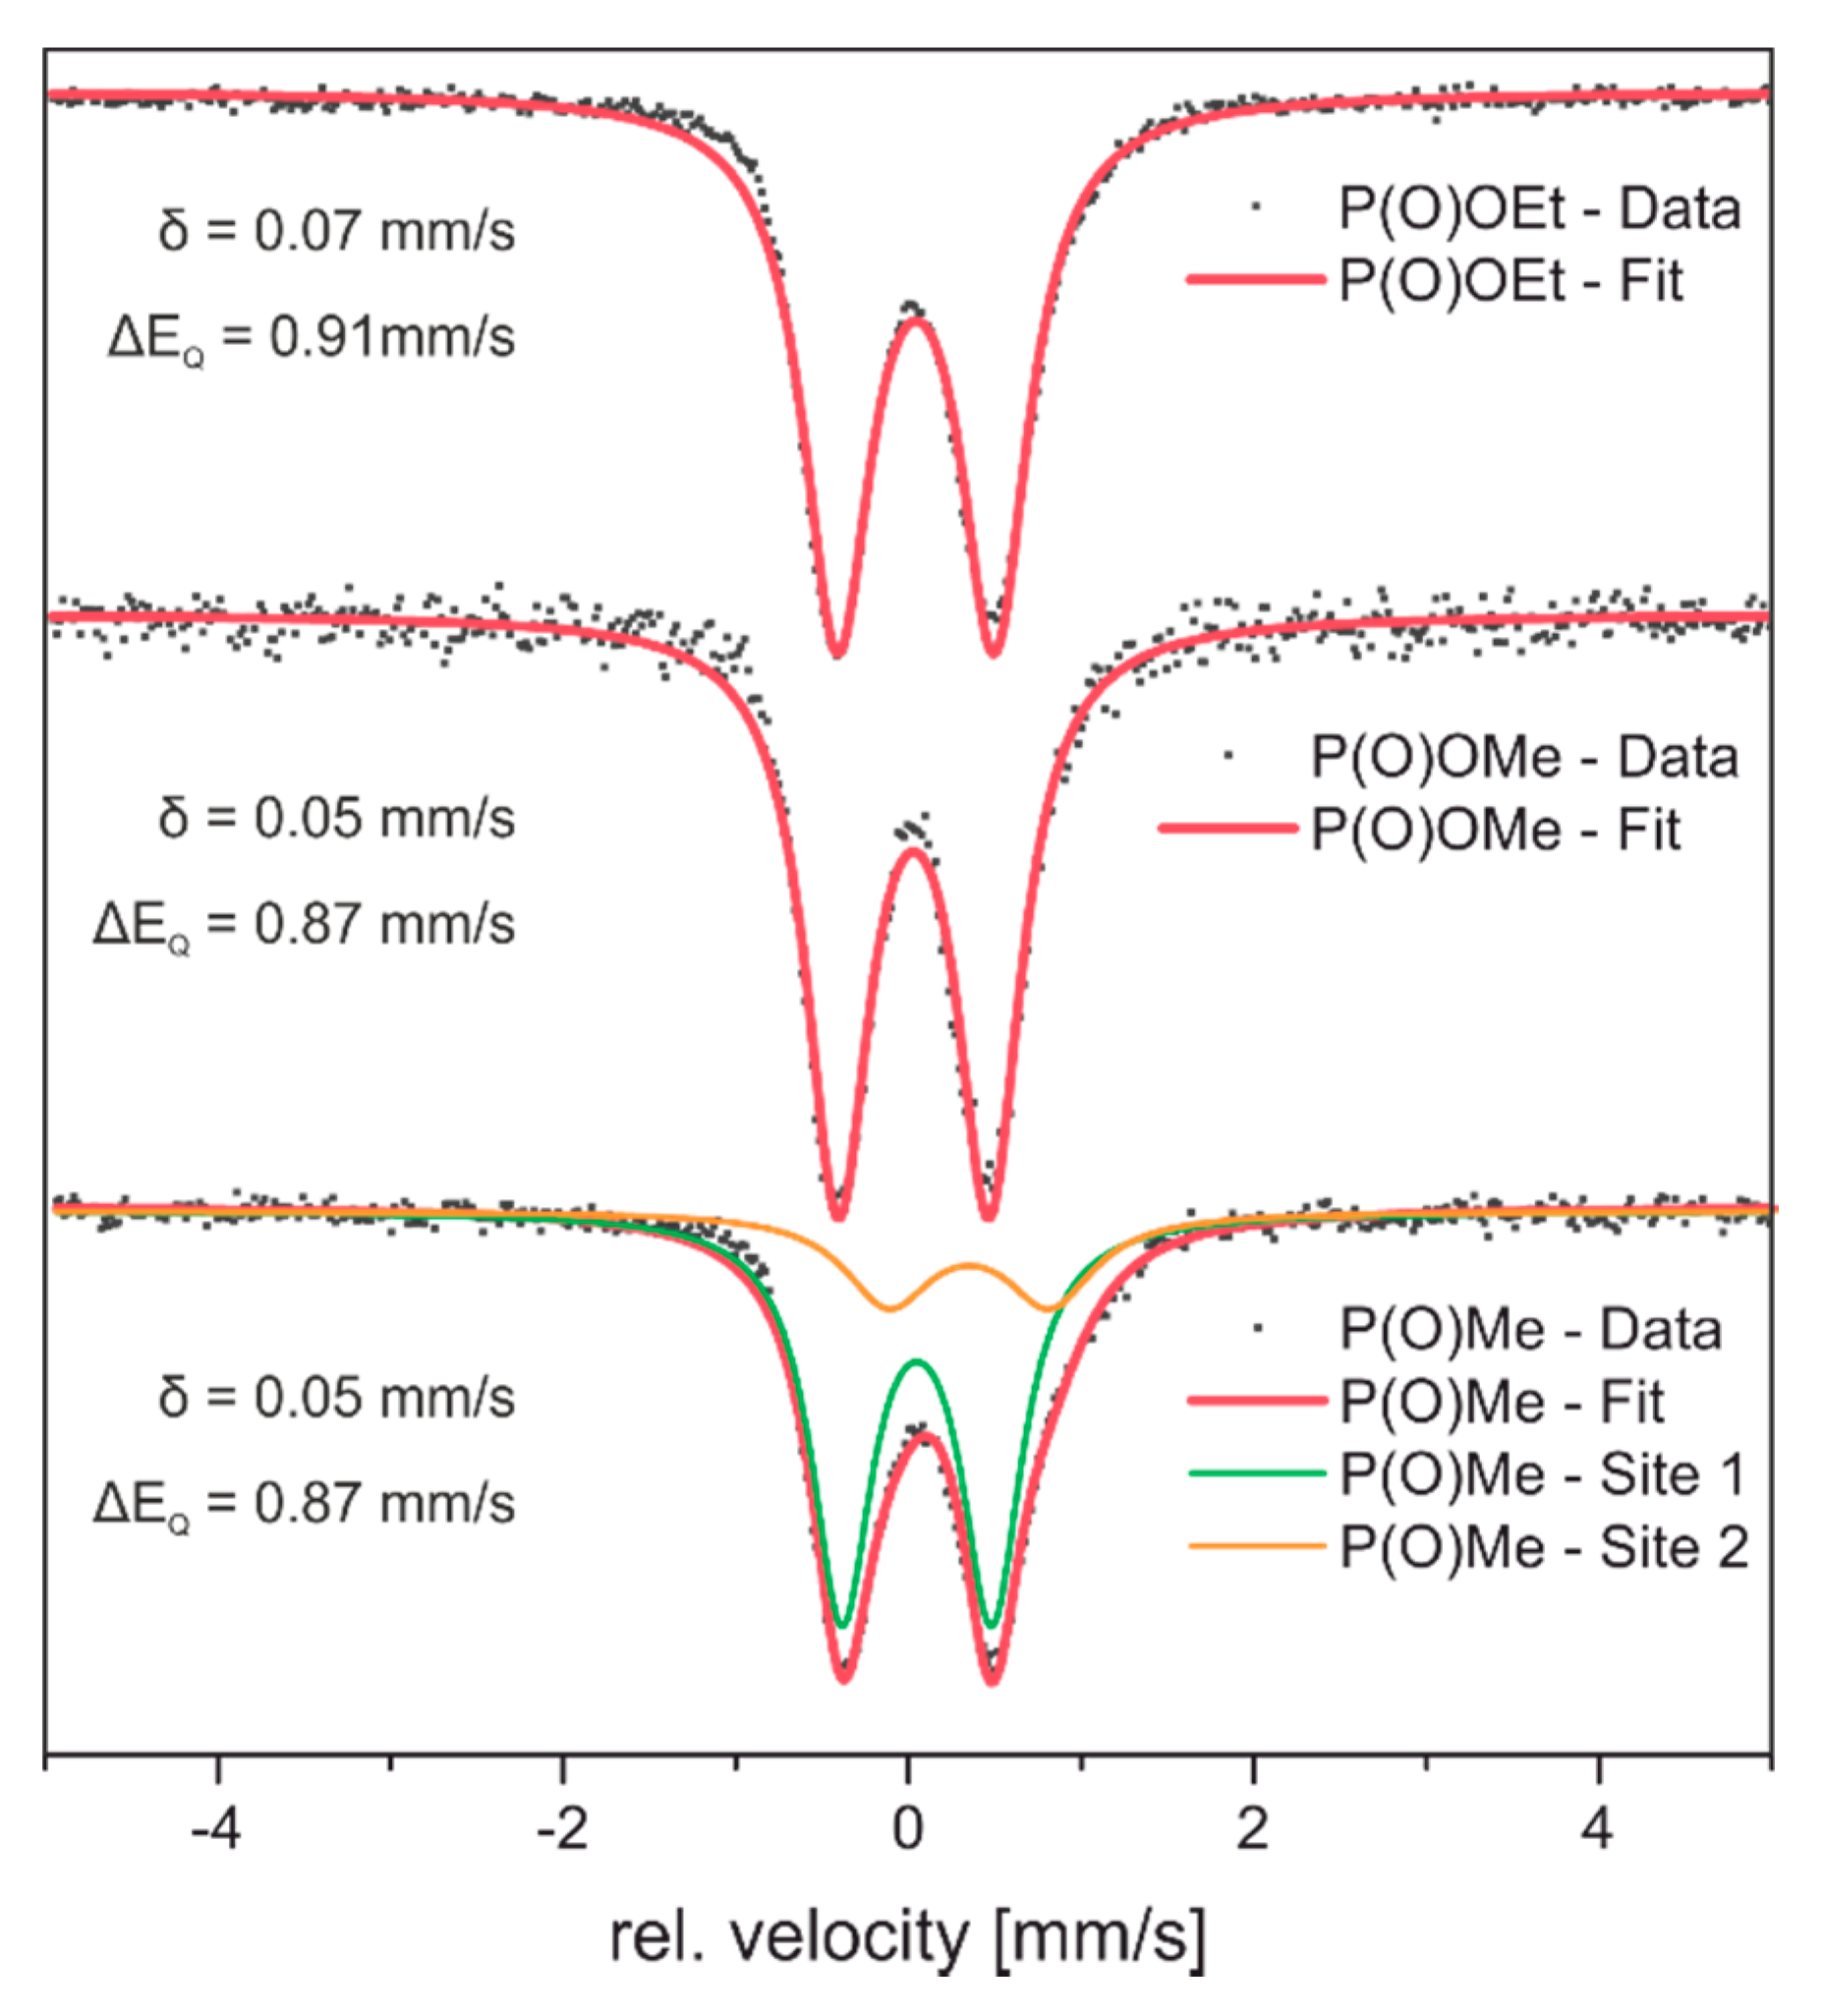
2.2.2. Mössbauer Spectroscopy
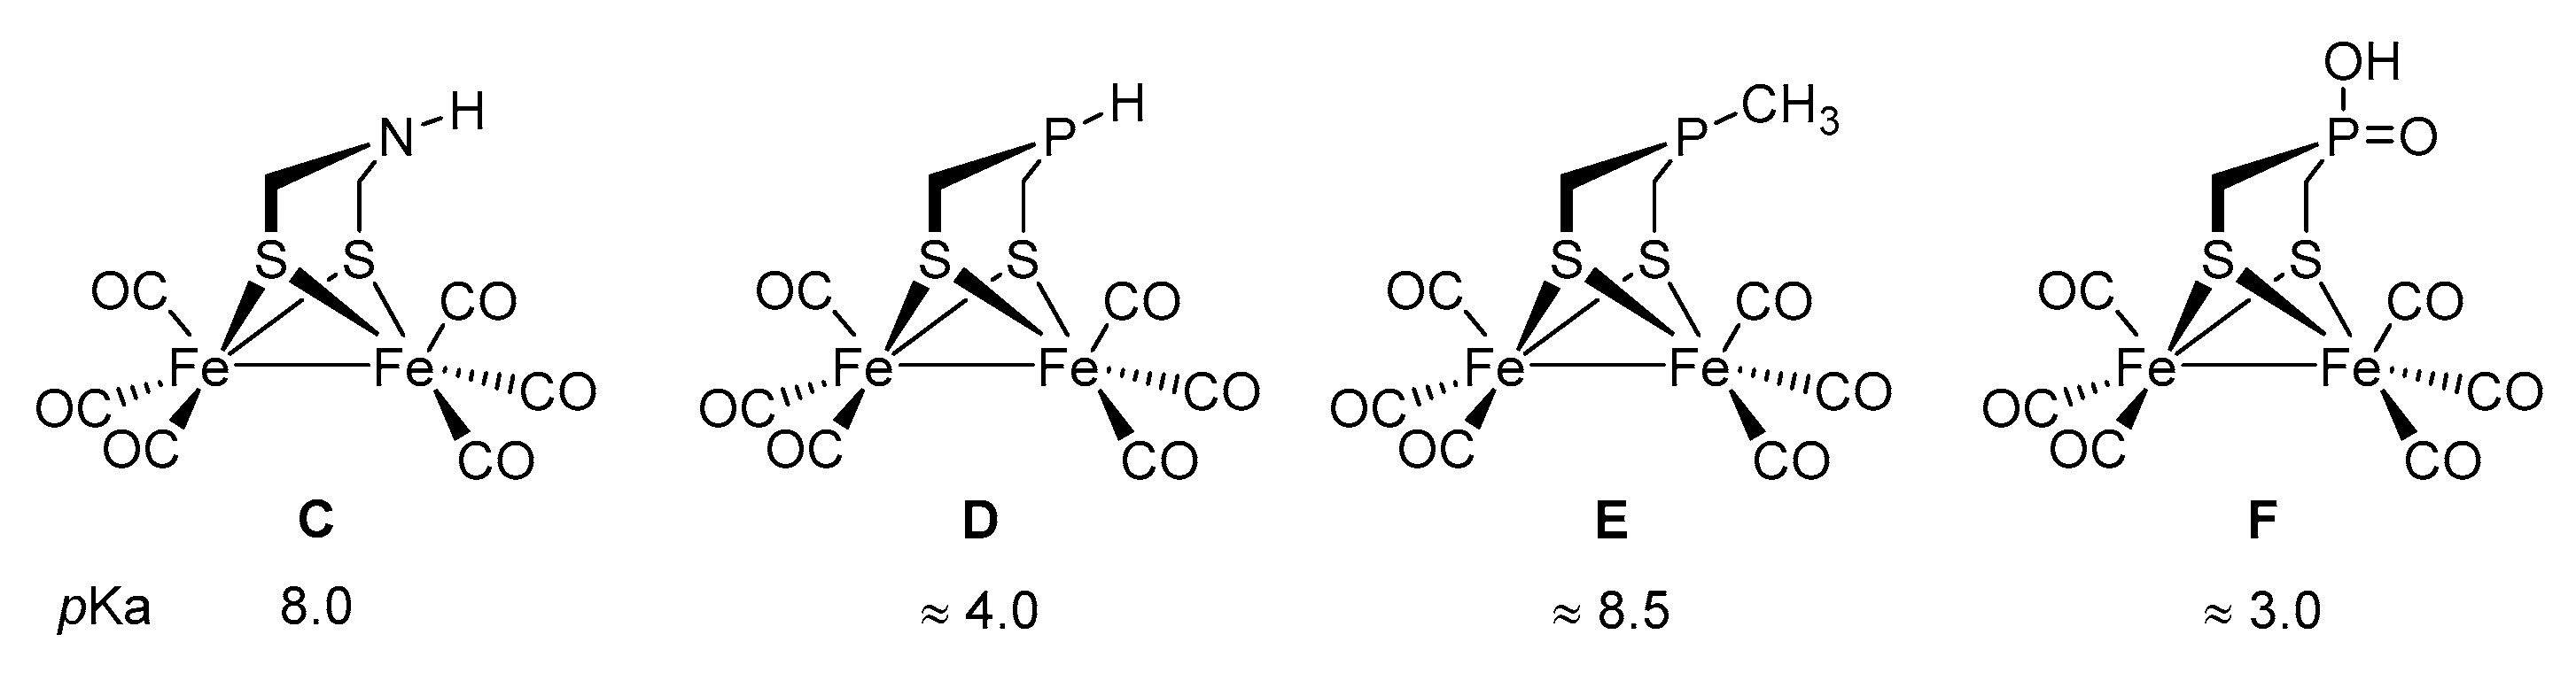
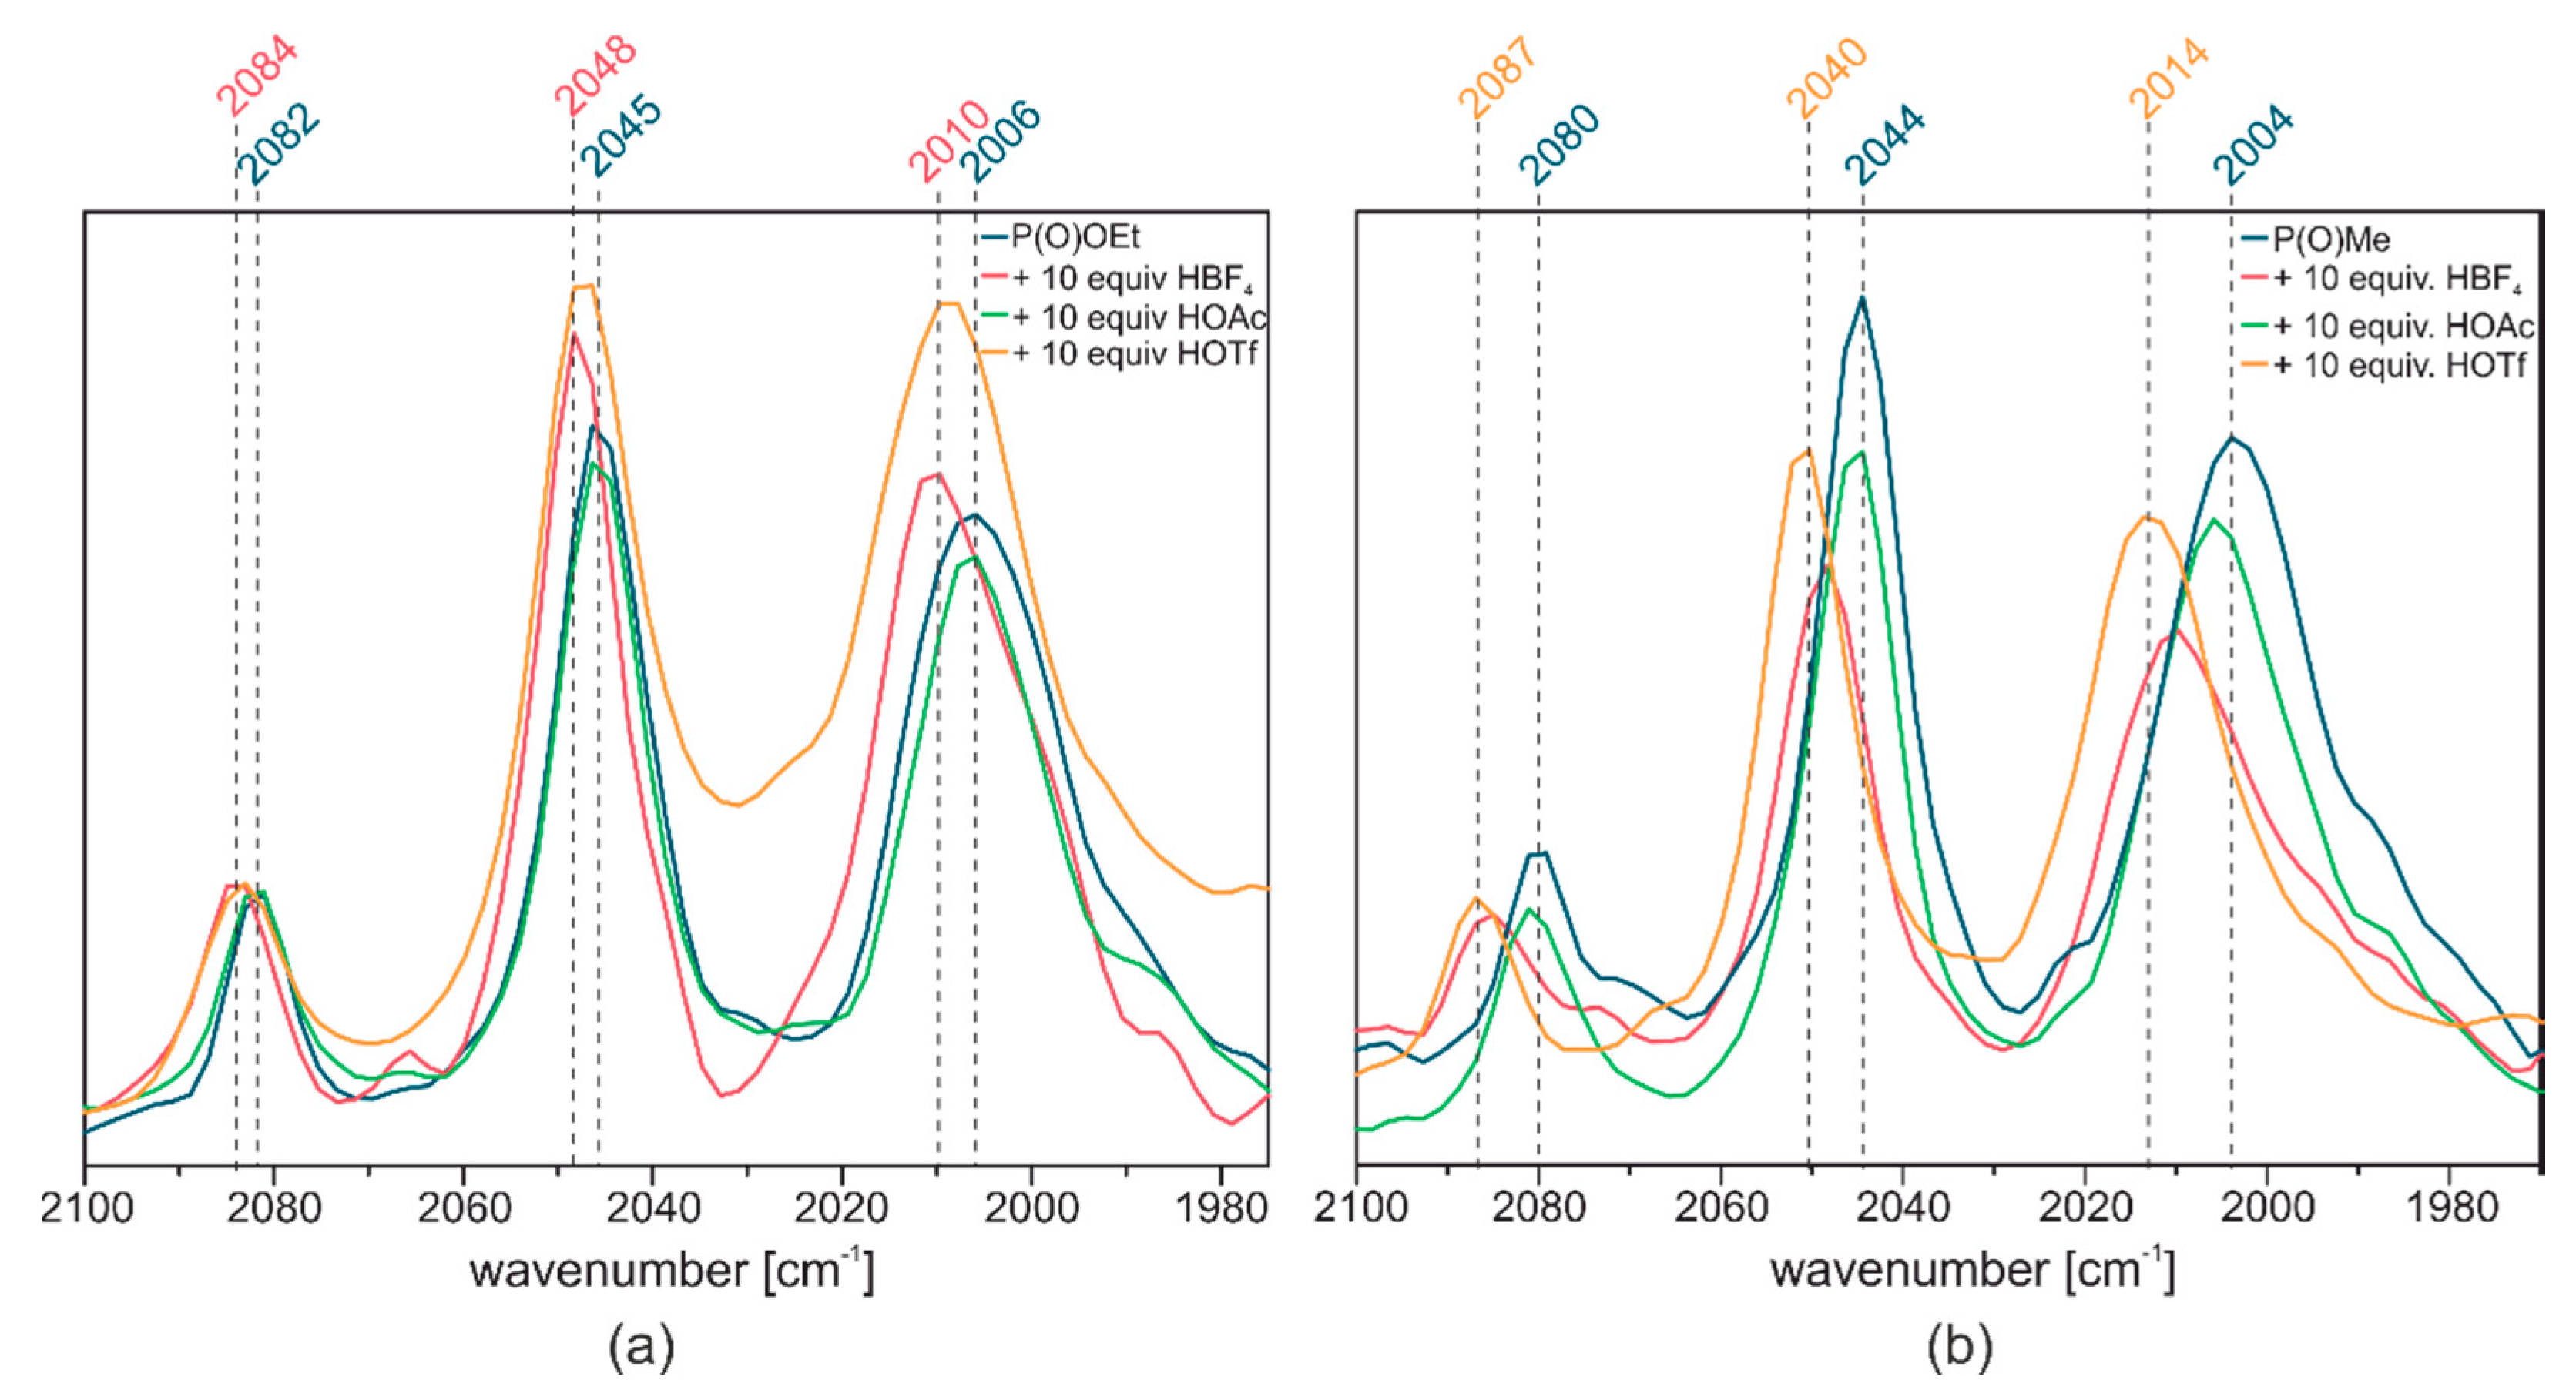
2.3. Reactivity towards Acids
2.4. DFT Calculations on the Protonation of [FeFe]-hydrogenase Model Compounds
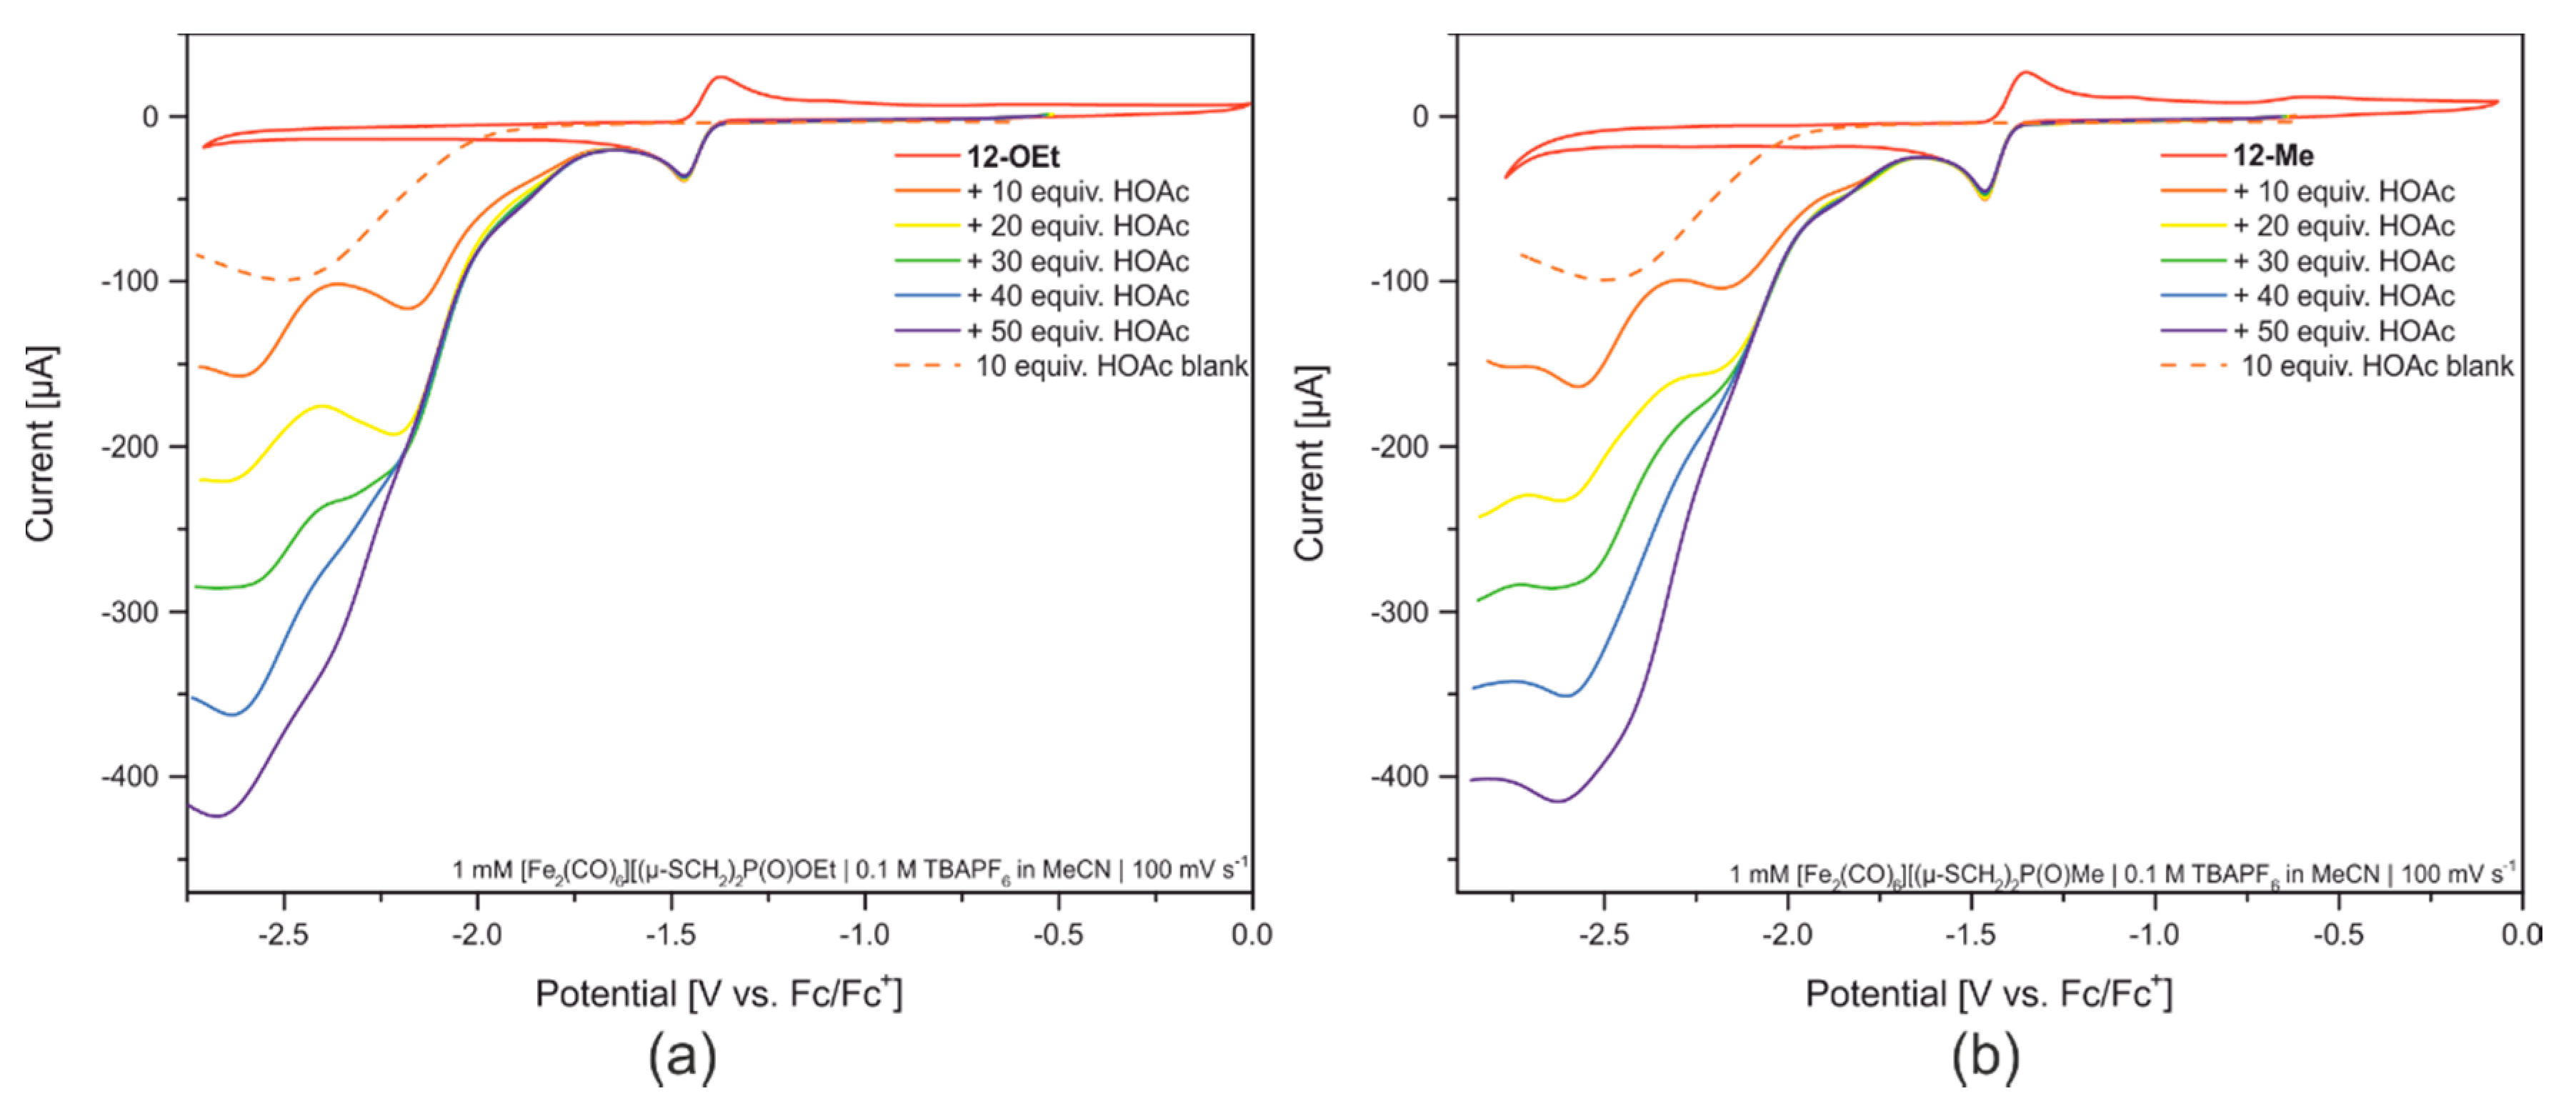
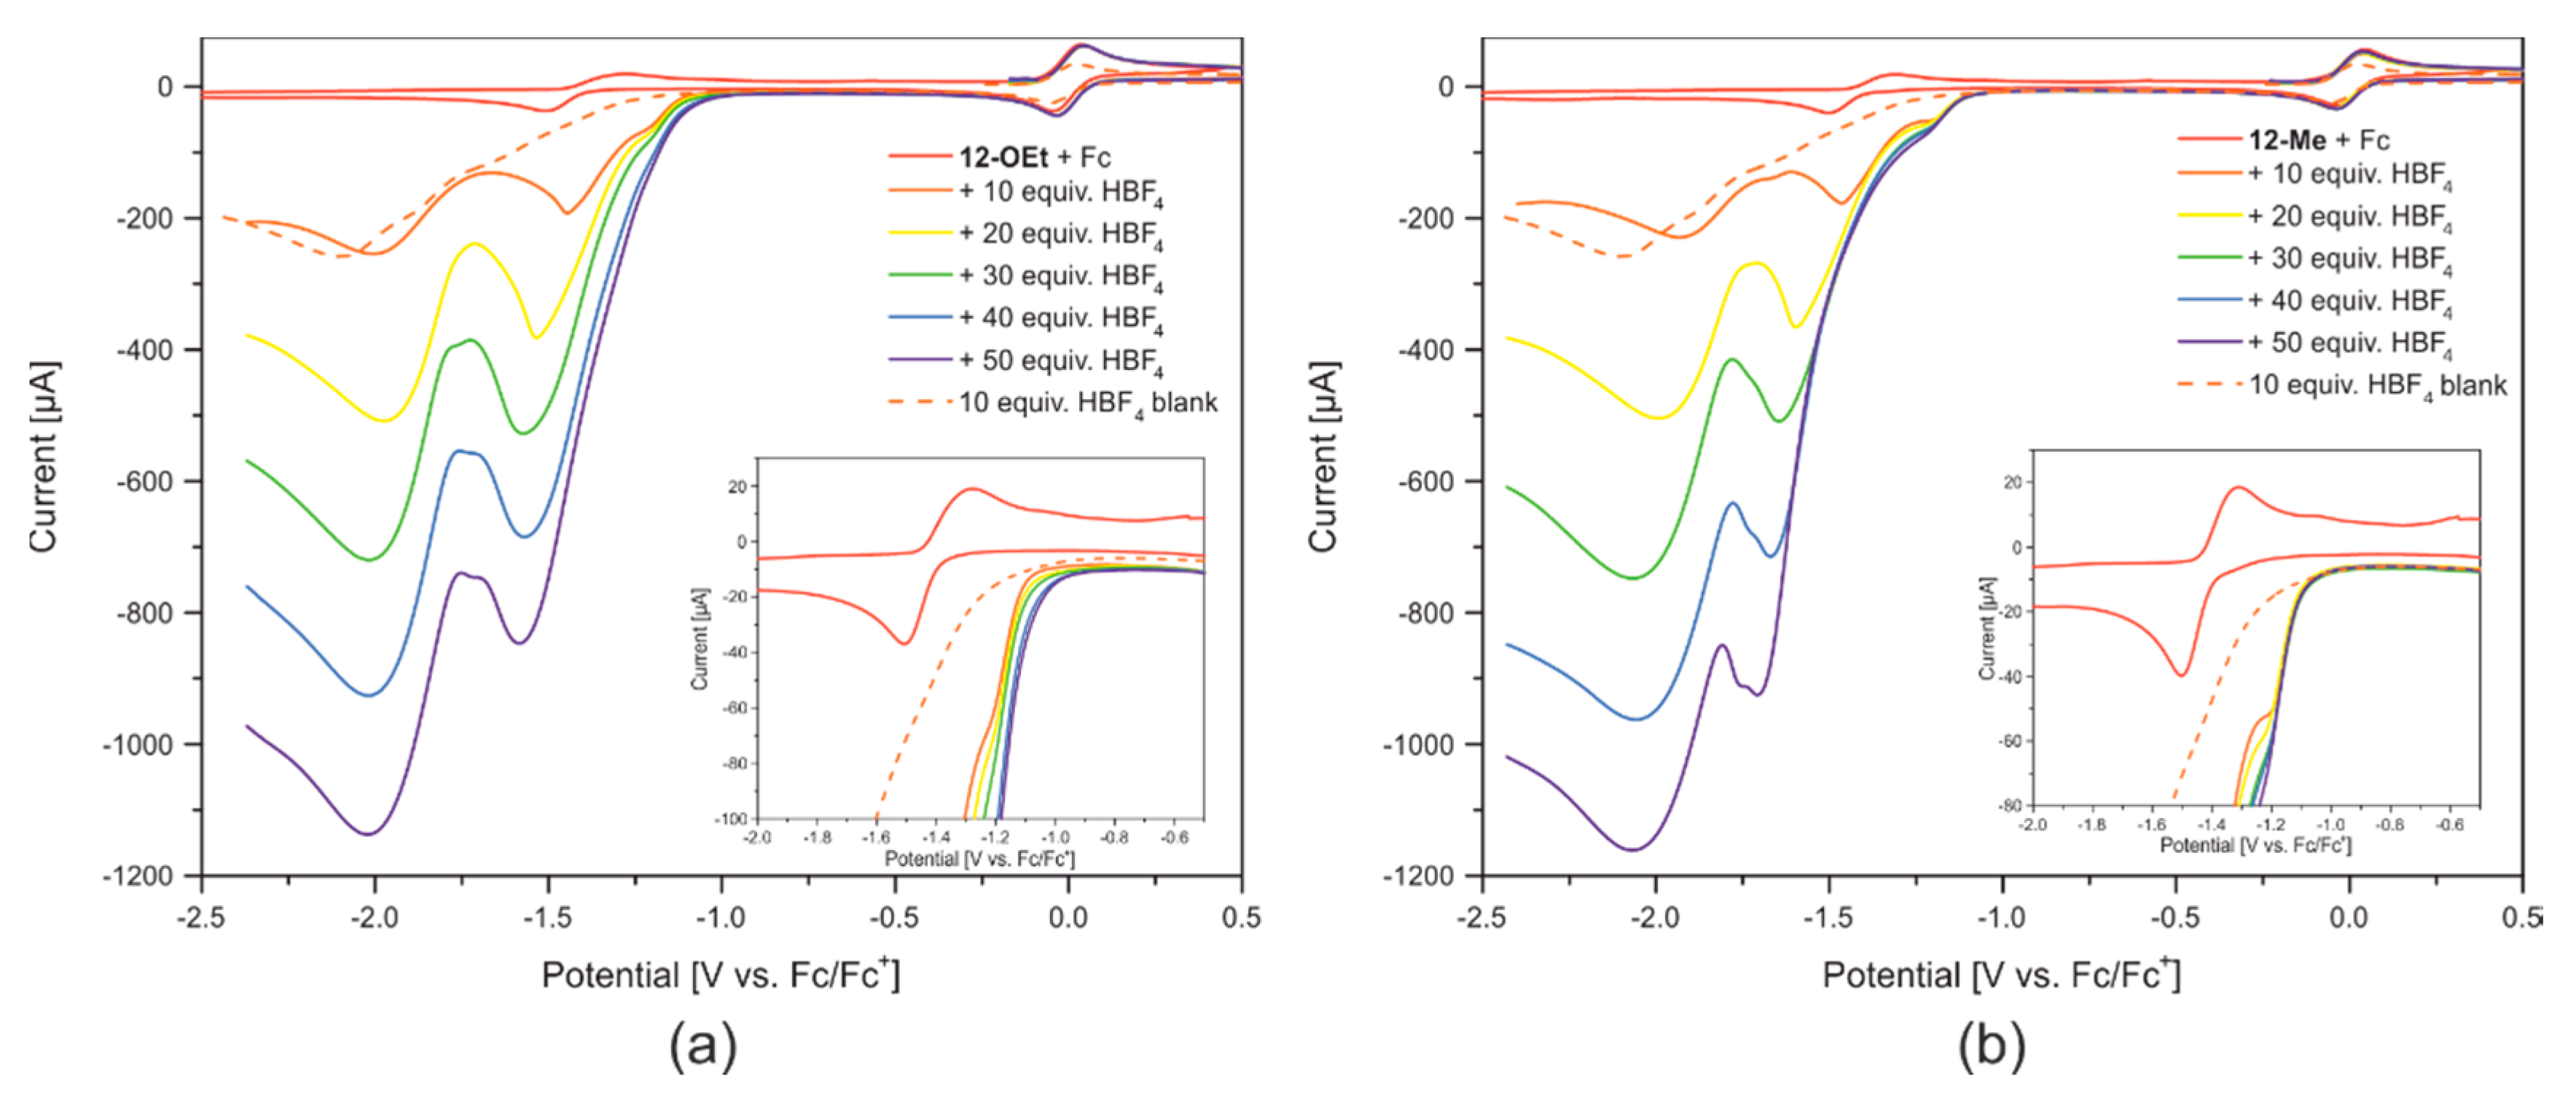
2.5. Redox Properties of Model Compounds 12-R in Absence and Presence of Acids of Various Strength
3. Conclusions
4. Materials and Methods
Syntheses
Note: Besides ethyl bis(mercaptomethyl) phosphinate, this procedure gives 4-ethoxy-1,2,4-dithiaphospholane 4-oxide, or a polymer by forming inter- instead of intramolecular disulfide bridges, as well. Those oxidized products can be specifically synthesized by the following procedure:
Note: Besides phenyl bis(mercaptomethyl) phosphinate, this procedure gives 4-phenoxy-1,2,4-dithiaphospholane 4-oxide, or a polymer by forming inter- instead of intramolecular disulfide bridges, as well. Here, only 31P-NMR spectroscopy was able to distinguish between both products
Note: Besides Bis(mercatptomethyl)methyl phosphine oxide, this procedure gives 4-methyl-1,2,4-dithiaphospholane 4-oxide, or a polymer by forming inter- instead of intramolecular disulfide bridges, as well.
Supplementary Materials
Author Contributions
Funding
Conflicts of Interest
References
- Peters, J.W.; Lanzilotta, W.N.; Lemon, B.J.; Seefeldt, L.C. X-ray crystal structure of the Fe-only hydrogenase (CpI) from Clostridium pasteurianum to 1.8 angstrom resolution. Science 1998, 282, 1853–1858. [Google Scholar] [CrossRef] [PubMed]
- Nicolet, Y.; Piras, C.; Legrand, P.; Hatchikian, C.E.; Fontecilla-Camps, J.C. Desulfovibrio desulfuricans iron hydrogenase: The structure shows unusual coordination to an active site Fe binuclear center. Structure 1999, 7, 13–23. [Google Scholar] [CrossRef] [Green Version]
- Lubitz, W.; Ogata, H.; Ruediger, O.; Reijerse, E. Hydrogenases. Chem. Rev. 2014, 114, 4081–4148. [Google Scholar] [CrossRef] [PubMed]
- Silakov, A.; Wenk, B.; Reijerse, E.; Lubitz, W. 14N HYSCORE investigation of the H-cluster of [FeFe] hydrogenase: Evidence for a nitrogen in the dithiol bridge. Phys. Chem. Chem. Phys. 2009, 11, 6592. [Google Scholar] [CrossRef] [PubMed]
- Berggren, G.; Adamska, A.; Lambertz, C.; Simmons, T.R.; Esselborn, J.; Atta, M.; Gambarelli, S.; Mouesca, J.-M.; Reijerse, E.; Lubitz, W.; et al. Biomimetic assembly and activation of [FeFe]-hydrogenases. Nature 2013, 499, 66–69. [Google Scholar] [CrossRef] [Green Version]
- Esselborn, J.; Lambertz, C.; Adamska-Venkatesh, A.; Simmons, T.; Berggren, G.; Noth, J.; Siebel, J.; Hemschemeier, A.; Artero, V.; Reijerse, E.; et al. Spontaneous activation of [FeFe]-hydrogenases by an inorganic [2Fe] active site mimic. Nat. Chem. Biol. 2013, 9, 607–609. [Google Scholar] [CrossRef] [Green Version]
- Siebel, J.F.; Adamska-Venkatesh, A.; Weber, K.; Rumpel, S.; Reijerse, E.; Lubitz, W. Hybrid [FeFe]-Hydrogenases with Modified Active Sites Show Remarkable Residual Enzymatic Activity. Biochemistry 2015, 54, 1474–1483. [Google Scholar] [CrossRef]
- Kertess, L.; Wittkamp, F.; Sommer, C.; Esselborn, J.; Rüdiger, O.; Reijerse, E.J.; Hofmann, E.; Lubitz, W.; Winkler, M.; Happe, T.; et al. Chalcogenide substitution in the [2Fe] cluster of [FeFe]-hydrogenases conserves high enzymatic activity. Dalton Trans. 2017, 46, 16947–16958. [Google Scholar] [CrossRef]
- Sommer, C.; Richers, C.P.; Lubitz, W.; Rauchfuss, T.B.; Reijerse, E.J. A [RuRu] Analogue of an [FeFe]-Hydrogenase Traps the Key Hydride Intermediate of the Catalytic Cycle. Angew. Chem. Int. Ed. 2018, 57, 5429–5432. [Google Scholar] [CrossRef]
- Engel, R.; Cohen, J.I. Phosphorus: Organophosphorus Chemistry. In Encyclopedia of Inorganic and Bioinorganic Chemistry; Scott, R.A., Ed.; John Wiley & Sons, Ltd.: Chichester, UK, 2011; ISBN 978-1-119-95143-8. [Google Scholar]
- Oswald, A.A.; Guertin, D.L. Organic Nitrogen Compounds. I. Peroxide Intermediates of Tertiary Alkylamine Oxidation by Hydrogen Peroxide. J. Org. Chem. 1963, 28, 651–657. [Google Scholar] [CrossRef]
- Markovski, L.N.; Romanenko, V.D. Phosphaalkynes and phosphaalkenes. Tetrahedron 1989, 45, 6019–6090. [Google Scholar] [CrossRef]
- Song, L.-C.; Zhao, P.-H.; Du, Z.-Q.; Tang, M.-Y.; Hu, Q.-M. Unexpected Synthesis of Tetrahedral Fe/S Clusters via Highly Reactive Butterfly Intermediates (μ-HS) 2 Fe 2 (CO) 5 [RP(CH 2 OH) 2 ]. Organometallics 2010, 29, 5751–5753. [Google Scholar] [CrossRef]
- Almazahreh, L.R.; Apfel, U.-P.; Imhof, W.; Rudolph, M.; Goerls, H.; Talarmin, J.; Schollhammer, P.; El-Khateeb, M.; Weigand, W. A Novel [FeFe] Hydrogenase Model with a (SCH2)2P = O Moiety. Organometallics 2013, 32, 4523–4530. [Google Scholar] [CrossRef]
- Bourrez, M.; Steinmetz, R.; Gloaguen, F. Mechanistic Insights into the Catalysis of Electrochemical Proton Reduction by a Diiron Azadithiolate Complex. Inorg. Chem. 2014, 53, 10667–10673. [Google Scholar] [CrossRef] [PubMed]
- Stanley, J.L.; Heiden, Z.M.; Rauchfuss, T.B.; Wilson, S.R.; De Gioia, L.; Zampella, G. Desymmetrized Diiron Azadithiolato Carbonyls: A Step Toward Modeling the Iron-Only Hydrogenases. Organometallics 2008, 27, 119–125. [Google Scholar] [CrossRef] [Green Version]
- Henderson, W.A., Jr.; Streuli, C.A. The Basicity of Phosphines. J. Am. Chem. Soc. 1960, 82, 5790–5791. [Google Scholar] [CrossRef]
- Maier, L. Organic phosphorus compounds 53 preparation and properties of bis-(chloromethyl)-phosphinic and -thiophosphinic acid derivatives as well as tertiary phosphine oxides and sulfides containing two ClCH2 groups [1]. Helv. Chim. Acta 1971, 54, 1651–1660. [Google Scholar] [CrossRef]
- Hieber, W.; Gruber, J. Zur Kenntnis der Eisencarbonylchalkogenide. Z. Für Anorg. Und Allg. Chem. 1958, 296, 91–103. [Google Scholar]
- Cheng, L.-X.; Ma, C.-B.; Hu, M.-Q.; Chen, C.-N. (μ 4 -Disulfido-1:2κ 2 S, S; 3:4κ 2 S ′, S ′)bis(μ 2 -ethylthiolato-κ2 S: S)tetrakis[tricarbonyliron(II)(Fe—Fe)]. Acta Cryst. E Struct. Rep. Online 2005, 61, m892–m894. [Google Scholar] [CrossRef]
- Li, H.; Rauchfuss, T.B. Iron Carbonyl Sulfides, Formaldehyde, and Amines Condense To Give the Proposed Azadithiolate Cofactor of the Fe-Only Hydrogenases. J. Am. Chem. Soc. 2002, 124, 726–727. [Google Scholar] [CrossRef]
- Silakov, A.; Olsen, M.T.; Sproules, S.; Reijerse, E.J.; Rauchfuss, T.B.; Lubitz, W. EPR/ENDOR, Mössbauer, and Quantum-Chemical Investigations of Diiron Complexes Mimicking the Active Oxidized State of [FeFe]Hydrogenase. Inorg. Chem. 2012, 51, 8617–8628. [Google Scholar] [CrossRef] [Green Version]
- Gilbert-Wilson, R.; Siebel, J.F.; Adamska-Venkatesh, A.; Pham, C.C.; Reijerse, E.; Wang, H.; Cramer, S.P.; Lubitz, W.; Rauchfuss, T.B. Spectroscopic Investigations of [FeFe] Hydrogenase Maturated with [ 57 Fe 2 (adt)(CN) 2 (CO) 4 ] 2–. J. Am. Chem. Soc. 2015, 137, 8998–9005. [Google Scholar] [CrossRef] [PubMed] [Green Version]
- Apfel, U.-P.; Troegel, D.; Halpin, Y.; Tschierlei, S.; Uhlemann, U.; Görls, H.; Schmitt, M.; Popp, J.; Dunne, P.; Venkatesan, M.; et al. Models for the active site in [FeFe] hydrogenase with iron-bound ligands derived from bis-, tris-, and tetrakis(mercaptomethyl)silanes. Inorg. Chem. 2010, 49, 10117–10132. [Google Scholar] [CrossRef] [PubMed]
- Song, L.-C.; Yang, Z.-Y.; Bian, H.-Z.; Hu, Q.-M. Novel Single and Double Diiron Oxadithiolates as Models for the Active Site of [Fe]-Only Hydrogenases. Organometallics 2004, 23, 3082–3084. [Google Scholar] [CrossRef]
- Raamat, E.; Kaupmees, K.; Ovsjannikov, G.; Trummal, A.; Kütt, A.; Saame, J.; Koppel, I.; Kaljurand, I.; Lipping, L.; Rodima, T.; et al. Acidities of strong neutral Brønsted acids in different media: ACIDITIES OF STRONG NEUTRAL BRØNSTED ACIDS. J. Phys. Org. Chem. 2013, 26, 162–170. [Google Scholar] [CrossRef]
- Fujinaga, T.; Sakamoto, I. Electrochemical studies of sulfonates in non-aqueous solvents. J. Electroanal. Chem. Interfacial Electrochem. 1977, 85, 185–201. [Google Scholar] [CrossRef]
- Capon, J.-F.; Ezzaher, S.; Gloaguen, F.; Pétillon, F.Y.; Schollhammer, P.; Talarmin, J. Electrochemical Insights into the Mechanisms of Proton Reduction by [Fe2(CO)6{μ-SCH2N(R)CH2S}] Complexes Related to the [2Fe]H Subsite of [FeFe]Hydrogenase. Chem. Eur. J. 2008, 14, 1954–1964. [Google Scholar] [CrossRef] [PubMed]
- Gloaguen, F.; Lawrence, J.D.; Rauchfuss, T.B.; Bénard, M.; Rohmer, M.-M. Bimetallic Carbonyl Thiolates as Functional Models for Fe-Only Hydrogenases. Inorg. Chem. 2002, 41, 6573–6582. [Google Scholar] [CrossRef]
- Eilers, G.; Schwartz, L.; Stein, M.; Zampella, G.; de Gioia, L.; Ott, S.; Lomoth, R. Ligand versus Metal Protonation of an Iron Hydrogenase Active Site Mimic. Chem. A Eur. J. 2007, 13, 7075–7084. [Google Scholar] [CrossRef]
- Lawrence, J.D.; Li, H.; Rauchfuss, T.B.; Bénard, M.; Rohmer, M.-M. Diiron Azadithiolates as Models for the Iron-Only Hydrogenase Active Site: Synthesis, Structure, and Stereoelectronics. Angew. Chem. Int. Ed. 2001, 40, 1768–1771. [Google Scholar] [CrossRef]
- Mejia-Rodriguez, R.; Chong, D.; Reibenspies, J.H.; Soriaga, M.P.; Darensbourg, M.Y. The Hydrophilic Phosphatriazaadamantane Ligand in the Development of H 2 Production Electrocatalysts: Iron Hydrogenase Model Complexes. J. Am. Chem. Soc. 2004, 126, 12004–12014. [Google Scholar] [CrossRef]
- Senger, M.; Mebs, S.; Duan, J.; Shulenina, O.; Laun, K.; Kertess, L.; Wittkamp, F.; Apfel, U.-P.; Happe, T.; Winkler, M.; et al. Protonation/reduction dynamics at the [4Fe–4S] cluster of the hydrogen-forming cofactor in [FeFe]-hydrogenases. Phys. Chem. Chem. Phys. 2018, 2018, 3128–3140. [Google Scholar] [CrossRef] [Green Version]
- Senger, M.; Laun, K.; Wittkamp, F.; Duan, J.; Haumann, M.; Happe, T.; Winkler, M.; Apfel, U.-P.; Stripp, S.T. Proton-Coupled Reduction of the Catalytic [4Fe-4S] Cluster in [FeFe]-Hydrogenases. Angew. Chem. Int. Ed. 2017, 56, 16503–16506. [Google Scholar] [CrossRef] [PubMed]
- Mebs, S.; Duan, J.; Wittkamp, F.; Stripp, S.T.; Happe, T.; Apfel, U.-P.; Winkler, M.; Haumann, M. Differential Protonation at the Catalytic Six-Iron Cofactor of [FeFe]-Hydrogenases Revealed by 57 Fe Nuclear Resonance X-ray Scattering and Quantum Mechanics/Molecular Mechanics Analyses. Inorg. Chem. 2019, 58, 4000–4013. [Google Scholar] [CrossRef] [PubMed]
- Borg, S.J.; Behrsing, T.; Best, S.P.; Razavet, M.; Liu, X.; Pickett, C.J. Electron Transfer at a Dithiolate-Bridged Diiron Assembly: Electrocatalytic Hydrogen Evolution. J. Am. Chem. Soc. 2004, 126, 16988–16999. [Google Scholar] [CrossRef] [PubMed]
- Albracht, S.P.J.; Roseboom, W.; Hatchikian, E.C. The active site of the [FeFe]-hydrogenase from Desulfovibrio desulfuricans. I. Light sensitivity and magnetic hyperfine interactions as observed by electron paramagnetic resonance. JBIC J. Biol. Inorg. Chem. 2006, 11, 88–101. [Google Scholar] [CrossRef]


| P-Type | P—Compounds | N-Type | N—Compounds | |
|---|---|---|---|---|
| Aliphatics | Phosphines |  | Amines |  |
| Phosphaalkenes |  | Imines |  | |
| Phosphaalkynes |  | Nitriles |  | |
| Diphosphenes |  | Azo compounds |  | |
| Aromatics/ Heterocycles | Phosphinines |  | Pyridines |  |
| Phospholes |  | Pyrroles |  |
| Entry | Compound | δ [mm/s] | ΔEQ [mm/s] | Ref. |
|---|---|---|---|---|
| 1 | [Fe2(CO)6][(μ-SCH2)2P(O)OEt] (12-OEt) | 0.07 | 0.91 | a) |
| 2 | [Fe2(CO)6][(μ-SCH2)2P(O)OMe] (12-OMe) | 0.05 | 0.87 | a) |
| 3 | [Fe2(CO)6][(μ-SCH2)2P(O)Me] (12-Me) | 0.05 | 0.87 | a) |
| 4 | [Fe2(CO)6][(μ-SCH2)2CH2] (PDT) | 0.05 | 0.63 | a) |
| 5 | [Fe2(CO)6][(μ-SeCH2)2CH2] (PDSe) | 0.06 | 0.65 | a) |
| 6 | [Fe2(CO)6][(μ-SeCH2)2NH] (ADSe) | 0.07 | 0.65 | a) |
| 7 | [Fe2(CO)6][(μ-SCH2)2NH] (ADT) | 0.05 | 0.64 | a) |
| 8 | [Fe2(CO)6][(μ-SCH2)2Ph] (BDT) | 0.08 | 0.46 | a) |
| 9 | [Fe2(CO)4(CN)2][(μ-SCH2)2CH2]2− | 0.06 | 0.92 | a) |
| 10 | [Fe2(CO)4(CN)2][(μ-SCH2)2NH]2− | 0.09 | 0.43 | a) |
| 11 | [Fe2(CO)4(CN)2][(μ-SeCH2)2CH2]2− | 0.07 | 0.83 | a) |
| 12 | HydA1adt | 0.16, 0.08 | 0.89, 0.55 | [23] |
| 13 | [Fe2(CO)6][(μ-SCH2)2SiMe2] | −0.04 | 0.78 | [24] |
| 14 | [Fe2(CO)6][(μ-SCH2)2SiMe(CH2SH)] | −0.04 | 0.82 | [24] |
| 15 | [Fe2(CO)6][(μ-SCH2)2O)] | −0.02 | 0.81 | [25] |
| 16 | [Fe2(µCO)(CO)2(PMe)(dppe)][(μ-SCH2)2)] | −0.58 (PMe), 0.70 (dppe) | 0.2 (PMe), 0.04 (dppe) | [22] |
© 2020 by the authors. Licensee MDPI, Basel, Switzerland. This article is an open access article distributed under the terms and conditions of the Creative Commons Attribution (CC BY) license (http://creativecommons.org/licenses/by/4.0/).
Share and Cite
Wittkamp, F.; Boydas, E.B.; Roemelt, M.; Apfel, U.-P. New Phosphorous-Based [FeFe]-Hydrogenase Models. Catalysts 2020, 10, 522. https://doi.org/10.3390/catal10050522
Wittkamp F, Boydas EB, Roemelt M, Apfel U-P. New Phosphorous-Based [FeFe]-Hydrogenase Models. Catalysts. 2020; 10(5):522. https://doi.org/10.3390/catal10050522
Chicago/Turabian StyleWittkamp, Florian, Esma Birsen Boydas, Michael Roemelt, and Ulf-Peter Apfel. 2020. "New Phosphorous-Based [FeFe]-Hydrogenase Models" Catalysts 10, no. 5: 522. https://doi.org/10.3390/catal10050522