Article

Insights into the Pt (111) Surface Aid in Predicting the Selective Hydrogenation Catalyst

1
Key Laboratory for Green Chemical Technology of the Ministry of Education, School of Chemical Engineering and Technology, Tianjin University, Tianjin 300072, China
2
Collaborative Innovative Center of Chemical Science and Engineering (Tianjin), Tianjin 300072, China
*
Author to whom correspondence should be addressed.
Catalysts 2020, 10(12), 1473; https://doi.org/10.3390/catal10121473
Submission received: 22 October 2020 / Revised: 30 November 2020 / Accepted: 3 December 2020 / Published: 16 December 2020
(This article belongs to the Special Issue Computational Chemistry and Catalysis: Prediction and Design)

Abstract

:
The d-band center position of the metal catalyst is one of the most important factors for catalytic selective hydrogenation, e.g., the conversion of nitrostyrene to aminostyrene. In this work, we modulate the d-band center position of the Pt surface via H coverage manipulation in order to assess the highly efficient selective hydrogenation catalyst using density functional theory (DFT) calculation, which is validated experimentally. The optimal transition metal catalysts are first screened by comparing the adsorption energy values of two ideal models, nitrobenzene and styrene, and by correlating the adsorption energy with the d-band center positions. Among the ten transition metals, Pt nanoparticles have a good balance between selectivity and the conversion rate. Then, the surface hydrogen covering strategy is applied to modulate the d-band center position on the Pt (111) surface, with the increase of H coverage leading to a decline of the d-band center position, which can selectively enhance the adsorption of nitro groups. However, excessively high H coverage (e.g., 75% or 100%) with an insufficiently low d-band center position can switch the chemisorption of nitro groups to physisorption, significantly reducing the catalytic activity. Therefore, a moderate d-band center shift (ca. −2.14 eV) resulted in both high selectivity and catalytic conversion. In addition, the PtSn experimental results met the theoretical expectations. This work provides a new strategy for the design of highly efficient metal catalysts for selective hydrogenation via the modulation of the d-band center position.

Graphical Abstract

1. Introduction

Rational catalyst design strategies generally need to be guided by theoretical calculations [1]. By constructing adsorption competition strategies for initial configurations and key intermediates, potential advantageous catalysts can be screened and predicted, which can greatly reduce the costs involved in studying catalytic processes and industrial production [2]. A number of studies have found that adsorption strength often depends on the adsorbent and electron density properties of the catalyst surface [3]. The latter is often most relevant in designing heterogeneous catalysts, especially for the process of regulating specific functional group reactions while stopping other functional groups from participating in the selective catalysis reaction [4]. For example, the process of selective hydrogenation of nitrobenzene to aniline involves adsorption competition between nitro groups and other functional groups, and their levels of sensitivity to the surface electrons of the catalyst are very different [5,6]. Therefore, theoretical calculations can provide opportunities to screen outstanding catalysts and study the catalytic reaction mechanism.
Aniline and its derivatives are key intermediates in the production of pharmaceuticals, pesticides, dyes, and pigments, which are usually synthesized through the selective reduction of nitroaromatic hydrocarbons [7]. Of these, selective hydrogenation reduction of nitrostyrene is one of the most challenging reactions [8]. Currently, the most advantageous and frequently used catalysts are transition metals supported on reducible supports [9]. For example, Corma et al. found that Au/TiO2-catalyzed nitrostyrene can achieve a selectivity rate of 96%. However, calculations showed that Au does not have catalytic selectivity, which is entirely due to the preferential adsorption of nitro groups on TiO2, and because the low conversion frequency (TOF = 173/h) is insufficient for practical applications [10]. In line with the inspiration for this work, metals such as Pt, Ni, Pd, Ru, and others have been extensively developed and studied [11,12,13]. However, these metals have much higher adsorption capacity for –C=C than that for the nitro group, resulting in low selectivity. An effective strategy to solve issue this is to reduce the interaction between –C=C and the metal without decreasing the nitro group adsorption strength [14]. Since –C=C is more sensitive to the geometric effect of metal than –NO2, the most used method is to adjust the geometric size of the metal nanoparticles. For instance, reducing the metal loading of Ni/TiO2 can increase the poor hydrogenation selectivity to 96.3%, but it also causes a sharp drop in hydrogenation activity, which is similar to the performance of loaded Au and Ag nanoparticles [10]. In addition, Pd, Fe, Rh, and other potential catalysts have also been developed and modified, however the selectivity improvements have been very limited.
An important means to understand the adsorption properties of the reactants during the heterogeneous catalysis process is to compare the d-band center positions of transition metals [15], which provides the possibility to balance the relationship between conversion and selectivity. Recently, there have been studies involving manipulation of the d-band center positions on solid catalyst surfaces to improve the selectivity of the catalytic reaction [16]. In 2020, Xu et al. used the ligand effect to adjust the position of the d-band center by changing the surface composition ratio of nickel and copper, and found that the hydrogen evolution reaction (HER) activity of the alkali metals has a volcanic curve relationship with the measured d-band center position [17]. Meanwhile, Xiao et al. utilized the argon ion radiation method to effectively adjust the d-band center position on the surface of Co3O4, and found that a proper center shift is beneficial to the adsorption selectivity of oxygen groups [18]. However, regarding the selective hydrogenation of nitrostyrene, there are fewer studies on the modulation of the d-band center position for the promotion of catalytic performance. Therefore, this work focuses on optimizing the catalytic selectivity of transition metals through d-band center position modulation.
In this work, we compared the adsorption energies of –NO2 and –C=C on 10 transition metals using the DFT method and screened potential superior metals (i.e., Pt nanoparticles) through d-band center position changes. In order to reveal the influence of the d-band center position on the catalytic performance values, a Pt (111) slab model covered by fcc-H was rationally constructed. Combining the adsorption energy values of –NO2 and –C=C groups and the change of reaction barriers, we found that the hydrogenation selectivity of nitrostyrene could be further improved by moderately changing the d-band center positions on the surfaces of Pt nanoparticles.

2. Results and Discussion

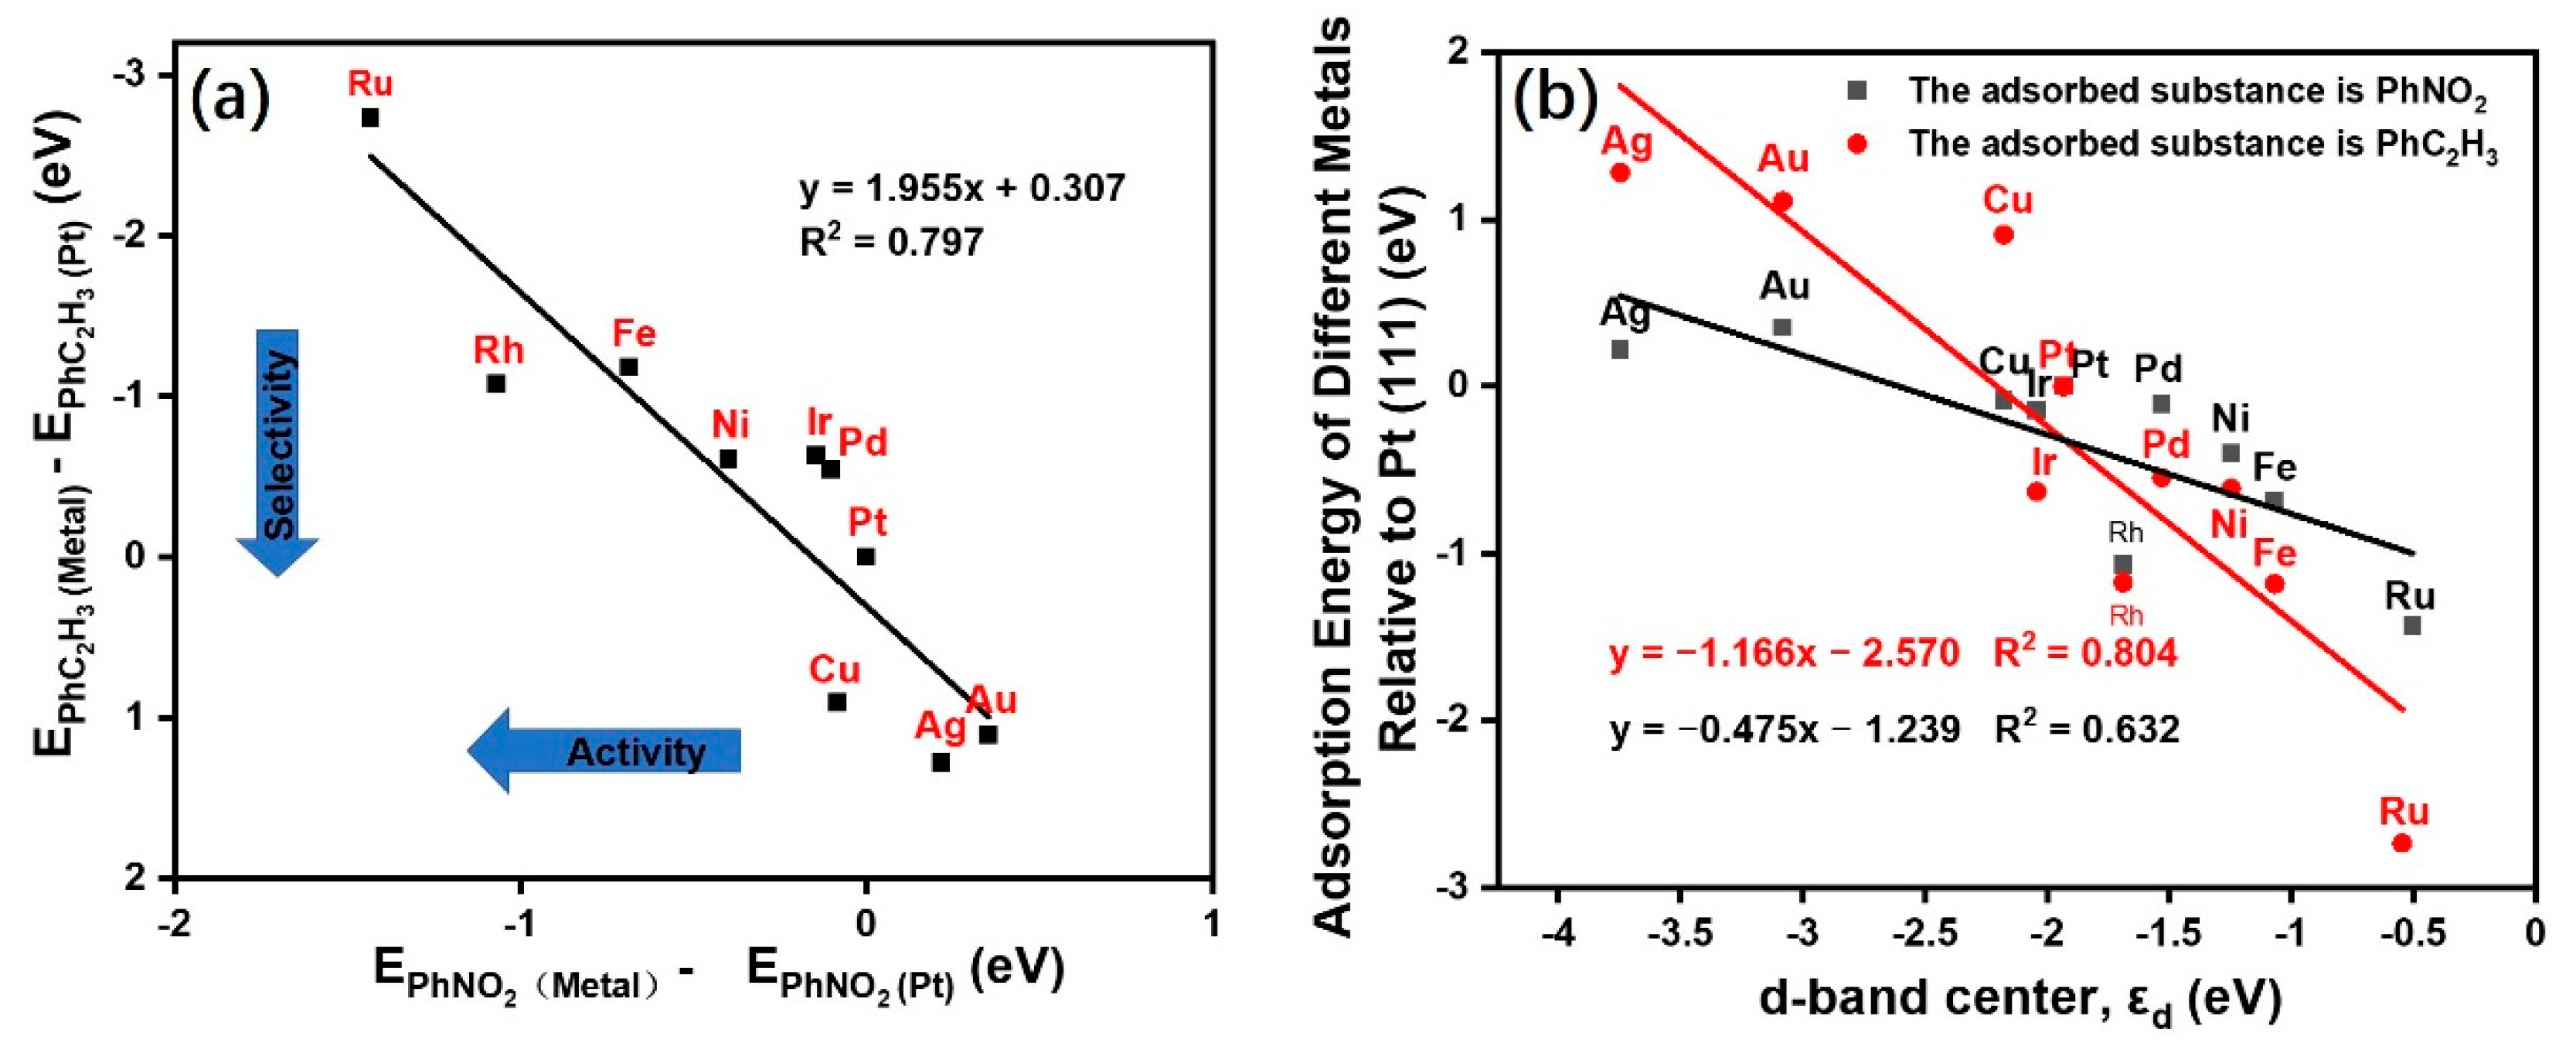
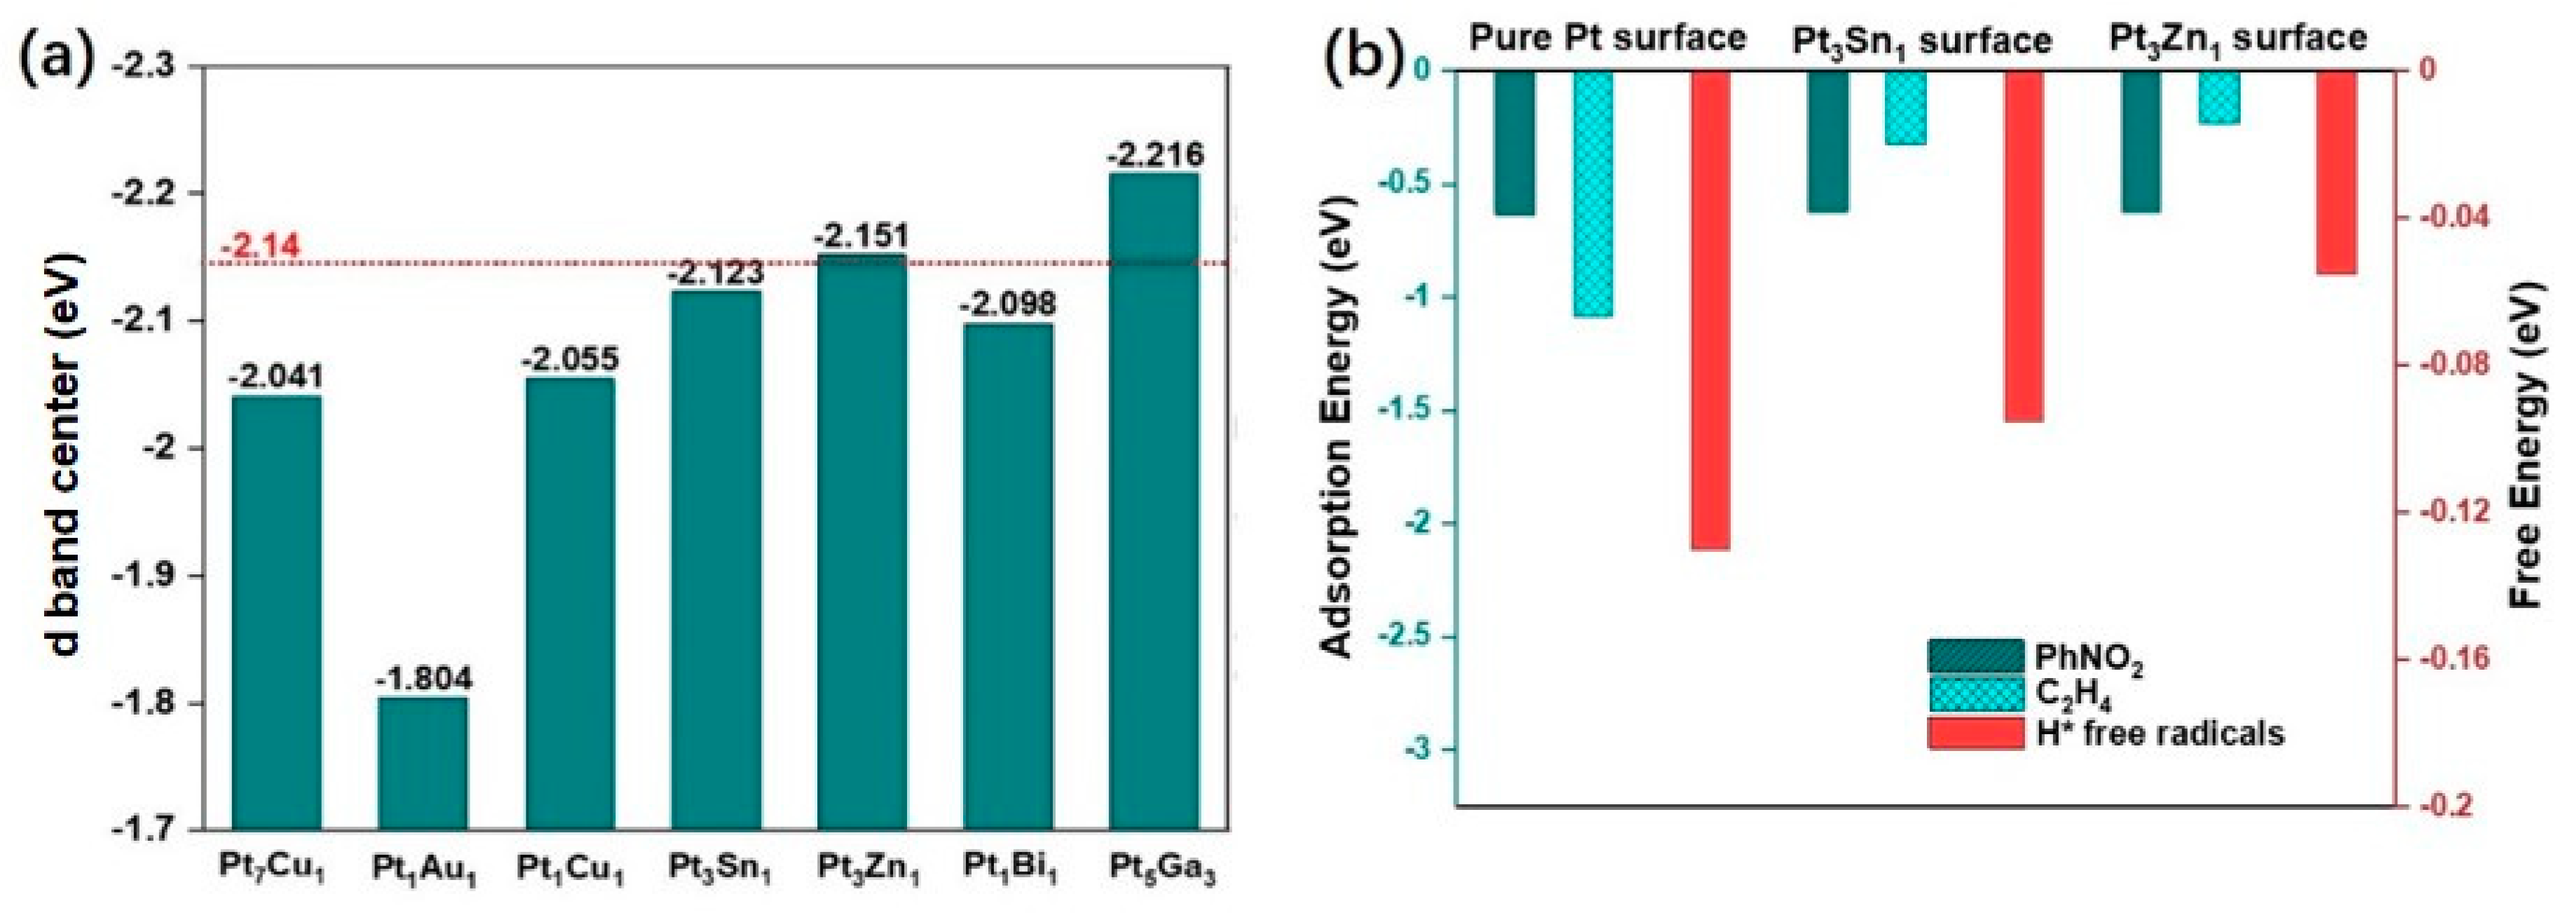
2.1. Screening of Transition Metals

The selectivity of the hydrogenation of nitrostyrene in the production of aminostyrene is mainly due to the competitive adsorption of nitro and vinyl groups; the benzene ring is considered inert during this reaction (which will be demonstrated in Section 2.3). Generally, researchers mainly use two probe substances, nitrobenzene and ethylene, as descriptors for nitrostyrene (see the ball-and-stick models in Figure 1), which can greatly simplify the calculation process. This simplification can also avoid the need to analyze the strength of the simultaneous adsorption of nitro and vinyl groups when the flat nitrostyrene structure is adsorbed [19].
According to the optimized adsorbate model, the space environments of styrene and nitrobenzene are very different. The –C=C bonds in styrene are parallel to the benzene rings in space, and their structure is horizontal to the metal surface during the process of adsorption. Therefore, for the adsorption of styrene, both the –C=C bond and the benzene ring must be considered, even if the adsorption energy of the benzene ring is negligible [20]. In contrast, the –NO2 group, which has a vertical structure, takes place on the metal surface in the adsorption process. Therefore, for PhNO2, only the adsorption of the –NO2 group needs to be considered, which can satisfy real-world situations.
Previous studies have shown that the decisive factor in the selectivity of the selective hydrogenation of nitrostyrene is the adsorption competition of –NO2 and –C=C on the catalyst surface [21]. Therefore, relatively weak adsorption of –C=C on the catalyst surface indicates high selectivity, while moderately enhanced adsorption of –NO2 is one of the key factors that improves the activity. We screened 10 transition metals (Ni, Pd, Ag, Ir, Au, Fe, Rh, Ru, Cu, Pt; Figure S1, Support Information, SI) and calculated their adsorption strengths for styrene and nitrobenzene (Figure S2, SI). Since many studies have been carried out on Pt, we used it as a benchmark (Table S1, Figures S3 and S4, SI) to measure the performance of other transition metals. It should be mentioned that the adsorption energy we calculated for styrene included not only the adsorption of –C=C, but also the adsorption of benzene. We will describe the contribution of benzene later.
On the surfaces of the 10 transition metals, the energy difference of EPhC2H3(metal) − EPhC2H3(Pt) is positively linearly correlated with that of EPhNO2(metal) − EPhNO2(Pt), which means that when the adsorption energy of a certain metal to PhNO2 is low, the adsorption energy of PhC2H3 is also low (Figure 2a). It is worth noting that relatively weak styrene adsorption on a certain metal leads to the better selectivity in the selective hydrogenation, while relatively strong nitrostyrene adsorption results in higher activity. Therefore, the lower left region of Pt should show high activity and selectivity, which is the target region for the selective hydrogenation, with Cu (111) obviously existing in this region (Figure 2a). Unfortunately, we found that H2 could not exist on its surface in the form of chemisorption, as the bond length is much longer than 3 Å (Table S1, Figures S4 and S5, SI).
For the metals located in the upper left region, i.e., Ru, Rh, Fe, Ni, Ir, and Pd, they should show higher catalytic activity but lower selectivity, which is due to their strong adsorption strength to the adsorbates [22]. For the metals located in the lower right region, i.e., Ag and Au, they should show lower catalytic activity but higher selectivity. Similar to Cu, the adsorption states of PhNO2 and PhC2H3 on Ag and Au (Figure 2a) are physical adsorption, as shown by the bond length (>3 Å, Figure S6, SI), which causes the nitro group to be more advantageous to adsorption on the defective position of the reducible support [23], leading to high selectivity and low activity. For example, using the Au/TiO2 as a catalyst, the nitrostyrene does not adsorb on the Au surface, but it can adsorb on the oxygen defect of TiO2 or the boundary between TiO2 and Au via –NO2 groups with moderate adsorption strength [24]. Au is only responsible for cracking H2, but the low hydrogen decomposition efficiency and hydrogen overflow efficiency lead to high selectivity and low activity. Based on the above calculation and analysis, Pt was the only catalytic model that performed well in our screening process. However, its results were still far from the theoretical value of Cu (Figure 2a). Adjusting the electronic properties of the Pt (111) slab to the Cu (111) slab is an ideal method to further improve its catalytic performance.
Next, the scaling relationship derived from the linear relationship between the atoms’ d-band center positions on the surface of the transition metal and the adsorption energy was investigated (Figure 2b). The adsorption energies of PhNO2 and PhC2H3 become stronger as the d-band center position moves closer to the Fermi energy level. Interestingly, the adsorption of PhC2H3 is more sensitive than that of PhNO2. Therefore, we hoped to adjust the d-band center to a position between Pt and Cu to balance the adsorption strength of nitro and vinyl groups without excessively reducing the H2 cracking activity.
The doping of the catalyst allows manipulation of the d-band center position via the introduction of other atoms, however this affects the structure of the d-band center regulation–performance relationship [25]. In fact, the adsorption of the reactant hydrogen on the reaction substrate can also control the surface d-band center position without affecting the crystal structure or lattice stress [26]. Therefore, we used the regulation of the H atom coverage (equivalent to the introduction of protons) on the Pt surface to control the d-band center position and its catalytic performance, and to establish the relationship between the d-band center position and the catalytic activity.

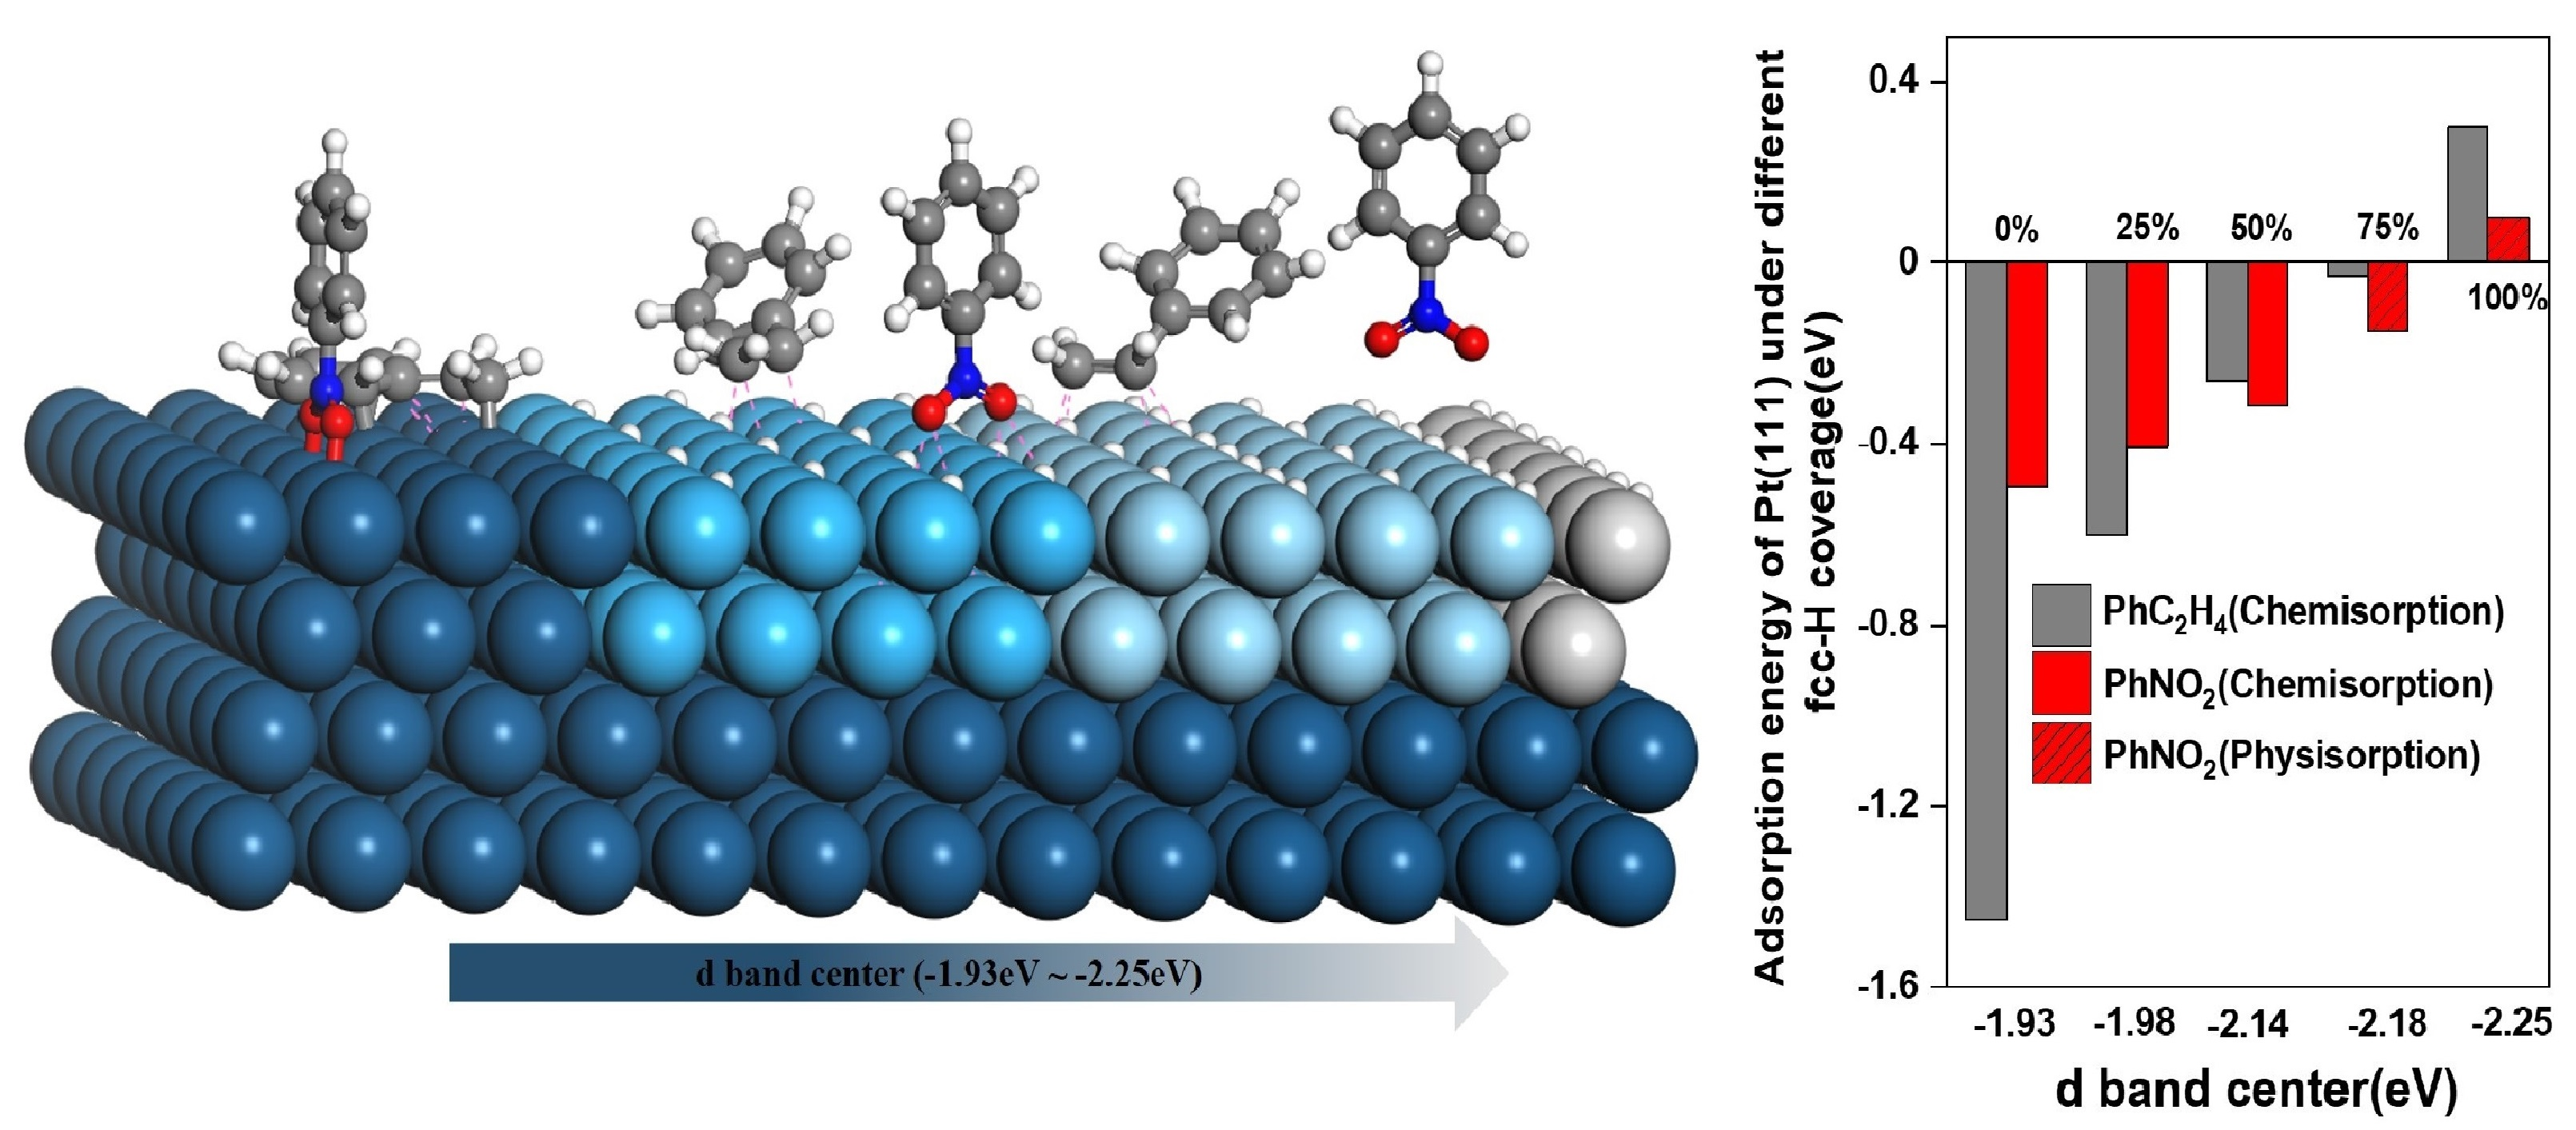
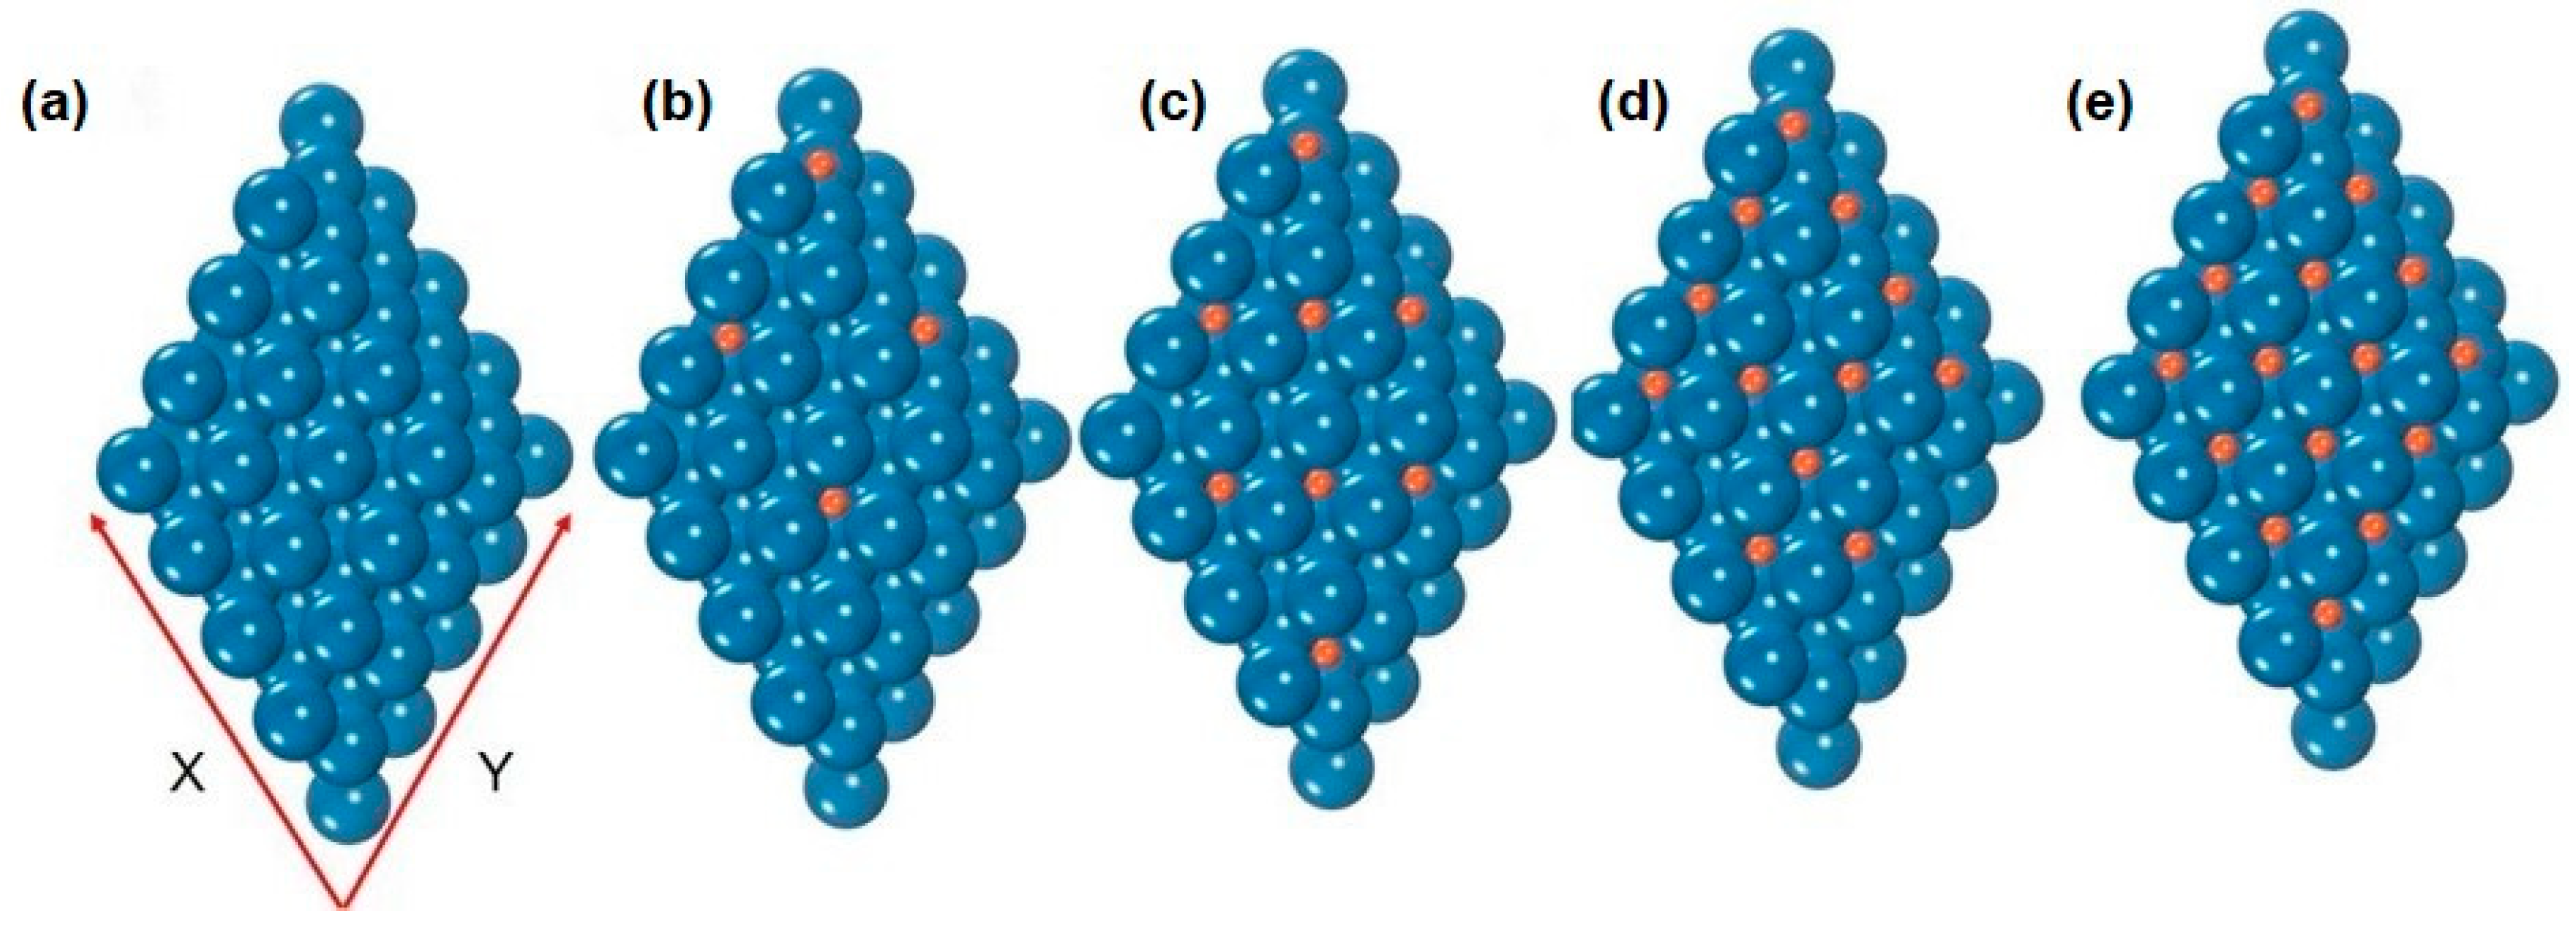
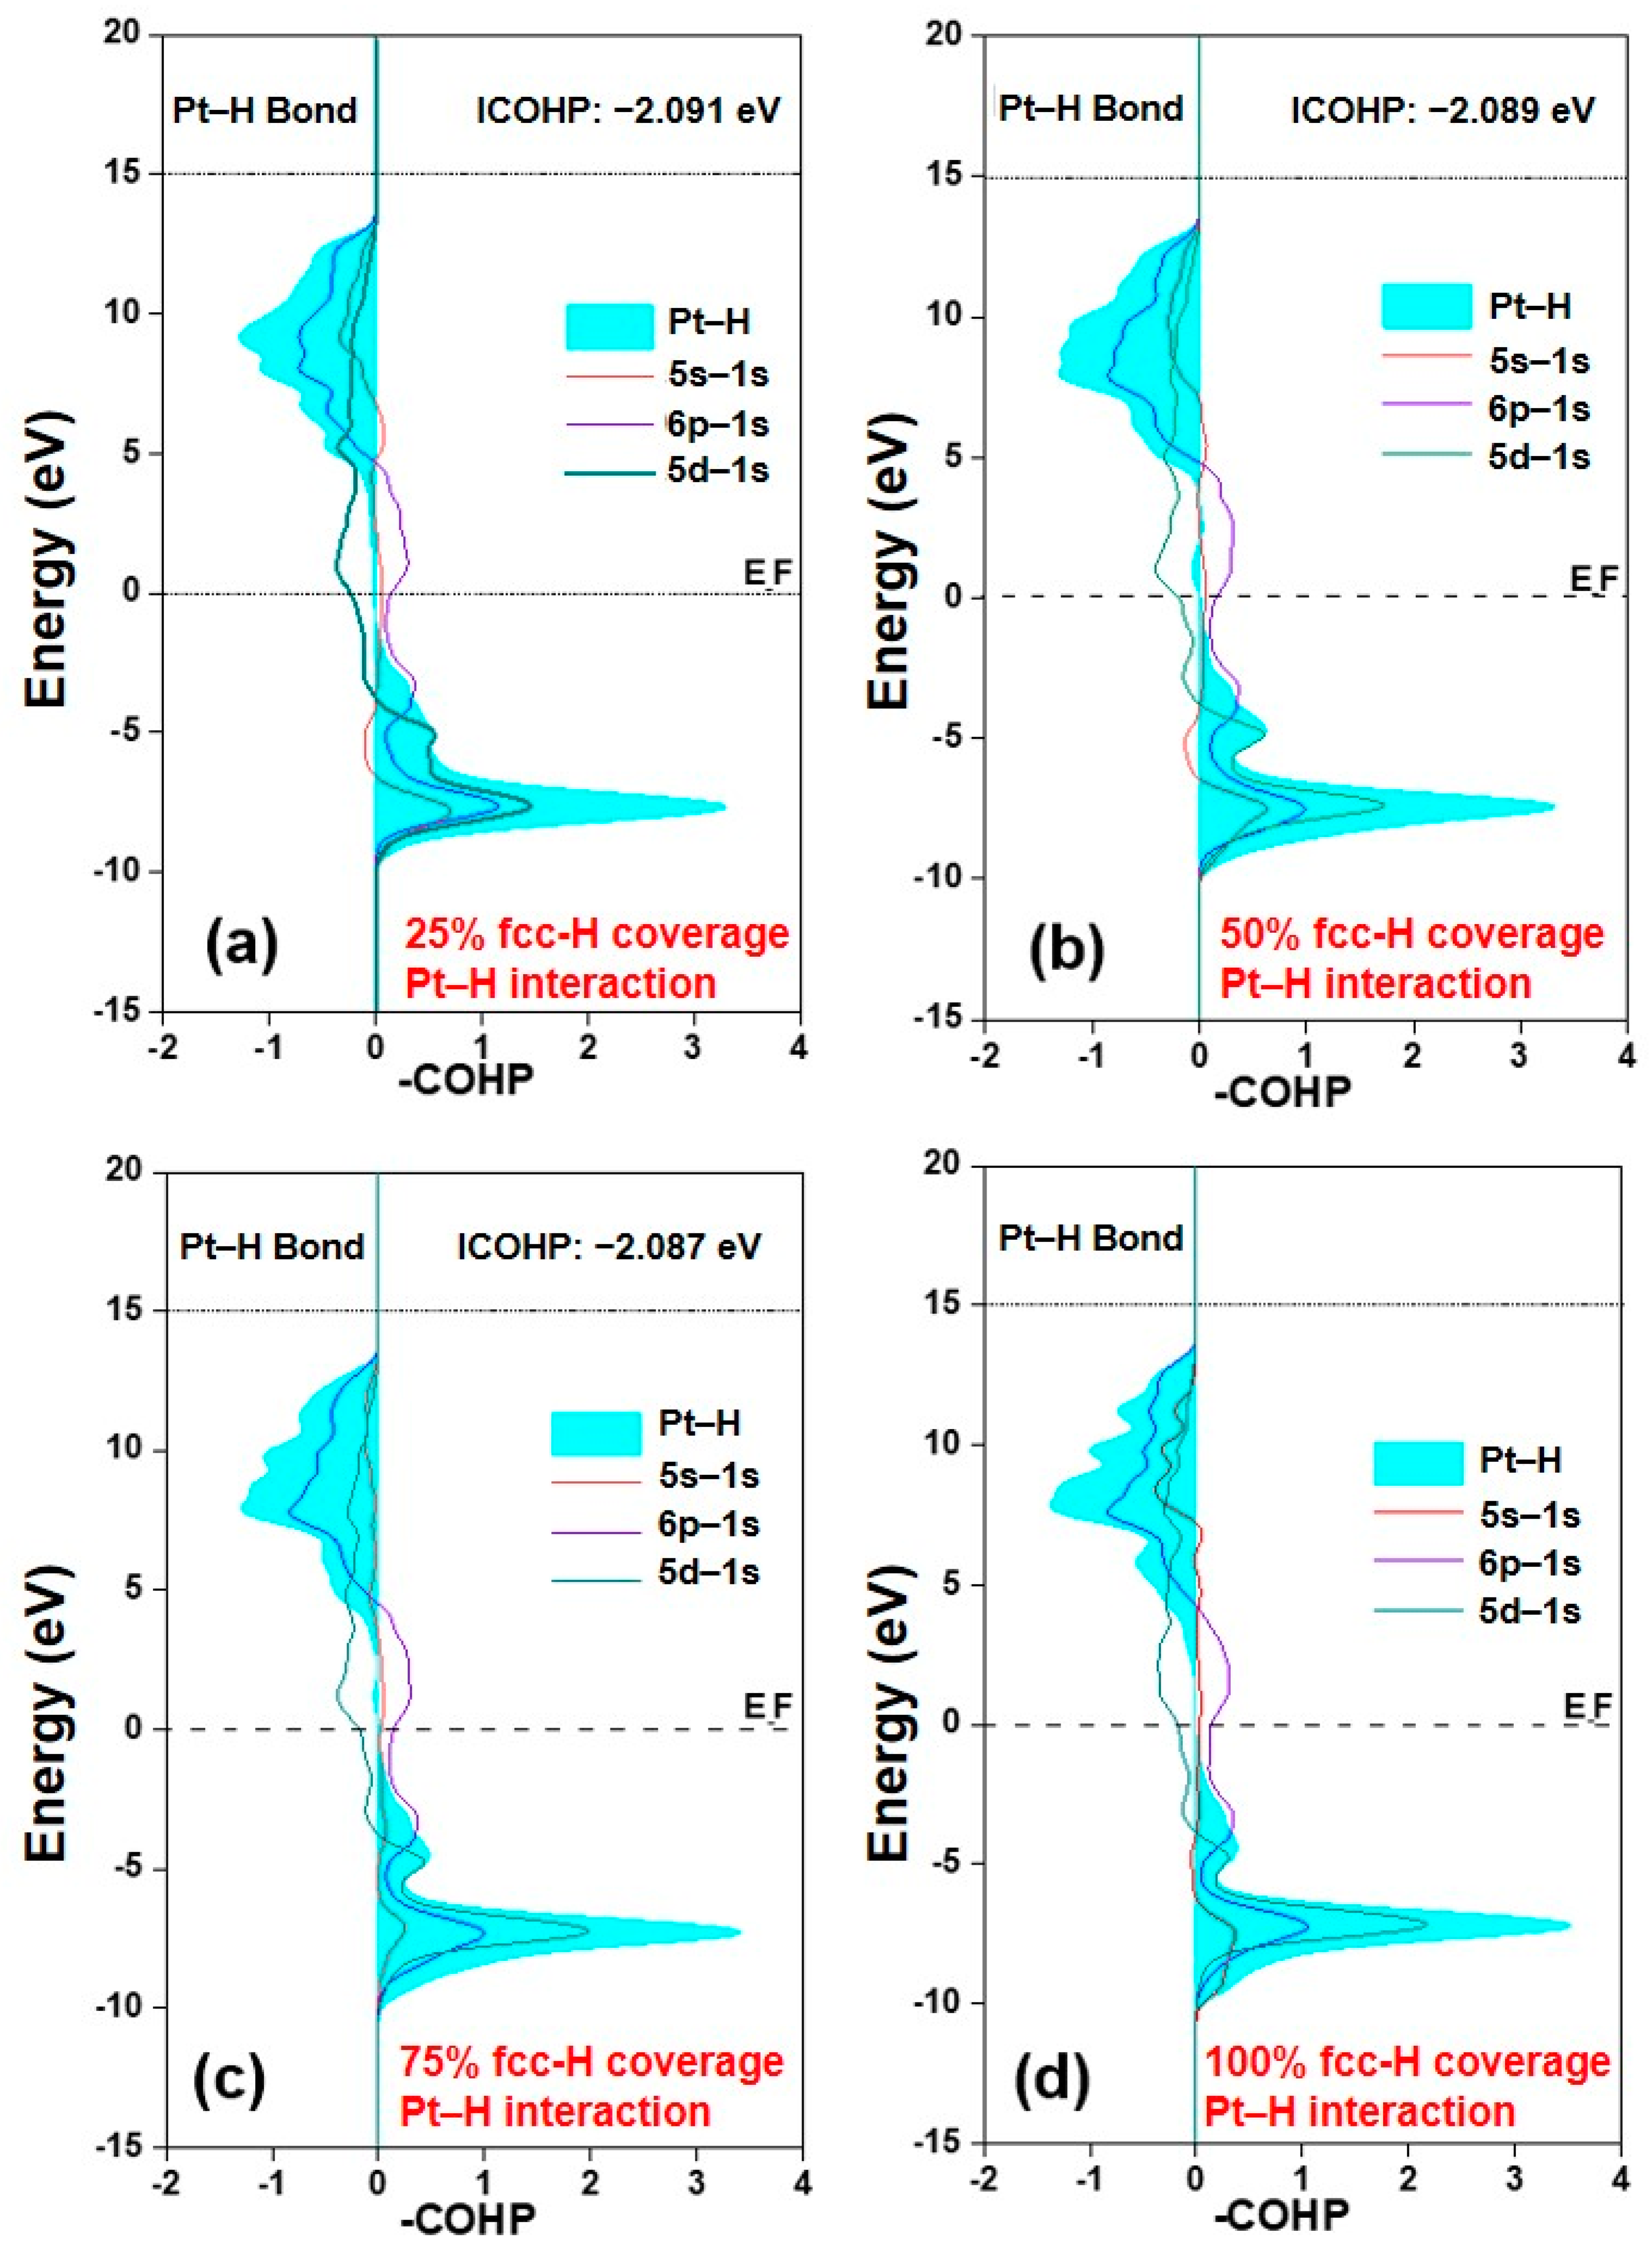
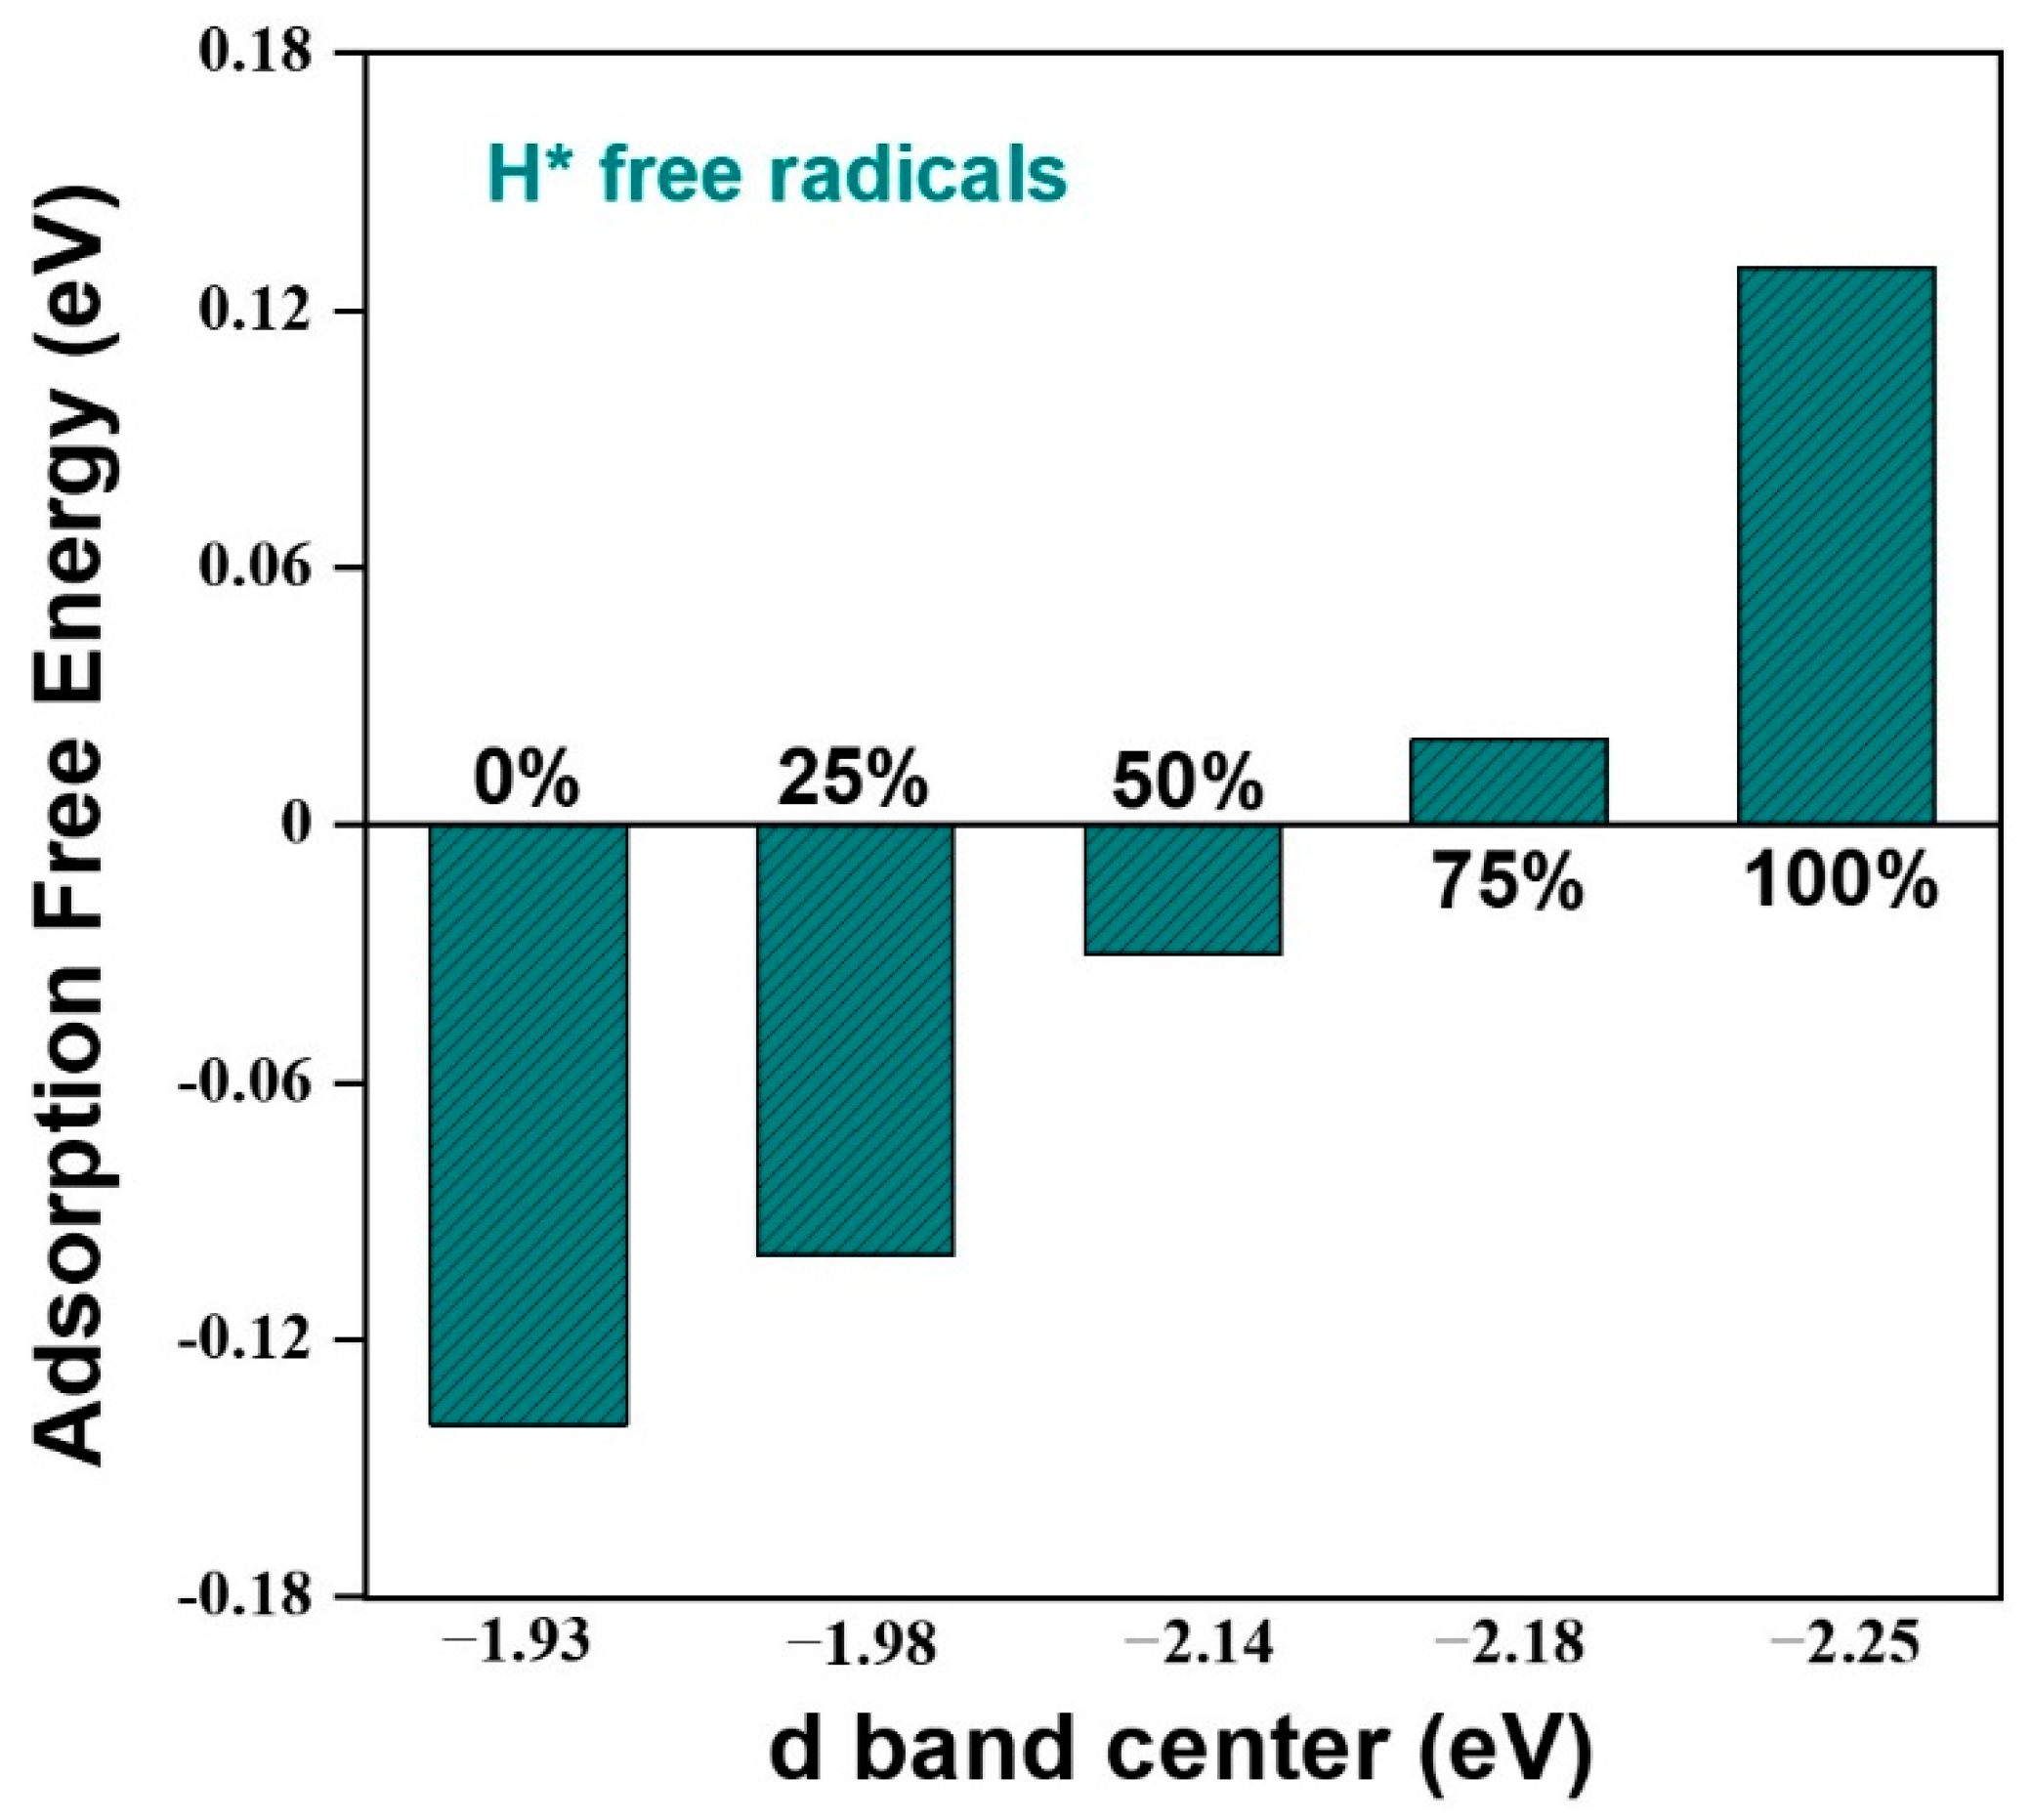
2.2. Regulation of the Electronic Properties of the Pt Surface by Hydrogen Coverage

We qualitatively covered different proportions of hydrogen atoms at the fcc position on the Pt (111) surface, regulating the d-band center position of the Pt (111) surface approaching Cu (111) (Figure S7, SI). We simulated the initial Pt (111) cell model with 0% to 100% fcc-H coverage (Figure 3) and listed the top 16 atoms, used the horizontal and vertical coordinates (x, y) to represent the Pt atoms at each specific position.
When simulating the electron transfer process, it is necessary to examine the binding information for Pt–H in different environments. We found that the energy band of H atoms is relatively diffuse and cannot be analyzed qualitatively, so we used the bond strength for analysis (Figure S8, SI). We calculated the negative-value crystal orbital Hamiltonian populations (–COHP) of the Pt–H bond under different fcc-H coverage rates (Figure 4). Among the four Pt–H bonding models, the differences in -ICOHP values (from −2.091 eV to −2.086 eV) are very small, so the stability of Pt–H bonding under different fcc-H coverage is similar. Moreover, the orbital hybridizations of the four Pt–H bonding models are also similar, which are mainly formed via the hybridization of the Pt atom 5s, 6p, and 5d orbitals with the H atom 1s orbital. Obviously, Pt(5d)–H(1s) contributes more to orbital hybridization than Pt(6p)–H(1s) and Pt(5s)–H(1s). Although Pt(5d)–H(1s) has the most influence on the bonding orbit below the Fermi level, a certain degree of anti-bonding orbiting also appears. Because the other two hybrid methods offset this effect, the overall state can still be considered a bonding orbit. Meanwhile, with the increase of the H coverage, the combination of Pt(5d) and H(1s) orbits increases, but the hybridization of the other two orbits becomes weaker, so the bonding strength of the Pt–H is generally maintained. Therefore, under different fcc-H coverage rates, all orbital hybridizations and bonding energies of Pt–H bonds are similar, providing the possibility to change the d-band center position gradually.
Next, we calculated the electron density values of the top three layers of the above models, and the d-band center positions of 16 Pt atoms on each surface were plotted as tables (Table S2, SI), along with the subsurface layer and the third layer atomic electron density information (Tables S3 and S4, SI). The electron density of Pt (111) without fcc-H coverage is uniform and the density information of each Pt atom is the same (Figure S9, SI). The table below shows the d-band center of 16 Pt atoms covered by 25% fcc-H in the surface layer. According to the adsorption theory, both –NO2 and –C2H3 groups are inclined to adsorb on the Pt atoms site where d-band center is closer to the Fermi level. In other words, they all preferentially adsorb on Pt atoms at (3.2) and (3.3), while Pt atoms at (2.2) are relatively less capable of adsorption competition. We analyzed the d-band center values for 50% fcc-H-covered Pt atoms. For the 75%, the –NO2 and –C2H3 groups preferentially adsorb at (3.2) and (3.3) positions, while for the 100%, due to the uniform distribution of electron density, the adsorption conditions of –NO2 and –C2H3 are consistent with that of 0% fcc-H, and they randomly adsorb on the two adjacent Pt atoms. (Table S2b–d, SI). It is worth noting that the average value for the d-band center positions of Pt atoms decreases with the increase of the fcc-H coverage (from −1.933 eV down to −2.246 eV), resulting in a gradual decrease of the adsorption energy.
Moreover, we found that in the system with the same coverage, the second- and third-layer Pt atoms have similar d-band center values for surface atoms, except that the difference between the highest and the lowest values becomes smaller as the atoms get deeper. The main function of the inner-layer atoms is to avoid huge electron changes in the surface layer and to relax together with the surface layer atoms to reduce the overall energy of the system [27]. Similarly, with the increase of fcc-H coverage, the d-band center value of the inner-layer Pt atoms also decreases (Tables S3 and S4, SI). Accordingly, by introducing protons into the Pt (111) slab, we can successfully regulate the d-band center positions of the Pt atoms gradually down to the position of the copper atoms, providing the ideal models to investigate the influence of the d-band center positions of Pt atoms on the catalytic process.

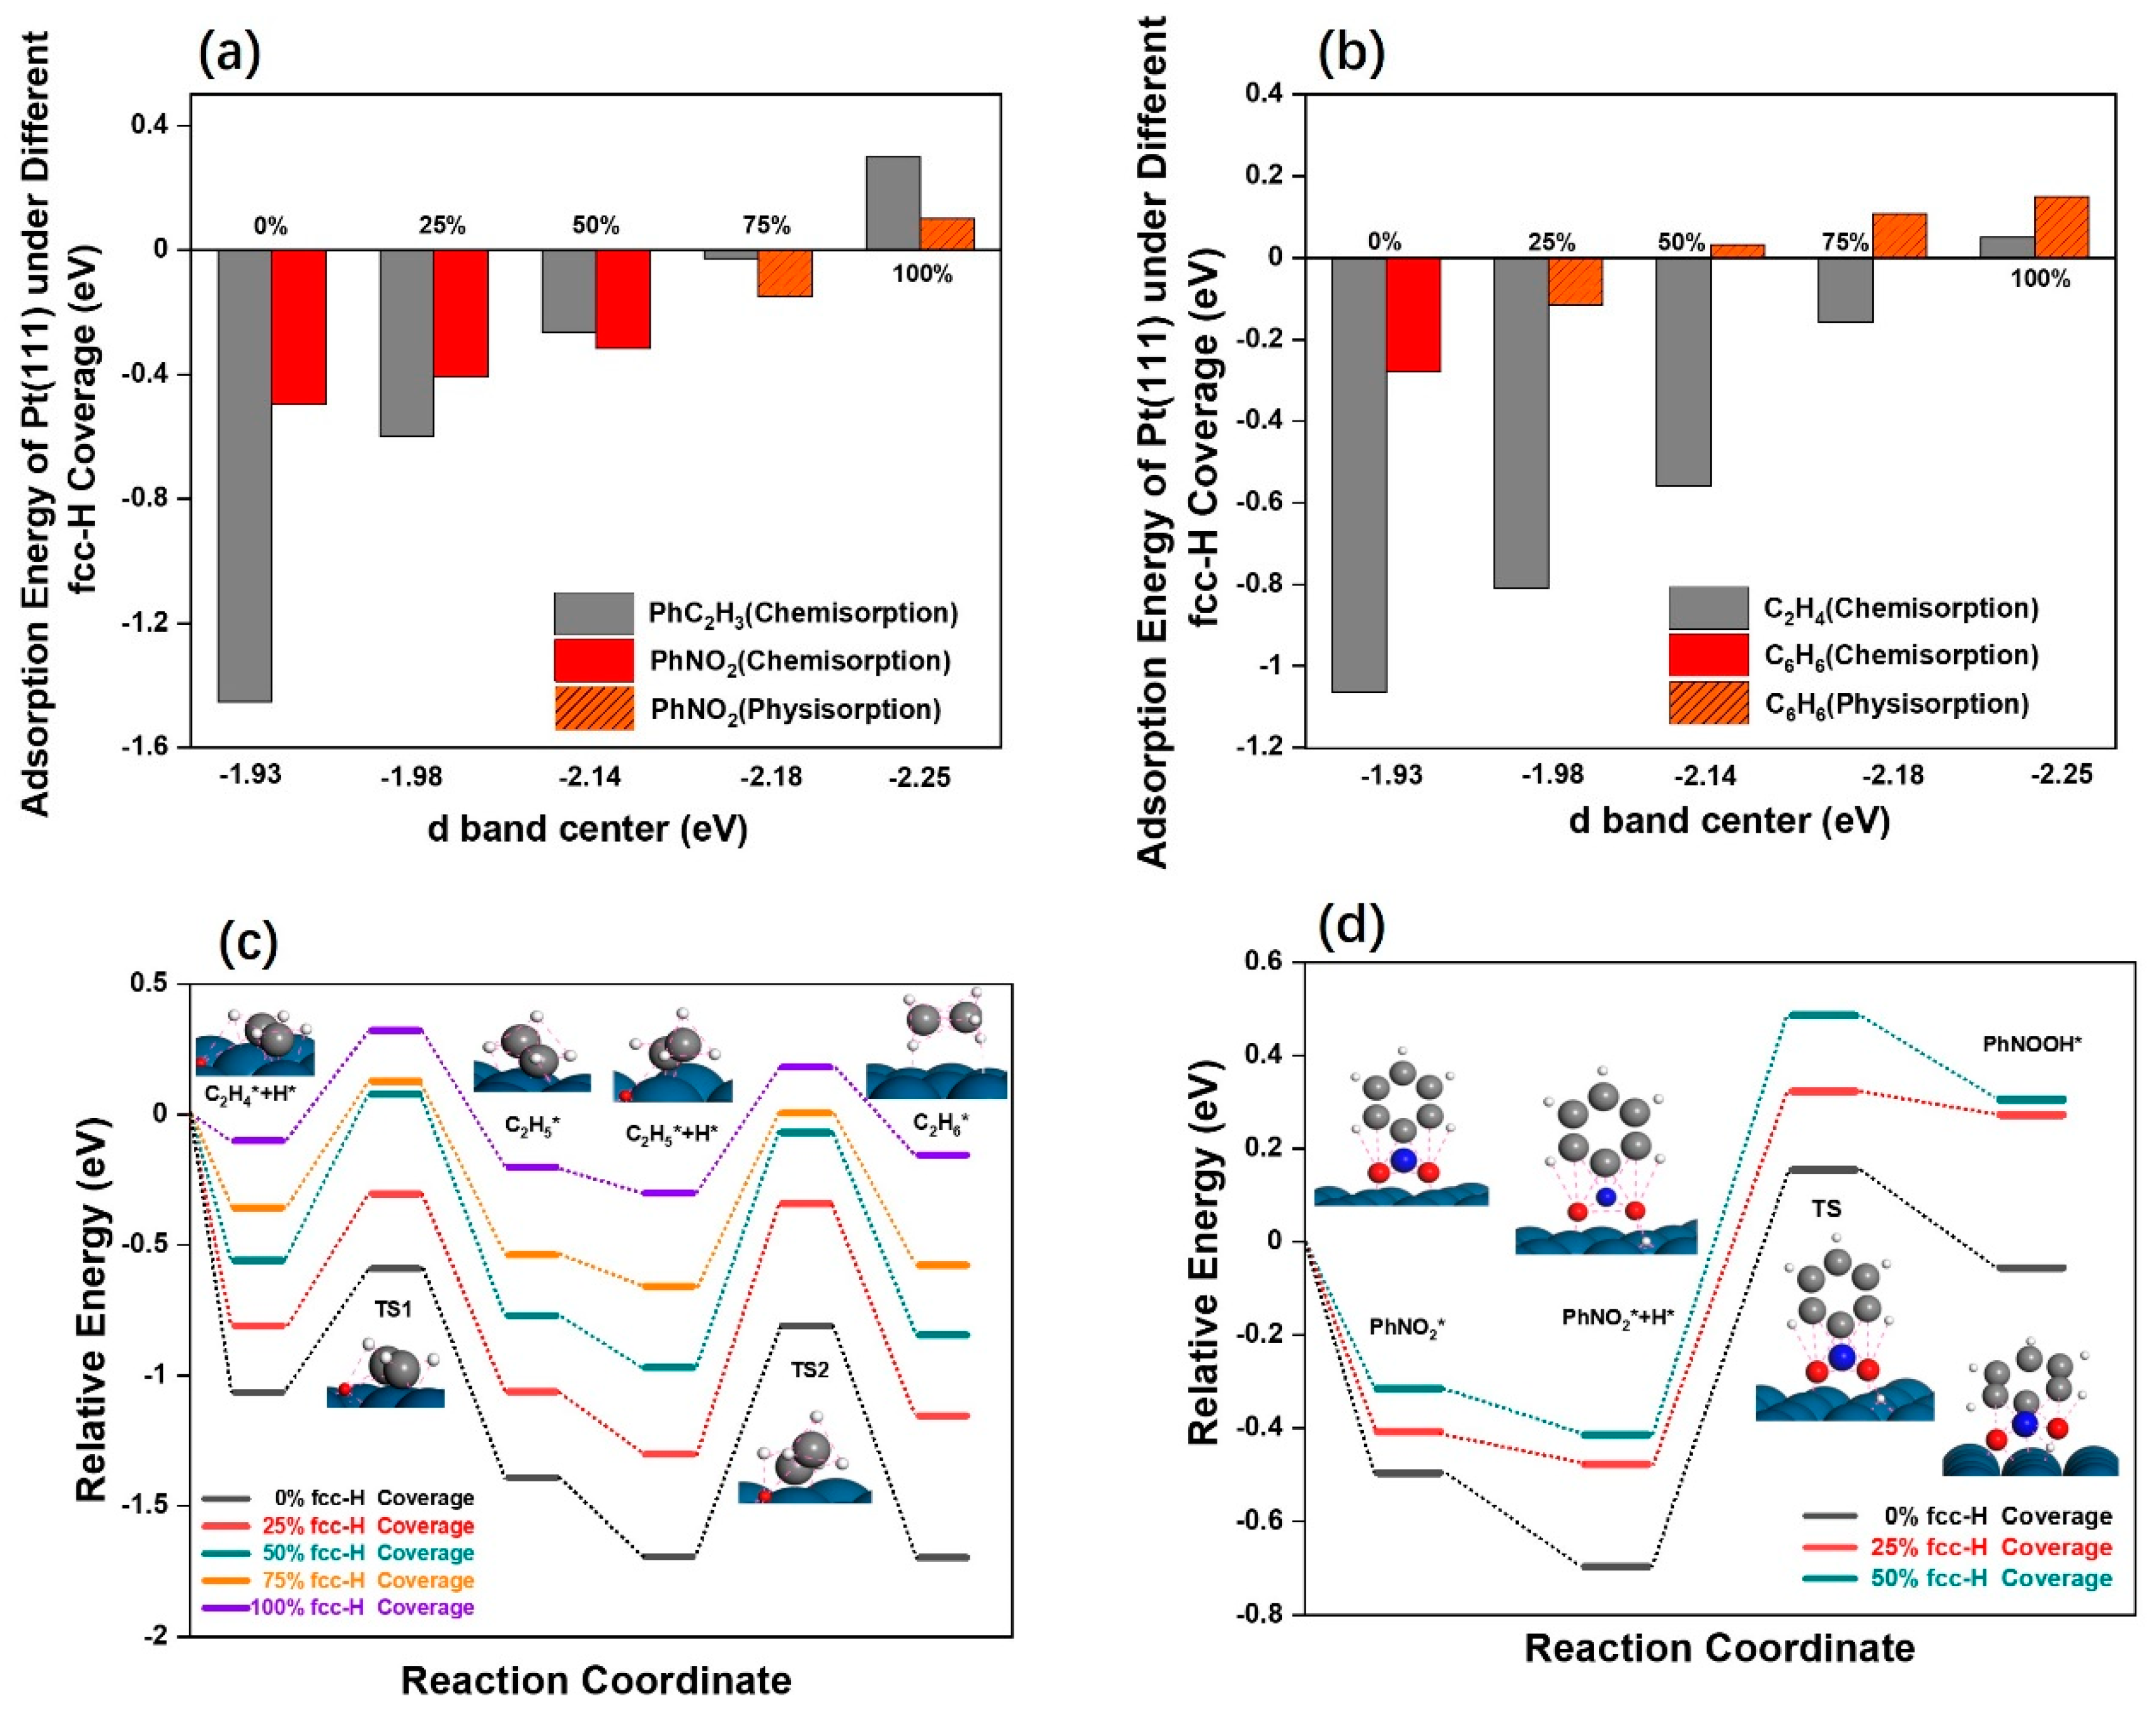
2.3. The Adsorption Energy and Reaction Path

In the selective hydrogenation of nitrostyrene, hydrogen molecules will undergo dissociation, adsorption, diffusion, desorption, and bonding steps [28]. Among these, the focus needs to be on the adsorption process, the strength of which should be moderate, which is beneficial to the subsequent steps [29]. For the process of hydrogen adsorption, the dissociation energy of hydrogen is very small [30], so in the process of DFT calculation, the energy from half of a H2 molecule and one H atom is often treated as approximately equivalent. Based on this, in order to study the adsorption properties of hydrogen under different models, we calculated the adsorption free energy at the top position. The fcc-H coverage on Pt can gradually increase the free energy of hydrogen radicals (Figure 5). Under 50% fcc-H coverage, the adsorption free energy is closest to 0, indicating that the adsorption strength of hydrogen radicals is moderate, facilitating hydrogen mass transfer on the catalyst.
Furthermore, the adsorption of reactants and the following hydrogenation reactions on the Pt (111) surface with different fcc-H coverage rates were investigated. In order to investigate the adsorption of different groups of nitrostyrene on the Pt surface under different H coverage rates, we selected six model adsorbents, i.e., PhNO2, PhC2H3, C2H4, C6H6, OH, and CH3. The adsorption energy values of PhC2H3 and PhNO2 gradually decreased with the increase of the fcc-H coverage, with the former declining faster than the latter (Figure 6). When the fcc-H coverage reached 75–100%, their adsorption changed to physisorption, with Pt–O, Pt–N, and Pt–C bond lengths > 3 Å (Figure S10, SI), which is insufficient to initiate the subsequent hydrogenation reaction. Although a high fcc-H coverage with a lower d-band center value benefits the hydrogenation selectivity, excessively high coverage (75–100%) leads to the weak physical adsorption of reactants on the Pt surface, resulting in very low reactivity. Therefore, the proper fcc-H coverage rate of 50%, which results in a relatively low d-band center position (−2.14 eV) and better chemisorption, is the ideal condition for the simulation of the selective hydrogenation.
As described above, the adsorption properties of PhC2H3 are influenced by both benzene and ethylene, so we calculated the relationship between their adsorption energy and fcc-H coverage percentage on the Pt surface (Figure 7b). The benzene rings (C6H6) can only chemisorb on the Pt surface without H coverage (0%). When the d-band center position of the Pt atoms is far away from the Fermi level, starting from the 25% fcc-H coverage, C6H6 can only physically adsorb on the Pt surface. In contrast, C2H4 (we chose C2H4 to represent PhC2H3, which was also adopted in other work [20], greatly simplifying the calculation cost) showed obvious chemisorption on the Pt surface, even when the fcc-H coverage reached 75%.
Based on the above results, we selected PhNO2 and C2H4 as probe reactants to investigate the hydrogenation reaction path on the Pt (111) surface with different fcc-H coverage rates. The change trends for the five reaction paths for C2H4 hydrogenation were similar. Obviously, the TS2 (transition state) step of the reaction is the rate-limiting step, in which there is a maximum energy barrier of 0.962 eV under 75% fcc-H coverage, and the energy barrier gaps among these five paths are very small (<0.15 eV) (Figure 6c and Figure S11, SI). Therefore, this energy barrier difference for the rate-limiting step has less effect on the thermal catalysis process for the five paths. Since the difference in adsorption energy values for the initial adsorbate under different fcc-H coverage rates exceeds 0.25 eV, which is much larger than the difference in the energy barrier, the initial adsorption energy is the most important factor in determining the reaction selectivity.
Since PhNO2 is physically adsorbed on the Pt surface when the fcc-H coverage rates reach 75% and 100%, they cannot undergo the subsequent hydrogenation reaction. Therefore, for PhNO2 hydrogenation, we only simulated the reaction paths at fcc-H coverage rates of 0%, 25%, and 50% (Figure 6d). For the nitro group hydrogenation, the difference in the energy barrier of the rate-limiting step is less than 0.1 eV among the five paths, which is much smaller than the difference in adsorption energy of 0.18 eV. Therefore, the adsorption strength of nitro group is still an important factor in determining selectivity. Based on the above calculations, the difference of the adsorption strength of –NO2 and –C2H3 on the Pt models with different d-band center positions determines the hydrogenation selectivity. In this work, the optimal fcc-H coverage percentage for high selectivity is 50% with the Pt atom d-band center value of −2.14 eV.
Based on the above demonstration, the modulation of the d-band center value to −2.14 eV shows the best performance for the selective hydrogenation. Since the metal atoms on the p-zone and its boundary can moderately reduce the d-band center positions of transition metals and will not excessively reduce the catalyst, as occurs with non-metallic doping, we selected several kinds of atoms (Cu, Au, Sn, Zn, Bi, and Ga) for doping (Figure 7a and Figure S12, SI) [31,32,33,34]. We can reasonably predict that Pt3Sn1 and Pt3Zn1 show d-band center values closest to the ideal value, and should have high selectivity and conversion efficiency (Figure S13, SI). Taking Pt3Sn1 and Pt3Zn1 as an example (Figure 7b), the Pt3Sn1 adsorption energies for nitrobenzene and ethylene are −0.619 eV and −0.323 eV, respectively, which are much better than the values of −0.633 eV and −1.676 eV observed on the surface of pure Pt. The performance of Pt3Zn1 is better, with adsorption energies of −0.62 eV and −0.25 eV for PhNO2 and C2H4, respectively. In addition, the hydrogen radical adsorption free energy values for Pt3Sn1 and Pt3Zn1 are −0.095 eV and −0.055 eV, respectively, which are beneficial to heterogeneous catalysis. This example confirms our prediction and meets our screening expectations.
Recently, PtZn alloys have achieved great success in the selective hydrogenation of nitrobenzene [35]. In order to verify our inference, and in view of the fact that PtSn alloy also has better theoretical hydrogenation selectivity (Table S5, SI), we prepared the PtSn/CN (CN refers to nitrogen-doped carbon nanosheets) catalyst and carried out selective hydrogenation experiments of 3-nitrostyrene at different temperatures. The results showed that the catalyst was uniformly loaded and the alloy had a high dispersion degree and good crystallinity (Figure 8a–d). The particle size distribution was much larger than 2 nm, which is enough to form nanocrystalline planes (Figure S14, SI). In the selective hydrogenation experiment with nitrostyrene, it had high selectivity (>99%) when the hydrogen pressure was 8 bar and the temperature was 40 °C. Before Sn atoms were incorporated, Pt/CN had only 26% selectivity under the same conditions. The reaction selectivity for 2-nitrostyrene and 4-nitrostyrene both exceeded 99% (Tables S6 and S7, SI). Moreover, the catalytic activity was suppressed very slightly, which is in line with our theoretical guidance experiment expectations (Figure 8e and Figure S15, Table S1, SI). It is worth noting that CN has no intrinsic catalytic activity at low temperatures (Table S8, SI).

3. Conclusions

In this work, the optimal transition metal catalysts for selective hydrogenation were first screened by comparing the adsorption energy values of two ideal models, nitrobenzene and styrene, and by correlating the adsorption energy values with the d-band center value. Among the calculated transition metals, Pt showed the best catalytic performance. Then, the surface hydrogen coverage strategy was used to decrease the d-band center position of the Pt (111) surface. This approach can selectively enhance the nitro group adsorption, however excessively high H coverage (75% or 100%) with an insufficiently low d-band center position leads to the physisorption of nitro groups, significantly reducing the catalytic activity. Therefore, a moderate d-band center shift (ca. −2.14 eV) results in both high selectivity and catalytic conversion. In addition, the optimal d-band center shift can be achieved by constructing alloys, such as PtZn and PtSn. This work provides the relationship between the d-band center position and hydrogenation selectivity, which will guide the rational design and fabrication of high-performance heterogeneous catalysts.

Supplementary Materials

The following are available online at https://www.mdpi.com/2073-4344/10/12/1473/s1, Figure S1: Models of (a) Ni (111), (b) Pd (111), (c) Ag (111), (d) Ir (111), (e) Au (111), (f) Fe (110), (g) Rh (111), (h) Ru (0001), (i) Pt (111), (j) Cu (111) surfaces, Table S1: Nitrobenzene and styrene are adsorbed stably on different metal surfaces. (a) PhNO2/Ru, (b) PhC2H3/Ru, (c) PhNO2/Ni, (d) PhC2H3/Ni, (e) PhNO2/Rh, (f) PhC2H3/Rh, (g) PhNO2/Pd, (h) PhC2H3/Pd, (i) PhNO2/Fe, (j) PhC2H3/Fe, (k) PhNO2/Ir, (l) PhC2H3/Ir, (m) PhNO2/Pt, (n) PhC2H3/Pt, (o) PhNO2/Cu, (p) PhC2H3/Cu, (q) PhNO2/Au, (r) PhC2H3/Au, (s) PhNO2/Ag, (t) PhC2H3/Ag, Table S1: Adsorption parameters of H and H2 on Pt (111) and Cu (111), Figure S3: The models of H atoms adsorbed on the top (a), hcp (b) and fcc (c) positions of Pt (111), and pure Pt (111) slab (d), Figure S4: The models of H2 molecules adsorbed on Cu (111) (a) and Pt (111) (b) surface, Figure S5: The models of H atoms adsorbed on the hcp (a) and fcc (b) positions of Cu (111), and pure Cu (111) slab (c), Figure S6: Schematic diagram of nitrobenzene and styrene adsorbed on Au and Ag. PhNO2/Au (a), PhC2H3/Au (b), PhNO2/Ag (c), PhC2H3 (d), Figure S7: Schematic diagram of the coverage of fcc-H atoms, Figure S8: Density of states of Pt (111) surface with 0% (a), 25% (b), 50% (c), 75% (d) and 100% (e) fcc-H coverage, Table S2: The d-band center of Pt atoms covered by fcc-H in the surface layer of 25% (a), 50% (b), 75% (c), and 100% (d), respectively, Table S3: The d-band center of Pt atoms covered by fcc-H in the second layer of 25% (a), 50% (b), 75% (c), and 100% (d), respectively, Table S4: The d-band center of Pt atoms covered by fcc-H in the third layer of 25% (a), 50% (b), 75% (c), and 100% (d), respectively, Figure S9: The density of states of Pt (111) without fcc-coverage, Figure S10: Schematic diagram of nitrobenzene adsorbed on Pt (111) with 75% (a) and 100% (b) fcc-H coverage, Figure S11: Schematic diagram of the reaction path of ethylene on Pt (111) under different fcc-H coverage, Figure S12: Pt-based alloys: (a)Pt7Cu1; (b) Pt1Cu1; (c) Pt1Au1; (d) Pt1Bi1; (e)Pt5Ga3, Figure S14: Transmission electron microscope (TEM) images of Pt/CN in different scales (a)50 nm, (b)10 nm, Figure S15: PtSn catalyst particle size distribution diagram. Table S5: The d-band center of Pt alloy at 0% and 100% fcc-H coverage, Table S6: Comparison of the activity and selectivity with traditional research, Table S7: Reaction data of other reactants, Table S8: Support catalytic performance, General Computational Details, Experimantal Section.

Author Contributions

T.W. carried out the DFT calculation and wrote the draft of the manuscript. L.P. and X.Z. conceived and designed the experiment, J.-J.Z. performed the experiments; T.W., J.-J.Z., L.P. analyzed the data. The manuscript was reviewed, and edited by T.W., L.P., X.Z., J.-J.Z. All authors have read and agreed to the published version of the manuscript.

Funding

This research was funded by [the Scientific Research Projects of the Ministry of Education of China] grant number [6141A02033522] and [the National Natural Science Foundation of China] grant number [21978200]. And The APC was funded by [the National Natural Science Foundation of China, and Tianzuo Wang].

Acknowledgments

The authors appreciate the support from the Scientific Research Projects of the Ministry of Education of China (6141A02033522) and the National Natural Science Foundation of China (21978200).

Conflicts of Interest

The authors declare no competing financial interest.

References

  1. Dzade, N.Y. CO2 and H2O Coadsorption and Reaction on the Low-Index Surfaces of Tantalum Nitride: A First-Principles DFT-D3 Investigation. Catalysts 2020, 10, 1217. [Google Scholar] [CrossRef]
  2. Lou, Y.; Zheng, Y.; Li, X.; Ta, N.; Xu, J.; Nie, Y.; Cho, K.; Liu, J. Pocketlike Active Site of Rh1/MoS2 Single-Atom Catalyst for Selective Crotonaldehyde Hydrogenation. J. Am. Chem. Soc. 2019, 141, 19289–19295. [Google Scholar] [CrossRef] [PubMed]
  3. Zhu, X.; Guo, Q.; Sun, Y.; Chen, S.; Wang, J.-Q.; Wu, M.; Fu, W.; Tang, Y.; Duan, X.; Chen, D.; et al. Optimising surface d charge of AuPd nanoalloy catalysts for enhanced catalytic activity. Nat. Commun. 2019, 10, 1428. [Google Scholar] [CrossRef] [PubMed] [Green Version]
  4. Ferri, P.; Li, C.; Paris, C.; Vidal-Moya, A.; Moliner, M.; Boronat, M.; Corma, A. Chemical and Structural Parameter Connecting Cavity Architecture, Confined Hydrocarbon Pool Species, and MTO Product Selectivity in Small-Pore Cage-Based Zeolites. ACS Catal. 2019, 9, 11542–11551. [Google Scholar] [CrossRef]
  5. Blaser, H.-U. CHEMISTRY: A Golden Boost to an Old Reaction. Science 2006, 313, 312–313. [Google Scholar] [CrossRef] [PubMed]
  6. Hamm, G.; Schmidt, T.; Breitbach, J.; Franke, D.; Becker, C.; Wandelt, K. The Adsorption of Ethene on Pd(111) and Ordered Sn/Pd(111) Surface Alloys. Zeitschrift Phys. Chem. 2009, 223, 209–232. [Google Scholar] [CrossRef]
  7. Downing, R.; Kunkeler, P.; Van Bekkum, H. Catalytic syntheses of aromatic amines. Catal. Today 1997, 37, 121–136. [Google Scholar] [CrossRef]
  8. Blaser, H.-U.; Steiner, H.; Studer, M. Selective Catalytic Hydrogenation of Functionalized Nitroarenes: An Update. ChemCatChem 2009, 1, 210–221. [Google Scholar] [CrossRef]
  9. Zhang, L.; Zhou, M.; Wang, A.; Zhang, T. Selective Hydrogenation over Supported Metal Catalysts: From Nanoparticles to Single Atoms. Chem. Rev. 2020, 120, 683–733. [Google Scholar] [CrossRef]
  10. Corma, A. Chemoselective Hydrogenation of Nitro Compounds with Supported Gold Catalysts. Science 2006, 313, 332–334. [Google Scholar] [CrossRef]
  11. Shimizu, K.-I.; Miyamoto, Y.; Kawasaki, T.; Tanji, T.; Tai, Y.; Satsuma, A. Chemoselective Hydrogenation of Nitroaromatics by Supported Gold Catalysts: Mechanistic Reasons of Size- and Support-Dependent Activity and Selectivity. J. Phys. Chem. C 2009, 113, 17803–17810. [Google Scholar] [CrossRef]
  12. Berguerand, C.; Yarulin, A.; Cárdenas-Lizana, F.; Wärnå, J.; Sulman, E.; Murzin, D.Y.; Kiwi-Minsker, L. Chemoselective Liquid Phase Hydrogenation of 3-Nitrostyrene over Pt Nanoparticles: Synergy with ZnO Support. Ind. Eng. Chem. Res. 2015, 54, 8659–8669. [Google Scholar] [CrossRef]
  13. Furukawa, S.; Takahashi, K.; Komatsu, T. Well-structured bimetallic surface capable of molecular recognition for chemoselective nitroarene hydrogenation† †Electronic supplementary information (ESI) available: FT-IR spectra, recycling test, kinetic studies, and DFT calculations. Chem. Sci. 2016, 7, 4476–4484. [Google Scholar] [CrossRef] [PubMed] [Green Version]
  14. Serna, P.; Corma, A. Transforming Nano Metal Nonselective Particulates into Chemoselective Catalysts for Hydrogenation of Substituted Nitrobenzenes. ACS Catal. 2015, 5, 7114–7121. [Google Scholar] [CrossRef]
  15. Hammer, B.; Nørskov, J. Theoretical Surface Science and Catalysis—Calculations and Concepts; Elsevier: Amsterdam, The Netherlands, 2000; Volume 45, pp. 71–129. [Google Scholar]
  16. Zhang, Z.; Li, Y.-L.; Gu, J.; Ding, L.; Xue, N.; Peng, L.; Guo, X.; Zhu, Y.; Ma, J.; Ding, W. The effect of electrostatic field on the catalytic properties of platinum clusters confined in zeolite for hydrogenation. Catal. Sci. Technol. 2018, 8, 6384–6395. [Google Scholar] [CrossRef]
  17. Romero, A.H.; Cerecetto, H. A Common, Facile and Eco-Friendly Method for the Reduction of Nitroarenes, Selective Reduction of Poly-Nitroarenes and Deoxygenation of N -Oxide Containing Heteroarenes Using Elemental Sulfur. Eur. J. Org. Chem. 2020, 2020, 1853–1865. [Google Scholar] [CrossRef]
  18. He, D.; Song, X.; Li, W.; Tang, C.; Liu, J.; Ke, Z.; Jiang, C.; Xiao, X. Inside Back Cover: Active Electron Density Modulation of Co3O4-Based Catalysts Enhances their Oxygen Evolution Performance (Angew. Chem. Int. Ed. 17/2020). Angew. Chem. Int. Ed. 2020, 59, 6936. [Google Scholar] [CrossRef]
  19. Formenti, D.; Ferretti, F.; Scharnagl, F.K.; Beller, M. Reduction of Nitro Compounds Using 3d-Non-Noble Metal Catalysts. Chem. Rev. 2019, 119, 2611–2680. [Google Scholar] [CrossRef]
  20. Mao, J.; Chen, W.; Sun, W.; Chen, Z.; Pei, J.; He, D.; Lv, C.; Wang, D.; Li, Y. Rational Control of the Selectivity of a Ruthenium Catalyst for Hydrogenation of 4-Nitrostyrene by Strain Regulation. Angew. Chem. Int. Ed. 2017, 56, 11971–11975. [Google Scholar] [CrossRef]
  21. Trandafir, M.M.; Pop, L.; Hădade, N.D.; Florea, M.; Neatu, F.; Teodorescu, C.M.; Duraki, B.; Van Bokhoven, J.A.; Grosu, I.; Parvulescu, V.; et al. An adamantane-based COF: Stability, adsorption capability, and behaviour as a catalyst and support for Pd and Au for the hydrogenation of nitrostyrene. Catal. Sci. Technol. 2016, 6, 8344–8354. [Google Scholar] [CrossRef]
  22. Wei, C.; Sun, Y.; Scherer, G.G.; Fisher, A.C.; Sherburne, M.P.; Ager, J.W.; Xu, Z.J. Surface Composition Dependent Ligand Effect in Tuning the Activity of Nickel–Copper Bimetallic Electrocatalysts toward Hydrogen Evolution in Alkaline. J. Am. Chem. Soc. 2020, 142, 7765–7775. [Google Scholar] [CrossRef] [PubMed]
  23. Zhang, J.; Gao, Z.; Wang, S.; Wang, G.; Gao, X.; Zhang, B.; Xing, S.; Zhao, S.; Qin, Y. Origin of synergistic effects in bicomponent cobalt oxide-platinum catalysts for selective hydrogenation reaction. Nat. Commun. 2019, 10, 1–8. [Google Scholar] [CrossRef] [PubMed]
  24. Macino, M.; Barnes, A.J.; Althahban, S.M.; Qu, R.; Gibson, E.K.; Morgan, D.J.; Freakley, S.J.; Dimitratos, N.; Kiely, C.J.; Gao, X.; et al. Tuning of catalytic sites in Pt/TiO2 catalysts for the chemoselective hydrogenation of 3-nitrostyrene. Nat. Catal. 2019, 2, 873–881. [Google Scholar] [CrossRef]
  25. Zhu, J.; Hu, L.; Zhao, P.; Lee, L.Y.S.; Wong, K.-Y. Recent Advances in Electrocatalytic Hydrogen Evolution Using Nanoparticles. Chem. Rev. 2020, 120, 851–918. [Google Scholar] [CrossRef] [PubMed]
  26. Shi, X.-L.; Zou, J.; Chen, Z. Advanced Thermoelectric Design: From Materials and Structures to Devices. Chem. Rev. 2020, 120, 7399–7515. [Google Scholar] [CrossRef] [PubMed]
  27. Mu, R.; Fu, Q.; Xu, H.; Zhang, H.; Huang, Y.; Jiang, Z.; Zhang, S.; Tan, D.; Bao, X. Synergetic Effect of Surface and Subsurface Ni Species at Pt−Ni Bimetallic Catalysts for CO Oxidation. J. Am. Chem. Soc. 2011, 133, 1978–1986. [Google Scholar] [CrossRef]
  28. She, W.; Qi, T.; Cui, M.; Yan, P.; Ng, S.W.; Li, W.; Li, G.; Weng, N.S. High Catalytic Performance of a CeO2-Supported Ni Catalyst for Hydrogenation of Nitroarenes, Fabricated via Coordination-Assisted Strategy. ACS Appl. Mater. Interfaces 2018, 10, 14698–14707. [Google Scholar] [CrossRef]
  29. Liu, L.; Corma, A. Metal Catalysts for Heterogeneous Catalysis: From Single Atoms to Nanoclusters and Nanoparticles. Chem. Rev. 2018, 118, 4981–5079. [Google Scholar] [CrossRef] [Green Version]
  30. Peng, Y.; Geng, Z.; Zhao, S.; Wang, L.; Li, H.; Wang, X.; Zheng, X.; Zhu, J.; Li, Z.; Si, R.; et al. Pt Single Atoms Embedded in the Surface of Ni Nanocrystals as Highly Active Catalysts for Selective Hydrogenation of Nitro Compounds. Nano Lett. 2018, 18, 3785–3791. [Google Scholar] [CrossRef]
  31. Takigawa, I.; Shimizu, K.-I.; Tsuda, K.; Takakusagi, S. Machine-learning prediction of the d-band center for metals and bimetals. RSC Adv. 2016, 6, 52587–52595. [Google Scholar] [CrossRef] [Green Version]
  32. Vandichel, M.; Grönbeck, H. A dimer path for CO dissociation on PtSn. Catal. Sci. Technol. 2019, 9, 695–701. [Google Scholar] [CrossRef] [Green Version]
  33. Chen, C.; Sun, M.; Hu, Z.-P.; Ren, J.-T.; Zhang, S.; Yuan, Z.-Y. New insight into the enhanced catalytic performance of ZnPt/HZSM-5 catalysts for direct dehydrogenation of propane to propylene. Catal. Sci. Technol. 2019, 9, 1979–1988. [Google Scholar] [CrossRef]
  34. Yoo, S.J.; Kim, S.-K.; Jeon, T.-Y.; Hwang, S.J.; Lee, J.-G.; Lee, S.-C.; Lee, K.-S.; Cho, Y.-H.; Sung, Y.-E.; Lim, T.-H. Enhanced stability and activity of Pt–Y alloy catalysts for electrocatalytic oxygen reduction. Chem. Commun. 2011, 47, 11414–11416. [Google Scholar] [CrossRef]
  35. Han, A.; Zhang, J.; Sun, W.; Chen, W.; Zhang, S.; Han, Y.; Feng, Q.; Zheng, L.; Gu, L.; Chen, C.; et al. Isolating contiguous Pt atoms and forming Pt-Zn intermetallic nanoparticles to regulate selectivity in 4-nitrophenylacetylene hydrogenation. Nat. Commun. 2019, 10, 1–7. [Google Scholar] [CrossRef]
Figure 1. Molecular structures of styrene (a), nitrobenzene (b), and 3-nitrostyrene (c). The gray, white, red, and blue balls represent C, H, O, and N, respectively.
Catalysts 10 01473 g001
Figure 2. (a) The relative adsorption energies of PhNO2 and PhC2H3 on different transition metals, using Pt as the benchmark. Pt (111) is located at (0.0) (Table S2, SI), based on which the lower left region is the ideal region. (b) The adsorption energy trends for PhNO2 and PhC2H3 on different metals with the change of the d-band center positions of the metal surface atoms.
Catalysts 10 01473 g002
Figure 3. Schematic diagram of hydrogen atoms on the Pt (111) surface with 0% (a), 25% (b), 50% (c), 75% (d), and 100% (e) fcc-H coverage. The blue and orange balls represent the Pt and H atoms, respectively.
Catalysts 10 01473 g003
Figure 4. The negative-value crystal orbital Hamiltonian populations of Pt–H bonds at 25% (a), 50% (b), 75% (c), and 100% (d) fcc-H coverage.
Catalysts 10 01473 g004
Figure 5. The adsorption free energy values of hydrogen atoms on different d-band central atoms.
Catalysts 10 01473 g005
Figure 6. The adsorption energy values of PhNO2 and PhC2H3 (a) and of C2H4 and C6H6 (b) on Pt atoms with different fcc-H coverage rates. (c) The reaction path of C2H4 hydrogenation on Pt atoms with different fcc-H coverage rates. (d) The first-step hydrogenation reaction path of PhNO2 on Pt atoms with 0%, 25% and 50% fcc-H coverage.
Catalysts 10 01473 g006
Figure 7. (a) The d-band center values of different Pt-based alloys. (b) The adsorption performances of pure Pt, Pt3Sn1, and Pt3Zn1 on PhNO2, C2H4, and H*, respectively.
Catalysts 10 01473 g007
Figure 8. Transmission electron microscope (TEM) images of PtSn/CN at different scales: (a) 50 nm; (b) 10 nm. Scan of the atomic distribution of Pt and Sn on the TEM: (c) Pt; (d) Sn. (e) The hydrogenation performance results of Pt/CN and PtSn/CN catalytic nitrostyrenes on 40 min at 40 °C with 8 bar hydrogen pressure.
Catalysts 10 01473 g008
Publisher’s Note: MDPI stays neutral with regard to jurisdictional claims in published maps and institutional affiliations.

