Modified Hydrothermal Route for Synthesis of Photoactive Anatase TiO2/g-CN Nanotubes from Sludge Generated TiO2

 ,
,  , , , and
Abstract
:1. Introduction
2. Results and Discussion
2.1. Morphological Attributes
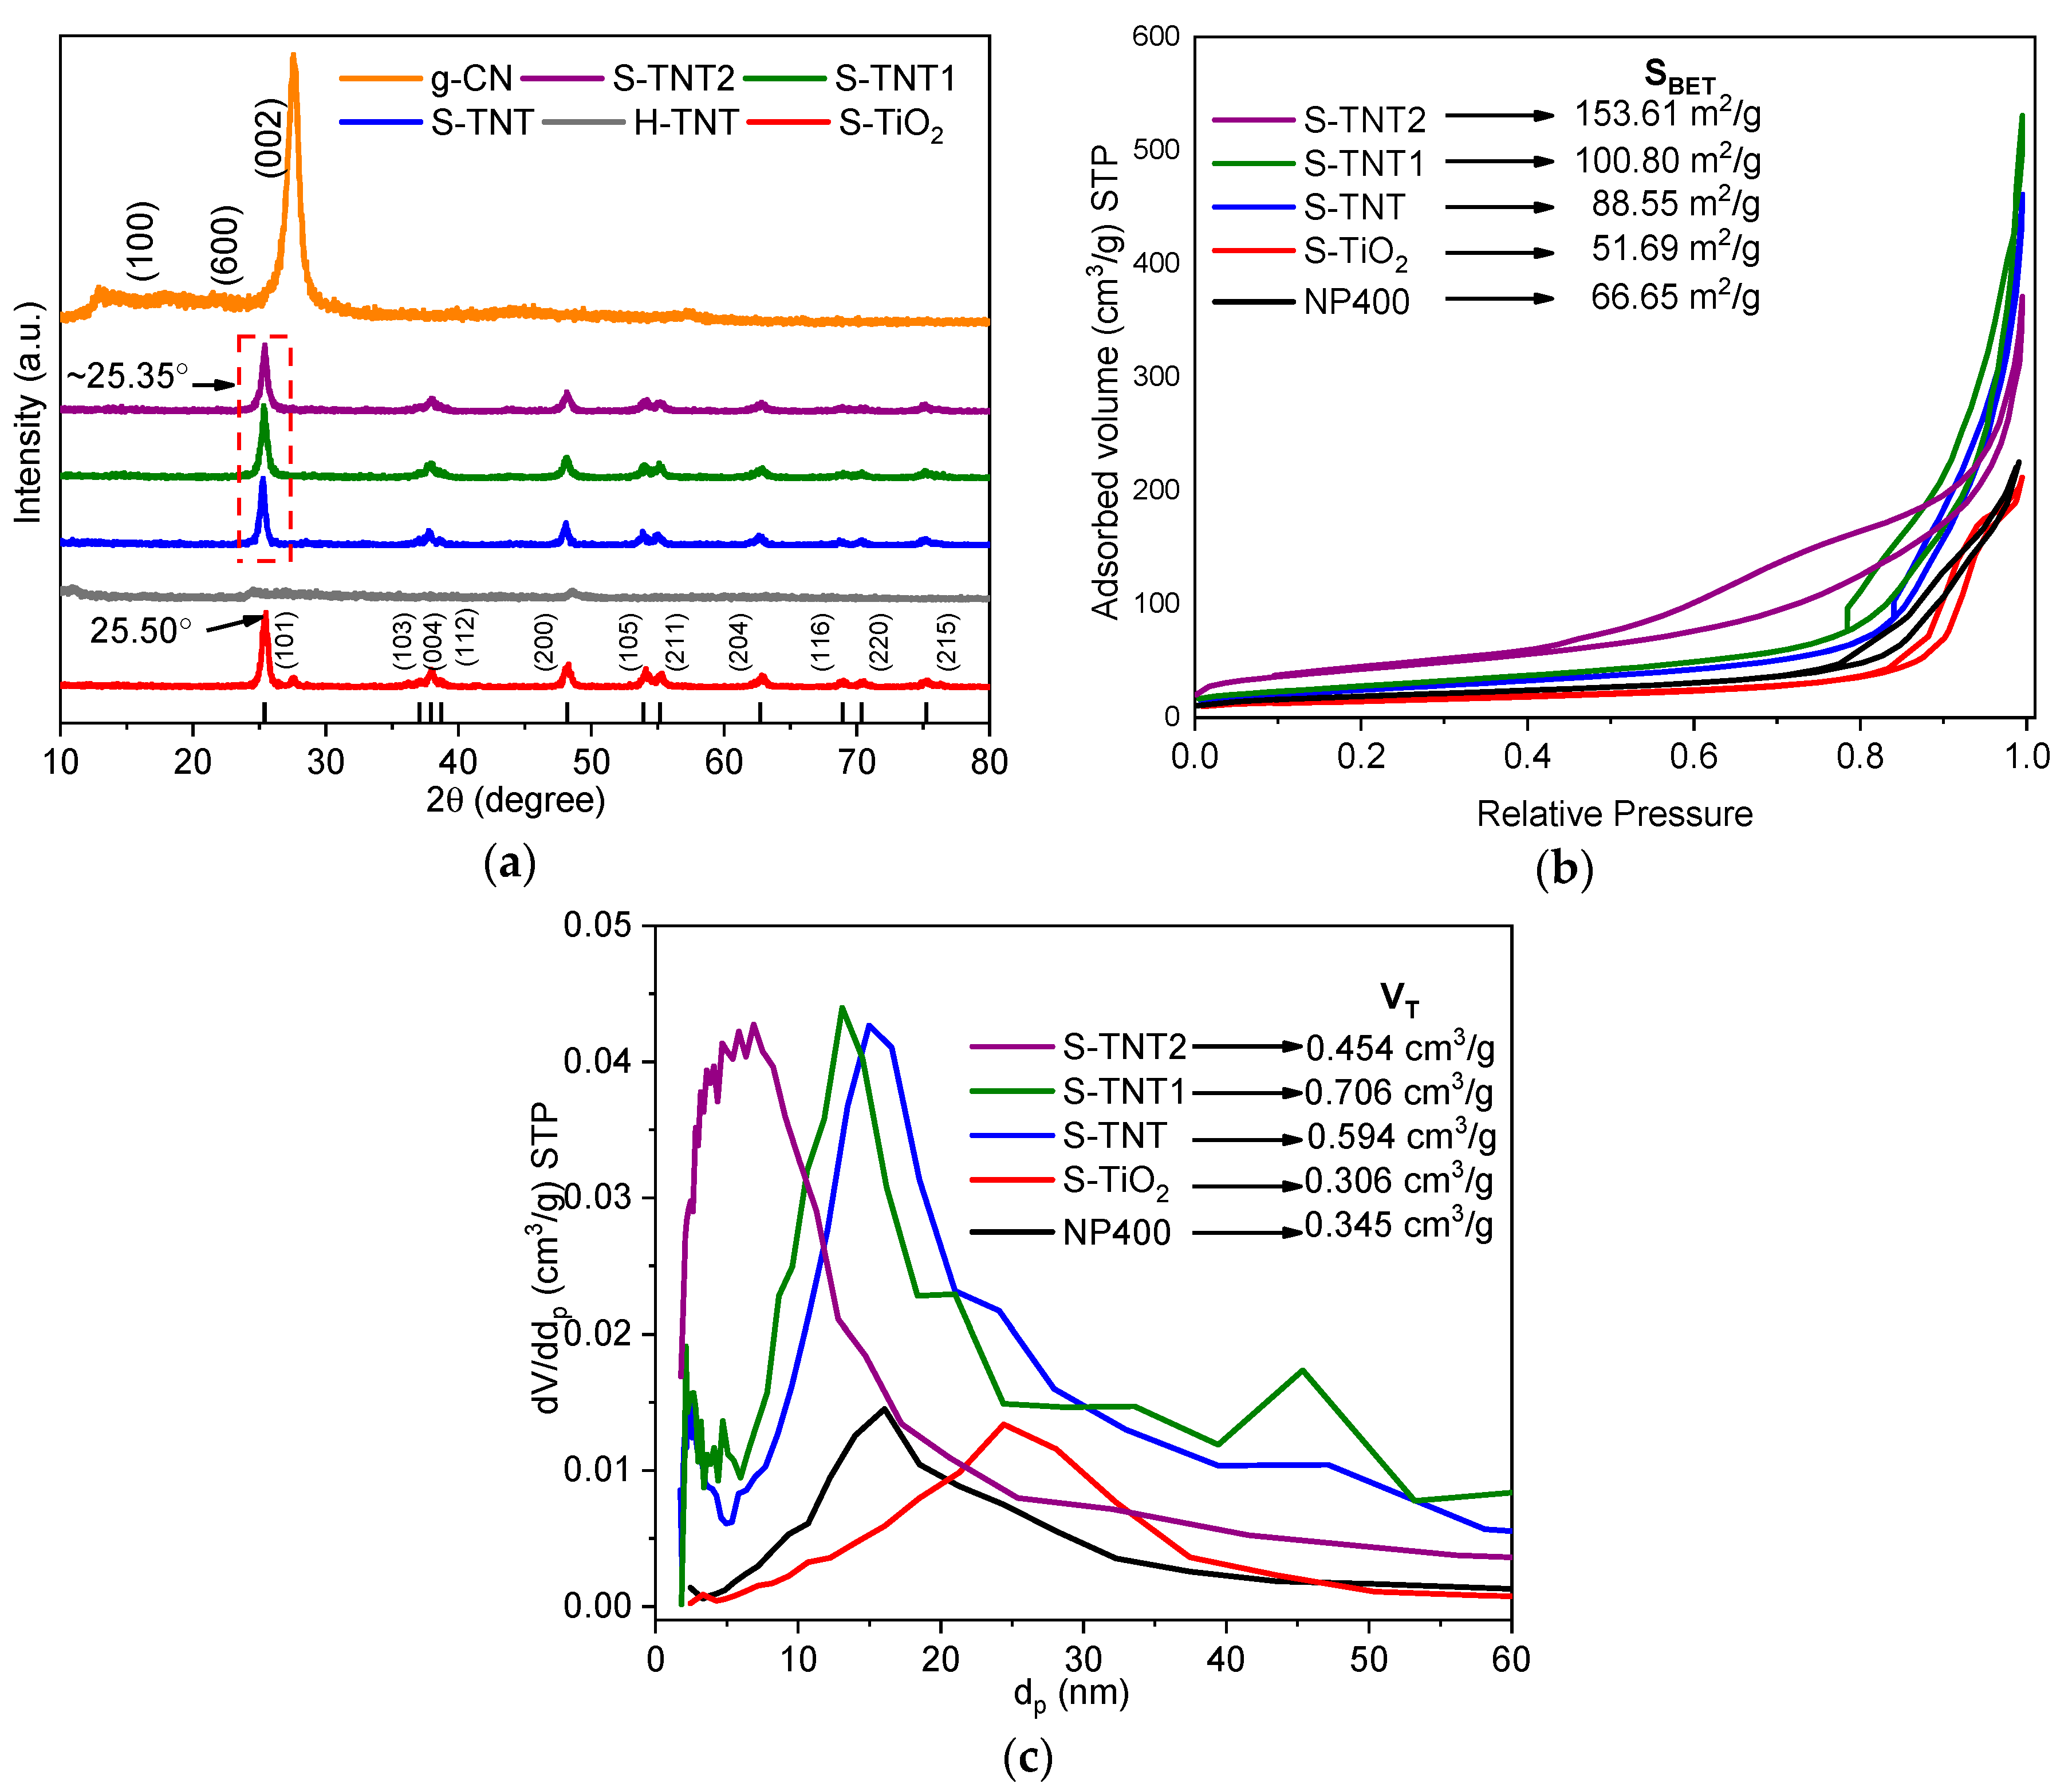
X-Ray Powder Diffraction (XRD) and Brunauer–Emmett–Teller (BET) Results
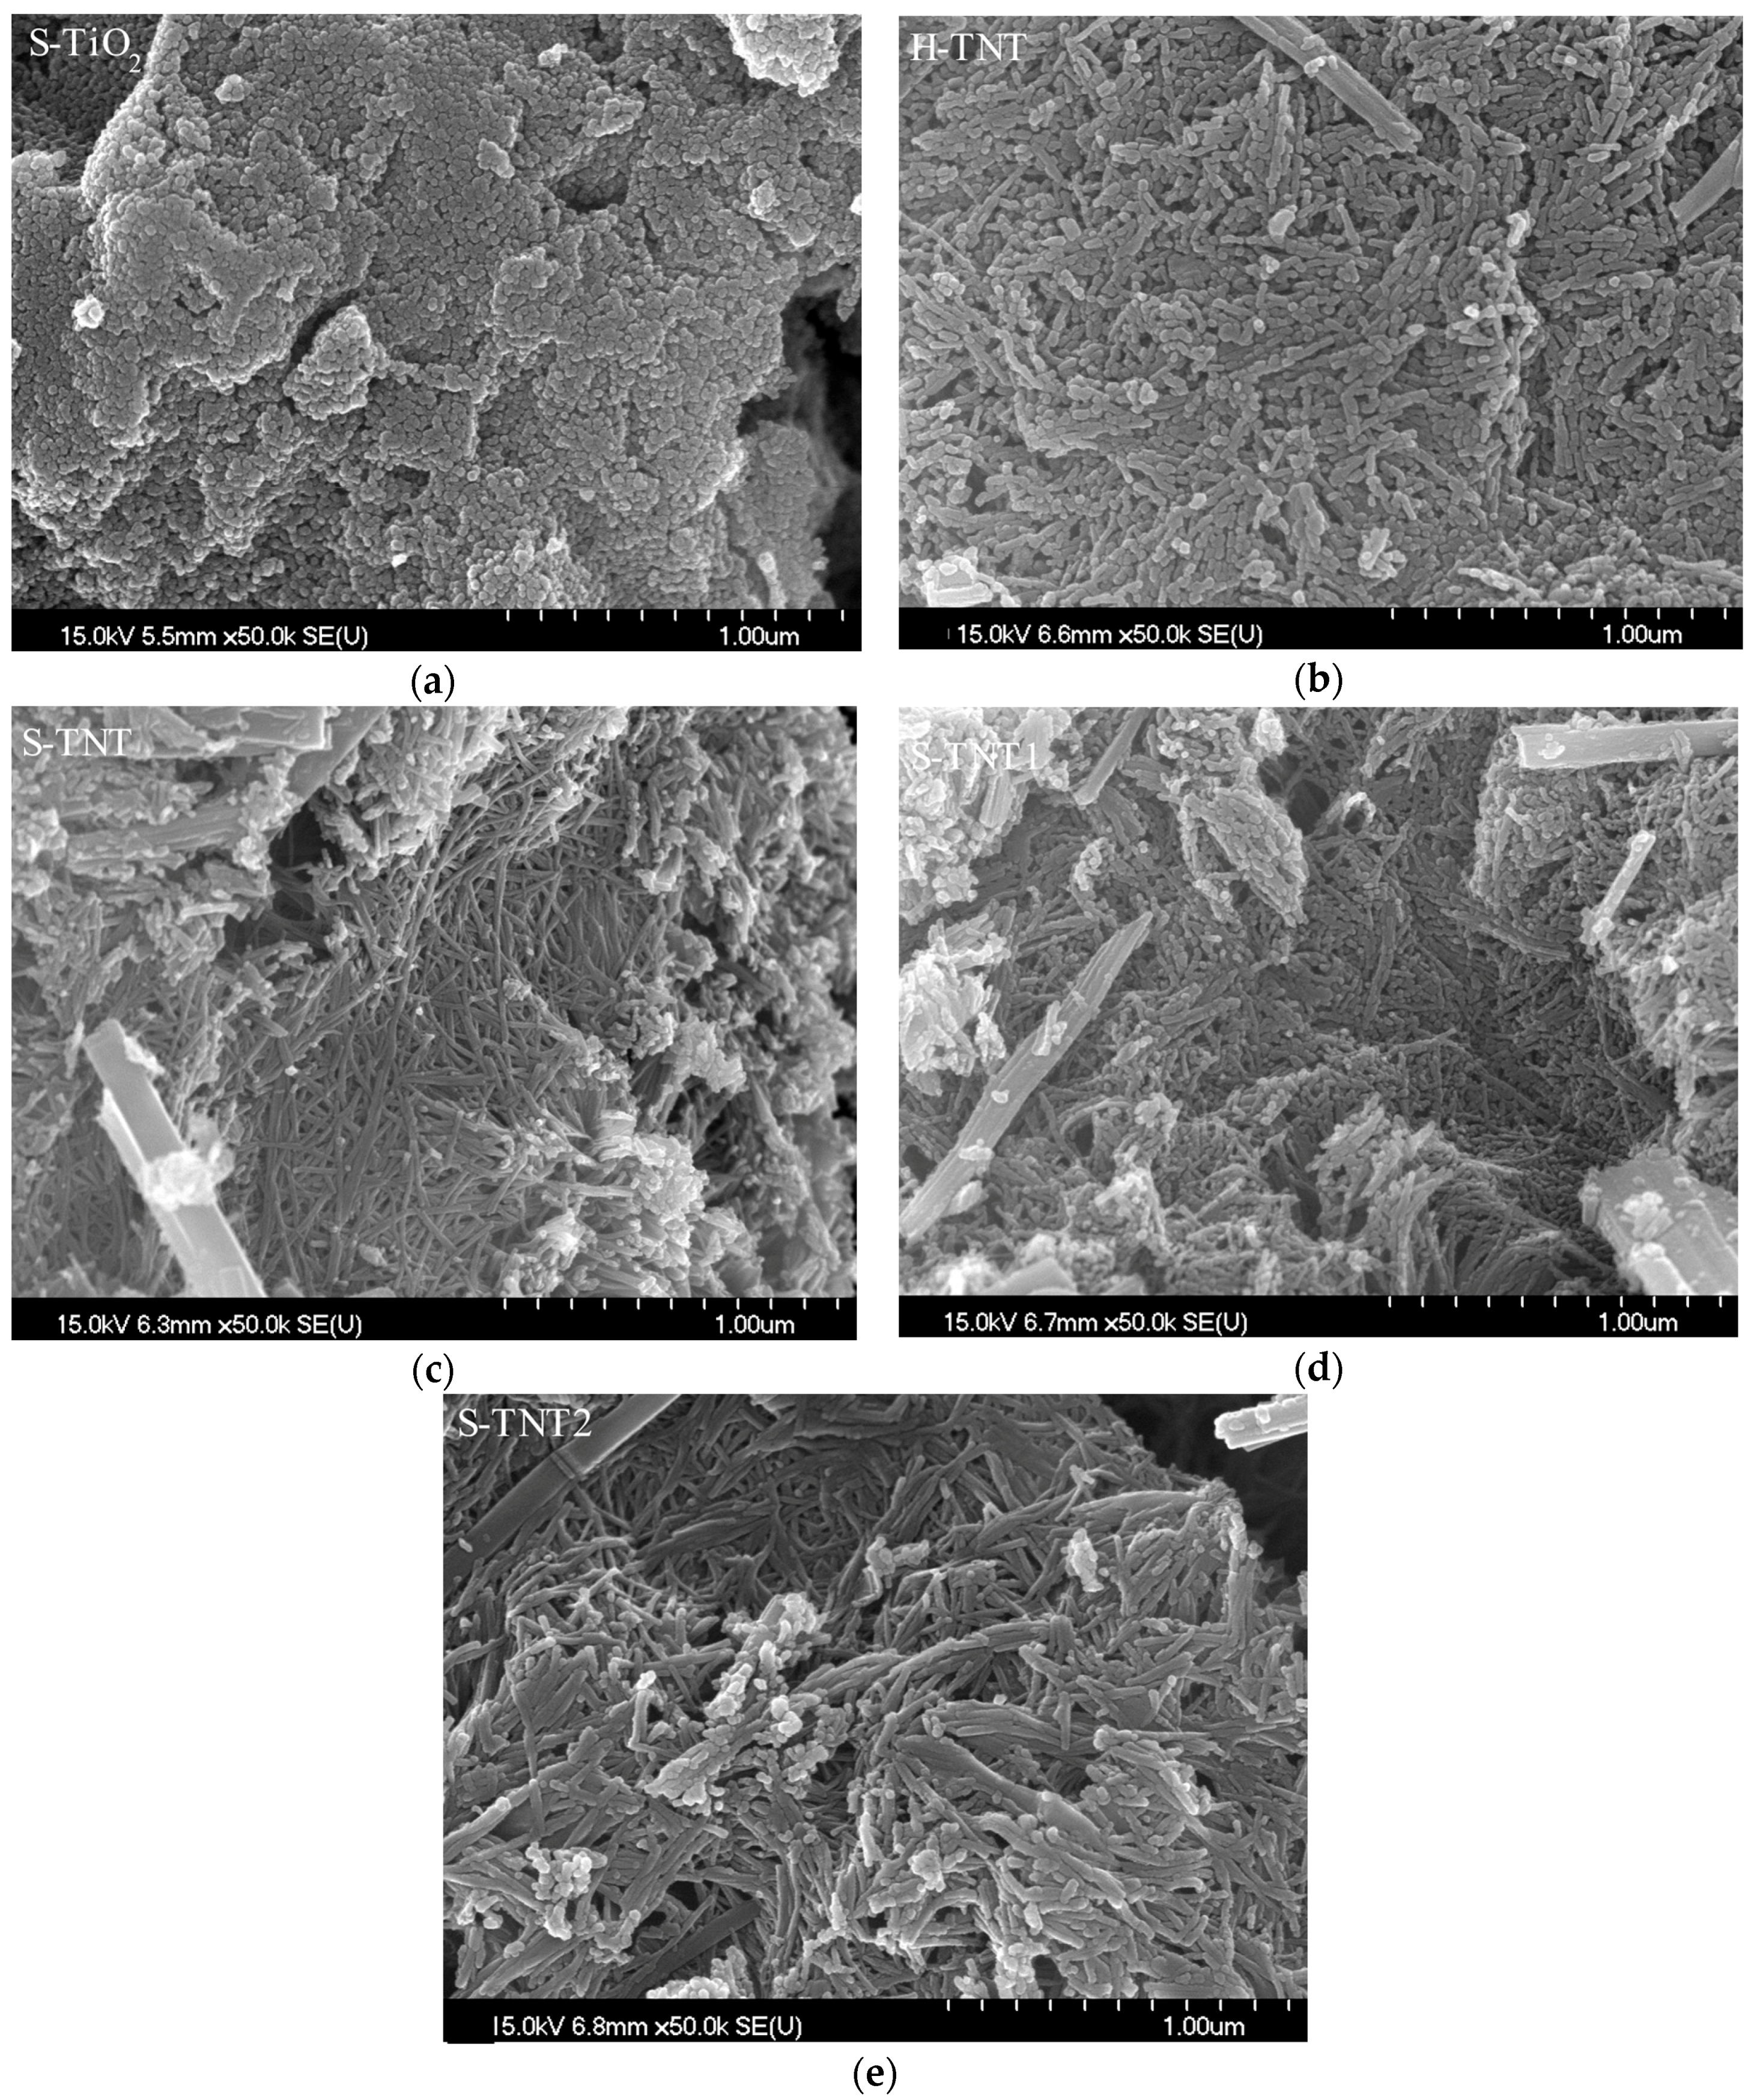
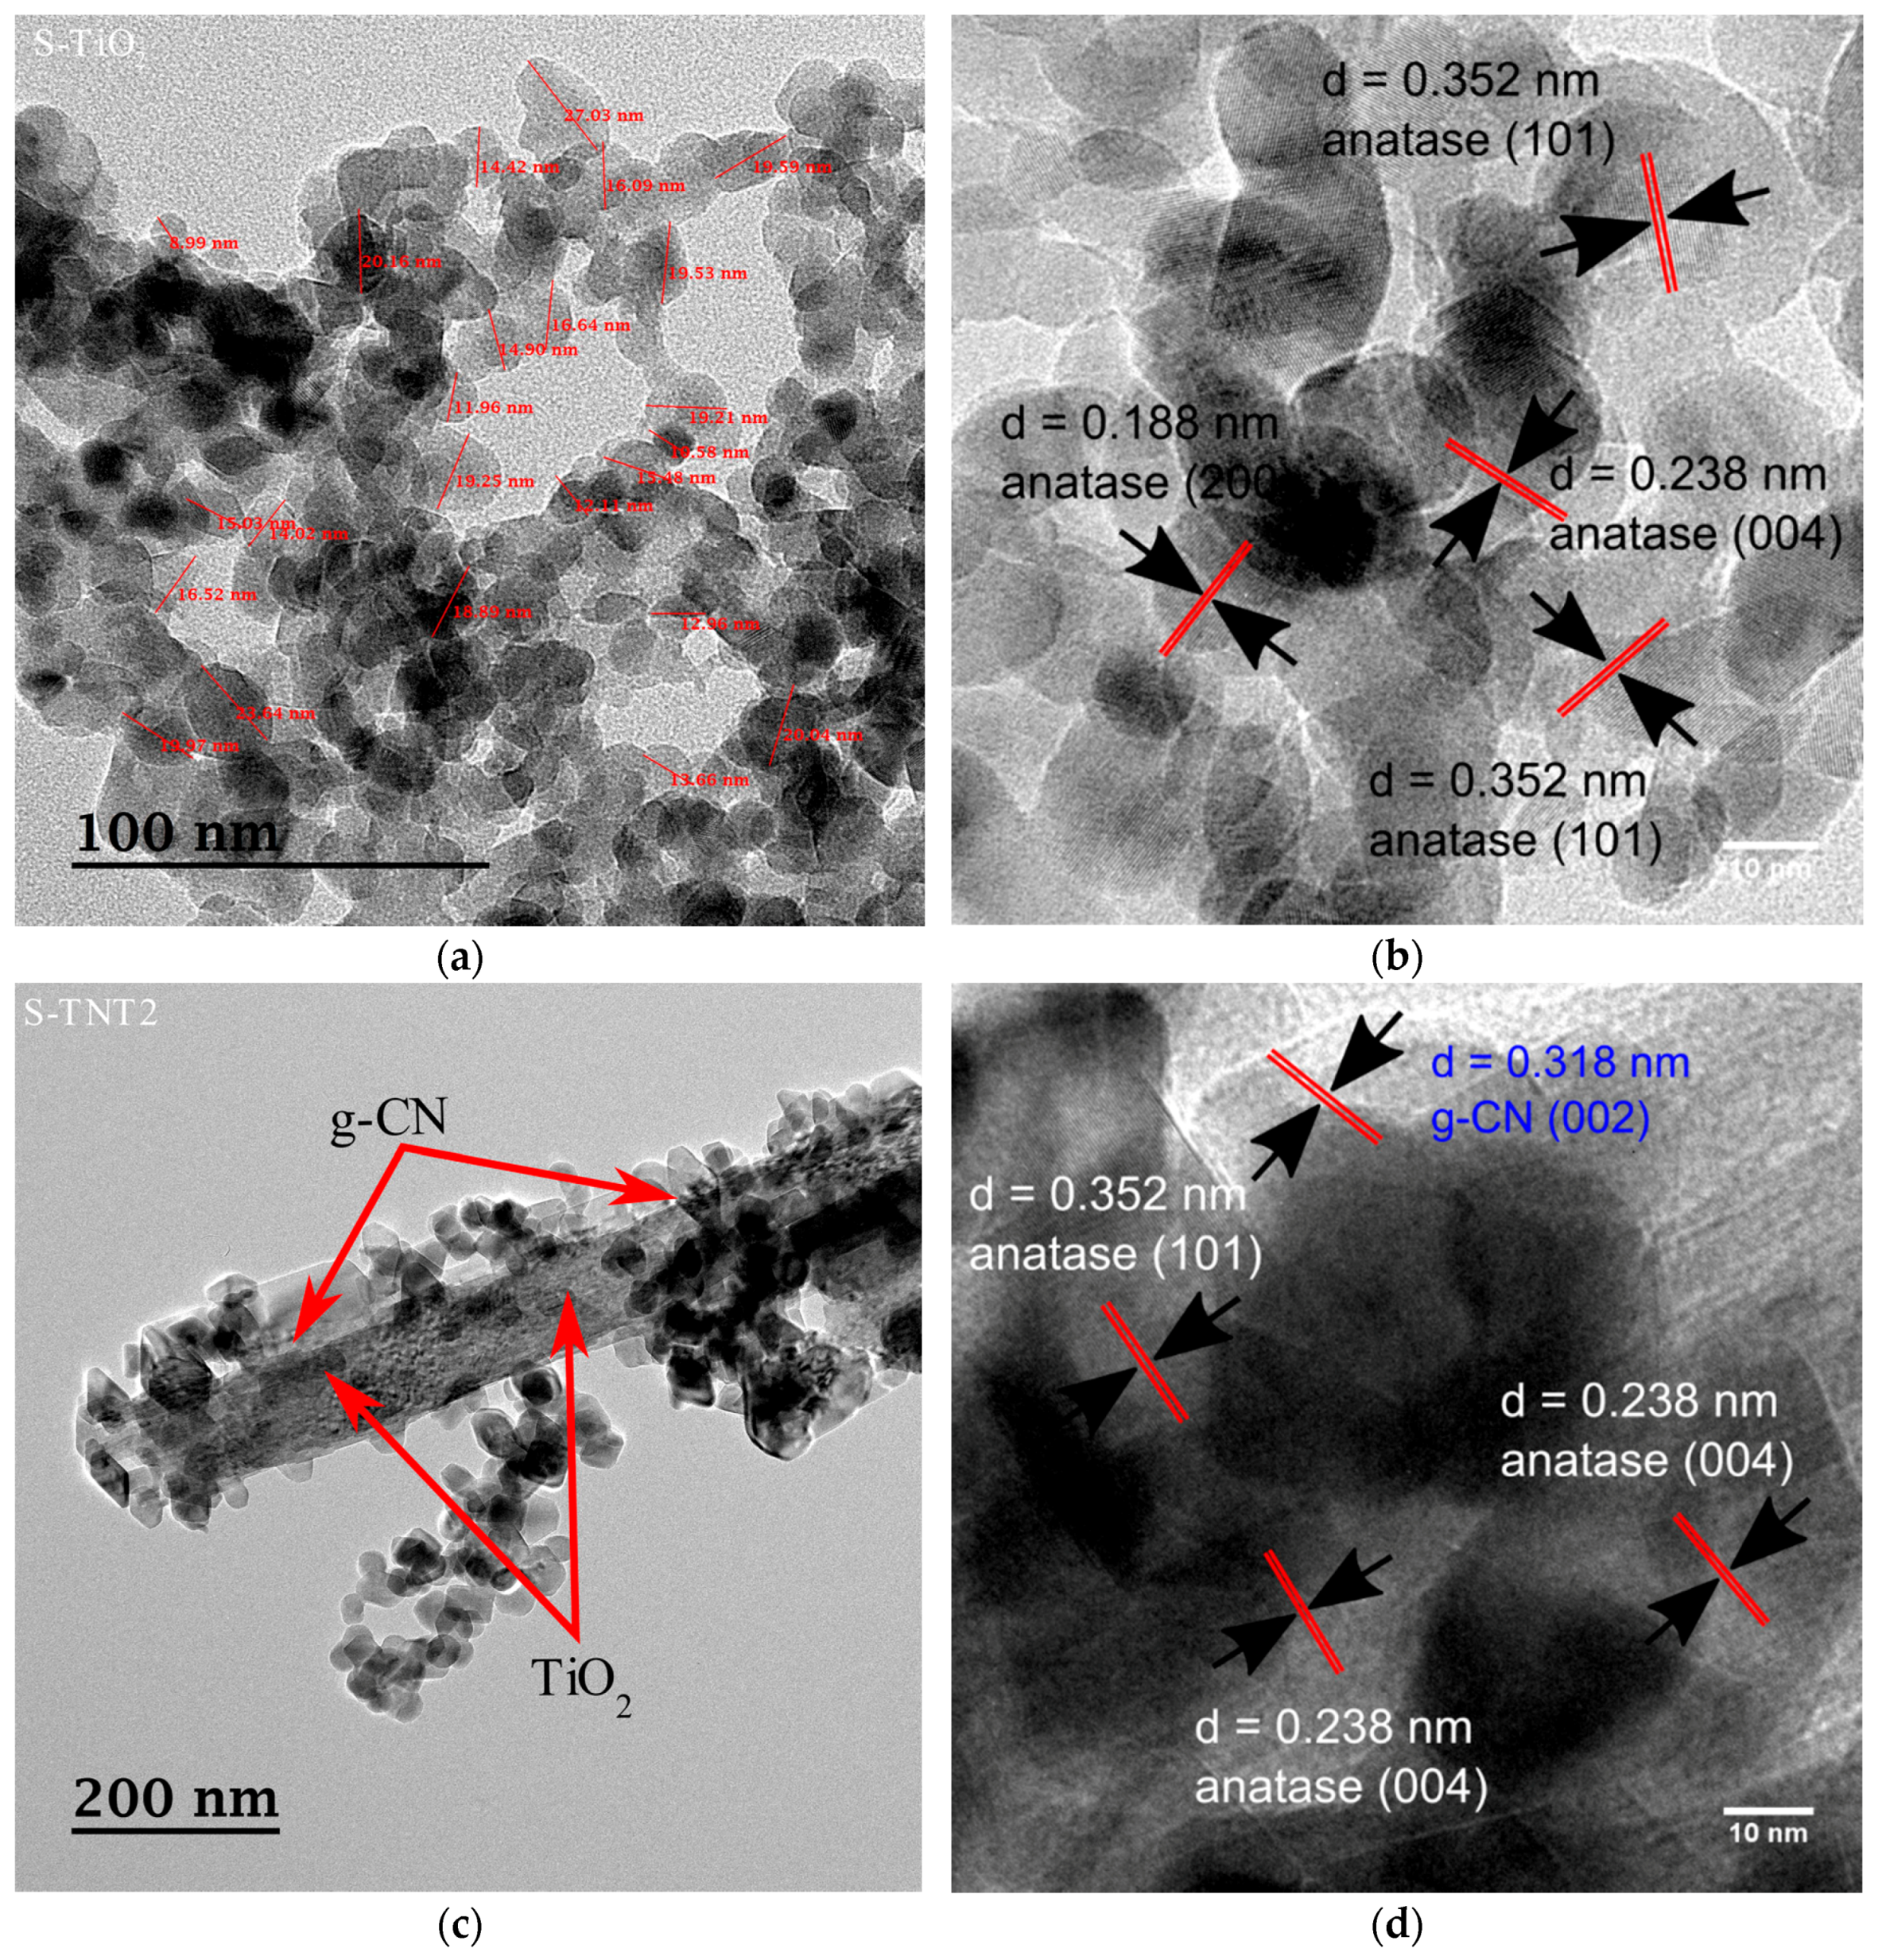
2.2. Electron Microscopy (SEM and TEM Images)
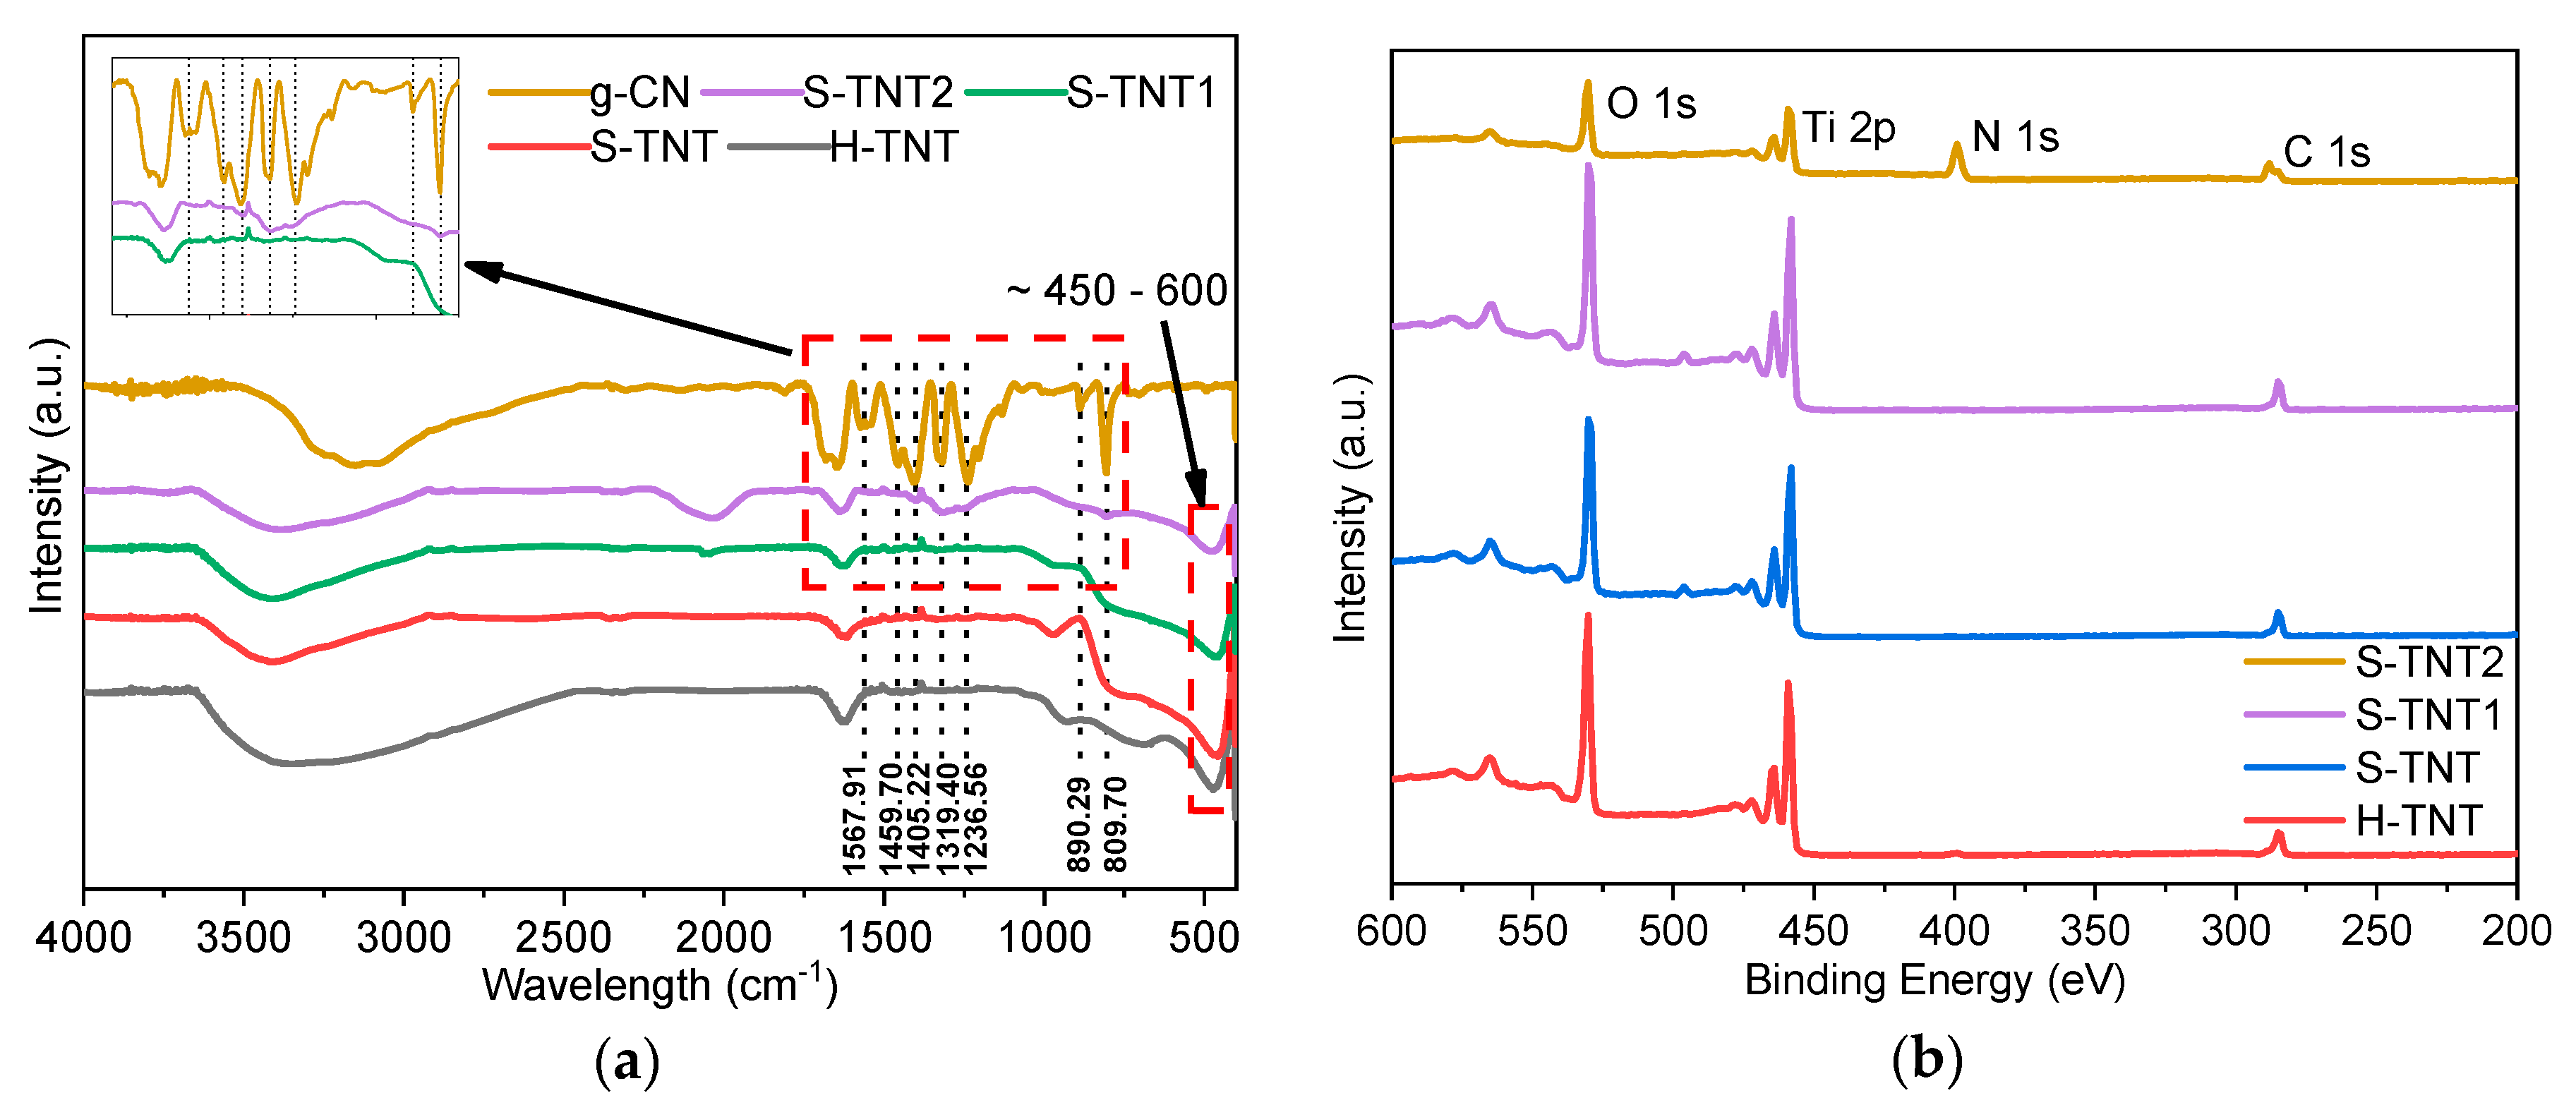
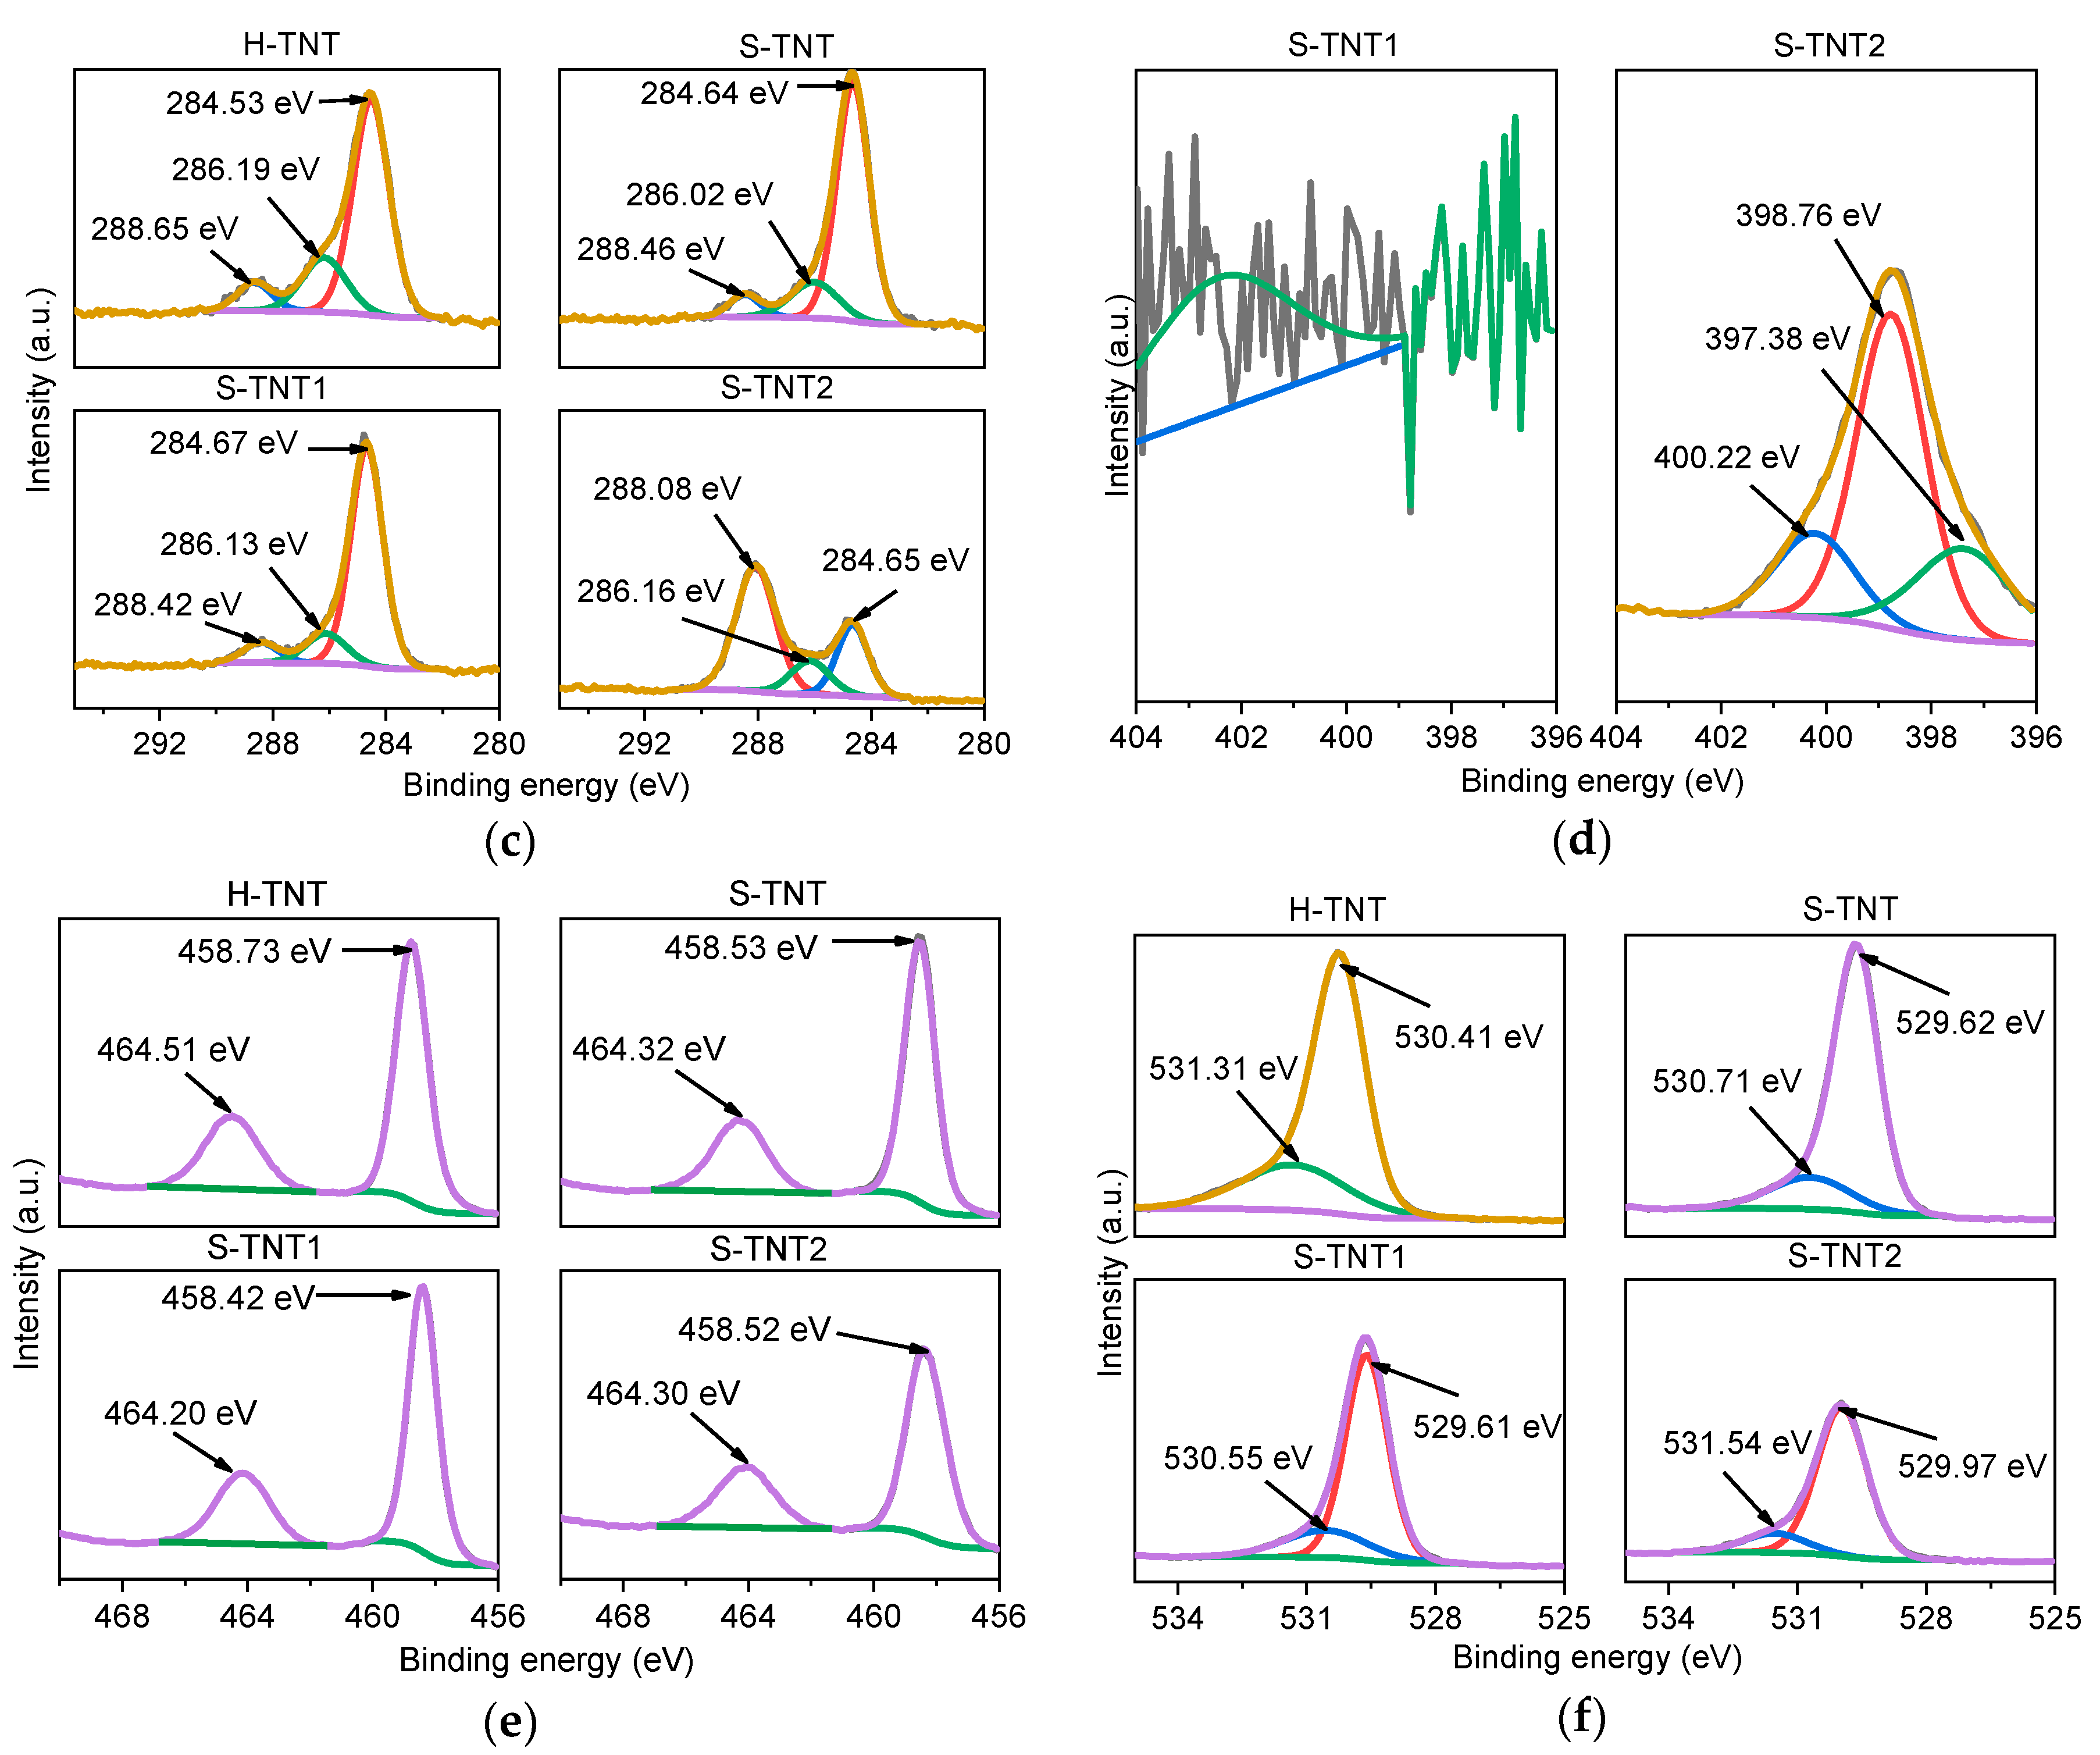
2.3. Fourier Transform Infrared (FT-IR) and X-Ray Photoelectron Spectroscopy (XPS) Spectra
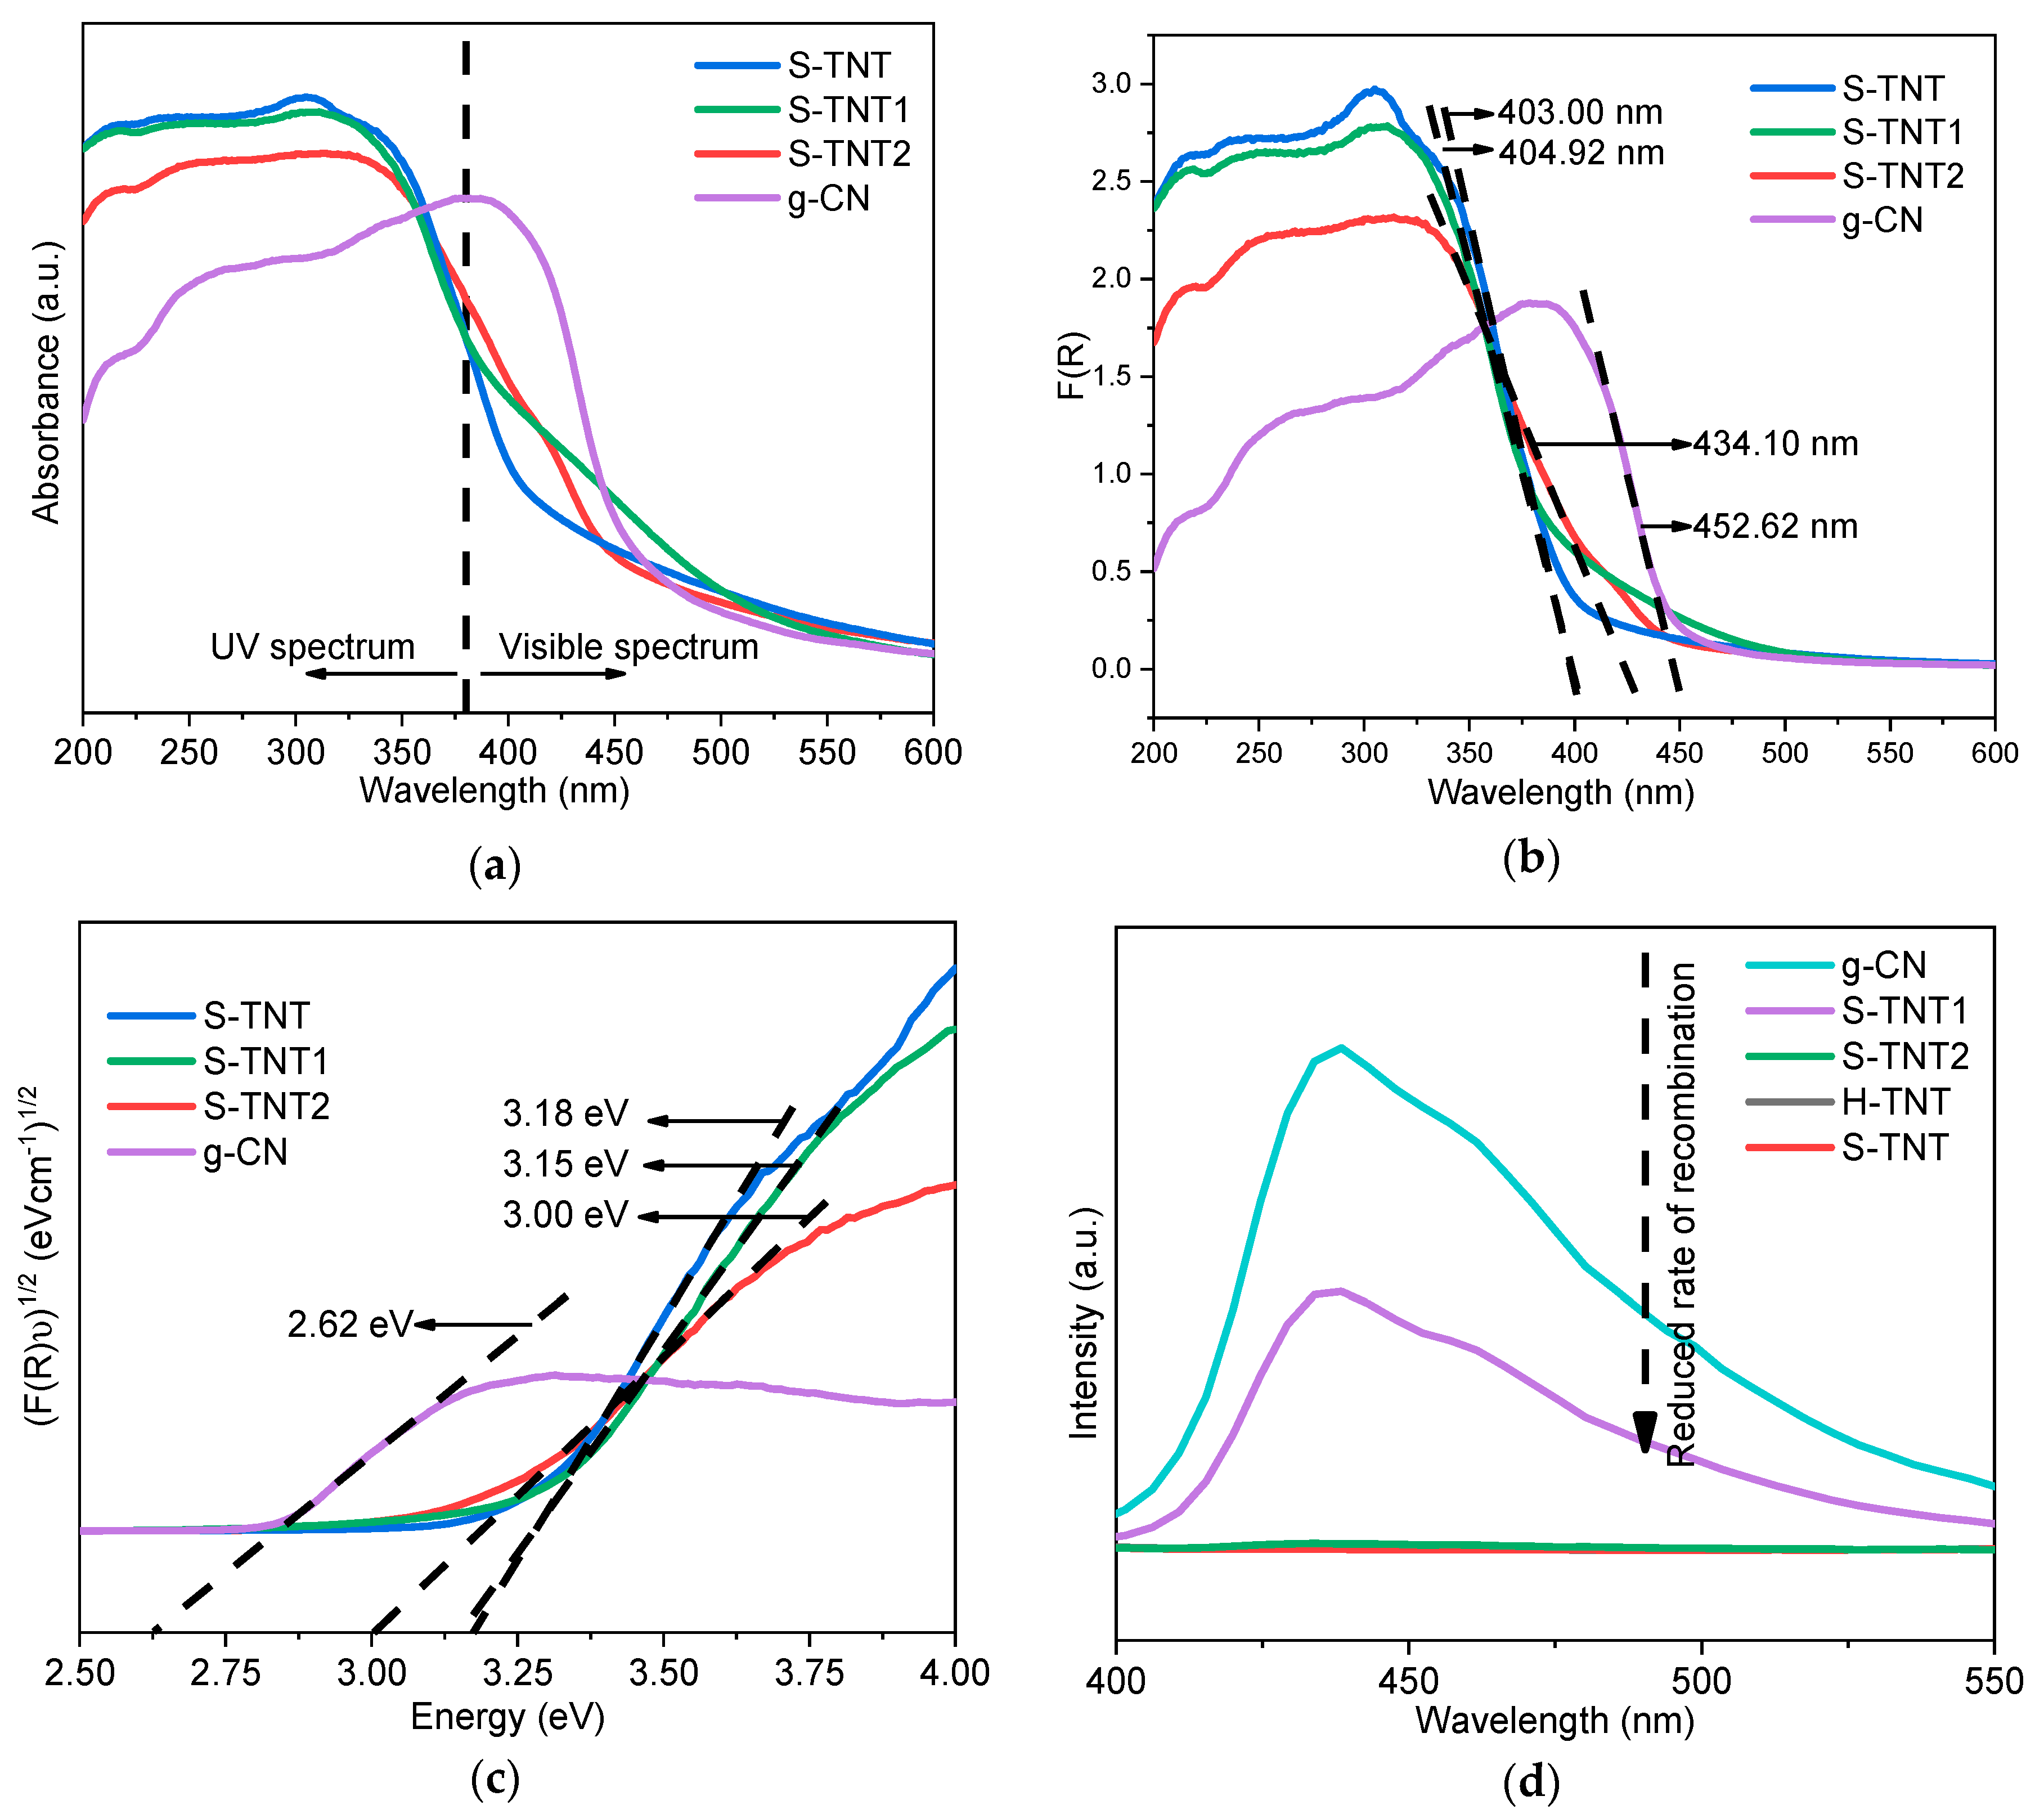
2.4. Optical Traits (Photoluminescence (PL) and UV/Vis Diffuse Reflectance Spectroscopy (DRS))
2.5. Photoactivity
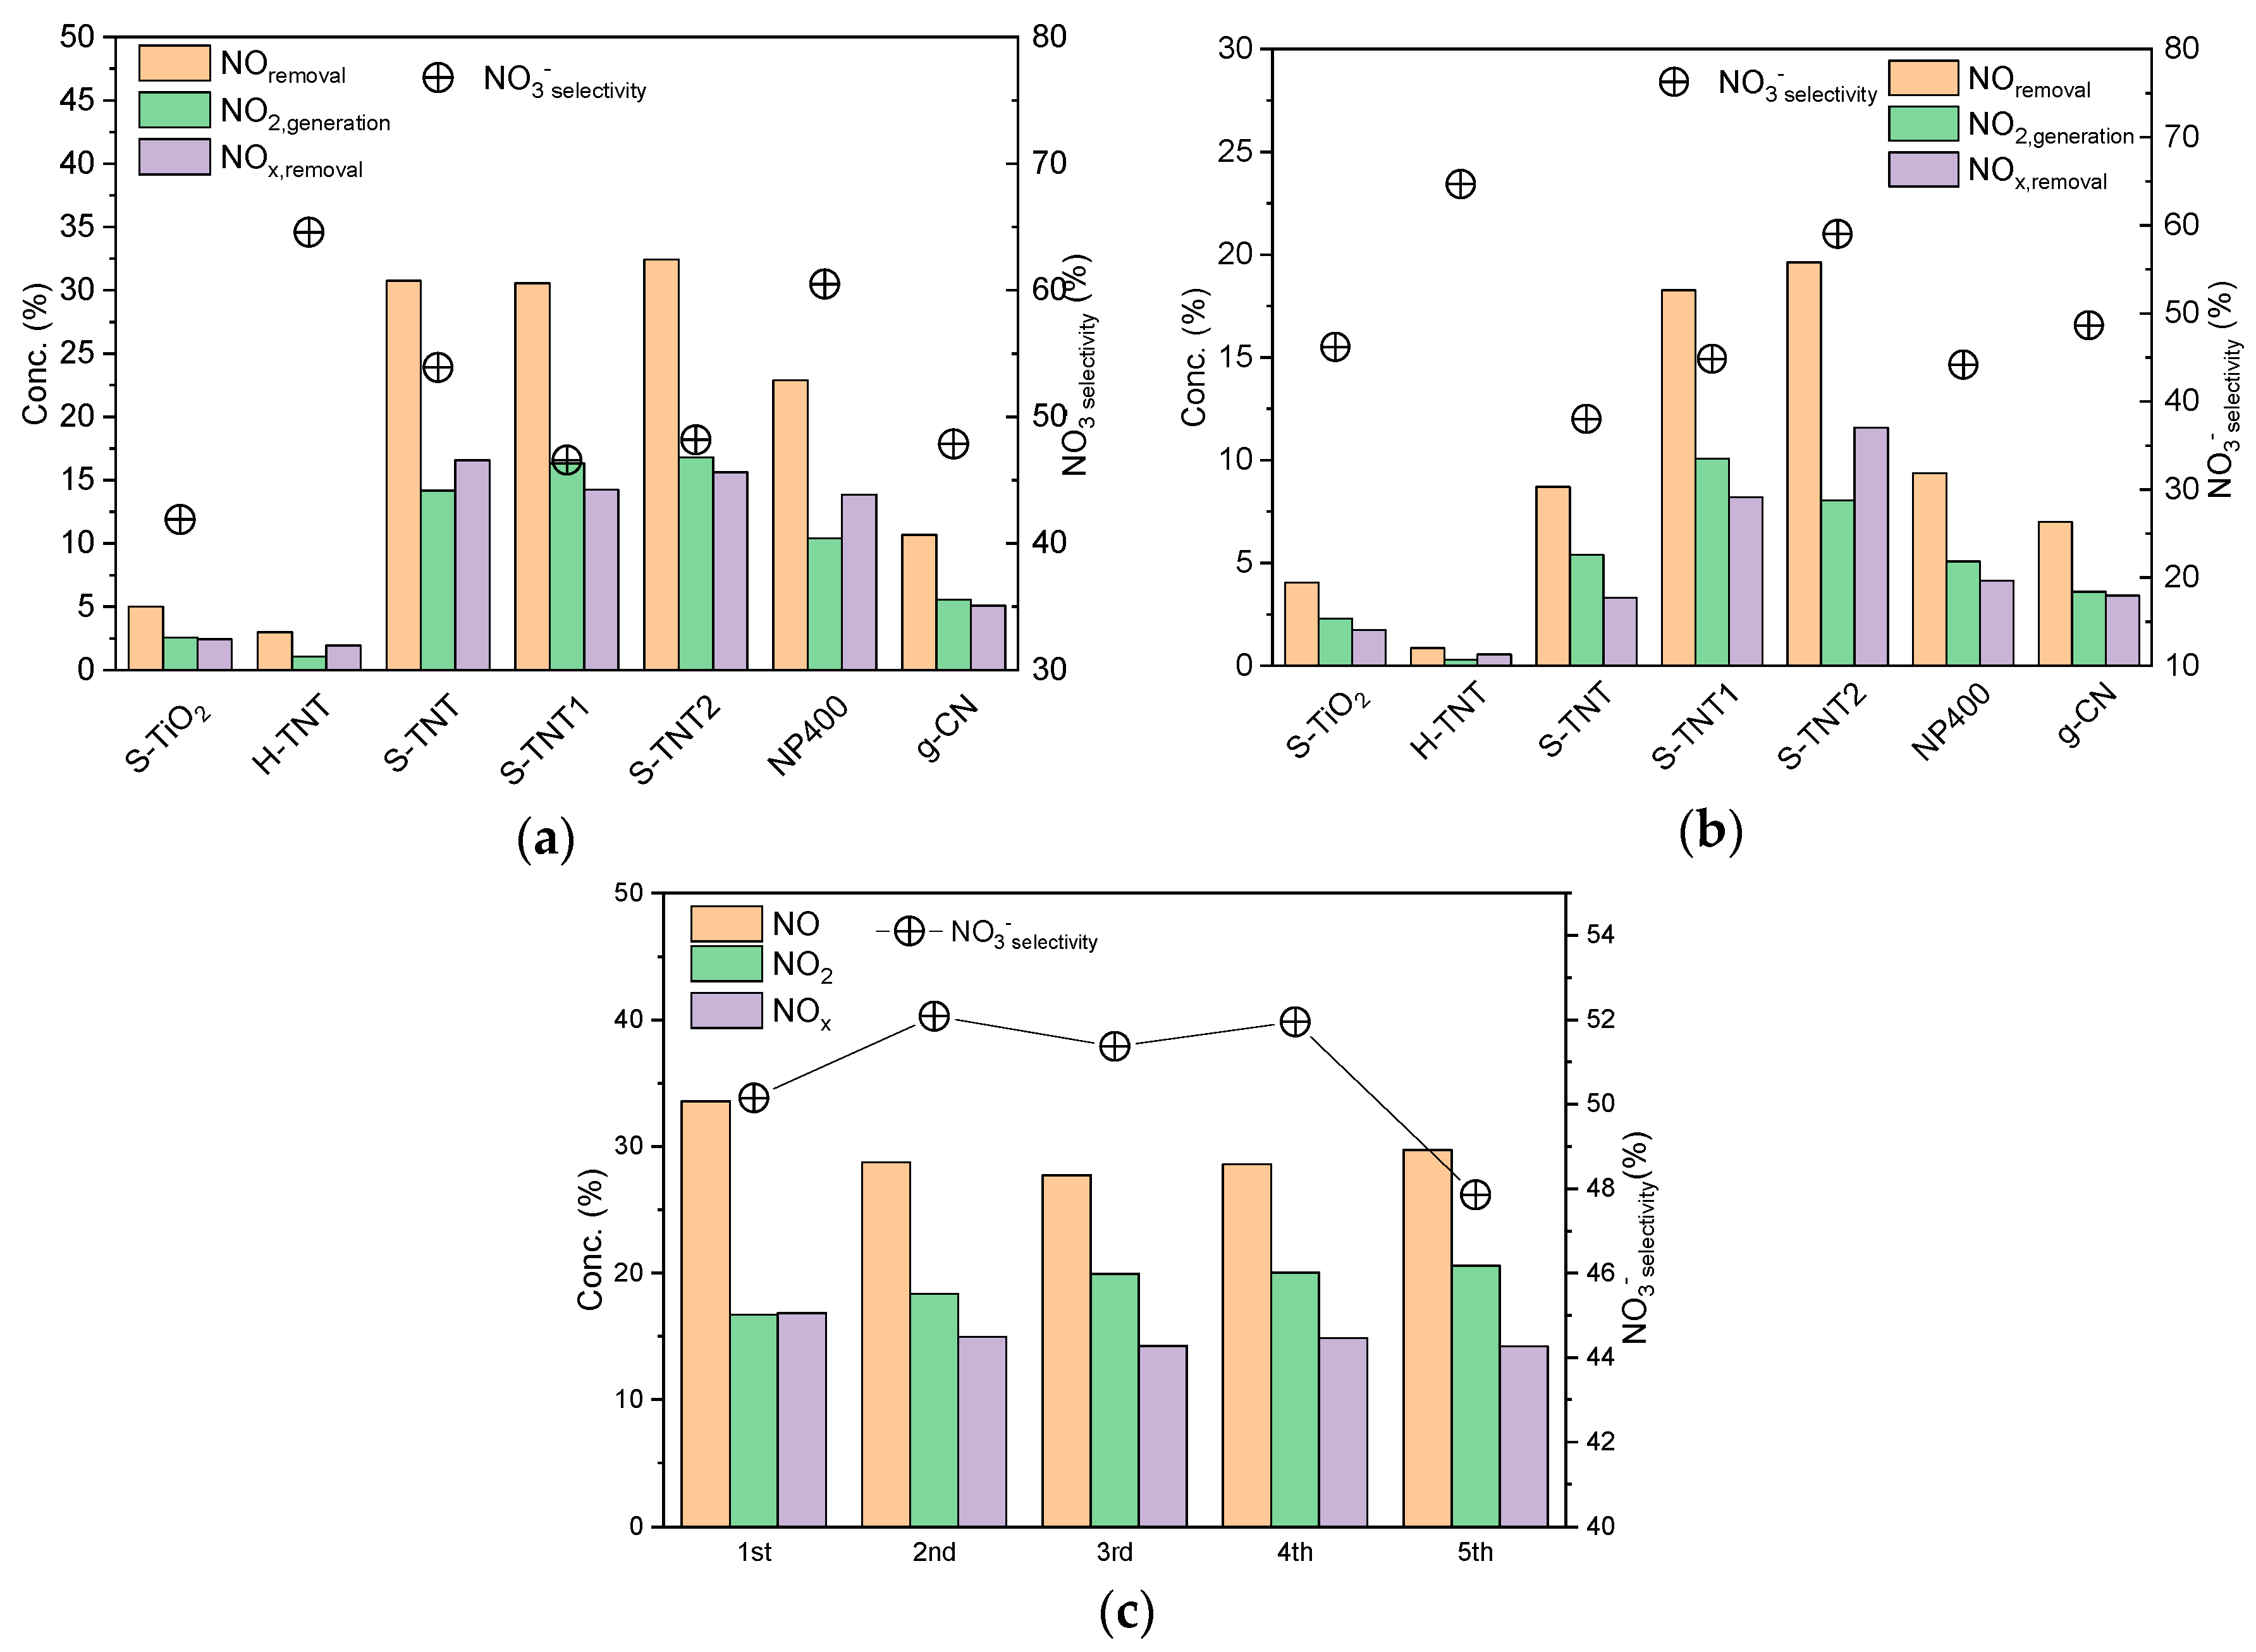
2.5.1. NOx Removal
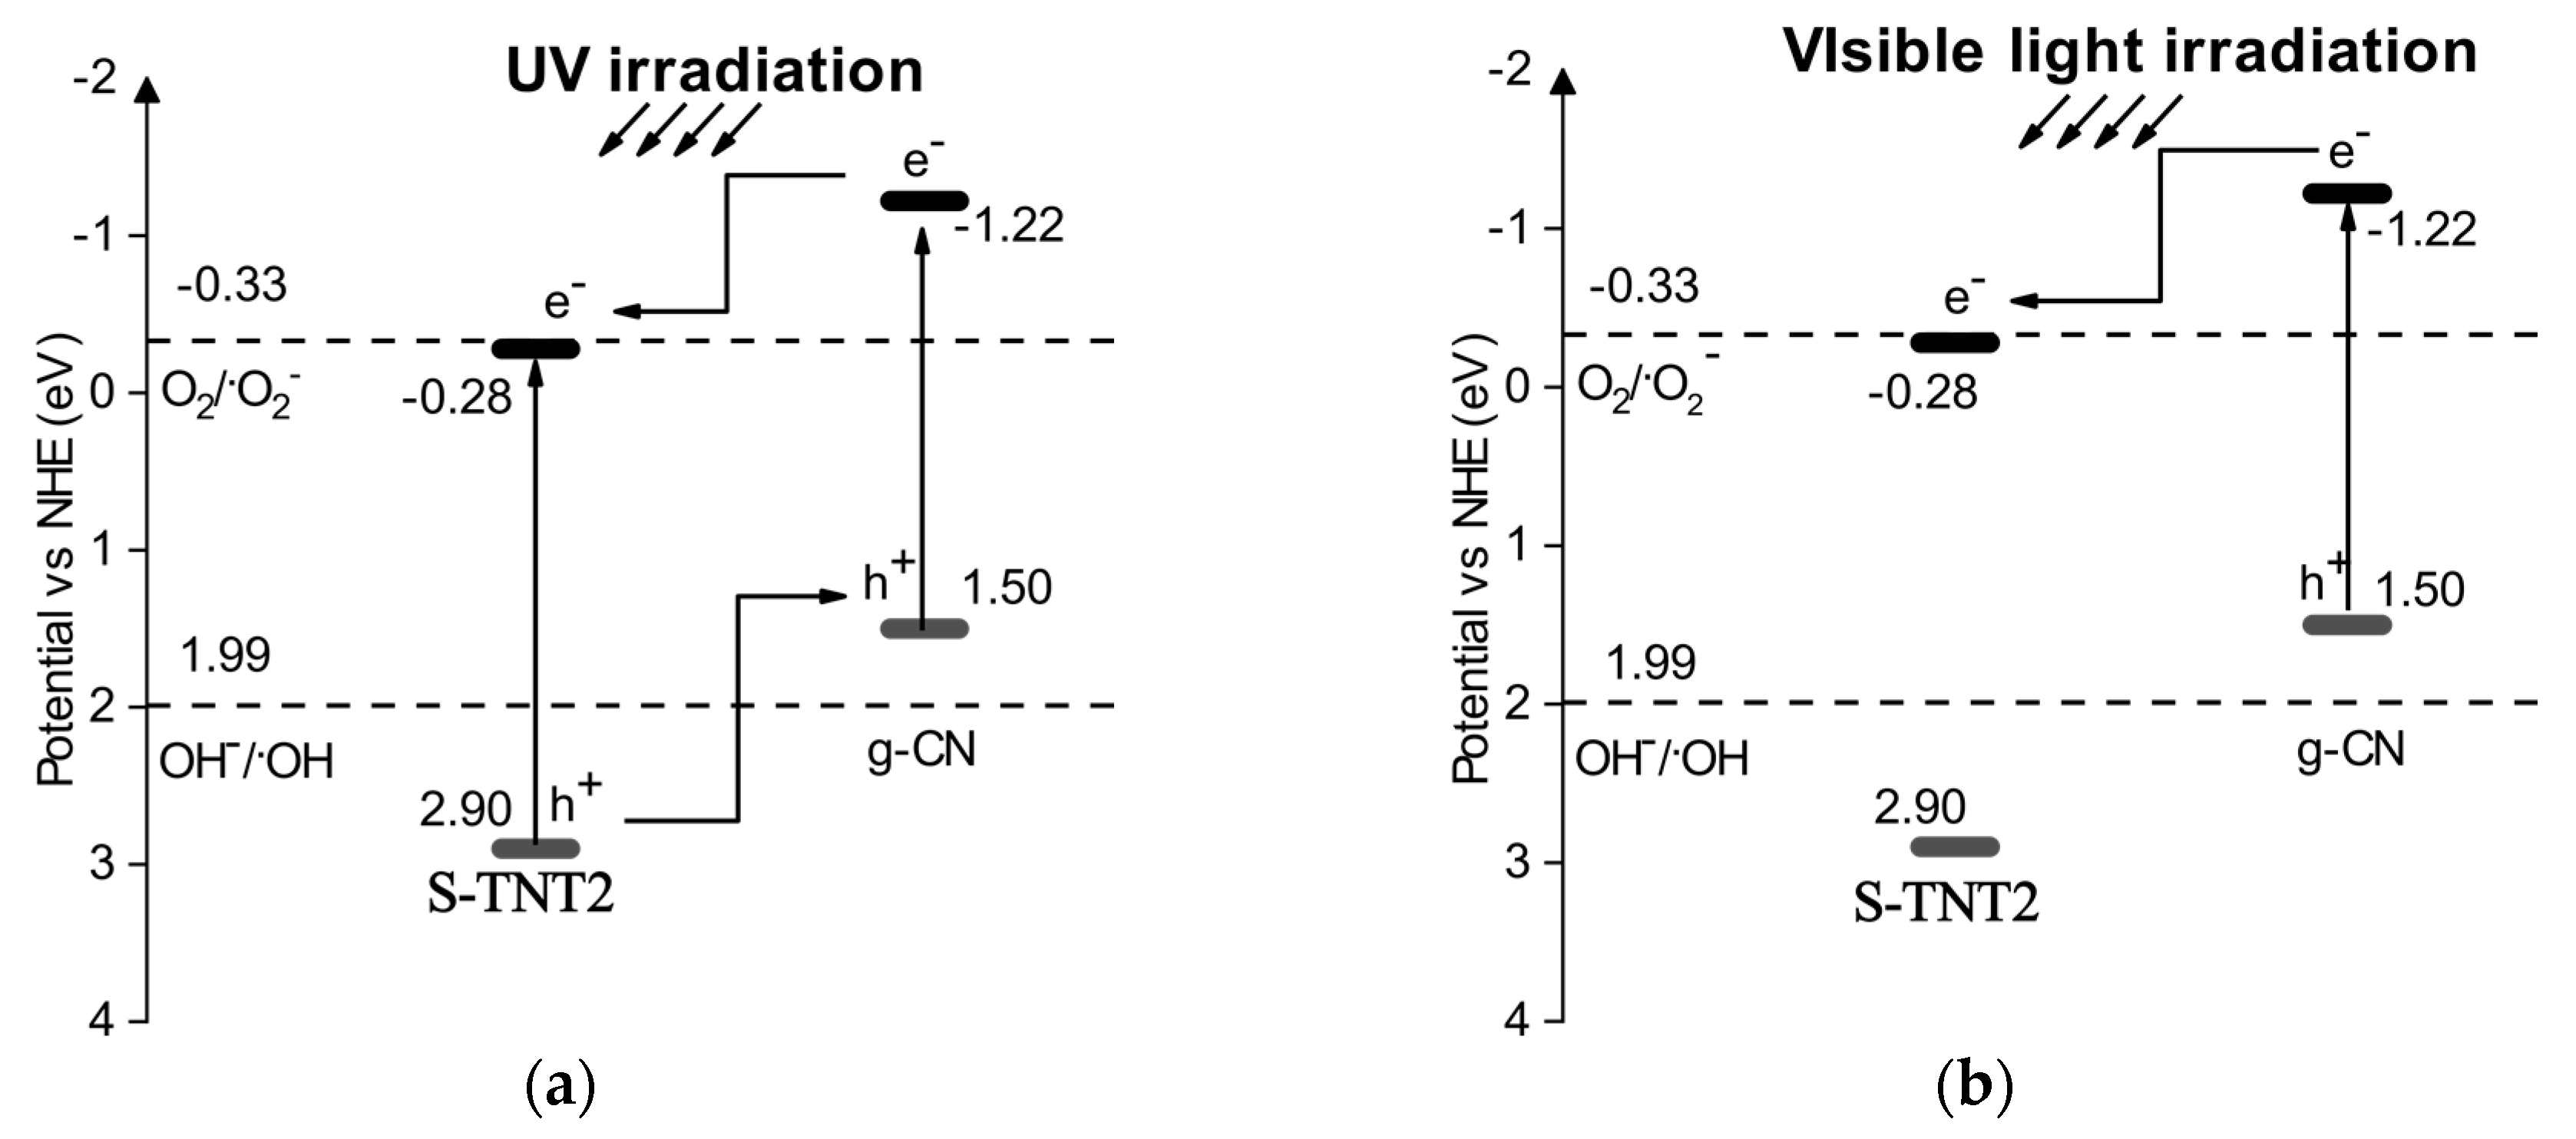
2.5.2. Mechanism of NOx Removal
3. Materials and Methods
3.1. Materials
3.2. Preparation of S-TiO2 and H-TNT
3.3. Preparation of S-TNT/g-CN Composite
3.4. Characterization
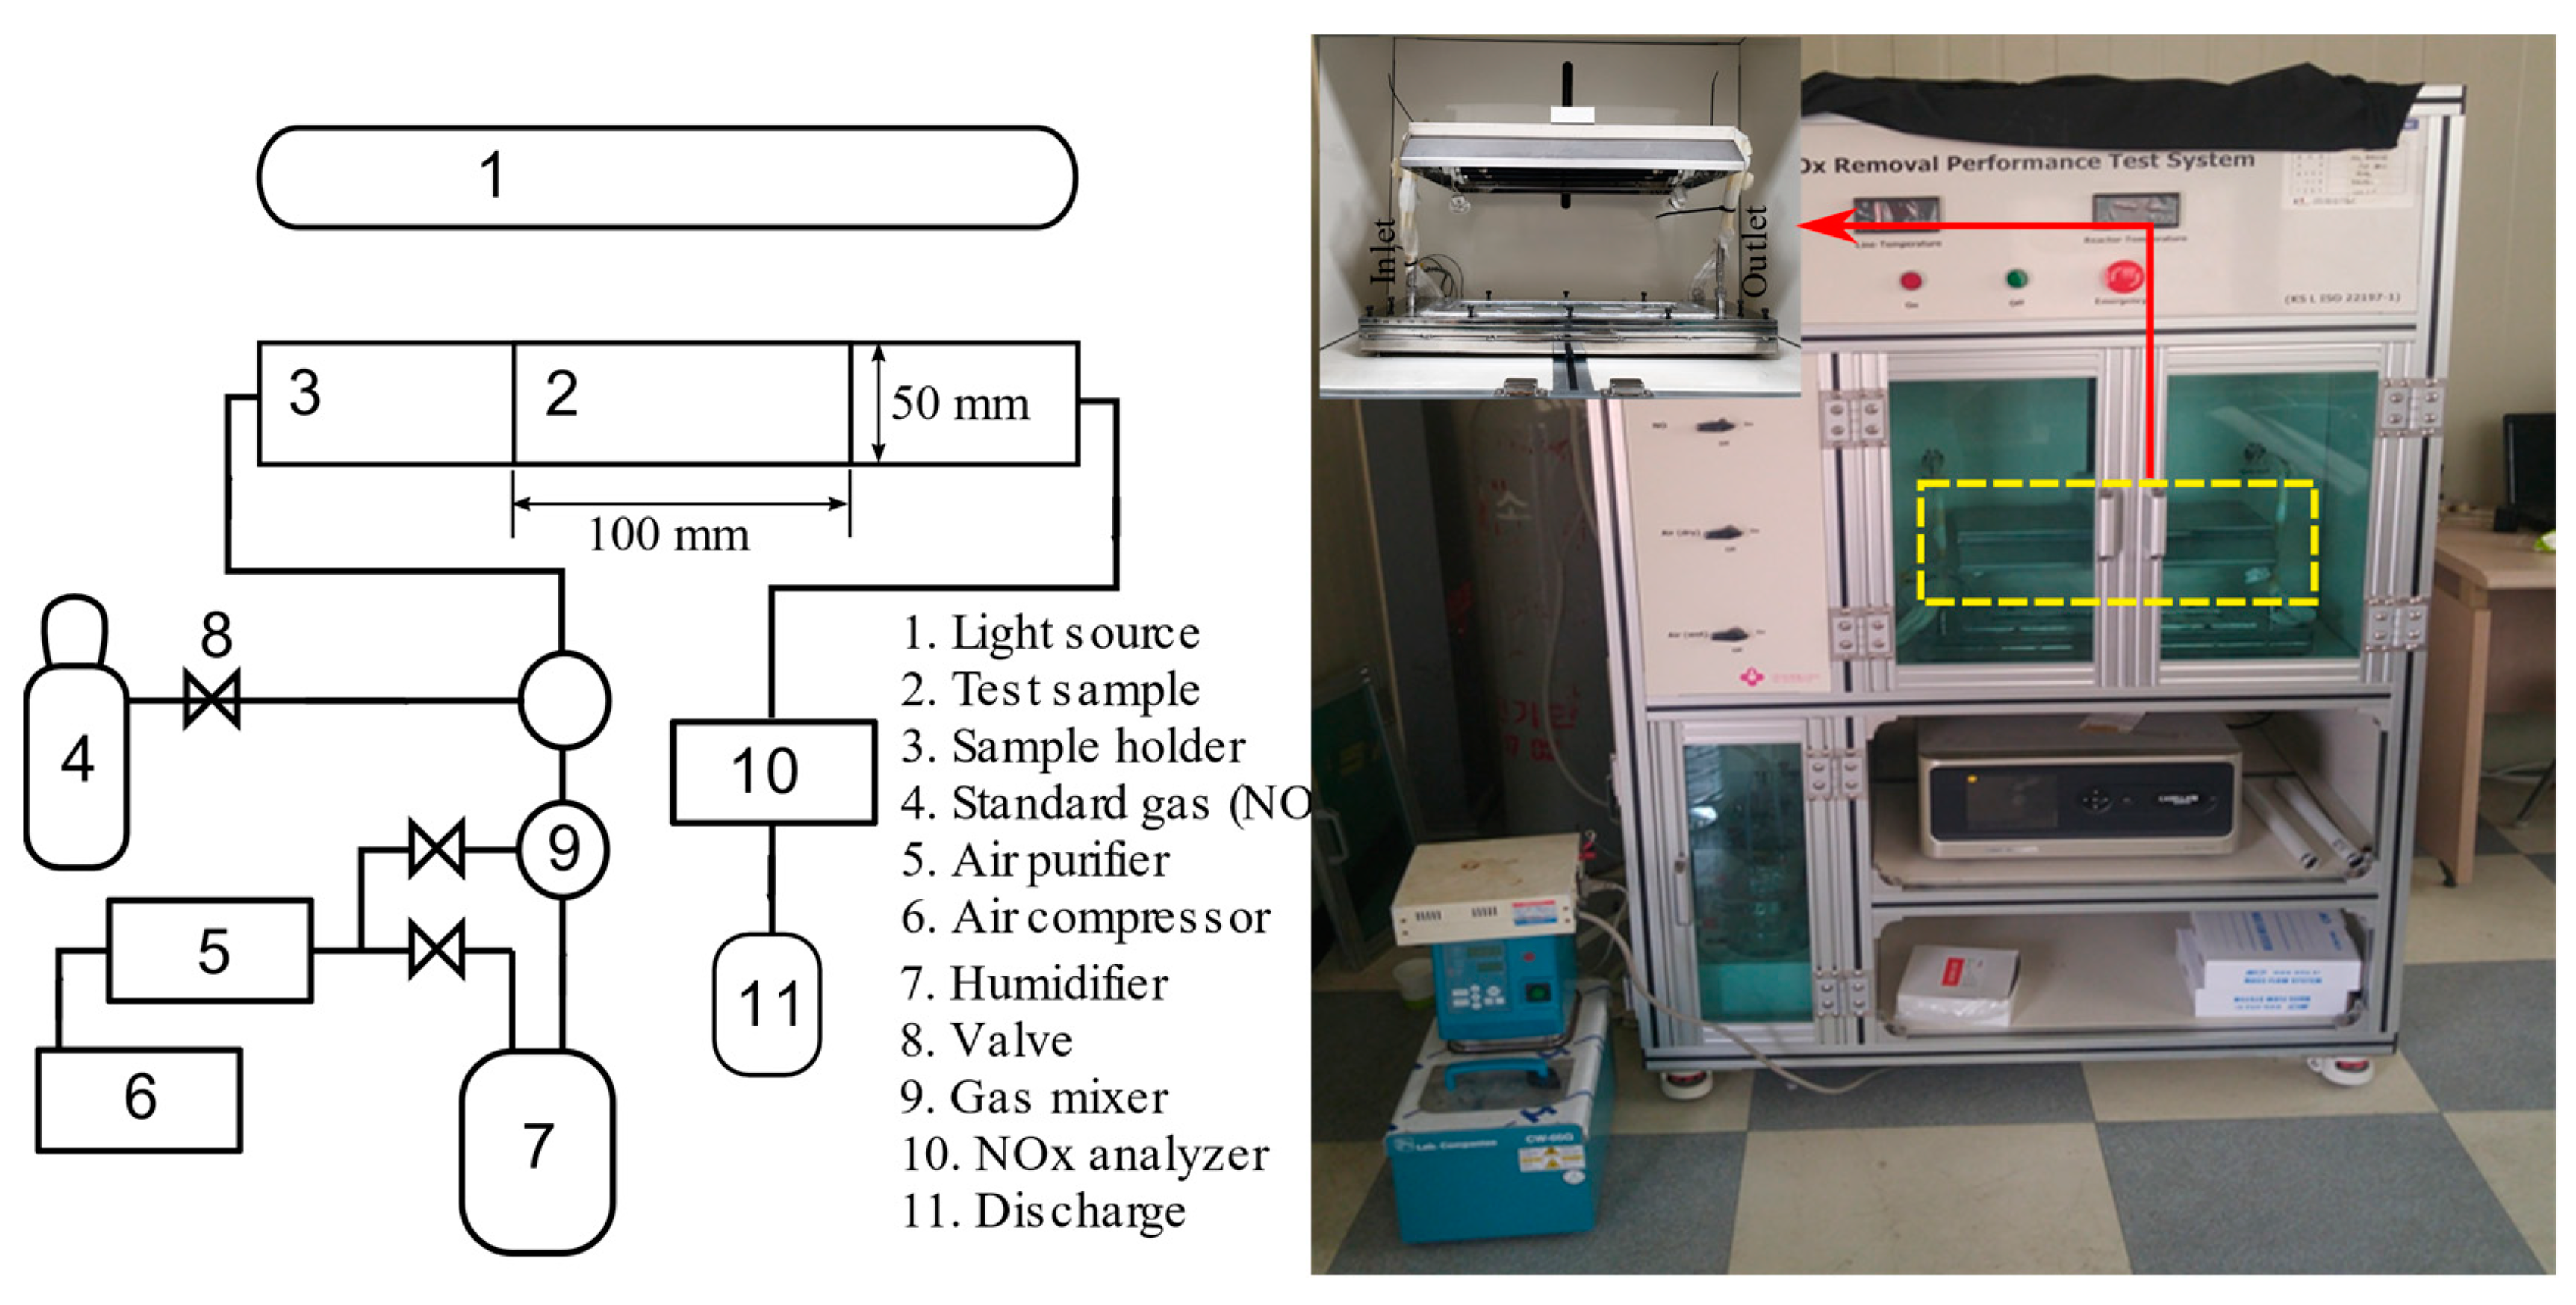
3.5. Photocatalytic Activity
4. Conclusions
- NaOH-based modified hydrothermal treatment of TiO2 generated from sludges of dye wastewater can produce H-titanate after successive acid wash and lead to the preparation of pure anatase TiO2 nanotubes through calcination.
- Facile calcination of sludge generated H-titanate, and an equal part of melamine mix at a temperature of 550 °C for 3 h can successfully produce anatase TiO2/g-CN nanotubes with severely increased effective surface area compared with the pristine nanotubes prepared by only calcining H-titanate.
- Owing to bandgap narrowing, the prepared TiO2/g-CN nanotubes showed a redshift in light absorption (434.10 nm). Hence, UV light absorption was reduced compared with pristine TiO2 nanotubes, but the several-fold increase in effective surface area counterbalanced that drawback.
Supplementary Materials
Author Contributions
Funding
Conflicts of Interest
References
- Xue, X.; Cashman, S.; Gaglione, A.; Mosley, J.; Weiss, L.; Ma, X.C.; Cashdollar, J.; Garland, J. Holistic Analysis of Urban Water Systems in the Greater Cincinnati Region: (1) Life Cycle Assessment and Cost Implications. Water Res. X 2019, 2. [Google Scholar] [CrossRef]
- Pavithra, K.G.; Kumar, P.S.; Jaikumar, V.; Rajan, P.S. Removal of colorants from wastewater: A review on sources and treatment strategies. J. Ind. Eng. Chem. 2019, 75, 1–19. [Google Scholar] [CrossRef]
- Mian, M.M.; Liu, G.J. Sewage sludge-derived TiO2/Fe/Fe3C-biochar composite as an efficient heterogeneous catalyst for degradation of methylene blue. Chemosphere 2019, 215, 101–114. [Google Scholar] [CrossRef]
- Shon, H.K.; Vigneswaran, S.; Kim, I.S.; Cho, J.; Kim, G.J.; Kim, J.B.; Kim, J.H. Preparation of titanium dioxide (TiO2) from sludge produced by titanium tetrachloride (TiCl4) flocculation of wastewater. Environ. Sci. Technol. 2007, 41, 1372–1377. [Google Scholar] [CrossRef] [Green Version]
- Shon, H.K.; Vigneswaran, S.; Kandasamy, J.; Zareie, M.H.; Kim, J.B.; Cho, D.L.; Kim, J.H. Preparation and Characterization of Titanium Dioxide (TiO2) from Sludge produced by TiCl4Flocculation with FeCl3, Al2(SO4)3and Ca(OH)2Coagulant Aids in Wastewater. Sep. Sci. Technol. 2009, 44, 1525–1543. [Google Scholar] [CrossRef] [Green Version]
- Shon, H.; Okour, Y.; El Saliby, I.; Park, J.; Cho, D.; Kim, J.B.; Park, H.J.; Kim, J.H. Preparation and Characterisation of Titanium dioxide Produced from Ti-salt Flocculated Sludge in Water Treatment. J. Korean Ind. Eng. Chem. 2009, 20, 241–250. [Google Scholar]
- Okour, Y.; Shon, H.K.; El Saliby, I. Characterisation of titanium tetrachloride and titanium sulfate flocculation in wastewater treatment. Water Sci. Technol. 2009, 59, 2463–2473. [Google Scholar] [CrossRef] [Green Version]
- Hossain, S.M.; Park, M.J.; Tijing, L.; Kim, J.H.; Shon, H. Preparation and Characterization of TiO2 Generated from Synthetic Wastewater Using TiCl4 Based Coagulation/Flocculation Aided with Ca(OH)2. J. Environ. Manag. 2019, 250, 109521. [Google Scholar] [CrossRef]
- Chi, Y.; Tian, C.; Li, H.; Zhao, Y. Polymerized Titanium Salts for Algae-Laden Surface Water Treatment and the Algae-Rich Sludge Recycle toward Chromium and Phenol Degradation from Aqueous Solution. ACS Sustain. Chem. Eng. 2019, 7, 12964–12972. [Google Scholar] [CrossRef]
- Wang, Z.; Wang, Y.; Yu, C.; Zhao, Y.; Fan, M.; Gao, B. The removal of silver nanoparticle by titanium tetrachloride and modified sodium alginate composite coagulants: Floc properties, membrane fouling, and floc recycle. Environ. Sci. Pollut. Res. Int. 2018. [Google Scholar] [CrossRef]
- Nasirian, M.; Lin, Y.P.; Bustillo-Lecompte, C.F.; Mehrvar, M. Enhancement of photocatalytic activity of titanium dioxide using non-metal doping methods under visible light: A review. Int. J. Environ. Sci. Technol. 2017, 15, 2009–2032. [Google Scholar] [CrossRef]
- Liu, C.; Zhang, L.; Liu, R.; Gao, Z.; Yang, X.; Tu, Z.; Yang, F.; Ye, Z.; Cui, L.; Xu, C.; et al. Hydrothermal synthesis of N-doped TiO2 nanowires and N-doped graphene heterostructures with enhanced photocatalytic properties. J. Alloy. Compd. 2016, 656, 24–32. [Google Scholar] [CrossRef]
- Yu, H.; Pan, J.; Bai, Y.; Zong, X.; Li, X.; Wang, L. Hydrothermal synthesis of a crystalline rutile TiO2 nanorod based network for efficient dye-sensitized solar cells. Chemistry 2013, 19, 13569–13574. [Google Scholar] [CrossRef]
- Yu, Q.L.; Hendrix, Y.; Lorencik, S.; Brouwers, H.J.H. Field study of NOx degradation by a mineral-based air purifying paint. Build. Environ. 2018, 142, 70–82. [Google Scholar] [CrossRef]
- Yu, B.; Meng, F.; Khan, M.W.; Qin, R.; Liu, X. Facile synthesis of AgNPs modified TiO2@g-C3N4 heterojunction composites with enhanced photocatalytic activity under simulated sunlight. Mater. Res. Bull. 2020, 121. [Google Scholar] [CrossRef]
- Asahi, R.; Morikawa, T.; Irie, H.; Ohwaki, T. Nitrogen-doped titanium dioxide as visible-light-sensitive photocatalyst: Designs, developments, and prospects. Chem. Rev. 2014, 114, 9824–9852. [Google Scholar] [CrossRef]
- Lee, B.C.; Kim, S.; Shon, H.K.; Vigneswaran, S.; Kim, S.D.; Cho, J.; Kim, I.S.; Choi, K.H.; Kim, J.B.; Park, H.J.; et al. Aquatic toxicity evaluation of TiO2 nanoparticle produced from sludge of TiCl4 flocculation of wastewater and seawater. J. Nanopart. Res. 2008, 11, 2087–2096. [Google Scholar] [CrossRef] [Green Version]
- Wei, X.; Shao, C.; Li, X.; Lu, N.; Wang, K.; Zhang, Z.; Liu, Y. Facile in situ synthesis of plasmonic nanoparticles-decorated g-C3N4/TiO2 heterojunction nanofibers and comparison study of their photosynergistic effects for efficient photocatalytic H2 evolution. Nanoscale 2016, 8, 11034–11043. [Google Scholar] [CrossRef]
- Gao, Z.D.; Qu, Y.F.; Zhou, X.; Wang, L.; Song, Y.Y.; Schmuki, P. Pt-Decorated g-C3N4/TiO2 Nanotube Arrays with Enhanced Visible-Light Photocatalytic Activity for H2 Evolution. ChemistryOpen 2016, 5, 197–200. [Google Scholar] [CrossRef]
- Cui, L.; Liu, S.; Wang, F.; Li, J.; Song, Y.; Sheng, Y.; Zou, H. Growth of uniform g-C3N4 shells on 1D TiO2 nanofibers via vapor deposition approach with enhanced visible light photocatalytic activity. J. Alloy. Compd. 2020, 826. [Google Scholar] [CrossRef]
- Kasuga, T.; Hiramatsu, M.; Hoson, A.; Sekino, T.; Niihara, K. Formation of titanium oxide nanotube. Langmuir 1998, 14, 3160–3163. [Google Scholar] [CrossRef]
- Han, C.; Wang, Y.; Lei, Y.; Wang, B.; Wu, N.; Shi, Q.; Li, Q. In situ synthesis of graphitic-C3N4 nanosheet hybridized N-doped TiO2 nanofibers for efficient photocatalytic H2 production and degradation. Nano Res. 2014, 8, 1199–1209. [Google Scholar] [CrossRef]
- El Saliby, I.; Okour, Y.; Shon, H.K.; Kandasamy, J.; Lee, W.E.; Kim, J.H. TiO2 nanoparticles and nanofibres from TiCl4 flocculated sludge: Characterisation and photocatalytic activity. J. Ind. Eng. Chem. 2012, 18, 1033–1038. [Google Scholar] [CrossRef]
- Li, J.; Ma, W.; Chen, C.; Zhao, J.; Zhu, H.; Gao, X. Photodegradation of dye pollutants on one-dimensional TiO2 nanoparticles under UV and visible irradiation. J. Mol. Catal. A Chem. 2007, 261, 131–138. [Google Scholar] [CrossRef]
- Okour, Y.; Shon, H.K.; El Saliby, I.J.; Naidu, R.; Kim, J.B.; Kim, J.H. Preparation and characterisation of titanium dioxide (TiO2) and thiourea-doped titanate nanotubes prepared from wastewater flocculated sludge. Bioresour. Technol. 2010, 101, 1453–1458. [Google Scholar] [CrossRef]
- Song, X.; Hu, Y.; Zheng, M.M.; Wei, C.H. Solvent-free in situ synthesis of g-C3N4/{001}TiO2 composite with enhanced UV- and visible-light photocatalytic activity for NO oxidation. Appl. Catal. B Environ. 2016, 182, 587–597. [Google Scholar] [CrossRef]
- Ma, J.Z.; Wang, C.X.; He, H. Enhanced photocatalytic oxidation of NO over g-C3N4-TiO2 under UV and visible light. Appl. Catal. B Environ. 2016, 184, 28–34. [Google Scholar] [CrossRef] [Green Version]
- Kobayakawa, K.; Murakami, Y.; Sato, Y. Visible-light active N-doped TiO2 prepared by heating of titanium hydroxide and urea. J. Photochem. Photobiol. A Chem. 2005, 170, 177–179. [Google Scholar] [CrossRef]
- Kim, T.H.; Rodríguez-González, V.; Gyawali, G.; Cho, S.H.; Sekino, T.; Lee, S.W. Synthesis of solar light responsive Fe, N co-doped TiO2 photocatalyst by sonochemical method. Catal. Today 2013, 212, 75–80. [Google Scholar] [CrossRef]
- Nolan, N.T.; Synnott, D.W.; Seery, M.K.; Hinder, S.J.; Van Wassenhoven, A.; Pillai, S.C. Effect of N-doping on the photocatalytic activity of sol-gel TiO2. J. Hazard. Mater. 2012, 211, 88–94. [Google Scholar] [CrossRef] [Green Version]
- Wu, D.; Long, M.; Cai, W.; Chen, C.; Wu, Y. Low temperature hydrothermal synthesis of N-doped TiO2 photocatalyst with high visible-light activity. J. Alloy. Compd. 2010, 502, 289–294. [Google Scholar] [CrossRef]
- Papailias, I.; Todorova, N.; Giannakopoulou, T.; Yu, J.G.; Dimotikali, D.; Trapalis, C. Photocatalytic activity of modified g-C3N4/TiO2 nanocomposites for NOx removal. Catal. Today 2017, 280, 37–44. [Google Scholar] [CrossRef]
- Liu, H.; Yu, D.Q.; Sun, T.B.; Du, H.Y.; Jiang, W.T.; Muhammad, Y.; Huang, L. Fabrication of surface alkalinized g-C3N4 and TiO2 composite for the synergistic adsorption-photocatalytic degradation of methylene blue. Appl. Surf. Sci. 2019, 473, 855–863. [Google Scholar] [CrossRef]
- Huang, Y.; Wang, P.G.; Wang, Z.Y.; Rao, Y.F.; Cao, J.J.; Pu, S.Y.; Ho, W.K.; Lee, S.C. Protonated g-C3N4/Ti( )(3+)self-doped TiO2 nanocomposite films: Room-temperature preparation, hydrophilicity, and application for photocatalytic NOx removal. Appl. Catal. B Environ. 2019, 240, 122–131. [Google Scholar] [CrossRef]
- Jiang, G.M.; Cao, J.W.; Chen, M.; Zhang, X.M.; Dong, F. Photocatalytic NO oxidation on N-doped TiO2/g-C3N4 heterojunction: Enhanced efficiency, mechanism and reaction pathway. Appl. Surf. Sci. 2018, 458, 77–85. [Google Scholar] [CrossRef]
- Giannakopoulou, T.; Papailias, I.; Todorova, N.; Boukos, N.; Liu, Y.; Yu, J.; Trapalis, C. Tailoring the energy band gap and edges’ potentials of g-C3N4/TiO2 composite photocatalysts for NOx removal. Chem. Eng. J. 2017, 310, 571–580. [Google Scholar] [CrossRef]
- Kočí, K.; Reli, M.; Troppová, I.; Šihor, M.; Kupková, J.; Kustrowski, P.; Praus, P. Photocatalytic decomposition of N2O over TiO2/g-C3N4 photocatalysts heterojunction. Appl. Surf. Sci. 2017, 396, 1685–1695. [Google Scholar] [CrossRef]
- Zhang, L.; Jing, D.; She, X.; Liu, H.; Yang, D.; Lu, Y.; Li, J.; Zheng, Z.; Guo, L. Heterojunctions in g-C3N4/TiO2(B) nanofibres with exposed (001) plane and enhanced visible-light photoactivity. J. Mater. Chem. A 2014, 2, 2071–2078. [Google Scholar] [CrossRef] [Green Version]
- Zhao, L.S.; Liu, Y.H.; Wang, L.; Zhao, H.X.; Chen, D.S.; Zhong, B.N.; Wang, J.C.; Qi, T. Production of rutile TiO2 pigment from titanium slag obtained by hydrochloric acid leaching of vanadium-bearing titanomagnetite. Ind. Eng. Chem. Res. 2014, 53, 70–77. [Google Scholar] [CrossRef]
- ISO. 22197-1: Fine Ceramics (Advanced Ceramics, Advanced Technical Ceramics)—Test Method for Air-Purification Performance of Semiconducting Photocatalytic Materials—Part 1: Removal of Nitric Oxide; ISO: Geneva, Switzerland, 2007. [Google Scholar]
- ISO. 17168-1: Fine Ceramics (Advanced Ceramics, Advanced Technical Ceramics)—Test Method for Air-Purification Performance of Semiconducting Photocatalytic Materials Under Indoor Lighting Environment—Part 1: Removal of Nitric Oxide; ISO: Geneva, Switzerland, 2018. [Google Scholar]
- Liao, S.C.; Mayo, W.E.; Pae, K.D. Theory of high pressure/low temperature sintering of bulk nanocrystalline TiO2. Acta Mater. 1997, 45, 4027–4040. [Google Scholar] [CrossRef]
- Thomas, A.; Fischer, A.; Goettmann, F.; Antonietti, M.; Müller, J.O.; Schlögl, R.; Carlsson, J.M. Graphitic carbon nitride materials: Variation of structure and morphology and their use as metal-free catalysts. J. Mater. Chem. 2008, 18. [Google Scholar] [CrossRef] [Green Version]
- Dong, F.; Ou, M.Y.; Jiang, Y.K.; Guo, S.; Wu, Z.B. Efficient and Durable Visible Light Photocatalytic Performance of Porous Carbon Nitride Nanosheets for Air Purification. Ind. Eng. Chem. Res. 2014, 53, 2318–2330. [Google Scholar] [CrossRef]
- Gu, L.; Wang, J.; Zou, Z.; Han, X. Graphitic-C(3)N(4)-hybridized TiO(2) nanosheets with reactive {001} facets to enhance the UV- and visible-light photocatalytic activity. J. Hazard. Mater. 2014, 268, 216–223. [Google Scholar] [CrossRef] [PubMed]
- Thommes, M.; Kaneko, K.; Neimark, A.V.; Olivier, J.P.; Rodriguez-Reinoso, F.; Rouquerol, J.; Sing, K.S.W. Physisorption of gases, with special reference to the evaluation of surface area and pore size distribution (IUPAC Technical Report). Pure Appl. Chem. 2015, 87, 1051–1069. [Google Scholar] [CrossRef] [Green Version]
- Huang, J.; Li, D.; Li, R.; Chen, P.; Zhang, Q.; Liu, H.; Lv, W.; Liu, G.; Feng, Y. One-step synthesis of phosphorus/oxygen co-doped g-C3N4/anatase TiO2 Z-scheme photocatalyst for significantly enhanced visible-light photocatalysis degradation of enrofloxacin. J. Hazard. Mater. 2020, 386, 121634. [Google Scholar] [CrossRef]
- Zhou, B.; Hong, H.; Zhang, H.; Yu, S.; Tian, H. Heterostructured Ag/g-C3N4/TiO2 with enhanced visible light photocatalytic performances. J. Chem. Technol. Biotechnol. 2019, 94, 3806–3814. [Google Scholar] [CrossRef]
- Wang, X.J.; Yang, W.Y.; Li, F.T.; Xue, Y.B.; Liu, R.H.; Hao, Y.J. In Situ Microwave-Assisted Synthesis of Porous N-TiO2/g-C3N4 Heterojunctions with Enhanced Visible-Light Photocatalytic Properties. Ind. Eng. Chem. Res. 2013, 52, 17140–17150. [Google Scholar] [CrossRef]
- Troppová, I.; Šihor, M.; Reli, M.; Ritz, M.; Praus, P.; Kočí, K. Unconventionally prepared TiO2/g-C3N4 photocatalysts for photocatalytic decomposition of nitrous oxide. Appl. Surf. Sci. 2018, 430, 335–347. [Google Scholar] [CrossRef]
- Rhee, I.; Lee, J.S.; Kim, J.B.; Kim, J.H. Nitrogen oxides mitigation efficiency of cementitious materials incorporated with TiO2. Materials 2018, 11, 877. [Google Scholar] [CrossRef] [Green Version]
- Park, S.M.; Chekli, L.; Kim, J.B.; Shahid, M.; Shon, H.K.; Kim, P.S.; Lee, W.S.; Lee, W.E.; Kim, J.H. NOx removal of mortar mixed with titania produced from Ti-salt flocculated sludge. J. Ind. Eng. Chem. 2014, 20, 3851–3856. [Google Scholar] [CrossRef]


| ID | Amount (g) | Prepared Sample (g) | Mixing Ratio | |
|---|---|---|---|---|
| H-TNT | Melamine | |||
| S-TNT | 2.5 | - | 2.4 | - |
| S-TNT1 | 2.5 | 1.25 | 2.1 | 2:1 |
| S-TNT2 | 2.5 | 2.5 | 2 | 1:1 |
Publisher’s Note: MDPI stays neutral with regard to jurisdictional claims in published maps and institutional affiliations. |
© 2020 by the authors. Licensee MDPI, Basel, Switzerland. This article is an open access article distributed under the terms and conditions of the Creative Commons Attribution (CC BY) license (http://creativecommons.org/licenses/by/4.0/).
Share and Cite
Hossain, S.M.; Park, H.; Kang, H.-J.; Mun, J.S.; Tijing, L.; Rhee, I.; Kim, J.-H.; Jun, Y.-S.; Shon, H.K. Modified Hydrothermal Route for Synthesis of Photoactive Anatase TiO2/g-CN Nanotubes from Sludge Generated TiO2. Catalysts 2020, 10, 1350. https://doi.org/10.3390/catal10111350
Hossain SM, Park H, Kang H-J, Mun JS, Tijing L, Rhee I, Kim J-H, Jun Y-S, Shon HK. Modified Hydrothermal Route for Synthesis of Photoactive Anatase TiO2/g-CN Nanotubes from Sludge Generated TiO2. Catalysts. 2020; 10(11):1350. https://doi.org/10.3390/catal10111350
Chicago/Turabian StyleHossain, Sayed Mukit, Heeju Park, Hui-Ju Kang, Jong Seok Mun, Leonard Tijing, Inkyu Rhee, Jong-Ho Kim, Young-Si Jun, and Ho Kyong Shon. 2020. "Modified Hydrothermal Route for Synthesis of Photoactive Anatase TiO2/g-CN Nanotubes from Sludge Generated TiO2" Catalysts 10, no. 11: 1350. https://doi.org/10.3390/catal10111350