
Role of the Skin Microenvironment in Melanomagenesis: Epidermal Keratinocytes and Dermal Fibroblasts Promote BRAF Oncogene-Induced Senescence Escape in Melanocytes

 , , and
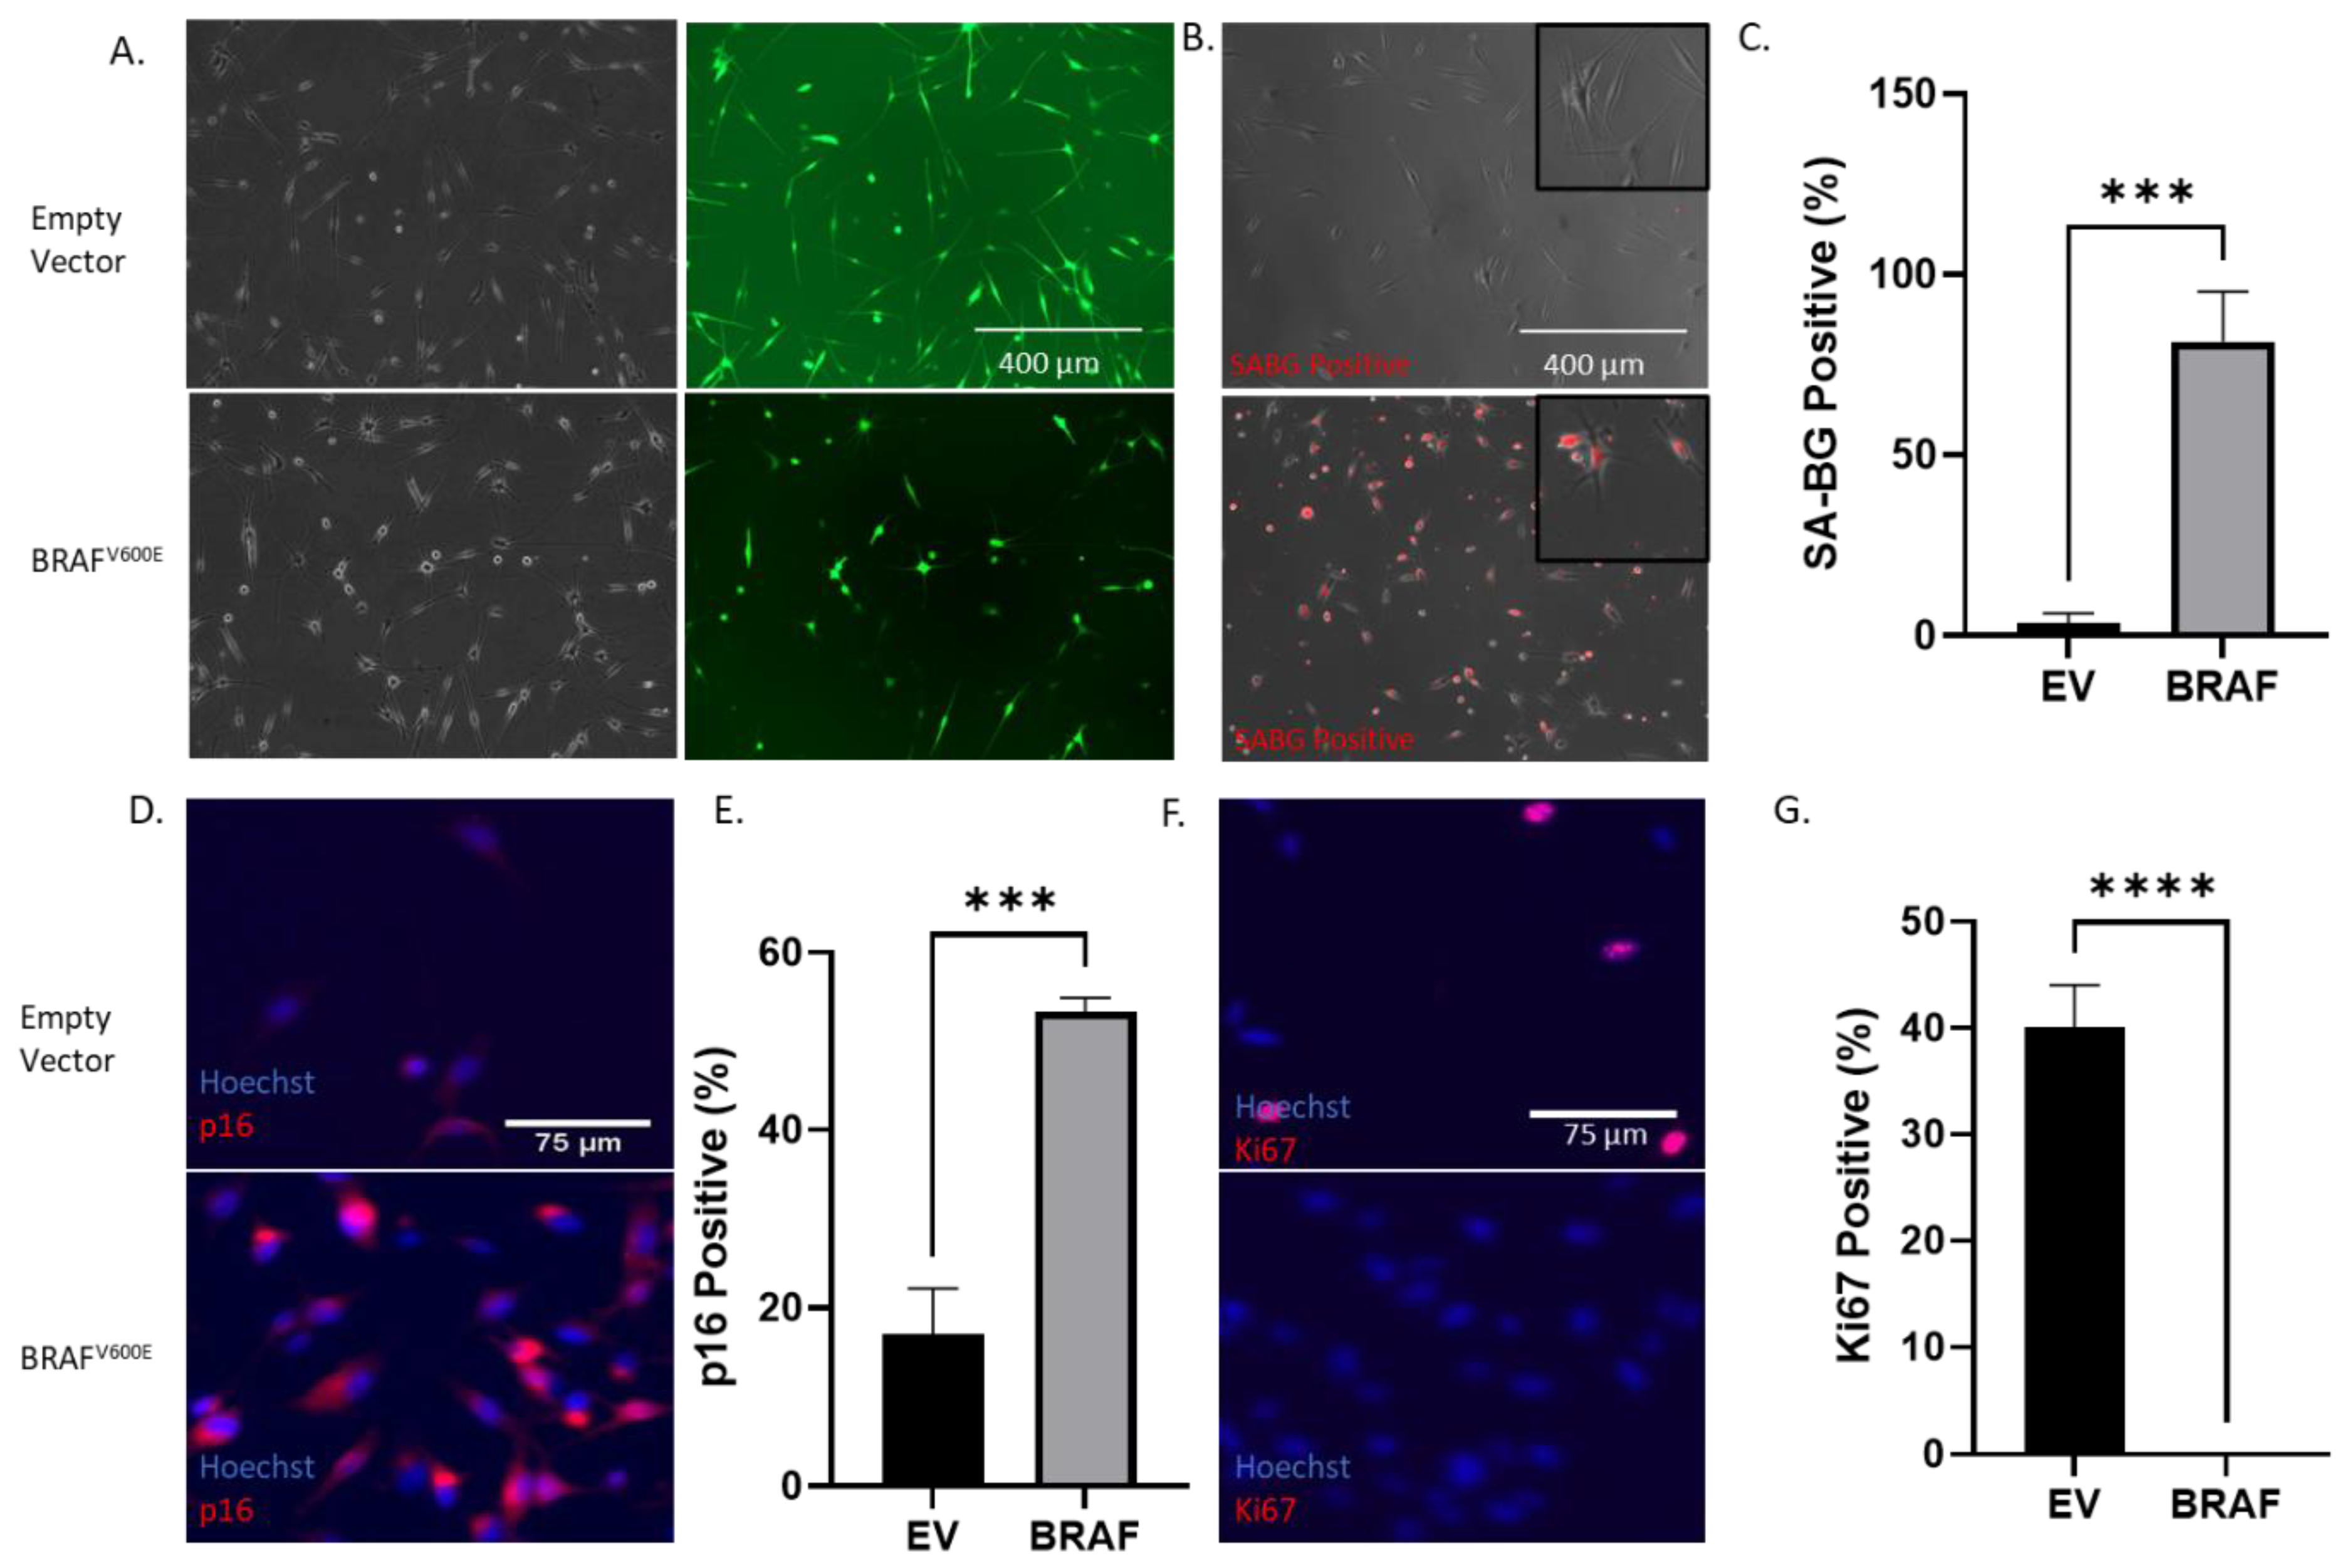
Abstract
:Simple Summary
Abstract
1. Introduction
2. Results
2.1. BRAFV600E Transformation Induces a Growth Arrest and Senescence after an Initial Burst of Proliferation in Normal Human Melanocytes
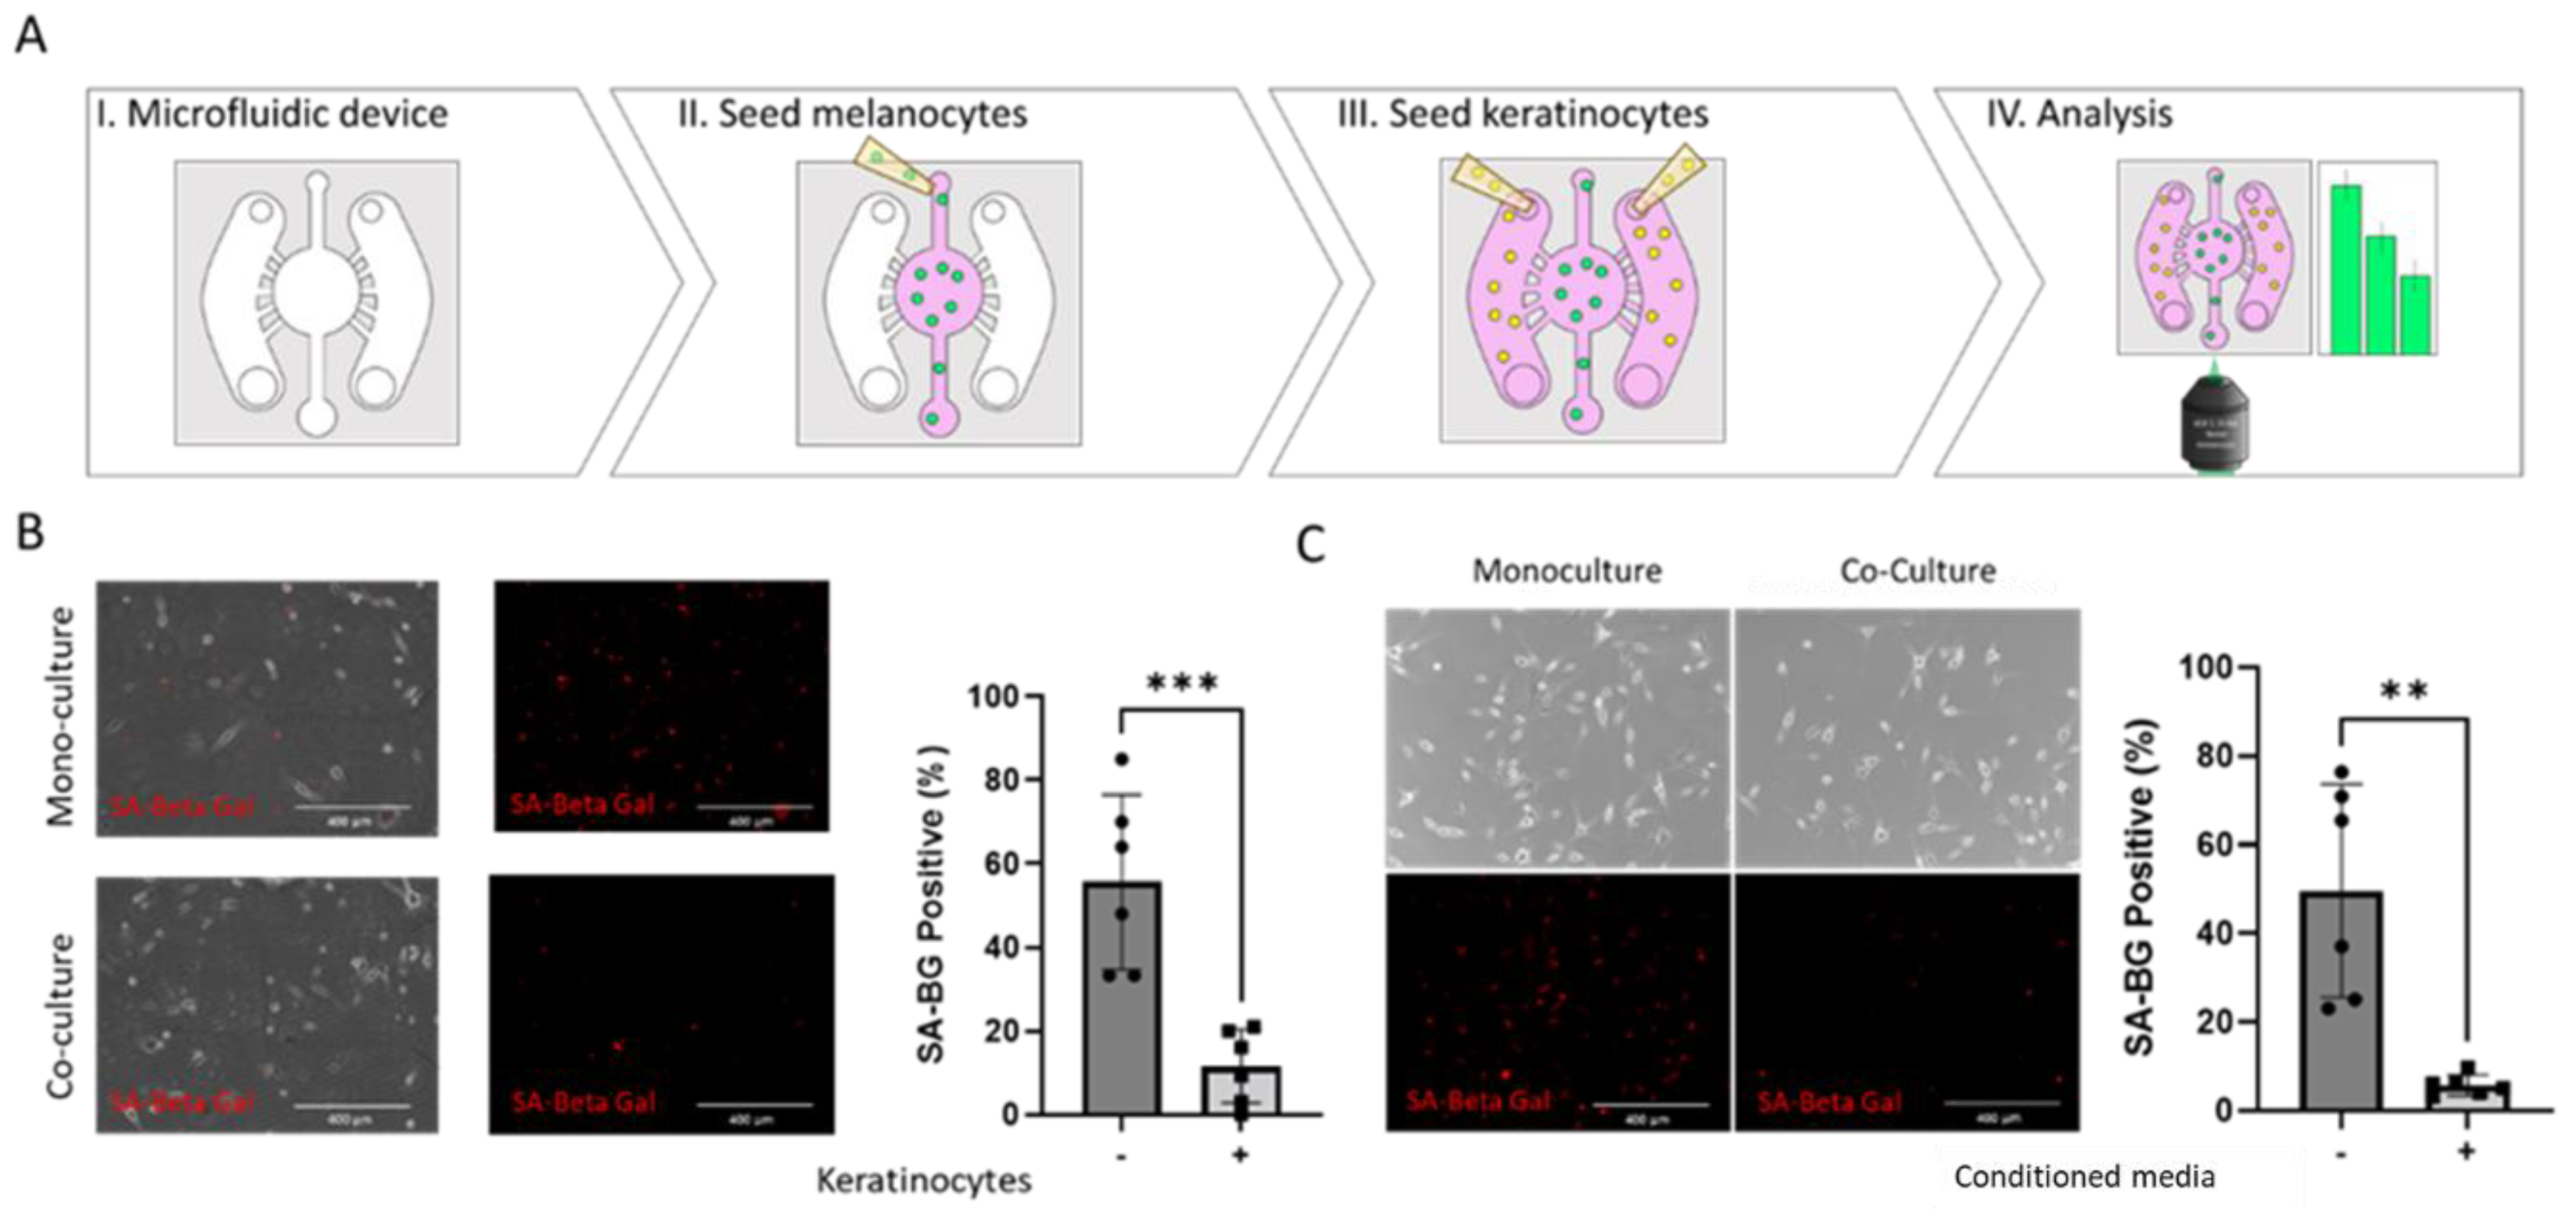
2.2. Keratinocytes Suppress Oncogene-Induced Senescence in BRAFV600E Melanocytes
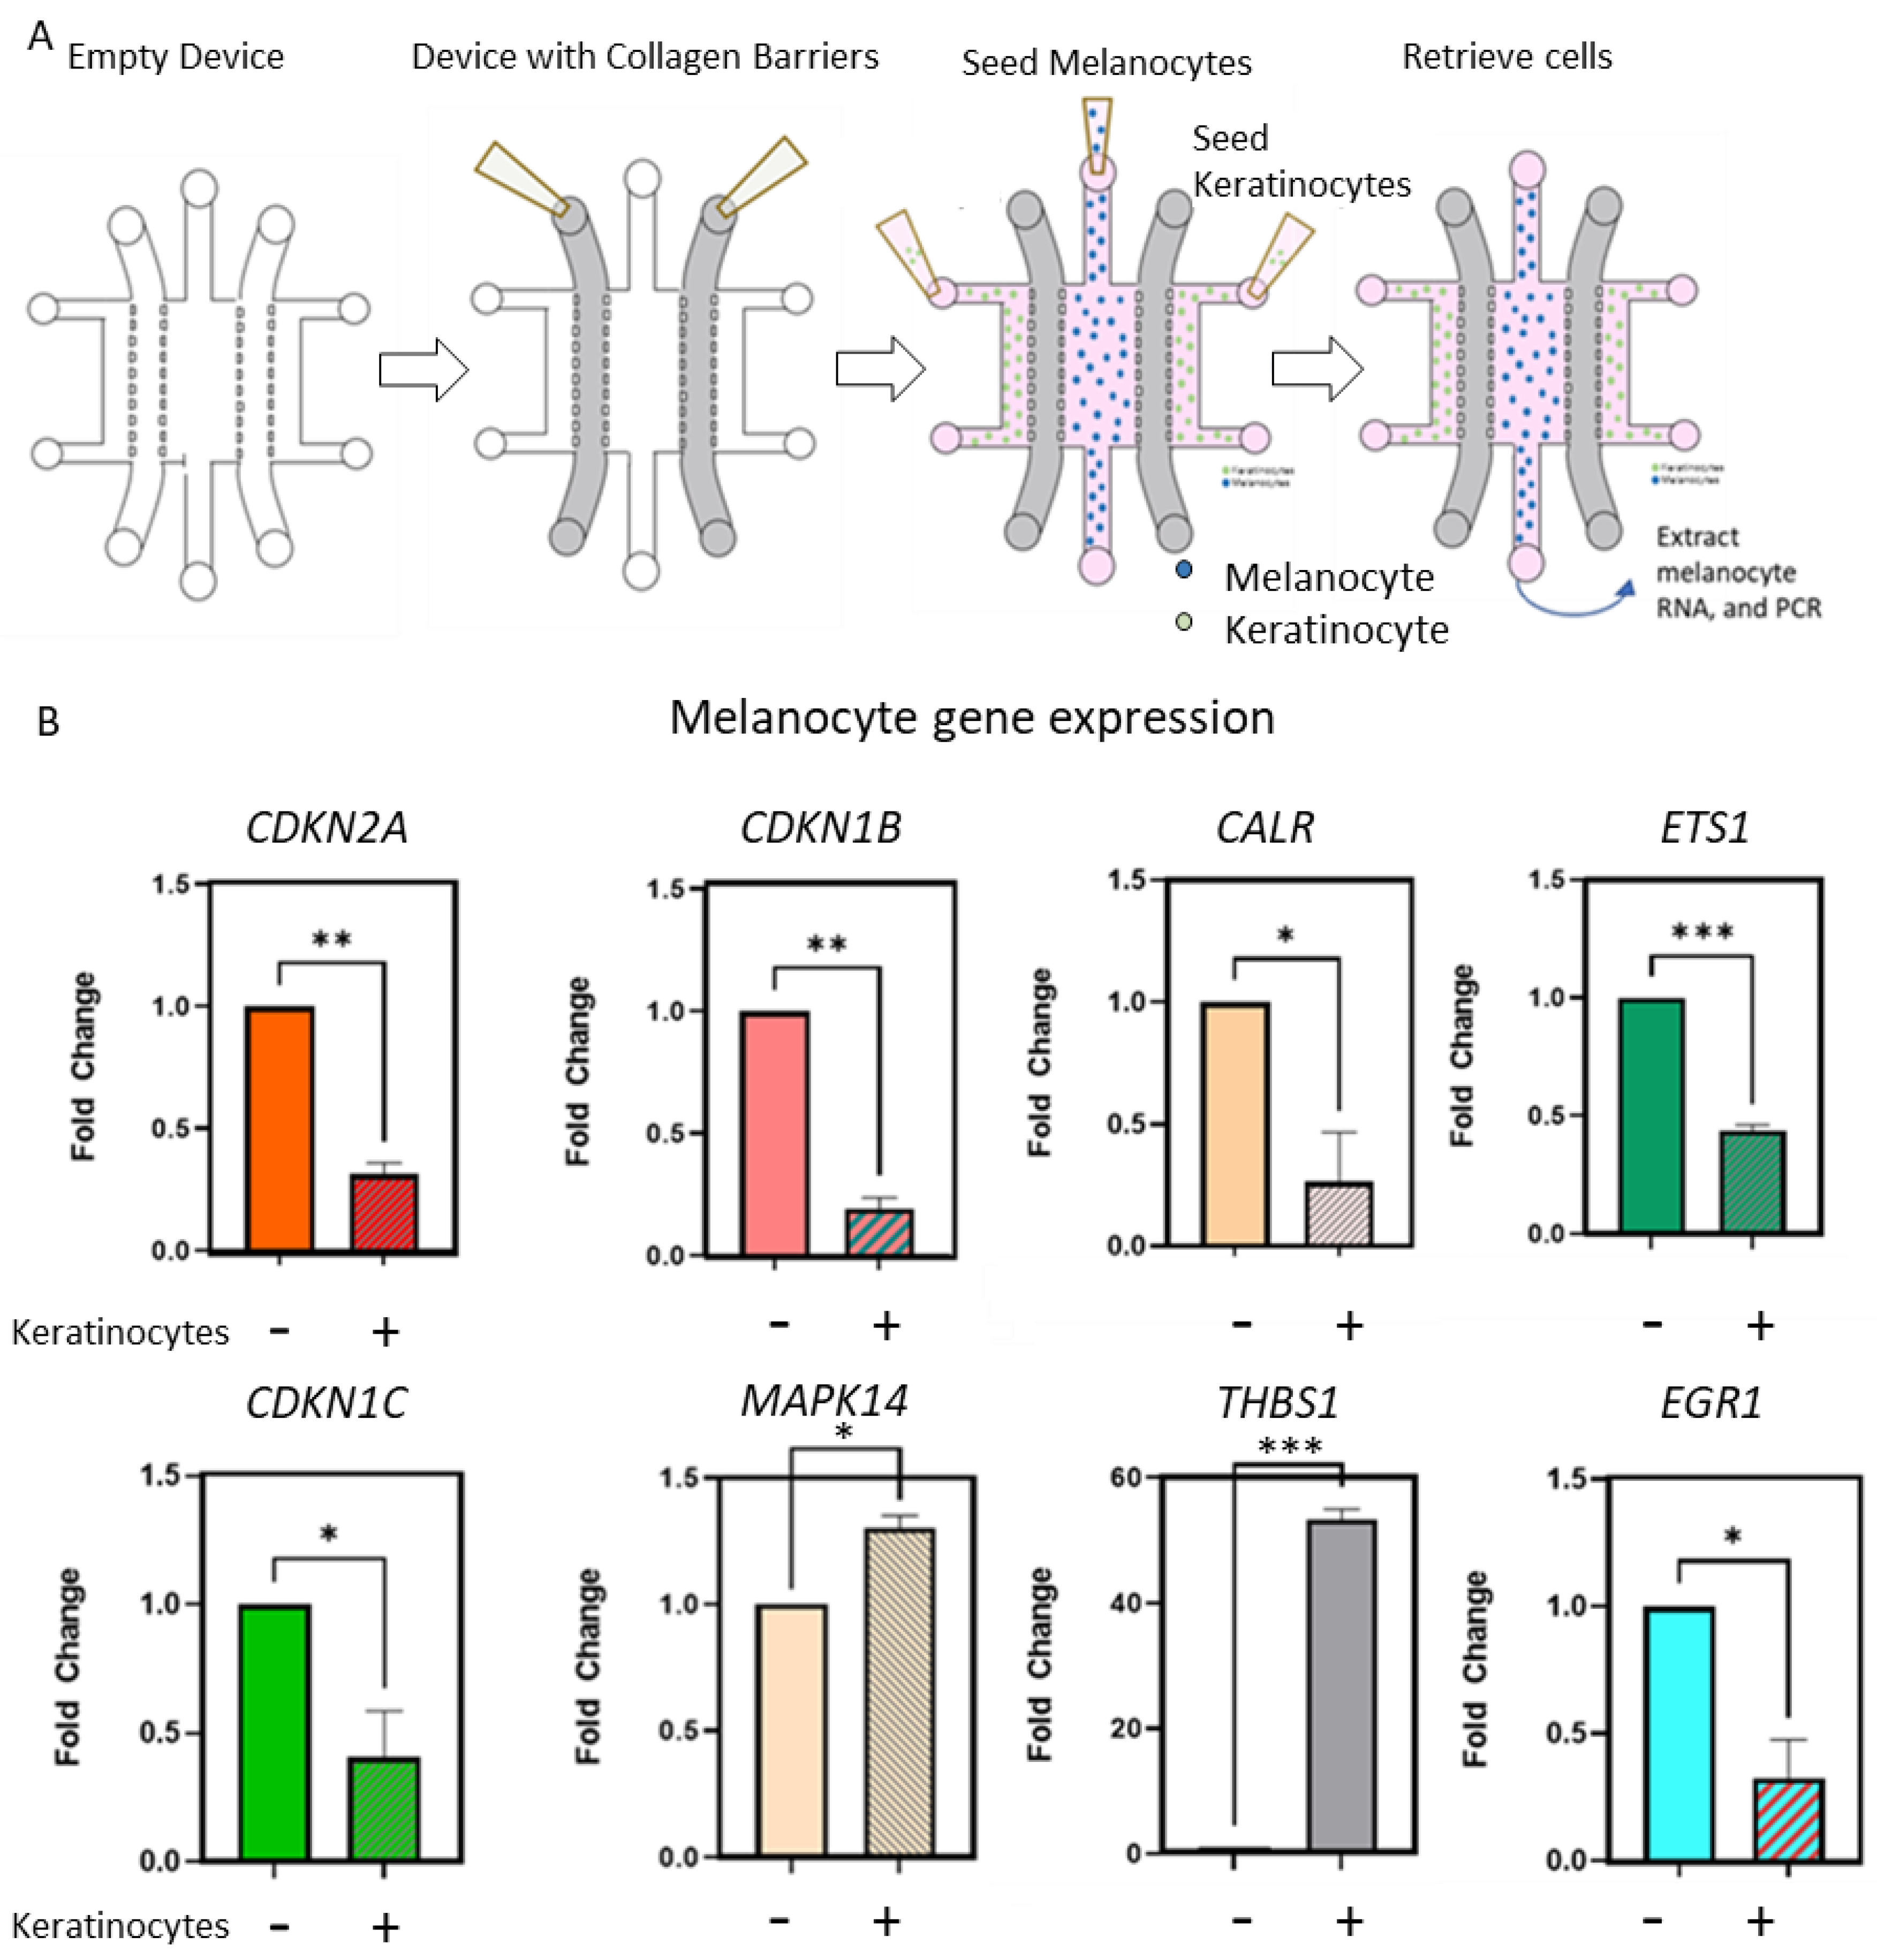
2.3. Keratinocytes Condition OIS-Associated Gene Expression in Primary Melanocytes
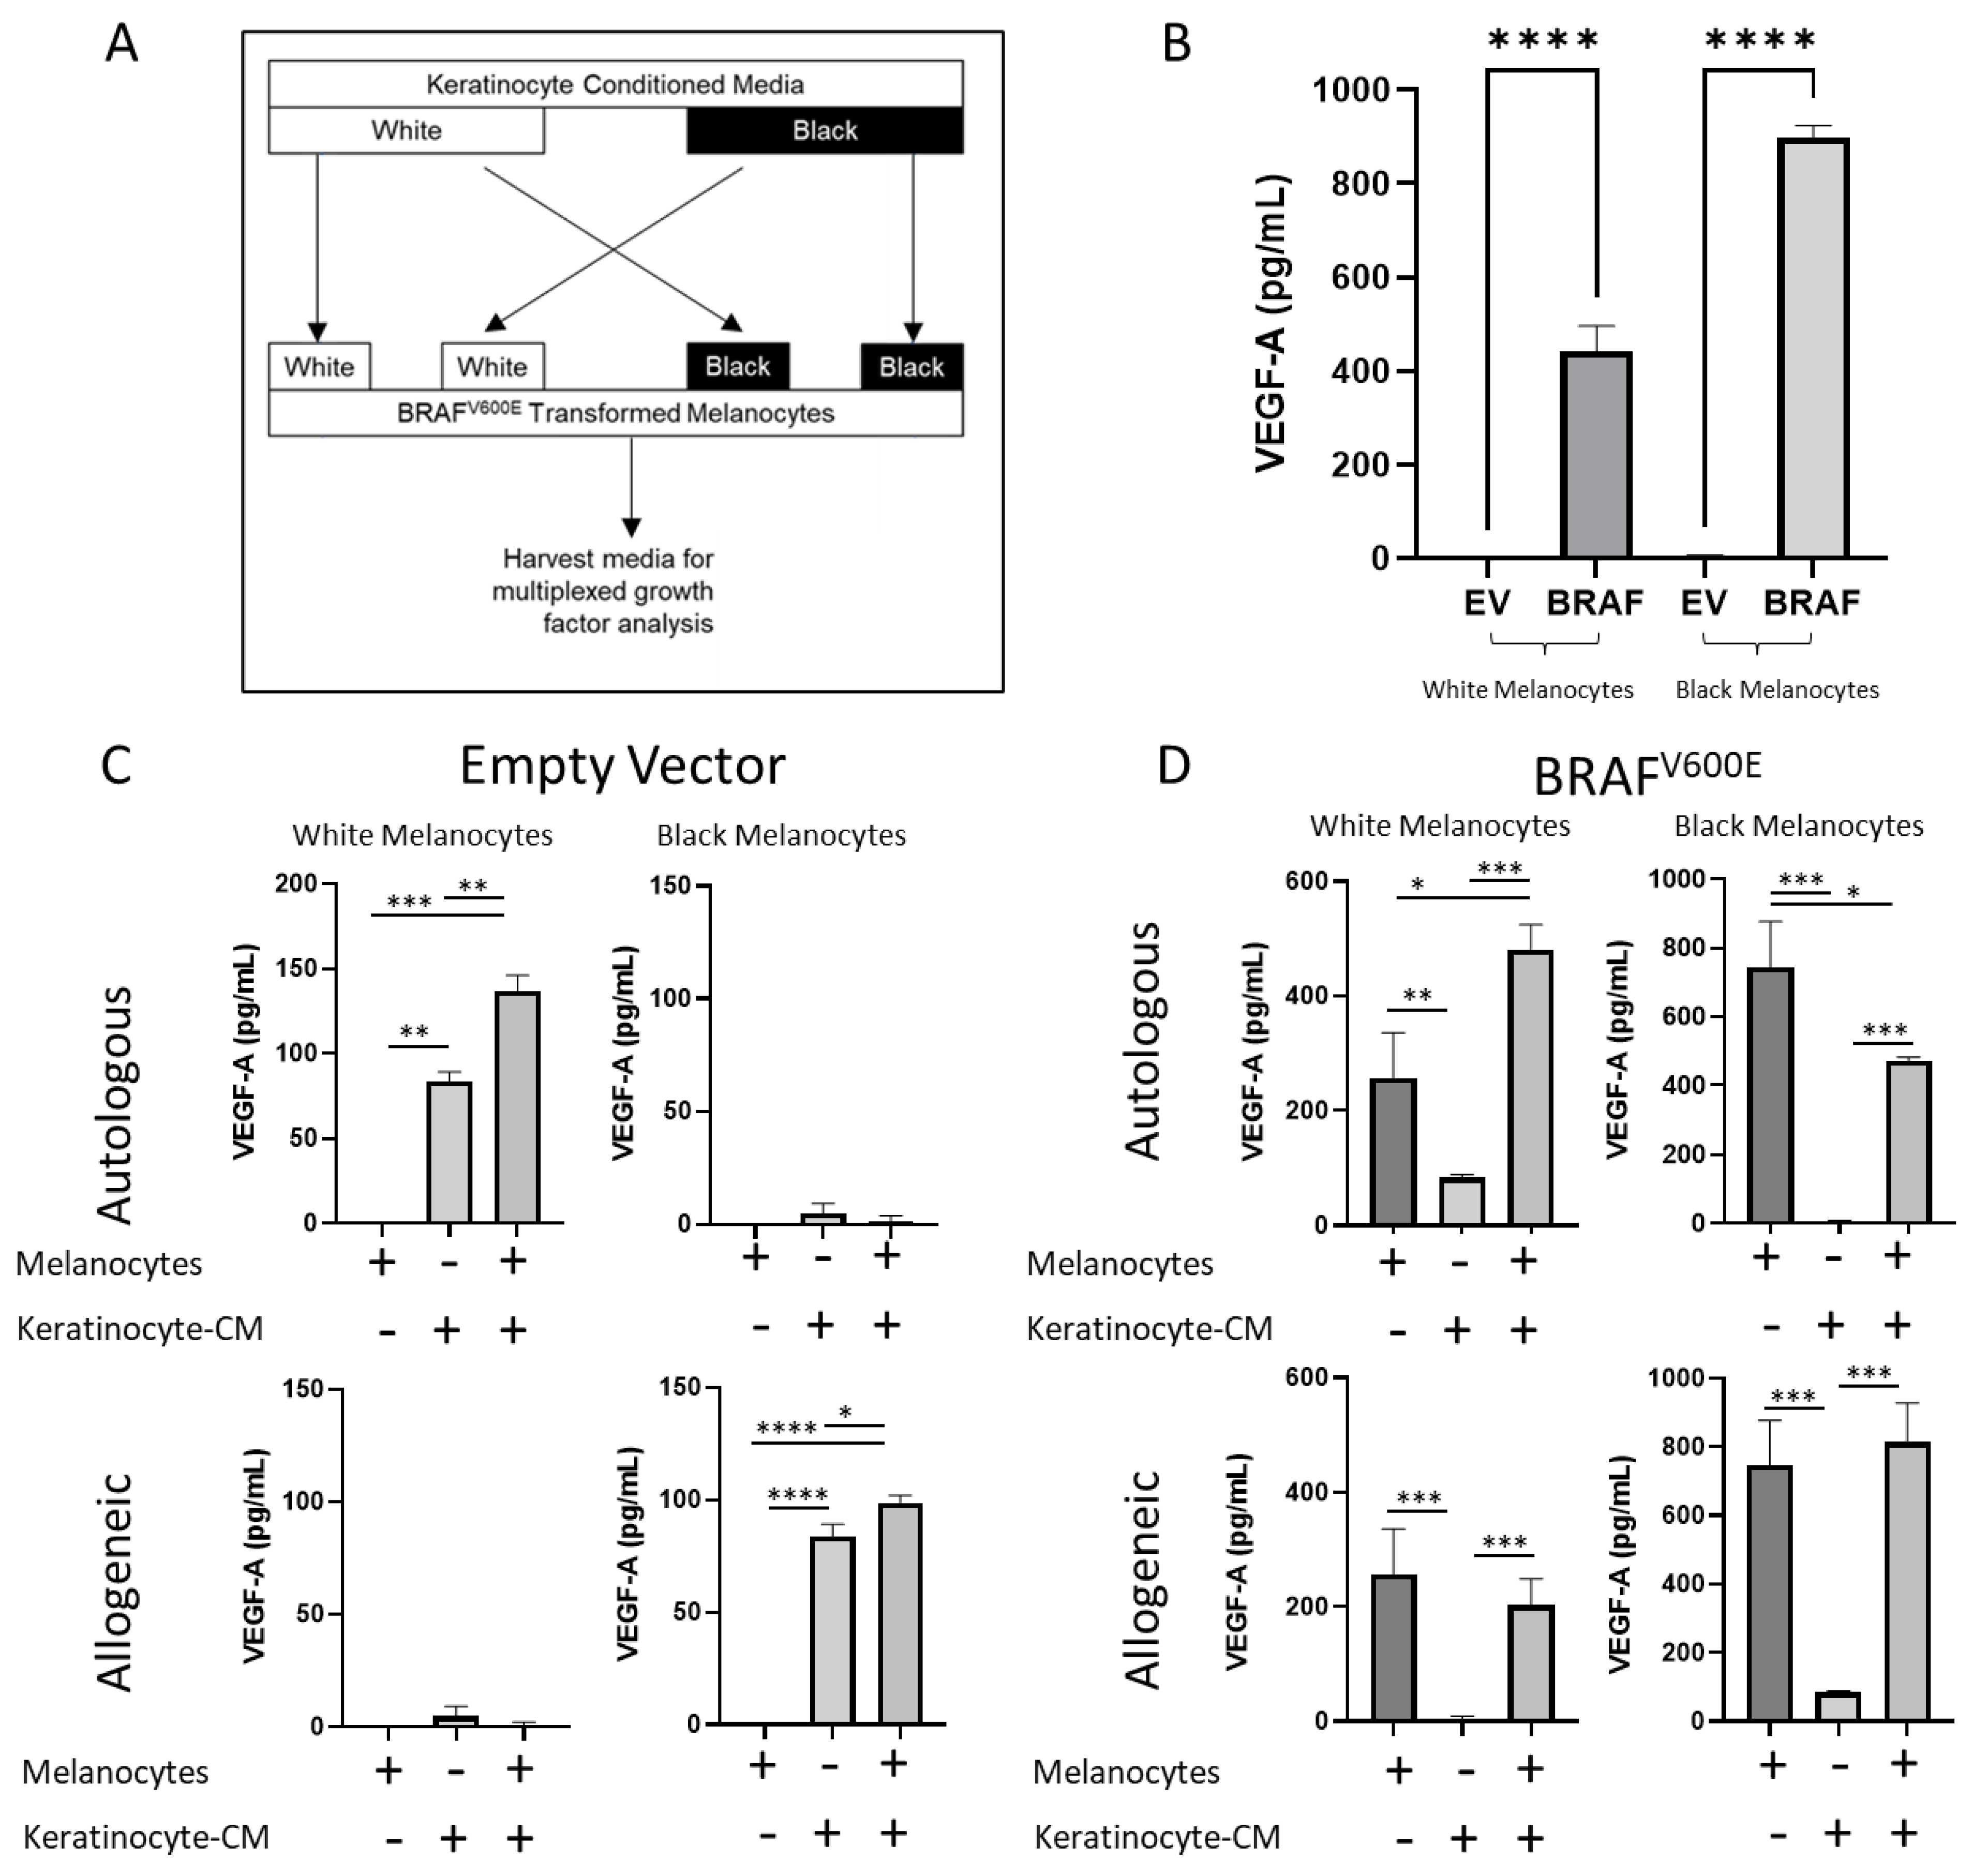
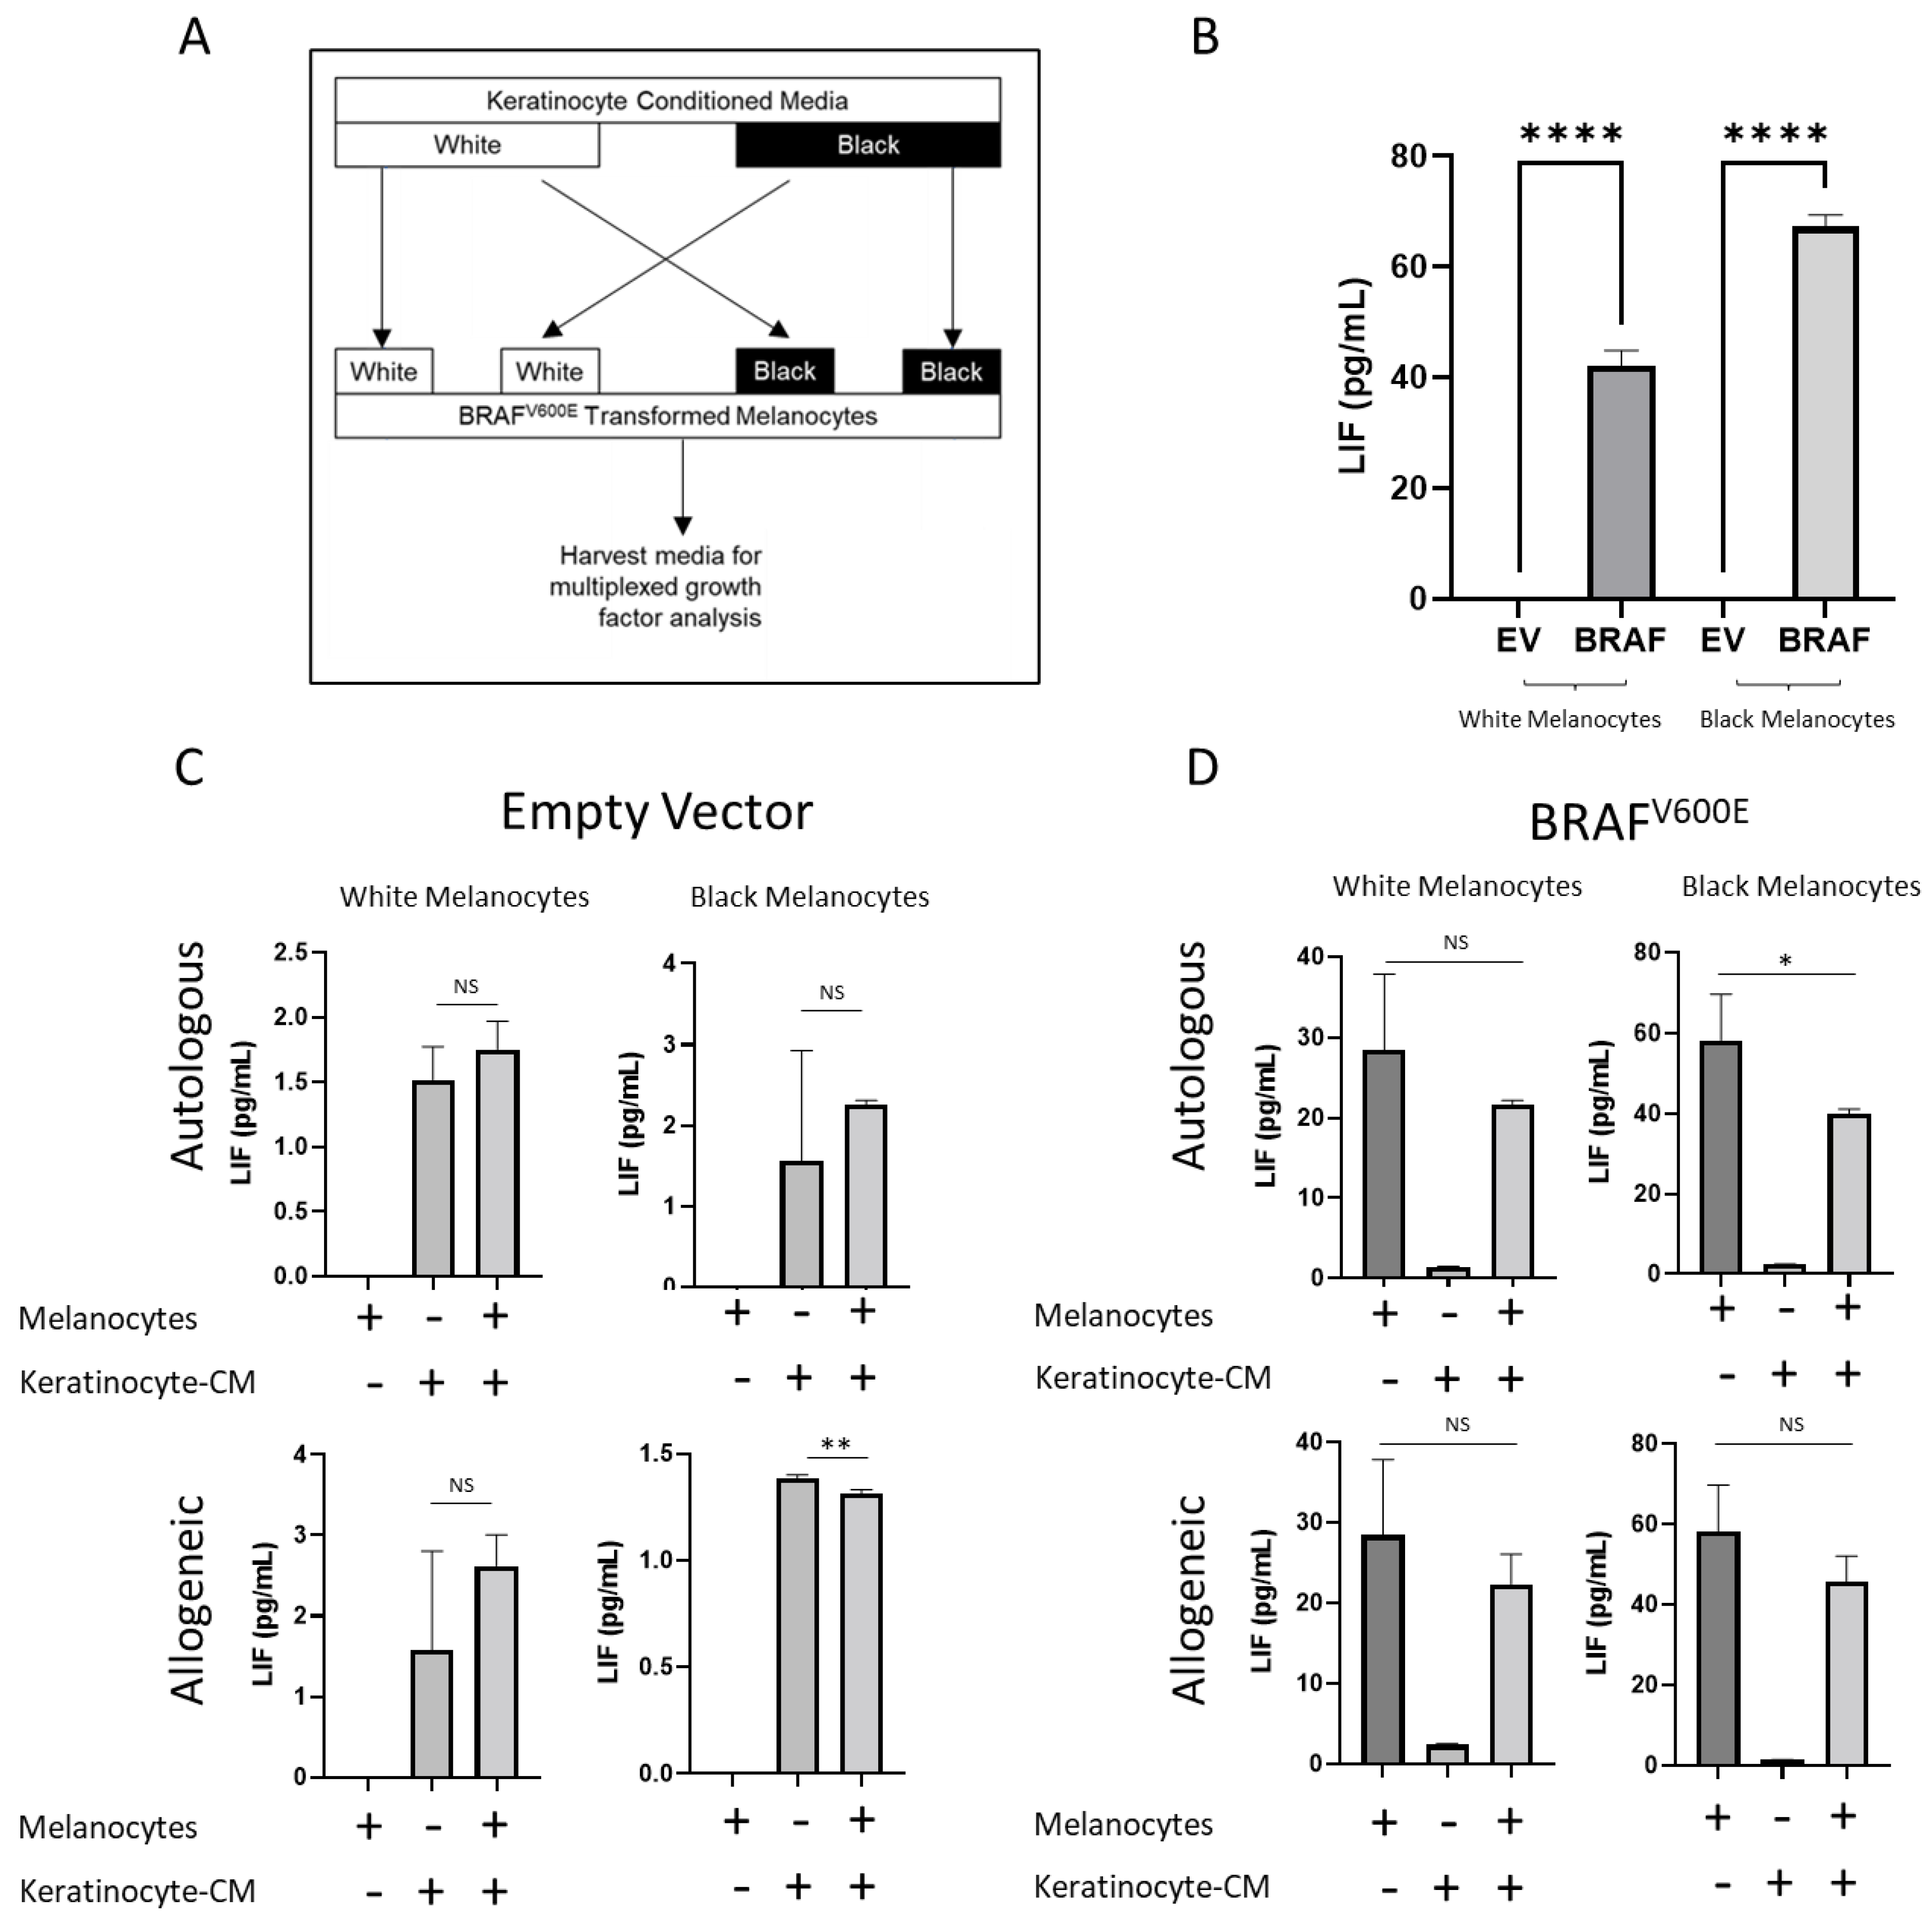
2.4. BRAFV600E Transformation and Keratinocytes Alter Growth Factor Secretion in Melanocytes
3. Discussion
4. Materials and Methods
4.1. Microdevice Fabrication and Operation
4.2. Cell Culture
4.3. Lentivirus Preparation and Transduction
4.4. Senescence-Associated Beta-Galactosidase Analysis
4.5. Immunofluorescence
4.6. RNA Isolation and qPCR
4.7. Multiplexed Assay for the Measurement of Growth Factor Secretion
4.8. Images and Statistical Analysis
5. Conclusions
Supplementary Materials
Author Contributions
Funding
Institutional Review Board Statement
Informed Consent Statement
Data Availability Statement
Acknowledgments
Conflicts of Interest
References
- American Cancer Society. Key Statistics for Melanoma Skin Cancer. 2021. Available online: https://www.cancer.org/cancer/melanoma-skin-cancer/about/key-statistics.html (accessed on 5 September 2021).
- Vultur, A.; Herlyn, M. SnapShot: Melanoma. Cancer Cell 2013, 23, 706. [Google Scholar] [CrossRef] [Green Version]
- Davies, H.; Bignell, G.R.; Cox, C.; Stephens, P.; Edkins, S.; Clegg, S.; Teague, J.; Woffendin, H.; Garnett, M.J.; Bottomley, W.; et al. Mutations of the BRAF gene in human cancer. Nature 2002, 417, 949–954. [Google Scholar] [CrossRef] [PubMed]
- Pollock, P.; Harper, U.L.; Hansen, K.S.; Yudt, L.M.; Stark, M.; Robbins, C.M.; Moses, T.Y.; Hostetter, G.; Wagner, U.; Kakareka, J.; et al. High frequency of BRAF mutations in nevi. Nat. Genet. 2003, 33, 19–20. [Google Scholar] [CrossRef] [PubMed]
- Michaloglou, C.; Vredeveld, L.C.W.; Soengas, M.S.; Denoyelle, C.; Kuilman, T.; Van Der Horst, C.M.A.M.; Majoor, D.M.; Shay, J.W.; Mooi, W.J.; Peeper, D.S. BRAFE600-associated senescence-like cell cycle arrest of human naevi. Nature 2005, 436, 720–724. [Google Scholar] [CrossRef]
- Vredeveld, L.C.; Possik, P.A.; Smit, M.A.; Meissl, K.; Michaloglou, C.; Horlings, H.M.; Ajouaou, A.; Kortman, P.C.; Dankort, D.; McMahon, M.; et al. Abrogation of BRAFV600E-induced senescence by PI3K pathway activation contributes to melanomagenesis. Genes Dev. 2012, 26, 1055–1069. [Google Scholar] [CrossRef] [Green Version]
- Yu, Y.; Schleich, K.; Yue, B.; Ji, S.; Lohneis, P.; Kemper, K.; Silvis, M.R.; Qutob, N.; van Rooijen, E.; Werner-Klein, M.; et al. Targeting the Senescence-Overriding Cooperative Activity of Structurally Unrelated H3K9 Demethylases in Melanoma. Cancer Cell 2018, 33, 322–336.e8. [Google Scholar] [CrossRef] [Green Version]
- Haass, N.K.; Herlyn, M. Normal human melanocyte homeostasis as a paradigm for understanding melanoma. J. Investig. Dermatol. Symp. Proc. 2005, 10, 153–163. [Google Scholar] [CrossRef] [Green Version]
- Hachiya, A.; Kobayashi, A.; Yoshida, Y.; Kitahara, T.; Takema, Y.; Imokawa, G. Biphasic Expression of Two Paracrine Melanogenic Cytokines, Stem Cell Factor and Endothelin-1, in Ultraviolet B-Induced Human Melanogenesis. Am. J. Pathol. 2004, 165, 2099–2109. [Google Scholar] [CrossRef] [Green Version]
- Imokawa, G.; Yada, Y.; Miyagishi, M. Endothelins secreted from human keratinocytes are intrinsic mitogens for human melanocytes. J. Biol. Chem. 1992, 267, 24675–24680. [Google Scholar] [CrossRef]
- Shih, I.M.; Elder, D.E.; Hsu, M.Y.; Herlyn, M. Regulation of Mel-CAM/MUC18 expression on melanocytes of different stages of tumor progression by normal keratinocytes. Am. J. Pathol. 1994, 145, 837–845. [Google Scholar]
- Valyi-Nagy, I.T.; Hirka, G.; Jensen, P.J.; Shih, I.M.; Juhasz, I.; Herlyn, M. Undifferentiated keratinocytes control growth, morphology, and antigen expression of normal melanocytes through cell-cell contact. Lab. Investig. 1993, 69, 152–159. [Google Scholar] [PubMed]
- Slominski, A.; Zmijewski, M.A.; Pawelek, J. L-tyrosine and L-dihydroxyphenylalanine as hormone-like regulators of melanocyte functions. Pigment Cell Melanoma Res. 2012, 25, 14–27. [Google Scholar] [CrossRef] [PubMed] [Green Version]
- Slominski, A.; Tobin, D.J.; Shibahara, S.; Wortsman, J. Melanin Pigmentation in Mammalian Skin and Its Hormonal Regulation. Physiol. Rev. 2004, 84, 1155–1228. [Google Scholar] [CrossRef]
- Tadokoro, R.; Takahashi, Y. Intercellular transfer of organelles during body pigmentation. Curr. Opin. Genet. Dev. 2017, 45, 132–138. [Google Scholar] [CrossRef]
- Wolff, K. Melanocyte-keratinocyte interactions in vivo: The fate of melanosomes. Yale J. Biol. Med. 1973, 46, 384–396. [Google Scholar]
- Ayuso, J.M.; Sadangi, S.; Lares, M.; Rehman, S.; Humayun, M.; Denecke, K.M.; Skala, M.C.; Beebe, D.J.; Setaluri, V. Microfluidic model with air-walls reveals fibroblasts and keratinocytes modulate melanoma cell phenotype, migration, and metabolism. Lab Chip 2021, 21, 1139–1149. [Google Scholar] [CrossRef]
- Škalamera, D.; Stevenson, A.J.; Ehmann, A.; Ainger, S.A.; Lanagan, C.; Sturm, R.A.; Gabrielli, B. Melanoma mutations modify melanocyte dynamics in co-culture with keratinocytes or fibroblasts. J. Cell Sci. 2019, 132, jcs234716. [Google Scholar] [CrossRef]
- Ayuso, J.M.; Virumbrales-Munoz, M.; McMinn, P.H.; Rehman, S.; Gomez, I.; Karim, M.R.; Trusttchel, R.; Wisinski, K.B.; Beebe, D.J.; Skala, M.C. Tumor-on-a-chip: A microfluidic model to study cell response to environmental gradients. Lab Chip 2019, 19, 3461–3471. [Google Scholar] [CrossRef] [PubMed]
- Benam, K.H.; Villenave, R.; Lucchesi, C.; Varone, A.; Hubeau, C.; Lee, H.-H.; Alves, S.E.; Salmon, M.; Ferrante, T.C.; Weaver, J.C.; et al. Small airway-on-a-chip enables analysis of human lung inflammation and drug responses in vitro. Nat. Methods 2016, 13, 151–157. [Google Scholar] [CrossRef] [PubMed]
- Ayuso, J.M.; Park, K.-Y.; Virumbrales-Muñoz, M.; Beebe, D.J. Toward improved in vitro models of human cancer. APL Bioeng. 2021, 5, 010902. [Google Scholar] [CrossRef]
- Virumbrales-Muñoz, M.; Ayuso, J.M.; Gong, M.M.; Humayun, M.; Livingston, M.K.; Lugo-Cintrón, K.M.; McMinn, P.; Álvarez-García, Y.R.; Beebe, D.J. Microfluidic lumen-based systems for advancing tubular organ modeling. Chem. Soc. Rev. 2020, 49, 6402–6442. [Google Scholar] [CrossRef]
- Ayuso, J.M.; Rehman, S.; Virumbrales-Munoz, M.; McMinn, P.H.; Geiger, P.; Fitzgerald, C.; Heaster, T.; Skala, M.C.; Beebe, D.J. Microfluidic tumor-on-a-chip model to evaluate the role of tumor environmental stress on NK cell exhaustion. Sci. Adv. 2021, 7, eabc2331. [Google Scholar] [CrossRef]
- Bischel, L.L.; Sung, K.E.; Jiménez-Torres, J.A.; Mader, B.; Keely, P.J.; Beebe, D.J. The importance of being a lumen. FASEB J. 2014, 28, 4583–4590. [Google Scholar] [CrossRef]
- Ayuso, J.; Rehman, S.; Farooqui, M.; Virumbrales-Muñoz, M.; Setaluri, V.; Skala, M.; Beebe, D. Microfluidic Tumor-on-a-Chip Model to Study Tumor Metabolic Vulnerability. Int. J. Mol. Sci. 2020, 21, 9075. [Google Scholar] [CrossRef]
- Windler, C.; Gey, C.; Seeger, K. Skin melanocytes and fibroblasts show different changes in choline metabolism during cellular senescence. Mech. Ageing Dev. 2017, 164, 82–90. [Google Scholar] [CrossRef]
- Bennett, D.C. Human melanocyte senescence and melanoma susceptibility genes. Oncogene 2003, 22, 3063–3069. [Google Scholar] [CrossRef] [Green Version]
- Gray-Schopfer, V.C.; Cheong, S.C.; Chong, H.; Chow, J.; Moss, T.; Abdel-Malek, Z.A.; Marais, R.; Wynford-Thomas, D.; Bennett, D.C. Cellular senescence in naevi and immortalisation in melanoma: A role for p16? Br. J. Cancer 2006, 95, 496–505. [Google Scholar] [CrossRef] [Green Version]
- Ha, L.; Merlino, G.; Sviderskaya, E.V. Melanomagenesis: Overcoming the barrier of melanocyte senescence. Cell Cycle 2008, 7, 1944–1948. [Google Scholar] [CrossRef] [Green Version]
- Lin, A.W.; Barradas, M.; Stone, J.C.; van Aelst, L.; Serrano, M.; Lowe, S.W. Premature senescence involving p53 and p16 is activated in response to constitutive MEK/MAPK mitogenic signaling. Genes Dev. 1998, 12, 3008–3019. [Google Scholar] [CrossRef] [Green Version]
- McNeal, A.S.; Liu, K.; Nakhate, V.; Natale, C.; Duperret, E.K.; Capell, B.C.; Dentchev, T.; Berger, S.; Herlyn, M.; Seykora, J.T.; et al. CDKN2B Loss Promotes Progression from Benign Melanocytic Nevus to Melanoma. Cancer Discov. 2015, 5, 1072–1085. [Google Scholar] [CrossRef] [Green Version]
- Feng, M.; Marjon, K.D.; Zhu, F.; Weissman-Tsukamoto, R.; Levett, A.; Sullivan, K.; Kao, K.S.; Markovic, M.; Bump, P.A.; Jackson, H.M.; et al. Programmed cell removal by calreticulin in tissue homeostasis and cancer. Nat. Commun. 2018, 9, 3194. [Google Scholar] [CrossRef]
- O’Hara, S.P.; Splinter, P.L.; Trussoni, C.E.; Pisarello, M.J.L.; Loarca, L.; Splinter, N.S.; Schutte, B.F.; LaRusso, N.F. ETS Proto-oncogene 1 Transcriptionally Up-regulates the Cholangiocyte Senescence-associated Protein Cyclin-dependent Kinase Inhibitor 2A. J. Biol. Chem. 2017, 292, 4833–4846. [Google Scholar] [CrossRef] [Green Version]
- Ohtani, N.; Zebedee, Z.; Huot, T.J.G.; Stinson, J.A.; Sugimoto, M.; Ohashi, Y.; Sharrocks, A.D.; Peters, G.; Hara, E. Opposing effects of Ets and Id proteins on p16INK4a expression during cellular senescence. Nature 2001, 409, 1067–1070. [Google Scholar] [CrossRef]
- Krones-Herzig, A.; Adamson, E.; Mercola, D. Early growth response 1 protein, an upstream gatekeeper of the p53 tumor suppressor, controls replicative senescence. Proc. Natl. Acad. Sci. USA 2003, 100, 3233–3238. [Google Scholar] [CrossRef] [Green Version]
- Guillon, J.; Petit, C.; Moreau, M.; Toutain, B.; Henry, C.; Roché, H.; Bonichon-Lamichhane, N.; Salmon, J.P.; Lemonnier, J.; Campone, M.; et al. Regulation of senescence escape by TSP1 and CD47 following chemotherapy treatment. Cell Death Dis. 2019, 10, 199. [Google Scholar] [CrossRef]
- Jayachandran, A.; Anaka, M.; Prithviraj, P.; Hudson, C.; McKeown, S.J.; Lo, P.-H.; Vella, L.J.; Goding, C.R.; Cebon, J.; Behren, A. Thrombospondin 1 promotes an aggressive phenotype through epithelial-to-mesenchymal transition in human melanoma. Oncotarget 2014, 5, 5782–5797. [Google Scholar] [CrossRef] [Green Version]
- Crombie, I.K. Racial differences in melanoma incidence. Br. J. Cancer 1979, 40, 185–193. [Google Scholar] [CrossRef] [Green Version]
- Rajabi, P.; Neshat, A.; Mokhtari, M.; Rajabi, M.A.; Eftekhari, M.; Tavakoli, P. The role of VEGF in melanoma progression. J. Res. Med. Sci. 2012, 17, 534–539. [Google Scholar]
- Atzori, M.G.; Ceci, C.; Ruffini, F.; Trapani, M.; Barbaccia, M.L.; Tentori, L.; D’Atri, S.; Lacal, P.M.; Graziani, G. Role of VEGFR-1 in melanoma acquired resistance to the BRAF inhibitor vemurafenib. J. Cell. Mol. Med. 2019, 24, 465–475. [Google Scholar] [CrossRef] [Green Version]
- Guo, H.; Cheng, Y.; Martinka, M.; McElwee, K. High LIFr expression stimulates melanoma cell migration and is associated with unfavorable prognosis in melanoma. Oncotarget 2015, 6, 25484–25498. [Google Scholar] [CrossRef] [Green Version]
- Kuphal, S.; Wallner, S.; Bosserhoff, A. Impact of LIF (leukemia inhibitory factor) expression in malignant melanoma. Exp. Mol. Pathol. 2013, 95, 156–165. [Google Scholar] [CrossRef] [PubMed]
- Li, B.; Zhang, G.; Wang, Z.; Yang, Y.; Wang, C.; Fang, D.; Liu, K.; Wang, F.; Mei, Y. c-Myc-activated USP2-AS1 suppresses senescence and promotes tumor progression via stabilization of E2F1 mRNA. Cell Death Dis. 2021, 12, 1006. [Google Scholar] [CrossRef] [PubMed]
- Jo, Y.S.; Li, S.; Song, J.H.; Kwon, K.H.; Lee, J.C.; Rha, S.Y.; Lee, H.J.; Sul, J.Y.; Kweon, G.R.; Ro, H.-K.; et al. Influence of the BRAF V600E Mutation on Expression of Vascular Endothelial Growth Factor in Papillary Thyroid Cancer. J. Clin. Endocrinol. Metab. 2006, 91, 3667–3670. [Google Scholar] [CrossRef] [PubMed]
- Vihinen, P.; Koskivuo, I.; Syrjänen, K.; Tervahartiala, T.; Sorsa, T.; Pyrhönen, S. Serum matrix metalloproteinase-8 is associated with ulceration and vascular invasion of malignant melanoma. Melanoma Res. 2008, 18, 268–273. [Google Scholar] [CrossRef]
- Iida, J.; McCarthy, J.B. Expression of collagenase-1 (MMP-1) promotes melanoma growth through the generation of active transforming growth factor-beta. Melanoma Res. 2007, 17, 205–213. [Google Scholar] [CrossRef]
- Falush, D.; Stephens, M.; Pritchard, J.K. Inference of Population Structure Using Multilocus Genotype Data: Linked Loci and Correlated Allele Frequencies. Genetics 2003, 164, 1567–1587. [Google Scholar] [CrossRef]
- Castro-Pérez, E.; Rodríguez, C.I.; Mikheil, D.; Siddique, S.; McCarthy, A.; Newton, M.A.; Setaluri, V. Melanoma Progression Inhibits Pluripotency and Differentiation of Melanoma-Derived iPSCs Produces Cells with Neural-like Mixed Dysplastic Phenotype. Stem Cell Rep. 2019, 13, 177–192. [Google Scholar] [CrossRef] [Green Version]
- Raabe, E.H.; Lim, K.S.; Kim, J.M.; Meeker, A.; Mao, X.-G.; Nikkhah, G.; Maciaczyk, J.; Kahlert, U.; Jain, D.; Bar, E.; et al. BRAF Activation Induces Transformation and Then Senescence in Human Neural Stem Cells: A Pilocytic Astrocytoma Model. Clin. Cancer Res. 2011, 17, 3590–3599. [Google Scholar] [CrossRef] [Green Version]
- Zabierowski, S.E.; Baubet, V.; Himes, B.; Li, L.; Fukunaga-Kalabis, M.; Patel, S.; McDaid, R.; Guerra, M.; Gimotty, P.; Dahamne, N.; et al. Direct Reprogramming of Melanocytes to Neural Crest Stem-Like Cells by One Defined Factor. Stem Cells 2011, 29, 1752–1762. [Google Scholar] [CrossRef] [Green Version]


Publisher’s Note: MDPI stays neutral with regard to jurisdictional claims in published maps and institutional affiliations. |
© 2022 by the authors. Licensee MDPI, Basel, Switzerland. This article is an open access article distributed under the terms and conditions of the Creative Commons Attribution (CC BY) license (https://creativecommons.org/licenses/by/4.0/).
Share and Cite
Sadangi, S.; Milosavljevic, K.; Castro-Perez, E.; Lares, M.; Singh, M.; Altameemi, S.; Beebe, D.J.; Ayuso, J.M.; Setaluri, V. Role of the Skin Microenvironment in Melanomagenesis: Epidermal Keratinocytes and Dermal Fibroblasts Promote BRAF Oncogene-Induced Senescence Escape in Melanocytes. Cancers 2022, 14, 1233. https://doi.org/10.3390/cancers14051233
Sadangi S, Milosavljevic K, Castro-Perez E, Lares M, Singh M, Altameemi S, Beebe DJ, Ayuso JM, Setaluri V. Role of the Skin Microenvironment in Melanomagenesis: Epidermal Keratinocytes and Dermal Fibroblasts Promote BRAF Oncogene-Induced Senescence Escape in Melanocytes. Cancers. 2022; 14(5):1233. https://doi.org/10.3390/cancers14051233
Chicago/Turabian StyleSadangi, Shreyans, Katarina Milosavljevic, Edgardo Castro-Perez, Marcos Lares, Mithalesh Singh, Sarah Altameemi, David J. Beebe, Jose M. Ayuso, and Vijayasaradhi Setaluri. 2022. "Role of the Skin Microenvironment in Melanomagenesis: Epidermal Keratinocytes and Dermal Fibroblasts Promote BRAF Oncogene-Induced Senescence Escape in Melanocytes" Cancers 14, no. 5: 1233. https://doi.org/10.3390/cancers14051233