Next Article in Journal / Special Issue
Isolation of the Main Pathogens Causing Postharvest Disease in Fresh Angelica sinensis during Different Storage Stages and Impacts of Ozone Treatment on Disease Development and Mycotoxin Production
Previous Article in Journal
Correlation between Saliva Levels and Serum Levels of Free Uremic Toxins in Healthy Volunteers
Previous Article in Special Issue
Using Molecular Spectroscopic Techniques (NIR and ATR-FT/MIR) Coupling with Various Chemometrics to Test Possibility to Reveal Chemical and Molecular Response of Cool-Season Adapted Wheat Grain to Ergot Alkaloids
 
 
Correction published on 23 January 2024, see Toxins 2024, 16(2), 62.
Article

Mixtures of Mycotoxins, Phytoestrogens, and Other Secondary Metabolites in Whole-Plant Corn Silages and Total Mixed Rations of Dairy Farms in Central and Northern Mexico

by
Felipe Penagos-Tabares
1,2,3,*,
Michael Sulyok
4,
Juan-Ignacio Artavia
5,
Samanta-Irais Flores-Quiroz
6,
César Garzón-Pérez
6,
Ezequías Castillo-Lopez
2,7,
Luis Zavala
5,
Juan-David Orozco
5,
Johannes Faas
5,
Rudolf Krska
4,8 and
Qendrim Zebeli
2,7
1
Unit of Nutritional Physiology, Institute of Physiology, Pathophysiology, and Biophysics, Department of Biomedical Sciences, University of Veterinary Medicine Vienna, Veterinärplatz 1, 1210 Vienna, Austria
2
Christian-Doppler-Laboratory for Innovative Gut Health Concepts in Livestock (CDL-LiveGUT), Department for Farm Animals and Veterinary Public Health, University of Veterinary Medicine, Veterinaerplatz 1, 1210 Vienna, Austria
3
FFoQSI GmbH—Austrian Competence Centre for Feed and Food Quality, Safety and Innovation, Technopark 1C, 3430 Tulln, Austria
4
Department of Agrobiotechnology, IFA-Tulln, Institute of Bioanalytics and Agro-Metabolomics, University of Natural Resources and Life Sciences, Vienna, Konrad-Lorenz-Strasse 20, 3430 Tulln, Austria
5
DSM-BIOMIN Research Center, Technopark 1, 3430 Tulln, Austria
6
Facultad de Estudios Superiores Cuautitlán, Cuautitlán, Medicina Veterinaria y Zootecnia, Universidad Nacional Autónoma de México (UNAM), Cuautitlán Izcalli 54714, Mexico
7
Institute of Animal Nutrition and Functional Plant Compounds, Department of Farm Animals and Veterinary Public Health, University of Veterinary Medicine Vienna, Veterinaerplatz 1, 1210 Vienna, Austria
8
Institute for Global Food Security, School of Biological Sciences, Queen’s University Belfast, 19 Chlorine Gardens, Belfast BT9 5DL, UK
*
Author to whom correspondence should be addressed.
Toxins 2023, 15(2), 153; https://doi.org/10.3390/toxins15020153
Submission received: 31 January 2023 / Revised: 8 February 2023 / Accepted: 9 February 2023 / Published: 13 February 2023 / Corrected: 23 January 2024
(This article belongs to the Special Issue Detection, Control and Contamination of Mycotoxins (Volume II))

Abstract

:
Mycotoxins and endocrine disruptors such as phytoestrogens can affect cattle health, reproduction, and productivity. Most studies of mycotoxins in dairy feeds in Mexico and worldwide have been focused on a few (regulated) mycotoxins. In contrast, less known fungal toxins, phytoestrogens, and other metabolites have been neglected and underestimated. This study analyzed a broad spectrum (>800) of mycotoxins, phytoestrogens, and fungal, plant, and unspecific secondary metabolites in whole-plant corn silages (WPCSs) and total mixed rations (TMRs) collected from 19 Mexican dairy farms. A validated multi-metabolite liquid chromatography/electrospray ionization–tandem mass spectrometric (LC/ESI–MS/MS) method was used. Our results revealed 125 of >800 tested (potentially toxic) secondary metabolites. WPCSs/TMRs in Mexico presented ubiquitous contamination with mycotoxins, phytoestrogens, and other metabolites. The average number of mycotoxins per TMR was 24, ranging from 9 to 31. Fusarium-derived secondary metabolites showed the highest frequencies, concentrations, and diversity among the detected fungal compounds. The most frequently detected mycotoxins in TMRs were zearalenone (ZEN) (100%), fumonisin B1 (FB1) (84%), and deoxynivalenol (84%). Aflatoxin B1 (AFB1) and ochratoxin A (OTA), previously reported in Mexico, were not detected. All TMR samples tested positive for phytoestrogens. Among the investigated dietary ingredients, corn stover, sorghum silage, and concentrate proportions were the most correlated with levels of total mycotoxins, fumonisins (Fs), and ergot alkaloids, respectively.
Key Contribution: Omnipresent contamination of a wide range of mycotoxins, phytoestrogens, and other metabolites is reported in WPCSs and TMRs on Mexican dairy farms. Co-contamination levels in TMRs varied from 9 to 31 mycotoxins per sample. Most of the detected mycotoxins/metabolites are not addressed by regulatory limits and are not well studied; toxicological implications of the “cocktail effect” are currently unpredictable. Although concentrations of parental compounds such as deoxynivalenol are below guidance levels, the sum of related compounds (total type B trichothecenes) can exceed such levels. Long-term and subclinical effects on herds’ health, production, and reproduction produced by complex mixtures of toxins/endocrine disruptors should be considered and addressed.

1. Introduction

According to the Food and Agriculture Organization (FAO), Mexico is included in the list of the countries with the highest milk deficits, along with China, Italy, the Russian Federation, Algeria, and Indonesia [1,2]. The health, productivity, and reproductive performance of dairy cattle, as well as the quality and safety of the milk, depend widely on feed quality and management [3]. In recent years, growing evidence of ubiquitous multi-mycotoxin contamination of agricultural commodities has increased interest and concern regarding the occurrence of this contaminant in multiple agriculture sectors, including dairy cattle feedstuffs and diets [2,4,5]. The dairy cow diet varies extensively among farms, seasons, and production systems worldwide, including various ingredients, primary forages, cereal grains, and agro-industrial byproducts [3]. Such diversity of feedstuffs contributes to dietary exposure to a broad spectrum of toxic and potentially toxic compounds. Among such compounds, mycotoxins have been classified as one of the riskiest substances that jeopardize feed and food safety [6,7]. Although over 500 compounds have been considered mycotoxins, most studies have investigated a limited number of mycotoxins in agricultural commodities [4,8,9,10]. Previous surveillance studies on contamination of dairy cattle feed in Mexico (via enzyme-linked immunosorbent assay and high-performance liquid chromatography) [11,12,13,14,15,16], but also worldwide, have been focused mainly on mycotoxins addressed by regulatory limits or guidance levels in animal feed—for instance, aflatoxins (AFs), zearalenone (ZEN), ochratoxin A (OTA), and trichothecenes (type A and B) [16,17,18,19].
Total mixed rations (TMR) is a popular “complete ration” feeding system used in dairy farms with large herd sizes. It is produced by mixing forages, byproducts, cereal grains, concentrates, minerals, vitamins, and other additives, supplying the nutrients needed to meet maintenance and production requirements [20,21]. TMRs have been shown to be contaminated with complex mycotoxin cocktails and other secondary metabolites from fungi, bacteria, and plants [22,23]. Additionally, whole-plant corn silage (WPCS) is one the most frequent ingredients incorporated in many countries in modern dairy and beef farming. Specifically, WPCS is the most widely used silage in North America [24,25]. It has been described in multiple regions that WPCS is one of the feedstuffs with significant relevance to the dietary contamination of mycotoxins [2,23,26,27].
Mycotoxicoses in cattle are usually ambiguous subclinical disorders affecting herds. These can occur from chronic syndromes of impaired rumen function or increased predisposition to infectious diseases and, less frequently, acute toxicoses with severe illness and death [8,28,29]. In addition, recent studies have shown that mycotoxins are highly relevant risk factors for pregnant animals. Prenatal exposure to these compounds can compromise the postnatal development of several organic systems, such as the reproductive, nervous, and circulatory systems [30,31,32,33]. Moreover, complex toxicological interactions, including addition, synergism, potentiation, and antagonism, among mycotoxins undoubtedly affect animal and human health and reproduction [34]. Such interactions between co-occurring mycotoxins demands more research and risk assessment using integrative methodologies, including the multi-mycotoxin analysis approach [2,4]. Additionally, other naturally occurring substances (for example, plant-derived metabolites such as phytoestrogens) present mainly in Leguminosae plants and can act as endocrine disruptors, impairing the reproductive performance of livestock [35,36,37,38].
Studies on the broad spectrum of mycotoxins and other endocrine disruptors of natural origin in the feedstuffs and diets of dairy cows and other food-producing animals are essential. However, they are still very limited [2,4]. Therefore, this study aimed to determine co-occurrences and concentrations of mycotoxins and other fungal metabolites (derived from the genus Alternaria, Aspergillus, Fusarium, Penicillium, other fungi, and ergot alkaloids) as well as secondary plant metabolites (such as phytoestrogens and others) in TMRs and WPCSs from large dairy cattle farms located in northern and central Mexico. The analysis was achieved using a validated multi-metabolite analysis. The possible associations of the main dietary ingredients to the levels of mycotoxins and other secondary metabolites contained in the TMRs were also assessed.

2. Results

2.1. Main Dietary Ingredients

The frequency of the inclusion and dietary levels of the main ingredients of TMRs formulated for lactating cows for all surveyed farms are presented in Table 1. The dairy farms participating in the study fed TMRs containing highly balanced proportions of forage and concentrates, averaging 49.9% and 50.1%, respectively. The forage-to-concentrate ratio (F:C) fluctuated between 40:60 and 60:40. The most common dietary components included were WPCSs (100%), alfalfa hay (79%), and high-energy density concentrate (74%). Less commonly included were protein-rich concentrate (26%), corn stover (21%), and rolled corn (21%). Other TMR ingredients with frequencies of inclusion under 20% were corn meal (16%), oat hay (16%), and sorghum silage (11%) as well as corn bran, alfalfa silage, bakery byproduct, and brewery spent grain (5%) (Table 1).
Regarding the proportion of inclusion (dietary content), commercial high-energy density concentrate was the dietary ingredient most abundant in the evaluated TMRs, with an average inclusion of 45.5% on a dry matter (DM) basis, ranging from 28.3% to 60%. WPCSs averaged 38.9% DM of the rations, varying from 27.5% to 53%. The diets that included rolled corn, corn meal, and protein-rich concentrate presented an average of 25.5%, 24.2%, and 22.6% DM, respectively. The remaining ingredients were included in the TMR formulations with an average of inclusion (proportion) less than 15% DM (Table 1).

2.2. Occurrence and Concentrations of the Detected Metabolites

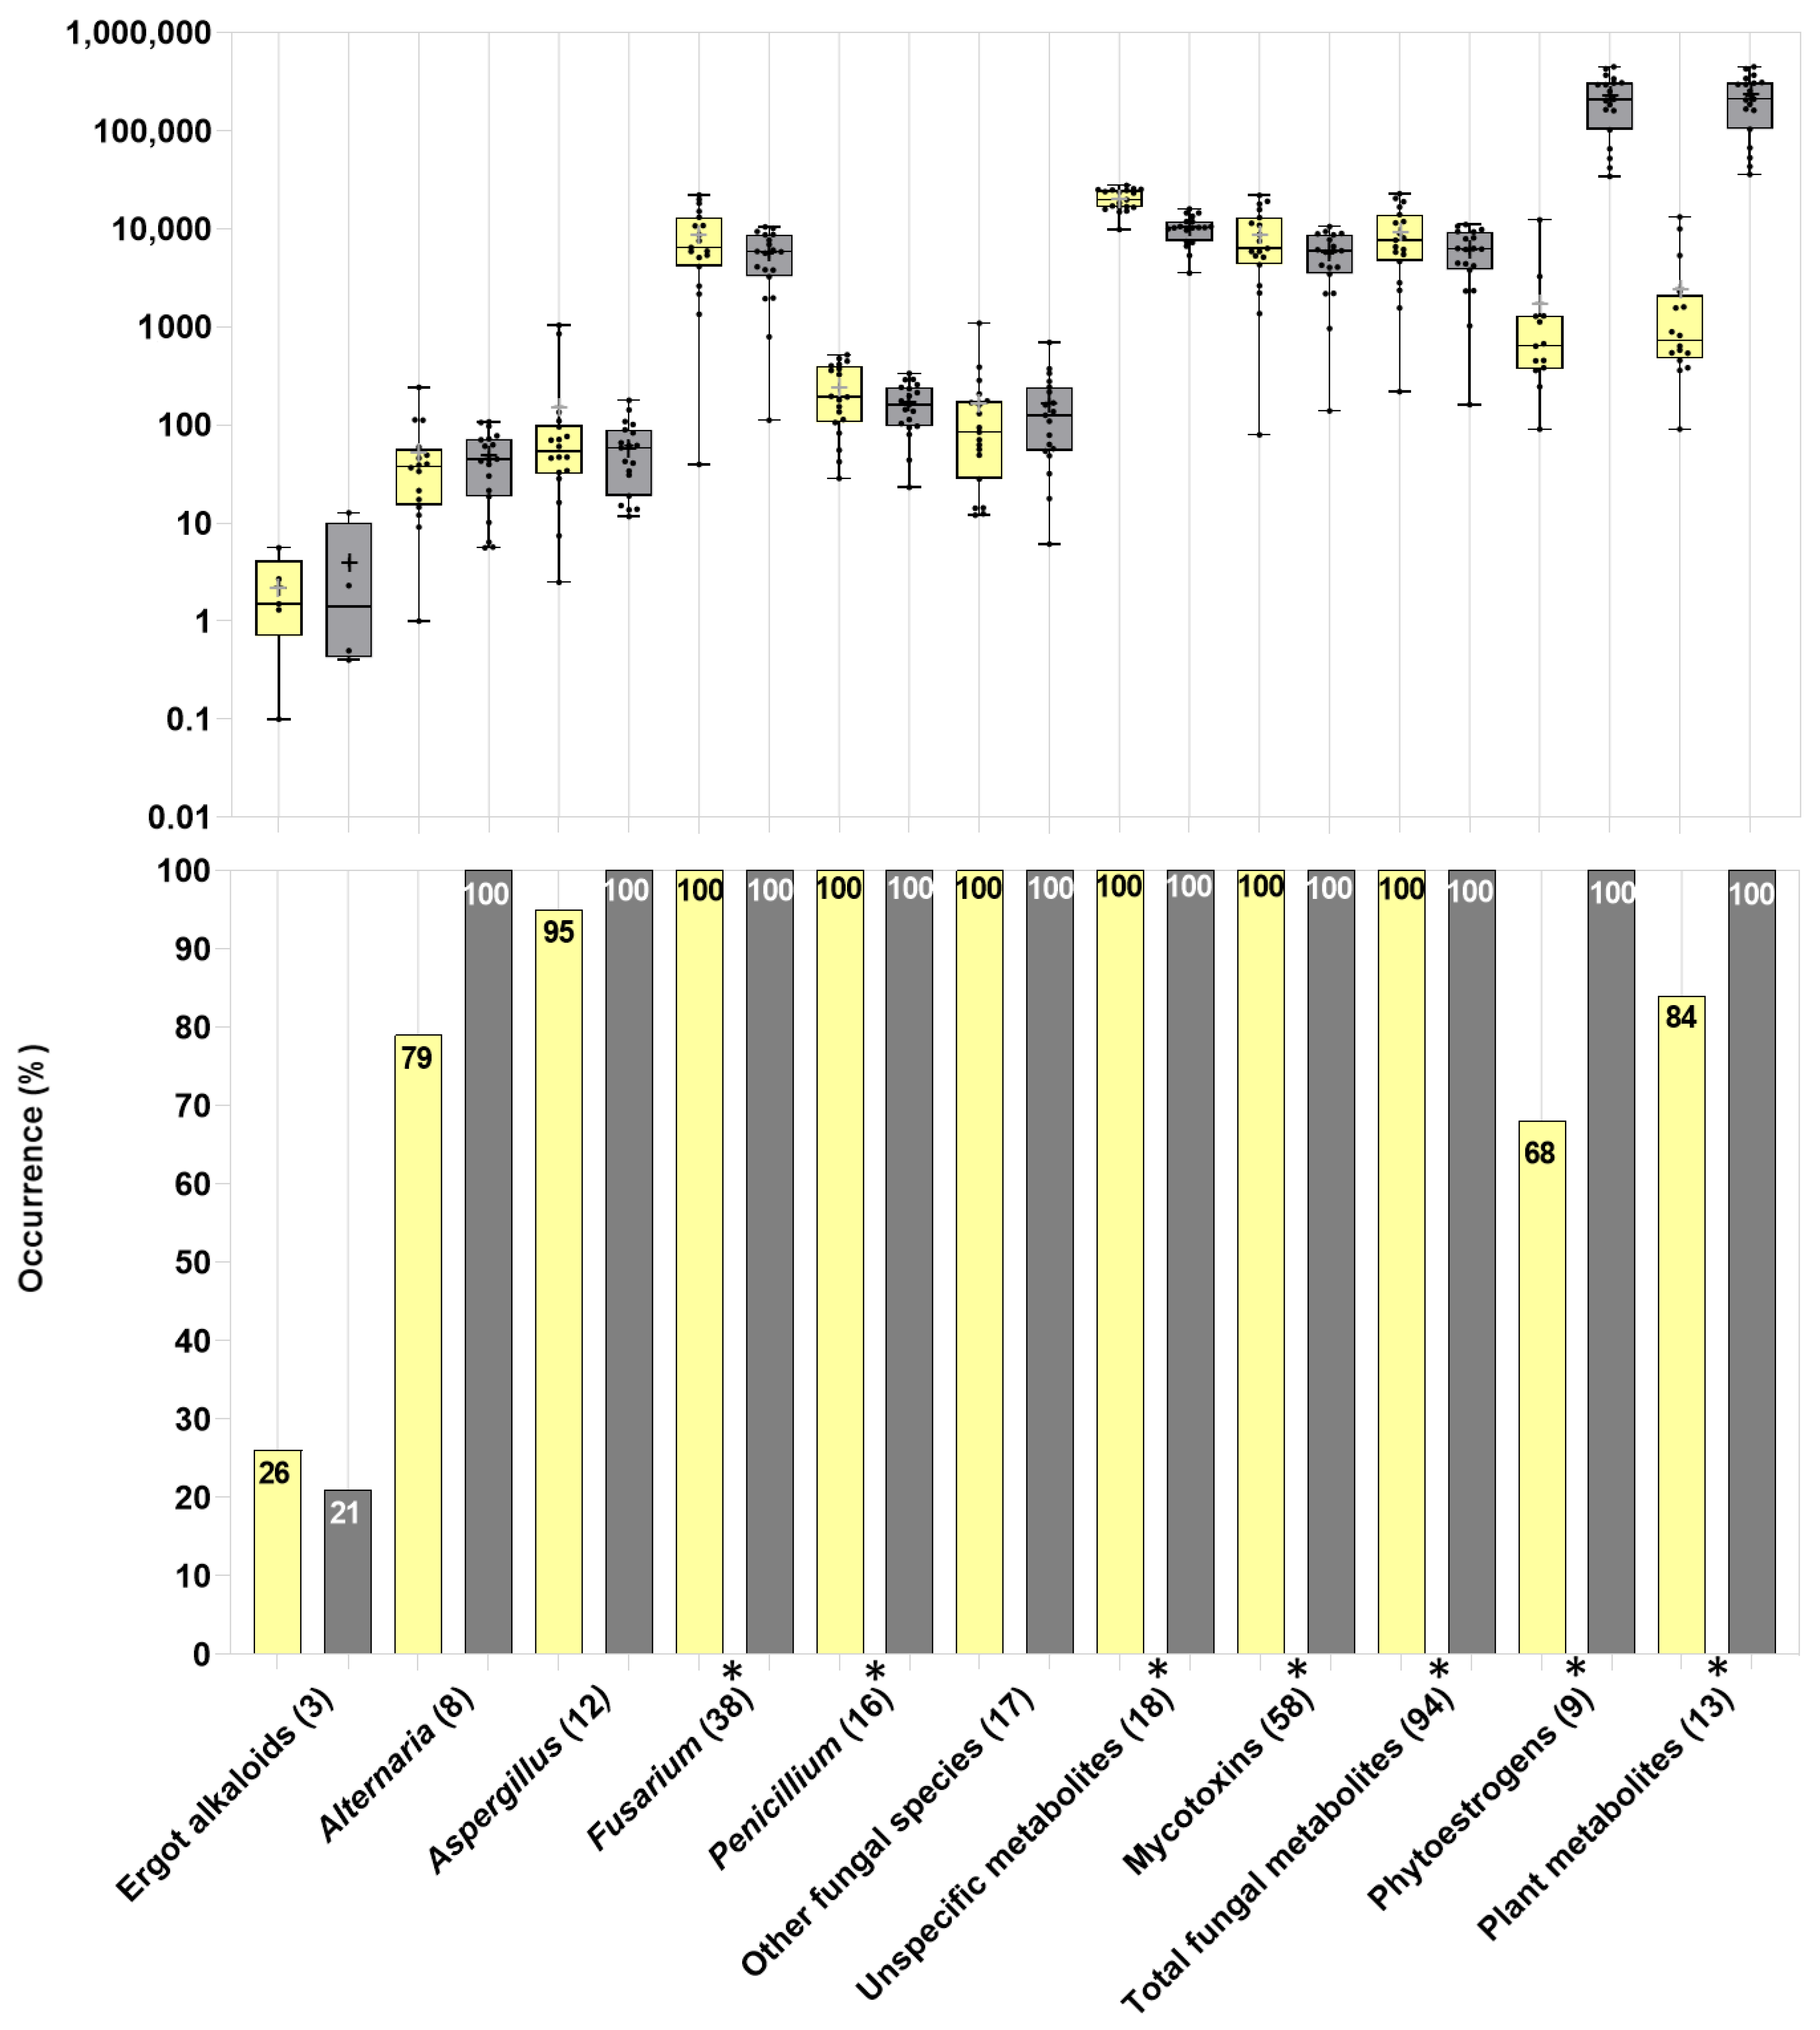
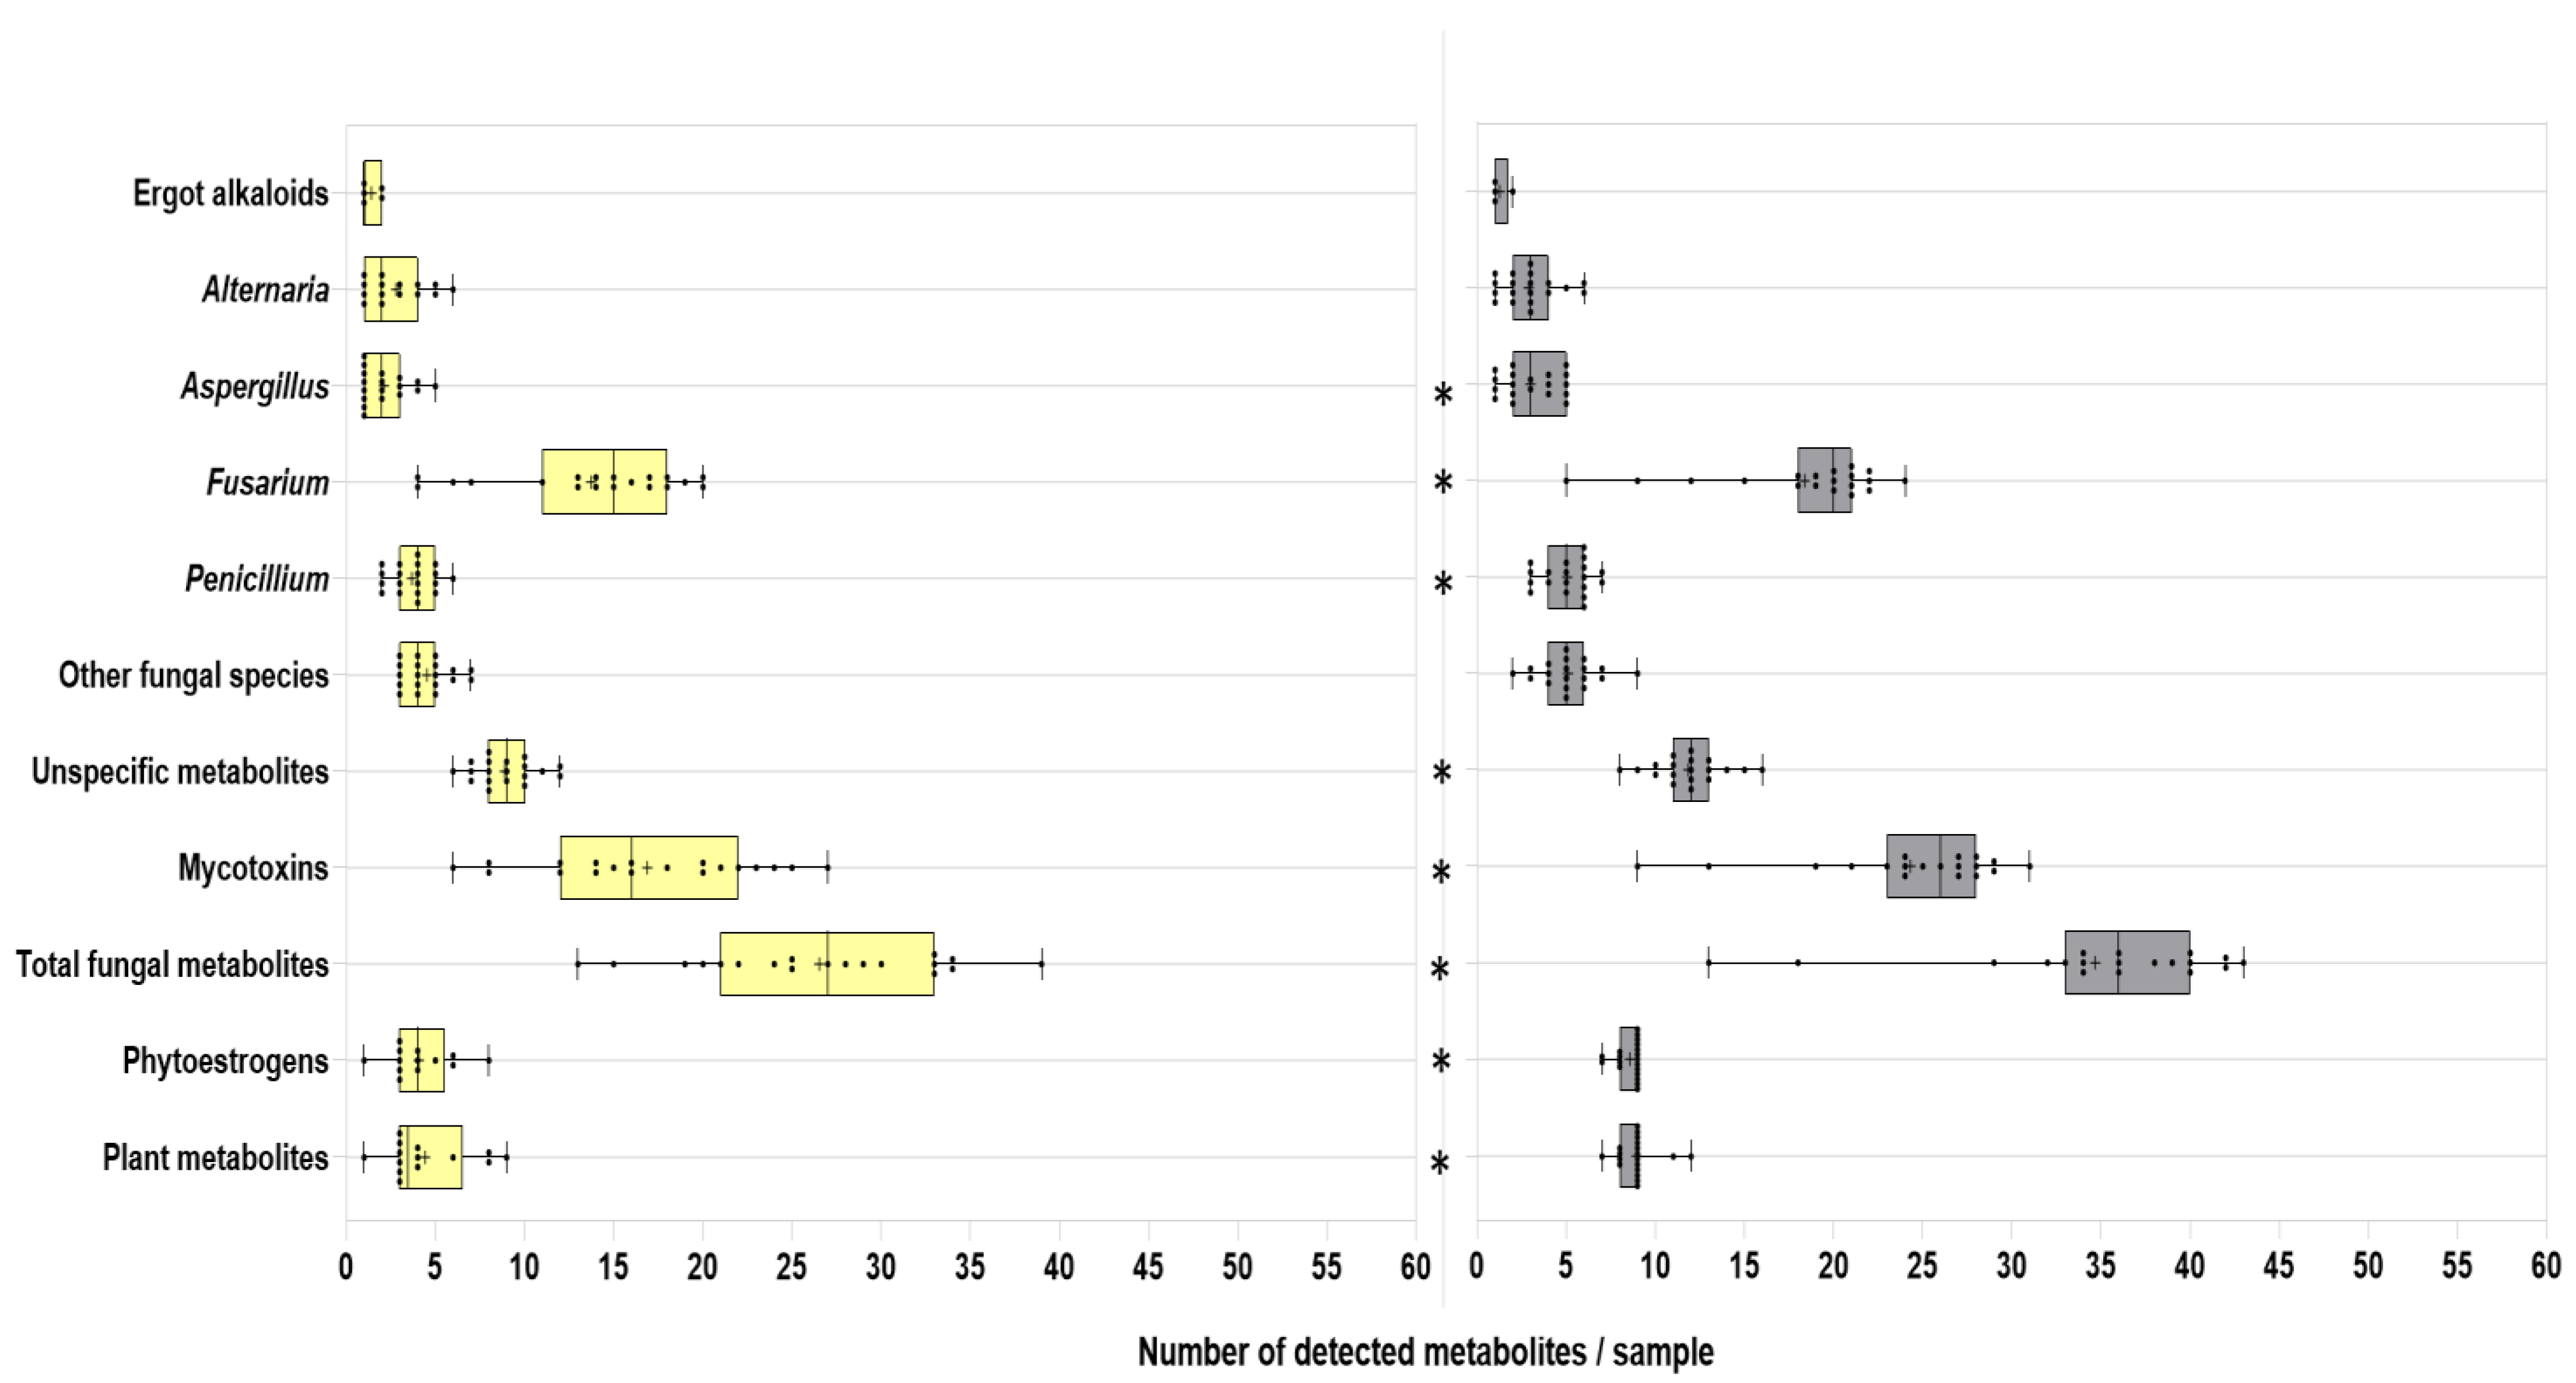
2.2.1. General Overview

The 125 identified biological compounds in representative samples of WPCSs (114) and TMRs (118) were grouped based on their reported primary producers. These compounds consisted of 94 fungal metabolites, derived from the genera Alternaria (number of detected metabolites: 8), Aspergillus (12), Fusarium (38), Penicillium (16), or other fungi (17) and ergot-derived alkaloids (3). Thirteen compounds were plant-derived metabolites (including 9 phytoestrogens), 18 were unspecific metabolites (multi-kingdom-derived, i.e., derived from fungi, bacteria, and/or plants), and 1 was of bacterial origin (Figure 1). Figure 1 and Table 2 illustrate the occurrence and concentrations of the groups of metabolites. Additionally, Table 2 shows the significance level of a paired comparison between the WPCSs and TMRs per respective farm.
Regarding the fungal metabolites, the group of ergot alkaloids presented a minor occurrence as a group, detected in 26% of the WPCSs and 21% of the TMRs. All the TMR samples showed metabolites derived from Alternaria, Aspergillus, Fusarium, Penicillium, other fungi, phytoestrogens, and unspecific metabolites. The analyzed WPCS samples contained the ubiquitous presence of all the mentioned categories except the plant metabolites (occurrence: 84%), including phytoestrogens (68%) (Figure 1). The plant-derived metabolites (specifically, the accumulated phytoestrogens) were the compounds detected with the highest concentration in the TMRs (Figure 1, Table 2 and Table 3, Supplementary Figure S1a,b). The phytoestrogen content in the TMRs was above 34,300 µg/kg. The levels of phytoestrogens in the WPCSs were low compared to the TMRs, with a maximum content of 12,350 µg/kg. After the total plant-derived metabolites, total unspecific metabolites showed the second-highest concentrations among the groups, ranging from 9860 µg/kg to 27,790 µg/kg in the analyzed silages and from 3540 µg/kg to 15,980 µg/kg in the TMRs. Regarding the accumulated concentrations of fungal-produced metabolites, the fusarial metabolites showed the highest concentrations, with an average of 8702 µg/kg (range: 39.6 µg/kg–22,110 µg/kg) in WPCSs and 5550 µg/kg (range: 112 µg/kg–10,500 µg/kg) in TMR samples. The second most produced group of fungal metabolites was the Penicillium-derived compounds, which presented, on average, 243 µg/kg (range: 29 µg/kg–520 µg/kg) in the WPCSs and 171 µg/kg (range: 23.2 µg/kg–337 µg/kg) in the TMRs. Subsequently, the group of metabolites produced by other fungi presented, on average, 164 µg/kg (range: 12 µg/kg–1090 µg/kg) in WPCSs and 169 µg/kg (range: 6.1 µg/kg–697 µg/kg) in TMRs. Aspergillus-produced compounds were found in average levels of 154 µg/kg (range: 2.50 µg/kg–1040 µg/kg) in WPCSs and 61.7 µg/kg (range: 11.7 µg/kg–179 µg/kg) in TMRs. Compounds derived from Alternaria present in WPCSs fluctuated from 9.1 µg/kg to 242 µg/kg and in TMRs varied from 5.6 µg/kg to 108 µg/kg. The ergot alkaloids were detected in very low concentrations—for instance, on average, 2.24 µg/kg (maximum 5.60 µg/kg) in the silages and 4.00 µg/kg (max: 12.7 µg/kg) in the rations. The average content of total fungal metabolites in WPCSs was 9300 µg/kg (max: 22,800 µg/kg), and in TMRs it was 6001 µg/kg (max: 11,070 µg/kg). The levels of mycotoxin contamination presented a mean of 8710 µg/kg (range: 79.5 µg/kg–21,960 µg/kg) in the silages and 5590 µg/kg (range: 139 µg/kg–10,570 µg/kg) in the dietary rations (Figure 1, Supplementary Figure S1a). The concentrations of metabolites derived from Fusarium (p-value = 0.0005), Penicillium (p-value = 0.0108), total fungal metabolites (p-value = 0.0004), total unspecific metabolites (p-value < 0.0001), and accumulated mycotoxins (p-value = 0.0006) were significantly higher in WPCSs than in TMRs. On the contrary, the plant-derived metabolites (represented primarily by phytoestrogens) presented significantly higher (p-value < 0.0001) levels in the TMRs than in the silages (Figure 1, Supplementary Figure S1b, Table 2).

2.2.2. Mycotoxins and Other Fungal Secondary Metabolites

Of the 94 fungal-derived metabolites detected, 58 have been previously reported as mycotoxins (Table 3). Among the major mycotoxins, ZEN, deoxynivalenol (DON), FA1, FA2, FB1, FB2, FB3, and FB4 were detected in TMRs as well as in WPCSs. The carcinogenic mycotoxins AFB1 and OTA were not detected in the assessed feed samples. Toxin metabolites related to the parent major mycotoxins such as nivalenol (NIV), DON-3-glucoside, and hydrolyzed FB1 were found in silages and in rations. 15-acetyl-deoxynivalenol was seen only in WPCSs (11%). ZEN was detected in all the TMR samples and in 68% of the WPCSs. The dietary levels of ZEN had an average of 38.7 µg/kg and a maximum concentration of 246 µg/kg. DON was also found with a higher frequency in TMRs (84%) than in WPCSs (53%). The average concentration of DON in TMRs was 615 µg/kg, and the maximum level was 1660 µg/kg. FB1 and FB2 were the most detected and with the highest levels among the fumonisins (Fs) in TMRs, with occurrences of 84% and 64% and an average of 218 µg/kg and 103 µg/kg, respectively. NIV was detected more frequently in TMRs (68%) than in WPCSs (42%). The levels of NIV were significantly higher (p-value = 0.0061) in samples of TMRs (mean: 872 µg/kg; max: 2600 µg/kg) than in WPCSs (mean: 269 µg/kg; max: 614 µg/kg) (Table 3). The totals of Fs (sum of FA1, FA2, FB1, FB2, FB3, FB4 hydrolyzed B1) and a total of type B trichothecenes (sum of DON, 15-acetyl-DON, DON-3-glucoside, and NIV) were superior in WPCSs than in TMRs; however, the differences were not significant. The maximum amount of total Fs in silages was 4410 µg/kg, and it was 1670 µg/kg in mixed rations. The maximum concentration of type B trichothecenes in WPCSs was 4230 µg/kg, whereas the highest concentration in the analyzed TMR samples was 5510 µg/kg. Concerning other less studied mycotoxins derived from Fusarium spp. such as beauvericin, beauvericin A, bikaverin, and enniatins (ENNs) (A, A1, A2, B, B1, and B2), epiquisetin, equisetin, fusaric acid, culmorin, moniliformin, and siccanol, among others, were also detected. Beauvericin, bikaverin, and moniliformin were detected in all the analyzed TMRs. Siccanol was the Fusarium-derived metabolite with the highest concentration, averaging 2510 µg/kg and with a maximum level of 6130 µg/kg. The second most produced fusarial metabolite was 15-hydroxyculmorin (average: 1270 µg/kg; max: 1510 µg/kg). The total content of ENNs was significantly superior (p-value = 0.0144) in TMRs than in WPCSs, with a respective average of 11.2 µg/kg and 5.96 µg/kg. Among mycotoxins produced by Penicillium spp., mycophenolic acid was detected in TMRs, with an occurrence of 42%. Citrinin, primarily Penicillium-derived but also produced by some Aspergilli, was seen in only 1 TMR sample (5%). Concerning the metabolites derived from Alternaria spp., tentoxin and tenuazonic acid showed the highest occurrence in TMRs, being detected in 79% and 53% of the samples, respectively. Tenuazonic acid presented the highest concentration in TMRs among this group of metabolites (average: 49.4 µg/kg, range: 30.3 µg/kg–82.8 µg/kg).
Table 3. Occurrences and concentrations of mycotoxins and other fungal metabolites detected in whole-plant corn silages and total mixed rations of Mexican dairy farms.
Group of
Metabolites
MetabolitePositive
Samples 1
(%)
Whole-Plant Corn Silages
(n = 19)
Positive
Samples 1
(%)
Total Mixed Rations
(n = 19)
Wilcoxon Matched-Pairs Test
Concentration (µg/kg DM) 2Concentration (µg/kg DM) 2p-Value *
Average ± SDMedianRangeAverage ± SDMedianRange
Ergot
alkaloids
Festuclavine +52.410>0.9999
Dihydroergosine +261.35 ± 1.171.290.13–3.2210.83 ± 0.970.440.18–2.280.0625
Chanoclavine +52.04512.5>0.9999
Alternaria spp.Altenuisol +322.5 ± 02.52.5–2.5373.14 ± 1.72.52.5–6.990.7656
Alternariol +55.5119.77 ± 6.049.775.5–140.75
Alternariolmethylether +479.89 ± 7.595.55.5–27.4426.39 ± 2.515.55.5–12.60.25
Altersetin +266.76 ± 4.55.161.25–12.74215.7 ± 9.8612.34.18–34.30.0488
Infectopyron2197 ± 649423.9–1761634.2 ± 3.3836.130.3–36.20.1875
Macrosporin +163.75 ± 03.753.75–3.75113.75 ± 03.753.75–3.75>0.9999
Tentoxin +427.71 ± 4.866.383.1–16796.91 ± 2.876.412.48–11.30.0932
Tenuazonic acid +3240.2 ± 10.437.530.1–60.45349.4 ± 16.841.830.3–82.80.064
Aspergillus spp.Averufin +423.6 ± 1.9 3.03.0–8.4 262.95 ± 02.952.95–2.950.125
Deoxygerfelin0112.41 ± 1.332.411.47–3.350.5
Flavoglaucin +112.8 ± 0.972.82.11–3.4910040.7 ± 29.641.63.63–111<0.0001
Fumigaclavine C +547.20>0.9999
Fumiquinazolin D +01111.8 ± 5.3411.88.01–15.60.5
Kojic acid +11877 ± 130877785–6951450.5
Kotanin A112.5 ± 02.52.5–2.552.50>0.9999
Methylsulochrin54.5114.5 ± 04.54.5–4.5>0.9999
Phenopyrrozin8456.1 ± 28.153.116.2–1327912.4 ± 5.1410.77.16–24.1<0.0001
seco-Sterigmatocystin +162.72 ± 1.83.580.65–3.91420.9 ± 0.460.650.65–1.71>0.9999
Sterigmatocystin +0 112.65 ± 02.652.65–2.650.5
Versicolorin C166.05 ± 3.983.753.75–10.600.25
Fusarium spp.15-Acetyldeoxynivalenol +11142 ± 46.7142109–17500.5
15-Hydroxyculmorin +322090 ± 15101580464–4410261270 ± 1951280993–15100.1563
Acuminatum B +32151 ± 89.614258.3–2902652.2 ± 21.855.827.6–83.20.1094
Antibiotic Y59.559.5>0.9999
Apicidin +167.14 ± 2.327.234.78–9.4159.040.5
Aurofusarin +68168 ± 38648.83–14208483.4 ± 67.367.111.4–2240.2247
Beauvericin +10057.8 ± 74.732.35.46–33010033.1 ± 24.329.13.84–84.20.2266
Beauvericin A +890.96 ± 1.550.450.45–6.87840.55 ± 0.270.450.45–1.420.0204
Bikaverin +95224 ± 25399.415.3–879100115 ± 95.694.718.1–3080.0204
Chrysogin +058.03>0.9999
Culmorin +58865 ± 695634150–209058505 ± 427402150–14200.0234
Deoxyfusapyron1122 ± 122213.5–30.516591 ± 60352126.2–12300.375
Deoxynivalenol +531500 ± 10801370323–335084615 ± 49137678–16700.1928
DON-3-glucoside +2674 ± 95.519.519.5–2403760.3 ± 23.56519.5–86.60.3984
Enniatin A +111.02 ± 1.151.020.2–1.83370.45 ± 0.370.20.2–1.190.3438
Enniatin A1 +110.4 ± 00.40.4–0.4791.03 ± 0.820.40.4–2.60.0002
Enniatin B +0684.63 ± 5.621.41.4–18.80.0002
Enniatin B1 +111.45 ± 01.451.45–1.45893.99 ± 3.781.451.45–12.2<0.0001
Enniatin B2 +0160.29 ± 0.050.290.24–0.340.25
Epiequisetin +163.37 ± 1.63.781.6–4.7251.60.375
Equisetin +326.3 ± 6.273.051.6–14.7425.19 ± 2.464.172.36–9.580.6836
Fumonisin A1 precursor +1663.2 ± 40.561.223.7–1055814.3 ± 14.19.163.55–48.90.3096
Fumonisin A2 +1143 ± 3.914340.2–45.85180.5
Fumonisin B1 +47723 ± 105012426.5–270084218 ± 24412626.5–10100.2288
Fumonisin B2 +42301 ± 37172.618–98768103 ± 10061.518–3950.7722
Fumonisin B3 +16276 ± 145297121–4093257.1 ± 41.84026.5–131>0.9999
Fumonisin B4 +1678.3 ± 70.56118–1563226.1 ± 201818–66.90.5625
Fusarium spp.Fungerin0526.5>0.9999
Fusaproliferin +37403 ± 62816661.5–182058280 ± 25222660.8–9890.3054
Fusapyron +51.555.46–5.46>0.9999
Fusaric acid +891210 ± 8401130260–322074562 ± 235503298–1190<0.0001
Hydrolysed Fumonisin B1 +1637 ± 49.1107.29–93.7530.4 0.75
Moniliformin +8988.9 ± 76.9489–263100101 ± 6778.827.6–2470.1956
Nivalenol +42269 ± 184209103–61468872 ± 85338588.5–26000.0061
Sambutoxin +370.37 ± 0.190.30.3–0.7950.30.0625
Siccanol +894620 ± 35303960525–12,350952510 ± 16502370409–61300.0028
W49379171 ± 19080.73.55–6947486.6 ± 65.41013.55–1900.0256
Zearalenone +6858.7 ± 79.421.54.6–27810038.7 ± 57.217.84.6–2460.9297
Total enniatins475.96 ± 7.241.600.60–198911.2 ± 9.87.111.85–370.0144
Total fumonisins471150 ± 157020326.5–441089325 ± 3961553.6–16700.3867
Total Type B trichothecenes532000 ± 12301790323–4230891940 ± 1760115678.0–55100.0505
Penicillium spp.7-Hydroxypestalotin5317.3 ± 9.9914.97.3–41.9479.74 ± 4.879.742.6–16.70.0186
Asterric acid512.5512.5N/A
Bilaid A10020.3 ± 22.911.45.78–87.6958.53 ± 7.046.773.49–27.3<0.0001
Citreoviridin +02142.9 ± 12.241.331.1–580.125
Citrinin +0577.9>0.9999
Cycloaspeptide A0513.4>0.9999
Cyclopenin52.850>0.9999
Mycophenolic acid +1190.2 ± 11890.27–1734232 ± 42.911.47–1270.1094
Mycophenolic acid IV +52.530>0.9999
NP 1243534.10>0.9999
Oxaline1668.9 ± 61.281.22.55–1231620.1 ± 14.912.910–37.20.5
Pestalotin5329.2 ± 13.528.78.61–59.25812.4 ± 6.9311.23.3–24.50.0282
PF 1163A53.3250.75>0.9999
Questiomycin51.5898.71 ± 7.728.60.6–23<0.0001
Questiomycin Derivate95184 ± 11116434.9–40795118 ± 64.210618.1–2380.0002
Quinolactacin A111.2 ± 01.21.2–1.2211.2 ± 01.21.2–1.20.5
Other fungiAscochlorin2111.9 ± 10.28.433.75–26.9216.24 ± 4.993.753.75–13.70.625
Ascofuranone212.26 ± 1.821.351.35–4.9851.350.3125
Bassianolide373.17 ± 1.252.72.7–6322.7 ± 02.72.7–2.70.5
Beauveriolide I_III261.5 ± 01.51.5–1.5164.22 ± 3.013.711.5–7.450.6563
Cercosporin5840.8 ± 25.636.513.2–87.97972.2 ± 79.742.515.1–3250.0479
Cytochalasin J011136 ± 26.5136117–1550.5
Destruxin B +0211.25 ± 0.681.10.7–2.090.125
Ilicicolin A56.23371.83 ± 0.611.61.6–3.210.2813
Ilicicolin B7918.9 ± 20.74.454.45–69.48914.1 ± 9.96134.45–28.90.6848
Ilicicolin E51.7111.7 ± 01.71.7–1.7>0.9999
Monocerin89115 ± 23737.42.1–9907485.9 ± 13337.22.1–5020.0024
Mycousnine0110.75 ± 00.750.75–0.750.5
Myriocin +1667.9 ± 52.148.128.6–1273244.6 ± 26.241.115.7–92.60.5625
Phomalone56.140>0.9999
Sporidesmolide II847.9 ± 13.22.920.75–44.7744.4 ± 5.072.540.75–17.20.0643
Sporidesmolide III50.750.750.750>0.9999
Unspecific
metabolites
3-Nitropropionic acid2163 ± 60.94318.5–1472118.5 ± 018.518.5–18.50.5
Asperglaucide55.9910027.3 ± 33.610.82.05–142<0.0001
Asperphenamate54.89795.98 ± 7.373.351.93–31.4<0.0001
Brevianamid F89171 ± 77.816661–40889116 ± 40.611249.2–2280.0021
Chrysophanol47226 ± 11123162.5–36732176 ± 65.120562.5–2260.0195
Citreorosein5324.1 ± 12.419.114.7–54.43719.1 ± 6.6715.812.5–30.10.123
Cyclo(L-Pro-L-Tyr)1004680 ± 23004570926–89701002180 ± 11101890589–53600.0006
Cyclo(L-Pro-L-Val)10014,760 ± 382013,4506890–22001007080 ± 230067902160–11,570<0.0001
Emodin959.62 ± 5.319.223.5–23.19546.9 ± 1028.493.5–4220.2312
Fellutanine A95128 ± 51.812748.8–2608994.3 ± 38.786.734.8–1990.0053
Iso-Rhodoptilometrin581.58 ± 0.591.41.4–3.35531.4 ± 01.41.4–1.40.5
N-Benzoyl-Phenylalanine02112.2 ± 2.4712.19.56–150.125
Neoechinulin A0100133 ± 78.410229.6–304<0.0001
Norlichexanthone51.9471.9 ± 01.91.90.0078
Rugulusovine100355 ± 153373137–681100204 ± 93.819753.5–407<0.0001
Skyrin682.06 ± 1.071.850.55–3.96894.42 ± 6.132.480.55–270.0097
Ternatin56.320>0.9999
Tryptophol42258 ± 126170170–45632963 ± 817642170–21000.5508
PhytoestrogensBiochanin51477936.3 ± 1334.520.2–61.60.0081
Coumestrol2656 ± 10488–24189157 ± 12610945.5–4790.0011
Daidzein37263 ± 3518989–102010012,700 ± 671010,7103820–27,620<0.0001
Daidzin68428 ± 71919191–273010063,690 ± 40,17065,6409350–125,770<0.0001
Genistein58153 ± 2724747–94710011,760 ± 617011,1903990–26,530<0.0001
Genistin631000 ± 1850362110–6700100118,150 ± 75,850113,270157,180–249,320<0.0001
Glycitein5324894790 ± 184044502220–8220<0.0001
Glycitin11364 ± 292364158–57010013,340 ± 792012,0701080–27,390<0.0001
Ononin546100176 ± 28153.346–512<0.0001
Other plant
metabolites
Abscisic acid421610 ± 2860574273–86701001660 ± 6361620411–32700.0012
Anisodamine16514 ± 373470164–90716137.2 ± 10114134.5–2360.375
Atropine16318 ± 85360219–3741169.1 ± 22.469.153.3–84.90.25
Hyoscine16427 ± 39147315–79411215.7 ± 93.1216150–2820.375
BacterialNonactin161 ± 011–1261.3 ± 1.20.80.6–3.30.3906
1 Samples with values > limit of detection (LOD). 2 Excluding data < LOD. In case values > LOD and < limit of quantification (LOQ), LOQ/2 was used for calculation. * Significant differences between each set of matched pairs presented p-value < 0.05. SD = Standard deviation; DM = Dry matter; + = metabolites classified as mycotoxins.
Tenuazonic acid presented the highest concentration in TMRs among this group of metabolites (average: 49.4 µg/kg, range: 30.3 µg/kg–82.8 µg/kg). In the analyzed silages, the most frequently occurring were alternariolmethylether (47%) and tentoxin (42%). The Alternaria-derived metabolites with the highest levels were infectopyrone (average: 97 µg/kg; range: 23.9 µg/kg–176 µg/kg) and tenuazonic acid (average: 40.2 µg/kg; range: 30.1 µg/kg–60.4 µg/kg). Other metabolites produced by Alternaria spp. such as altenuisol, alternariol, altersetin, and macrosporin were also detected in both studied matrices. Among the metabolites produced by fungi of the genus Aspergillus, flavoglaucin was detected in all the TMR samples, followed by phenopyrrozin, which was found in 79% of the samples. Phenopyrrozin also showed the highest occurrence of Aspergilli-derived compounds in WPCSs. Kojic acid presented the highest levels among the Aspergillus-derived metabolites in silages and TMRs, although its occurrence was low. Other metabolites/mycotoxins such as averufin, fumigaclavine, fumiquinazolin D, and seco-Sterigmatocystin were detected in both WPCSs and TMRs. Among the ergot alkaloids, dihydroergosine occurred the most. Chanoclavine was detected in low frequency (5%) in TMRs and WPCSs. Festuclavine was detected only in WPCSs. The concentrations of the individual ergot alkaloids were low (≤12.5 µg/kg). Concerning the compounds produced by other fungi species, the most frequently detected in TMR samples were ilicicolin B (89%), cercosporin (79%), monocerin (74%), and sporidesmolide II (74%). The metabolites derived from other fungal species that were most frequently detected in the analyzed WPCS samples were monocerin (89%), sporidesmolide II (84%), and ilicicolin B (79%). Monocerin was the compound derived from other fungi with the highest concentration in WPCSs as well as in TMRs, with a respective average of 115 µg/kg and 85.9 µg/kg. The levels of monocerin were significantly superior (p-value = 0.0024) in the silages. Samples of silage and TMRs showed content of ascochlorin, ascofuranone, bassianolide, beauveriolide III, ilicicolin A, and myriocin. Cytochalasin J, destruxin B, and mycousnine were identified only in TMRs, whereas phomalone and sporidesmolide III were identified only in WPCSs.

2.2.3. Plant Secondary Metabolites (Phytoestrogens and Others)

Among the plant-derived metabolites, nine phytoestrogens in WPCSs and in TMRs were found. The isoflavones daidzein, daidzin, genistein, genistin, and glycitin and the isoflavone glucoside onionin were identified in all the TMR samples. Biochanin, coumestrol, and glycitein also presented a high occurrence in TMRs (≥79%). The most frequently detected phytoestrogens in WCPSs were daidzin (68%), genistin (63%), and genistein (58%). The other phytoestrogens were identified in <40% of the silage samples. The concentrations of the all the found phytoestrogens were significantly higher (p-value < 0.5) in the TMRs than in the WPCSs. Genistin was the (plant) metabolite with the highest concentration detected in both feed matrices, averaging 1000 µg/kg and 118,150 µg/kg in WPCSs and TMRs, respectively. Concerning the compounds cataloged in the group of other plant metabolites, abscisic acid was predominant in occurrence and concentration; for instance, its occurrences in WPCSs and TMRs were 42% and 100%, respectively. The levels of abscisic acid were significantly superior (p-value = 0.0012) in TMRs than in the silages. Three tropane alkaloids (anisodamine, atropine, and hyoscine) were identified in both analyzed matrices. The 3 mentioned tropane alkaloids occurred in 16% of the WPCSs, whereas in TMRs anisodamine was found at a frequency of 16% and atropine as well as hyoscine in 11% of the samples. These alkaloids were detected in concentrations lower than 1000 µg/kg; the levels were higher in WPCSs, but without significance (i.e., p-value > 0.05) (Table 3).

2.2.4. Unspecific (Multi-Kingdom) and Bacterial Metabolites

Multiple metabolites that can be produced by unrelated organisms belonging to diverse kingdoms such as Plantae, Fungi, and/or Eubacteria were detected in both feed commodities. Four compounds belonging to this category, asperglaucide, cyclo (L-Pro-L-Tyr), cyclo (L-Pro-L-Val), neoechinulin A, and rugulusovine, were identified in all the assessed TMR samples. Asperphenamate, brevianamid F, chrysophanol, emodin, skyrin, fellutanine A, and iso-rhodoptilometrin occurred in TMRs at a rate superior to 50%. Other unspecific metabolites such as 3-nitropropionic acid, chrysophanol, citreorosein, N-benzoyl-phenylalanine, and tryptophol were detected in frequencies between 20% and 40%. Regarding the occurrence in WPCSs, all the assessed samples contained cyclo (L-Pro-L-Tyr), cyclo (L-Pro-L-Val), and rugulusovine, with frequencies of over 50% for brevianamid F, citreorosein, emodin, fellutanine A, iso-rhodoptilometrin, and skyrin. The highest concentrations in the category of unspecific metabolites corresponded to the bioactive cyclic dipeptides cyclo (L-Pro-L-Val) and cyclo (L-Pro-L-Tyr) in silages as well as in TMRs, with an average concentration above 2100 µg/kg. The content of both cyclic dipeptides was significantly higher (p-value < 0.001) in WCPSs than in the complete rations. The other compounds of this group presented average concentrations lower than 400 µg/kg in WPCSs and TMRs (Table 3).

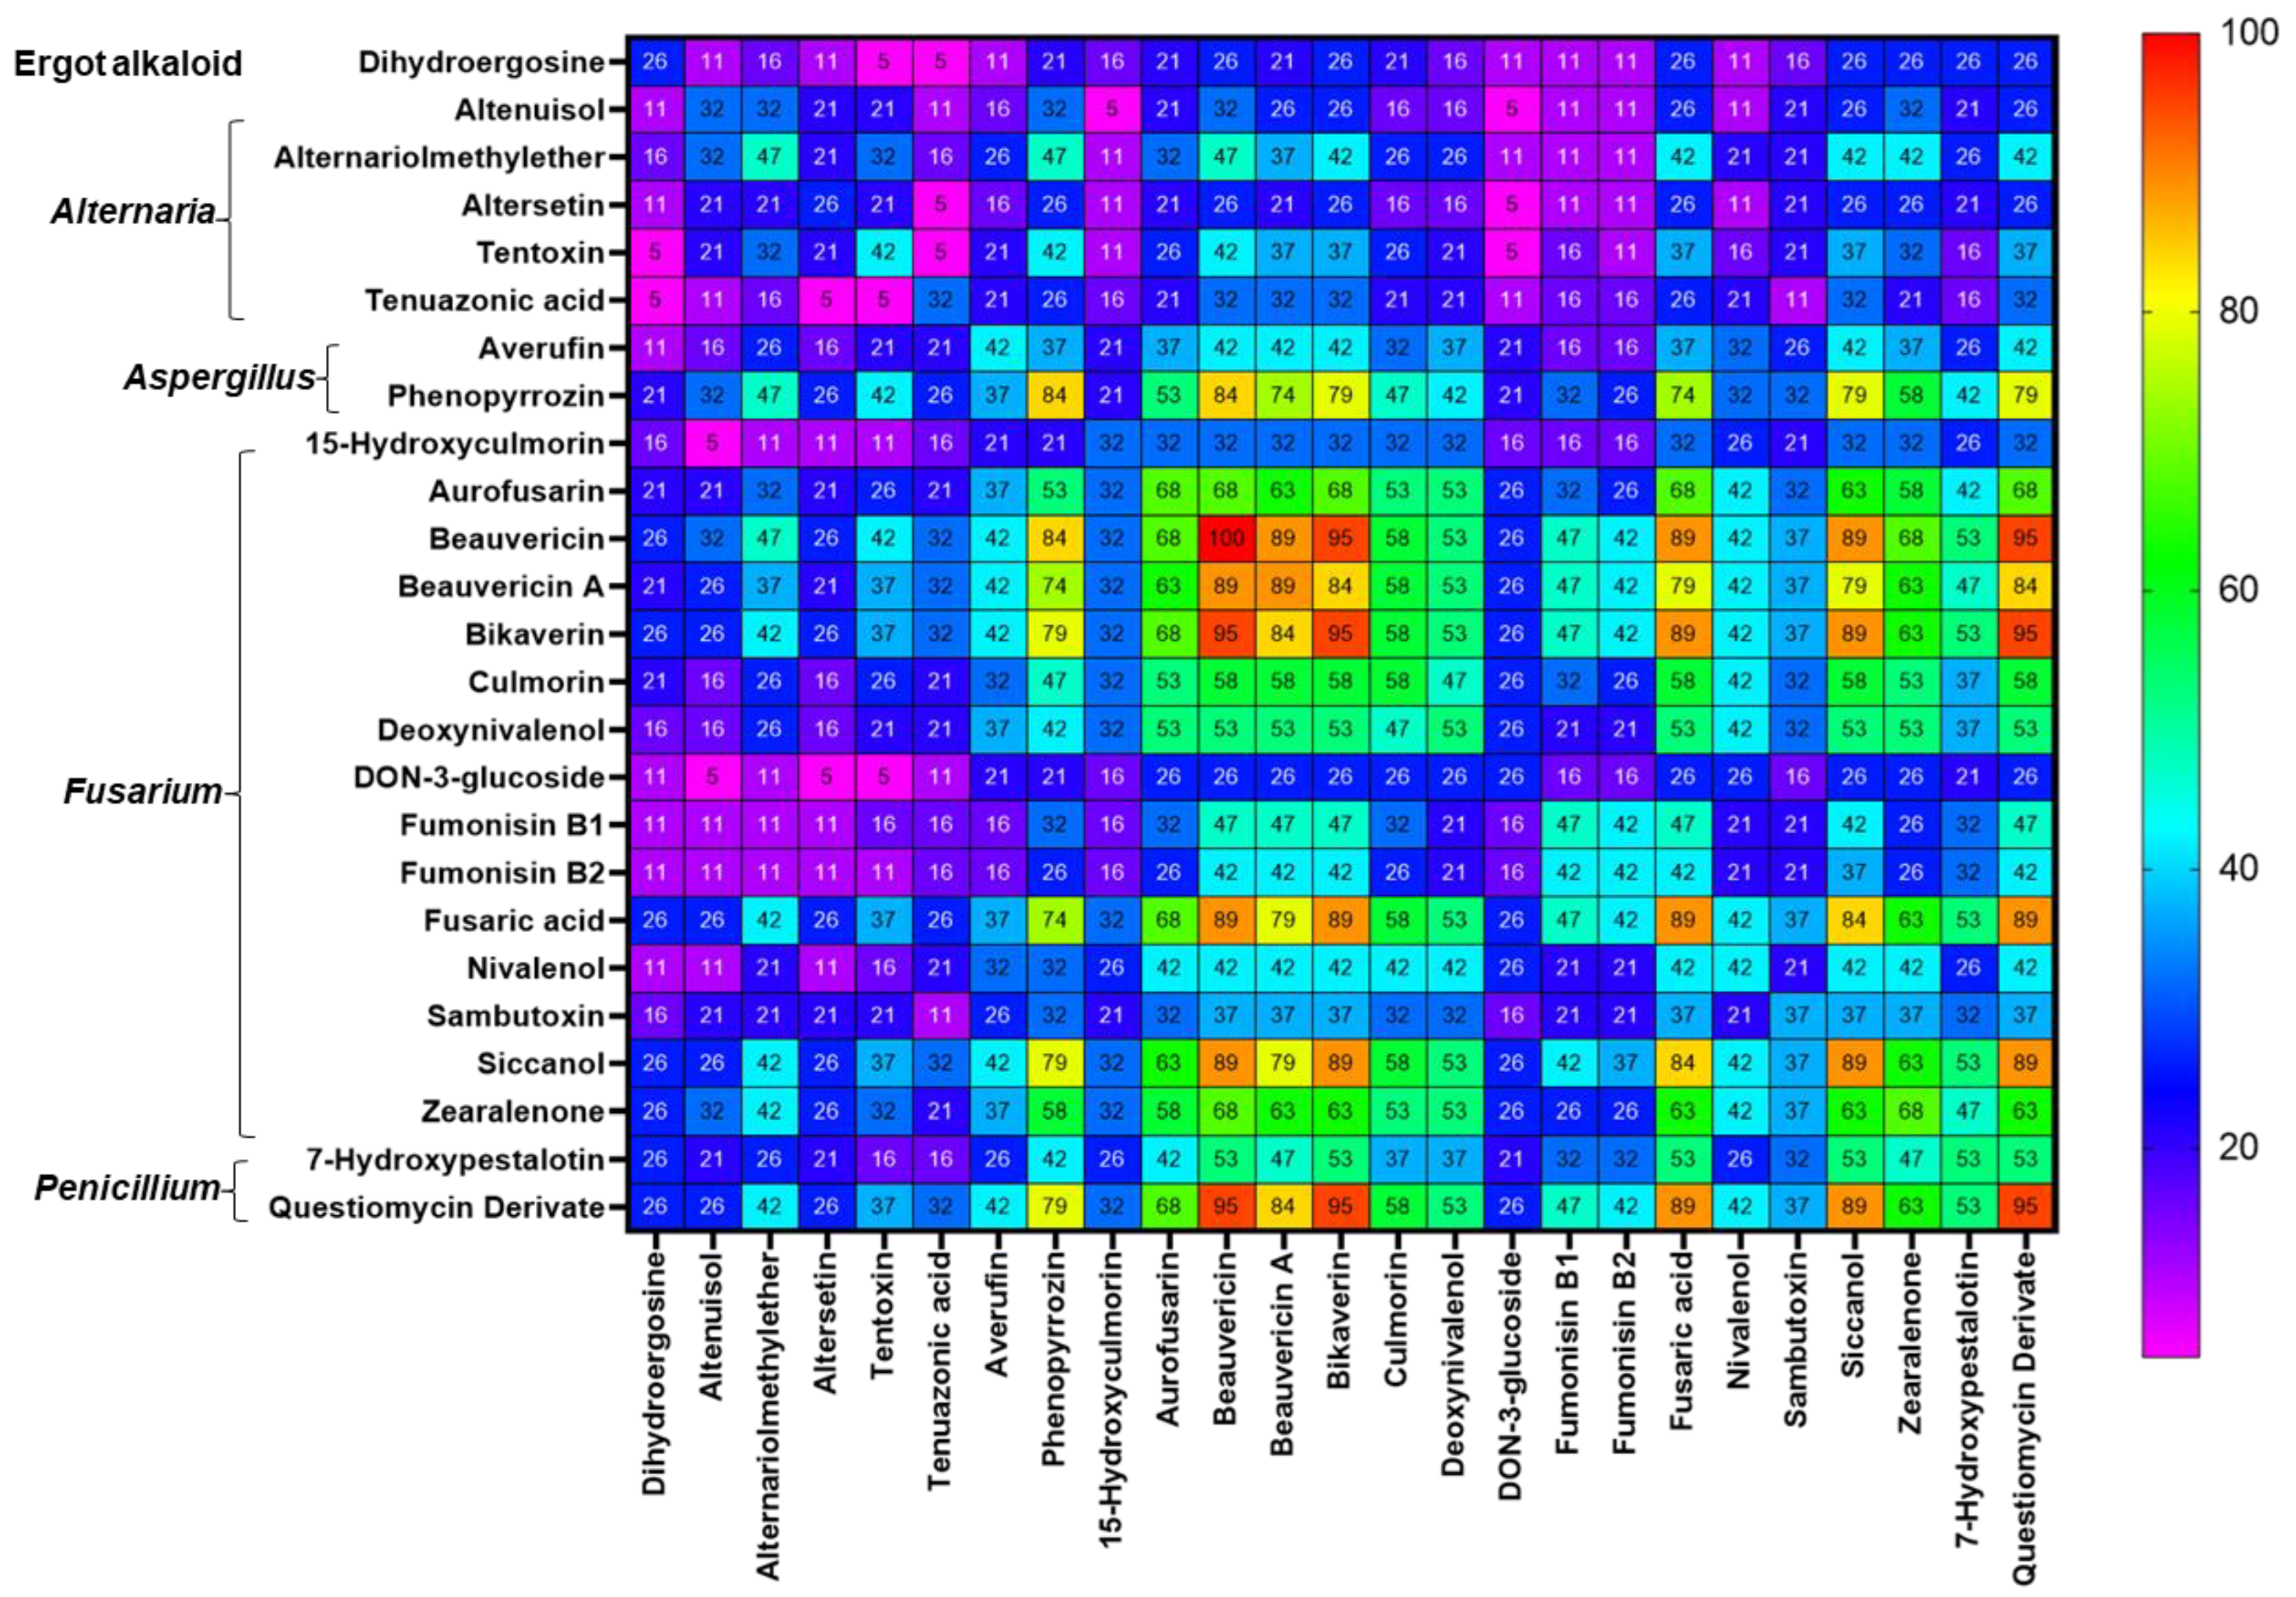
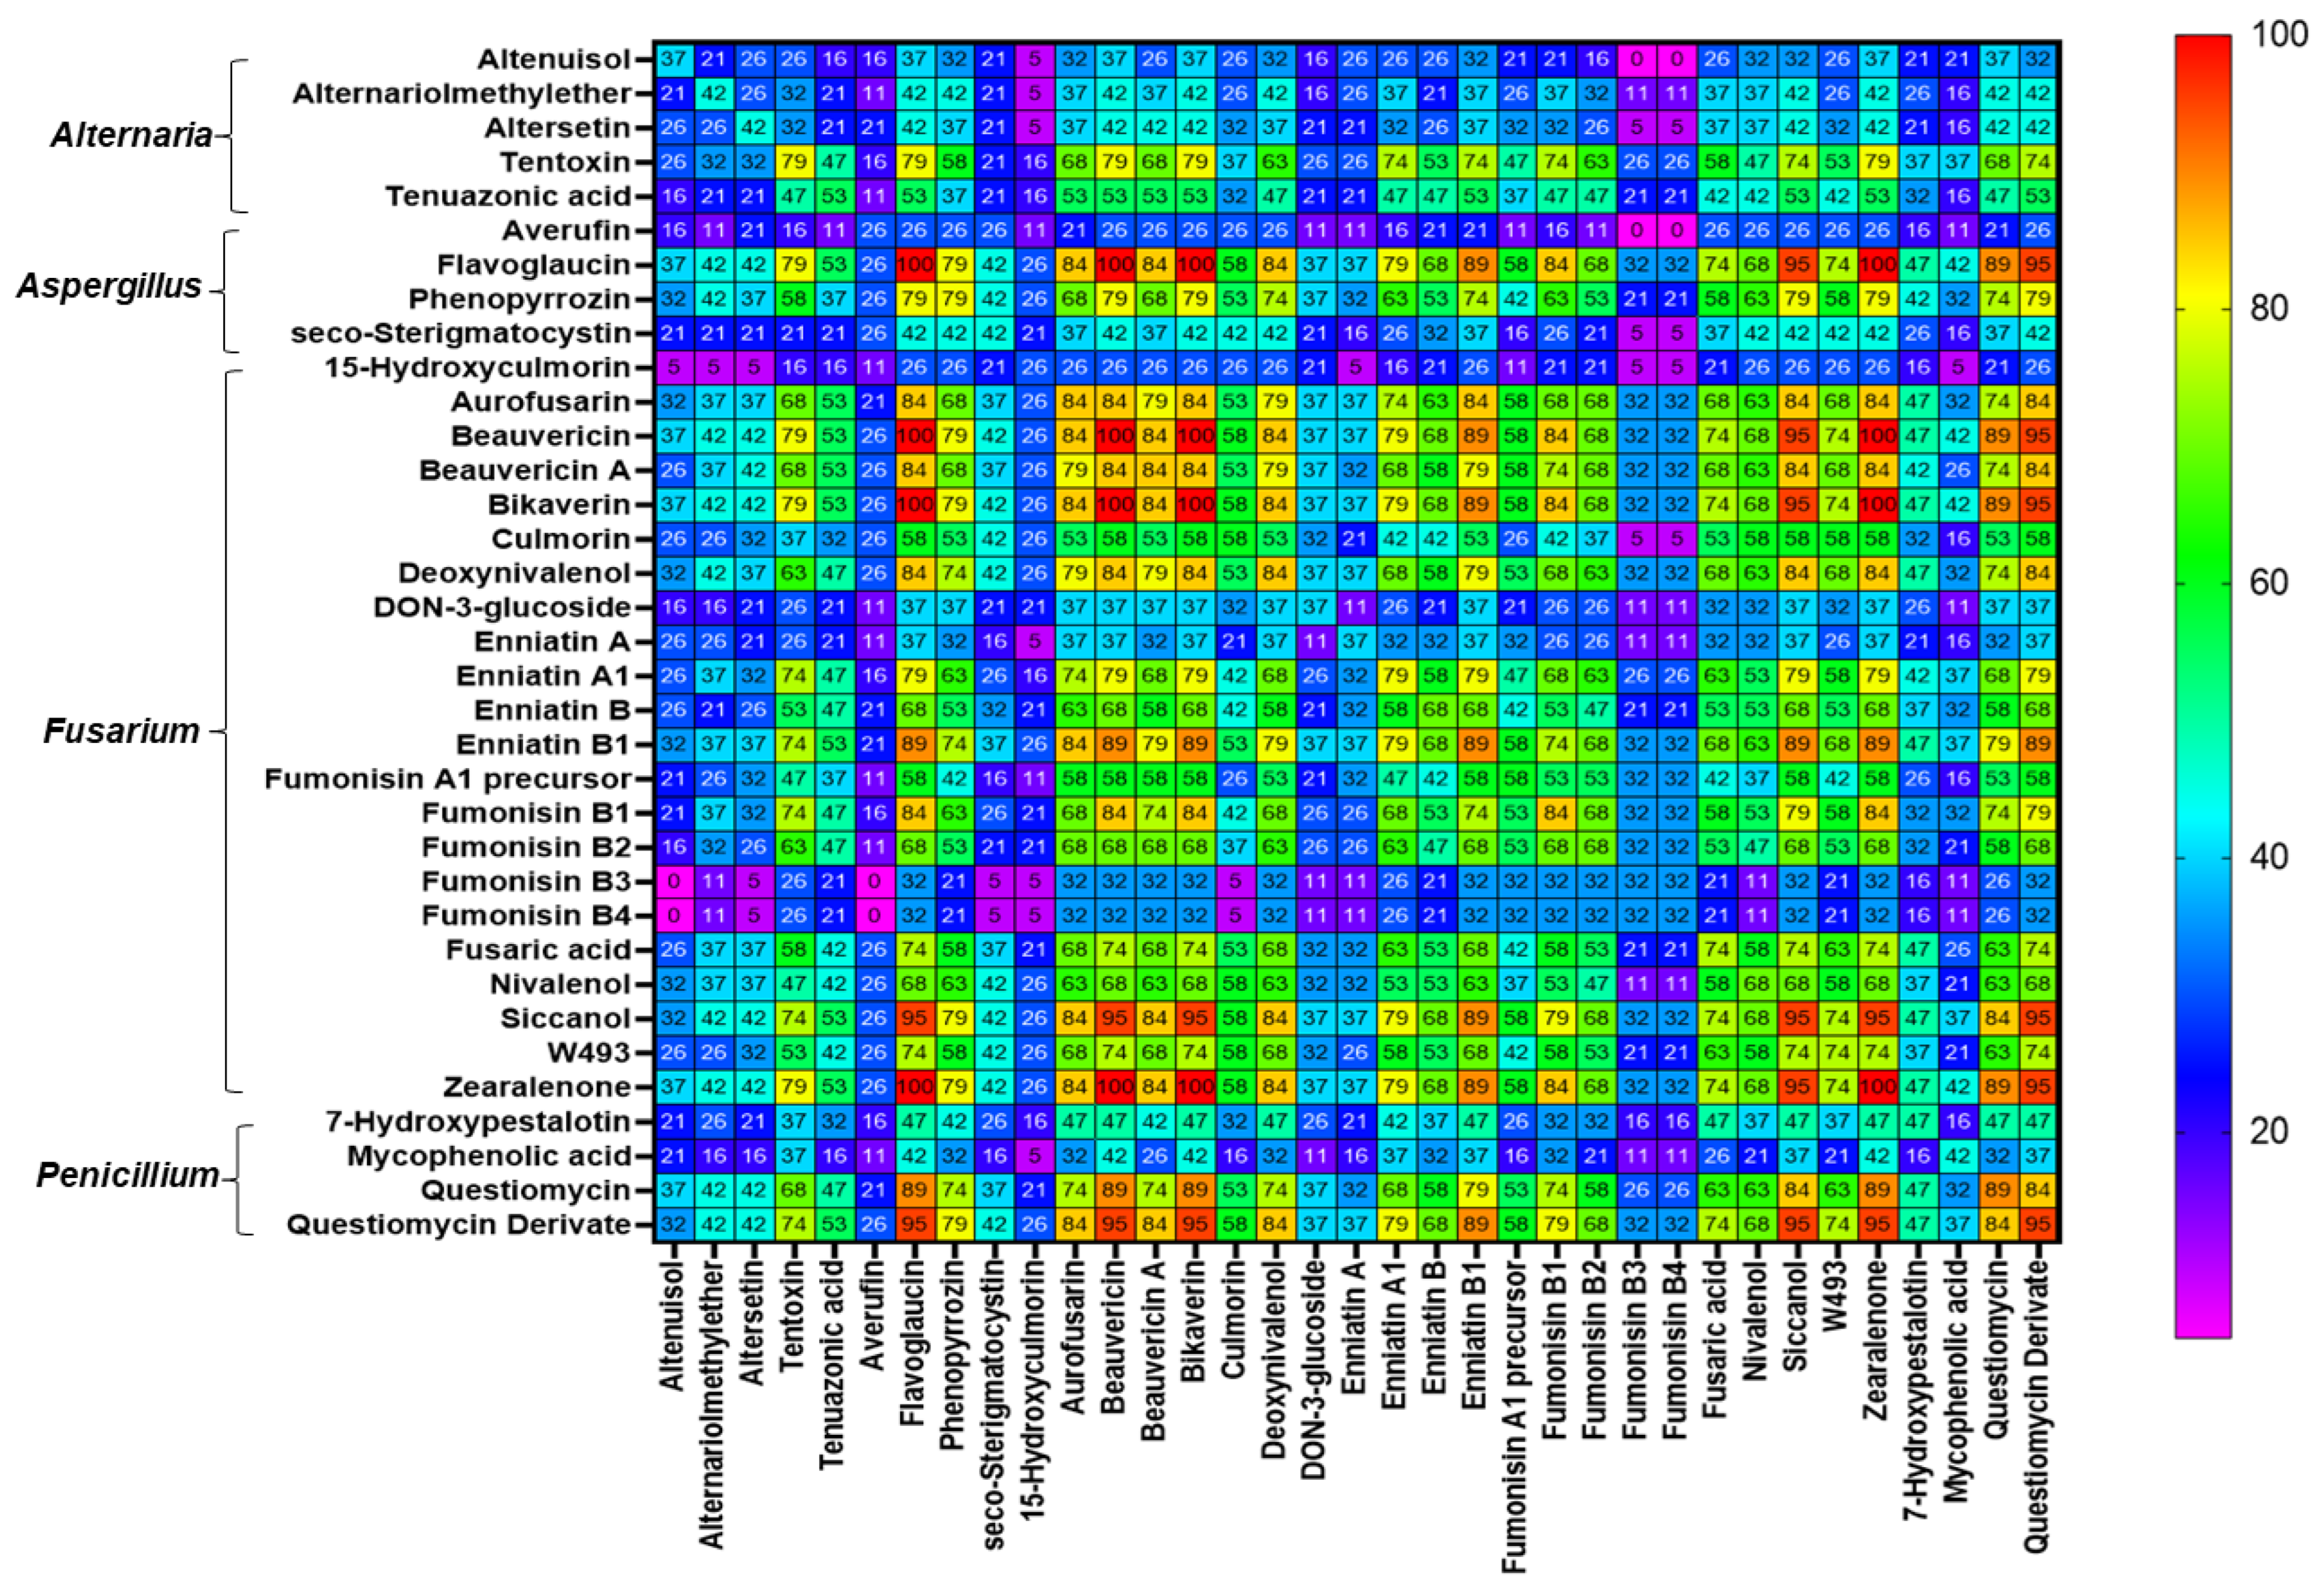
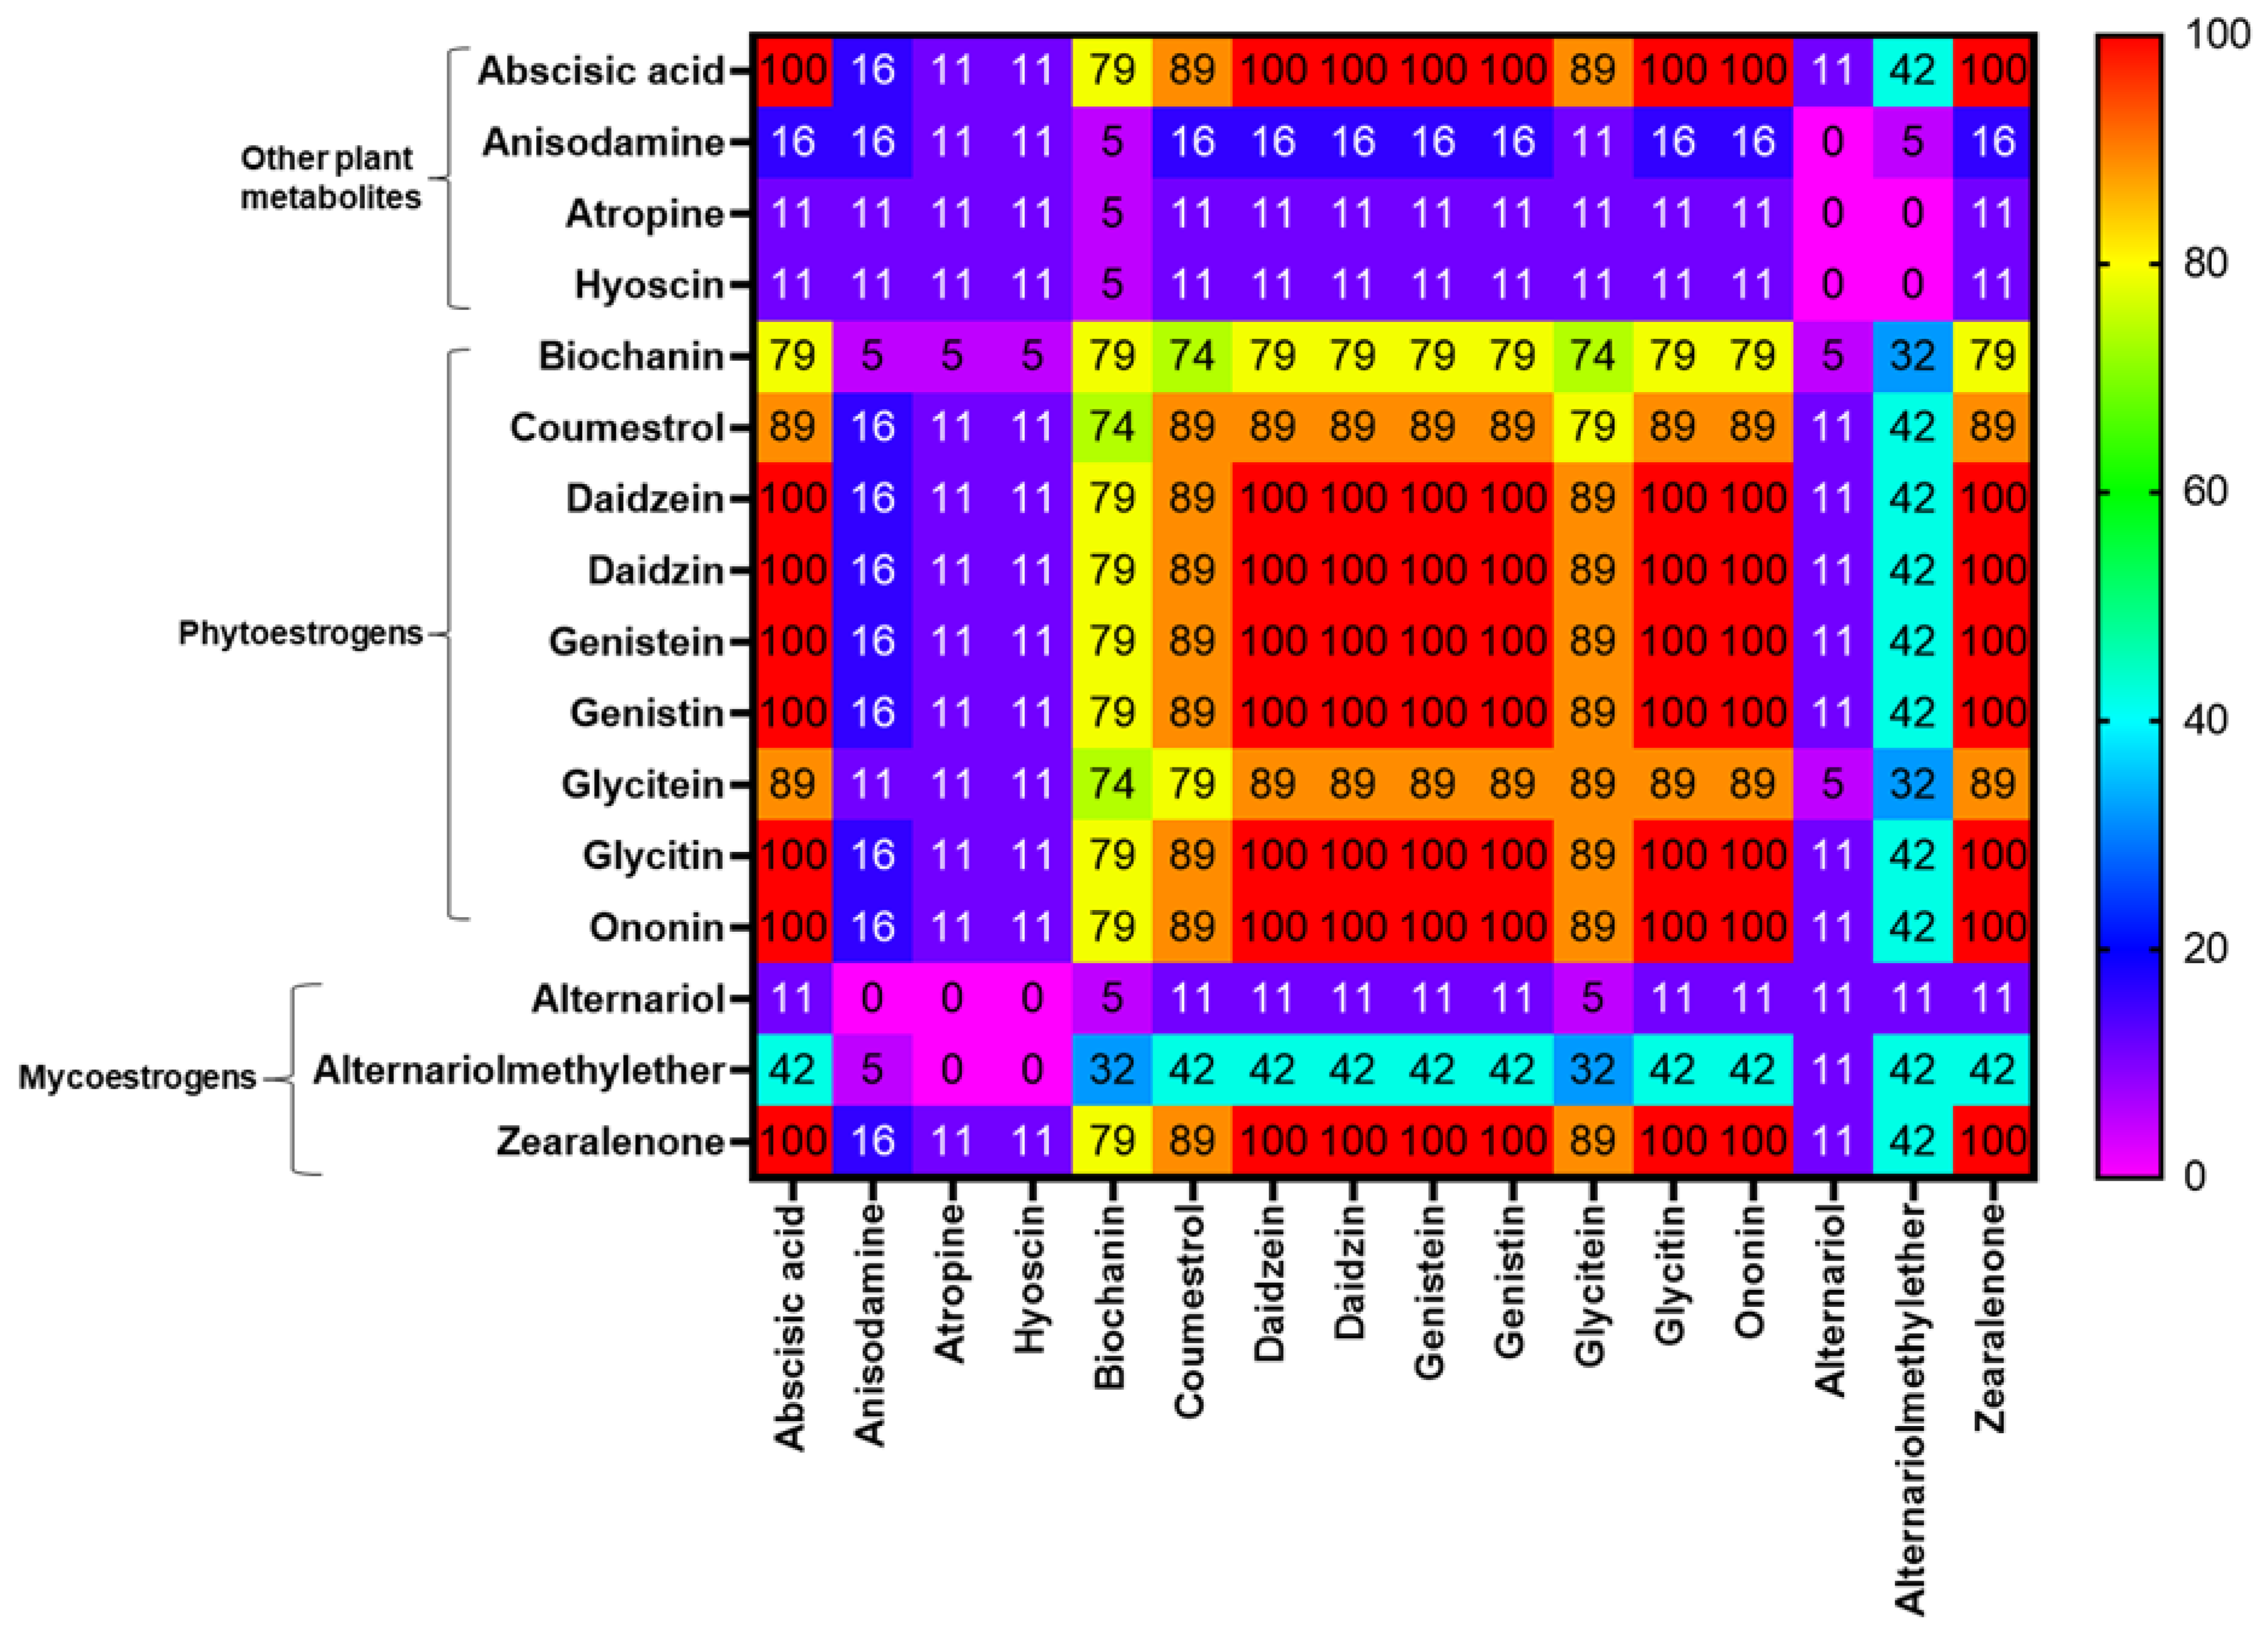
2.3. Co-occurrence of Mycotoxins and Phytoestrogens

Figure 2 illustrates the distribution and variation grade of the individual samples in the co-contamination levels of the metabolite groups. Table S1 presents the exact values of the co-contamination levels (average ± SD, median, minimum, maximum) of the groups of metabolites. Additionally, the significance (p-values) of the comparison via the Wilcoxon matched-pairs signed rank test between co-contamination of the diverse groups’ metabolites in samples of WPCSs and TMRs are also presented in Table S1. All the samples were co-contaminated with cocktails of toxins/metabolites. In total, the assessed WPCSs showed, on average, 29 metabolites per sample (range: 13–39 metabolites per sample), and TMRs showed 55 metabolites per sample (range: 31–66 metabolites per sample). Silages presented, on average, 17 mycotoxins per sample, varying from 6 to 27 mycotoxins per sample. The assessed TMR samples showed a mean of 24 mycotoxins per sample, ranging from 9 to 31 mycotoxins per sample. The mycotoxin co-contamination level was significantly higher (p < 0.0001) in TMRs. Fusarium-derived metabolites was the category among the fungal metabolites with the highest diversity of detected compounds, showing, on average, 14 metabolites per sample (max: 20 metabolites per sample) in WPCSs and 18 metabolites per sample (max: 24 metabolites per sample) in TMRs. The co-contamination grade with compounds derived from Aspergillus spp., Fusarium spp., Penicillium spp., and other fungi, in addition to the total fungal metabolites, phytoestrogens, plant metabolites, unspecific metabolites, and total metabolites, was significantly higher (p-value < 0.05) in the complete rations than in the silages.
Co-occurrence analyses (frequency of detection of combinations, in %) between mycotoxins/metabolites evidenced in WPCSs and TMRs are presented in Figure 3 and Figure 4, respectively. In the silages, the most frequent combinations of mycotoxins detected were among ZEN and fusarial emerging mycotoxins such as aurofusarin, beauvericin, beauvericin A, bikaverin, fusaric acid, and siccanol, which presented occurrences of over 50%. The co-occurrence of DON and ZEN was detected in 53% of the WPCS samples. The Aspergillus-produced metabolite phenopyrrozin and the Penicillium-derived questiomycin derivate showed co-occurrences of over 50% with ZEN and the emerging fusarial mycotoxins such as aurofusarin, beauvericin, beauvericin A, bikaverin, fusaric acid, and siccanol (Figure 3). Regarding the most recurrent combinations of mycotoxins/metabolites in TMRs, the co-occurrence among aurofusarin, beauvericin, beauvericin A, bikaverin, fusaric acid, and siccanol were higher than 75%. The mycoestrogen ZEN presented a high degree of co-occurrence with mycotoxins DON (84%), FB1 (84%), FB2 (68%), and NIV (68%). Remarkably, more than half of the TMR samples presented co-occurrence of the Alternaria-derived mycotoxins alternariolmethylether and tenuazonic acid and the Aspergillus-produced flavoglaucin and phenopyrrozin; questiomycin and its derivate also co-occurred with the fusarial mycotoxins DON, ZEN, FB1 aurofusarin, beauvericin, beauvericin A, bikaverin, and enniatin B1 (Figure 4).
The co-occurrence rates of estrogenic compounds (for instance, phytoestrogens and mycoestrogens) and other detected plant secondary metabolites (abscisic acid, anisodamine, atropine, and hyoscine) in TMRs are shown in Figure 5. All tested samples presented co-occurrence among the phytoestrogens daidzein, daidzin, genistein, genistin, glycitin, and onionin and the fusarial mycoestrogen ZEN. The occurrence of these mentioned estrogenic compounds with the Alternaria mycoestrogens alternariol and its monomethylether corresponded to 11% and 42%, respectively.

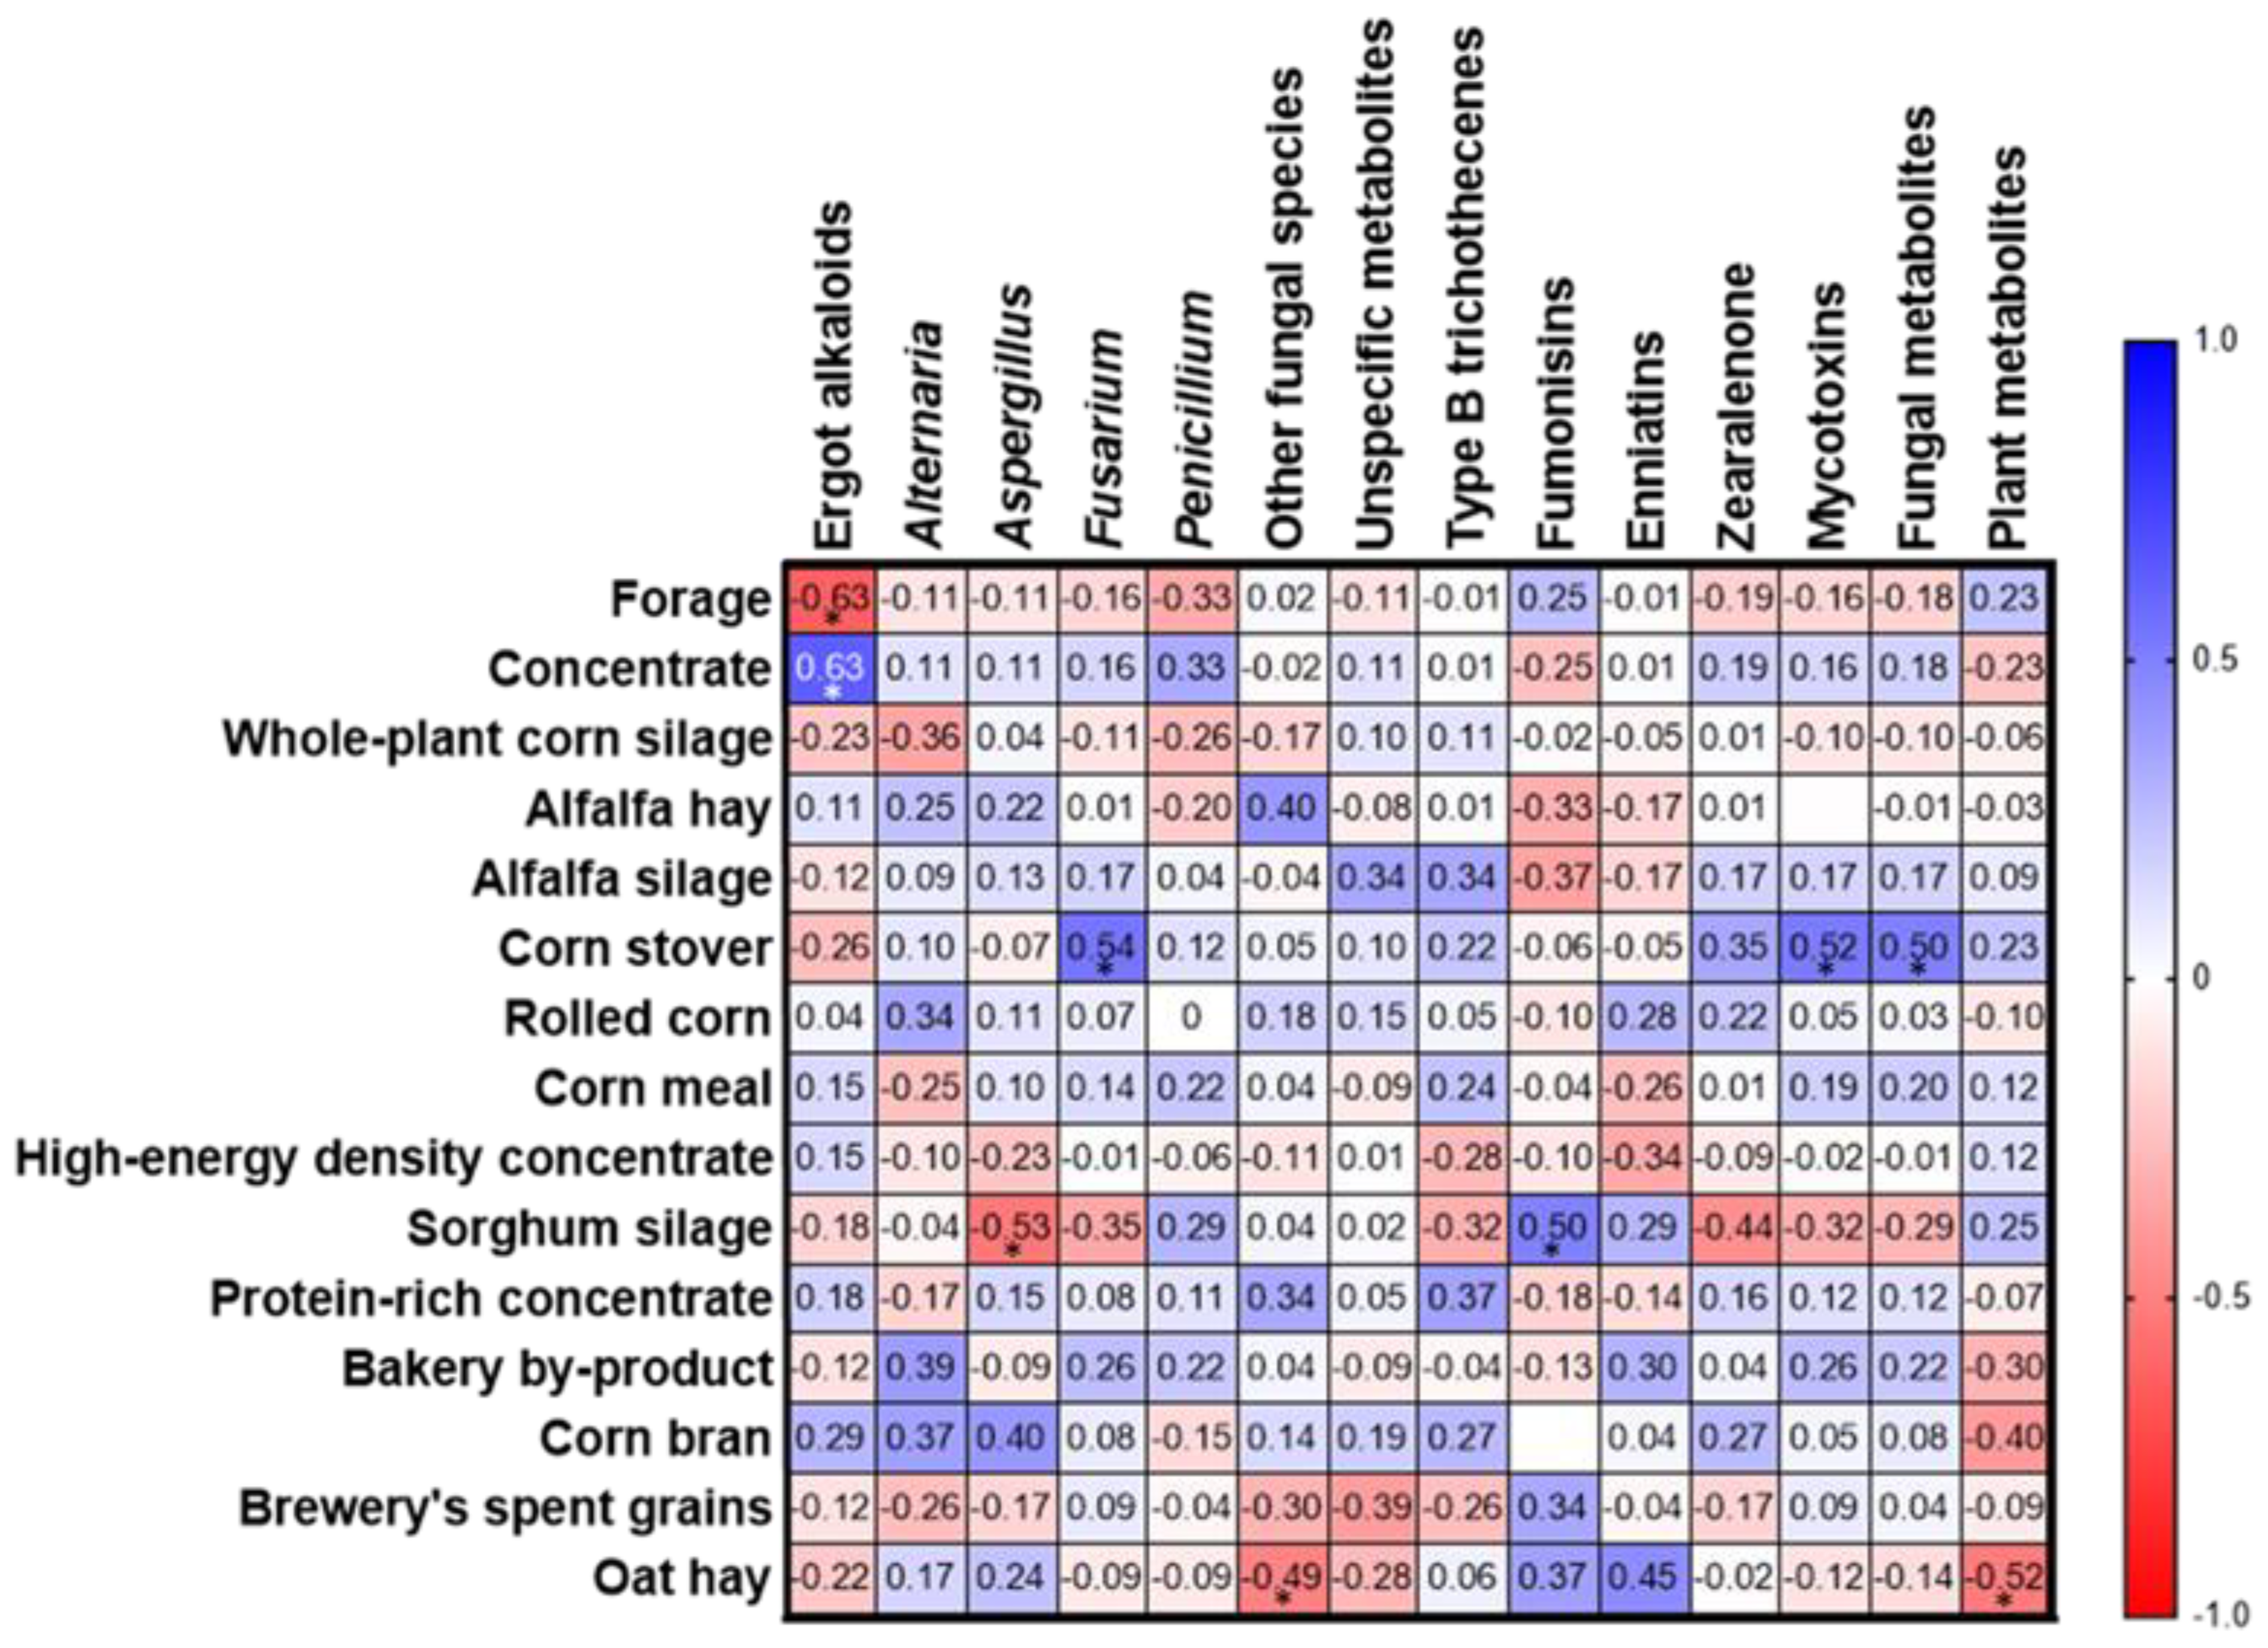
2.4. Relationship between Concentrations of Mycotoxin/Metabolite Groups and the Dietary Ingredients

Spearman’s correlation coefficients (rho(ρ)) among groups of metabolites detected in total mixed rations with the main ingredients of the TMRs are shown in Figure 6. The respective p-values of the correlation coefficients are presented in the supplementary Table S2. Correlations with individual mycotoxin, phytoestrogen, and tropane alkaloid levels were also assessed (data not shown); strong and moderate correlation coefficients and their respective p-values are presented in the text. A moderate positive correlation was observed between the total proportion of concentrate with total ergot alkaloids (ρ = 0.63, p-value = 0.038), the ergot alkaloid dihydroergosine (ρ = 0.63, p-value = 0.006), and the penicillium-derived metabolite pestalotin (ρ = 0.59, p-value = 0.008). The dietary content of corn stover presented a moderate positive correlation with levels of Fusarium-derived metabolites (ρ = 0.63, p-value = 0.0173), beauvericin (ρ = 0.60, p-value = 0.007), total mycotoxins (ρ = 0.52, p-value = 0.0220), and total fungal metabolites (ρ = 0.50, p-value = 0.0305). Sorghum silage showed a moderate positive correlation with the total Fs levels (ρ = 0.65, p-value = 0.0303), FA2 (ρ = 0.65, p-value = 0.0028), FB2 (ρ = 0.50, p-value = 0.0275), FB3 (ρ = 0.52, p-value = 0.0213), FB4 (ρ = 0.57, p-value = 0.0109), hydrolyzed FB1 (ρ = 0.73, p-value = 0.0004), and citrinin (ρ = 0.73, p-value = 0.0004). The dietary content of oat hay revealed a moderate positive correlation with the concentration of the Fusarium emerging mycotoxin enniatin B2 (ρ = 0.68, p-value = 0.0012) and the tropane alkaloid anisodamine (ρ = 0.52, p-value = 0.0236) and negative correlation with the metabolites produced by other fungi (ρ = 0.52, p-value = 0.0331) and total plant metabolites/phytoestrogens (ρ = 0.52, p-value = 0.0231). Brewery spent grains correlated positively and moderately with the alkaloid tropanes anisodamine (ρ = 0.54, p-value = 0.0165), atropine (ρ = 0.65, p-value = 0.0028), and hyoscine (ρ = 0.65, p-value = 0.0028).

3. Discussion

This investigation describes for the first time the occurrence of mixtures of mycotoxins, phytoestrogens, and other secondary metabolites in the WPCSs and TMRs of dairy farms in Mexico. The presented results confirmed the ubiquitous presence of mycotoxin mixtures in feeds and complete rations of dairy cows, as indicated in previous studies [2,22,39,40,41]. The multi-mycotoxin approach used in this study showed that previous reports on mycotoxin contamination are underestimations, as demonstrated by the mixtures fluctuating from 9 to 31 different mycotoxins (13 to 43 total fungal metabolites and 31 to 66 total secondary metabolites) per ration, evidencing the realistic scenario of simultaneous dietary exposition of dairy cattle to multiple mycotoxins and endocrine disruptors. Fusarium-derived mycotoxins/metabolites represented the most relevant fungal metabolites considering the high co-occurrence rates and levels in both WPCSs and TMRs. Our outcome confirms the importance of Fusarium spp. as a primary contributor to contamination with mycotoxins (such as ZEN, DON, and Fs), emerging mycotoxins (such as beauvericin), and other less studied metabolites in dairy cattle feeds, which have also been described in other regions such as South America [42], Europe [2,5,43], and Asia [22].
Mexican regulations establish maximum limits only for AFs in cereals and cereal products. The maximal levels for AFs for humans are 20 µg/kg and for cattle consumption 100–300 µg/kg [44,45]. No limits or guidance levels are set for other mycotoxins. Because Mexican regulations on mycotoxins in animal feed are outdated and not strict enough, they should be updated accordingly [46]. As reference values for this discussion, the advisory limits/guidance values established by the FDA and EU Commission [19,47,48] will be considered. On an 88% DM basis, the FDA sets for complete rations of dairy animals levels of 5000 µg DON/kg, 30,000 µg Fs (FB1 + FB2 + FB3)/kg, and 20 µg AFs/kg. For OTA (and others ochratoxins) as well as ZEN, the FDA has no regulatory limits [47,48]. The EU Commission recommends 500 µg/kg for ZEN and 5000 µg/kg for DON [19]. Previous studies on mycotoxins in Mexico cattle feeds focused mainly on classic mycotoxins such as AFs, Fs, OTs, ZEN, and DON [11,49]. In the case of the individual mycotoxin levels such as DON (max: 1670 µg/kg), ZEN (max: 246 µg/kg), and total Fs (max: 1670 µg/kg), no sample presented contamination levels higher than the FDA or EU Commission’s regulatory levels. However, the sum of related toxic metabolites can be higher than such regulatory limits, for example, the sum type B trichothecenes (amount of DON, 15-acetyl-DON, DON-3-glucoside, and NIV). The highest concentration of total type B trichothecenes detected in TMR samples was 5510 µg/kg (equivalent to 6405 µg/kg on an 88% DM), which is above the levels of the single parent mycotoxin included in the legislation (DON). This evidence shows that although the analysis of individual analytes can be below the guidance levels, the total content of related metabolites such as modified mycotoxins, in this case type B trichothecenes, can be above the guidance value, representing a risk. Our results confirm that mycotoxin regulations target the tip of the iceberg if we consider the multiple mycotoxins co-occurrence (i.e., the real-world scenario), as suggested previously [2,4]. In fact, common combinations of mycotoxins detected in the TMR samples from Mexico such as DON and ZEN (84%), ZEN and NIV (68%), ZEN and FB1 (84%), and NIV and DON (63%) present synergistic effects [50,51,52,53,54]. McKay et al., 2019 demonstrated that diets (TMR) contaminated with concentrations under the FDA or EU Commission guidance levels, for instance, 1966 μg DON/kg DM and 366 μg ZON/kg DM, declined milk yield to 0.74 kg/cow/d, which can reduce the income of farmers significantly [55].
TMRs of Mexican dairy cows also were contaminated with other less studied compounds derived from Fusarium (such as beauvericin, enniatins, culmorin, and bikaverin), Alternaria (e.g., alternariolmethyether and teanuazonic acid), and Aspergillus (e.g., kojic acid, averufin, and STC) along with Penicillium toxins (such as mycophenolic acid) and other metabolites that have been reported previously in the diets and silages of dairy cattle [2,22,43,56]. As in preceding studies, the current research found Fusarium mycotoxins/metabolites to be a dominant group of fungal metabolites in WPCSs and TMRs [2,43]. The occurrences and average levels of enniatins and ergot alkaloids were lower than those of diets and maize silages in Europe reported recently [2,43], which suggests that these kinds of toxins occur less in Mexico, representing a lower risk than in Europe. However, this must be confirmed by additional studies. On the other hand, the occurrence and total Fs levels were higher in the TMRs of Mexican dairy farms (occurring in 89% of the samples; average: 325 µg/kg; max: 1670 µg/kg) than the dietary levels of total Fs previously reported in Austria (with an occurrence of 71%; average: 150 µg/kg; max: 1590 µg/kg) [2]. The occurrence of FB1 (34.8%) and FB2 (29.1%) in a European survey on mycotoxins in WPCSs [43] was lower than that evidenced in our study (FB1: 47%; FB2: 42%). Comparing the median and maximum concentrations of Fs in WPCSs from Mexico showed averages (FB1 median: 124 µg/kg; max: 2703 µg/kg; FB2 median: 301 µg/kg; max: 987 µg/kg) higher than the averages of European WPCSs (FB1 median: 60 µg/kg; max: 553 µg/kg; FB2 median: 20.4 µg/kg; max: 133 µg/kg) [43]. The same trend was evidenced for DON occurrences and levels in Mexican (100%; median: 1370 µg/kg; max: 3352 µg/kg) and European (67.7%; median: 303 µg/kg; max: 3060 µg/kg) WPSCs. This study did not find samples contaminated with OTA, a mycotoxin with low occurrence in European WPCSs (2.5%) [43] and Austrian complete rations (1%).
ZEN also presented higher occurrence and median in Mexican (100%; 15.2 µg/kg) than in European (67.7%; µg/kg) WPSCs. However, the ZEN maximum level detected in a WPCS sample from Europe (1670 µg/kg) was around 6 times higher than that reported in the present study (278 µg/kg). Although our investigation did not detect AFB1 and OTA, as initially expected, it is essential to clarify that these fungal compounds with carcinogenic properties have been widely reported in dairy cattle feeds (such as cereals) and dairy products (AFM1) in Mexico, representing a real and latent veterinary and public health risk in this country [12,46,49,57,58,59,60]. Averufin, sterigmatocystin, and versicolorin C, considered to be possible precursors of AFs [61,62,63,64,65], were detected. Sterigmatocystin was previously reported in Mexican maize [59]. Like AFs, sterigmatocystin is known to be a carcinogenic compound with immunotoxin and immunomodulatory activity. Data on the exposure of dairy cows and other animals to sterigmatocystin and the related toxicological implications are limited [66,67,68].
Our results highlight teanuazonic acid as one of the most abundant Alternaria mycotoxins in TMRs. However, animal epidemiological and toxicological information on Alternaria-produced toxins (e.g., alternariol, alternariolmethylether, and teanuazonic acid) is still required. Health risks associated with Alternaria toxins in feeds must be investigated and clarified [69]. We also detected the Penicillium-derived compound mycophenolic acid, mainly related to post-harvest contamination during the ensiling process [8,40,70]. Previous studies showed average levels of mycophenolic acid of 54 µg/kg and 47.5 µg/kg in TMRs from the Netherlands and Austria, respectively [2,71]. The mean of the evaluated TMR samples (32 µg/kg) was lower than the cited European reports. Additionally, kojic acid, produced primarily by Aspergillus spp. but also by some Penicillium spp. [72], has demonstrated antibacterial and immunomodulatory activity [73,74,75]. Citrinin, which is primarily Penicillium-derived [76] but also produced by some Aspergillus spp. [77], was also found. Moreover, several less known metabolites produced by other fungi were detected in TMRs. Some of them, such as cercosporin, the illicicolins, and cytochalasins, have antibacterial activity [78,79,80,81]. The diversity of mycotoxins and fungal secondary metabolites detected in TMRs is due to their multi-commodity composition (Table 1).
Concerning the risk associated with toxicological interactions of mycotoxins [4,82], this study demonstrated a high occurrence of a wide variety of mycotoxins (most of them not considered in legislation at the international level) and other fungal secondary metabolites in the TMRs of dairy cattle. In addition, our findings also showed that phytoestrogens constituent a class of metabolites ubiquitously contained in dairy cow rations. The concern in veterinary medicine and public health related to phytoestrogens is due to their endocrine-disrupting activity. These estrogenic compounds are found primarily in Leguminosae plants, such as clovers (Trifolium spp.), alfalfa (Medicago sativa), and soybeans (Glycine max), and they can act as endocrine disruptors, impairing the reproductive performance of livestock [25,26,27,28,29,30,31,32,33,34,35,36,37,83,84]. In TMR samples, the phytoestrogens that most occurred and the highest concentrations presented were isoflavones such as genistin, daidzein, glycitin, and daidzein (Table 3). However, coumestrol, which is reported to be more potent in estrogenic activity than isoflavones, presented concentrations below the reported critical range (18–180 mg/kg) [85]. The interaction of phytoestrogens with other estrogenic xenobiotics (such as mycoestrogens) is currently the focus of interest [86,87,88]. In this study the co-occurrence of these estrogenic compounds with mycoestrogens such as ZEN, alternariol, and alternariolmethyether was corroborated in TMRs of dairy cattle (Figure 5), matching previous results of a similar survey carried out in Austria [2]. Along with the mentioned phytoestrogens, other plant-derived compounds detected in TMRs of dairy cows were the phytohormone abscisic acid [89] and the tropane alkaloids anisodamine, atropine, and hyoscine [90]. These alkaloids can have a wide range of biological activity (e.g., anticholinergic effects) and are mostly detected in high concentrations in plants belonging to the Solanaceae and Erythroxylaceae families [91]. These tropane alkaloids were previously detected in cattle feed from Tunisia and Spain in lower concentrations [92] than those presented here. However, according to a scientific opinion of the panel on contaminants of the European Food Safety Authority (EFSA), toxicosis due to tropane alkaloids in livestock is relatively rare [93]. We consider the presence of these alkaloids in TMRs to be a consequence of the existence of native Solanaceae weeds in the feed crops of Mexican dairy cattle. Due to the detected occurrences (≤16%) and low concentrations (<300 µg/kg) in TMR samples, these alkaloids seem not be a risk for the fed cattle.
Our results revealed corn stover as the most correlated ingredient with the content of total mycotoxins, Fusarium-derived metabolites, and fungal metabolites (Figure 6). Corn stover is the stalks, leaves, and husks that remain in the field after corn harvest [94]. It has been reported as a source of abundant exposure to Fusarium mycotoxins such as Fs, ZEN, and DON [95,96]. The content of ergot alkaloids correlated to the proportion of concentrate in the diet, confirming previous reports that related cereal grains with ergot alkaloids [97]. The proportion of sorghum silage in the rations presented the highest correlation with total content of Fs but also of FA2, FB2, FB3, FB4 hydrolyzed FB1, and citrinin. A previous study performed in the state of Nuevo León, Mexico, evidenced a contamination rate by Fs of 62% [98]. In Uruguay, it was found that 40% of the freshly harvested samples of sorghum presented contamination with Fs [99]. In Brazil, the occurrence of FB1 in sorghum was 74% [100]. These reports demonstrated that Fs contamination is common in this crop. In contrast to prior investigations in other regions such as Europe and South America [2,26,43,71], our results do not suggest WPCSs as one of the most contributing feedstuffs to mycotoxin/metabolite contamination. Concerning the correlations between the dietary ingredients and the levels of mycotoxins/metabolites, it is crucial to consider that more consistent association and relationship assessments require higher sample sizes and additional studies.
The complex mixtures of different mycotoxins, phytoestrogens, and other metabolites evidenced in the WPCSs and rations of dairy cattle in Mexico indicate, along with previous reports/studies, that unexplored and unpredictable toxicological interactions, such as synergistic as well as antagonistic toxic effects, are happening. Extensive studies using a multi-metabolite approach should be performed in other Mexican regions and other Latin American countries on dairy feed and other animal feed but also food for human consumption, including animal-derived products such as dairy products. More governmental interest and research are essential to ensure the safety of animal feed and derived foods, which will support animal health and the productive potential of herds, as well as the delivery of safe products to consumers.

4. Conclusions

This study demonstrated the ubiquitous contamination of WPCSs and TMRs by a wide spectrum of mycotoxins/metabolites (derived from the genera Fusarium, Alternaria, Aspergillus, and Penicillium) and endocrine disruptor compounds such as phytoestrogens and other metabolites in Mexico. Overall, Fusarium-produced mycotoxins and metabolites were the dominant fungal contaminants. In the assessed TMR samples, ZEN was found with a frequency of 100%, Fs of 89%, and DON of 84%. Although the detected individual levels of the classic mycotoxins (ZEN, DON, FB1, and FB2) were below the maximum/guidance values of Mexican, EU, and FDA regulations, the fact that multiple (regulated, modified, and emerging) mycotoxins co-occurred in complex mixtures, fluctuating from 9 to 31 toxins per sample, should cause concern. Most detected mycotoxins/metabolites are not well studied; their effect as mixtures and their toxicological implications have not been determined. Long-term and subclinical effects on herds’ health, production, and reproduction produced by complex mixtures of toxins and endocrine disruptors are unpredictable and require more research. Regarding the ingredients that represent more risk for mycotoxin contamination in TMRs, corn stover was the most correlated feedstuff to high total mycotoxins levels, and sorghum silage was most correlated to Fs contamination. Our results also revealed that dietary concentrate proportion had the strongest correlation to ergot alkaloid contamination in the TMRs of Mexican dairy cattle.

5. Materials and Methods

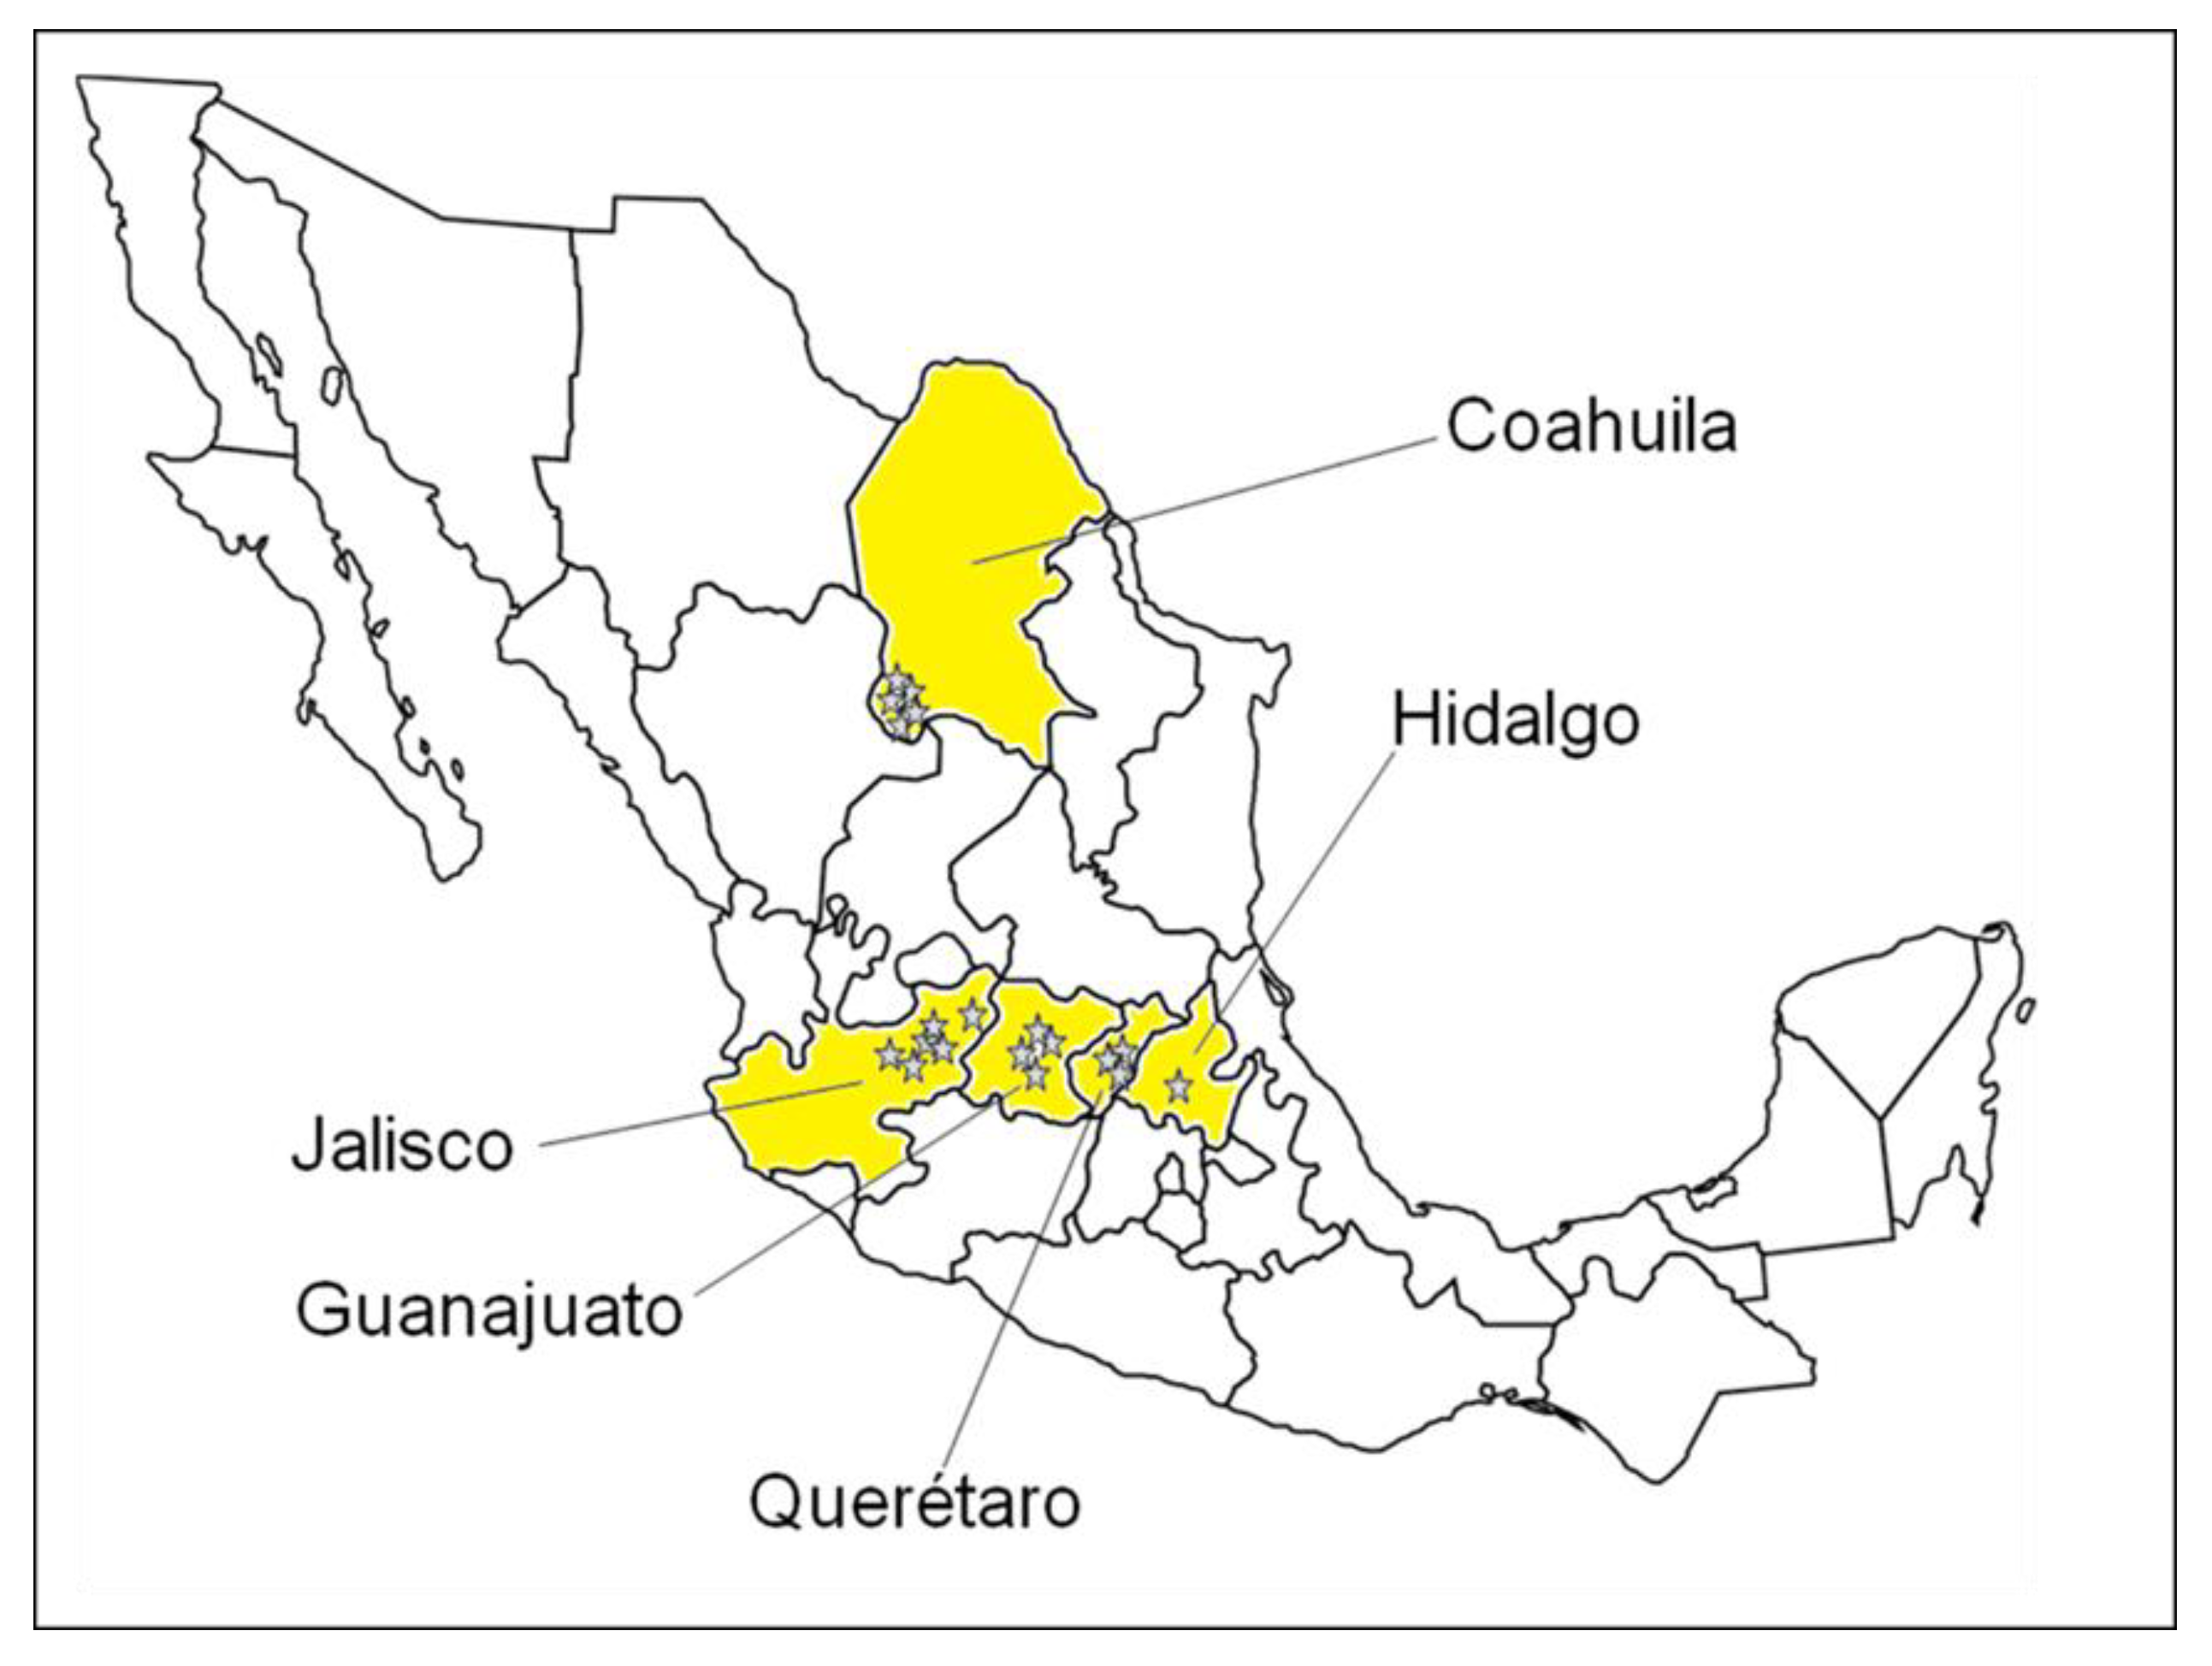
5.1. Sampling and Sample Preparation

Representative samples of TMRs and WPCSs were collected from 19 dairy farms in 5 states in northern and central Mexico—for instance, Coahuila (5), Guanajuato (3), Hidalgo (1), Jalisco (7), and Querétaro (3) (Figure 7). The average herd size of the participating farms was 1512 (SD ± 986) lactating cows, varying from 100 to 3500 lactating cows. The main cattle breed of the farms was Holstein-Friesian. Each representative sample of TMRs and WPCSs consisted of at least of 30 incremental samples. Data on the TMR formulation (most important ingredients and their respective proportions) were collected via personal interview (questionnaire-guided).
The samples were manually collected with gloves from the feed bunk directly after the serving (TMR) (according to Penagos-Tabares et al., 2022 [2]) and from already-opened and “ready to be fed” WPCS bunker silos (according to McElhinney et al., 2016 [101]). The amount of composited samples (>30 incremental samples) was 1–1.5 kg. Collected samples were homogenized (properly manually mixed), vacuum-packed, and stored in the dark at −20 °C until sample preparation. Sampling was carried out during the period of July–August of 2022. For the sample preparation, TMR and WPCS samples were air-dried (at 65 °C for 48 h) and the whole samples were subsequently milled to a final particle size < 0.5 mm using a mill (Hamilton Beach Model 80335R, Hamilton Beach Brands Inc., China). Finally, aliquots of 5 grams (±0.01 g) of each homogenized representative sample were designed for analysis. The samples were placed into 50 mL polypropylene conical tubes (Sarstedt, Nümbrecht, Germany) and sent to Tulln an der Donau, Austria, for multi-metabolite analysis. The sample preparation was carried out at the Laboratory of Animal Nutrition of Facultad de Estudios Superiores Cuautitlán, Medicina Veterinaria y Zootecnia (UNAM), located in Cuautitlán Izcalli, México.

5.2. Multi-Mycotoxin Analysis (LC-ESI–MS/MS)

The validated multi-metabolite (>800) liquid chromatography/electrospray ionization–tandem mass spectrometric (LC/ESI–MS/MS) method was carried out at the Institute of Bioanalytics and Agro-Metabolomics of the University of Natural Resources and Life Sciences, Vienna, located in Tull an der Donau, Austria, according to previous descriptions. Water purification was completed using a Purelab Ultra system (ELGA LabWater, Celle, Germany). Glacial acetic acid (p.a.) and ammonium acetate (LC-MS grade) were bought from Sigma-Aldrich (Vienna, Austria). HiPerSolv Chromanorm HPLC gradient grade acetonitrile was purchased from VWR Chemicals (Vienna, Austria), and LC-MS Chromasolv grade methanol was acquired from Honeywell (Seelze, Germany). Standards of >800 fungal, plant, and unspecific secondary metabolites were supplied by several research institutions or commercial providers and are listed in Supplementary Table S3. For simultaneous quantification of multiple metabolites, 5 grams (±0.01 g) of each TMR and WPCS sample was extracted in 20 mL of the extraction solvent (acetonitrile/water/acetic acid 79:20:1, v/v/v) following the procedures reported by Steiner et al. (2020) [102]. These volumes were placed into the QTrap 5500 LC-MS/MS system (Applied Biosystems, Foster City, CA, USA) equipped with a TurboV electrospray ionization (ESI) source coupled to a 1290 series UHPLC system (Agilent Technologies, Waldbronn, Germany). Subsequently, quantification from external calibration by serial dilutions of a stock solution of analyzed compounds was accomplished. Finally, the outcomes were adjusted for apparent recoveries defined through spiking experiments, according to Steiner et al. (2020) [102]. This analytical methodology has been validated [96] and used to study the occurrence of multiple metabolites in complex feedstuff matrices such as silages, pastures, concentrates, and TMRs [2,5,22,39,56]. The method accuracy has been verified on a routine basis by proficiency testing organized by BIPEA (Genneviliers, France). Satisfactory z-scores between −2 and 2 have been achieved for >95% of >1800 results submitted so far. Supplementary Table S4 presents performance values of LC/ESI–MS/MS analysis for mycotoxins, phytoestrogens, and other fungal, plant, and unspecific metabolites detected in WPCSs and TMRs.

5.3. Data Analysis

Concentrations of metabolites were presented in μg/kg on a DM basis. Descriptive statistics (i.e., occurrences and the average, median, and range of the concentrations) were processed considering only the positive values (x ≥ limit of detection (LOD)) using Microsoft® Excel®. Values lower than the limit of quantification (LOQ) were calculated as LOQ/2. The normality assessment of the data was completed via the D’Agostino and Pearson test, Anderson-Darling test, Shapiro-Wilk test, and Kolmogorov-Smirnov test. All the tests indicated the non-normal distribution of the handled data. Considering the dependence, the differences between concentrations of metabolites in TMRs and WPCSs of each respective farm were assessed via the (nonparametric) Wilcoxon matched-pairs signed rank test, and statistical differences were considered significant at p-value < 0.05. The co-occurrence analyses of mycotoxins and plant metabolites were performed separately using Microsoft Excel, generating matrices plotted in heatmaps. Moreover, a two-tailed Spearman’s correlation test was conducted to explore possible relations among dietary ingredients and levels of metabolites. Spearman’s correlation coefficients were considered significant at a p-value < 0.05. Accordingly, the correlation coefficients were interpreted according to Hinkle et al. 2003 [103]: “very high” (0.90 up to 1.00), “high” (0.70 up to 0.90), “moderate” (0.50 up to 0.70), “low” (0.30 up to 0.50), and “negligible” (<0.30). Low and negligible correlations were not considered for the interpretation of the results. The statistical analyses and graphs were completed using GraphPad Prism version 9.5 (GraphPad Software, San Diego, CA, USA).

Supplementary Materials

The following supporting information can be downloaded at: https://www.mdpi.com/2072-6651/15/2/153/s1, Figure S1: Distribution of concentration (µg/kg DM, linear scale) of (a) groups of fungal metabolites and mycotoxins and (b) total phytoestrogens and plant metabolites detected in in whole-plant corn silages (yellow) and total mix rations (gray) in dairy farms in Mexico. Asterisks (*) show significant differences (p-value < 0.05) between the concentrations of the respective groups in whole-plant corn silages and total mixed rations according to the Wilcoxon matched-pairs signed rank test (p-values in Table 2). Means are shown as “+”; Table S1: Description of the co-contamination level of the diverse groups of analysis detected in whole-plant corn silages and total mixed rations of Mexican dairy farms; Table S2: p-values of the Spearman’s correlation coefficients (ρ) among groups of metabolites detected in total mixed rations with the main dietary ingredients. Significantly different (p-value < 0.05) presented in black cells; Table S3: List of 863 targeted metabolites to analyze whole-plant corn silages and total mixed rations from Mexican dairy farms via a validated multi-metabolite liquid chromatography/electrospray ionization–tandem mass spectrometry (LC/ESI–MS/MS); Table S4: Performance values of liquid chromatography/electrospray ionization–tandem mass spectrometry (LC/ESI–MS/MS) analysis for mycotoxins, phytoestrogens, and other fungal, plant, and unspecific metabolites detected in whole-plant corn silage and total mixed rations of dairy cattle in Mexico.

Author Contributions

Conceptualization, F.P.-T., J.F. and J.-I.A.; methodology, F.P.-T., J.-I.A., J.-D.O., L.Z., S.-I.F.-Q., C.G.-P., M.S. and R.K.; formal analysis, F.P.-T.; investigation, F.P.-T., M.S. and R.K.; resources, J.F., J.-I.A. and Q.Z.; data curation, F.P.-T. and M.S; writing—original draft preparation, F.P.-T.; writing—review and editing, M.S., S.-I.F.-Q., C.G.-P., J.F., J.-I.A., E.C.-L., R.K., Q.Z., J.-D.O. and L.Z.; visualization, F.P.-T.; supervision, J.-I.A., J.F., F.P.-T. and Q.Z:; project administration, J.-I.A., J.-D.O., L.Z. and J.F.; funding acquisition, J.F., J.-I.A., C.G.-P. and Q.Z. All authors have read and agreed to the published version of the manuscript.

Funding

This research was financed by the resources of the BIOMIN Holding GmbH (part of DSM), the Universidad Nacional Autónoma de México, and the University of Veterinary Medicine Vienna. Part of the equipment used for sample processing at the Universidad Nacional Autónoma de México were acquired from the program Programa de Apoyo a Proyectos de Investigacion, FESC-CI2260.

Institutional Review Board Statement

Not applicable.

Informed Consent Statement

Not applicable.

Data Availability Statement

Data are available on request due to restrictions (data protection agreement).

Acknowledgments

We thank Ioana Vicente Colín for her assistance in the laboratory of UNAM. We also thank the farmers for making this research possible. Open Access Funding by the University of Veterinary Medicine Vienna.

Conflicts of Interest

J.-D.O., L.Z., J.-I.A. and J.F. are employed by BIOMIN Holding GmbH (part of DMS), which operates the BIOMIN Research Center and is a feed additives manufacturer. This, however, did not influence sampling, analyses, or data interpretation.

References

  1. FAO. Dairy Market Review: Emerging Trends and Outlook, December 2021. Rome. 2021. Available online: https://www.fao.org/3/cb7982en/cb7982en.pdf (accessed on 25 January 2023).
  2. Penagos-Tabares, F.; Khiaosa-ard, R.; Schmidt, M.; Bartl, E.-M.; Kehrer, J.; Nagl, V.; Faas, J.; Sulyok, M.; Krska, R.; Zebeli, Q. Cocktails of Mycotoxins, Phytoestrogens, and Other Secondary Metabolites in Diets of Dairy Cows in Austria: Inferences from Diet Composition and Geo-Climatic Factors. Toxins 2022, 14, 493. [Google Scholar] [CrossRef] [PubMed]
  3. FAO; IDF; IFCN. World Mapping of Animal Feeding Systems in the Dairy Sector; FAO: Rome, Italy; IDF: Brussels, Belgium; IFCN: Rome, Italy, 2014; pp. 1–36. [Google Scholar]
  4. Battilani, P.; Palumbo, R.; Giorni, P.; Dall’Asta, C.; Dellafiora, L.; Gkrillas, A.; Toscano, P.; Crisci, A.; Brera, C.; De Santis, B. Mycotoxin mixtures in food and feed: Holistic, innovative, flexible risk assessment modelling approach: MYCHIF. EFSA Support. Publ. 2020, 17, 1757E. [Google Scholar] [CrossRef]
  5. Penagos-Tabares, F.; Khiaosa-Ard, R.; Nagl, V.; Faas, J.; Jenkins, T.; Sulyok, M.; Zebeli, Q. Mycotoxins, Phytoestrogens, and Other Secondary Metabolites in Austrian Pastures: Occurrences, Contamination Levels, and Implications of Geo-climatic Factors. Toxins 2021, 13, 460. [Google Scholar] [CrossRef]
  6. Bryden, W.L. Mycotoxin contamination of the feed supply chain: Implications for animal productivity and feed security. Anim. Feed Sci. Technol. 2012, 173, 134–158. [Google Scholar] [CrossRef]
  7. Bryden, W.L. Mycotoxins in the food chain: Human health implications. Asia Pac. J. Clin. Nutr. 2007, 16, 95–101. [Google Scholar] [PubMed]
  8. Gallo, A.; Giuberti, G.; Frisvad, J.C.; Bertuzzi, T.; Nielsen, K.F. Review on Mycotoxin Issues in Ruminants: Occurrence in Forages, Effects of Mycotoxin Ingestion on Health Status and Animal Performance and Practical Strategies to Counteract Their Negative Effects. Toxins 2015, 7, 3057–3111. [Google Scholar] [CrossRef]
  9. Liu, M.; Zhao, L.; Gong, G.; Zhang, L.; Shi, L.; Dai, J.; Han, Y.; Wu, Y.; Khalil, M.M.; Sun, L. Invited review: Remediation strategies for mycotoxin control in feed. J. Anim. Sci. Biotechnol. 2022, 13, 19. [Google Scholar] [CrossRef]
  10. Cinar, A.; Onbaşı, E. Mycotoxins: The hidden danger in foods. In Mycotoxins and Food Safety; IntechOpen: London, UK, 2020. [Google Scholar]
  11. Reyes-Velázquez, W.P.; Espinoza, V.H.I.; Rojo, F.; Jiménez-Plasencia, C.; Palacios, E.d.L.; Hernández-Góbora, J.; Ramírez-Álvarez, A. Occurrence of fungi and mycotoxins in corn silage, Jalisco State, Mexico. Rev. Iberoam. Micol. 2008, 25, 182–185. [Google Scholar]
  12. Álvarez-Días, F.; Torres-Parga, B.; Valdivia-Flores, A.G.; Quezada-Tristán, T.; Alejos-De La Fuente, J.I.; Sosa-Ramírez, J.; Rangel-Muñoz, E.J. Aspergillus flavus and Total Aflatoxins Occurrence in Dairy Feed and Aflatoxin M1 in Bovine Milk in Aguascalientes, Mexico. Toxins 2022, 14, 292. [Google Scholar] [CrossRef]
  13. Ortiz, C.M.F.; Portilla, L.B.H.; Medrano, J.V. Contaminación con micotoxinas en alimento balanceado y granos de uso pecuario en México en el año 2003. Rev. Mex. Cienc. Pecu. 2006, 44, 247–256. [Google Scholar]
  14. Betancourt, P.; Denise, S. Microbiota and mycotoxins in trilinear hybrid maize produced in natural environments at central region in Mexico. Adv. Microbiol. 2016, 6, 671–676. [Google Scholar] [CrossRef]
  15. Betancourt, S.D.P.; Ronquillo, J.C.C.; Manzano, E.P. Contaminación de Fusariotoxinas: Zearalenona, Fumonisinas y Deoxinivalenol en maíz (Zea mays L.), procedente de Puebla y de la Ciudad de México. Soc. Rural. Producción Medio Ambiente. 2020, 20, 16. [Google Scholar]
  16. Gruber-Dorninger, C.; Jenkins, T.; Schatzmayr, G. Global mycotoxin occurrence in feed: A ten-year survey. Toxins 2019, 11, 375. [Google Scholar] [CrossRef] [PubMed]
  17. Zhao, L.; Zhang, L.; Xu, Z.; Liu, X.; Chen, L.; Dai, J.; Karrow, N.A.; Sun, L. Occurrence of Aflatoxin B1, Deoxynivalenol and Zearalenone in Feeds in China during 2018–2020. J. Anim. Sci. Biotechnol. 2021, 12, 74. [Google Scholar] [CrossRef] [PubMed]
  18. Commission, E. Directive 2002/32/EC of the European Parliament and of the Council of 7 May 2002 on undesirable substances in animal feed. Luxemb. Off. J. Eur. Union. 2002, 140, 10–22. [Google Scholar]
  19. Commission, E. Commission Recommendation of 17 August 2006 on the presence of deoxynivalenol, zearalenone, ochratoxin A, T-2 and HT-2 and fumonisins in products intended for animal feeding (2006/576/EC). Off J Eur Union. 2006, 229, 7–9. [Google Scholar]
  20. Schingoethe, D.J. A 100-Year Review: Total mixed ration feeding of dairy cows. J. Dairy Sci. 2017, 100, 10143–10150. [Google Scholar] [CrossRef]
  21. Bueno, A.V.I.; Lazzari, G.; Jobim, C.C.; Daniel, J.L.P. Ensiling total mixed ration for ruminants: A review. Agronomy 2020, 10, 879. [Google Scholar] [CrossRef]
  22. Awapak, D.; Petchkongkaew, A.; Sulyok, M.; Krska, R. Co-occurrence and toxicological relevance of secondary metabolites in dairy cow feed from Thailand. Food Addit. Contam. Part A Chem. Anal. Control Expo. Risk Assess. 2021, 38, 1013–1027. [Google Scholar] [CrossRef]
  23. Rodriguez-Blanco, M.; Marin, S.; Sanchis, V.; Ramos, A.J. Fusarium mycotoxins in total mixed rations for dairy cows. Mycotoxin Res. 2020, 36, 277–286. [Google Scholar] [CrossRef]
  24. Wilkinson, J.M.; Toivonen, M.I. World Silage: A Survey of Forage Conservation around the World; Chalcombe Publications: Lincoln, UK, 2003. [Google Scholar]
  25. Alonso, V.A.; Pereyra, C.M.; Keller, L.A.M.; Dalcero, A.M.; Rosa, C.A.R.; Chiacchiera, S.M.; Cavaglieri, L.R. Fungi and mycotoxins in silage: An overview. J. Appl. Mirobiol. 2013, 115, 637–643. [Google Scholar] [CrossRef]
  26. Signorini, M.L.; Gaggiotti, M.; Molineri, A.; Chiericatti, C.A.; de Basilico, M.L.Z.; Basilico, J.C.; Pisani, M. Exposure assessment of mycotoxins in cow’s milk in Argentina. Food Chem. Toxicol. 2012, 50, 250–257. [Google Scholar] [CrossRef] [PubMed]
  27. Driehuis, F.; Spanjer, M.C.; Scholten, J.M.; Te Giffel, M.C. Occurrence of mycotoxins in maize, grass and wheat silage for dairy cattle in the Netherlands. Food. Addit. Contam. Part B Surveill. 2008, 1, 41–50. [Google Scholar] [CrossRef] [PubMed]
  28. Santos, R.R.; Fink-Gremmels, J. Mycotoxin syndrome in dairy cattle: Characterisation and intervention results. World Mycotoxin J. 2014, 7, 357–366. [Google Scholar] [CrossRef]
  29. Botha, C.; Naude, T.; Moroe, M.; Rottinghaus, G. Gangrenous ergotism in cattle grazing fescue (Festuca elatior L.) in South Africa: Clinical communication. J. S. Afr. Vet. Assoc. 2004, 75, 45–48. [Google Scholar] [CrossRef] [PubMed]
  30. Supriya, C.; Reddy, P.S. Prenatal exposure to aflatoxin B1: Developmental, behavioral, and reproductive alterations in male rats. Sci. Nat. 2015, 102, 26. [Google Scholar] [CrossRef]
  31. Gao, X.; Xiao, Z.; Li, C.; Zhang, J.; Zhu, L.; Sun, L.; Zhang, N.; Khalil, M.M.; Rajput, S.A.; Qi, D. Prenatal exposure to zearalenone disrupts reproductive potential and development via hormone-related genes in male rats. Food Chem. Toxicol. 2018, 16, 11–19. [Google Scholar] [CrossRef]
  32. Tomaszewska, E.; Rudyk, H.; Wojtysiak, D.; Donaldson, J.; Muszyński, S.; Arciszewski, M.B.; Lisova, N.; Brezvyn, O.; Puzio, I.; Abramowicz, B.; et al. Basal Blood Morphology, Serum Biochemistry, and the Liver and Muscle Structure of Weaned Wistar Rats Prenatally Exposed to Fumonisins. Animals 2022, 12, 2353. [Google Scholar] [CrossRef]
  33. Kras, K.; Rudyk, H.; Muszyński, S.; Tomaszewska, E.; Dobrowolski, P.; Kushnir, V.; Muzyka, V.; Brezvyn, O.; Arciszewski, M.B.; Kotsyumbas, I. Morphology and Chemical Coding of Rat Duodenal Enteric Neurons following Prenatal Exposure to Fumonisins. Animals 2022, 12, 1055. [Google Scholar] [CrossRef]
  34. Smith, M.-C.; Madec, S.; Coton, E.; Hymery, N. Natural co-occurrence of mycotoxins in foods and feeds and their in vitro combined toxicological effects. Toxins 2016, 8, 94. [Google Scholar] [CrossRef]
  35. Wolawek-Potocka, I.; Bah, M.M.; Korzekwa, A.; Piskula, M.K.; Wiczkowski, W.; Depta, A.; Skarzynski, D.J. Soybean-derived phytoestrogens regulate prostaglandin secretion in endometrium during cattle estrous cycle and early pregnancy. Exp. Biol. Med. 2005, 230, 189–199. [Google Scholar] [CrossRef] [PubMed]
  36. Reed, K.F.M. Fertility of herbivores consuming phytoestrogen-containing Medicago and Trifolium species. Agriculture 2016, 6, 35. [Google Scholar] [CrossRef]
  37. Wocławek-Potocka, I.; Korzekwa, A.; Skarżyński, D. Can phytoestrogens pose a danger in the reproduction of cows? Med. Weter. 2008, 64, 515–519. [Google Scholar]
  38. Wocławek-Potocka, I.; Mannelli, C.; Boruszewska, D.; Kowalczyk-Zieba, I.; Waśniewski, T.; Skarżyński, D.J. Diverse effects of phytoestrogens on the reproductive performance: Cow as a model. Int. J. Endocrinol. 2013, 2013, 650984. [Google Scholar] [CrossRef]
  39. Penagos-Tabares, F.; Khiaosa-Ard, R.; Schmidt, M.; Pacífico, C.; Faas, J.; Jenkins, T.; Nagl, V.; Sulyok, M.; Labuda, R.; Zebeli, Q. Fungal species and mycotoxins in mouldy spots of grass and maize silages in Austria. Mycotoxin Res. 2022, 38, 117–136. [Google Scholar] [CrossRef]
  40. Penagos-Tabares, F.; Sulyok, M.; Nagl, V.; Faas, J.; Krska, R.; Khiaosa-ard, R.; Zebeli, Q. Mixtures of mycotoxins, phytoestrogens, and pesticides co-occurring in wet brewery’s spent grains (BSG) intended for dairy cattle feeding in Austria. Food Addit. Contam. Part A Chem. Anal. Control Expo. Risk Assess. 2022, 39, 1855–1877. [Google Scholar] [CrossRef]
  41. Kemboi, D.C.; Ochieng, P.E.; Antonissen, G.; Croubels, S.; Scippo, M.-L.; Okoth, S.; Kangethe, E.K.; Faas, J.; Doupovec, B.; Lindahl, J.F. Multi-Mycotoxin Occurrence in Dairy Cattle and Poultry Feeds and Feed Ingredients from Machakos Town, Kenya. Toxins 2020, 12, 762. [Google Scholar] [CrossRef]
  42. Nichea, M.J.; Cendoya, E.; Zachetti, V.G.L.; Chiacchiera, S.M.; Sulyok, M.; Krska, R.; Torres, A.M.; Chulze, S.N.; Ramirez, M.L. Mycotoxin profile of Fusarium armeniacum isolated from natural grasses intended for cattle feed. World Mycotoxin J. 2015, 8, 451–457. [Google Scholar] [CrossRef]
  43. Reisinger, N.; Schurer-Waldheim, S.; Mayer, E.; Debevere, S.; Antonissen, G.; Sulyok, M.; Nagl, V. Mycotoxin Occurrence in Maize Silage-A Neglected Risk for Bovine Gut Health? Toxins 2019, 11, 577. [Google Scholar] [CrossRef]
  44. De la Federación, D.O. Norma Oficial Mexicana NOM-188-SSA1–2002, Productos y Servicios: Control de Aflatoxinas en Cereales para Consumo Humano y Animal, Especificaciones Sanitarias. D. Of. Fed. 2002. Available online: https://www.dof.gob.mx/nota_detalle.php?codigo=719385&fecha=15/10/2002 (accessed on 25 January 2023).
  45. De la Federación, D.O. Norma Oficial Mexicana NOM-247-SSA1-2008, Productos y servicios. Cereales y sus Productos. Cereales, h.d.c., Sémolas o Semolinas. Alimentos a Base de: Cereales, Semillas Comestibles, de Harinas, Sémolas o Semolinas o sus Mezclas. Productos de Panificación. Disposiciones y Especificaciones Sanitarias y Nutrimentales. Métodos de Prueba. D. Of. Fed. 2008. Available online: https://dof.gob.mx/nota_detalle.php?codigo=5100356&fecha=27/07/2009#gsc.tab=0 (accessed on 25 January 2023).
  46. Molina-Pintor, I.; Ruíz-Arias, M.; Guerrero-Flores, M.; Rojas-García, A.; Barrón-Vivanco, B.S.; Medina-Díaz, I.M.; Bernal-Hernández, Y.; Ortega-Cervantes, L.; Rodríguez-Cervantes, C.; Ramos, A. Preliminary survey of the occurrence of mycotoxins in cereals and estimated exposure in a northwestern region of Mexico. Int. J. Environ. Health Res. 2022, 32, 2271–2285. [Google Scholar] [CrossRef]
  47. US Food and Drug Administration (US FDA). Guidance for Industry and FDA: Advisory Levels for Deoxynivalenol (DON) in Finished Wheat Products for Human Consumption and Grains and Grain by-Products Used for Animal Feed. Available online: https://www.fda.gov/regulatory-information/search-fda-guidance-documents/guidance-industry-and-fda-advisory-levels-deoxynivalenol-don-finished-wheat-products-human#:~:text=The%20advisory%20levels%20for%20DON%20are%20as%20follows%3A,germ%2C%20that%20may%20potentially%20be%20consumed%20by%20humans. (accessed on 25 January 2023).
  48. US Food and Drug Administration (US FDA). Guidance for Industry: Action Levels for Poisonous or Deleterious Substances in Human Food and Animal Feed. Available online: https://www.fda.gov/regulatory-information/search-fda-guidance-documents/guidance-industry-action-levels-poisonous-or-deleterious-substances-human-food-and-animal-feed#afla (accessed on 25 January 2023).
  49. García, S.; Heredia, N. Mycotoxins in Mexico: Epidemiology, management, and control strategies. Mycopathologia 2006, 162, 255–264. [Google Scholar] [CrossRef] [PubMed]
  50. Thapa, A.; Horgan, K.A.; White, B.; Walls, D. Deoxynivalenol and Zearalenone—Synergistic or Antagonistic Agri-Food Chain Co-Contaminants? Toxins 2021, 13, 561. [Google Scholar] [CrossRef] [PubMed]
  51. Szabó-Fodor, J.; Szabó, A.; Kócsó, D.; Marosi, K.; Bóta, B.; Kachlek, M.; Mézes, M.; Balogh, K.; Kövér, G.; Nagy, I. Interaction between the three frequently co-occurring Fusarium mycotoxins in rats. J. Anim. Physiol. Anim. Nutr. 2019, 103, 370–382. [Google Scholar] [CrossRef] [PubMed]
  52. Alassane-Kpembi, I.; Kolf-Clauw, M.; Gauthier, T.; Abrami, R.; Abiola, F.A.; Oswald, I.P.; Puel, O. New insights into mycotoxin mixtures: The toxicity of low doses of Type B trichothecenes on intestinal epithelial cells is synergistic. Toxicol. Appl. Pharmacol. 2013, 272, 191–198. [Google Scholar] [CrossRef]
  53. Alassane-Kpembi, I.; Puel, O.; Oswald, I.P. Toxicological interactions between the mycotoxins deoxynivalenol, nivalenol and their acetylated derivatives in intestinal epithelial cells. Arch. Toxicol. 2015, 89, 1337–1346. [Google Scholar] [CrossRef]
  54. Alassane-Kpembi, I.; Puel, O.; Pinton, P.; Cossalter, A.-M.; Chou, T.-C.; Oswald, I.P. Co-exposure to low doses of the food contaminants deoxynivalenol and nivalenol has a synergistic inflammatory effect on intestinal explants. Arch. Toxicol. 2017, 91, 2677–2687. [Google Scholar] [CrossRef]
  55. McKay, Z.C.; Averkieva, O.; Rajauria, G.; Pierce, K.M. The effect of feedborne Fusarium mycotoxins on dry matter intake, milk production and blood metabolites of early lactation dairy cows. Anim. Feed Sci. Technol. 2019, 253, 39–44. [Google Scholar] [CrossRef]
  56. Shimshoni, J.A.; Cuneah, O.; Sulyok, M.; Krska, R.; Galon, N.; Sharir, B.; Shlosberg, A. Mycotoxins in corn and wheat silage in Israel. Food Addit. Contam. Part A Chem. Anal. Control. Expo. Risk Assess. 2013, 30, 1614–1625. [Google Scholar] [CrossRef]
  57. Hernandez-Valdivia, E.; Valdivia-Flores, A.; Cruz-Vazquez, C.; Martinez-Saldaña, M.; Quezada-Tristan, T.; Rangel-Muñoz, E.; Ortiz-Martinez, R.; Medina-Esparza, L.; Jaramillo-Juarez, F. Diagnosis of Subclinical Aflatoxicosis by Biochemical Changes in Dairy Cows under Field Conditions. Pak. Vet. J. 2021, 41, 33–38. [Google Scholar] [CrossRef]
  58. Jiménez-Pérez, C.; Alatorre-Santamaría, S.; Tello-Solís, S.; Gómez-Ruiz, L.; Rodríguez-Serrano, G.; García-Garibay, M.; Cruz-Guerrero, A. Analysis of aflatoxin M1 contamination in milk and cheese produced in Mexico: A review. World Mycotoxin J. 2021, 14, 269–285. [Google Scholar] [CrossRef]
  59. Betancourt, S.D.P.; Carranza, B.V.; Manzano, E.P. Estimation of mycotoxin multiple contamination in Mexican hybrid seed maize by HPLC-MS/MS. Agric. Sci. 2015, 6, 1089. [Google Scholar] [CrossRef]
  60. Carvajal, M.; Bolaños, A.; Rojo, F.; Mendez, I. Aflatoxin M1 in pasteurized and ultrapasteurized milk with different fat content in Mexico. J. Food Prot. 2003, 66, 1885–1892. [Google Scholar] [CrossRef] [PubMed]
  61. Cary, J.W.; Ehrlich, K.C.; Bland, J.M.; Montalbano, B.G. The aflatoxin biosynthesis cluster gene, aflX, encodes an oxidoreductase involved in conversion of versicolorin A to demethylsterigmatocystin. Appl. Environ. Microbiol. 2006, 72, 1096–1101. [Google Scholar] [CrossRef] [PubMed]
  62. Hsieh, D.; Lin, M.; Yao, R. Conversion of sterigmatocystin to aflatoxin B1 by Aspergillus parasiticus. Biochem. Biophys. Res. Commun. 1973, 52, 992–997. [Google Scholar] [CrossRef]
  63. McCormick, S.P.; Bhatnagar, D.; Lee, L.S. Averufanin is an aflatoxin B1 precursor between averantin and averufin in the biosynthetic pathway. Appl. Environ. Microbiol. 1987, 53, 14–16. [Google Scholar] [CrossRef]
  64. Lin, M.; Hsieh, D. Averufin in the biosynthesis of aflatoxin B1. J. Am. Chem. Soc. 1973, 95, 1668–1669. [Google Scholar] [CrossRef]
  65. Muaz, K.; Manzoor, S.; Akhtar, S.; Riaz, M.; Amir, M.; Akram, K.; Ismail, A. Aflatoxin Biosynthesis. In Aflatoxins in Food: A Recent Perspective; Hakeem, K.R., Oliveira, C.A.F., Ismail, A., Eds.; Springer: Cham, Switzerland, 2022; pp. 19–40. [Google Scholar]
  66. EFSA. Scientific Opinion on the risk for public and animal health related to the presence of sterigmatocystin in food and feed. EFSA J. 2013, 11, 3254. [Google Scholar] [CrossRef]
  67. Gruber-Dorninger, C.; Novak, B.; Nagl, V.; Berthiller, F. Emerging mycotoxins: Beyond traditionally determined food contaminants. J. Agric. Food Chem. 2017, 65, 7052–7070. [Google Scholar] [CrossRef]
  68. Chuang, W.Y.; Hsieh, Y.C.; Lee, T.-T. The effects of fungal feed additives in animals: A review. Animals 2020, 10, 805. [Google Scholar] [CrossRef]
  69. EFSA Panel on Contaminants in the Food Chain. Scientific Opinion on the risks for animal and public health related to the presence of Alternaria toxins in feed and food. EFSA J. 2011, 9, 2407. [Google Scholar] [CrossRef]
  70. Storm, I.; Rasmussen, R.R.; Rasmussen, P.H. Occurrence of Pre- and Post-Harvest Mycotoxins and Other Secondary Metabolites in Danish Maize Silage. Toxins 2014, 6, 2256–2269. [Google Scholar] [CrossRef] [PubMed]
  71. Driehuis, F.; Spanjer, M.C.; Scholten, J.M.; Giffel, M.C.T. Occurrence of Mycotoxins in Feedstuffs of Dairy Cows and Estimation of Total Dietary Intakes. J. Dairy Sci. 2008, 91, 4261–4271. [Google Scholar] [CrossRef] [PubMed]
  72. Parrish, F.; Wiley, B.; Simmons, E.; Long Jr, L. Production of aflatoxins and kojic acid by species of Aspergillus and Penicillium. Appl. Microbiol. 1966, 14, 139. [Google Scholar] [CrossRef] [PubMed]
  73. Morton, H.E.; Kocholaty, W.; Junowicz-Kocholaty, R.; Kelner, A. Toxicity and antibiotic activity of kojic acid produced by Aspergillus luteo-virescens. J. Bacteriol. 1945, 50, 579–584. [Google Scholar] [CrossRef]
  74. Kotani, T.; Ichimoto, I.; Tatsumi, C.; Fujita, T. Bacteriostatic activities and metal chelation of kojic acid analogs. Agric. Biol. Chem. 1976, 40, 765–770. [Google Scholar]
  75. Bashir, F.; Sultana, K.; Khalid, M.; Rabia, H. Kojic Acid: A Comprehensive Review. Asian J. Allied Health Sci. 2021, 6, 13–21. [Google Scholar] [CrossRef]
  76. Geisen, R.; Schmidt-Heydt, M.; Touhami, N.; Himmelsbach, A. New aspects of ochratoxin A and citrinin biosynthesis in Penicillium. Curr. Opin. Food Sci. 2018, 23, 23–31. [Google Scholar] [CrossRef]
  77. Timonin, M.; Rouatt, J. Production of citrinin by Aspergillus sp. of the Candidus group. Can. J. Public Health 1944, 35, 80–88. [Google Scholar]
  78. Hayakawa, S.; Minato, H.; Katagiri, K. The ilicicolins, antibiotics from Cylindrocladium ilicicola. J. Antibiot. 1971, 24, 653–654. [Google Scholar] [CrossRef]
  79. Jouda, J.-B.; Tamokou, J.-d.-D.; Mbazoa, C.D.; Douala-Meli, C.; Sarkar, P.; Bag, P.K.; Wandji, J. Antibacterial and cytotoxic cytochalasins from the endophytic fungus Phomopsis sp. harbored in Garcinia kola (Heckel) nut. BMC Complement. Altern. Med. 2016, 16, 462. [Google Scholar] [CrossRef]
  80. Aldridge, D.; Armstrong, J.; Speake, R.; Turner, W. The cytochalasins, a new class of biologically active mould metabolites. Chem. Commun. 1967, 1, 26–27. [Google Scholar] [CrossRef]
  81. Lynch, F.; Geoghegan, M. Antibiotic activity of a fungal perylene-quinone and some of its derivatives. Trans. Br. Mycol. Soc. 1979, 72, 31–37. [Google Scholar] [CrossRef]
  82. Singh, K.; Kumari, A. Mycotoxins Co-occurrence Poisoning. In Mycotoxins and Mycotoxicoses; Springer: Singapore, 2022; pp. 129–136. [Google Scholar]
  83. Coop, I.E. Depression of lambing performance from mating on lucerne. Proc. N. Z. Soc. Anim. Prod. 1977, 37, 149–151. [Google Scholar]
  84. Mostrom, M.; Evans, T.J. Phytoestrogens. In Veterinary Toxicology: Basic and Clinical Principles, 3rd ed.; Gupta, R.C., Ed.; Elsevier: Amsterdam, The Netherlands, 2018; pp. 817–833. [Google Scholar]
  85. Mostrom, M.; Evans, T.J. Phytoestrogens. In Reproductive and Developmental Toxicology; Gupta, R.C., Ed.; Academic Press—Medical: Amsterdam, The Netherlands, 2011; pp. 707–722. [Google Scholar]
  86. Grgic, D.; Varga, E.; Novak, B.; Müller, A.; Marko, D. Isoflavones in Animals: Metabolism and Effects in Livestock and Occurrence in Feed. Toxins 2021, 13, 836. [Google Scholar] [CrossRef] [PubMed]
  87. Vejdovszky, K.; Schmidt, V.; Warth, B.; Marko, D. Combinatory estrogenic effects between the isoflavone genistein and the mycotoxins zearalenone and alternariol in vitro. Mol. Nutr. Food Res. 2017, 61, 1600526. [Google Scholar] [CrossRef]
  88. Hessenberger, S.; Botzi, K.; Degrassi, C.; Kovalsky, P.; Schwab, C.; Schatzmayr, D.; Schatzmayr, G.; Fink-Gremmels, J. Interactions between plant-derived oestrogenic substances and the mycoestrogen zearalenone in a bioassay with MCF-7 cells. Pol. J. Vet. Sci. 2017, 20, 513–520. [Google Scholar] [CrossRef] [PubMed]
  89. Chen, K.; Li, G.J.; Bressan, R.A.; Song, C.P.; Zhu, J.K.; Zhao, Y. Abscisic acid dynamics, signaling, and functions in plants. J. Integr. Plant Biol. 2020, 62, 25–54. [Google Scholar] [CrossRef] [PubMed]
  90. Sahu, P.K.; Pradhan, S.P.; Kumar, P.S. Isolation, elucidation, and structure–activity relationships of phytoalkaloids from Solanaceae. Stud. Nat. Prod. Chem. 2022, 72, 371–389. [Google Scholar]
  91. Kohnen-Johannsen, K.L.; Kayser, O. Tropane Alkaloids: Chemistry, pharmacology, biosynthesis and production. Molecules 2019, 24, 796. [Google Scholar] [CrossRef]
  92. Romera-Torres, A.; Romero-González, R.; Vidal, J.L.M.; Frenich, A.G. Study of the occurrence of tropane alkaloids in animal feed using LC-HRMS. Anal. Methods 2018, 10, 3340–3346. [Google Scholar] [CrossRef]
  93. EFSA Panel on Contaminants in the Food Chain. Scientific Opinion on Tropane Alkaloids in food and feed. EFSA J. 2013, 11, 1–113. [Google Scholar]
  94. Ruan, Z.; Wang, X.; Liu, Y.; Liao, W. Corn. In Integrated Processing Technologies for Food and Agricultural By-Products; Pan, Z., Zhang, R., Zicari, S., Eds.; Academic Press: Cambridge, MA, USA, 2019; pp. 59–72. [Google Scholar]
  95. Karls, C.; Schaefer, M.; Schaefer, D. PSXI-8 Corn stover feedlot diets with elevated mycotoxins and binder effect on cattle performance. J. Anim. Sci. 2020, 98, 394. [Google Scholar] [CrossRef]
  96. Reyes-Velázquez, W.P.; Anguiano-Sevilla, C.N.; Anguiano-Estrella, R.; Rojo, F.G. Association of acute equine leukoencephalomalacia (ELEM) with fumonisins concentrations in corn stover in an outbreak in the state of Jalisco, Mexico. Austral J. Vet. Sci. 2018, 50, 111–113. [Google Scholar] [CrossRef]
  97. Coufal-Majewski, S.; Stanford, K.; McAllister, T.; Blakley, B.; McKinnon, J.; Chaves, A.V.; Wang, Y. Impacts of cereal ergot in food animal production. Front. Vet. Sci. 2016, 3, 15. [Google Scholar] [CrossRef] [PubMed]
  98. Huerta-Treviño, A.; Dávila-Aviña, J.E.; Sánchez, E.; Heredia, N.; García, S. Occurrence of mycotoxins in alfalfa (Medicago sativa L.), sorghum [Sorghum bicolor (L.) Moench], and grass (Cenchrus ciliaris L.) retailed in the state of Nuevo León, México. Agrociencia 2016, 50, 825–836. [Google Scholar]
  99. Del Palacio, A.; Mionetto, A.; Bettucci, L.; Pan, D. Evolution of fungal population and mycotoxins in sorghum silage. Food Addit. Contam. Part A Chem. Anal. Control Expo. Risk Assess. 2016, 33, 1864–1872. [Google Scholar] [CrossRef]
  100. da Silva, J.B.; Pozzi, C.R.; Mallozzi, M.A.; Ortega, E.M.; Corrêa, B. Mycoflora and occurrence of aflatoxin B1 and fumonisin B1 during storage of Brazilian sorghum. J. Agric. Food Chem. 2000, 48, 4352–4356. [Google Scholar] [CrossRef]
  101. McElhinney, C.; Danaher, M.; Grant, J.; Elliott, C.T.; Okiely, P. Variation associated with sampling bale or pit silage for mycotoxins and conventional chemical characteristics. World Mycotoxin J. 2016, 9, 331–342. [Google Scholar] [CrossRef]
  102. Steiner, D.; Sulyok, M.; Malachová, A.; Mueller, A.; Krska, R. Realizing the simultaneous liquid chromatography-tandem mass spectrometry based quantification of >1200 biotoxins, pesticides and veterinary drugs in complex feed. J. Chormatogr. A. 2020, 1629, 461502. [Google Scholar] [CrossRef]
  103. Hinkle, D.E.; Wiersma, W.; Jurs, S.G. Correlation. In Applied Statistics for the Behavioral Sciences; Houghton Mifflin College Division: Boston, MA, USA, 2003; pp. 485–528. [Google Scholar]
Figure 1. Occurrence and distribution of concentrations (µg/kg on DM basis, log 10 scale) of groups of secondary metabolites detected in whole-plant corn silages (in yellow) and total mixed rations (in gray) on dairy farms in Mexico. The total number of secondary metabolites detected per group is shown in parentheses. Asterisks (*) show significant differences (p-value < 0.05) between the concentrations of the respective groups in whole-plant corn silages and total mixed rations according to the Wilcoxon matched-pairs signed rank test (p-values in Table 2). Means are shown as “+”.
Toxins 15 00153 g001
Figure 2. Scatter plots illustrate the grade of co-contamination (number of metabolites/sample) by group, whole-plant corn silages (in yellow) or total mixed rations (in gray) from Mexico. Asterisks (*) confirm significant differences (p-value < 0.05) between the number of metabolites per sample in the respective group, whole-plant corn silages or total mixed rations, according to the Wilcoxon matched-pairs signed rank test (p-values in Table S1).
Toxins 15 00153 g002
Figure 3. Heatmap of the most frequent combinations of mycotoxins/metabolites detected in whole-plant corn silages from Central and Northern Mexico dairy farms. Values correspond to percentage of samples containing both mycotoxins/metabolites. Mycotoxins/metabolites included in this analysis occurred in ≥25% of the samples.
Toxins 15 00153 g003
Figure 4. Heatmap of the most frequent combinations of mycotoxins/metabolites detected in total mixed rations from Central and Northern Mexico dairy farms. Values correspond to percentage of samples containing both mycotoxins/metabolites. Mycotoxins/metabolites included in this analysis occurred in ≥25% of the samples.
Toxins 15 00153 g004
Figure 5. Heatmap of the combinations of detected plant metabolites (including phytoestrogens) and mycoestrogens in total mixed rations from Central and Northern Mexico dairy farms. Values correspond to percentage of samples containing both metabolites.
Toxins 15 00153 g005
Figure 6. Spearman’s correlation coefficients (ρ) among groups of metabolites detected in total mixed rations with the main ingredients. The asterisks (*) indicate significant correlation coefficients (p-value < 0.05). All the p-values are available in Table S2.
Toxins 15 00153 g006
Figure 7. Map of Mexico showing the locations of the participating farms.
Toxins 15 00153 g007
Table 1. Frequencies of inclusion (%) and dietary content (percentage of the diet on a DM basis) of the main ingredients incorporated in total mixed rations of investigated Mexican dairy farms.
Dietary IngredientFrequency of Inclusion
(n = 19) (%)
Dietary Content (% of DM Basis)
Average ± SDMedianRange
Whole-plant corn silage10038.9 ± 6.6240.027.5–53.0
Alfalfa hay 799.1 ± 4.369.03.5–16.5
High-energy density concentrate 7445.5 ± 8.8548.528.3–60.0
Protein-rich concentrate 2622.6 ± 3.5825.017.0–25.0
Corn stover213.5 ± 2.582.91.0–7.0
Rolled corn2125.5 ± 6.2627.916.3–30.0
Corn meal 1624.2 ± 9.8023.015.0–34.5
Oat hay 163.3 ± 0.763.52.5–4.0
Sorghum silage 1113.0 ± 2.8313.011.0–15.0
Corn bran 1113.8 ± 0.3513.813.5–14.0
Alfalfa silage 55.0
Bakery byproduct57.0
Brewery spent grain 59.5
Forage 10049.9 ± 4.4250.040.0–60.0
Concentrate 10050.1 ± 4.4250.040.0–60.0
SD = Standard deviation; DM = Dry matter.
Table 2. Concentrations of metabolites detected in whole-plant corn silages and total mixed rations of Mexican dairy farms.
Concentration
(µg/kg DM) 1
Group of Metabolites
Ergot AlkaloidsAlternariaAspergillusFusariumPenicilliumOther Fungal SpeciesMycotoxinsTotal Fungal MetabolitesUnspecific MetabolitesPhytoestrogensPlant Metabolites
Whole-plant corn
silages
(n = 19)
Average2.2456.415487002431648710930020,32017402450
±SD2.0960.4292641016324763406620495032903820
Median1.539.153.8646019384.86330767019,920638726
Minimum0.19.102.539.628.71279.5219986090.590.5
Maximum5.6242104022,110520109021,96022,80027,79012,35013,190
Total mixed
rations
(n = 19)
Average3.9848.761.755501711695590600010,240224,260225,960
±SD5.8833.846.5316089.1167300032603200129,040129,040
Median1.444.558.45840161.1125.45970619010,300209,740211,540
Minimum0.45.611.711223.26.1139161354034,27035,910
Maximum12.710817910,51033769710,57011,07015,980448,670449,400
Wilcoxon matched-pairs testp-value *0.6250.4180.70860.00050.01080.9840.00060.0004<0.0001<0.0001<0.0001
1 Values based on the sum of the concentrations of the metabolites of each respective group (see Table 3). * Significant differences between each set of matched pairs presented p-value < 0.05. SD = Standard deviation; DM = Dry matter.
Disclaimer/Publisher’s Note: The statements, opinions and data contained in all publications are solely those of the individual author(s) and contributor(s) and not of MDPI and/or the editor(s). MDPI and/or the editor(s) disclaim responsibility for any injury to people or property resulting from any ideas, methods, instructions or products referred to in the content.

