
The Effect of Sn-2 Palmitate on Blood Glucose, Lipids and Body Composition in Middle-Aged and Elderly Adults: A Randomized, Double-Blinded Controlled Trial

 , , , , ,
Abstract
:1. Introduction
2. Materials and Methods
2.1. Participants
2.2. Intervention
2.3. Screening and Eligibility
2.4. Randomization and Blinding
2.5. Anthropometric Assessment
2.6. Blood Serum Assessment
2.7. Medical History and Lifestyle Behavior
2.8. Diet Assessment
2.9. Statistics
3. Results
4. Discussion
5. Conclusions
Supplementary Materials
Author Contributions
Funding
Institutional Review Board Statement
Informed Consent Statement
Data Availability Statement
Acknowledgments
Conflicts of Interest
References
- Wei, W.; Jin, Q.; Wang, X. Human milk fat substitutes: Past achievements and current trends. Prog. Lipid Res. 2019, 74, 69–86. [Google Scholar] [CrossRef]
- Zhang, Z.; Wang, Y.; Li, Y.; Lin, X.; Hong, Z.; Huang, J.; Zhang, X.; Yang, Y.; Su, Y. Effects of Sn-2-palmitate-enriched formula feeding on infants’ growth, stool characteristics, stool fatty acid soap contents and bone mineral content: A systematic review and meta-analysis of randomized controlled trials. Crit. Rev. Food Sci. Nutr. 2022, 63, 1–11. [Google Scholar] [CrossRef]
- Martinov, O.; Lugonja, U.O.C.; Snezana, S.; Gojgic-Cvijovic, G.; Vrvic, M. Investigation of differences in intestinal microbial composition between breast-fed and infant prebiotic formula-fed infants. New Biotechnol. 2009, 25, S373. [Google Scholar] [CrossRef]
- Zhu, L.; Fang, S.; Zhang, H.; Sun, X.; Yang, P.; Wan, J.; Zhang, Y.; Lu, W.; Yu, L. Total Sn-2 Palmitic Triacylglycerols and the Ratio of OPL to OPO in Human Milk Fat Substitute Modulated Bile Acid Metabolism and Intestinal Microbiota Composition in Rats. Nutrients 2023, 15, 4929. [Google Scholar] [CrossRef] [PubMed]
- Aibar-Almazan, A.; Voltes-Martinez, A.; Castellote-Caballero, Y.; Afanador-Restrepo, D.F.; Carcelen-Fraile, M.D.C.; Lopez-Ruiz, E. Current Status of the Diagnosis and Management of Osteoporosis. Int. J. Mol. Sci. 2022, 23, 9465. [Google Scholar] [CrossRef]
- Salari, N.; Ghasemianrad, M.; Ammari-Allahyari, M.; Rasoulpoor, S.; Shohaimi, S.; Mohammadi, M. Global prevalence of constipation in older adults: A systematic review and meta-analysis. Wien. Klin. Wochenschr. 2023, 135, 389–398. [Google Scholar] [CrossRef]
- Sin Teh, S.; Ong, A.S.H.; Choo, Y.M.; Mah, S.H. sn-2 Hypothesis: A Review of the Effects of Palm Oil on Blood Lipid Levels. J. Oleo Sci. 2018, 67, 697–706. [Google Scholar] [CrossRef] [PubMed]
- Zock, P.L.; de Vries, J.H.; de Fouw, N.J.; Katan, M.B. Positional distribution of fatty acids in dietary triglycerides: Effects on fasting blood lipoprotein concentrations in humans. Am. J. Clin. Nutr. 1995, 61, 48–55. [Google Scholar] [CrossRef] [PubMed]
- Sanders, T.A.; Filippou, A.; Berry, S.E.; Baumgartner, S.; Mensink, R.P. Palmitic acid in the sn-2 position of triacylglycerols acutely influences postprandial lipid metabolism. Am. J. Clin. Nutr. 2011, 94, 1433–1441. [Google Scholar] [CrossRef]
- Filippou, A.; Teng, K.T.; Berry, S.E.; Sanders, T.A. Palmitic acid in the sn-2 position of dietary triacylglycerols does not affect insulin secretion or glucose homeostasis in healthy men and women. Eur. J. Clin. Nutr. 2014, 68, 1036–1041. [Google Scholar] [CrossRef]
- Filippou, A.; Berry, S.E.; Baumgartner, S.; Mensink, R.P.; Sanders, T.A. Palmitic acid in the sn-2 position decreases glucose-dependent insulinotropic polypeptide secretion in healthy adults. Eur. J. Clin. Nutr. 2014, 68, 549–554. [Google Scholar] [CrossRef] [PubMed]
- Tao, L.C.; Xu, J.N.; Wang, T.T.; Hua, F.; Li, J.J. Triglyceride-glucose index as a marker in cardiovascular diseases: Landscape and limitations. Cardiovasc. Diabetol. 2022, 21, 68. [Google Scholar] [CrossRef]
- Quispe, R.; Martin, S.S.; Michos, E.D.; Lamba, I.; Blumenthal, R.S.; Saeed, A.; Lima, J.; Puri, R.; Nomura, S.; Tsai, M.; et al. Remnant cholesterol predicts cardiovascular disease beyond LDL and ApoB: A primary prevention study. Eur. Heart J. 2021, 42, 4324–4332. [Google Scholar] [CrossRef]
- Wen, J.; Huang, Y.; Lu, Y.; Yuan, H. Associations of non-high-density lipoprotein cholesterol, triglycerides and the total cholesterol/HDL-c ratio with arterial stiffness independent of low-density lipoprotein cholesterol in a Chinese population. Hypertens. Res. 2019, 42, 1223–1230. [Google Scholar] [CrossRef]
- Popiolek-Kalisz, J.; Szczygiel, K. Bioelectrical Impedance Analysis and Body Composition in Cardiovascular Diseases. Curr. Probl. Cardiol. 2023, 48, 101911. [Google Scholar] [CrossRef]
- Salmon-Gomez, L.; Catalan, V.; Fruhbeck, G.; Gomez-Ambrosi, J. Relevance of body composition in phenotyping the obesities. Rev. Endocr. Metab. Disord. 2023, 24, 809–823. [Google Scholar] [CrossRef]
- Chen, L.K.; Woo, J.; Assantachai, P.; Auyeung, T.W.; Chou, M.Y.; Iijima, K.; Jang, H.C.; Kang, L.; Kim, M.; Kim, S.; et al. Asian Working Group for Sarcopenia: 2019 Consensus Update on Sarcopenia Diagnosis and Treatment. J. Am. Med. Dir. Assoc. 2020, 21, 300–307. [Google Scholar] [CrossRef] [PubMed]
- Wang, R.T.; Gerstein, H.C.; Van Spall, H.G.C.; Lip, G.Y.H.; Olier, I.; Ortega-Martorell, S.; Thabane, L.; Ye, Z.B.; Li, G.W. Relationship between remnant cholesterol and risk of heart failure in participants with diabetes mellitus. Eur. Heart J.-Qual. Care Clin. Outcomes 2023, 9, 537–545. [Google Scholar] [CrossRef] [PubMed]
- Fan, M.; Lyu, J.; He, P. Chinese guidelines for data processing and analysis concerning the International Physical Activity Questionnaire. Zhonghua Liuxingbingxue Zazhi 2014, 35, 961–964. [Google Scholar]
- Yang, Y.; Wang, G.; Pan, X. China Food Composition; Peking University Medical Press: Beijing, China, 2009; Volume 42, pp. 795–799. [Google Scholar]
- Ren, Z.; Zhao, A.; Wang, Y.; Meng, L.; Szeto, I.M.-Y.; Li, T.; Gong, H.; Tian, Z.; Zhang, Y.; Wang, P. Association between Dietary Inflammatory Index, C-Reactive Protein and Metabolic Syndrome: A Cross-Sectional Study. Nutrients 2018, 10, 831. [Google Scholar] [CrossRef]
- Yiannakou, Y.; Tack, J.; Piessevaux, H.; Dubois, D.; Quigley, E.M.M.; Ke, M.Y.; Da Silva, S.; Joseph, A.; Kerstens, R. The PAC-SYM questionnaire for chronic constipation: Defining the minimal important difference. Aliment. Pharmacol. Ther. 2017, 46, 1103–1111. [Google Scholar] [CrossRef]
- Mo, S.Y.; Lai, O.M.; Chew, B.H.; Ismail, R.; Bakar, S.A.; Jabbar, N.A.; Teng, K.T. Interesterified palm olein lowers postprandial glucose-dependent insulinotropic polypeptide response in type 2 diabetes. Eur. J. Nutr. 2019, 58, 1873–1885. [Google Scholar] [CrossRef] [PubMed]
- Forsythe, C.E.; French, M.A.; Goh, Y.K.; Clandinin, M.T. Cholesterolaemic influence of palmitic acid in the sn-1, 3 v. the sn-2 position with high or low dietary linoleic acid in healthy young men. Br. J. Nutr. 2007, 98, 337–344. [Google Scholar] [CrossRef] [PubMed]
- Torosyan, N.; Visrodia, P.; Torbati, T.; Minissian, M.B.; Shufelt, C.L. Dyslipidemia in midlife women: Approach and considerations during the menopausal transition. Maturitas 2022, 166, 14–20. [Google Scholar] [CrossRef] [PubMed]
- Shen, L.; Huang, W.; Xu, X.; Wang, L.; Wang, Q.; Li, S.; Yuan, X. Stool Saponified Fatty Acid, Behavior, Growth, and Stool Characteristics in Infants Fed a High-OPO Formula: A Randomized, Double-Blind Clinical Trial. Front. Pediatr. 2021, 9, 712201. [Google Scholar] [CrossRef]
- Carnielli, V.P.; Luijendijk, I.H.; Van Goudoever, J.B.; Sulkers, E.J.; Boerlage, A.A.; Degenhart, H.J.; Sauer, P.J. Structural position and amount of palmitic acid in infant formulas: Effects on fat, fatty acid, and mineral balance. J. Pediatr. Gastroenterol. Nutr. 1996, 23, 553–560. [Google Scholar] [CrossRef]
- O’Keeffe, M.; Kelly, M.; O’Herlihy, E.; O’Toole, P.W.; Kearney, P.M.; Timmons, S.; O’Shea, E.; Stanton, C.; Hickson, M.; Rolland, Y.; et al. Potentially modifiable determinants of malnutrition in older adults: A systematic review. Clin. Nutr. 2019, 38, 2477–2498. [Google Scholar] [CrossRef]
- Liu, C.R.; Wong, P.Y.; Chung, Y.L.; Chow, S.K.H.; Cheung, W.H.; Law, S.W.; Chan, J.C.N.; Wong, R.M.Y. Deciphering the "obesity paradox" in the elderly: A systematic review and meta-analysis of sarcopenic obesity. Obes. Rev. 2023, 24, e13534. [Google Scholar] [CrossRef]
- Chooi, Y.C.; Ding, C.; Magkos, F. The epidemiology of obesity. Metabolism 2019, 92, 6–10. [Google Scholar] [CrossRef]
- Kuo, Y.Y.; Chang, H.Y.; Huang, Y.C.; Liu, C.W. Effect of Whey Protein Supplementation in Postmenopausal Women: A Systematic Review and Meta-Analysis. Nutrients 2022, 14, 4210. [Google Scholar] [CrossRef]
- Guo, D.; Li, F.; Zhao, J.; Zhang, H.; Liu, B.; Pan, J.; Zhang, W.; Chen, W.; Xu, Y.; Jiang, S.; et al. Effect of an infant formula containing sn-2 palmitate on fecal microbiota and metabolome profiles of healthy term infants: A randomized, double-blind, parallel, controlled study. Food Funct. 2022, 13, 2003–2018. [Google Scholar] [CrossRef] [PubMed]
- Wu, W.; Zhao, A.; Liu, B.; Ye, W.H.; Su, H.W.; Li, J.; Zhang, Y.M. Neurodevelopmental Outcomes and Gut Bifidobacteria in Term Infants Fed an Infant Formula Containing High sn-2 Palmitate: A Cluster Randomized Clinical Trial. Nutrients 2021, 13, 693. [Google Scholar] [CrossRef]
- Civardi, E.; Garofoli, F.; Longo, S.; Mongini, M.E.; Grenci, B.; Mazzucchelli, I.; Angelini, M.; Castellazzi, A.; Fasano, F.; Grinzato, A.; et al. Safety, growth, and support to healthy gut microbiota by an infant formula enriched with functional compounds. Clin. Nutr. 2017, 36, 238–245. [Google Scholar] [CrossRef] [PubMed]
- Wang, S.; Zheng, C.; Guo, D.; Chen, W.; Xie, Q.; Zhai, Q. Dose-related effects of sn-2 palmitate, a specific positional distributed human milk fatty acid, intake in early life on the composition and metabolism of the intestinal microbiota. J. Dairy Sci. 2023, 106, 8272–8286. [Google Scholar] [CrossRef] [PubMed]
- Liu, C.; Cheung, W.H.; Li, J.; Chow, S.K.; Yu, J.; Wong, S.H.; Ip, M.; Sung, J.J.Y.; Wong, R.M.Y. Understanding the gut microbiota and sarcopenia: A systematic review. J. Cachexia Sarcopenia Muscle 2021, 12, 1393–1407. [Google Scholar] [CrossRef] [PubMed]


| Fatty Acids | OPO-Enriched Oil | Control Oil |
|---|---|---|
| C8:0 | 0 | 0 |
| C10:0 | 0 | 0 |
| C12:0 | 0.1 | 0.2 |
| C14:0 | 0.6 | 0.8 |
| C16:0 1 | 28.2 | 28.1 |
| C18:0 | 2.9 | 3.8 |
| C18:1 | 58.8 | 55.0 |
| C18:2 | 7.7 | 10.0 |
| Others | 1.7 | 2.1 |
| Characteristics | OPO-Enriched Oil | Control | p Value |
|---|---|---|---|
| Age, years | 64.49 ± 6.69 | 64.04 ± 7.29 | 0.734 |
| Gender, n (%) | 0.869 | ||
| Male | 14 (25.93) | 14 (24.56) | |
| Female | 40 (74.07) | 43 (75.44) | |
| Ethnic group, n (%) | 0.956 | ||
| Han | 52 (96.30) | 55 (96.49) | |
| Minorities | 2 (3.70) | 2 (3.51) | |
| Working status, n (%) | 0.902 | ||
| Working or housewife | 9 (16.67) | 10 (17.54) | |
| Retired | 45 (83.33) | 47 (82.46) | |
| Educational level, n (%) | 0.662 | ||
| Basic education | 12 (22.22) | 9 (15.79) | |
| Secondary education | 12 (22.22) | 15 (26.32) | |
| High education | 30 (55.56) | 33 (57.89) | |
| Monthly income per capita 2, n (%) | 0.827 | ||
| 0~4999 | 11 (20.37) | 11 (19.30) | |
| 5000~9999 | 30 (55.56) | 34 (59.65) | |
| ≥10,000 | 13 (24.07) | 11 (19.30) | |
| Smoking status, n (%) | 0.300 | ||
| Non-Smoker | 49 (90.74) | 48 (84.21) | |
| Smoker | 5 (9.26) | 9 (15.79) | |
| Second-hand smoke exposure 2 | |||
| <1 day per week | 46 (88.46) | 48 (87.27) | 0.851 |
| 2–7 days per week | 6 (11.54) | 7 (12.73) | |
| Menopause in women, n (%) | 0.449 | ||
| Postmenopausal | 38 (95.00) | 39 (90.70) | |
| Not postmenopausal | 2 (5.00) | 4 (9.30) | |
| Physical activity | 0.584 | ||
| Lower | 5 (9.26) | 9 (15.79) | |
| Medium | 38 (70.37) | 37 (64.91) | |
| Higher | 11 (20.37) | 11 (19.30) | |
| Weight, kg | 64.94 ± 9.69 | 66.86 ± 10.97 | 0.352 |
| Body mass index, kg/m2 | 24.70 ± 2.91 | 25.26 ± 3.64 | 0.359 |
| Systolic blood pressure, mmHg | 125.90 ± 17.94 | 125.28 ± 18.28 | 0.858 |
| Diastolic blood pressure, mmHg | 79.02 ± 9.95 | 77.09 ± 9.08 | 0.291 |
| Hypertension, n (%) | 15 (27.78) | 14 (24.56) | 0.700 |
| Diabetes, n (%) | 2 (3.70) | 7 (12.28) | 0.098 |
| Dyslipidemia, n (%) | 15 (27.78) | 19 (33.33) | 0.526 |
| Energy or Nutrients | OPO-Enriched Oil | Control | p Value |
|---|---|---|---|
| Energy and macronutrients | |||
| Kilocalories | 1731.0 ± 522.9 | 1664.8 ± 440.3 | 0.434 |
| Protein, g | 64.3 ± 26.4 | 64.2 ± 21.3 | 0.876 |
| Fat, g | 69.2 ± 25.0 | 70.3 ± 19.9 | 0.946 |
| Carbohydrate, g | 219.3 ± 66.1 | 198.7 ± 71.9 | 0.042 |
| Micronutrients | |||
| Fiber, g | 13.1 ± 6.1 | 12.2 ± 6.2 | 0.310 |
| Cholesterol, mg | 409.1 ± 208.6 | 422.0 ± 170.4 | 0.267 |
| Vitamin A, µgRE | 619.2 ± 322.7 | 581.2 ± 372.0 | 0.224 |
| Thiamin, mg | 0.9 ± 0.9 | 0.8 ± 0.3 | 0.972 |
| Riboflavin, mg | 1.0 ± 0.4 | 0.9 ± 0.4 | 0.513 |
| Niacin, mg | 10.7 ± 6.1 | 10.8 ± 6.8 | 0.600 |
| Vitamin C, mg | 80.0 ± 36.4 | 76.7 ± 37.2 | 0.600 |
| Vitamin E, mg | 19.1 ± 35.9 | 16.5 ± 14.1 | 0.841 |
| Ca, mg | 576.4 ± 255.4 | 537.8 ± 385.5 | 0.095 |
| P, mg | 956.5 ± 402.2 | 904.8 ± 356.8 | 0.440 |
| K, mg | 1894.3 ± 737.6 | 1721.7 ± 663.0 | 0.278 |
| Na, mg | 692.6 ± 421.1 | 655.6 ± 421.5 | 0.520 |
| Mg, mg | 281.3 ± 155.3 | 264.9 ± 118.3 | 0.697 |
| Fe, mg | 15.6 ± 5.9 | 16.2 ± 7.7 | 0.948 |
| Zn, mg | 8.4 ± 3.7 | 8.2 ± 3.8 | 0.732 |
| Se, µg | 40.6 ± 18.5 | 39.9 ± 16.1 | 0.944 |
| Cu, mg | 1.5 ± 0.7 | 1.5 ± 1.0 | 0.339 |
| Mn, mg | 3.9 ± 1.6 | 3.6 ± 1.8 | 0.262 |
| Indicators | OPO Group | Control Group | p Value | ||||||
|---|---|---|---|---|---|---|---|---|---|
| Baseline | Week 12 | Week 24 | Baseline | Week 12 | Week 24 | Group | Time | Group × Time | |
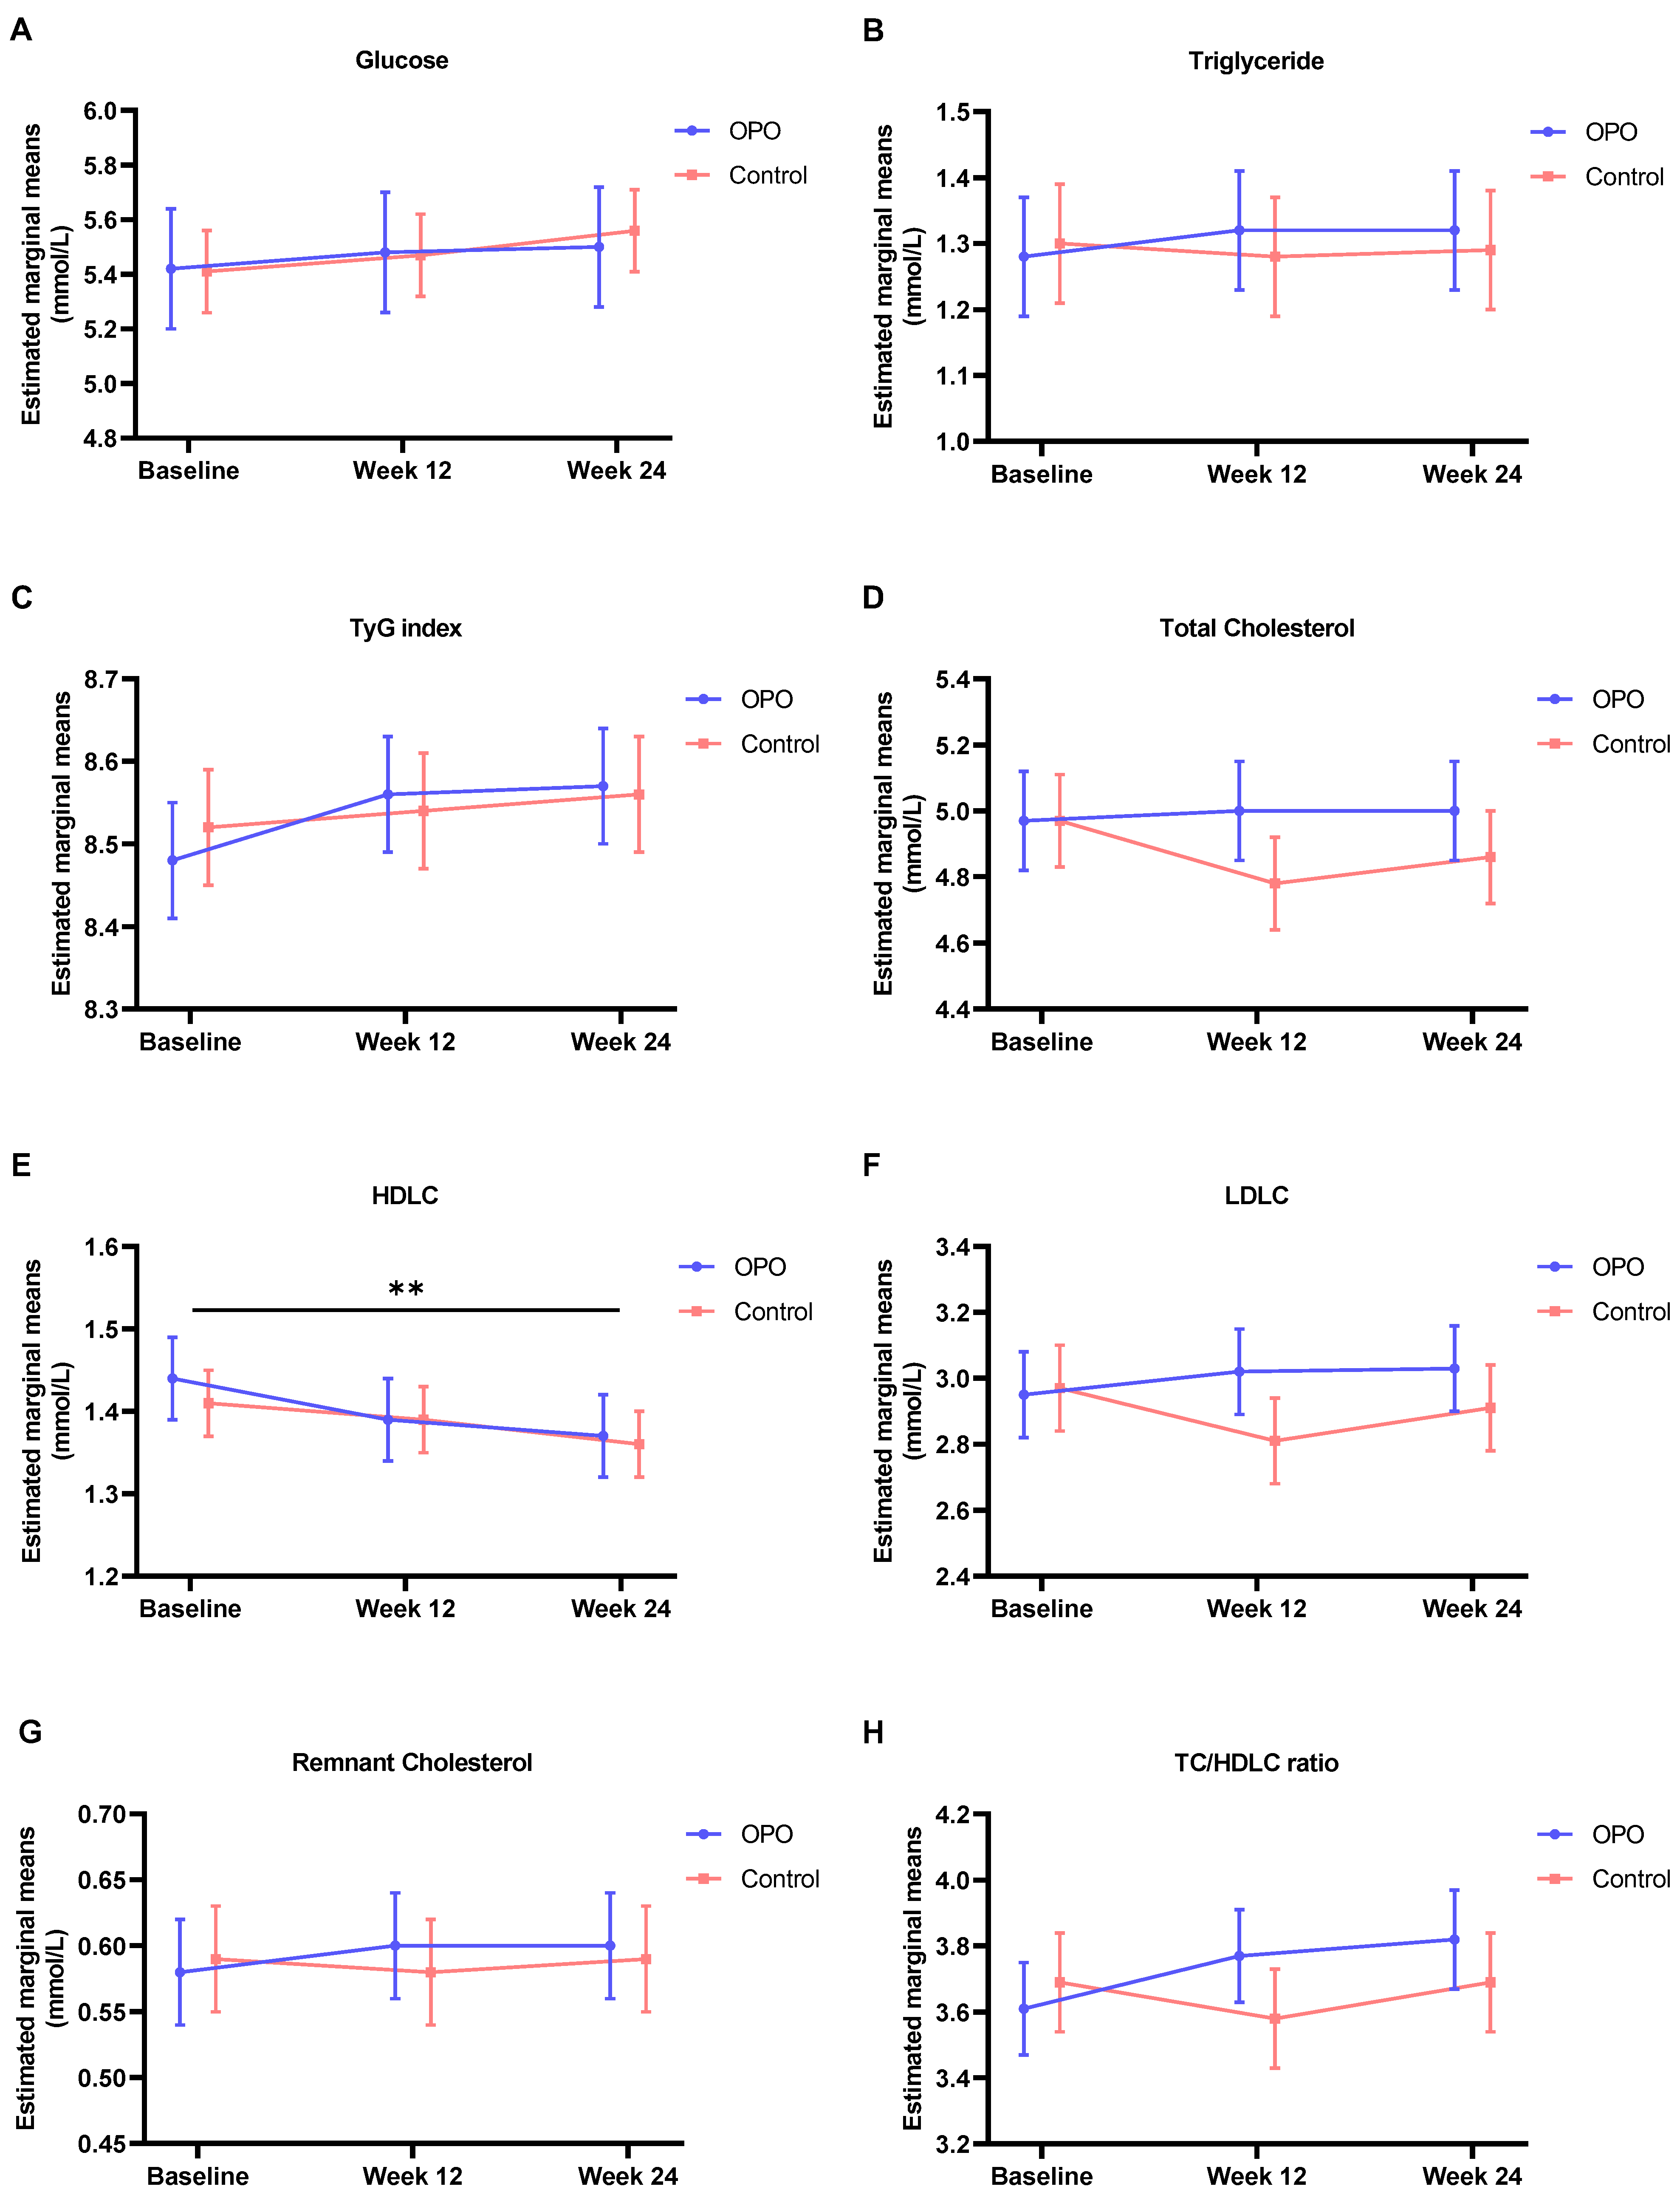
| Glucose, mmol/L | 5.42 ± 0.22 | 5.48 ± 0.22 | 5.50 ± 0.22 | 5.41 ± 0.15 | 5.47 ± 0.15 | 5.56 ± 0.15 | 0.951 | 0.149 | 0.791 |
| Triglyceride, mmol/L | 1.28 ± 0.094 | 1.32 ± 0.095 | 1.32 ± 0.097 | 1.30 ± 0.091 | 1.28 ± 0.091 | 1.29 ± 0.093 | 0.888 | 0.928 | 0.842 |
| TyG index | 8.48 ± 0.077 | 8.56 ± 0.077 | 8.57 ± 0.079 | 8.52 ± 0.070 | 8.54 ± 0.071 | 8.56 ± 0.071 | 0.976 | 0.196 | 0.665 |
| Total Cholesterol, mmol/L | 4.97 ± 0.15 | 5.00 ± 0.15 | 5.00 ± 0.15 | 4.97 ± 0.14 | 4.78 ± 0.14 | 4.86 ± 0.14 | 0.480 | 0.518 | 0.256 |
| HDLC, mmol/L | 1.44 ± 0.054 | 1.39 ± 0.054 | 1.37 ± 0.054 | 1.41 ± 0.046 | 1.39 ± 0.047 | 1.36 ± 0.047 | 0.832 | 0.003 | 0.575 |
| LDLC, mmol/L | 2.95 ± 0.13 | 3.02 ± 0.13 | 3.03 ± 0.13 | 2.97 ± 0.13 | 2.81 ± 0.13 | 2.91 ± 0.13 | 0.504 | 0.664 | 0.184 |
| Remnant Cholesterol, mmol/L | 0.58 ± 0.043 | 0.60 ± 0.043 | 0.60 ± 0.044 | 0.59 ± 0.041 | 0.58 ± 0.042 | 0.59 ± 0.042 | 0.885 | 0.936 | 0.843 |
| TC/HDLC ratio | 3.61 ± 0.14 | 3.77 ± 0.14 | 3.82 ± 0.15 | 3.69 ± 0.15 | 3.58 ± 0.15 | 3.69 ± 0.15 | 0.646 | 0.172 | 0.071 |
| Indicators | OPO Group | Control Group | p Value | ||||||||
|---|---|---|---|---|---|---|---|---|---|---|---|
| Baseline | Week 4 | Week 12 | Week 24 | Baseline | Week 4 | Week 12 | Week 24 | Group | Time | Group × Time | |
| Weight, kg | 67.80 ± 1.14 | 67.98 ± 1.14 | 67.28 ± 1.14 | 66.77 ± 1.14 | 69.92 ± 1.36 | 70.14 ± 1.36 | 69.33 ± 1.36 | 68.96 ± 1.36 | 0.195 | <0.001 | 0.968 |
| Body mass index, kg/m2 | 24.88 ± 0.41 | 24.95 ± 0.41 | 24.70 ± 0.41 | 24.51 ± 0.41 | 25.53 ± 0.50 | 25.61 ± 0.50 | 25.29 ± 0.50 | 25.14 ± 0.50 | 0.292 | <0.001 | 0.936 |
| Total body water, kg | 33.91 ± 0.54 | 33.90 ± 0.54 | 33.79 ± 0.54 | 32.93 ± 0.55 | 34.03 ± 0.49 | 33.91 ± 0.49 | 33.87 ± 0.49 | 33.34 ± 0.50 | 0.806 | 0.003 | 0.862 |
| Protein, kg | 9.00 ± 0.14 | 8.98 ± 0.14 | 8.96 ± 0.14 | 8.72 ± 0.14 | 9.02 ± 0.13 | 9.00 ± 0.13 | 8.98 ± 0.13 | 8.83 ± 0.13 | 0.795 | 0.002 | 0.871 |
| Soft lean mass, kg | 43.47 ± 0.70 | 43.44 ± 0.70 | 43.29 ± 0.70 | 42.19 ± 0.70 | 43.59 ± 0.62 | 43.47 ± 0.63 | 43.40 ± 0.63 | 42.71 ± 0.63 | 0.806 | 0.002 | 0.870 |
| Fat-free mass, kg | 46.09 ± 0.73 | 46.04 ± 0.73 | 45.88 ± 0.73 | 44.73 ± 0.74 | 46.16 ± 0.65 | 46.10 ± 0.66 | 46.01 ± 0.66 | 45.30 ± 0.66 | 0.804 | 0.002 | 0.850 |
| Skeletal muscle, kg | 25.19 ± 0.43 | 25.11 ± 0.43 | 25.03 ± 0.43 | 24.32 ± 0.44 | 25.19 ± 0.38 | 25.17 ± 0.39 | 25.11 ± 0.39 | 24.62 ± 0.39 | 0.820 | <0.001 | 0.883 |
| Skeletal muscle index, kg/m2 | 7.13 ± 0.10 | 7.11 ± 0.09 | 7.11 ± 0.09 | 7.02 ± 0.10 | 7.40 ± 0.13 | 7.16 ± 0.13 | 7.05 ± 0.13 | 6.95 ± 0.14 | 0.697 | 0.003 | 0.090 |
| Body fat mass, kg | 21.58 ± 0.85 | 21.81 ± 0.85 | 21.24 ± 0.85 | 21.93 ± 0.86 | 23.62 ± 0.96 | 23.88 ± 0.97 | 23.18 ± 0.97 | 23.50 ± 0.97 | 0.094 | 0.286 | 0.886 |
| Percent body fat, % | 31.93 ± 0.92 | 32.33 ± 0.92 | 31.77 ± 0.92 | 33.20 ± 0.93 | 33.66 ± 0.84 | 33.83 ± 0.85 | 33.27 ± 0.85 | 33.94 ± 0.86 | 0.183 | 0.177 | 0.763 |
| InBody score | 67.76 ± 1.00 | 67.54 ± 1.00 | 67.95 ± 1.00 | 66.03 ± 1.02 | 65.72 ± 0.89 | 65.39 ± 0.91 | 66.09 ± 0.90 | 65.11 ± 0.93 | 0.082 | 0.175 | 0.806 |
| Visceral fat level | 8.38 ± 0.34 | 8.97 ± 0.34 | 8.72 ± 0.34 | 8.94 ± 0.35 | 9.13 ± 0.37 | 9.31 ± 0.37 | 9.49 ± 0.37 | 9.72 ± 0.37 | 0.118 | 0.017 | 0.564 |
Disclaimer/Publisher’s Note: The statements, opinions and data contained in all publications are solely those of the individual author(s) and contributor(s) and not of MDPI and/or the editor(s). MDPI and/or the editor(s) disclaim responsibility for any injury to people or property resulting from any ideas, methods, instructions or products referred to in the content. |
© 2024 by the authors. Licensee MDPI, Basel, Switzerland. This article is an open access article distributed under the terms and conditions of the Creative Commons Attribution (CC BY) license (https://creativecommons.org/licenses/by/4.0/).
Share and Cite
Zhong, W.; Zhao, A.; Wei, X.; Mao, S.; Li, P.; Shen, Q.; Zhang, H.; Jiang, H.; Wang, P.; Zhang, Y. The Effect of Sn-2 Palmitate on Blood Glucose, Lipids and Body Composition in Middle-Aged and Elderly Adults: A Randomized, Double-Blinded Controlled Trial. Nutrients 2024, 16, 973. https://doi.org/10.3390/nu16070973
Zhong W, Zhao A, Wei X, Mao S, Li P, Shen Q, Zhang H, Jiang H, Wang P, Zhang Y. The Effect of Sn-2 Palmitate on Blood Glucose, Lipids and Body Composition in Middle-Aged and Elderly Adults: A Randomized, Double-Blinded Controlled Trial. Nutrients. 2024; 16(7):973. https://doi.org/10.3390/nu16070973
Chicago/Turabian StyleZhong, Wuxian, Ai Zhao, Xuetao Wei, Shuai Mao, Pin Li, Qianqian Shen, Hong Zhang, Hua Jiang, Peiyu Wang, and Yumei Zhang. 2024. "The Effect of Sn-2 Palmitate on Blood Glucose, Lipids and Body Composition in Middle-Aged and Elderly Adults: A Randomized, Double-Blinded Controlled Trial" Nutrients 16, no. 7: 973. https://doi.org/10.3390/nu16070973