
Associations between Dietary Patterns and Physical Activity with Physical Fitness among Adolescents in Shandong Province, China: A Cross-Sectional Study

Abstract
:1. Introduction
2. Materials and Methods
2.1. Participants and Study Design
2.2. Data Availability
2.3. Measurements
2.3.1. Demographic Factors
2.3.2. Physical Activity Measure
2.3.3. Dietary Assessment
2.3.4. Physical Fitness
2.4. Statistical Analysis
3. Results
3.1. Sociodemographic Characteristics of the Participants
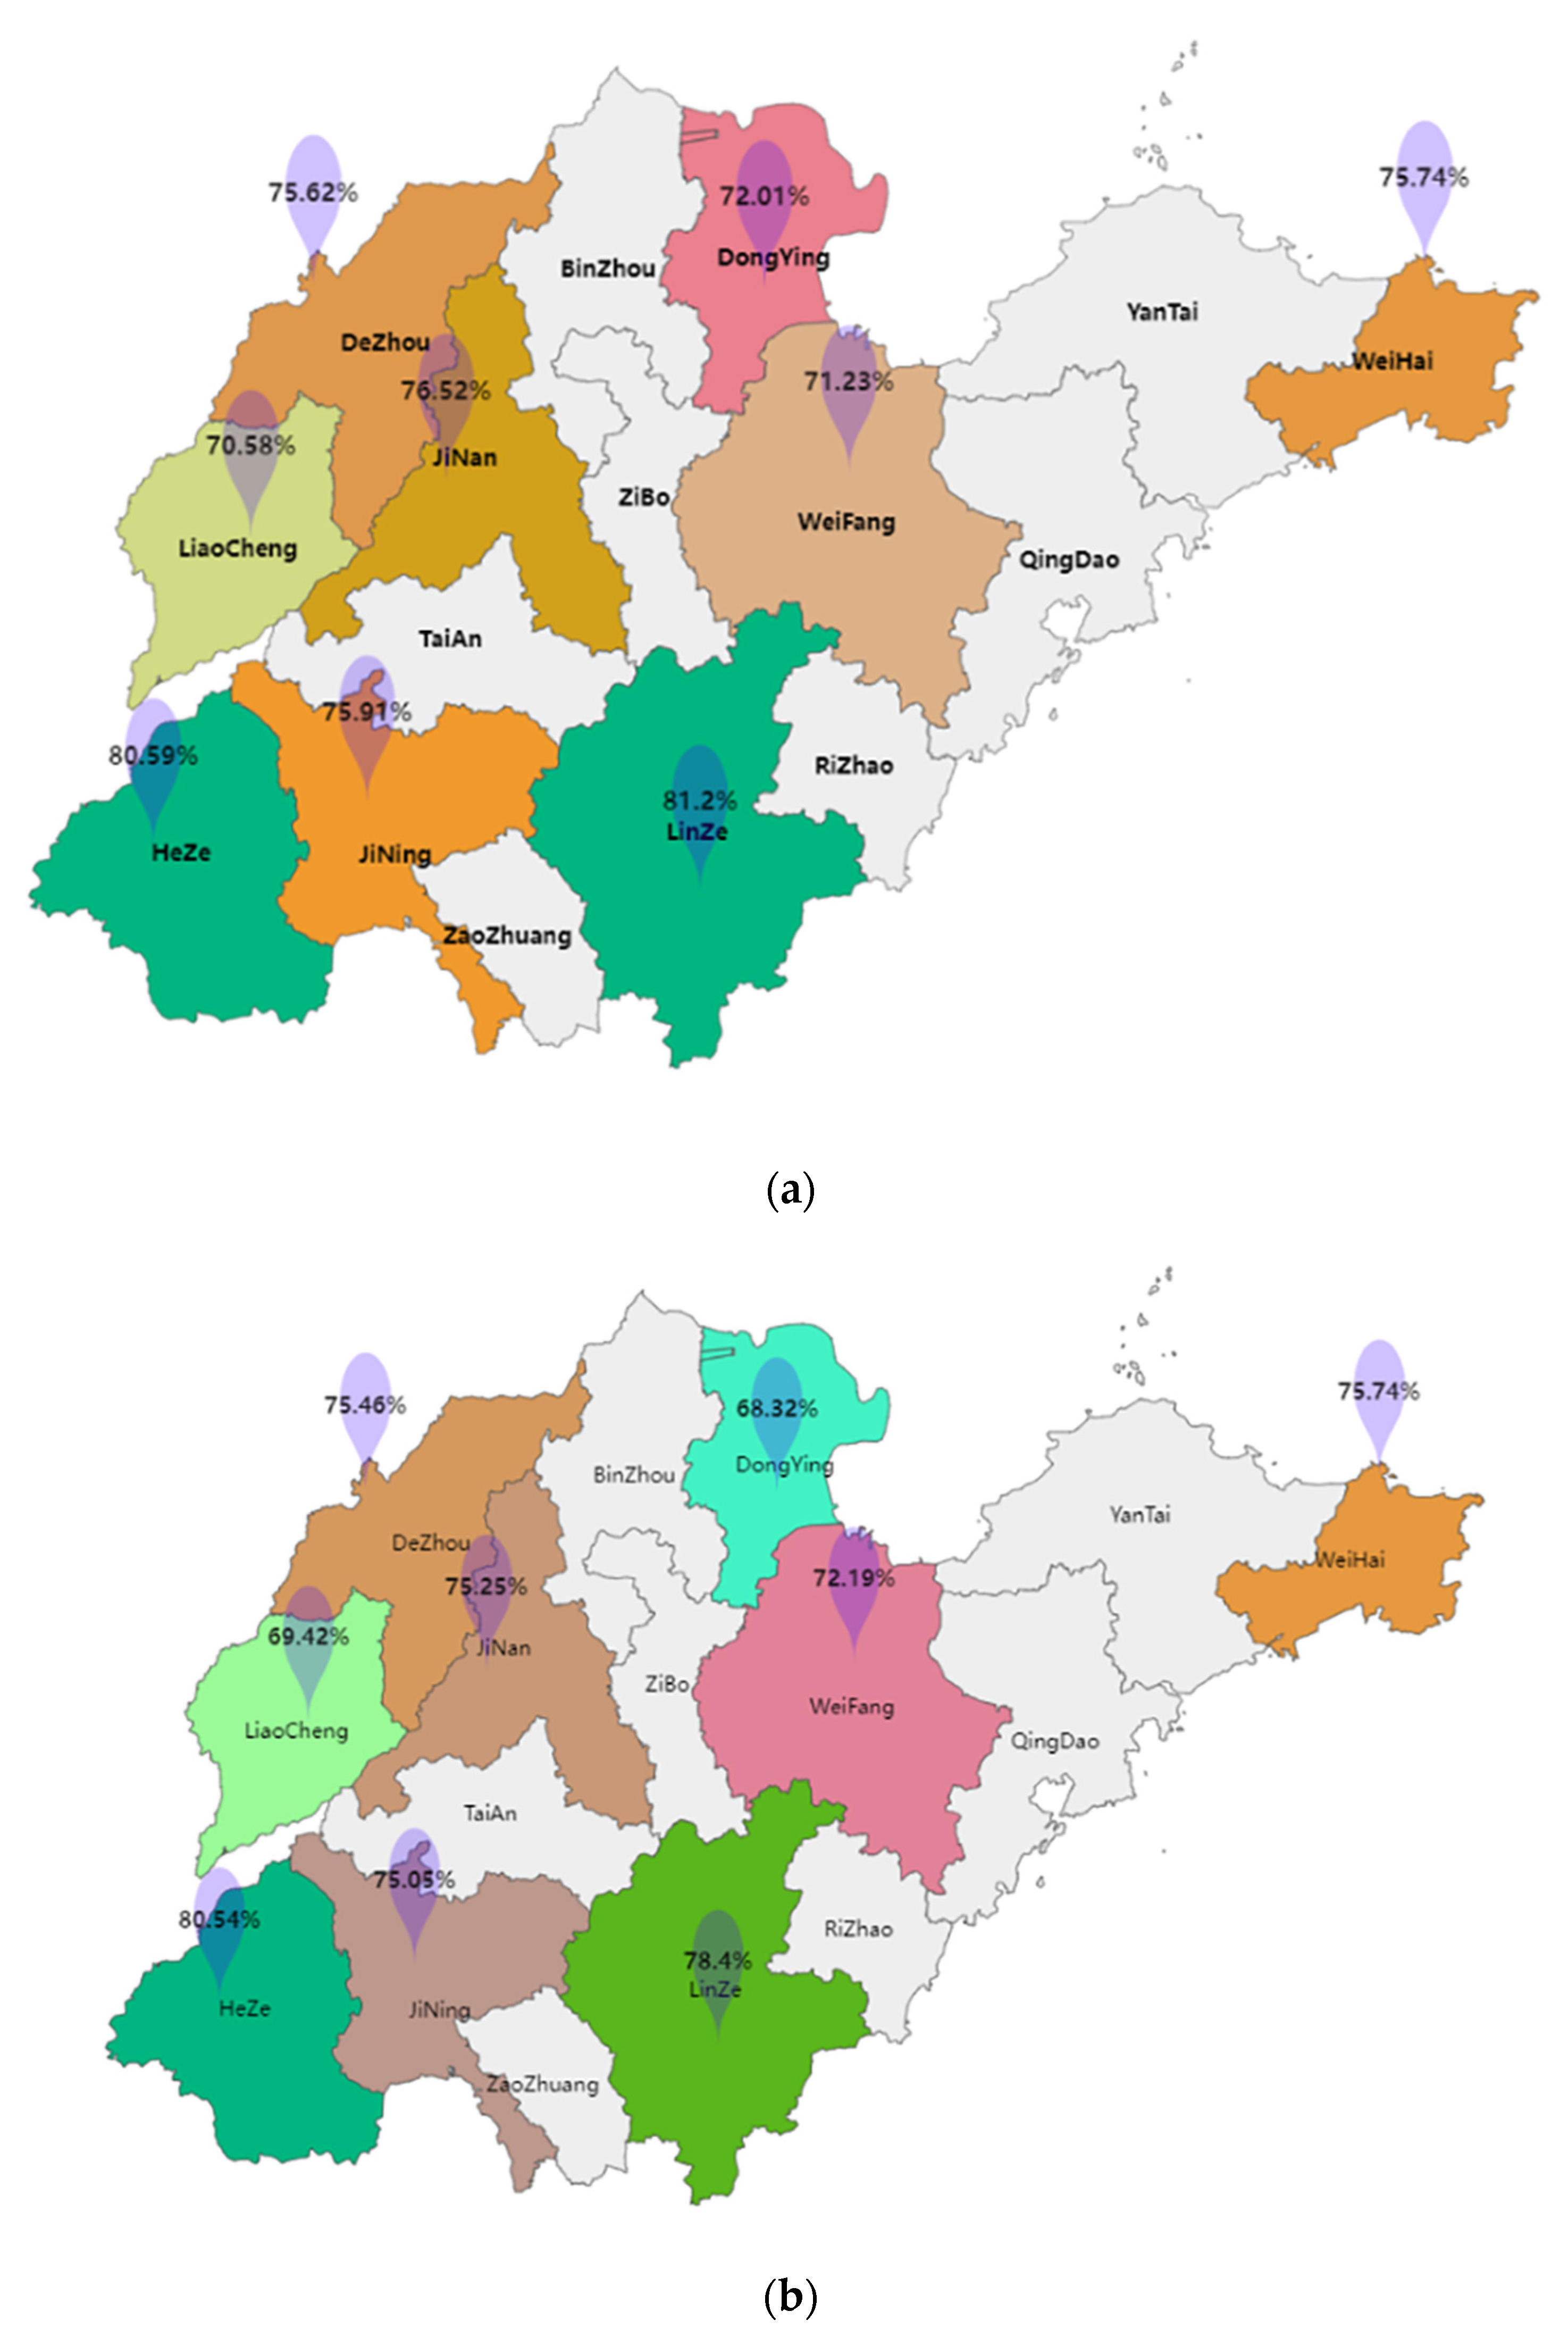
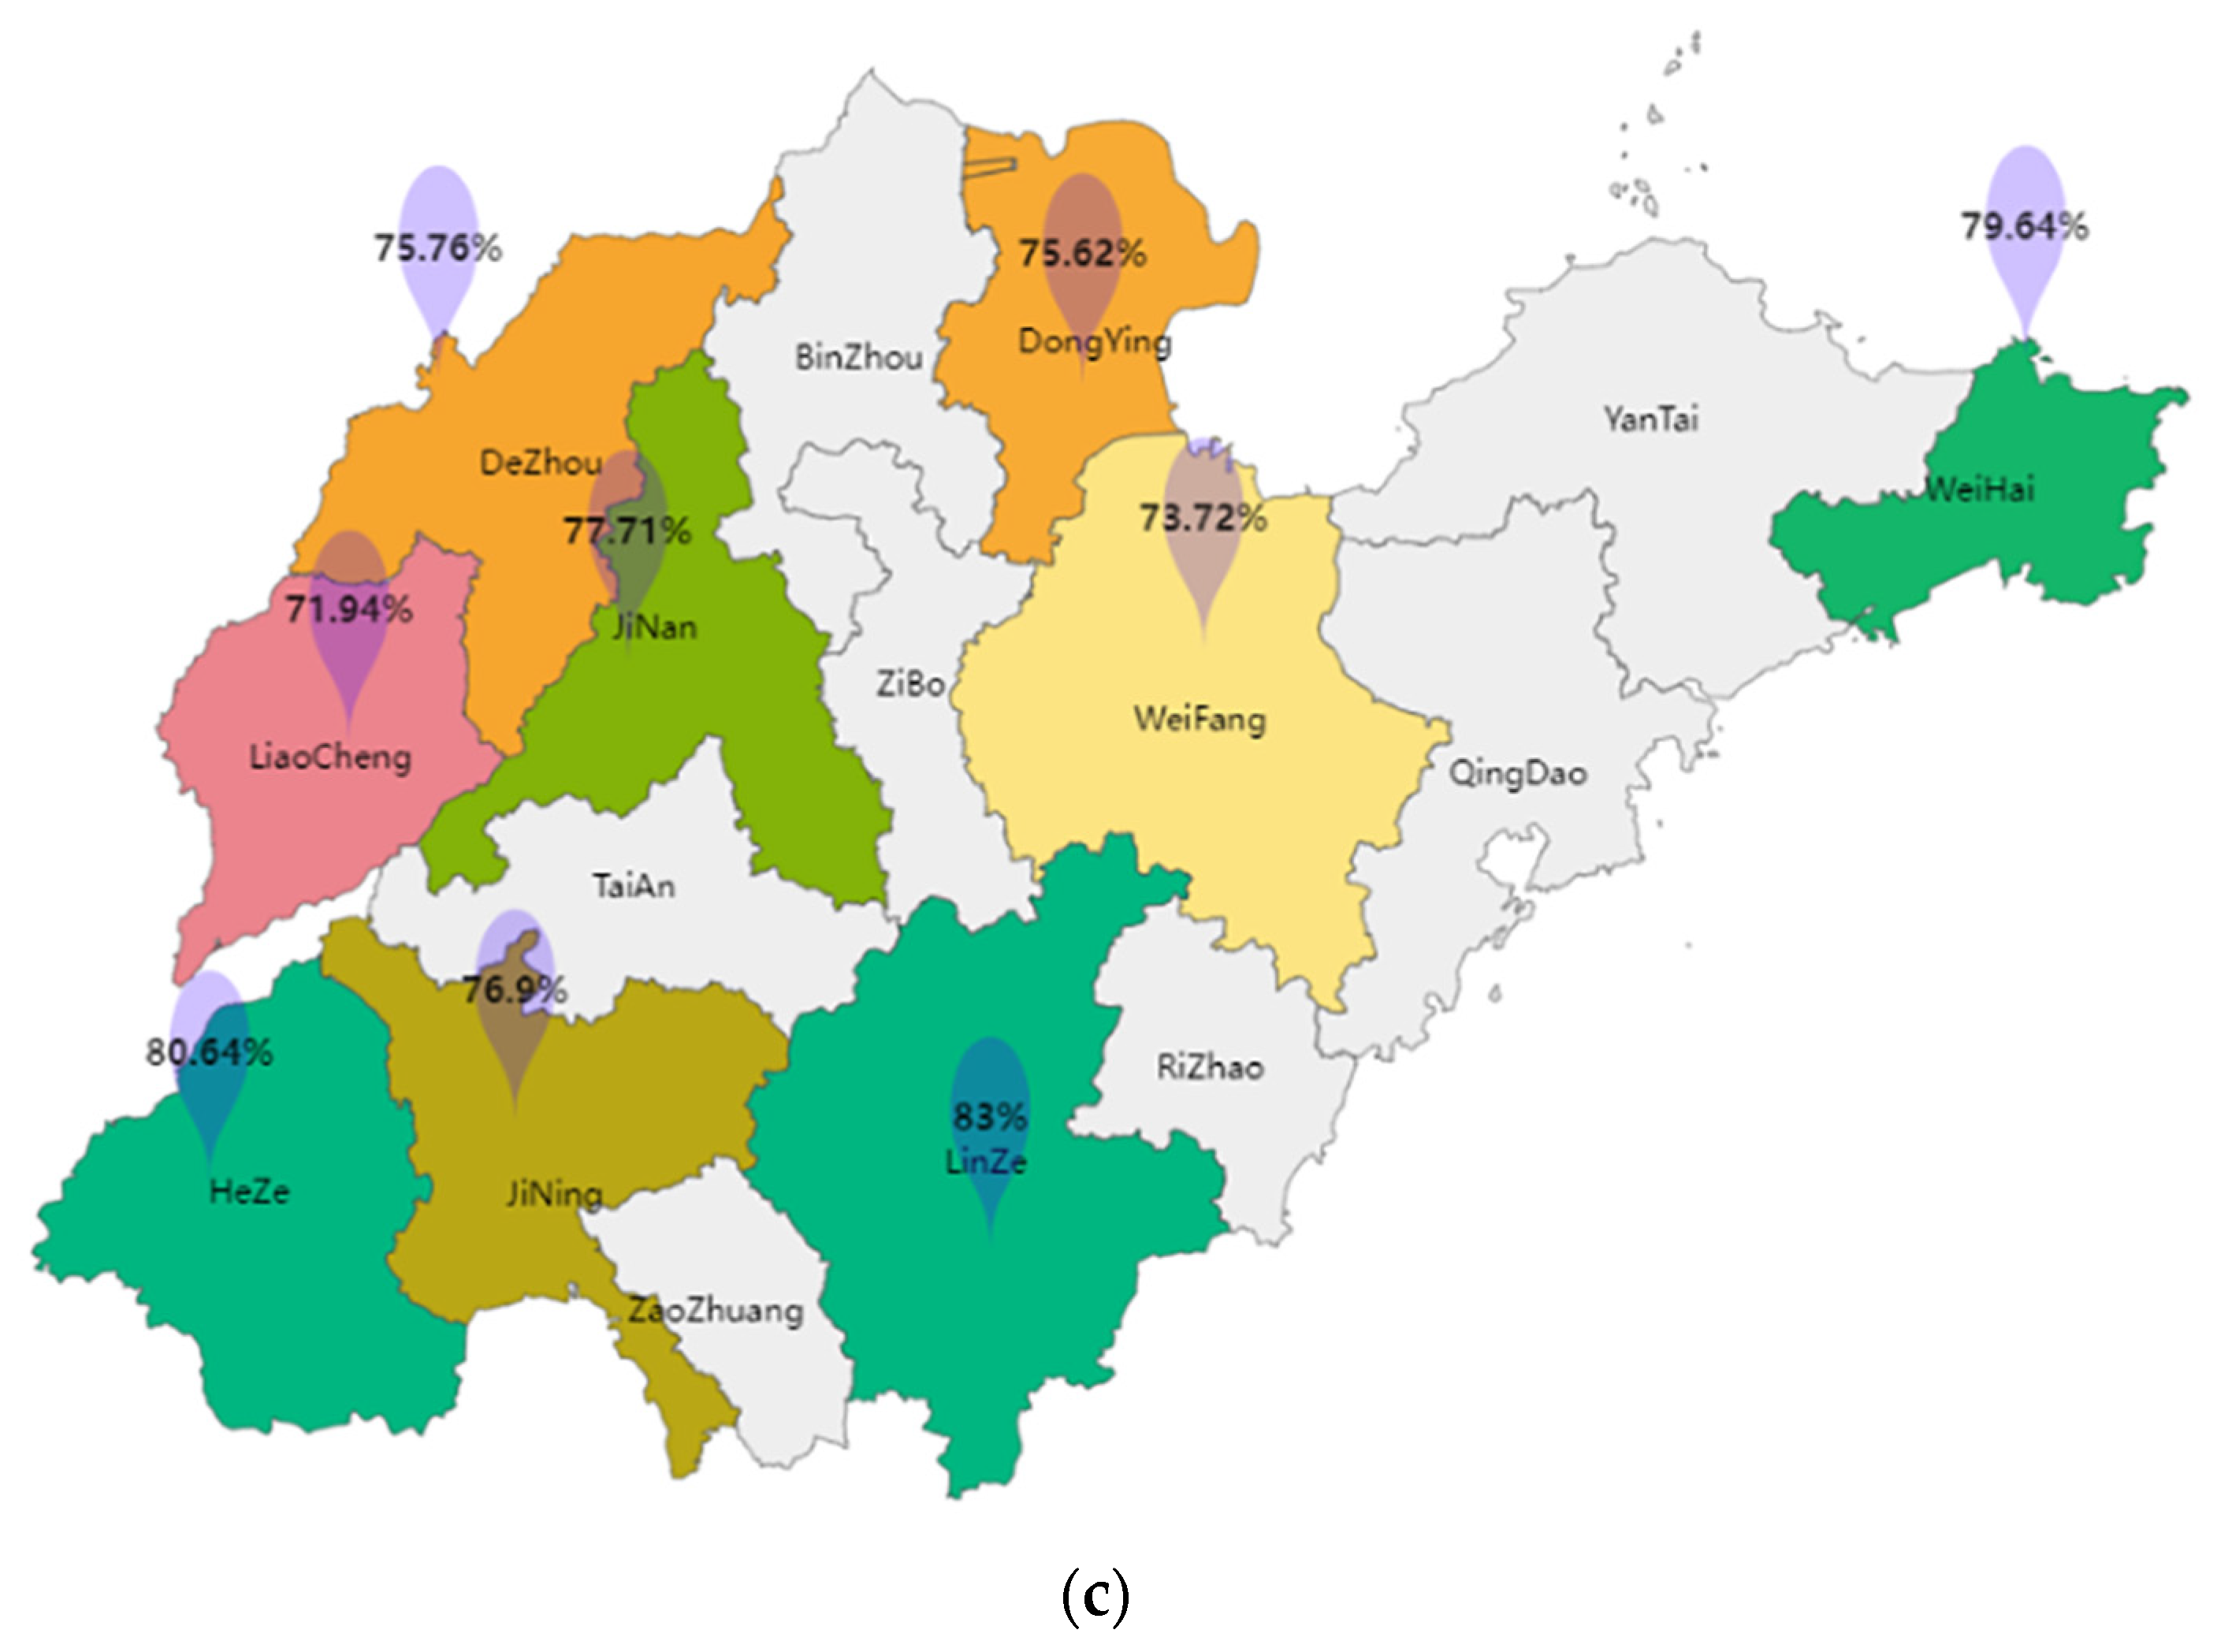
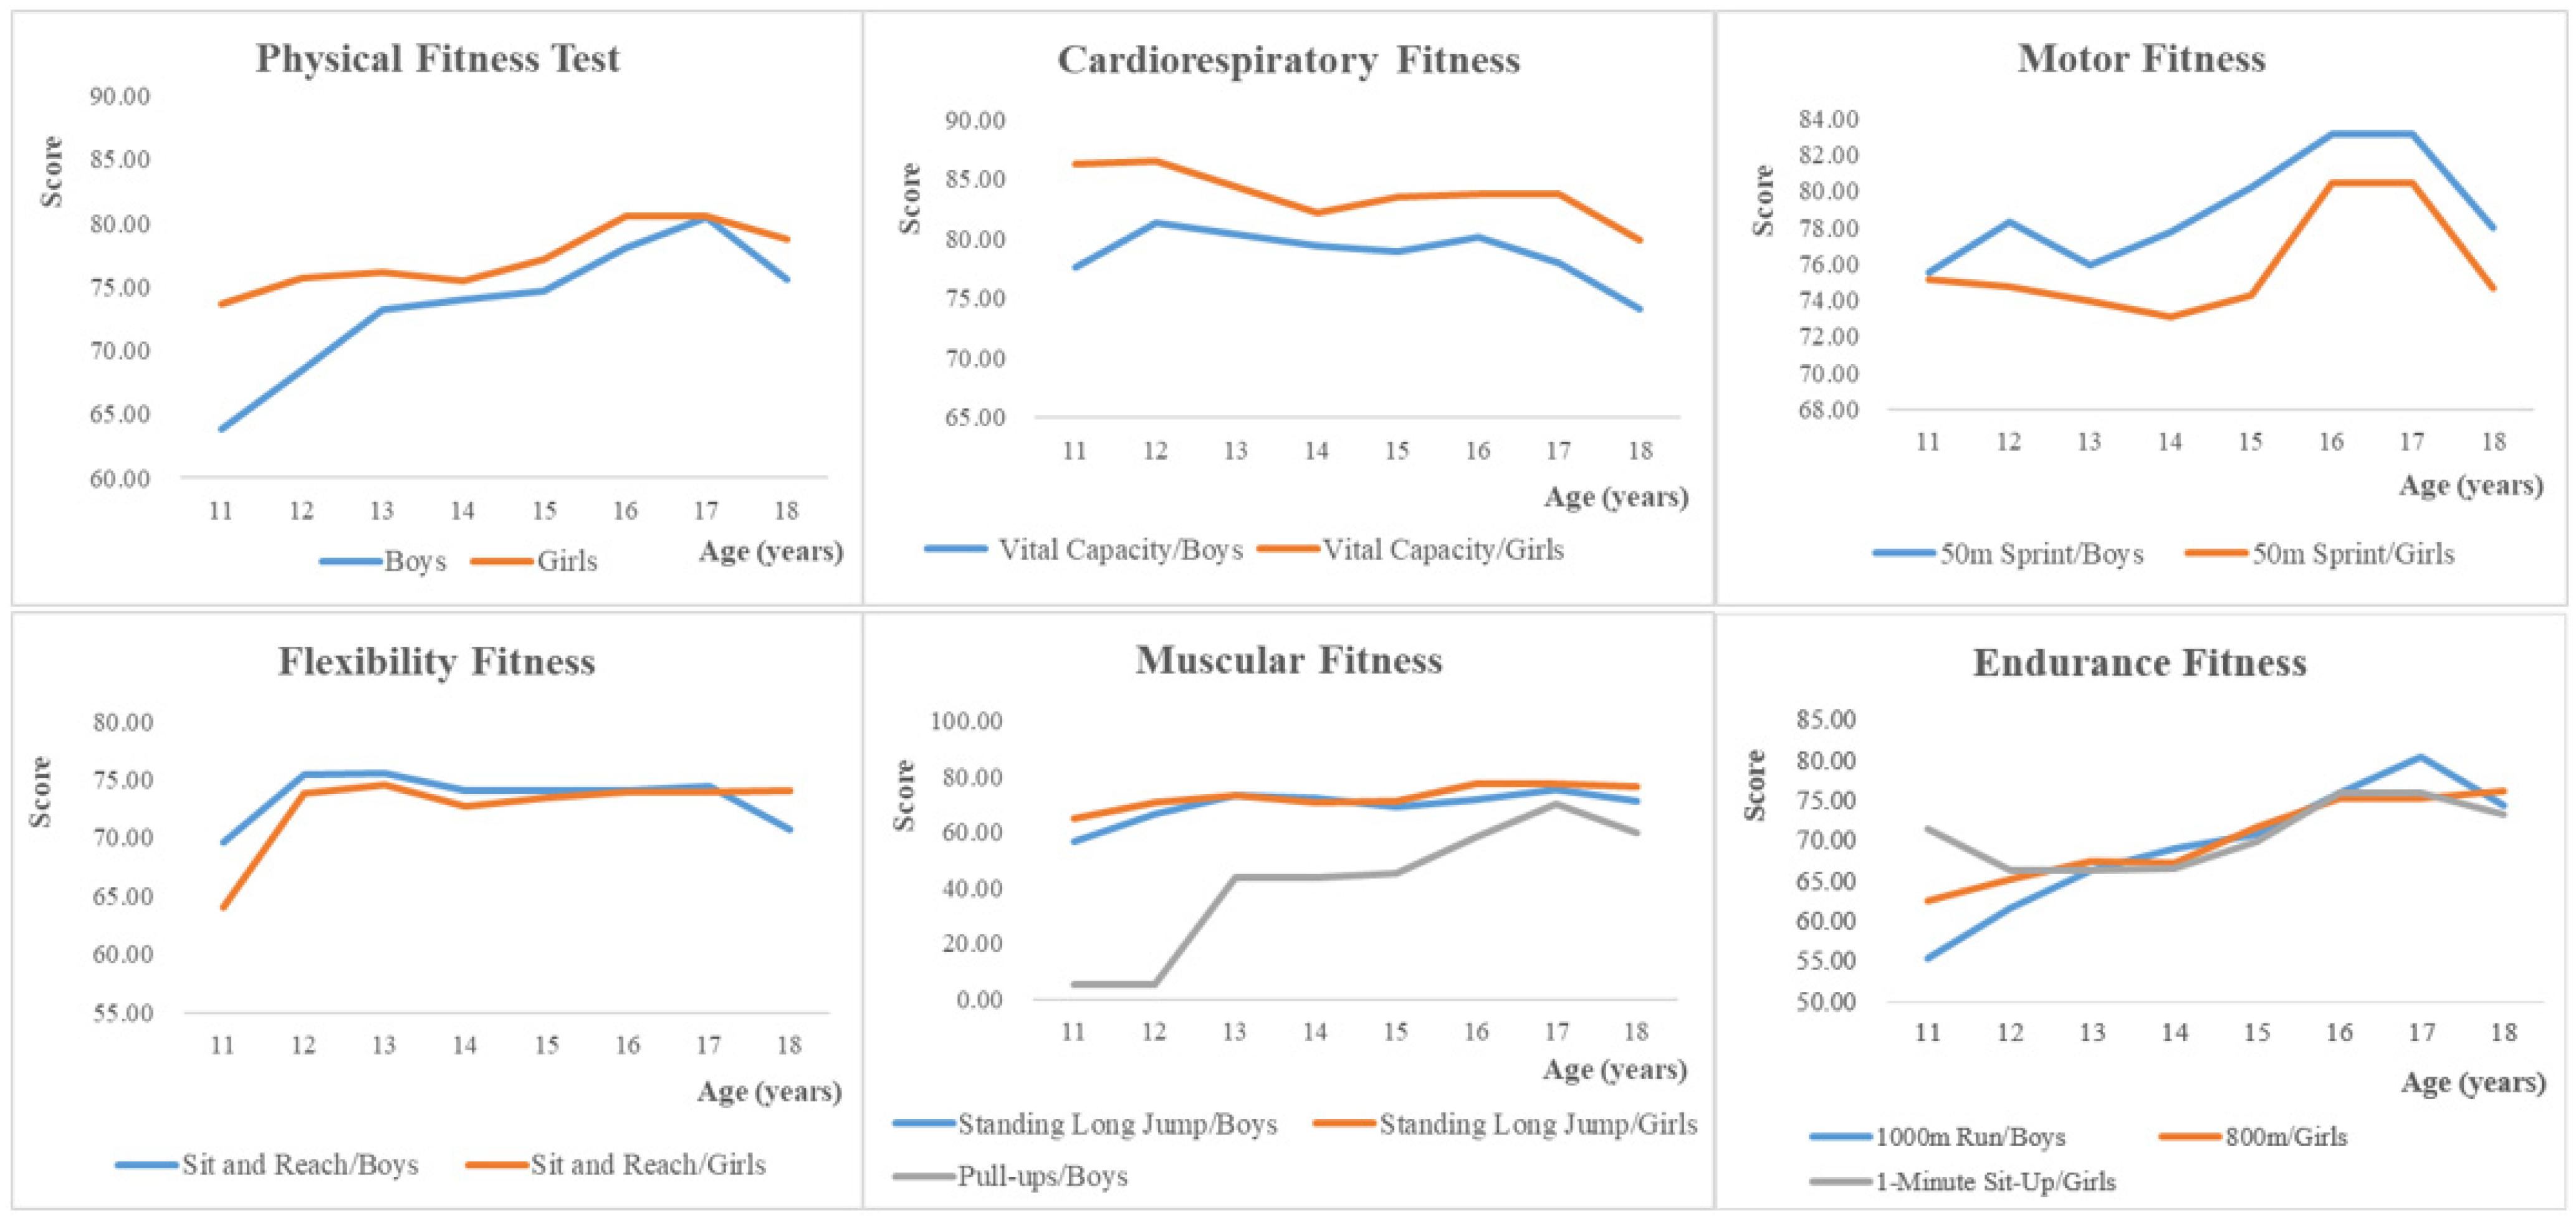
3.2. Physical Fitness Status of Adolescents in Shandong Province
3.3. Relationship between Physical Fitness and Other Variables
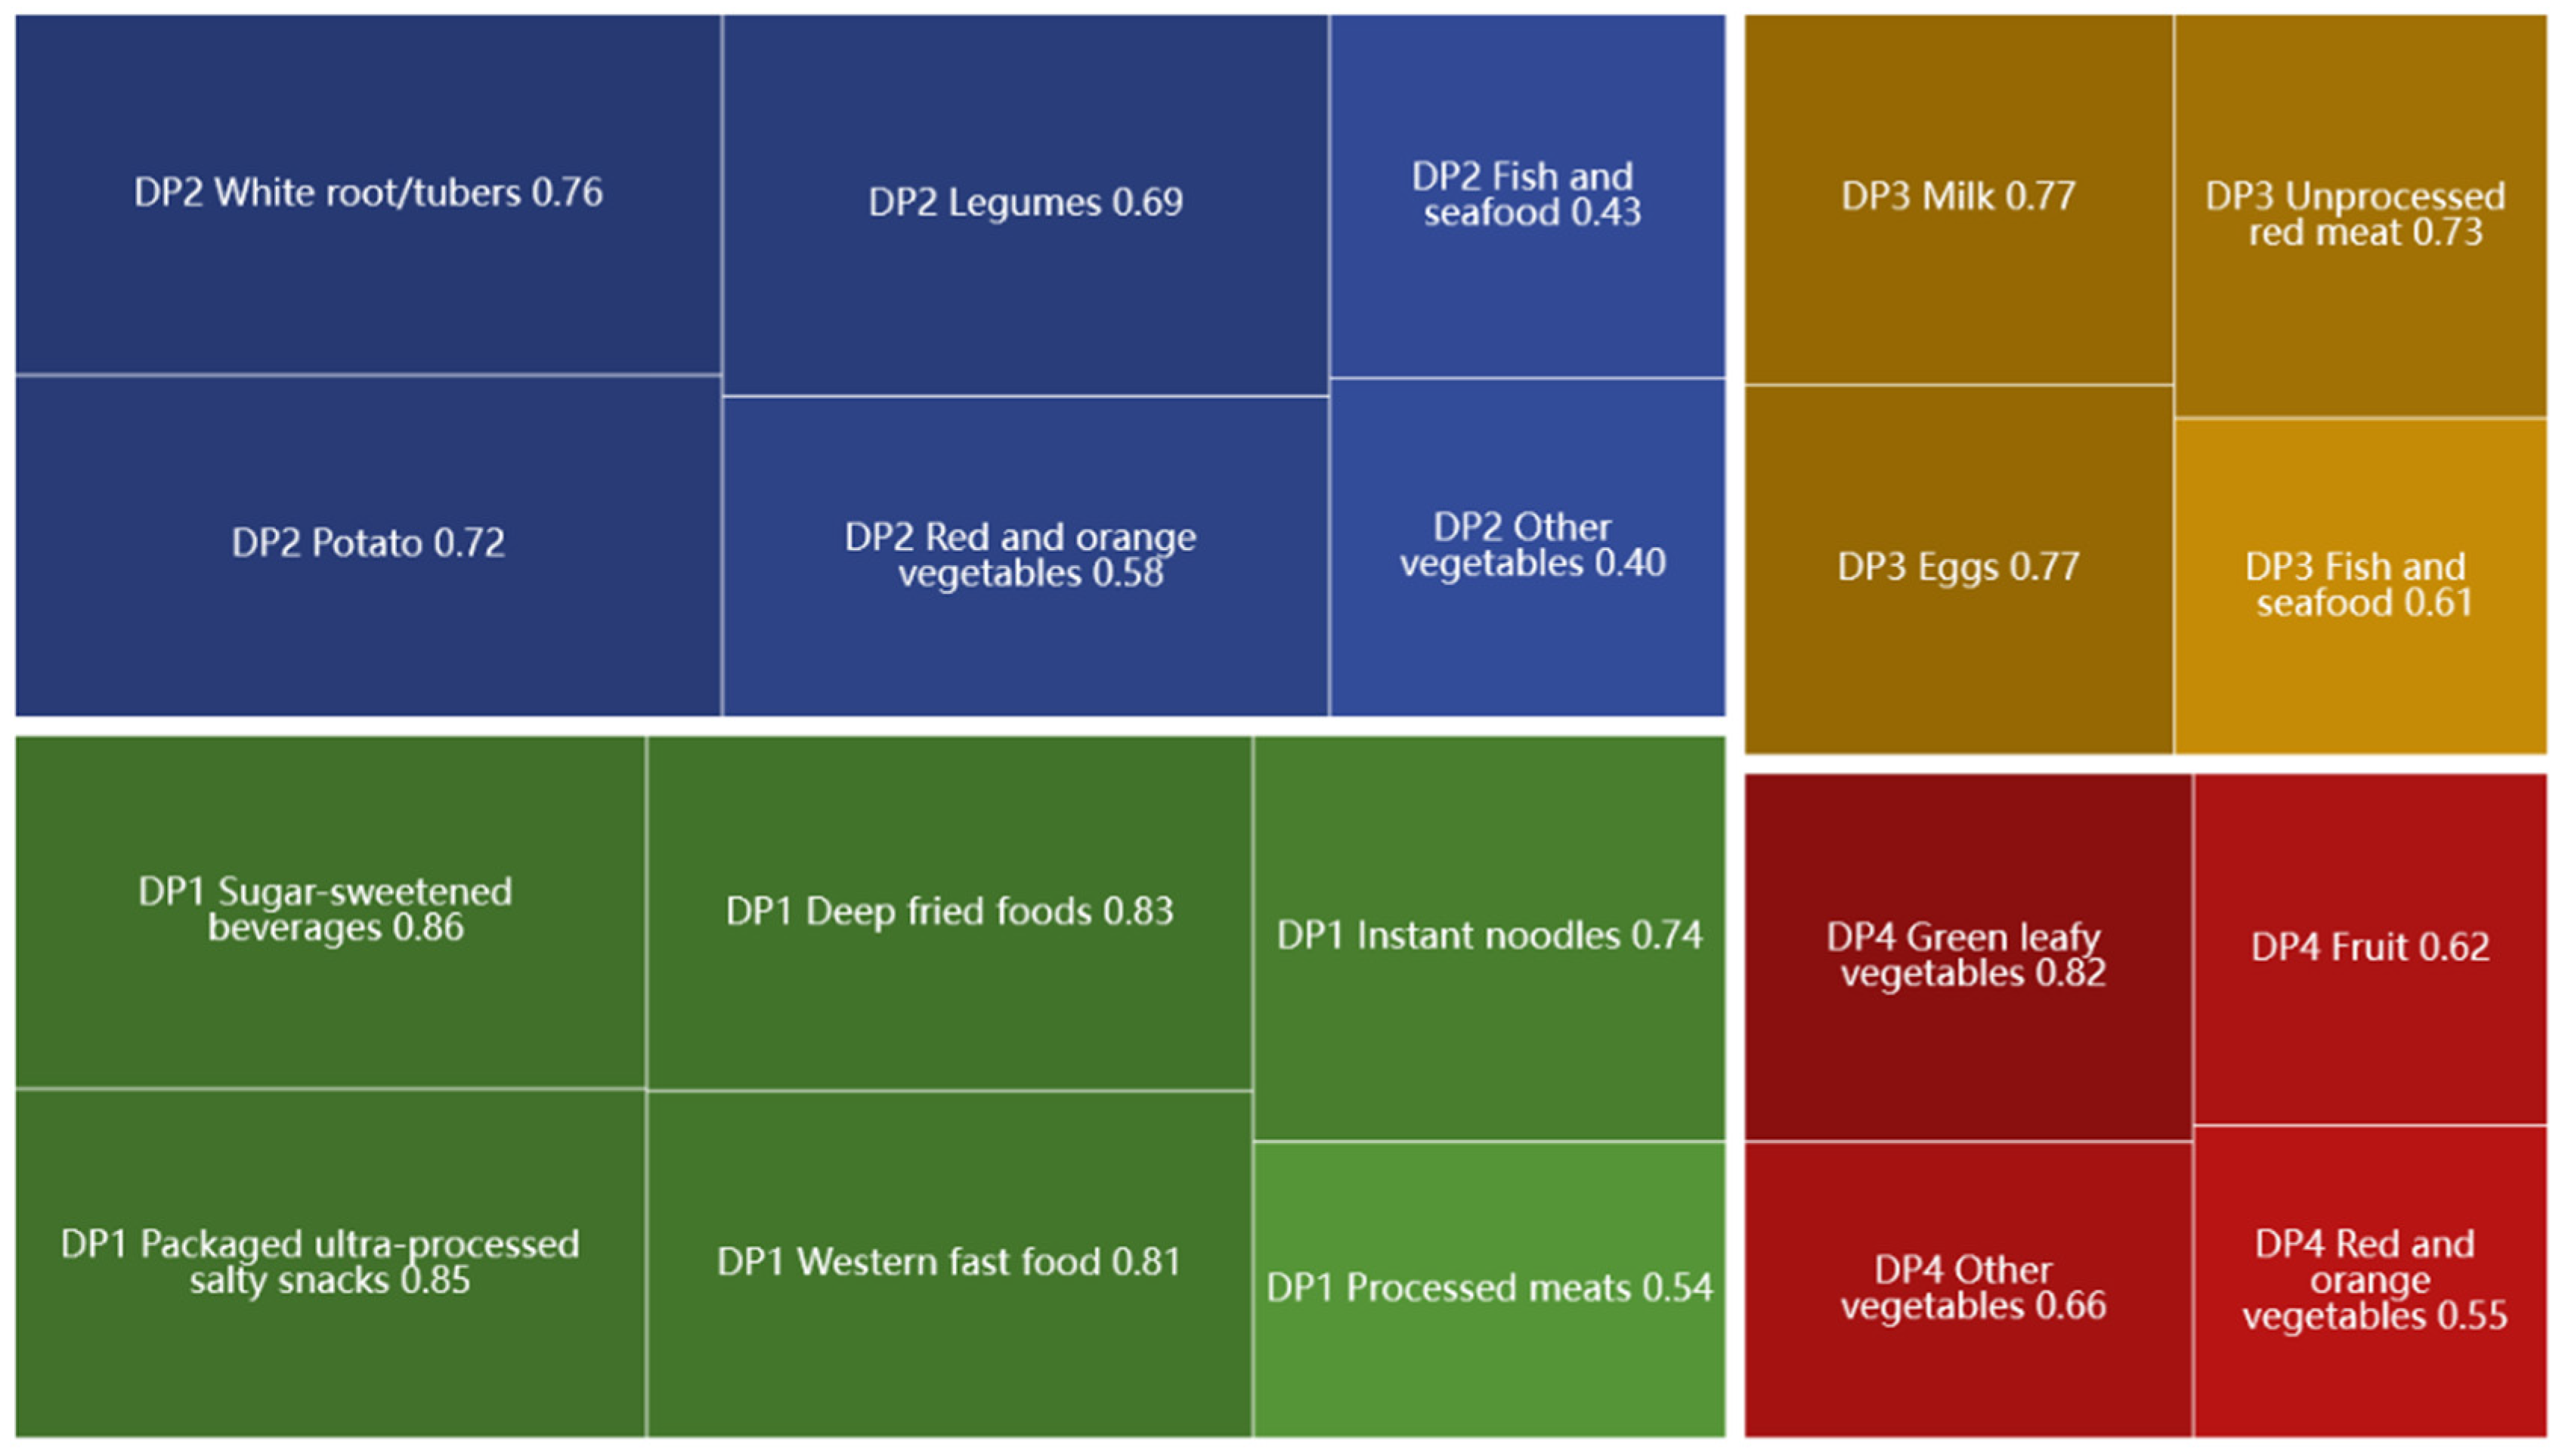
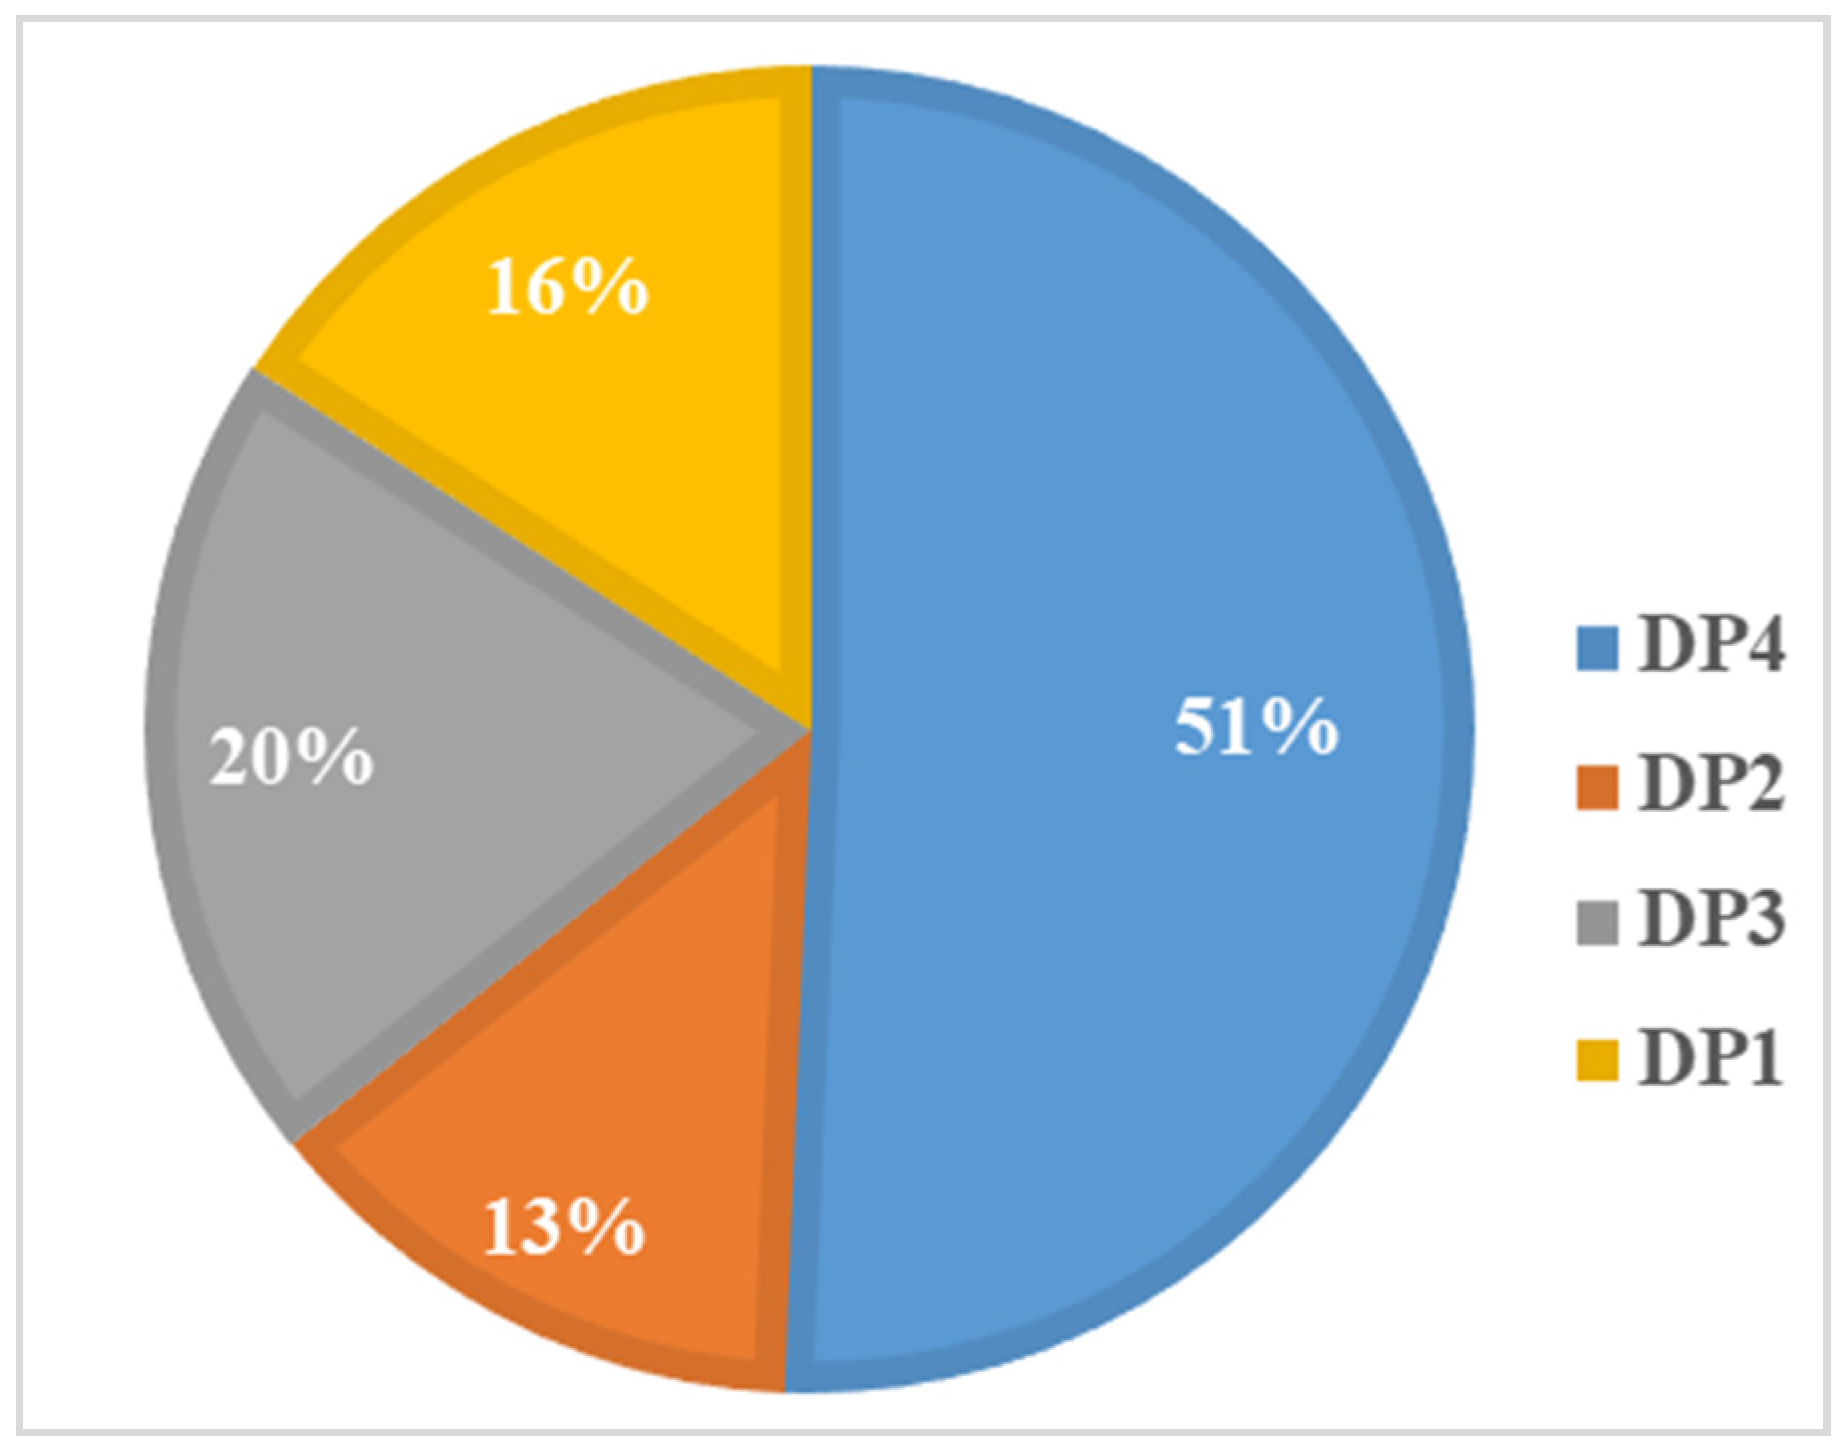
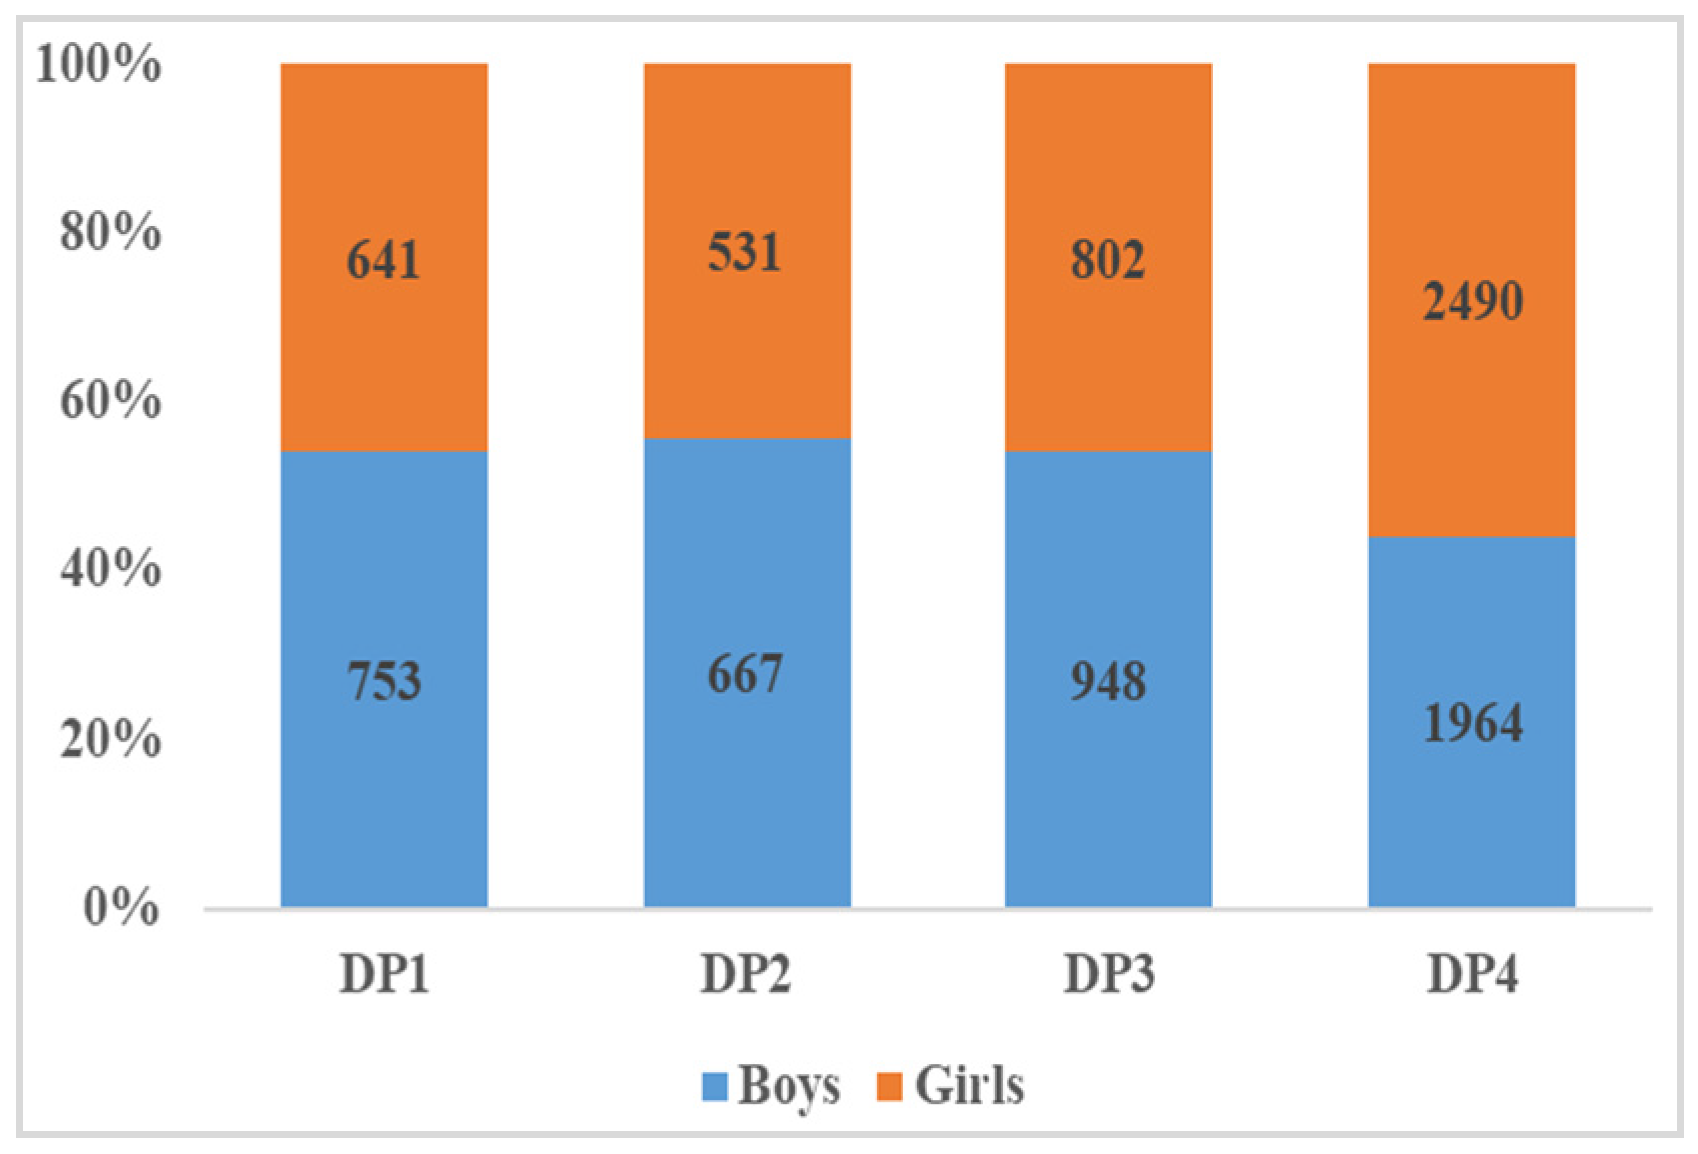
3.4. Dietary Patterns of Adolescents Aged 11–18
3.5. Associations between Dietary Patterns and Physical Fitness
4. Discussion
4.1. Physical Fitness
4.2. Dietary Patterns
4.3. Physical Activity, Dietary Patterns and Physical Fitness
4.4. Study Limitations and Future Research
5. Conclusions
Author Contributions
Funding
Institutional Review Board Statement
Informed Consent Statement
Data Availability Statement
Acknowledgments
Conflicts of Interest
References
- Caspersen, C.J.; Powell, K.E.; Christenson, G.M. Physical activity, exercise, and physical fitness: Definitions and distinctions for health-related research. Public Health Rep. 1985, 100, 126. [Google Scholar]
- Ganley, K.J.; Paterno, M.V.; Miles, C.; Stout, J.; Brawner, L.; Girolami, G.; Warren, M. Health-related fitness in children and adolescents. Pediatr. Phys. Ther. 2011, 23, 208–220. [Google Scholar] [CrossRef]
- Del Pozo, F.J.F.; Alonso, J.V.; Álvarez, M.V.; Orr, S.; Cantarero, F.J. Physical fitness as an indicator of health status and its relationship to academic performance during the prepubertal period. Health Promot. Perspect. 2017, 7, 197. [Google Scholar]
- Ortega, F.B.; Ruiz, J.R.; Castillo, M.J.; Sjöström, M. Physical fitness in childhood and adolescence: A powerful marker of health. Int. J. Obes. 2008, 32, 1–11. [Google Scholar] [CrossRef] [Green Version]
- Beltran-Valls, M.R.; Adelantado-Renau, M.; Moliner-Urdiales, D. Reallocating time spent in physical activity intensities: Longitudinal associations with physical fitness (DADOS study). J. Sci. Med. Sport 2020, 23, 968–972. [Google Scholar] [CrossRef] [PubMed]
- Brown, H.E.; Pearson, N.; Braithwaite, R.E.; Brown, W.J.; Biddle, S.J. Physical activity interventions and depression in children and adolescents. Sport. Med. 2013, 43, 195–206. [Google Scholar] [CrossRef] [PubMed]
- Department of Physical Health and Art Education Ministry of Education. The Eighth National Student Physique and Health Survey Results Released. Chin. J. School Health 2021, 42, 1281–1282. [Google Scholar] [CrossRef]
- Teran-Garcia, M.; Rankinen, T.; Bouchard, C. Genes, exercise, growth, and the sedentary, obese child. J. Appl. Physiol. 2008, 105, 988–1001. [Google Scholar] [CrossRef]
- Labayen, I.; Ruiz, J.R.; Ortega, F.B.; Loit, H.M.; Harro, J.; Veidebaum, T.; Sjöström, M. Intergenerational cardiovascular disease risk factors involve both maternal and paternal BMI. Diabetes Care 2010, 33, 894–900. [Google Scholar] [CrossRef] [PubMed] [Green Version]
- Cabanas-Sánchez, V.; Martínez-Gómez, D.; Izquierdo-Gómez, R.; Segura-Jiménez, V.; Castro-Piñero, J.; Veiga, O.L. Association between clustering of lifestyle behaviors and health-related physical fitness in youth: The UP&DOWN Study. J. Pediatr. 2018, 199, 41–48. [Google Scholar]
- Correia, J.M.; Santos, I.; Pezarat-Correia, P.; Silva, A.M.; Mendonca, G.V. Effects of ramadan and non-ramadan intermittent fasting on body composition: A systematic review and meta-analysis. Front. Nutr. 2021, 7, 625240. [Google Scholar] [CrossRef]
- Myers, A.; Camidge, D.; Croden, F.; Gibbons, C.; Stubbs, R.J.; Blundell, J.; Buckland, N. Free-Living Energy Balance Behaviors Are Associated with Greater Weight Loss During a Weight Loss Program. Front. Nutr. 2021, 8, 567. [Google Scholar] [CrossRef] [PubMed]
- Bogataj, Š.; Trajković, N.; Cadenas-Sanchez, C.; Sember, V. Effects of school-based exercise and nutrition intervention on body composition and physical fitness in overweight adolescent girls. Nutrients 2021, 13, 238. [Google Scholar] [CrossRef] [PubMed]
- Oh, S.; Lee, S.Y.; Kim, D.Y.; Woo, S.; Kim, Y.; Lee, H.J.; Lim, H. Association of Dietary Patterns with weight status and metabolic risk factors among children and adolescents. Nutrients 2021, 13, 1153. [Google Scholar] [CrossRef]
- Shikany, J.M.; Jacobs Jr, D.R.; Lewis, C.E.; Steffen, L.M.; Sternfeld, B.; Carnethon, M.R.; Richman, J.S. Associations between food groups, dietary patterns, and cardiorespiratory fitness in the Coronary Artery Risk Development in Young Adults study. Am. J. Clin. Nutr. 2013, 98, 1402–1409. [Google Scholar] [CrossRef] [PubMed] [Green Version]
- Shi, J.; Fang, H.; Guo, Q.; Yu, D.; Ju, L.; Cheng, X.; He, L. Association of Dietary Patterns with Metabolic Syndrome in Chinese Children and Adolescents Aged 7–17: The China National Nutrition and Health Surveillance of Children and Lactating Mothers in 2016–2017. Nutrients 2022, 14, 3524. [Google Scholar] [CrossRef]
- Howe, A.S.; Skidmore PM, L.; Parnell, W.R.; Wong, J.E.; Lubransky, A.C.; Black, K.E. Cardiorespiratory fitness is positively associated with a healthy dietary pattern in New Zealand adolescents. Public Health Nutr. 2016, 19, 1279–1287. [Google Scholar] [CrossRef] [Green Version]
- Shahinfar, H.; Ghanbari, M.; Jalilpiran, Y.; Payande, N.; Shahavandi, M.; Babaei, N.; Shab-Bidar, S. Interaction between major dietary patterns and cardiorespiratory fitness on metabolic syndrome in Iranian adults: A cross-sectional study. Nutr. J. 2021, 20, 1–17. [Google Scholar] [CrossRef]
- Liang, W.; Fu, J.; Tian, X.; Tian, J.; Yang, Y.; Fan, W.; Jin, Z. Physical Fitness and Dietary Intake Improve Mental Health in Chinese Adolescence Aged 12–13. Front. Integr. Neurosci. 2022, 16, 921605. [Google Scholar] [CrossRef]
- Serra-Majem, L.; Ribas, L.; García, A.; Pérez-Rodrigo, C.; Aranceta, J. Nutrient adequacy and Mediterranean Diet in Spanish school children and adolescents. Eur. J. Clin. Nutr. 2003, 57, S35–S39. [Google Scholar] [CrossRef] [Green Version]
- Evaristo, O.S.; Moreira, C.; Lopes, L.; Abreu, S.; Agostinis-Sobrinho, C.; Oliveira-Santos, J.; Mota, J. Associations between physical fitness and adherence to the Mediterranean diet with health-related quality of life in adolescents: Results from the LabMed Physical Activity Study. Eur. J. Public Health 2018, 28, 631–635. [Google Scholar] [CrossRef]
- Ramírez-Vélez, R.; Correa-Bautista, J.E.; Ojeda-Pardo, M.L.; Sandoval-Cuellar, C.; García-Hermoso, A.; Carrillo, H.A.; Agostinis-Sobrinho, C. Optimal adherence to a mediterranean diet and high muscular fitness are associated with a healthier cardiometabolic profile in collegiate students. Nutrients 2018, 10, 511. [Google Scholar] [CrossRef] [Green Version]
- Garcia-Hermoso, A.; Vegas-Heredia, E.D.; Fernández-Vergara, O.; Ceballos-Ceballos, R.; Andrade-Schnettler, R.; Arellano-Ruiz, P.; Ramírez-Vélez, R. Independent and combined effects of handgrip strength and adherence to a Mediterranean diet on blood pressure in Chilean children. Nutrition 2019, 60, 170–174. [Google Scholar] [CrossRef]
- López-Gil, J.F.; Brazo-Sayavera, J.; García-Hermoso, A.; Yuste Lucas, J.L. Adherence to Mediterranean Diet related with physical fitness and physical activity in school children aged 6–13. Nutrients 2020, 12, 567. [Google Scholar] [CrossRef] [Green Version]
- Cadenas-Sanchez, C.; Medrano, M.; Arenaza, L.; Amasene, M.; Osés, M.; Labayen, I. Association between Mediterranean Dietary Pattern and Breakfast Quality with Physical Fitness in School Children: The HIIT Project. Nutrients 2021, 13, 1353. [Google Scholar] [CrossRef] [PubMed]
- Galan-Lopez, P.; Sánchez-Oliver, A.J.; Ries, F.; González-Jurado, J.A. Mediterranean diet, physical fitness and body composition in sevillian adolescents: A healthy lifestyle. Nutrients 2019, 11, 2009. [Google Scholar] [CrossRef] [PubMed] [Green Version]
- Agostinis-Sobrinho, C.; Santos, R.; Rosário, R.; Moreira, C.; Lopes, L.; Mota, J.; Ramírez-Vélez, R. Optimal adherence to a Mediterranean diet may not overcome the deleterious effects of low physical fitness on cardiovascular disease risk in adolescents: A cross-sectional pooled analysis. Nutrients 2018, 10, 815. [Google Scholar] [CrossRef] [Green Version]
- Tambalis, K.D.; Panagiotakos, D.B.; Psarra, G.; Sidossis, L.S. Concomitant associations between lifestyle characteristics and physical activity status in children and adolescents. J. Res. Health Sci. 2019, 19, e00439. [Google Scholar]
- Finger, J.D.; Mensink, G.B.; Banzer, W.; Lampert, T.; Tylleskär, T. Physical activity, aerobic fitness and parental socio-economic position among adolescents: The German Health Interview and Examination Survey for Children and Adolescents 2003–2006 (KiGGS). Int. J. Behav. Nutr. Phys. Act. 2014, 11, 43. [Google Scholar] [CrossRef] [Green Version]
- Erkelenz, N.; Schreiber, A.C.; Kobel, S.; Kettner, S.; Drenowatz, C.; Steinacker, J.M. Relationship of parental health-related behaviours and physical fitness in girls and boys. J. Public Health 2014, 22, 407–414. [Google Scholar] [CrossRef] [Green Version]
- López, G.G.; Román-Viñas, B.; Ruiz, E.S. Physical fitness in Catalan children in relation to parental tobacco use and other associated factors. Apunts. Medicina de l’Esport 2019, 54, 119–129. [Google Scholar]
- Tian, Y.; Liu, L.; Wang, X.; Zhang, X.; Zhai, Y.; Wang, K.; Liu, J. Urban-Rural Differences in Physical Fitness and Out-of-School Physical Activity for Primary School Students: A County-Level Comparison in Western China. Int. J. Environ. Res. Public Health 2021, 18, 10813. [Google Scholar] [CrossRef] [PubMed]
- Zhang, S.; Luo, W.; Dong, X.; Chen, W.; Yi, X.; Zhou, W.; Zhao, Y. A Dataset on the Status Quo of Health and Health-Related Behaviors of Chinese Youth: A Longitudinal Large-Scale Survey in the Secondary School Students of Shandong Province. Chin. Med. Sci. J. 2022, 37, 60–66. [Google Scholar]
- Shandong University. Database of Youth Health. Population Health Data Archive. Available online: https://www.ncmi.cn/phda/dataDetails.do?id=CSTR:17970.11.A0031.202107.209.V1.0 (accessed on 19 July 2022).
- Kowalski, K.C.; Crocker PR, E.; Donen, R.M. The physical activity questionnaire for older children (PAQ-C) and adolescents (PAQ-A) manual. Coll. Kinesiol. Univ. Sask. 2004, 87, 1–38. [Google Scholar]
- Adeniyi, A.F.; Okafor, N.C.; Adeniyi, C.Y. Depression and physical activity in a sample of nigerian adolescents: Levels, relationships and predictors. Child Adolesc. Psychiatry Ment. Health 2011, 5, 16. [Google Scholar] [CrossRef] [Green Version]
- Xiu, X.; Qian, Q.; Wu, S. Mental Health Problems and Associated Factors among High School Students in Shandong Province of China: A Cross-Sectional Study. Int. J. Environ. Res. Public Health 2022, 19, 8478. [Google Scholar] [CrossRef]
- Herforth, A.W.; Wiesmann, D.; Martínez-Steele, E.; Andrade, G.; Monteiro, C.A. Introducing a suite of low-burden diet quality indicators that reflect healthy diet patterns at population level. Curr. Dev. Nutr. 2020, 4, nzaa168. [Google Scholar] [CrossRef] [PubMed]
- Wang, H.; Herforth, A.W.; Xi, B.; Zou, Z. Validation of the Diet Quality Questionnaire in Chinese Children and Adolescents and Relationship with Pediatric Overweight and Obesity. Nutrients 2022, 14, 3551. [Google Scholar] [CrossRef]
- Ministry of Education of the People’s Republic of China. Notice of the Ministry of Education on the National Student Physical Fitness Standard (Revised 2014). Available online: http://www.moe.gov.cn/s78/A17/twys_left/moe_938/moe_792/s3273/201407/t20140708_171692.html (accessed on 19 July 2022).
- Yi, X.; Fu, Y.; Burns, R.D.; Bai, Y.; Zhang, P. Body mass index and physical fitness among Chinese adolescents from Shandong Province: A cross-sectional study. BMC Public Health 2019, 19, 81. [Google Scholar] [CrossRef]
- Cadenas-Sanchez, C.; Martinez-Tellez, B.; Sanchez-Delgado, G.; Mora-Gonzalez, J.; Castro-Piñero, J.; Löf, M.; Ortega, F.B. Assessing physical fitness in preschool children: Feasibility, reliability and practical recommendations for the PREFIT battery. J Sci. Med. Sport. 2016, 19, 910–915. [Google Scholar] [CrossRef]
- Zhu, Z.; Yang, Y.; Kong, Z.; Zhang, Y.; Zhuang, J. Prevalence of physical fitness in Chinese school-aged children: Findings from the 2016 Physical Activity and Fitness in China—The Youth Study. J. Sport Health Sci. 2017, 6, 395–403. [Google Scholar] [CrossRef]
- Xin, F.; Zhu, Z.; Chen, S.; Chen, H.; Hu, X.; Ma, X.; Tang, Y. Prevalence and correlates of meeting the muscle-strengthening exercise recommendations among Chinese children and adolescents: Results from 2019 Physical Activity and Fitness in China—The Youth Study. J. Sport Health Sci. 2022, 11, 358–366. [Google Scholar] [CrossRef]
- Zahra, J.; Sebire, S.J.; Jago, R. “He’s probably more Mr. sport than me”—A qualitative exploration of mothers’ perceptions of fathers’ role in their children’s physical activity. BMC Pediatr. 2015, 15, 101. [Google Scholar] [CrossRef] [PubMed] [Green Version]
- Ruedl, G.; Niedermeier, M.; Wimmer, L.; Ploner, V.; Pocecco, E.; Cocca, A.; Greier, K. Impact of Parental Education and Physical Activity on the Long-Term Development of the Physical Fitness of Primary School Children: An Observational Study. Int. J. Environ. Res. Public Health 2021, 18, 8736. [Google Scholar] [CrossRef] [PubMed]
- Muñoz-Galiano, I.M.; Connor, J.D.; Gómez-Ruano, M.A.; Torres-Luque, G. Influence of the parental educational level on physical activity in schoolchildren. Sustainability 2020, 12, 3920. [Google Scholar] [CrossRef]
- Lin, X. “Purchasing hope”: The consumption of children’s education in urban China. J. Chin. Sociol. 2019, 6, 8. [Google Scholar] [CrossRef] [Green Version]
- Qin, W.; Wang, L.; Xu, L.; Sun, L.; Li, J.; Zhang, J.; Shao, H. An exploratory spatial analysis of overweight and obesity among children and adolescents in Shandong, China. BMJ Open 2019, 9, e028152. [Google Scholar] [CrossRef] [PubMed] [Green Version]
- Wang, Z.; Dang, J.; Zhang, X.; Moore, J.B.; Li, R. Assessing the relationship between weight stigma, stress, depression, and sleep in Chinese adolescents. Qual. Life Res. 2021, 30, 229–238. [Google Scholar] [CrossRef]
- Song, L.; Zhang, Y.; Chen, T.; Maitusong, P.; Lian, X. Association of body perception and dietary weight management behaviours among children and adolescents aged 6–17 years in China: Cross-sectional study using CHNS (2015). BMC Public Health 2022, 22, 175. [Google Scholar] [CrossRef] [PubMed]
- Delgado-Floody, P.; Alvarez, C.; Caamaño-Navarrete, F.; Jerez-Mayorga, D.; Latorre-Román, P. Influence of Mediterranean diet adherence, physical activity patterns, and weight status on cardiovascular response to cardiorespiratory fitness test in Chilean school children. Nutrition 2020, 71, 110621. [Google Scholar] [CrossRef]
- Ramdath, D.D.; Padhi EM, T.; Sarfaraz, S.; Renwick, S.; Duncan, A.M. Beyond the cholesterol-lowering effect of soy protein: A review of the effects of dietary soy and its constituents on risk factors for cardiovascular disease. Nutrients 2017, 9, 324. [Google Scholar] [CrossRef] [PubMed] [Green Version]
- Wang, X.; He, T.; Xu, S.; Li, H.; Wu, M.; Lin, Z.; Zhu, Y. Soy Food Intake Associated with Obesity and Hypertension in Children and Adolescents in Guangzhou, Southern China. Nutrients 2022, 14, 425. [Google Scholar] [CrossRef]
- Duellman, M.C.; Lukaszuk, J.M.; Prawitz, A.D.; Brandenburg, J.P. Protein supplement users among high school athletes have misconceptions about effectiveness. J. Strength Cond. Res. 2008, 22, 1124–1129. [Google Scholar] [CrossRef] [PubMed]
- Zurita-Ortega, F.; San Román-Mata, S.; Chacón-Cuberos, R.; Castro-Sánchez, M.; Muros, J.J. Adherence to the mediterranean diet is associated with physical activity, self-concept and sociodemographic factors in university student. Nutrients 2018, 10, 966. [Google Scholar] [CrossRef] [PubMed] [Green Version]


| Category | Test Indicator | Description | Scoring Criteria | Weight |
|---|---|---|---|---|
| Body Shape | Body Mass Index (BMI) | BMI scores are calculated as weight in kilograms divided by squared height in meters (kg/m2). Participants’ height (cm) is measured to the nearest 0.1 cm barefoot, and weight (kg) is examined to the nearest 0.1 kg by GMCS-IV (Jianmin, Beijing, China). | Normal = 100 Underweight = 80 Overweight = 80 Obese = 60 | 15% |
| Cardiorespiratory Fitness (CRF) | Vital Capacity (VC) | VC refers to the amount of air that the lungs can expel after having been filled completely and is measured with spirometry. | Excellent: 90–100 Good: 80–85 Pass: 60–78 Fail: ≤50 | 15% |
| Motor Fitness | 50 m Sprint | The test requires students to start from a uniform starting point and records the time it takes for the student to run 50 m. Performance is recorded to the nearest 0.1 s. | Excellent: 90–100 Good: 80–85 Pass: 60–78 Failed: ≤50 | 20% |
| Flexibility Fitness | Sit and Reach (SR) | SR reflects flexibility level of the lower body. Each participant performs the SR test twice, and the score for the farthest distance (measured to the nearest 0.1 cm) is recorded. | Excellent: 90–100 Good: 80–85 Pass: 60–78 Fail: ≤50 | 10% |
| Muscular Fitness | Standing Long Jump | To test the explosive power and physical coordination of the lower limbs, subjects are allowed to make three attempts. The longest distance (in cm) is recorded as the official score. | Excellent: 90–100 Good: 80–85 Pass: 60–78 Failed: ≤50 | 10% |
| Pull-ups/Boys | It indicates the upper body muscular endurance of the boys. The final score is recorded as the number of successful repetitions completed. | Excellent: 90–100 Good: 80–85 Pass: 60–78 Fail: ≤50 | 10% | |
| Endurance Fitness | 1-Minute Sit-Up (SU)/Girls | This is performed to assess the abdominal muscular endurance of the girls. The test instructs participants to perform sit-ups as many times as possible for one minute. The final score is recorded as the number of successful repetitions completed. | Excellent: 90–100 Good: 80–85 Pass: 60–78 Fail: ≤50 | 10% |
| 1000 m/800 m Run | To test the participants’ endurance fitness, boys and girls are instructed to perform a 1000 m run and an 800 m run, respectively. Running performance is recorded to the nearest 0.1 s. | Excellent: 90–100 Good: 80–85 Pass: 60–78 Fail: ≤50 | 20% |
| Characteristics | N (%) or Mean ± SD | χ2/t | p | ||
|---|---|---|---|---|---|
| All | Boys | Girls | |||
| Gender | |||||
| Boys | 4332 (49.2) | ||||
| Girls | 4464 (50.8) | ||||
| Age | 14.32 ± 1.82 | 14.22 ± 1.80 | 14.41 ± 1.84 | −4.83 | <0.001 |
| Place of residence | 1.24 | 0.265 | |||
| Urban | 4351 (49.5) | 2169 (50.1) | 2182 (48.9) | ||
| Rural | 4445 (50.5) | 2163 (49.9) | 2282 (51.1) | ||
| Father’s education level | 6.80 | 0.033 | |||
| Junior high school and below | 5563 (63.2) | 2684 (62.0) | 2879 (64.5) | ||
| High school | 1695 (19.3) | 852 (19.7) | 843 (18.9) | ||
| University and above | 1538 (17.5) | 796 (18.4) | 742 (16.6) | ||
| Mother’s education level | 2.35 | 0.309 | |||
| Junior high school and below | 5925 (67.4) | 2890 (66.7) | 3035 (68.0) | ||
| High school | 1492 (17.0) | 738 (17.0) | 754 (16.9) | ||
| University and above | 1379 (15.7) | 704 (16.3) | 675 (15.1) | ||
| Family economic status | 20.15 | <0.001 | |||
| Poor | 1426 (16.2) | 757 (17.5) | 669 (15.0) | ||
| Middle | 6679 (75.9) | 3200 (73.9) | 3479 (77.9) | ||
| Good | 691 (7.9) | 375 (8.7) | 316 (7.1) | ||
| PA | 119.42 | <0.001 | |||
| Inactive | 4205 (47.8) | 1815 (41.9) | 2390 (53.5) | ||
| Active | 4591 (52.2) | 2517 (58.1) | 2074 (46.5) | ||
| Diet | |||||
| GDR-Limit score | 16.42 ± 6.16 | 16.86 ± 6.53 | 16.00 ± 5.75 | 6.49 | <0.001 |
| GDR-Healthy score | 23.91 ± 5.63 | 24.31 ± 5.79 | 23.53 ± 5.44 | 6.45 | <0.001 |
| Overall GDR score | 7.49 ± 6.63 | 7.45 ± 6.82 | 7.53 ± 6.45 | −0.56 | <0.001 |
| Physical Fitness Score | 75.67 ± 10.94 | 73.94 ± 11.96 | 77.34 ± 9.56 | −14.68 | <0.001 |
| Height level classification | 116.53 | <0.001 | |||
| High | 3826 (43.5) | 1670 (38.6) | 2156 (48.3) | ||
| Middle | 4691 (53.3) | 2467 (56.9) | 2224 (49.8) | ||
| Short | 279 (3.2) | 195 (4.5) | 84 (1.9) | ||
| BMI classification | 49.02 | <0.001 | |||
| Obese | 951 (10.8) | 553 (12.8) | 398 (8.9) | ||
| Overweight | 1187 (13.5) | 632 (14.6) | 555 (12.4) | ||
| Normal | 6177(70.2) | 2910 (67.2) | 3267 (73.2) | ||
| Under-weight | 481 (5.5) | 237 (5.5) | 244 (5.5) | ||
| VC score | 81.54 ± 17.26 | 79.49 ± 17.52 | 83.53 ± 16.77 | −11.05 | 0.131 |
| 50 m Sprint score | 77.27 ± 18.07 | 78.88 ± 18.56 | 75.70 ± 17.43 | 8.26 | <0.001 |
| SR score | 73.83 ± 17.70 | 74.31 ± 17.10 | 73.36 ± 18.26 | 2.51 | 0.015 |
| Standing Long Jump score | 72.04 ± 19.46 | 70.90 ± 20.36 | 73.15 ± 18.47 | −5.41 | <0.001 |
| Pull-ups score | 42.05 ± 35.76 | ||||
| 1-Minute SU score | 69.99 ± 17.95 | ||||
| 1000 m Run score | 69.43 ± 24.11 | ||||
| 800 m Run score | 70.46 ± 20.89 | ||||
| Age | Heigh (cm) | Body Mass Index | Vital Capacity (mL) | 50 m Sprint (s) | Sit and Reach (cm) | Standing Long Jump (cm) | Pull-ups (n) | 1-Minute Sit-Up (n) | 1000 m Run (min) | 800 m Run (min) |
|---|---|---|---|---|---|---|---|---|---|---|
| Boys | ||||||||||
| 11 | 156.66 ± 8.74 | 21.17 ± 4.59 | 2292.06 ± 724.77 | 9.31 ± 1.43 | 5.46 ± 7.13 | 164.30 ± 23.38 | 3.27 ± 6.91 | 5.13 ± 1.07 | ||
| 12 | 161.10 ± 8.36 | 20.43 ± 3.98 | 2771.85 ± 829.97 | 8.90 ± 1.11 | 7.96 ± 9.55 | 178.55 ± 27.02 | 4.75 ± 7.04 | 4.95 ± 0.99 | ||
| 13 | 166.30 ± 8.39 | 20.62 ± 4.21 | 3056.03 ± 881.19 | 8.67 ± 1.13 | 9.01 ± 9.12 | 187.71 ± 27.81 | 4.36 ± 5.53 | 4.78 ± 1.06 | ||
| 14 | 169.20 ± 7.79 | 20.15 ± 3.86 | 3286.94 ± 785.87 | 8.29 ± 1.02 | 9.40 ± 7.91 | 201.60 ± 27.37 | 4.80 ± 5.45 | 4.45 ± 0.84 | ||
| 15 | 172.04 ± 7.40 | 20.49 ± 3.74 | 3596.83 ± 891.85 | 7.96 ± 0.87 | 10.54 ± 7.07 | 211.04 ± 26.46 | 5.75 ± 5.37 | 4.22 ± 0.66 | ||
| 16 | 175.44 ± 5.80 | 21.05 ± 3.58 | 3976.45 ± 1013.95 | 7.62 ± 0.69 | 11.80 ± 6.72 | 222.90 ± 23.92 | 9.19 ± 6.48 | 3.86 ± 0.57 | ||
| 17 | 176.60 ± 5.25 | 21.19 ± 3.24 | 4083.37 ± 1066.03 | 7.53 ± 0.65 | 13.28 ± 6.36 | 232.28 ± 22.56 | 12.25 ± 6.33 | 3.63 ± 0.41 | ||
| 18 | 176.51 ± 5.63 | 21.16 ± 3.52 | 4094.23 ± 1035.41 | 7.58 ± 0.60 | 12.41 ± 6.54 | 231.54 ± 21.42 | 11.20 ± 6.38 | 3.76 ± 0.53 | ||
| Girls | ||||||||||
| 11 | 156.72 ± 7.33 | 19.98 ± 3.99 | 2292.06 ± 724.77 | 9.42 ± 1.11 | 7.76 ± 8.13 | 155.02 ± 23.82 | 31.96 ± 10.66 | 4.35 ± 0.72 | ||
| 12 | 159.28 ± 6.66 | 19.75 ± 3.63 | 2771.85 ± 829.97 | 9.39 ± 1.22 | 11.24 ± 7.75 | 161.58 ± 21.82 | 29.46 ± 10.85 | 4.30 ± 0.71 | ||
| 13 | 161.74 ± 5.89 | 19.90 ± 3.59 | 3056.03 ± 881.19 | 9.36 ± 1.17 | 12.69 ± 9.18 | 164.54 ± 22.03 | 30.34 ± 10.10 | 4.25 ± 0.67 | ||
| 14 | 163.09 ± 5.73 | 19.90 ± 3.51 | 3286.94 ± 785.87 | 9.30 ± 1.09 | 12.78 ± 7.81 | 165.84 ± 22.38 | 31.44 ± 9.83 | 4.17 ± 0.79 | ||
| 15 | 163.17 ± 5.34 | 20.41 ± 3.13 | 3596.83 ± 891.85 | 9.17 ± 1.00 | 13.82 ± 7.49 | 168.29 ± 20.96 | 33.81 ± 9.68 | 3.97 ± 0.56 | ||
| 16 | 164.67 ± 5.12 | 20.12 ± 2.88 | 3976.45 ± 1013.95 | 8.67± 0.93 | 14.60 ± 6.74 | 176.63 ± 18.06 | 39.18 ± 10.40 | 3.78 ± 0.48 | ||
| 17 | 164.73 ± 4.91 | 20.07 ± 2.82 | 4083.37 ± 1066.03 | 8.62 ± 0.92 | 15.16 ± 6.45 | 178.73 ± 16.90 | 39.45 ± 9.71 | 3.66 ± 0.38 | ||
| 18 | 164.04 ± 4.71 | 20.45 ± 2.81 | 4094.23 ± 1035.41 | 8.85 ± 0.94 | 15.61 ± 5.85 | 176.75 ± 17.45 | 39.24 ± 10.29 | 3.69 ± 0.42 |
| Categories | All | Boys | Girls | |||
|---|---|---|---|---|---|---|
| B | OR (95% CI) | B | OR (95% CI) | B | OR (95% CI) | |
| Gender | ||||||
| Boys | 0 a | 1.0 (Referent) | ||||
| Girls | 3.27 | 26.38 (16.97, 41.01) *** | ||||
| Age | 1.46 | 4.29 (3.80, 4.85) *** | 1.88 | 6.56 (5.41, 7.94) *** | 1.07 | 2.92 (2.50, 3.40) *** |
| Place of Residence | ||||||
| Urban | 0 a | 1.0 (Referent) | 0 a | 1.0 (Referent) | 0 a | 1.0 (Referent) |
| Rural | 1.44 | 4.24 (2.66, 6.75) *** | 2.08 | 8.00 (3.89, 16.45) *** | 0.77 | 2.15 (1.19, 3.87) * |
| Father’s educational level | ||||||
| Junior high school and below | 0 a | 1.0 (Referent) | 0 a | 1.0 (Referent) | 0 a | 1.0 (Referent) |
| High school | −0.054 | 0.95 (0.50, 1.78) | 0.039 | 1.04 (0.39, 2.76) | −0.31 | 0.74 (0.33, 1.65) |
| University and above | 1.20 | 3.30 (1.51, 7.23) ** | 1.47 | 4.36 (1.32, 14.36) * | 0.88 | 2.42 (0.89, 6.61) |
| Mother’s educational level | ||||||
| Junior high school and below | 0 a | 1.0 (Referent) | 0 a | 1.0 (Referent) | 0 a | 1.0 (Referent) |
| High school | −0.64 | 0.53 (0.27, 1.02) | −0.81 | 0.45 (0.16, 1.25) | −0.38 | 0.69 (0.30, 1.59) |
| University and above | −0.25 | 0.78 (0.35, 1.77) | −1.52 | 0.22 (0.063, 0.76) * | 0.94 | 2.57 (0.90, 7.31) |
| Family economic status | ||||||
| Poor | 0 a | 1.0 (Referent) | 0 a | 1.0 (Referent) | 0 a | 1.0 (Referent) |
| Middle | 0.33 | 1.39 (0.76, 2.55) | 0.28 | 1.32 (0.53, 3.30) | 0.37 | 1.45 (0.66, 3.16) |
| Good | 0.41 | 1.51 0.57, 3.98) | 1.25 | 3.48 (0.82, 14.74) | −0.66 | 0.52 (0.14, 1.87) |
| PA | ||||||
| Inactive | 0 a | 1.0 (Referent) | 0 a | 1.0 (Referent) | 0 a | 1.0 (Referent) |
| Active | 0.99 | 2.69 (1.72, 4.20) *** | 1.12 | 3.06 (1.53, 6.13) ** | 0.77 | 2.15 (1.23, 3.77) ** |
| Diet | ||||||
| GDR-Limit score | 0.027 | 1.03 (0.99, 1.07) | 0.023 | 1.02 (0.97, 1.09) | 0.024 | 1.02 (0.97, 1.08) |
| GDR-Healthy score | 0.023 | 1.02 (0.98, 1.07) | 0.013 | 1.01 (0.95, 1.08) | 0.028 | 1.03 (0.97, 1.09) |
| PF Test | DP | All | Boys | Girls | |||
|---|---|---|---|---|---|---|---|
| Model 1 | Model 2 | Model 1 | Model 2 | Model 1 | Model 2 | ||
| Body Mass Index | DP1 | 1.06 (0.97, 1.15) | 1.06 (0.97, 1.15) | 1.01 (0.89, 1.14) | 1.01 (0.89, 1.14) | 1.12 (1.00, 1.26) | 1.12 (1.001, 1.26) * |
| DP2 | 0.84 (0.74, 0.94) ** | 0.84 (0.75, 0.95) ** | 0.84 (0.70, 1.01) | 0.85 (0.71, 1.02) | 0.84 (0.72, 0.97) * | 0.84 (0.72, 0.98) * | |
| DP3 | 1.06 (0.96, 1.18) | 1.08 (0.97, 1.19) | 1.13 (0.97, 1.32) | 1.15 (0.98, 1.34) | 0.99 (0.86, 1.14) | 1.00 (0.87, 1.16) | |
| DP4 | 1.09 (0.96, 1.23) | 1.08 (0.96, 1.22) | 1.06 (0.88, 1.28) | 1.05 (0.87, 1.27) | 1.12 (0.96, 1.30) | 1.11 (0.96, 1.30) | |
| Vital Capacity score | DP1 | 0.90 (0.60, 1.35) | 0.90 (0.60, 1.35) | 0.56 (0.31, 0.98) * | 0.56 (0.32, 0.98) * | 1.51 (0.84, 2.71) | 1.50 (0.84, 2.68) |
| DP2 | 1.09 (0.62, 1.92) | 1.10 (0.62, 1.94) | 1.01 (0.44, 2.31) | 1.05 (0.46, 2.41) | 1.14 (0.53, 2.47) | 1.12 (0.52, 2.43) | |
| DP3 | 0.89 (0.54, 1.47) | 0.91 (0.55, 1.50) | 1.37 (0.68, 2.76) | 1.48 (0.73, 2.99) | 0.57 (0.28, 1.16) | 0.56 (0.28, 1.14) | |
| DP4 | 0.82 (0.46, 1.45) | 0.81 (0.46, 1.44) | 1.03 (0.44, 2.40) | 1.00 (0.43, 2.32) | 0.67 (0.31, 1.46) | 0.67 (0.31, 1.47) | |
| 50 m Sprint score | DP1 | 1.03 (0.67, 1.57) | 1.02 (0.67, 1.56) | 0.75 (0.41, 1.36) | 0.75 (0.41, 1.36) | 1.51 (0.83, 2.76) | 1.49 (0.82, 2.73) |
| DP2 | 1.40 (0.77, 2.53) | 1.36 (0.75, 2.46) | 1.64 (0.68, 3.94) | 1.59 (0.66, 3.82) | 1.19 (0.54, 2.65) | 1.17 (0.52, 2.60) | |
| DP3 | 2.03 (1.20, 3.42) ** | 1.94 (1.15, 3.28) * | 1.81 (0.86, 3.79) | 1.70 (0.81, 3.58) | 2.37 (1.14, 4.95) * | 2.31 (1.11, 4.84) * | |
| DP4 | 0.96 (0.53, 1.75) | 0.97 (0.54, 1.77) | 0.75 (0.31, 1.82) | 0.77 (0.31, 1.87) | 1.23 (0.55, 2.76) | 1.23 (0.55, 2.76) | |
| Sit and Reach score | DP1 | 1.14 (0.75, 1.73) | 1.13 (0.74, 1.71) | 1.27 (0.73, 2.20) | 1.26 (0.73, 2.19) | 0.94 (0.50, 1.78) | 0.93 (0.49, 1.75) |
| DP2 | 2.36 (1.32, 4.23) ** | 2.28 (1.28, 4.08) ** | 3.03 (1.36, 6.77) ** | 2.90 (1.30, 6.49) ** | 2.00 (0.87, 4.63) | 1.94 (0.84, 4.50) | |
| DP3 | 0.64 (0.39, 1.07) | 0.61 (0.36, 1.02) | 0.79 (0.40, 1.55) | 0.73 (0.37, 1.44) | 0.52 (0.24, 1.13) | 0.50 (0.23, 1.09) | |
| DP4 | 0.60 (0.33, 1.08) | 0.61 (0.34, 1.09) | 0.34 (0.15, 0.76) ** | 0.35 (0.15, 0.79) * | 1.04 (0.45, 2.42) | 1.04 (0.45, 2.42) | |
| Standing Long Jump score | DP1 | 0.78 (0.49, 1.23) | 0.77 (0.48, 1.21) | 0.53 (0.27, 1.02) | 0.53 (0.27, 1.01) | 1.19 (0.63, 2.24) | 1.13 (0.60, 2.14) |
| DP2 | 1.65 (0.87, 3.12) | 1.54 (0.81, 2.91) | 1.85 (0.71, 4.82) | 1.74 (0.67, 4.55) | 1.41 (0.61, 3.28) | 1.30 (0.56, 3.02) | |
| DP3 | 1.37 (0.78, 2.40) | 1.23 (0.70, 2.16) | 1.05 (0.47, 2.36) | 0.94 (0.42, 2.13) | 1.99 (0.92, 4.32) | 1.79 (0.83, 3.91) | |
| DP4 | 0.62 (0.33, 1.18) | 0.64 (0.34, 1.22) | 0.82 (0.31, 2.18) | 0.86 (0.33, 2.28) | 0.49 (0.21, 1.14) | 0.49 (0.21, 1.15) | |
| 1000 m Run score | DP1 | 1.36 (0.64, 2.91) | 1.36 (0.64, 2.89) | ||||
| DP2 | 1.88 (0.62, 5.70) | 1.66 (0.55, 5.04) | |||||
| DP3 | 0.87 (0.34, 2.22) | 0.69 (0.27, 1.79) | |||||
| DP4 | 0.54(0.18, 1.67) | 0.60 (0.19, 1.84) | |||||
| Pull-ups score | DP1 | 0.92 (0.79, 1.07) | 0.92 (0.79, 1.07) | ||||
| DP2 | 0.91 (0.78, 1.07) | 0.92 (0.78, 1.08) | |||||
| DP3 | 1.15 (1.04, 1.27) ** | 1.18 (1.06, 1.30) ** | |||||
| DP4 | 1.05 (0.96, 1.14) | 1.04 (0.96, 1.14) | |||||
| 800 m Runscore | DP1 | 0.67 (0.33, 1.36) | 0.65 (0.32, 1.32) | ||||
| DP2 | 1.66 (0.65, 4.27) | 1.57 (0.61, 4.04) | |||||
| DP3 | 1.35 (0.57, 3.20) | 1.25 (0.53, 2.99) | |||||
| DP4 | 0.87 (0.34, 2.25) | 0.87 (0.34, 2.26) | |||||
| 1-Minute Sit-Upscore | DP1 | 1.27 (0.69, 2.34) | 1.27 (0.69, 2.34) | ||||
| DP2 | 1.14 (0.51, 2.56) | 1.14 (0.51, 2.57) | |||||
| DP3 | 1.27 (0.61, 2.67) | 1.28 (0.61, 2.69) | |||||
| DP4 | 0.60 (0.27, 1.35) | 0.60 (0.26, 1.35) |
Disclaimer/Publisher’s Note: The statements, opinions and data contained in all publications are solely those of the individual author(s) and contributor(s) and not of MDPI and/or the editor(s). MDPI and/or the editor(s) disclaim responsibility for any injury to people or property resulting from any ideas, methods, instructions or products referred to in the content. |
© 2023 by the authors. Licensee MDPI, Basel, Switzerland. This article is an open access article distributed under the terms and conditions of the Creative Commons Attribution (CC BY) license (https://creativecommons.org/licenses/by/4.0/).
Share and Cite
Wu, S.; Xiu, X.; Qian, Q. Associations between Dietary Patterns and Physical Activity with Physical Fitness among Adolescents in Shandong Province, China: A Cross-Sectional Study. Nutrients 2023, 15, 1425. https://doi.org/10.3390/nu15061425
Wu S, Xiu X, Qian Q. Associations between Dietary Patterns and Physical Activity with Physical Fitness among Adolescents in Shandong Province, China: A Cross-Sectional Study. Nutrients. 2023; 15(6):1425. https://doi.org/10.3390/nu15061425
Chicago/Turabian StyleWu, Sizhu, Xiaolei Xiu, and Qing Qian. 2023. "Associations between Dietary Patterns and Physical Activity with Physical Fitness among Adolescents in Shandong Province, China: A Cross-Sectional Study" Nutrients 15, no. 6: 1425. https://doi.org/10.3390/nu15061425