
The Geriatric Nutritional Risk Index (GNRI) as a Prognostic Biomarker for Immune Checkpoint Inhibitor Response in Recurrent and/or Metastatic Head and Neck Cancer
 , , , , ,
Abstract
:1. Introduction
2. Materials and Methods
2.1. Study Population and Study Design
2.2. Score Calculation
2.3. Statistical Analysis
3. Results
3.1. Patient Characteristics and Demographics
3.2. Survival
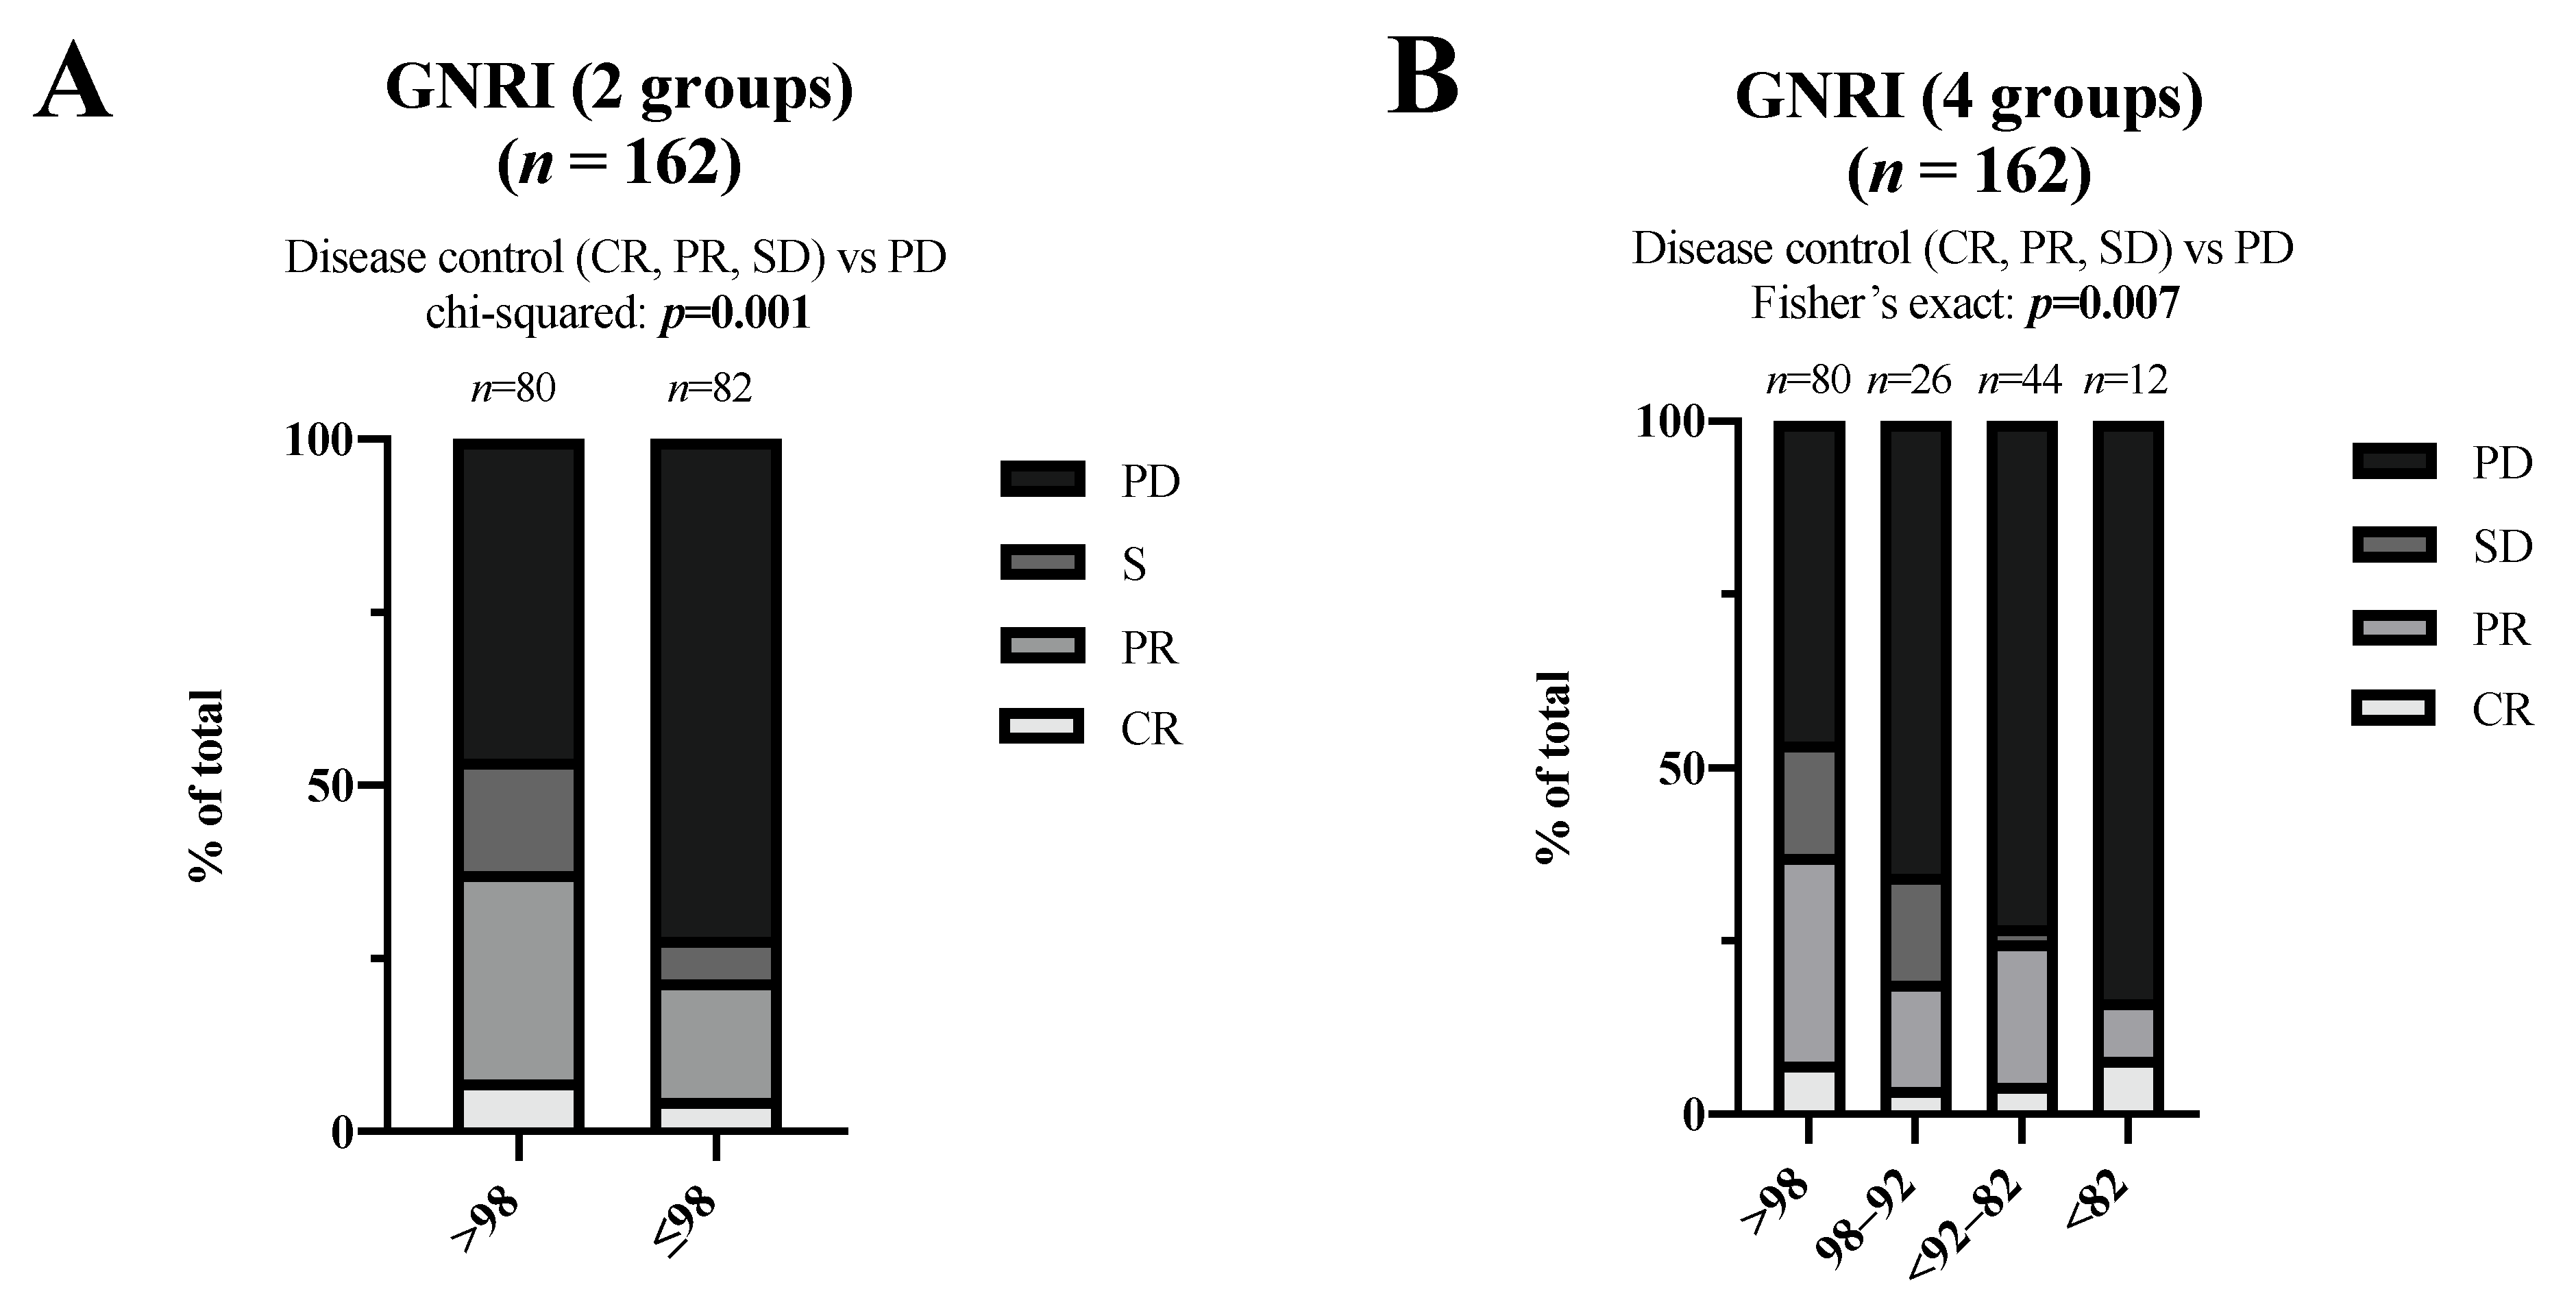
3.3. Best Overall Response
4. Discussion
Author Contributions
Funding
Institutional Review Board Statement
Informed Consent Statement
Data Availability Statement
Conflicts of Interest
Abbreviations
References
- Sung, H.; Ferlay, J.; Siegel, R.L.; Laversanne, M.; Soerjomataram, I.; Jemal, A.; Bray, F. Global Cancer Statistics 2020: GLOBOCAN Estimates of Incidence and Mortality Worldwide for 36 Cancers in 185 Countries. CA Cancer J. Clin. 2021, 71, 209–249. [Google Scholar] [CrossRef] [PubMed]
- Bressan, V.; Stevanin, S.; Bianchi, M.; Aleo, G.; Bagnasco, A.; Sasso, L. The effects of swallowing disorders, dysgeusia, oral mucositis and xerostomia on nutritional status, oral intake and weight loss in head and neck cancer patients: A systematic review. Cancer Treat. Rev. 2016, 45, 105–119. [Google Scholar] [CrossRef] [PubMed]
- Przekop, Z.; Szostak-Węgierek, D.; Milewska, M.; Panczyk, M.; Zaczek, Z.; Sobocki, J. Efficacy of the Nutritional Risk Index, Geriatric Nutritional Risk Index, BMI, and GLIM-Defined Malnutrition in Predicting Survival of Patients with Head and Neck Cancer Patients Qualified for Home Enteral Nutrition. Nutrients 2022, 14, 1268. [Google Scholar] [CrossRef] [PubMed]
- Müller-Richter, U.; Betz, C.; Hartmann, S.; Brands, R.C. Nutrition management for head and neck cancer patients improves clinical outcome and survival. Nutr. Res. 2017, 48, 1–8. [Google Scholar] [CrossRef] [PubMed]
- Burtness, B.; Harrington, K.J.; Greil, R.; Soulières, D.; Tahara, M.; de Castro, G., Jr.; Psyrri, A.; Basté, N.; Neupane, P.; Bratland, Å.; et al. Pembrolizumab alone or with chemotherapy versus cetuximab with chemotherapy for recurrent or metastatic squamous cell carcinoma of the head and neck (KEYNOTE-048): A randomised, open-label, phase 3 study. Lancet 2019, 394, 1915–1928. [Google Scholar] [CrossRef]
- Ferris, R.L.; Blumenschein, G., Jr.; Fayette, J.; Guigay, J.; Colevas, A.D.; Licitra, L.; Harrington, K.; Kasper, S.; Vokes, E.E.; Even, C.; et al. Nivolumab for Recurrent Squamous-Cell Carcinoma of the Head and Neck. N. Engl. J. Med. 2016, 375, 1856–1867. [Google Scholar] [CrossRef]
- Cohen, E.E.W.; Bell, R.B.; Bifulco, C.B.; Burtness, B.; Gillison, M.L.; Harrington, K.J.; Le, Q.T.; Lee, N.Y.; Leidner, R.; Lewis, R.L.; et al. The Society for Immunotherapy of Cancer consensus statement on immunotherapy for the treatment of squamous cell carcinoma of the head and neck (HNSCC). J. Immunother. Cancer 2019, 7, 184. [Google Scholar] [CrossRef]
- Szczyrek, M.; Bitkowska, P.; Chunowski, P.; Czuchryta, P.; Krawczyk, P.; Milanowski, J. Diet, Microbiome, and Cancer Immunotherapy-A Comprehensive Review. Nutrients 2021, 13, 2217. [Google Scholar] [CrossRef]
- Muscaritoli, M.; Arends, J.; Bachmann, P.; Baracos, V.; Barthelemy, N.; Bertz, H.; Bozzetti, F.; Hütterer, E.; Isenring, E.; Kaasa, S.; et al. ESPEN practical guideline: Clinical Nutrition in cancer. Clin. Nutr. 2021, 40, 2898–2913. [Google Scholar] [CrossRef]
- Bouillanne, O.; Morineau, G.; Dupont, C.; Coulombel, I.; Vincent, J.P.; Nicolis, I.; Benazeth, S.; Cynober, L.; Aussel, C. Geriatric Nutritional Risk Index: A new index for evaluating at-risk elderly medical patients. Am. J. Clin. Nutr. 2005, 82, 777–783. [Google Scholar] [CrossRef] [Green Version]
- Lu, W.; Shen, J.; Zou, D.; Li, P.; Liu, X.; Jian, Y. Predictive role of preoperative geriatric nutritional risk index for clinical outcomes in surgical gastric cancer patients: A meta-analysis. Front. Surg. 2022, 9, 1020482. [Google Scholar] [CrossRef] [PubMed]
- Yamagata, K.; Fukuzawa, S.; Uchida, F.; Terada, K.; Ishibashi-Kanno, N.; Bukawa, H. Does the geriatric nutrition risk index predict the prognosis of patients with oral squamous cell carcinoma? Br. J. Oral Maxillofac. Surg. 2022, 60, 475–481. [Google Scholar] [CrossRef] [PubMed]
- Shen, F.; Ma, Y.; Guo, W.; Li, F. Prognostic Value of Geriatric Nutritional Risk Index for Patients with Non-Small Cell Lung Cancer: A Systematic Review and Meta-Analysis. Lung 2022, 200, 661–669. [Google Scholar] [CrossRef]
- Nakayama, M.; Gosho, M.; Adachi, M.; Ii, R.; Matsumoto, S.; Miyamoto, H.; Hirose, Y.; Nishimura, B.; Tanaka, S.; Wada, T.; et al. The Geriatric Nutritional Risk Index as a Prognostic Factor in Patients with Advanced Head and Neck Cancer. Laryngoscope 2021, 131, e151–e156. [Google Scholar] [CrossRef]
- Roerecke, M.; Kaczorowski, J.; Tobe, S.W.; Gmel, G.; Hasan, O.S.M.; Rehm, J. The effect of a reduction in alcohol consumption on blood pressure: A systematic review and meta-analysis. Lancet Public Health 2017, 2, e108–e120. [Google Scholar] [CrossRef] [PubMed]
- Eisenhauer, E.A.; Therasse, P.; Bogaerts, J.; Schwartz, L.H.; Sargent, D.; Ford, R.; Dancey, J.; Arbuck, S.; Gwyther, S.; Mooney, M.; et al. New response evaluation criteria in solid tumours: Revised RECIST guideline (version 1.1). Eur. J. Cancer 2009, 45, 228–247. [Google Scholar] [CrossRef]
- Ng, W.L.; Collins, P.F.; Hickling, D.F.; Bell, J.J. Evaluating the concurrent validity of body mass index (BMI) in the identification of malnutrition in older hospital inpatients. Clin. Nutr. 2019, 38, 2417–2422. [Google Scholar] [CrossRef]
- Akaike, H. A new look at the statistical model identification. IEEE Trans. Autom. Control 1974, 19, 716–723. [Google Scholar] [CrossRef]
- Kubrak, C.; Martin, L.; Gramlich, L.; Scrimger, R.; Jha, N.; Debenham, B.; Chua, N.; Walker, J.; Baracos, V.E. Prevalence and prognostic significance of malnutrition in patients with cancers of the head and neck. Clin. Nutr. 2020, 39, 901–909. [Google Scholar] [CrossRef]
- Bwakura-Dangarembizi, M.; Amadi, B.; Bourke, C.D.; Robertson, R.C.; Mwapenya, B.; Chandwe, K.; Kapoma, C.; Chifunda, K.; Majo, F.; Ngosa, D.; et al. Health Outcomes, Pathogenesis and Epidemiology of Severe Acute Malnutrition (HOPE-SAM): Rationale and methods of a longitudinal observational study. BMJ. Open 2019, 9, e023077. [Google Scholar] [CrossRef] [Green Version]
- Kono, T.; Sakamoto, K.; Shinden, S.; Ogawa, K. Pre-therapeutic nutritional assessment for predicting severe adverse events in patients with head and neck cancer treated by radiotherapy. Clin. Nutr. 2017, 36, 1681–1685. [Google Scholar] [CrossRef] [PubMed]
- Cederholm, T.; Bosaeus, I.; Barazzoni, R.; Bauer, J.; Van Gossum, A.; Klek, S.; Muscaritoli, M.; Nyulasi, I.; Ockenga, J.; Schneider, S.M.; et al. Diagnostic criteria for malnutrition—An ESPEN Consensus Statement. Clin. Nutr. 2015, 34, 335–340. [Google Scholar] [CrossRef] [PubMed]
- Indini, A.; Rijavec, E.; Ghidini, M.; Tomasello, G.; Cattaneo, M.; Barbin, F.; Bareggi, C.; Galassi, B.; Gambini, D.; Grossi, F. Impact of BMI on Survival Outcomes of Immunotherapy in Solid Tumors: A Systematic Review. Int. J. Mol. Sci. 2021, 22, 2628. [Google Scholar] [CrossRef] [PubMed]
- Ichihara, E.; Harada, D.; Inoue, K.; Sato, K.; Hosokawa, S.; Kishino, D.; Watanabe, K.; Ochi, N.; Oda, N.; Hara, N.; et al. The impact of body mass index on the efficacy of anti-PD-1/PD-L1 antibodies in patients with non-small cell lung cancer. Lung Cancer 2020, 139, 140–145. [Google Scholar] [CrossRef]
- Donnelly, D.; Bajaj, S.; Yu, J.; Hsu, M.; Balar, A.; Pavlick, A.; Weber, J.; Osman, I.; Zhong, J. The complex relationship between body mass index and response to immune checkpoint inhibition in metastatic melanoma patients. J. Immunother. Cancer 2019, 7, 222. [Google Scholar] [CrossRef]
- Johannet, P.; Sawyers, A.; Qian, Y.; Kozloff, S.; Gulati, N.; Donnelly, D.; Zhong, J.; Osman, I. Baseline prognostic nutritional index and changes in pretreatment body mass index associate with immunotherapy response in patients with advanced cancer. J. Immunother. Cancer 2020, 8, e001674. [Google Scholar] [CrossRef]
- Zhang, X.; Rui, M.; Lin, C.; Li, Z.; Wei, D.; Han, R.; Ju, H.; Ren, G. The association between body mass index and efficacy of pembrolizumab as second-line therapy in patients with recurrent/metastatic head and neck squamous cell carcinoma. Cancer Med. 2022. [Google Scholar] [CrossRef]
- Baracos, V.E.; Martin, L.; Korc, M.; Guttridge, D.C.; Fearon, K.C.H. Cancer-associated cachexia. Nat. Revi. Dis. Primers 2018, 4, 17105. [Google Scholar] [CrossRef]
- Gupta, D.; Lis, C.G. Pretreatment serum albumin as a predictor of cancer survival: A systematic review of the epidemiological literature. Nutr. J. 2010, 9, 69. [Google Scholar] [CrossRef]
- Brkic, F.F.; Kadletz, L.; Jank, B.; Mayer, C.; Heiduschka, G.; Brunner, M. Impact of pretherapeutic neutrophil-to-lymphocyte ratio, serum albumin, body-mass index, and advanced lung cancer inflammation index on clinical outcome in sinonasal squamous cell carcinoma. J. Cranio-Maxillofac. Surg. 2020, 48, 33–37. [Google Scholar] [CrossRef]
- Turner, D.C.; Kondic, A.G.; Anderson, K.M.; Robinson, A.G.; Garon, E.B.; Riess, J.W.; Jain, L.; Mayawala, K.; Kang, J.; Ebbinghaus, S.W.; et al. Pembrolizumab Exposure-Response Assessments Challenged by Association of Cancer Cachexia and Catabolic Clearance. Clin. Cancer Res. 2018, 24, 5841–5849. [Google Scholar] [CrossRef] [PubMed]
- Guller, M.; Herberg, M.; Amin, N.; Alkhatib, H.; Maroun, C.; Wu, E.; Allen, H.; Zheng, Y.; Gourin, C.; Vosler, P.; et al. Nutritional Status as a Predictive Biomarker for Immunotherapy Outcomes in Advanced Head and Neck Cancer. Cancers 2021, 13, 5772. [Google Scholar] [PubMed]
- Karayama, M.; Inoue, Y.; Yoshimura, K.; Hozumi, H.; Suzuki, Y.; Furuhashi, K.; Fujisawa, T.; Enomoto, N.; Nakamura, Y.; Inui, N.; et al. Association of the Geriatric Nutritional Risk Index With the Survival of Patients With Non-Small Cell Lung Cancer After Nivolumab Therapy. J. Immunother. 2022, 45, 125–131. [Google Scholar] [CrossRef] [PubMed]
- Yamahara, K.; Mizukoshi, A.; Lee, K.; Ikegami, S. Pretherapeutic nutritional/inflammatory factors as predictors for survival of both early and advanced staged head and neck cancer patients. Auris Nasus Larynx 2021, 48, 731–737. [Google Scholar] [CrossRef] [PubMed]
- Spencer, C.N.; McQuade, J.L.; Gopalakrishnan, V.; McCulloch, J.A.; Vetizou, M.; Cogdill, A.P.; Khan, M.A.W.; Zhang, X.; White, M.G.; Peterson, C.B.; et al. Dietary fiber and probiotics influence the gut microbiome and melanoma immunotherapy response. Science 2021, 374, 1632–1640. [Google Scholar] [CrossRef]
- Soldati, L.; Di Renzo, L.; Jirillo, E.; Ascierto, P.A.; Marincola, F.M.; De Lorenzo, A. The influence of diet on anti-cancer immune responsiveness. J. Transl. Med. 2018, 16, 75. [Google Scholar] [CrossRef]
- Sonehara, K.; Tateishi, K.; Araki, T.; Komatsu, M.; Yamamoto, H.; Hanaoka, M. Prognostic value of the geriatric nutritional risk index among patients with previously treated advanced non-small cell lung cancer who subsequently underwent immunotherapy. Thorac. Cancer 2021, 12, 1366–1372. [Google Scholar] [CrossRef]
- Etani, T.; Naiki, T.; Sugiyama, Y.; Nagai, T.; Iida, K.; Noda, Y.; Shimizu, N.; Tasaki, Y.; Mimura, Y.; Okada, T.; et al. Low Geriatric Nutritional Risk Index as a Poor Prognostic Marker for Second-Line Pembrolizumab Treatment in Patients with Metastatic Urothelial Carcinoma: A Retrospective Multicenter Analysis. Oncology 2020, 98, 876–883. [Google Scholar] [CrossRef]
- Flint, T.R.; Fearon, D.T.; Janowitz, T. Connecting the Metabolic and Immune Responses to Cancer. Trends Mol. Med. 2017, 23, 451–464. [Google Scholar] [CrossRef]
- Flint, T.R.; Janowitz, T.; Connell, C.M.; Roberts, E.W.; Denton, A.E.; Coll, A.P.; Jodrell, D.I.; Fearon, D.T. Tumor-Induced IL-6 Reprograms Host Metabolism to Suppress Anti-tumor Immunity. Cell Metab. 2016, 24, 672–684. [Google Scholar] [CrossRef]
- Simpson, R.C.; Shanahan, E.R.; Batten, M.; Reijers, I.L.M.; Read, M.; Silva, I.P.; Versluis, J.M.; Ribeiro, R.; Angelatos, A.S.; Tan, J.; et al. Diet-driven microbial ecology underpins associations between cancer immunotherapy outcomes and the gut microbiome. Nat. Med. 2022, 28, 2344–2352. [Google Scholar] [CrossRef] [PubMed]
- Routy, B.; Le Chatelier, E.; Derosa, L.; Duong, C.P.M.; Alou, M.T.; Daillère, R.; Fluckiger, A.; Messaoudene, M.; Rauber, C.; Roberti, M.P.; et al. Gut microbiome influences efficacy of PD-1-based immunotherapy against epithelial tumors. Science 2018, 359, 91–97. [Google Scholar] [CrossRef] [PubMed]
- Dechaphunkul, T.; Arundon, T.; Raungkhajon, P.; Jiratrachu, R.; Geater, S.L.; Dechaphunkul, A. Benefits of immunonutrition in patients with head and neck cancer receiving chemoradiation: A phase II randomized, double-blind study. Clin. Nutr. 2022, 41, 433–440. [Google Scholar] [CrossRef] [PubMed]
- Ni, W.; Jiao, X.; Zou, H.; Jing, M.; Xia, M.; Zhu, S.; Li, L. Gut microbiome alterations in ICU patients with enteral nutrition-related diarrhea. Front. Microbiol. 2022, 13, 1051687. [Google Scholar] [CrossRef] [PubMed]
- Madnawat, H.; Welu, A.L.; Gilbert, E.J.; Taylor, D.B.; Jain, S.; Manithody, C.; Blomenkamp, K.; Jain, A.K. Mechanisms of Parenteral Nutrition-Associated Liver and Gut Injury. Nutr. Clin. Pract. 2020, 35, 63–71. [Google Scholar] [CrossRef] [Green Version]


| Total | GNRI (>98) No Risk | GNRI (≤98) at Risk | |||||
|---|---|---|---|---|---|---|---|
| Variables/Categories | n | (%) | n | (%) | n | (%) | p-Value |
| Number of patients | 162 | (100.0%) | 80 | (49.4%) | 82 | (50.6%) | |
| Age | |||||||
| ≥65 | 76 | (46.9%) | 43 | (53.8%) | 43 | (52.4%) | |
| <65 | 86 | (53.1%) | 37 | (46.3%) | 39 | (47.6%) | 0.867 |
| Sex | |||||||
| male | 115 | (71.0%) | 62 | (77.5%) | 53 | (64.6%) | |
| female | 47 | (29.0%) | 18 | (22.5%) | 29 | (35.4%) | 0.071 |
| BMI | |||||||
| underweight | 36 | (22.2%) | 6 | (7.5%) | 30 | (36.6%) | |
| normal weight | 102 | (63.0%) | 50 | (62.5%) | 52 | (63.4%) | |
| overweight | 17 | (10.5%) | 17 | (21.3%) | 0 | (0.0%) | |
| obese | 7 | (4.3%) | 7 | (8.8%) | 0 | (0.0%) | <0.001 |
| Nutritional supplementation | |||||||
| none | 43 | (26.5%) | 35 | (43.8%) | 8 | (9.8%) | |
| oral | 49 | (30.2%) | 22 | (27.5%) | 27 | (32.9%) | |
| enteral | 64 | (39.5%) | 22 | (27.5%) | 42 | (51.2%) | |
| parenteral | 6 | (3.7%) | 1 | (1.3%) | 5 | (6.1%) | <0.001 |
| History of heavy alcohol use | |||||||
| no | 114 | (70.4%) | 56 | (70.0%) | 58 | (70.7%) | |
| yes | 48 | (29.6%) | 24 | (30.0%) | 24 | (29.3%) | 0.919 |
| History of smoking | |||||||
| no | 11 | (6.8%) | 7 | (8.8%) | 4 | (4.9%) | |
| yes | 128 | (79.0%) | 62 | (77.5%) | 66 | (80.5%) | 0.366 |
| unknown | 23 | (14.2%) | 11 | (13.8%) | 12 | (14.6%) | |
| Primary site | |||||||
| oral cavity | 66 | (40.7%) | 26 | (32.5%) | 40 | (48.8%) | |
| oropharynx | 33 | (20.4%) | 18 | (22.5%) | 15 | (18.3%) | |
| hypopharynx | 20 | (12.3%) | 7 | (8.8%) | 13 | (15.9%) | |
| larynx | 17 | (10.5%) | 11 | (13.8%) | 6 | (7.3%) | |
| sinonasal | 9 | (5.6%) | 3 | (3.8%) | 6 | (7.3%) | |
| others § | 17 | (10.5%) | 15 | (18.8%) | 2 | (2.4%) | 0.003 |
| OPSCC (p16 positive) | |||||||
| yes | 13 | (8.0%) | 10 | (12.5%) | 3 | (3.7%) | |
| no | 149 | (92.0%) | 70 | (87.5%) | 79 | (96.3%) | 0.046 |
| Disease extent | |||||||
| locoregional | 75 | (46.3%) | 39 | (48.8%) | 36 | (43.9%) | |
| distant metastasis | 17 | (10.5%) | 8 | (10.0%) | 9 | (11.0%) | |
| locoregional + distant metastasis | 70 | (43.2%) | 33 | (41.3%) | 37 | (45.1%) | 0.826 |
| Prior primary treatment | |||||||
| surgical | 26 | (16%) | 10 | (12.5%) | 16 | (19.5%) | |
| surgical + poRT | 33 | (20.4%) | 18 | (22.5%) | 15 | (18.3%) | |
| surgical + poCRT/RIT | 13 | (8%) | 7 | (8.8%) | 6 | (7.3%) | |
| RT | 19 | (11.7%) | 10 | (12.5%) | 9 | (11%) | |
| CRT/RIT | 58 | (35.8%) | 28 | (35%) | 30 | (36.6%) | |
| palliative only | 13 | (8%) | 7 | (8.8%) | 6 | (7.3%) | 0.862 |
| Prior palliative chemotherapy | |||||||
| yes | 126 | (77.8%) | 66 | (82.5%) | 60 | (73.2%) | |
| no | 36 | (22.2%) | 14 | (17.5%) | 22 | (26.8%) | 0.153 |
| Regimen | |||||||
| Pembrolizumab | 82 | (50.6%) | 47 | (58.8%) | 35 | (42.7%) | |
| Pembrolizumab + platinum + 5-FU | 33 | (20.4%) | 15 | (18.8%) | 18 | (22.0%) | |
| Nivolumab | 47 | (29.0%) | 18 | (22.5%) | 29 | (35.4%) | 0.101 |
| CPS | |||||||
| <1 | 3 | (1.9%) | 1 | (1.3%) | 2 | (2.4%) | |
| 1–20 | 48 | (29.6%) | 24 | (30.0%) | 24 | (29.3%) | |
| >20 | 59 | (36.4%) | 34 | (42.5%) | 25 | (30.5%) | 0.538 |
| unknown | 52 | (32.1%) | 21 | (26.3%) | 31 | (37.8%) | |
| ECOG PS | |||||||
| 0 | 73 | (45.1%) | 46 | (57.5%) | 27 | (32.9%) | |
| 1 | 52 | (32.1%) | 24 | (30.0%) | 28 | (34.1%) | |
| ≥2 | 37 | (22.8%) | 10 | (12.5%) | 27 | (32.9%) | 0.001 |
| PFS | OS | ||||||||
|---|---|---|---|---|---|---|---|---|---|
| GNRI | Level | HR | (95% CI) | p-Value | AIC | HR | (95% CI) | p-Value | AIC |
| 2 groups | >98 vs. ≤98 | 1.98 | (1.41–2.80) | <0.001 | 1162.90 | 2.15 | (1.47–3.13) | <0.001 | 961.92 |
| 2 groups | ≥92 vs. <92 | 1.97 | (1.39–2.81) | <0.001 | 1164.71 | 2.74 | (1.86–4.03) | <0.001 | 953.60 |
| 2 groups | ≥82 vs. <82 | 1.59 | (0.83–3.03) | 0.161 | 1176.42 | 1.98 | (1.03–3.81) | 0.040 | 974.32 |
| 3 groups | >98 vs. 98–82 | 1.96 | (1.37–2.80) | <0.001 | 1164.85 | 2.06 | (1.39–3.05) | <0.001 | 963.29 |
| >98 vs. <82 | 2.11 | (1.08–4.14) | 0.029 | - | 2.74 | (1.38–5.45) | 0.004 | - | |
| 3 groups | >98 vs. 98–92 | 1.61 | (0.99–2.61) | 0.053 | 1163.24 | 1.30 | (0.75–2.24) | 0.346 | 954.74 |
| >98 vs. <92–82 | 2.21 | (1.52–3.23) | <0.001 | - | 2.92 | (1.93–4.42) | <0.001 | - | |
| 3 groups | ≥92 vs. 92–82 | 2.00 | (1.37–2.91) | <0.001 | 1166.69 | 2.78 | (1.83–4.21) | <0.001 | 955.57 |
| ≥92 vs. <82 | 1.90 | (0.98–3.67) | 0.057 | - | 2.61 | (1.33–5.11) | 0.005 | ||
| 4 groups | >98 vs. 98–92 | 1.61 | (0.99–2.61) | 0.053 | 1165.22 | 1.30 | (0.75–2.24) | 0.345 | 956.71 |
| >98 vs. <92–82 | 2.24 | (1.50–3.35) | <0.001 | - | 2.97 | (1.91–4.62) | <0.001 | - | |
| >98 vs. <82 | 2.11 | (1.08–4.14) | 0.029 | - | 2.78 | (1.40–5.53) | 0.004 | - | |
| PFS | OS | ||||||
|---|---|---|---|---|---|---|---|
| Variables/Levels | n | HR | (95% CI) | p-Value | HR | (95% CI) | p-Value |
| Age | 162 | ||||||
| ≥65 vs. <65 (ref) | 1.04 | (0.74–1.47) | 0.800 | 1.26 | (0.87–1.83) | 0.214 | |
| Sex | 162 | ||||||
| female vs. male (ref) | 1.10 | (0.76–1.59) | 0.628 | 1.11 | (0.74–1.67) | 0.608 | |
| BMI | 162 | ||||||
| underweight vs. normal weight (ref) | 1.13 | (0.75–1.70) | 0.561 | 1.37 | (0.87–2.15) | 0.178 | |
| overweight vs. normal weight (ref) | 0.69 | (0.37–1.18) | 0.161 | 1.04 | (0.57–1.87) | 0.908 | |
| obese vs. normal weight (ref) | 0.50 | (0.20–1.25) | 0.138 | 0.51 | (0.18–1.40) | 0.190 | |
| Nutritional supplementation | 162 | ||||||
| oral vs. none (ref) | 1.43 | (0.90–2.28) | 0.134 | 1.34 | (0.8–2.22) | 0.264 | |
| enteral vs. none (ref) | 1.79 | (1.16–2.76) | 0.009 | 1.92 | (1.19–3.12) | 0.008 | |
| parenteral vs. none (ref) | 2.98 | (1.24–7.17) | 0.015 | 3.05 | (1.16–7.98) | 0.023 | |
| History of heavy alcohol use | 162 | ||||||
| yes vs. no (ref) | 0.91 | (0.63–1.32) | 0.629 | 1.24 | (0.84–1.84) | 0.281 | |
| History of smoking | 139 | ||||||
| ever vs. never (ref) | 0.68 | (0.35–1.31) | 0.250 | 1.87 | (0.76–4.62) | 0.175 | |
| Primary site | 162 | ||||||
| oral cavity vs. larynx (ref) | 1.23 | (0.70–2.18) | 0.473 | 1.29 | (0.67–2.47) | 0.451 | |
| oropharynx vs. larynx (ref) | 0.90 | (0.47–1.69) | 0.734 | 0.82 | (0.40–1.69) | 0.588 | |
| hypopharynx vs. larynx (ref) | 1.15 | (0.58–2.29) | 0.684 | 0.58 | (0.24–1.37) | 0.212 | |
| sinonasal vs. larynx (ref) | 1.12 | (0.48–2.66) | 0.789 | 1.05 | (0.42–2.63) | 0.912 | |
| other § vs. larynx (ref) | 0.63 | (0.29–1.34) | 0.228 | 0.51 | (0.22–1.20) | 0.124 | |
| OPSCC (p16 positive) | 162 | ||||||
| yes vs. no (ref) | 1.01 | (0.56–1.84) | 0.961 | 0.91 | (0.47–1.74) | 0.766 | |
| Disease extent | 162 | ||||||
| distant metastasis vs locoregional (ref) | 0.65 | (0.35–1.20) | 0.165 | 0.48 | (0.22–1.06) | 0.070 | |
| locoregional + distant metastasis vs locoregional (ref) | 0.77 | (0.54–1.10) | 0.142 | 0.93 | (0.63–1.36) | 0.699 | |
| Prior primary treatment | 162 | ||||||
| surgical + poRT vs. surgical (ref) | 1.24 | (0.69–2.22) | 0.475 | 1.31 | (0.7–2.45) | 0.402 | |
| surgical + poCRT/RIT vs. surgical (ref) | 1.59 | (0.77–3.28) | 0.211 | 1.19 | (0.53–2.68) | 0.670 | |
| RT vs. surgical (ref) | 1.45 | (0.74–2.83) | 0.276 | 0.98 | (0.45–2.14) | 0.955 | |
| CRT/RIT vs. surgical (ref) | 1.30 | (0.76–2.21) | 0.337 | 1.34 | (0.76–2.34) | 0.309 | |
| palliative only vs. surgical (ref) | 0.74 | (0.34–1.64) | 0.460 | 0.79 | (0.35–1.79) | 0.577 | |
| Prior palliative chemotherapy | 162 | ||||||
| yes vs. no (ref) | 1.23 | (0.83–1.83) | 0.306 | 1.11 | (0.73–1.69) | 0.628 | |
| Regimen | 162 | ||||||
| Pembrolizumab + platinum + 5-FU vs Pembrolizumab (ref) | 0.67 | (0.41–1.08) | 0.101 | 0.86 | (0.51–1.47) | 0.591 | |
| Nivolumab vs Pembrolizumab (ref) | 1.35 | (0.92–1.99) | 0.120 | 1.27 | (0.84–1.92) | 0.250 | |
| CPS score | 110 | ||||||
| 1–20 vs. <1 (ref) | 0.64 | (0.19–2.08) | 0.454 | 0.67 | (0.16–2.84) | 0.590 | |
| >20 vs. <1 (ref) | 0.66 | (0.20–2.14) | 0.491 | 0.76 | (0.18–3.18) | 0.704 | |
| ECOG | 162 | ||||||
| 1 vs. 0 (ref) | 1.15 | (0.78–1.71) | 0.482 | 1.15 | (0.77–1.87) | 0.409 | |
| ≥2 vs. 0 (ref) | 1.73 | (1.13–2.65) | 0.012 | 2.53 | (1.59–4.01) | <0.001 |
| PFS | OS | ||||||||
|---|---|---|---|---|---|---|---|---|---|
| Variables/Levels | n | HR | (95% CI) | p-Value | AIC | HR | (95% CI) | p-Value | AIC |
| GNRI (2 groups) | 162 | ||||||||
| ≤98 vs. >98 (ref) | 1.65 | (1.12–2.42) | 0.012 | 1163.76 | - | - | - | - | |
| <92 vs. ≥92 (ref) | - | - | - | - | 2.20 | (1.45–3.35) | < 0.001 | 948.42 | |
| ECOG | 162 | ||||||||
| 1 vs. 0 (ref) | 1.02 | (0.67–1.54) | 0.926 | - | 1.17 | (0.74–1.84) | 0.495 | - | |
| ≥2 vs. 0 (ref) | 1.67 | (1.07–2.63) | 0.025 | - | 2.39 | (1.48–3.85) | <0.001 | - | |
| Nutritional supplementation | 162 | ||||||||
| oral vs. none (ref) | 1.14 | (0.69–1.87) | 0.610 | - | 1.28 | (0.77–2.14) | 0.345 | - | |
| enteral vs. none (ref) | 1.57 | (0.98–2.52) | 0.063 | - | 1.54 | (0.92–2.58) | 0.099 | - | |
| parenteral vs. none (ref) | 2.45 | (0.96–6.23) | 0.060 | - | 2.65 | (0.97–7.23) | 0.056 | - | |
| GNRI (4 groups) | 162 | ||||||||
| 98–92 vs. >98 (ref) | 1.32 | (0.77–2.28) | 0.310 | 1166.40 | 1.01 | (0.55–1.86) | 0.980 | 952.38 | |
| <92–82 vs. >98 (ref) | 1.80 | (1.15–2.81) | 0.010 | - | 2.25 | (1.38–3.69) | 0.001 | - | |
| <82 vs. >98 (ref) | 1.84 | (0.93–3.63) | 0.081 | - | 2.09 | (1.02–4.27) | 0.045 | - | |
| ECOG | 162 | ||||||||
| 1 vs. 0 (ref) | 1.05 | (0.69–1.59) | 0.836 | - | 1.16 | (0.73–1.85) | 0.526 | - | |
| ≥2 vs. 0 (ref) | 1.72 | (1.09–2.7) | 0.019 | - | 2.39 | (1.46–3.9) | 0.001 | - | |
| Nutritional supplementation | 162 | ||||||||
| oral vs. none (ref) | 1.22 | (0.74–2.03) | 0.438 | - | 1.28 | (0.73–2.24) | 0.383 | - | |
| enteral vs. none (ref) | 1.54 | (0.95–2.48) | 0.080 | - | 1.53 | (0.91–2.59) | 0.111 | - | |
| parenteral vs. none (ref) | 2.52 | (0.98–6.45) | 0.055 | - | 2.61 | (0.92–7.42) | 0.072 | - | |
Disclaimer/Publisher’s Note: The statements, opinions and data contained in all publications are solely those of the individual author(s) and contributor(s) and not of MDPI and/or the editor(s). MDPI and/or the editor(s) disclaim responsibility for any injury to people or property resulting from any ideas, methods, instructions or products referred to in the content. |
© 2023 by the authors. Licensee MDPI, Basel, Switzerland. This article is an open access article distributed under the terms and conditions of the Creative Commons Attribution (CC BY) license (https://creativecommons.org/licenses/by/4.0/).
Share and Cite
Haas, M.; Lein, A.; Fuereder, T.; Brkic, F.F.; Schnoell, J.; Liu, D.T.; Kadletz-Wanke, L.; Heiduschka, G.; Jank, B.J. The Geriatric Nutritional Risk Index (GNRI) as a Prognostic Biomarker for Immune Checkpoint Inhibitor Response in Recurrent and/or Metastatic Head and Neck Cancer. Nutrients 2023, 15, 880. https://doi.org/10.3390/nu15040880
Haas M, Lein A, Fuereder T, Brkic FF, Schnoell J, Liu DT, Kadletz-Wanke L, Heiduschka G, Jank BJ. The Geriatric Nutritional Risk Index (GNRI) as a Prognostic Biomarker for Immune Checkpoint Inhibitor Response in Recurrent and/or Metastatic Head and Neck Cancer. Nutrients. 2023; 15(4):880. https://doi.org/10.3390/nu15040880
Chicago/Turabian StyleHaas, Markus, Alexander Lein, Thorsten Fuereder, Faris F. Brkic, Julia Schnoell, David T. Liu, Lorenz Kadletz-Wanke, Gregor Heiduschka, and Bernhard J. Jank. 2023. "The Geriatric Nutritional Risk Index (GNRI) as a Prognostic Biomarker for Immune Checkpoint Inhibitor Response in Recurrent and/or Metastatic Head and Neck Cancer" Nutrients 15, no. 4: 880. https://doi.org/10.3390/nu15040880