
Identification of Nutritional Factors to Evaluate Periodontal Clinical Parameters in Patients with Systemic Diseases
 , , , , ,
  , , , , and
Abstract
:
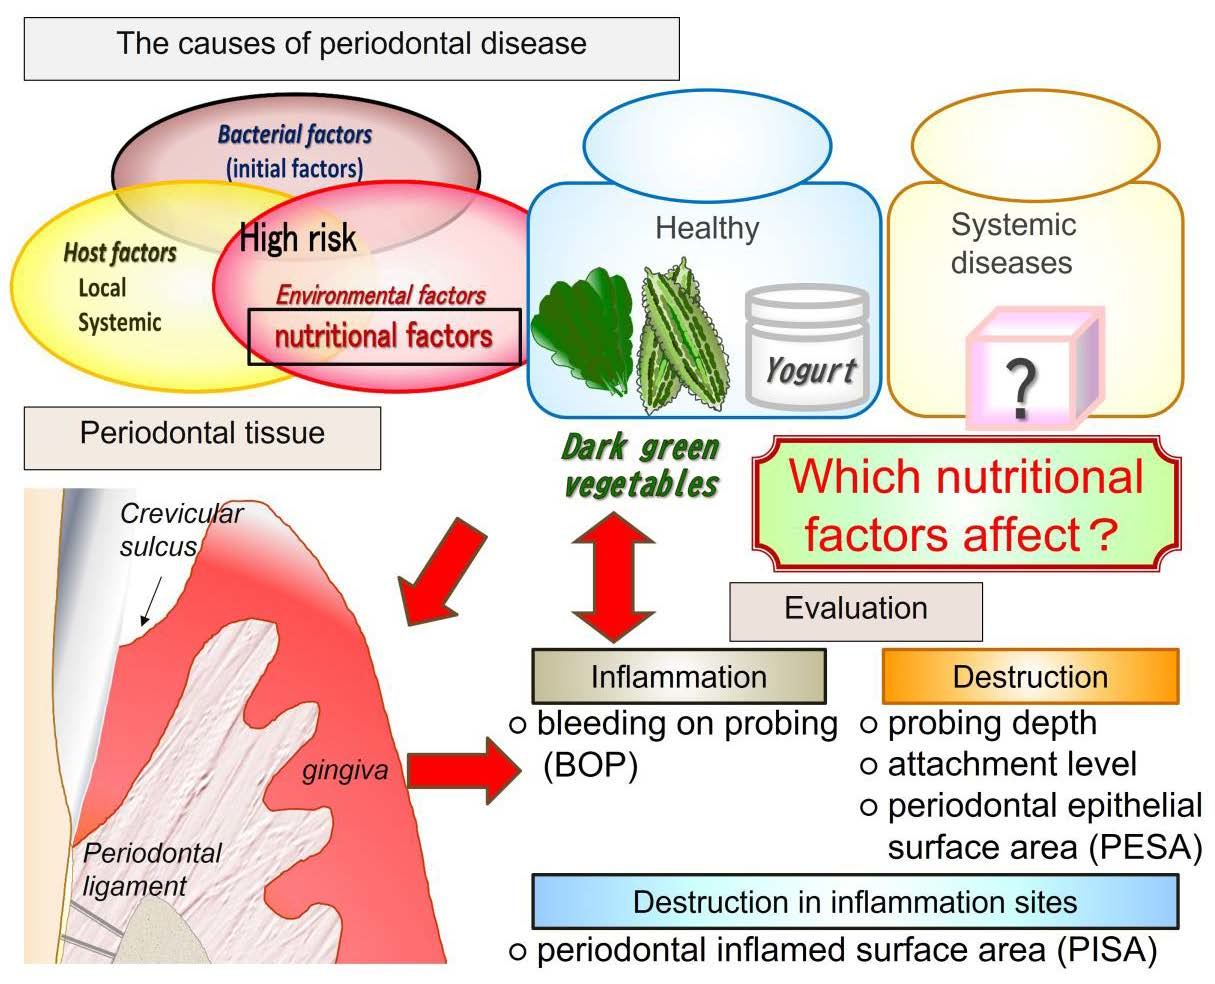
1. Introduction
2. Materials and Methods
2.1. Subjects
2.2. Periodontal Examinations
2.3. Questionnaire on Lifestyle Habits and Collection of Patient Information
2.4. Analysis of the Association between Periodontal Clinical Parameters and Environmental and Nutritional Factors
2.5. Enzyme-Linked Immunosorbent Assay (ELISA)
2.6. Statistical Analysis
3. Results
3.1. Profiling of Periodontal Examinations and Environmental and Nutritional Factors
3.2. Correlation Coefficient Matrix between Clinical Parameters and Environmental and Nutritional Factors
3.3. Multiple Regression Analysis
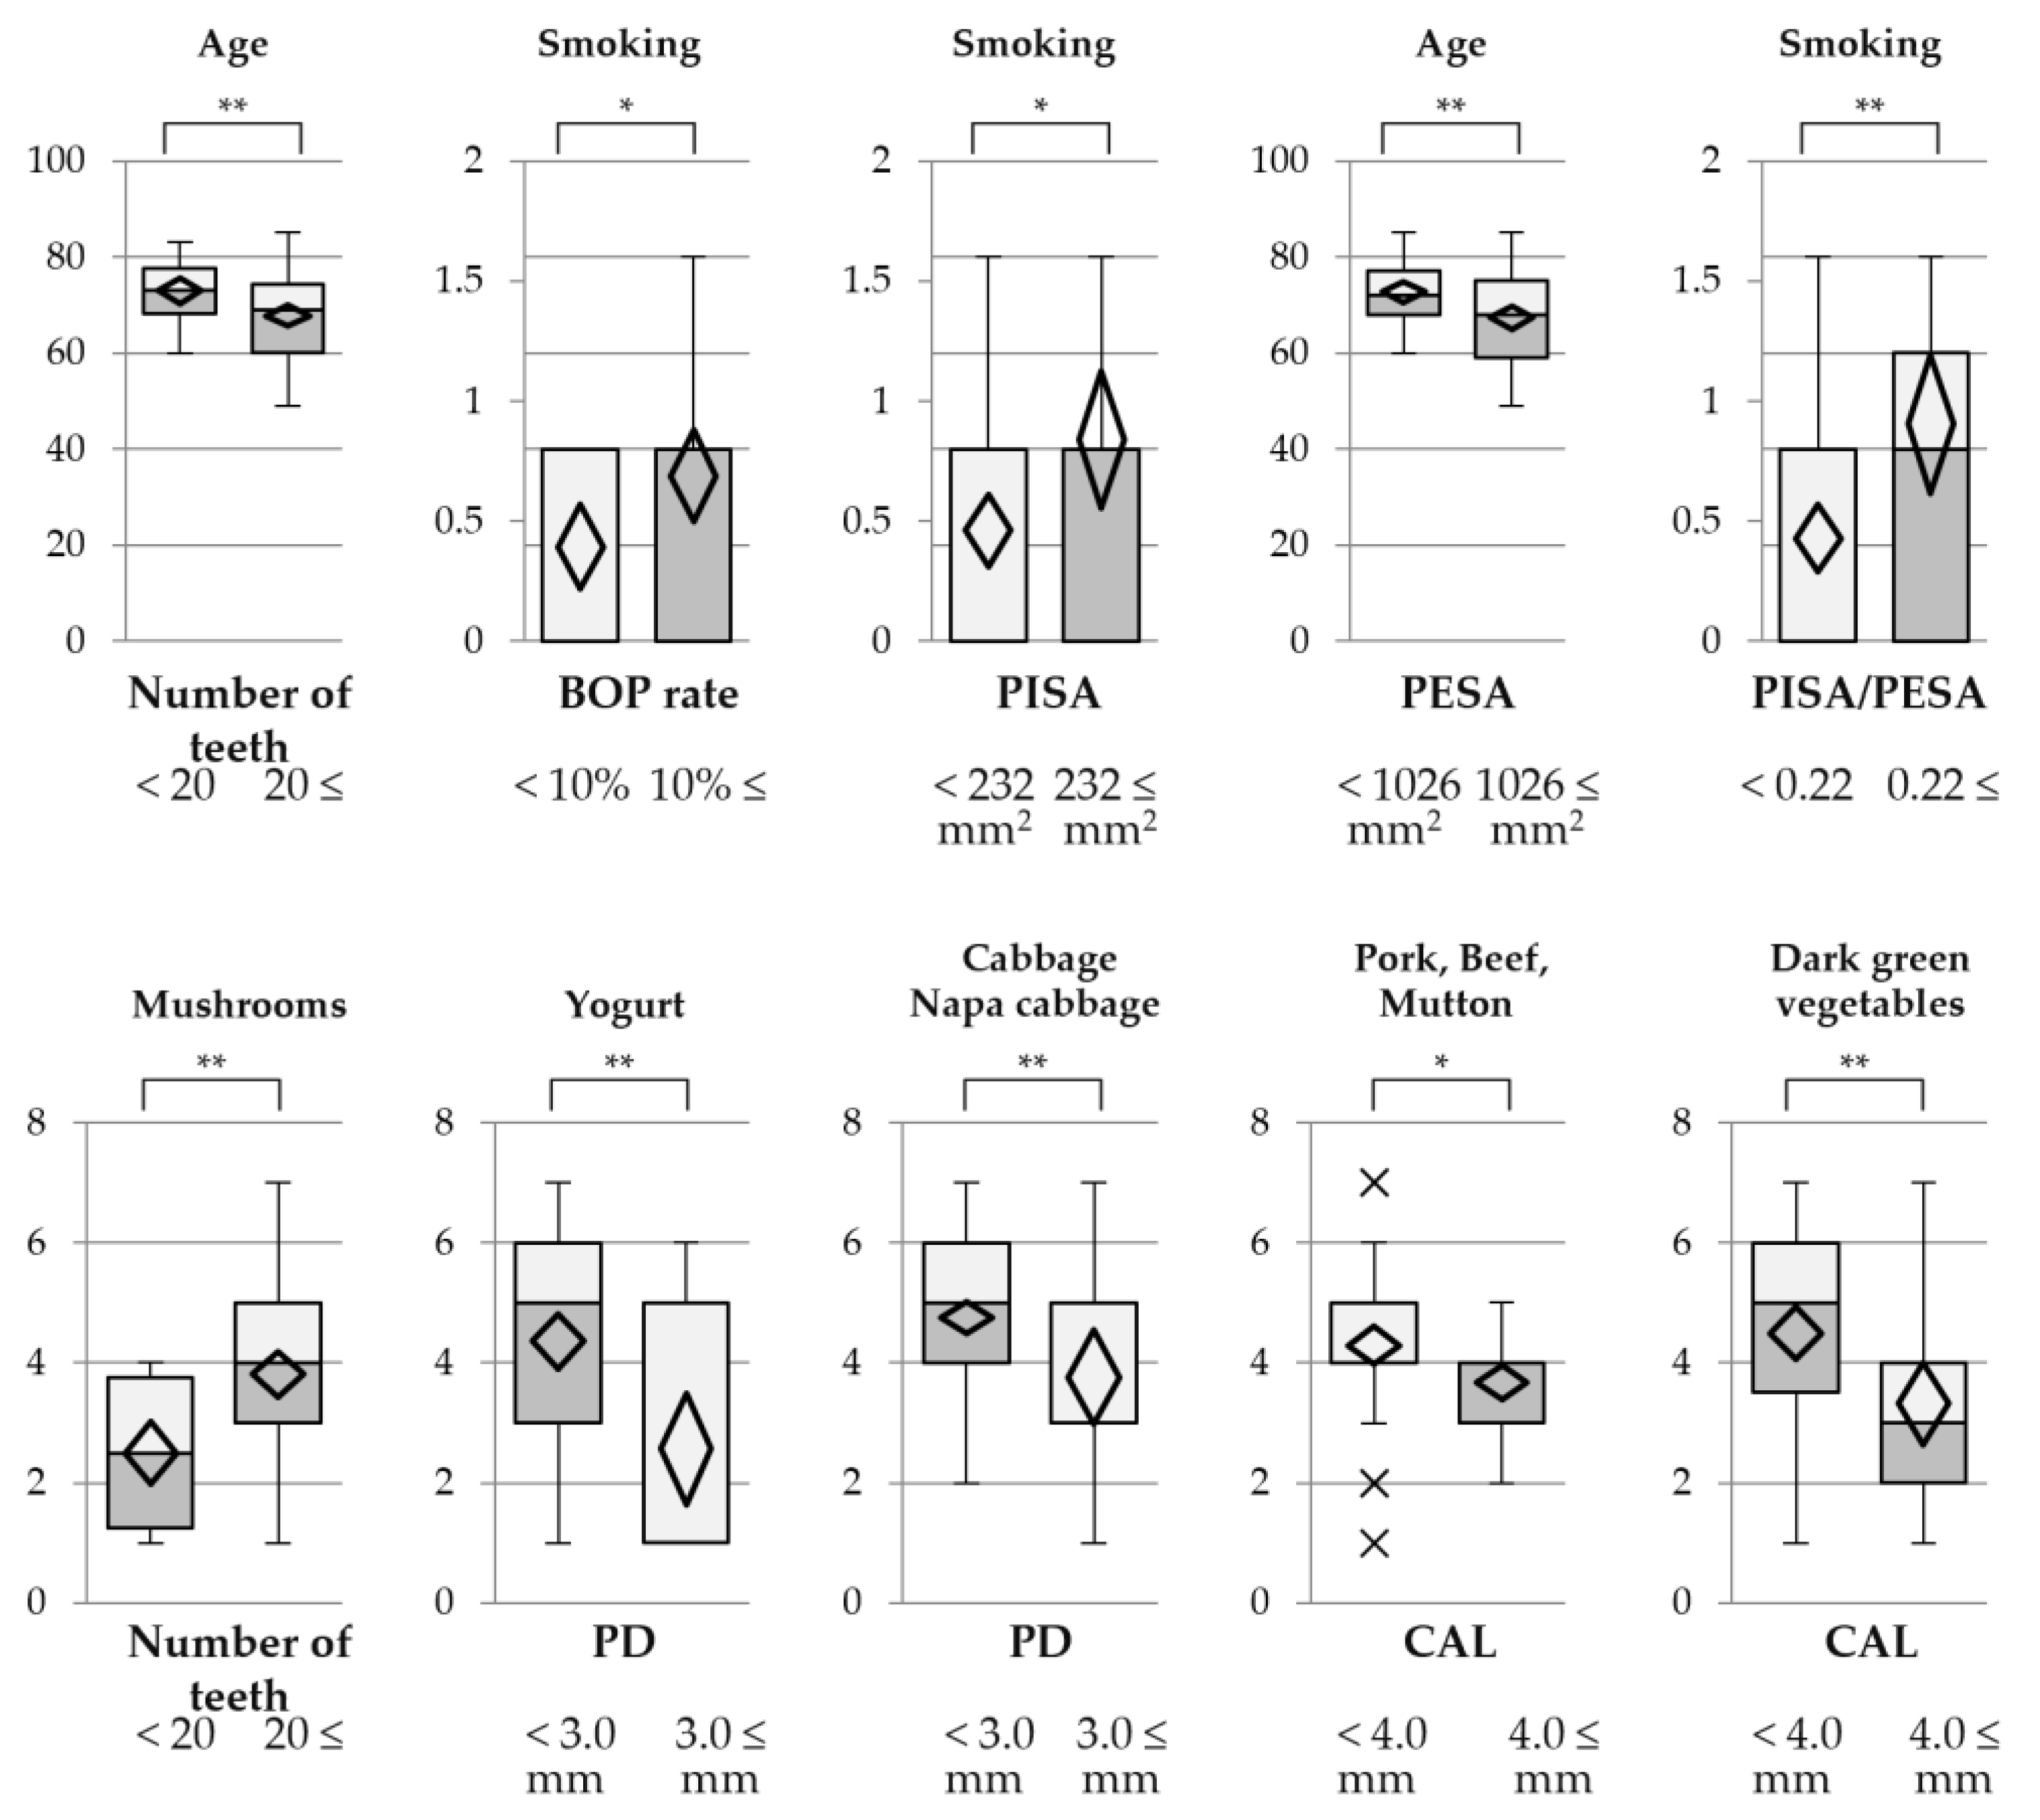
3.4. Stratified Descriptive Statistics between Clinical Parameters and Environmental and Nutritional Factors
3.5. Correlation Coefficients between Inflammatory Cytokines, Clinical Parameters, and Environmental and Nutritional Factors
4. Discussion
5. Conclusions
Supplementary Materials
Author Contributions
Funding
Institutional Review Board Statement
Informed Consent Statement
Data Availability Statement
Conflicts of Interest
References
- Desai, R.; Khobaragade, B.; McCracken, G.; Wassall, R.; Taylor, J.J.; Bissett, S.M.; Pumerantz, A.S.; Preshaw, P.M. Impact of diabetes and periodontal status on life quality. BDJ Open 2021, 7, 9. [Google Scholar] [CrossRef] [PubMed]
- Mergenhagen, S.E.; Tempel, T.R.; Snyderman, R. Immunologic reactions and periodontal inflammation. J. Dent. Res. 1970, 49, 256–261. [Google Scholar] [CrossRef] [PubMed]
- Liang, Y.H.; Chou, C.; Chen, Y.J.; Chou, Y.F.; Lin, C.Y.; Chou, C.; Wang, T.F. Impact of periodontal disease and chewing ability on the quality of life of the elderly in an affluent community. J. Formos. Med. Assoc. 2020, 119, 1693–1701. [Google Scholar] [CrossRef]
- Vermaire, J.A.; Partoredjo, A.S.K.; de Groot, R.J.; Brand, H.S.; Speksnijder, C.M. Mastication in health-related quality of life in patients treated for oral cancer: A systematic review. Eur. J. Cancer Care 2022, 31, e13744. [Google Scholar] [CrossRef]
- Tonetti, M.S.; Greenwell, H.; Kornman, K.S. Staging and grading of periodontitis: Framework and proposal of a new classification and case definition. J. Periodontol. 2018, 89, S159–S172. [Google Scholar] [CrossRef] [Green Version]
- Nesse, W.; Abbas, F.; van der Ploeg, I.; Spijkervet, F.K.; Dijkstra, P.U.; Vissink, A. Periodontal inflamed surface area: Quantifying inflammatory burden. J. Clin. Periodontol. 2008, 35, 668–673. [Google Scholar] [CrossRef] [PubMed] [Green Version]
- Lang, N.P.; Adler, R.; Joss, A.; Nyman, S. Absence of bleeding on probing. An indicator of periodontal stability. J. Clin. Periodontol. 1990, 17, 714–721. [Google Scholar] [CrossRef]
- Igari, K.; Inoue, Y.; Iwai, T. The Epidemiologic and Clinical Findings of Patients with Buerger Disease. Ann. Vasc. Surg. 2016, 30, 263–269. [Google Scholar] [CrossRef] [PubMed]
- Chambon, P. The nuclear receptor superfamily: A personal retrospect on the first two decades. Mol Endocrinol. 2005, 19, 1418–1428. [Google Scholar] [CrossRef] [PubMed] [Green Version]
- Waterland, R.A. Do maternal methyl supplements in mice affect DNA methylation of offspring? J. Nutr. 2003, 133, 238. [Google Scholar] [CrossRef]
- Waterland, R.A.; Jirtle, R.L. Transposable elements: Targets for early nutritional effects on epigenetic gene regulation. Mol. Cell Biol. 2003, 23, 5293–5300. [Google Scholar] [CrossRef] [Green Version]
- Kobayashi, R.; Kobayashi, T.; Sakai, F.; Hosoya, T.; Yamamoto, M.; Kurita-Ochiai, T. Oral administration of Lactobacillus gasseri SBT2055 is effective in preventing Porphyromonas gingivalis-accelerated periodontal disease. Sci. Rep. 2017, 7, 545. [Google Scholar] [CrossRef] [PubMed] [Green Version]
- Kobayashi, R.; Hashizume-Takizawa, T.; Kurita-Ochiai, T. Lactic acid bacteria prevent both periodontitis and atherosclerosis exacerbated by periodontitis in spontaneously hyperlipidemic mice. J. Periodontal Res. 2021, 56, 753–760. [Google Scholar] [CrossRef] [PubMed]
- Bartold, P.M.; Van Dyke, T.E. Host modulation: Controlling the inflammation to control the infection. Periodontol. 2000 2017, 75, 317–329. [Google Scholar] [CrossRef] [PubMed]
- Groeger, S.; Jarzina, F.; Windhorst, A.; Meyle, J. Influence of retinoic acid on human gingival epithelial barriers. J. Periodontal Res. 2016, 51, 748–757. [Google Scholar] [CrossRef]
- Nanayakkara, V.; Ekanayake, L.; Silva, R. Dietary intake of calcium, vitamins A and E and bleeding on probing in Sri Lankan preschoolers. Community Dent. Health 2014, 31, 153–157. [Google Scholar] [PubMed]
- Li, X.Y.; Wen, M.Z.; Liu, H.; Shen, Y.C.; Su, L.X.; Yang, X.T. Dietary magnesium intake is protective in patients with periodontitis. Front. Nutr. 2022, 9, 976518. [Google Scholar] [CrossRef] [PubMed]
- Tabe, S.; Nakayama, Y.; Kobayashi, R.; Oyama, K.; Kitano, D.; Ogihara, J.; Senpuku, H.; Ogata, Y. Association between Dietary Habit and Clinical Parameters in Patients with Chronic Periodontitis Undergoing Supportive Periodontal Therapy. Nutrients 2022, 14, 4993. [Google Scholar]
- Senba, T.; Kobayashi, Y.; Inoue, K.; Kaneto, C.; Inoue, M.; Toyokawa, S.; Suyama, Y.; Suzuki, T.; Miyano, Y.; Miyoshi, Y. The association between self-reported periodontitis and coronary heart disease—From MY Health Up Study. J. Occup. Health 2008, 50, 283–287. [Google Scholar] [CrossRef] [Green Version]
- Lockhart, P.B.; Bolger, A.F.; Papapanou, P.N.; Osinbowale, O.; Trevisan, M.; Levison, M.E.; Taubert, K.A.; Newburger, J.W.; Gornik, H.L.; Gewitz, M.H.; et al. Periodontal disease and atherosclerotic vascular disease: Does the evidence support an independent association?: A scientific statement from the American Heart Association. American Heart Association Rheumatic Fever, Endocarditis, and Kawasaki Disease Committee of the Council on Cardiovascular Disease in the Young, Council on Epidemiology and Prevention, Council on Peripheral Vascular Disease, and Council on Clinical Cardiology. Circulation 2012, 125, 2520–2544. [Google Scholar]
- Mirzaei, A.; Shahrestanaki, E.; Malmir, H.; Ejtahed, H.S.; Tajbakhsh, D.; Seif, E.; Djalalinia, S.; Mahdavi-Gorabi, A.; Qorbani, M. Association of periodontitis with lipid profile: An updated systematic review and meta-analysis. J. Diabetes Metab. Disord. 2022, 21, 1377–1393. [Google Scholar] [CrossRef] [PubMed]
- Yu, C.; Li, Q.; Zhou, Z. Concentration on the relationship between periodontitis and dyslipidemia. Oral Dis. 2022; ahead of print. [Google Scholar]
- Iwasaki, M.; Taylor, G.W.; Sato, M.; Minagawa, K.; Ansai, T.; Yoshihara, A. Effect of chronic kidney disease on progression of clinical attachment loss in older adults: A 4-year cohort study. J. Periodontol. 2019, 90, 826–833. [Google Scholar] [CrossRef] [PubMed]
- Iwasaki, M.; Taylor, G.W.; Manz, M.C.; Kaneko, N.; Imai, S.; Yoshihara, A.; Miyazaki, H. Serum antibody to Porphyromonas gingivalis in chronic kidney disease. J. Dent. Res. 2012, 91, 828–833. [Google Scholar] [CrossRef] [PubMed]
- Iwasaki, M.; Taylor, G.W.; Nesse, W.; Vissink, A.; Yoshihara, A.; Miyazaki, H. Periodontal disease and decreased kidney function in Japanese elderly. Am. J. Kidney Dis. 2012, 59, 202–209. [Google Scholar] [CrossRef]
- Nelson, R.G.; Shlossman, M.; Budding, L.M.; Pettitt, D.J.; Saad, M.F.; Genco, R.J.; Knowler, W.C. Periodontal disease and NIDDM in Pima Indians. Diabetes Care 1990, 13, 836–840. [Google Scholar] [CrossRef]
- Taylor, G.W.; Burt, B.A.; Becker, M.P.; Genco, R.J.; Shlossman, M.; Knowler, W.C.; Pettitt, D.J. Non–insulin dependent diabetes mellitus and alveolar bone loss progression over 2 years. J. Periodontol. 1998, 69, 76–83. [Google Scholar] [CrossRef] [Green Version]
- Kaur, G.; Holtfreter, B.; Rathmann, W.; Schwahn, C.; Wallaschofski, H.; Schipf, S.; Nauck, M.; Kocher, T. Association between type 1 and type 2 diabetes with periodontal disease and tooth loss. J. Clin. Periodontol. 2009, 36, 765–774. [Google Scholar] [CrossRef]
- Larvin, H.; Kang, J.; Aggarwal, V.R.; Pavitt, S.; Wu, J. Periodontitis and risk of immune–mediated systemic conditions: A systematic review and meta-analysis. Community Dent. Oral Epidemiol. 2022; ahead of print. [Google Scholar]
- Baleato, C.L.; Ferguson, J.J.A.; Oldmeadow, C.; Mishra, G.D.; Garg, M.L. Plant-Based Dietary Patterns versus Meat Consumption and Prevalence of Impaired Glucose Intolerance and Diabetes Mellitus: A Cross–Sectional Study in Australian Women. Nutrients 2022, 14, 4152. [Google Scholar] [CrossRef]
- O’Hearn, M.; Erndt-Marino, J.; Gerber, S.; Lauren, B.N.; Economos, C.; Wong, J.B.; Blumberg, J.B.; Mozaffarian, D. Validation of Food Compass with a healthy diet, cardiometabolic health, and mortality among U.S. adults, 1999–2018. Nat. Commun. 2022, 13, 7066. [Google Scholar] [CrossRef]
- Drake, A.M.; Coughlan, M.T.; Christophersen, C.T.; Snelson, M. Resistant Starch as a Dietary Intervention to Limit the Progression of Diabetic Kidney Disease. Nutrients 2022, 14, 4547. [Google Scholar] [CrossRef]
- Colletti, A.; Fratter, A.; Pellizzato, M.; Cravotto, G. Nutraceutical Approaches to Dyslipidaemia: The Main Formulative Issues Preventing Efficacy. Nutrients 2022, 14, 4769. [Google Scholar] [CrossRef] [PubMed]
- O’Leary, T.J.; Drake, R.B.; Naylor, J.E. The plaque control record. J. Periodontol. 1972, 43, 38. [Google Scholar] [CrossRef]
- Nakayama, Y.; Matsuda, H.; Itoh, S.; Iwai, Y.; Takai, H.; Mezawa, M.; Yoshino, S.; Ogata, Y. Impact of adjunctive procedures on recombinant human fibroblast growth factor-2-mediated periodontal regeneration therapy: A retrospective study. J. Periodontol. 2021, 92, 983–994. [Google Scholar] [CrossRef]
- Eichner, K. Renewed examination of the group classification of partially edentulous arches by Eichner and application advice for studies on morbidity statistics. Stomatologie 1990, 40, 321–325. [Google Scholar]
- Katz, J.; Chaushu, G.; Sgan-Cohen, H.D. Relationship of blood glucose level to community periodontal index of treatment needs and body mass index in a permanent Israeli military population. J. Periodontol. 2000, 71, 1521–1527. [Google Scholar] [CrossRef] [PubMed]
- Inoue, Y.; Hatanaka, K.; Yamamoto, T.; Hirata, T.; Minabe, M.; Yamamoto, T.; Naito, T.; Yamamoto, M.; Sato, S.; Ishihata, H.; et al. Reference values of periodontal inflamed surface area as a clinical index determined by a multicenter retrospective observational study. J. Jpn. Soc. Periodontol. 2019, 61, 159–167. [Google Scholar] [CrossRef] [Green Version]
- Gerontidis, A.; Grammatikopoulou, M.G.; Tzimos, C.; Gkiouras, K.; Taousani, E.; Athanasiadis, L.; Goulis, D.G. Effectors of Pregorexia and Emesis among Pregnant Women: A Pilot Study. Nutrients 2022, 14, 5275. [Google Scholar] [CrossRef] [PubMed]
- Frydrych, A.M.; Banerjee, C.; Mansoor, K.; Kujan, O. Factors influencing the cariogenic potential of oral nutritional supplements indicated for use in adults with or at risk of malnutrition. Spec. Care Dent. 2022, 42, 390–397. [Google Scholar] [CrossRef]
- Arimatsu, K.; Yamada, H.; Miyazawa, H.; Minagawa, T.; Nakajima, M.; Ryder, M.I.; Gotoh, K.; Motooka, D.; Nakamura, S.; Iida, T.; et al. Oral pathobiont induces systemic inflammation and metabolic changes associated with alteration of gut microbiota. Sci. Rep. 2014, 4, 4828. [Google Scholar] [CrossRef] [Green Version]
- Kato, T.; Yamazaki, K.; Nakajima, M.; Date, Y.; Kikuchi, J.; Hase, K.; Ohno, H.; Yamazaki, K. Oral Administration of Porphyromonas gingivalis Alters the Gut Microbiome and Serum Metabolome. mSphere 2018, 3, e00460-18. [Google Scholar] [CrossRef] [Green Version]
- Pfeuffer, M.; Schrezenmeir, J. Milk and the metabolic syndrome. Obes. Rev. 2007, 8, 109–118. [Google Scholar] [CrossRef]
- Al–Zahrani, M.S. Increased intake of dairy products is related to lower periodontitis prevalence. J. Periodontol. 2006, 77, 289–294. [Google Scholar] [CrossRef]
- Adegboye, A.R.; Christensen, L.B.; Holm-Pedersen, P.; Avlund, K.; Boucher, B.J.; Heitmann, B.L. Intake of dairy products in relation to periodontitis in older Danish adults. Nutrients 2012, 4, 1219–1229. [Google Scholar] [CrossRef]
- Ma, J.; Furuta, M.; Uchida, K.; Takeshita, T.; Kageyama, S.; Asakawa, M.; Takeuchi, K.; Suma, S.; Sakata, S.; Hata, J.; et al. Yogurt product intake and reduction of tooth loss risk in a Japanese community. J. Clin. Periodontol. 2022, 49, 345–352. [Google Scholar] [CrossRef] [PubMed]
- Ikram, S.; Hassan, N.; Raffat, M.A.; Mirza, S.; Akram, Z. Systematic review and meta–analysis of double–blind, placebo-controlled, randomized clinical trials using probiotics in chronic periodontitis. J. Investig. Clin. Dent. 2018, 9, e12338. [Google Scholar] [CrossRef]
- Martin-Cabezas, R.; Davideau, J.L.; Tenenbaum, H.; Huck, O. Clinical efficacy of probiotics as an adjunctive therapy to non-surgical periodontal treatment of chronic periodontitis: A systematic review and meta–analysis. J. Clin. Periodontol. 2016, 43, 520–530. [Google Scholar] [CrossRef]
- Mishra, S.; Misra, S.R.; Panda, S.; Mohanty, N.; Manfredi, B.; Parrini, M.; Giacomello, M.S.; Mortellaro, C.; Lucchina, A.G.; Annunziata, M.; et al. Role of probiotics in adjunct to non–surgical periodontal therapy in patients with chronic periodontitis: A systematic review and meta-analysis. J. Biol. Regul. Homeost. Agents 2021, 35, 67–78. [Google Scholar] [PubMed]
- Kim, S.; Lee, J.Y.; Park, J.Y.; Kim, Y.; Kang, C.H. Lacticaseibacillus rhamnosus MG4706 Suppresses Periodontitis in Osteoclasts, Inflammation-Inducing Cells, and Ligature-Induced Rats. Nutrients 2022, 14, 4869. [Google Scholar] [CrossRef] [PubMed]
- Hu, Q.; Acharya, A.; Leung, W.K.; Pelekos, G. Sponsorship Bias in Clinical Trials in the Dental Application of Probiotics: A Meta–Epidemiological Study. Nutrients 2022, 14, 3409. [Google Scholar] [CrossRef]
- Cheney, G. Vitamin U therapy of peptic ulcer. Calif. Med. 1952, 77, 248–252. [Google Scholar] [PubMed]
- Kim, W.S.; Yang, Y.J.; Min, H.G.; Song, M.G.; Lee, J.S.; Park, K.Y.; Kim, J.J.; Sung, J.H.; Choi, J.S.; Cha, H.J. Accelerated wound healing by S-methylmethionine sulfonium: Evidence of dermal fibroblast activation via the ERK1/2 pathway. Pharmacology 2010, 85, 68–76. [Google Scholar] [CrossRef] [PubMed]
- Cheney, G. Rapid healing of peptic ulcers in patients receiving fresh cabbage juice. Calif. Med. 1949, 70, 10–15. [Google Scholar] [PubMed]
- Saito, M.; Marumo, K. The Effects of Homocysteine on the Skeleton. Curr. Osteoporos. Rep. 2018, 16, 554–560. [Google Scholar] [CrossRef]
- Menon, K.; Marquina, C.; Hoj, P.; Liew, D.; Mousa, A.; de Courten, B. Carnosine and histidine-containing dipeptides improve dyslipidemia: A systematic review and meta-analysis of randomized controlled trials. Nutr. Rev. 2020, 78, 939–951. [Google Scholar] [CrossRef]
- Maeno, M.; Ito-Kato, E.; Suzuki, N.; Takada, T.; Takayama, T.; Ito, K.; Otsuka, K. Effect of beta-alanyl-L-histidinato zinc on the differentiation pathway of human periodontal ligament cells. Life Sci. 2004, 74, 2493–2504. [Google Scholar] [CrossRef] [PubMed]
- Ito-Kato, E.; Suzuki, N.; Maeno, M.; Takada, T.; Tanabe, N.; Takayama, T.; Ito, K.; Otsuka, K. Effect of carnosine on runt-related transcription factor-2/core binding factor alpha–1 and Sox9 expressions of human periodontal ligament cells. J. Periodontal Res. 2004, 39, 199–204. [Google Scholar] [CrossRef]
- Balci, N.; Kurgan, Ş.; Çekici, A.; Çakır, T.; Serdar, M.A. Free amino acid composition of saliva in patients with healthy periodontium and periodontitis. Clin. Oral Investig. 2021, 25, 4175–4183. [Google Scholar] [CrossRef]
- Asgari, M.M.; Brasky, T.M.; White, E. Association of vitamin A and carotenoid intake with melanoma risk in a large prospective cohort. J. Investig. Dermatol. 2012, 132, 1573–1582. [Google Scholar] [CrossRef]


| Objects | Total | Heart Disease | Dyslipidemia | Kidney Disease | Diabetes Mellitus | |||||
|---|---|---|---|---|---|---|---|---|---|---|
| Heart Disease | Non | Dyslipidemia | Non | Kidney Disease | Non | Diabetes Mellitus | Non | |||
| Total | 94 | 49 | 45 | 20 | 74 | 35 | 59 | 28 | 66 | |
| Sex | Male | 75 | 37 | 38 | 18 | 57 | 31 | 44 | 23 | 52 |
| Female | 19 | 12 | 7 | 2 | 17 | 4 | 15 | 5 | 14 | |
| Age | 70 (49−85) | 69 (49−85) | 71 (51−83) | 72 (51−85) | 70 (49−85) | 73 (49−85) | 69 (51−85) | 71 (51−85) | 69 (49−85) | |
| Visit of dental clinic | Within 6 months | 49 | 26 | 23 | 11 | 38 | 17 | 32 | 15 | 34 |
| Over 6 months | 45 | 23 | 22 | 9 | 36 | 18 | 27 | 13 | 32 | |
| Periodontal status | Extent (localized/generalized) | 84/10 | 44/5 | 40/5 | 18/2 | 66/8 | 28/7 | 56/3 | 25/3 | 59/7 |
| Stage (1/2/3/4) | 10/24/37/23 | 5 /13/21/11 | 5/11/17/12 | 6/4/4/6 | 4/21/33/17 | 4/9/13/9 | 6/15/24/14 | 2/7/16/4 | 8/17/22/19 | |
| Grade (A/B/C) | 19/46/29 | 10 /21/ 18 | 9/25/11 | 5/9/6 | 14/37/23 | 6/16/13 | 13/30/16 | 5/13/10 | 14/33/19 | |
| Examination item | Number of teeth | 25 (2−32) | 25 (3−32) | 25 (2−30) | 24.5 (4−29) | 25 (2−32) | 25 (12−32) | 24 (2−30) | 26 (4−30) | 24 (2−32) |
| Median of PD (mm) | 2.6 (2.1−5.2) | 2.6 (2.1−5.0) | 2.6 (2.1−5.2) | 2.6 (2.1−3.7) | 2.6 (2.1−5.2) | 2.6 (2.1−5.2) | 2.6 (2.1−5.0) | 2.6 (2.1−3.7) | 2.6 (2.1−5.2) | |
| Rate of PD 4–5 mm (%) | 4.10 (0−50.0) | 3.50 (0−50.0) | 4.8 (0−39.5) | 3.8 (0−30.1) | 4.5 (0−50.0) | 4.7 (0−50.0) | 4.0 (0−25.0) | 4.9 (0−38.7) | 3.6 (0−50.0) | |
| Rate of PD ≥6 mm (%) | 0 (0−32.5) | 0 (0−31.7) | 0.6 (0−32.5) | 0.4 (0−16.7) | 0 (0−32.5) | 0.01 (0−32.5) | 0 (0−31.7) | 0.31 (0−16.7) | 0 (0−32.5) | |
| Median of CAL (mm) | 3.65 (2.3−8.3) | 3.6 (2.3−6.6) | 3.8 (2.4−8.3) | 3.8 (2.3−6.6) | 3.6 (2.4−8.3) | 3.9 (2.4−8.2) | 3.6 (2.3−8.3) | 3.8 (2.6−5.7) | 3.6 (2.3−8.3) | |
| BOP rate (%) | 13.0 (1.3−63.0) | 12.9 (1.3−63.0) | 13.0 (1.8−42.3) | 10.8 (1.3−42.3) | 13.6 (1.7−63.0) | 12.9 (1.3−63.0) | 13.0 (1.3−61.7) | 10.4 (1.3−41.7) | 13.6 (1.3−63.0) | |
| PISA (mm2) | 146.7 (7.1−1131.2) | 154.4 (12.7−1131.2) | 143.6 (7.1−915.4) | 140.9 (12.7−915.4) | 154.7 (7.1−1131.2) | 154.4 (22.9−1131.2) | 143.6 (7.1−660.0) | 136.9 (12.7−680.7) | 154.7 (7.1−1131.2) | |
| PESA (mm2) | 1148.3 (132.7−2068.1) | 1134.3 (132.7−2068.1) | 1152.7 (137.3−2030.9) | 1028.3 (246.3−1875.4) | 1161.6 (132.7−2068.1) | 1180.3 (637.8−2068.1) | 1116.5 (132.7−1679.7) | 1180.4 (246.3−2030.9) | 1119.1 (132.7−2068.1) | |
| PISA/PESA | 0.16 (0.012−0.710) | 0.157 (0.012−0.710) | 0.170 (0.015−0.488) | 0.137 (0.012−0.488) | 0.170 (0.015−0.71) | 0.163 (0.024−0.609) | 0.157 (0.012−0.71) | 0.117 (0.012−0.484) | 0.165 (0.015−0.71) | |
| PCR (%) | 34.3 (3.6−98.1) | 33.7 (3.6−98.1) | 35.0 (6.0−88.0) | 26.7 (3.6−73.1) | 37.0 (6.0−98.1) | 39.1 (7.7−97.2) | 32.7 (3.6−98.1) | 37.0 (7.7−77.6) | 33.2 (3.6−98.1) | |
| Number of missing molars | 4 (0−16) | 4 (0−12) | 4 (0−16) | 4 (0−16) | 4 (0−16) | 4 (0−11) | 4 (0−16) | 3 (0−16) | 4 (0−16) | |
| Classification of Eichner | 4 (1−9) | 4 (1−9) | 4 (1−9) | 4 (1−9) | 4 (1−9) | 4 (1−8) | 4 (1−9) | 4 (1−9) | 4 (1−9) | |
| Environmental Factors | Nutritional Factors | |||||||||||||
|---|---|---|---|---|---|---|---|---|---|---|---|---|---|---|
| Age | Smoking | Br Index | BMI | Noodle | Pork, Beef, Mutton | Processed Meat | Tofu | Yogurt | Dark Green Vegetables | Cabbage, Napa Cabbage | Carrot, Squash | Other Vegetables | Mushrooms | |
| Stage | 0.013 | 0.039 | 0.054 | 0.022 | −0.114 | −0.201 * | −0.038 | −0.240 * | −0.155 | −0.221 * | −0.214 * | −0.277 ** | −0.200 | −0.279 ** |
| Grade | −0.095 | 0.226 * | 0.227 * | 0.034 | −0.125 | −0.208 * | −0.141 | −0.213 * | −0.210 * | −0.312 ** | −0.266 ** | −0.332 ** | −0.266 ** | −0.259 * |
| Number of teeth (n) | −0.279 ** | 0.088 | 0.007 | 0.087 | −0.051 | 0.234 * | 0.005 | 0.160 | 0.116 | 0.232 ** | 0.146 | 0.101 | 0.056 | 0.335 ** |
| PD (mm) | −0.102 | 0.101 | −0.061 | 0.028 | −0.165 | −0.160 | −0.229 * | −0.283 ** | −0.331 ** | −0.320 ** | −0.408 ** | −0.228 * | −0.225 * | −0.162 |
| Rate of PD 4–5 mm (%) | −0.049 | 0.309 ** | 0.032 | 0.064 | −0.203 * | −0.174 | −0.156 | −0.188 | −0.268 ** | −0.203 | −0.333 ** | −0.119 | −0.039 | −0.069 |
| Rate of PD ≥6 mm (%) | −0.017 | −0.124 | −0.149 | −0.102 | −0.099 | −0.064 | −0.204 * | −0.230 * | −0.229 * | −0.257 * | −0.309 ** | −0.211 * | −0.265 ** | −0.165 |
| CAL (mm) | 0.191 | 0.040 | 0.042 | −0.119 | 0.000 | −0.351 ** | −0.136 | −0.204 | −0.158 | −0.325 ** | −0.182 | −0.145 | −0.169 | −0.294 ** |
| BOP rate (%) | −0.188 | 0.277 ** | 0.077 | 0.091 | −0.254 * | −0.127 | −0.222 * | −0.240 * | −0.269 ** | −0.223 * | −0.286 ** | −0.177 | −0.161 | −0.079 |
| PISA (mm2) | −0.291 ** | 0.291 ** | 0.082 | 0.129 | −0.191 | −0.070 | −0.205 * | −0.191 | −0.229 * | −0.130 | −0.270 ** | −0.153 | −0.122 | 0.006 |
| PESA (mm2) | −0.376 ** | 0.217 * | 0.017 | 0.167 | −0.118 | 0.099 | −0.109 | −0.028 | −0.072 | 0.059 | −0.073 | −0.034 | −0.049 | 0.224 * |
| PISA/PESA | −0.189 | 0.264 * | 0.053 | 0.104 | −0.256 * | −0.117 | −0.211 * | −0.226 * | −0.257 * | −0.198 | −0.265 ** | −0.183 | −0.166 | −0.074 |
| rs > 0.20 | rs < −0.25 | rs < −0.20 | rs < −0.15 | |||||||||||
| Nutritional Factors | ||||||||
|---|---|---|---|---|---|---|---|---|
| Analysis Clinical Parameters | Correlation Coefficient |rs| > 0.15 | Multiple Regression Analysis | ||||||
| *: p < 0.05 **: p < 0.01 | Standardized Partial Regression Coefficient | Collinearity Statistics | R R2 Regression Variation | DW | MAE | |||
| Tolerance | VIF | |||||||
| Stage | •Processed meat •Yogurt •Dark green vegetable •Cabbage, Napa cabbage •Carrot, Squash •Other vegetables •Mushrooms | •Carrot, Squash •Mushrooms •Constant term ** | −0.1712 −0.2239 - | 0.6039 0.6039 - | 1.6558 1.6558 - | 0.2902 0.0842 p < 0.01 | 2.02 | 0.55 |
| Grade | •Processed meat •Yogurt •Dark green vegeta-ble •Cabbage, Napa cab-bage •Carrot, Squash •Other vegetables •Mushrooms | •Dark green vegetables •Carrot, Squash •Constant term ** | −0.1712 −0.2239 - | 0.6039 0.6039 - | 1.6558 1.6558 - | 0.3294 0.1085 p < 0.01 | 1.81 | 0.55 |
| Number of Teeth | •Pork, Beef, Mutton •Tofu •Dark green vegetables •Mushrooms | •Mushrooms ** •Constant term ** | 0.3355 - | 1.0000 - | 1.0000 - | 0.3208 0.1029 p < 0.01 | 2.08 | 4.96 |
| PD (mm) | All 10 nutritional factors | •Noodle •Tofu •Yogurt * •Cabbage, Napa cabbage * •Constant term ** | −0.1356 −0.1344 −0.2143 −0.2724 - | 0.9897 0.8510 0.8815 0.7777 - | 1.0104 1.1750 1.1344 1.2858 - | 0.4565 0.2084 p < 0.001 | 2.02 | 0.33 |
| Rate of PD 4–5 mm (%) | •Noodle •Pork, Beef, Mutton •Processed meat •Tofu •Yogurt •Dark green vegetable •Cabbage, Napa cabbage | •Noodle •Yogurt •Cabbage, Napa cabbage * •Constant term ** | −0.1796 −0.1827 −0.2549 - | 0.9897 0.8866 0.8787 - | 1.0104 1.1278 1.1380 - | 0.3409 0.1162 p < 0.01 | 2.05 | 7.0 |
| Rate of PD ≥6 mm (%) | •Processed meat •Tofu •Yogurt •Dark green vegetable •Cabbage, Napa cabbage •Carrot, Squash •Other vegetables •Mushrooms | •Cabbage, Napa cabbage * •Other vegetables •Constant term ** | −0.2512 −0.1718 - | 0.8311 0.8311 - | 1.2033 1.2033 - | 0.3151 0.0993 p < 0.01 | 2.07 | 2.96 |
| CAL (mm) | •Pork, Beef, Mutton •Tofu •Yogurt •Dark green vegetable •Cabbage, Napa cabbage •Carrot, squash •Other vegetables | •Pork, Beef, Mutton * •Dark green vegetables ** •Constant term ** | −0.2237 −0.2667 - | 0.9331 0.9331 - | 1.0717 1.0717 - | 0.3653 0.1334 p < 0.001 | 2.04 | 0.71 |
| BOP rate (%) | •Noodle •Processed meat •Tofu •Yogurt •Dark green vegetables •Cabbage, Napa cabbage •Carrot, Squash •Other vegetables | •Tofu •Yogurt •Cabbage, Napa cabbage •Constant term ** | −0.1391 −0.1843 −0.1716 - | 0.8510 0.8827 0.7850 - | 1.1750 1.1329 1.2739 - | 0.3209 0.1030 p < 0.01 | 2.15 | 9.27 |
| PISA (mm2) | •Noodle •Processed meat •Tofu •Yogurt •Cabbage, Napa cabbage •Carrot, Squash | •Yogurt •Cabbage, Napa cabbage * •Constant term ** | −0.1561 −0.2172 - | 0.8879 0.8879 - | 1.1263 1.1263 - | 0.2727 0.0744 p < 0.05 | 2.29 | 156.9 |
| PESA (mm2) | •Mushrooms | •Mushrooms * •Constant term ** | 0.2236 - | 1.0000 - | 1.0000 - | 0.1992 0.0397 p < 0.05 | 2.28 | 258.5 |
| PISA /PESA | •Noodle •Processed meat •Tofu •Yogurt •Dark green vegetables •Cabbage, Napa cabbage •Carrot, Squash •Other vegetables | •Yogurt •Cabbage, Napa cabbage •Constant term ** | −0.1897 −0.2019 - | 0.8879 0.8879 - | 1.1263 1.1263 - | 0.2876 0.0827 p < 0.01 | 2.14 | 0.101 |
| Environmental Factors | ||||||||
|---|---|---|---|---|---|---|---|---|
| Analysis Clinical Parameters | Correlation Coefficient |rs| > 0.15 | Multiple Regression Analysis | ||||||
| *: p < 0.05 **: p < 0.01 | Standardized Partial Regression Coefficient | Collinearity Statistics | R R2 Regression Variation | DW | MAE | |||
| Tolerance | VIF | |||||||
| Stage | N/A | N/A | - | - | - | - | - | - |
| Grade | •Smoking •Br Index | •Br Index * •constant term** | 0.2269 - | 1.0000 - | 1.0000 - | 0.2030 0.0412 p < 0.05 | 1.68 | 0.53 |
| Number of Teeth | •Age | •Age ** •constant term** | −0.2794 - | 1.0000 | 1.0000 | 0.2608 0.0680 p < 0.01 | 2.00 | 4.9 |
| PD (mm) | N/A | N/A | - | - | - | - | - | - |
| Rate of PD 4–5 mm (%) | •Smoking | •Smoking ** •constant term ** | 0.3092 - | 1.0000 - | 1.0000 - | 0.2929 0.0858 p < 0.01 | 2.18 | 7.1 |
| Rate of PD ≥6 mm (%) | N/A | N/A | - | - | - | - | - | - |
| CAL (mm) | •Age | •Age •constant term * | 0.1913 - | 1.0000 - | 1.0000 - | 0.1616 0.0261 p < 0.05 | 2.10 | 0.77 |
| BOP rate (%) | •Age •Smoking | •Age •Smoking * •constant term ** | −0.1637 0.2616 - | 0.9911 0.9911 - | 1.0090 1.0090 - | 0.2891 0.0836 p < 0.01 | 2.12 | 9.1 |
| PISA (mm2) | •Age •Smoking | •Age •Smoking * •constant term ** | −0.2656 0.2657 - | 0.9911 0.9911 - | 1.0090 1.0090 - | 0.3687 0.1359 p < 0.001 | 2.25 | 150.7 |
| PESA (mm2) | •Age •Smoking | •Age ** •Smoking •constant term ** | −0.3591 0.1831 - | 0.9911 0.9911 - | 1.0090 1.0090 - | 0.3959 0.1568 p < 0.001 | 2.27 | 247.4 |
| PISA/PESA | •Age •Smoking | •Age •Smoking * •constant term ** | −0.1654 0.2486 - | 0.9911 0.9911 - | 1.0090 1.0090 - | 0.2776 0.0771 p < 0.01 | 2.09 | 0.099 |
| Environmental Factors | ||||||||
|---|---|---|---|---|---|---|---|---|
| Analysis Clinical Parameters | Multiple Regression Analysis Explanatory Variable *: p < 0.05 **: p < 0.01 | Stratified Descriptive Statistics | Testing of Differences of Population Mean | |||||
| Stratified Standard of Explanatory Variable | Numbers | Mean ± SD of Explanatory Variable | Correlation Ratio (η2) *: p < 0.05 **: p < 0.01 | Hypothesis Testing for the Homogeneity of the Variances | Methods | p Value Statistical Power | ||
| Number of teeth | •Age * | <20 20≤ | 22 72 | 73.0 ± 6.07 67.8 ± 9.19 | 0.0632 * | p < 0.05 | t-test | p < 0.05 * 0.6933 |
| Rate of PD 4–5 mm (%) | •Smoking * | <2.0 2.0≤ | 31 63 | 0.48 ± 0.63 0.64 ± 0.70 | 0.0111 | p = 0.49 | Welch t-test | 0.29 0.1803 |
| BOP rate (%) | •Smoking * | <10 10≤ | 33 61 | 0.39 ± 0.50 0.69 ± 0.74 | 0.0434 * | p < 0.05 | t-test | p < 0.05 * 0.5246 |
| PISA (mm2) | •Smoking * | < 232 232 ≤ | 63 31 | 0.46 ± 0.59 0.84 ± 0.78 | 0.0695 * | p = 0.07 | Welch t-test | p < 0.05 * 0.6479 |
| PESA (mm2) | •Age * | < 1026 1026 ≤ | 29 65 | 72.8 ± 5.85 67.3 ± 9.48 | 0.0814 ** | p < 0.01 | t-test | p < 0.01 ** 0.8068 |
| PISA /PESA | •Smoking * | < 0.22 0.22 ≤ | 63 31 | 0.43 ± 0.56 0.90 ± 0.79 | 0.1093 ** | p < 0.05 | t-test | p < 0.01 ** 0.9139 |
| Nutritional Factors | ||||||||
|---|---|---|---|---|---|---|---|---|
| Analysis Clinical Parameters | Multiple Regression Analysis Explanatory Variable *: p < 0.05 **: p < 0.01 | Stratified Descriptive Statistics | Testing of Differences of Population Mean | |||||
| Stratified Standard of Explanatory Variable | Numbers | Mean ± SD of Explanatory Variable | Correlation Ratio (η2) *: p < 0.05 **: p < 0.01 | Hypothesis Testing for the Homogeneity of the Variances | Methods | p Value Statistical Power | ||
| Number of teeth | •Mushrooms | <20 20≤ | 22 72 | 2.50 ± 1.19 3.81 ± 1.56 | 0.1241 ** | p = 0.16 | Welch t-test | p < 0.001 *** 0.9833 |
| PD (mm) | •Yogurt * | <3.0 3.0≤ | 73 21 | 4.26 ± 2.00 2.57 ± 2.04 | 0.1226 ** | p = 0.87 | Welch t-test | p < 0.01 ** 0.9306 |
| •Cabbage, Napa cabbage * | 4.75 ± 1.10 3.76 ± 1.73 | 0.0981 ** | p < 0.01 | t-test | p < 0.01 ** 0.8791 | |||
| Rate of PD 4–5 mm (%) | •Cabbage, napa cabbage * | <2.0 2.0≤ | 31 63 | 4.68 ± 1.08 4.46 ± 1.44 | 0.0060 | p = 0.09 | Welch t-test | p = 0.41 0.1279 |
| Rate of PD ≥6 mm (%) | •Cabbage, napa cabbage * | <1.0 1.0≤ | 61 33 | 4.57 ± 1.06 4.46 ± 1.68 | 0.0019 | p < 0.01 | t-test | p = 0.68 0.0695 |
| CAL (mm) | •Pork, Beef, Mutton * | <4.0 4.0≤ | 63 31 | 4.29 ± 1.25 3.68 ± 0.79 | 0.0623 * | p <0.01 | t-test | p < 0.05 * 0.6870 |
| •Dark green vegetables ** | 4.49 ± 1.73 3.32 ± 1.85 | 0.0897 ** | p = 0.64 | Welch t-test | p < 0.01 ** 0.8241 | |||
| PISA (mm2) | •Cabbage, napa cabbage * | <232 232≤ | 63 31 | 4.67 ± 1.19 4.26 ± 1.55 | 0.0212 | p = 0.08 | Welch t-test | p = 0.20 0.2448 |
| PESA (mm2) | •Mushrooms * | <1026 1026≤ | 29 65 | 72.8 ± 5.85 67.3 ± 9.48 | 0.0285 | p < 0.01 | Welch t-test | p = 0.10 0.3745 |
Disclaimer/Publisher’s Note: The statements, opinions and data contained in all publications are solely those of the individual author(s) and contributor(s) and not of MDPI and/or the editor(s). MDPI and/or the editor(s) disclaim responsibility for any injury to people or property resulting from any ideas, methods, instructions or products referred to in the content. |
© 2023 by the authors. Licensee MDPI, Basel, Switzerland. This article is an open access article distributed under the terms and conditions of the Creative Commons Attribution (CC BY) license (https://creativecommons.org/licenses/by/4.0/).
Share and Cite
Nakayama, Y.; Tabe, S.; Yamaguchi, A.; Tsuruya, Y.; Kobayashi, R.; Oyama, K.; Kitano, D.; Kojima, K.; Kogawa, R.; Okumura, Y.; et al. Identification of Nutritional Factors to Evaluate Periodontal Clinical Parameters in Patients with Systemic Diseases. Nutrients 2023, 15, 365. https://doi.org/10.3390/nu15020365
Nakayama Y, Tabe S, Yamaguchi A, Tsuruya Y, Kobayashi R, Oyama K, Kitano D, Kojima K, Kogawa R, Okumura Y, et al. Identification of Nutritional Factors to Evaluate Periodontal Clinical Parameters in Patients with Systemic Diseases. Nutrients. 2023; 15(2):365. https://doi.org/10.3390/nu15020365
Chicago/Turabian StyleNakayama, Yohei, Shinichi Tabe, Arisa Yamaguchi, Yuto Tsuruya, Ryoki Kobayashi, Katsunori Oyama, Daisuke Kitano, Keisuke Kojima, Rikitake Kogawa, Yasuo Okumura, and et al. 2023. "Identification of Nutritional Factors to Evaluate Periodontal Clinical Parameters in Patients with Systemic Diseases" Nutrients 15, no. 2: 365. https://doi.org/10.3390/nu15020365