
The Application of Clustering on Principal Components for Nutritional Epidemiology: A Workflow to Derive Dietary Patterns
 , , and
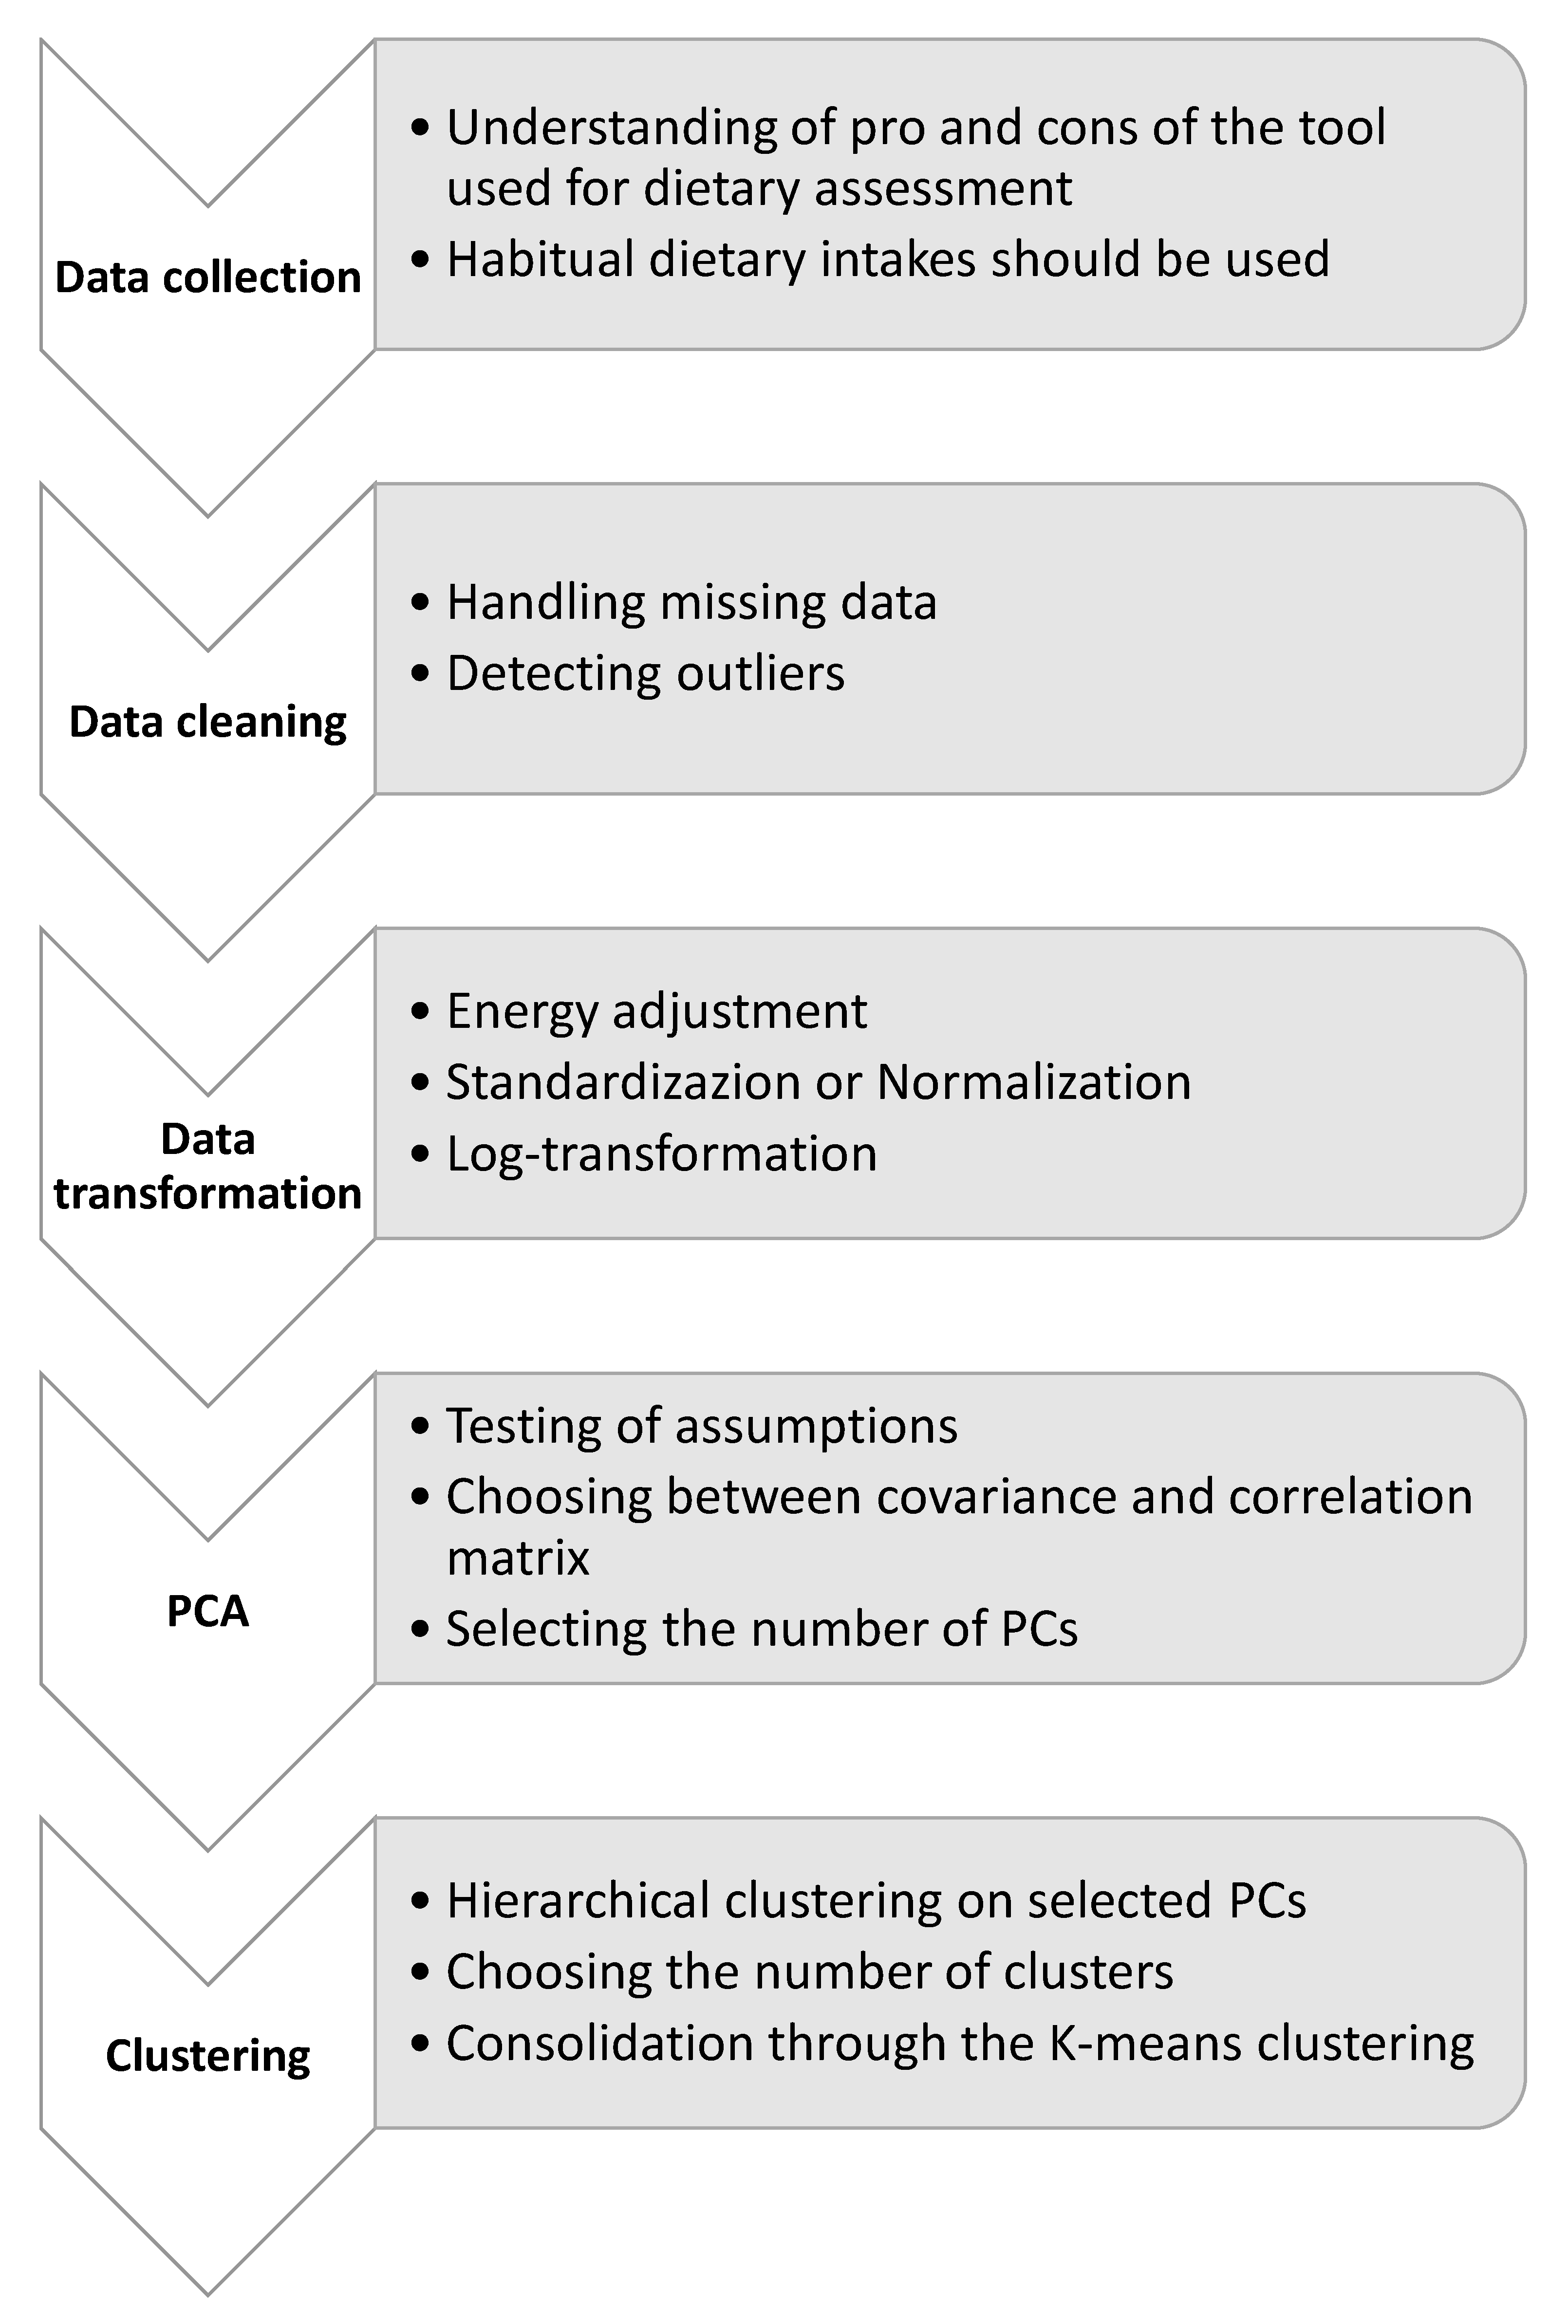
Abstract
:1. Introduction
2. Materials and Methods
2.1. Study Design
2.2. Data Collection
2.3. Data Cleaning
2.4. Data Transformation
2.5. Principal Component Analysis
2.6. Clustering and Consolidation
2.7. Statistical Analysis
3. Results
4. Discussion
5. Conclusions
Supplementary Materials
Author Contributions
Funding
Institutional Review Board Statement
Informed Consent Statement
Data Availability Statement
Acknowledgments
Conflicts of Interest
References
- Mozaffarian, D.; Rosenberg, I.; Uauy, R. History of modern nutrition science-implications for current research, dietary guidelines, and food policy. BMJ 2018, 361, k2392. [Google Scholar] [CrossRef] [PubMed] [Green Version]
- Woodside, J.V.; McCall, D.; McGartland, C.; Young, I.S. Micronutrients: Dietary intake v. supplement use. Proc. Nutr. Soc. 2005, 64, 543–553. [Google Scholar] [CrossRef] [PubMed] [Green Version]
- Mente, A.; de Koning, L.; Shannon, H.S.; Anand, S.S. A systematic review of the evidence supporting a causal link between dietary factors and coronary heart disease. Arch. Int. Med. 2009, 169, 659–669. [Google Scholar] [CrossRef] [PubMed] [Green Version]
- Waijers, P.M.; Feskens, E.J.; Ocké, M.C. A critical review of predefined diet quality scores. Br. J. Nutr. 2007, 97, 219–231. [Google Scholar] [CrossRef] [Green Version]
- Martinez-Lacoba, R.; Pardo-Garcia, I.; Amo-Saus, E.; Escribano-Sotos, F. Mediterranean diet and health outcomes: A systematic meta-review. Eur. J. Public Health 2018, 28, 955–961. [Google Scholar] [CrossRef] [Green Version]
- Guo, X.; Warden, B.A.; Paeratakul, S.; Bray, G.A. Healthy Eating Index and obesity. Eur. J. Clin. Nutr. 2004, 58, 1580–1586. [Google Scholar] [CrossRef] [Green Version]
- Barchitta, M.; Maugeri, A.; La Mastra, C.; Rosa, M.C.; Favara, G.; Lio, R.M.S.; Agodi, A. Dietary Antioxidant Intake and Human Papillomavirus Infection: Evidence from a Cross-Sectional Study in Italy. Nutrients 2020, 12, 1384. [Google Scholar] [CrossRef]
- Marcos-Pardo, P.J.; González-Gálvez, N.; Espeso-García, A.; Abelleira-Lamela, T.; López-Vivancos, A.; Vaquero-Cristóbal, R. Association among Adherence to the Mediterranean Diet, Cardiorespiratory Fitness, Cardiovascular, Obesity, and Anthropometric Variables of Overweight and Obese Middle-Aged and Older Adults. Nutrients 2020, 12, 2750. [Google Scholar] [CrossRef]
- Maugeri, A.; Hruskova, J.; Jakubik, J.; Kunzova, S.; Sochor, O.; Barchitta, M.; Agodi, A.; Bauerova, H.; Medina-Inojosa, J.R.; Vinciguerra, M. Dietary antioxidant intake decreases carotid intima media thickness in women but not in men: A cross-sectional assessment in the Kardiovize study. Free Radic. Biol. Med. 2019, 131, 274–281. [Google Scholar] [CrossRef]
- Zheng, J.; Merchant, A.T.; Wirth, M.D.; Zhang, J.; Antwi, S.O.; Shoaibi, A.; Shivappa, N.; Stolzenberg-Solomon, R.Z.; Hebert, J.R.; Steck, S.E. Inflammatory potential of diet and risk of pancreatic cancer in the Prostate, Lung, Colorectal and Ovarian (PLCO) Cancer Screening Trial. Int. J. Cancer 2018, 142, 2461–2470. [Google Scholar] [CrossRef]
- Fowler, M.E.; Akinyemiju, T.F. Meta-analysis of the association between dietary inflammatory index (DII) and cancer outcomes. Int. J. Cancer 2017, 141, 2215–2227. [Google Scholar] [CrossRef] [PubMed] [Green Version]
- Orlich, M.J.; Fraser, G.E. Vegetarian diets in the Adventist Health Study 2: A review of initial published findings. Am. J. Clin. Nutr. 2014, 100 (Suppl. S1), 353S–358S. [Google Scholar] [CrossRef] [PubMed] [Green Version]
- Barchitta, M.; Quattrocchi, A.; Adornetto, V.; Marchese, A.E.; Agodi, A. Tumor necrosis factor-alpha -308 G>A polymorphism, adherence to Mediterranean diet, and risk of overweight/obesity in young women. Biomed. Res. Int. 2014, 2014, 742620. [Google Scholar] [CrossRef] [PubMed]
- Steck, S.E.; Murphy, E.A. Dietary patterns and cancer risk. Nat. Rev. Cancer 2020, 20, 125–138. [Google Scholar] [CrossRef] [PubMed]
- Lara, K.M.; Levitan, E.B.; Gutierrez, O.M.; Shikany, J.M.; Safford, M.M.; Judd, S.E.; Rosenson, R.S. Dietary Patterns and Incident Heart Failure in U.S. Adults Without Known Coronary Disease. J. Am. Coll. Cardiol. 2019, 73, 2036–2045. [Google Scholar] [CrossRef]
- Maugeri, A.; Barchitta, M.; Favara, G.; La Rosa, M.C.; La Mastra, C.; Magnano San Lio, R.; Agodi, A. Maternal Dietary Patterns Are Associated with Pre-Pregnancy Body Mass Index and Gestational Weight Gain: Results from the "Mamma & Bambino" Cohort. Nutrients 2019, 11, 1308. [Google Scholar] [CrossRef] [Green Version]
- Maugeri, A.; Hruskova, J.; Jakubik, J.; Hlinomaz, O.; Medina-Inojosa, J.R.; Barchitta, M.; Agodi, A.; Vinciguerra, M. How dietary patterns affect left ventricular structure, function and remodelling: Evidence from the Kardiovize Brno 2030 study. Sci. Rep. 2019, 9, 19154. [Google Scholar] [CrossRef] [Green Version]
- Agodi, A.; Maugeri, A.; Kunzova, S.; Sochor, O.; Bauerova, H.; Kiacova, N.; Barchitta, M.; Vinciguerra, M. Association of Dietary Patterns with Metabolic Syndrome: Results from the Kardiovize Brno 2030 Study. Nutrients 2018, 10, 898. [Google Scholar] [CrossRef] [Green Version]
- Barchitta, M.; Maugeri, A.; Quattrocchi, A.; Agrifoglio, O.; Scalisi, A.; Agodi, A. The Association of Dietary Patterns with High-Risk Human Papillomavirus Infection and Cervical Cancer: A Cross-Sectional Study in Italy. Nutrients 2018, 10, 469. [Google Scholar] [CrossRef] [Green Version]
- Shab-Bidar, S.; Golzarand, M.; Hajimohammadi, M.; Mansouri, S. A posteriori dietary patterns and metabolic syndrome in adults: A systematic review and meta-analysis of observational studies. Public Health Nutr. 2018, 21, 1681–1692. [Google Scholar] [CrossRef]
- Htun, N.C.; Suga, H.; Imai, S.; Shimizu, W.; Takimoto, H. Food intake patterns and cardiovascular risk factors in Japanese adults: Analyses from the 2012 National Health and nutrition survey, Japan. Nutr. J. 2017, 16, 61. [Google Scholar] [CrossRef] [PubMed] [Green Version]
- Mertens, E.; Markey, O.; Geleijnse, J.M.; Givens, D.I.; Lovegrove, J.A. Dietary Patterns in Relation to Cardiovascular Disease Incidence and Risk Markers in a Middle-Aged British Male Population: Data from the Caerphilly Prospective Study. Nutrients 2017, 9, 75. [Google Scholar] [CrossRef] [PubMed] [Green Version]
- Rezagholizadeh, F.; Djafarian, K.; Khosravi, S.; Shab-Bidar, S. A posteriori healthy dietary patterns may decrease the risk of central obesity: Findings from a systematic review and meta-analysis. Nutr. Res. 2017, 41, 1–13. [Google Scholar] [CrossRef] [PubMed]
- Atkins, J.L.; Whincup, P.H.; Morris, R.W.; Lennon, L.T.; Papacosta, O.; Wannamethee, S.G. Dietary patterns and the risk of CVD and all-cause mortality in older British men. Br. J. Nutr. 2016, 116, 1246–1255. [Google Scholar] [CrossRef] [PubMed] [Green Version]
- Jia, Q.; Xia, Y.; Zhang, Q.; Wu, H.; Du, H.; Liu, L.; Wang, C.; Shi, H.; Guo, X.; Liu, X.; et al. Dietary patterns are associated with prevalence of fatty liver disease in adults. Eur. J. Clin. Nutr. 2015, 69, 914–921. [Google Scholar] [CrossRef]
- Sun, J.; Buys, N.J.; Hills, A.P. Dietary pattern and its association with the prevalence of obesity, hypertension and other cardiovascular risk factors among Chinese older adults. Int. J. Environ. Res. Public Health 2014, 11, 3956–3971. [Google Scholar] [CrossRef]
- Couto, E.; Boffetta, P.; Lagiou, P.; Ferrari, P.; Buckland, G.; Overvad, K.; Dahm, C.C.; Tjønneland, A.; Olsen, A.; Clavel-Chapelon, F.; et al. Mediterranean dietary pattern and cancer risk in the EPIC cohort. Br. J. Cancer 2011, 104, 1493–1499. [Google Scholar] [CrossRef] [Green Version]
- Barchitta, M.; Maugeri, A.; Agrifoglio, O.; Favara, G.; La Mastra, C.; La Rosa, M.C.; Magnano San Lio, R.; Agodi, A. Dietary patterns and school performance: Evidence from a sample of adolescents in Sicily, Italy. Ann. Ig 2019, 31. [Google Scholar]
- Lever, J.; Krzywinski, M.; Altman, N. Principal component analysis. Nat. Methods 2017, 14, 641–642. [Google Scholar] [CrossRef] [Green Version]
- Barchitta, M.; Maugeri, A.; Magnano San Lio, R.; Favara, G.; La Rosa, M.C.; La Mastra, C.; Quattrocchi, A.; Agodi, A. Dietary Patterns are Associated with Leukocyte LINE-1 Methylation in Women: A Cross-Sectional Study in Southern Italy. Nutrients 2019, 11, 1843. [Google Scholar] [CrossRef] [Green Version]
- Altman, N.; Krzywinski, M. Clustering. Nat. Methods 2017, 14, 545–546. [Google Scholar] [CrossRef]
- Moeller, S.M.; Reedy, J.; Millen, A.E.; Dixon, L.B.; Newby, P.K.; Tucker, K.L.; Krebs-Smith, S.M.; Guenther, P.M. Dietary patterns: Challenges and opportunities in dietary patterns research an Experimental Biology workshop, April 1, 2006. J. Am. Diet. Assoc. 2007, 107, 1233–1239. [Google Scholar] [CrossRef] [PubMed]
- Chen, H.; Ward, M.H.; Graubard, B.I.; Heineman, E.F.; Markin, R.M.; Potischman, N.A.; Russell, R.M.; Weisenburger, D.D.; Tucker, K.L. Dietary patterns and adenocarcinoma of the esophagus and distal stomach. Am. J. Clin. Nutr. 2002, 75, 137–144. [Google Scholar] [CrossRef] [PubMed] [Green Version]
- Costacou, T.; Bamia, C.; Ferrari, P.; Riboli, E.; Trichopoulos, D.; Trichopoulou, A. Tracing the Mediterranean diet through principal components and cluster analyses in the Greek population. Eur. J. Clin. Nutr. 2003, 57, 1378–1385. [Google Scholar] [CrossRef]
- Newby, P.; Tucker, K. Empirically Derived Eating Patterns Using Factor or Cluster Analysis: A Review. Nutr. Rev. 2004, 62, 177–203. [Google Scholar] [CrossRef]
- Newby, P.K.; Muller, D.; Tucker, K.L. Associations of empirically derived eating patterns with plasma lipid biomarkers: A comparison of factor and cluster analysis methods. Am. J. Clin. Nutr. 2004, 80, 759–767. [Google Scholar] [CrossRef] [Green Version]
- Crozier, S.R.; Robinson, S.M.; Borland, S.E.; Inskip, H.M.; Group, S.S. Dietary patterns in the Southampton Women’s Survey. Eur. J. Clin. Nutr. 2006, 60, 1391–1399. [Google Scholar] [CrossRef] [Green Version]
- Smith, A.D.; Emmett, P.M.; Newby, P.K.; Northstone, K. A comparison of dietary patterns derived by cluster and principal components analysis in a UK cohort of children. Eur. J. Clin. Nutr. 2011, 65, 1102–1109. [Google Scholar] [CrossRef] [Green Version]
- Husson, F.; Josse, J.; Pagès, J. Principal Component Methods—Hierarchical Clustering—Partitional Clustering: Why Would We Need to Choose for Visualizing Data? Available online: https://www.semanticscholar.org/paper/Principal-component-methods-hierarchical-clustering-Josse/04335d99d840ac3370f5aeb262828cf127d3ff1c (accessed on 1 November 2022).
- Maugeri, A.; Barchitta, M.; Magnano San Lio, R.; Favara, G.; La Rosa, M.C.; La Mastra, C.; Basile, G.; Agodi, A. Adherence to the Mediterranean diet partially mediates socioeconomic differences in leukocyte LINE-1 methylation: Evidence from a cross-sectional study in Italian women. Sci. Rep. 2020, 10, 14360. [Google Scholar] [CrossRef]
- Maugeri, A.; Barchitta, M.; Fiore, V.; Rosta, G.; Favara, G.; La Mastra, C.; La Rosa, M.C.; Magnano San Lio, R.; Agodi, A. Determinants of Adherence to the Mediterranean Diet: Findings from a Cross-Sectional Study in Women from Southern Italy. Int. J. Environ. Res. Public Health 2019, 16, 2963. [Google Scholar] [CrossRef] [Green Version]
- Barchitta, M.; Maugeri, A.; Quattrocchi, A.; Barone, G.; Mazzoleni, P.; Catalfo, A.; De Guidi, G.; Iemmolo, M.G.; Crimi, N.; Agodi, A. Mediterranean Diet and Particulate Matter Exposure Are Associated With LINE-1 Methylation: Results From a Cross-Sectional Study in Women. Front. Genet. 2018, 9, 514. [Google Scholar] [CrossRef] [PubMed]
- Agodi, A.; Barchitta, M.; Quattrocchi, A.; Maugeri, A.; Canto, C.; Marchese, A.E.; Vinciguerra, M. Low fruit consumption and folate deficiency are associated with LINE-1 hypomethylation in women of a cancer-free population. Genes Nutr. 2015, 10, 480. [Google Scholar] [CrossRef] [PubMed] [Green Version]
- Shim, J.S.; Oh, K.; Kim, H.C. Dietary assessment methods in epidemiologic studies. Epidemiol. Health 2014, 36, e2014009. [Google Scholar] [CrossRef] [PubMed] [Green Version]
- Maugeri, A.; Barchitta, M. A Systematic Review of Ecological Momentary Assessment of Diet: Implications and Perspectives for Nutritional Epidemiology. Nutrients 2019, 11, 2696. [Google Scholar] [CrossRef] [Green Version]
- Barchitta, M.; Maugeri, A.; La Rosa, M.C.; Magnano San Lio, R.; Favara, G.; Panella, M.; Cianci, A.; Agodi, A. Single Nucleotide Polymorphisms in Vitamin D Receptor Gene Affect Birth Weight and the Risk of Preterm Birth: Results From the "Mamma & Bambino" Cohort and A Meta-Analysis. Nutrients 2018, 10, 1172. [Google Scholar] [CrossRef] [Green Version]
- Malarvizhi, R.; Thanamani, A. K-nearest neighbor in missing data imputation. Int. J. Eng. Res. Dev. 2012, 5, 5–7. [Google Scholar]
- Willett, W.; Stampfer, M.J. Total energy intake: Implications for epidemiologic analyses. Am. J. Epidemiol. 1986, 124, 17–27. [Google Scholar] [CrossRef]
- Willett, W.C.; Howe, G.R.; Kushi, L.H. Adjustment for total energy intake in epidemiologic studies. Am. J. Clin. Nutr. 1997, 65, 1220S–1228S, discussion 1229S–1231S. [Google Scholar] [CrossRef] [Green Version]
- Willett, W. Nutritional Epidemiology, 3rd ed.; Oxford University Press: Oxford, UK, 2013; Volume 40, ISBN 978-0-19-975403-8. [Google Scholar]
- Maugeri, A.; Barchitta, M.; Basile, G.; Agodi, A. Applying a hierarchical clustering on principal components approach to identify different patterns of the SARS-CoV-2 epidemic across Italian regions. Sci. Rep. 2021, 11, 7082. [Google Scholar] [CrossRef]
- Argüelles, M.; Benavides, C.; Fernández, I. A new approach to the identification of regional clusters: Hierarchical clustering on principal components. Appl. Econ. 2014, 46, 2511–2519. [Google Scholar] [CrossRef]
- Barchitta, M.; Maugeri, A.; Favara, G.; Riela, P.M.; La Mastra, C.; La Rosa, M.C.; San Lio, R.M.; Gallo, G.; Mura, I.; Agodi, A.; et al. Cluster analysis identifies patients at risk of catheter-associated urinary tract infections in intensive care units: Findings from the SPIN-UTI Network. J. Hosp. Infect. 2021, 107, 57–63. [Google Scholar] [CrossRef] [PubMed]
- Maugeri, A.; Barchitta, M.; Agodi, A. A Clustering Approach to Classify Italian Regions and Provinces Based on Prevalence and Trend of SARS-CoV-2 Cases. Int. J. Environ. Res. Public Health 2020, 17, 5286. [Google Scholar] [CrossRef]
- Böcker, A.; Derksen, S.; Schmidt, E.; Teckentrup, A.; Schneider, G. A hierarchical clustering approach for large compound libraries. J. Chem. Inf. Model. 2005, 45, 807–815. [Google Scholar] [CrossRef] [PubMed]
- Varshavsky, R.; Horn, D.; Linial, M. Global considerations in hierarchical clustering reveal meaningful patterns in data. PLoS One 2008, 3, e2247. [Google Scholar] [CrossRef] [PubMed]
- Maugeri, A.; Barchitta, M.; Agrifoglio, O.; Favara, G.; La Mastra, C.; La Rosa, M.C.; Magnano San Lio, R.; Panella, M.; Cianci, A.; Agodi, A. The impact of social determinants and lifestyles on dietary patterns during pregnancy: Evidence from the “Mamma & Bambino” study. Ann. Ig 2019, 31, 81–89. [Google Scholar]


Disclaimer/Publisher’s Note: The statements, opinions and data contained in all publications are solely those of the individual author(s) and contributor(s) and not of MDPI and/or the editor(s). MDPI and/or the editor(s) disclaim responsibility for any injury to people or property resulting from any ideas, methods, instructions or products referred to in the content. |
© 2022 by the authors. Licensee MDPI, Basel, Switzerland. This article is an open access article distributed under the terms and conditions of the Creative Commons Attribution (CC BY) license (https://creativecommons.org/licenses/by/4.0/).
Share and Cite
Maugeri, A.; Barchitta, M.; Favara, G.; La Mastra, C.; La Rosa, M.C.; Magnano San Lio, R.; Agodi, A. The Application of Clustering on Principal Components for Nutritional Epidemiology: A Workflow to Derive Dietary Patterns. Nutrients 2023, 15, 195. https://doi.org/10.3390/nu15010195
Maugeri A, Barchitta M, Favara G, La Mastra C, La Rosa MC, Magnano San Lio R, Agodi A. The Application of Clustering on Principal Components for Nutritional Epidemiology: A Workflow to Derive Dietary Patterns. Nutrients. 2023; 15(1):195. https://doi.org/10.3390/nu15010195
Chicago/Turabian StyleMaugeri, Andrea, Martina Barchitta, Giuliana Favara, Claudia La Mastra, Maria Clara La Rosa, Roberta Magnano San Lio, and Antonella Agodi. 2023. "The Application of Clustering on Principal Components for Nutritional Epidemiology: A Workflow to Derive Dietary Patterns" Nutrients 15, no. 1: 195. https://doi.org/10.3390/nu15010195