
Front-of-Package Nutrition Labeling and Its Impact on Food Industry Practices: A Systematic Review of the Evidence


Abstract
:1. Introduction
2. Materials and Methods
2.1. Inclusion Criteria and Exclusion Criteria
2.2. Information Sources and Search
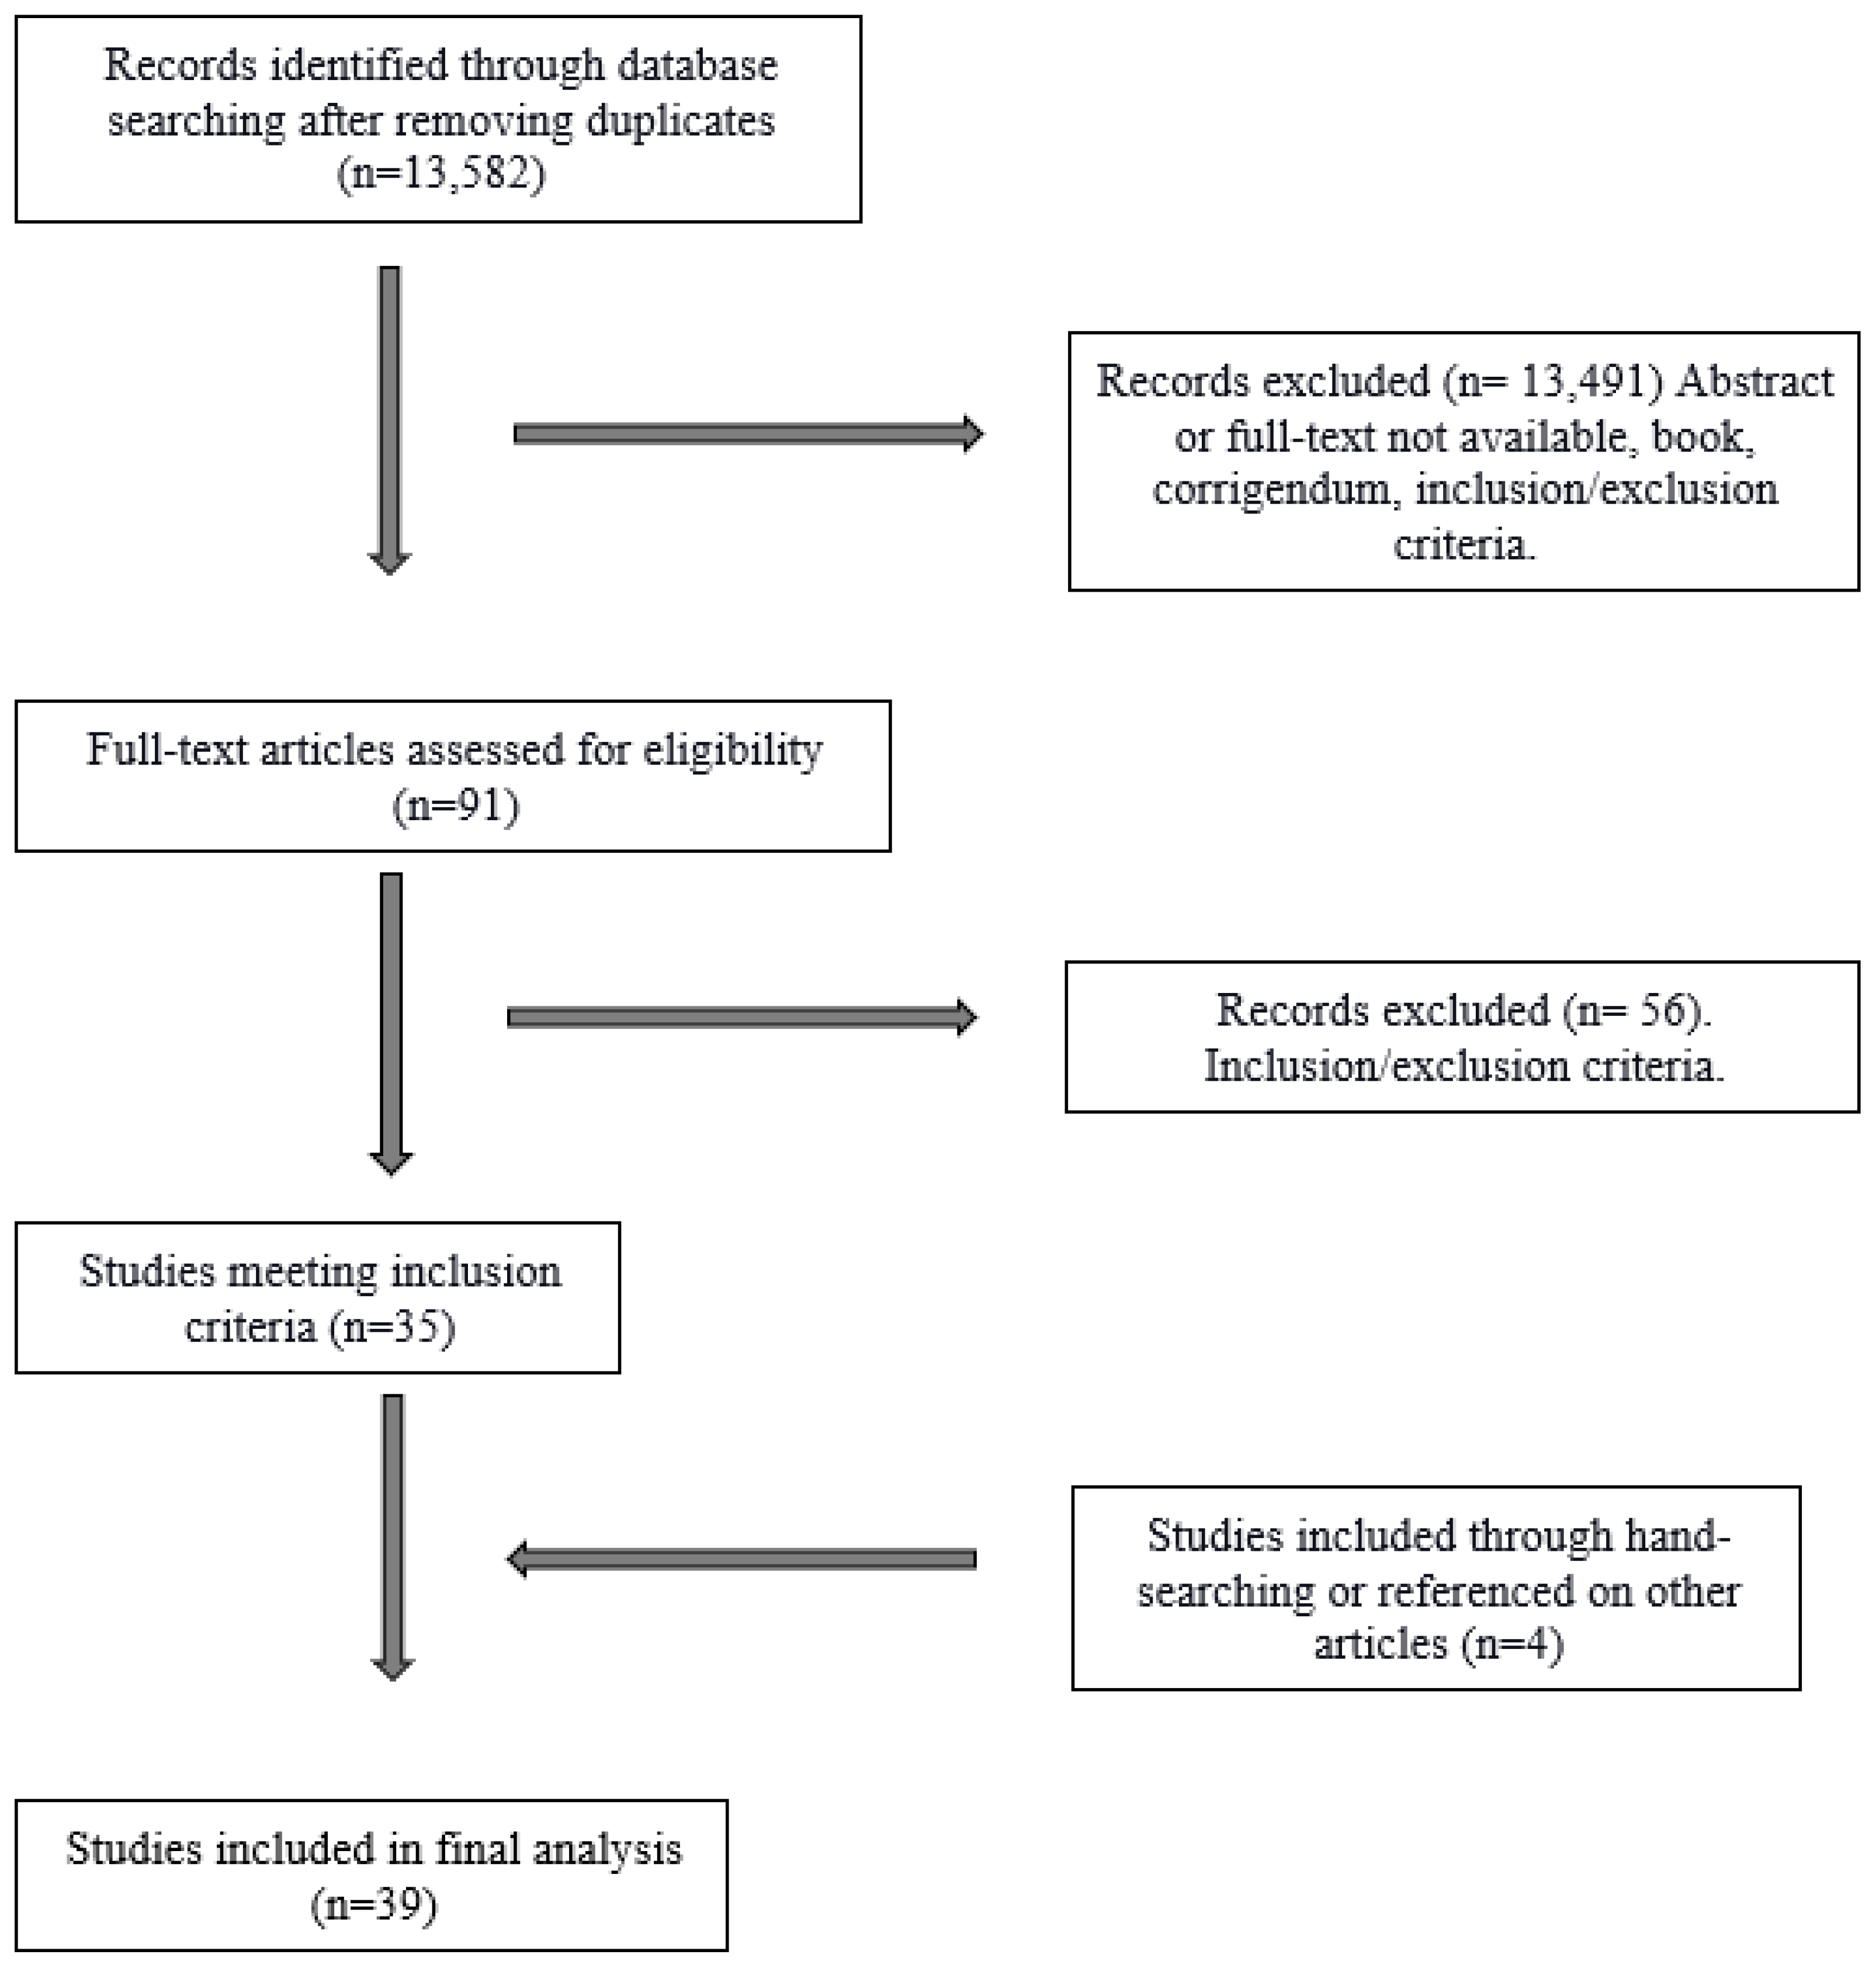
2.3. Article Review and Study Selection
2.4. Data Extraction
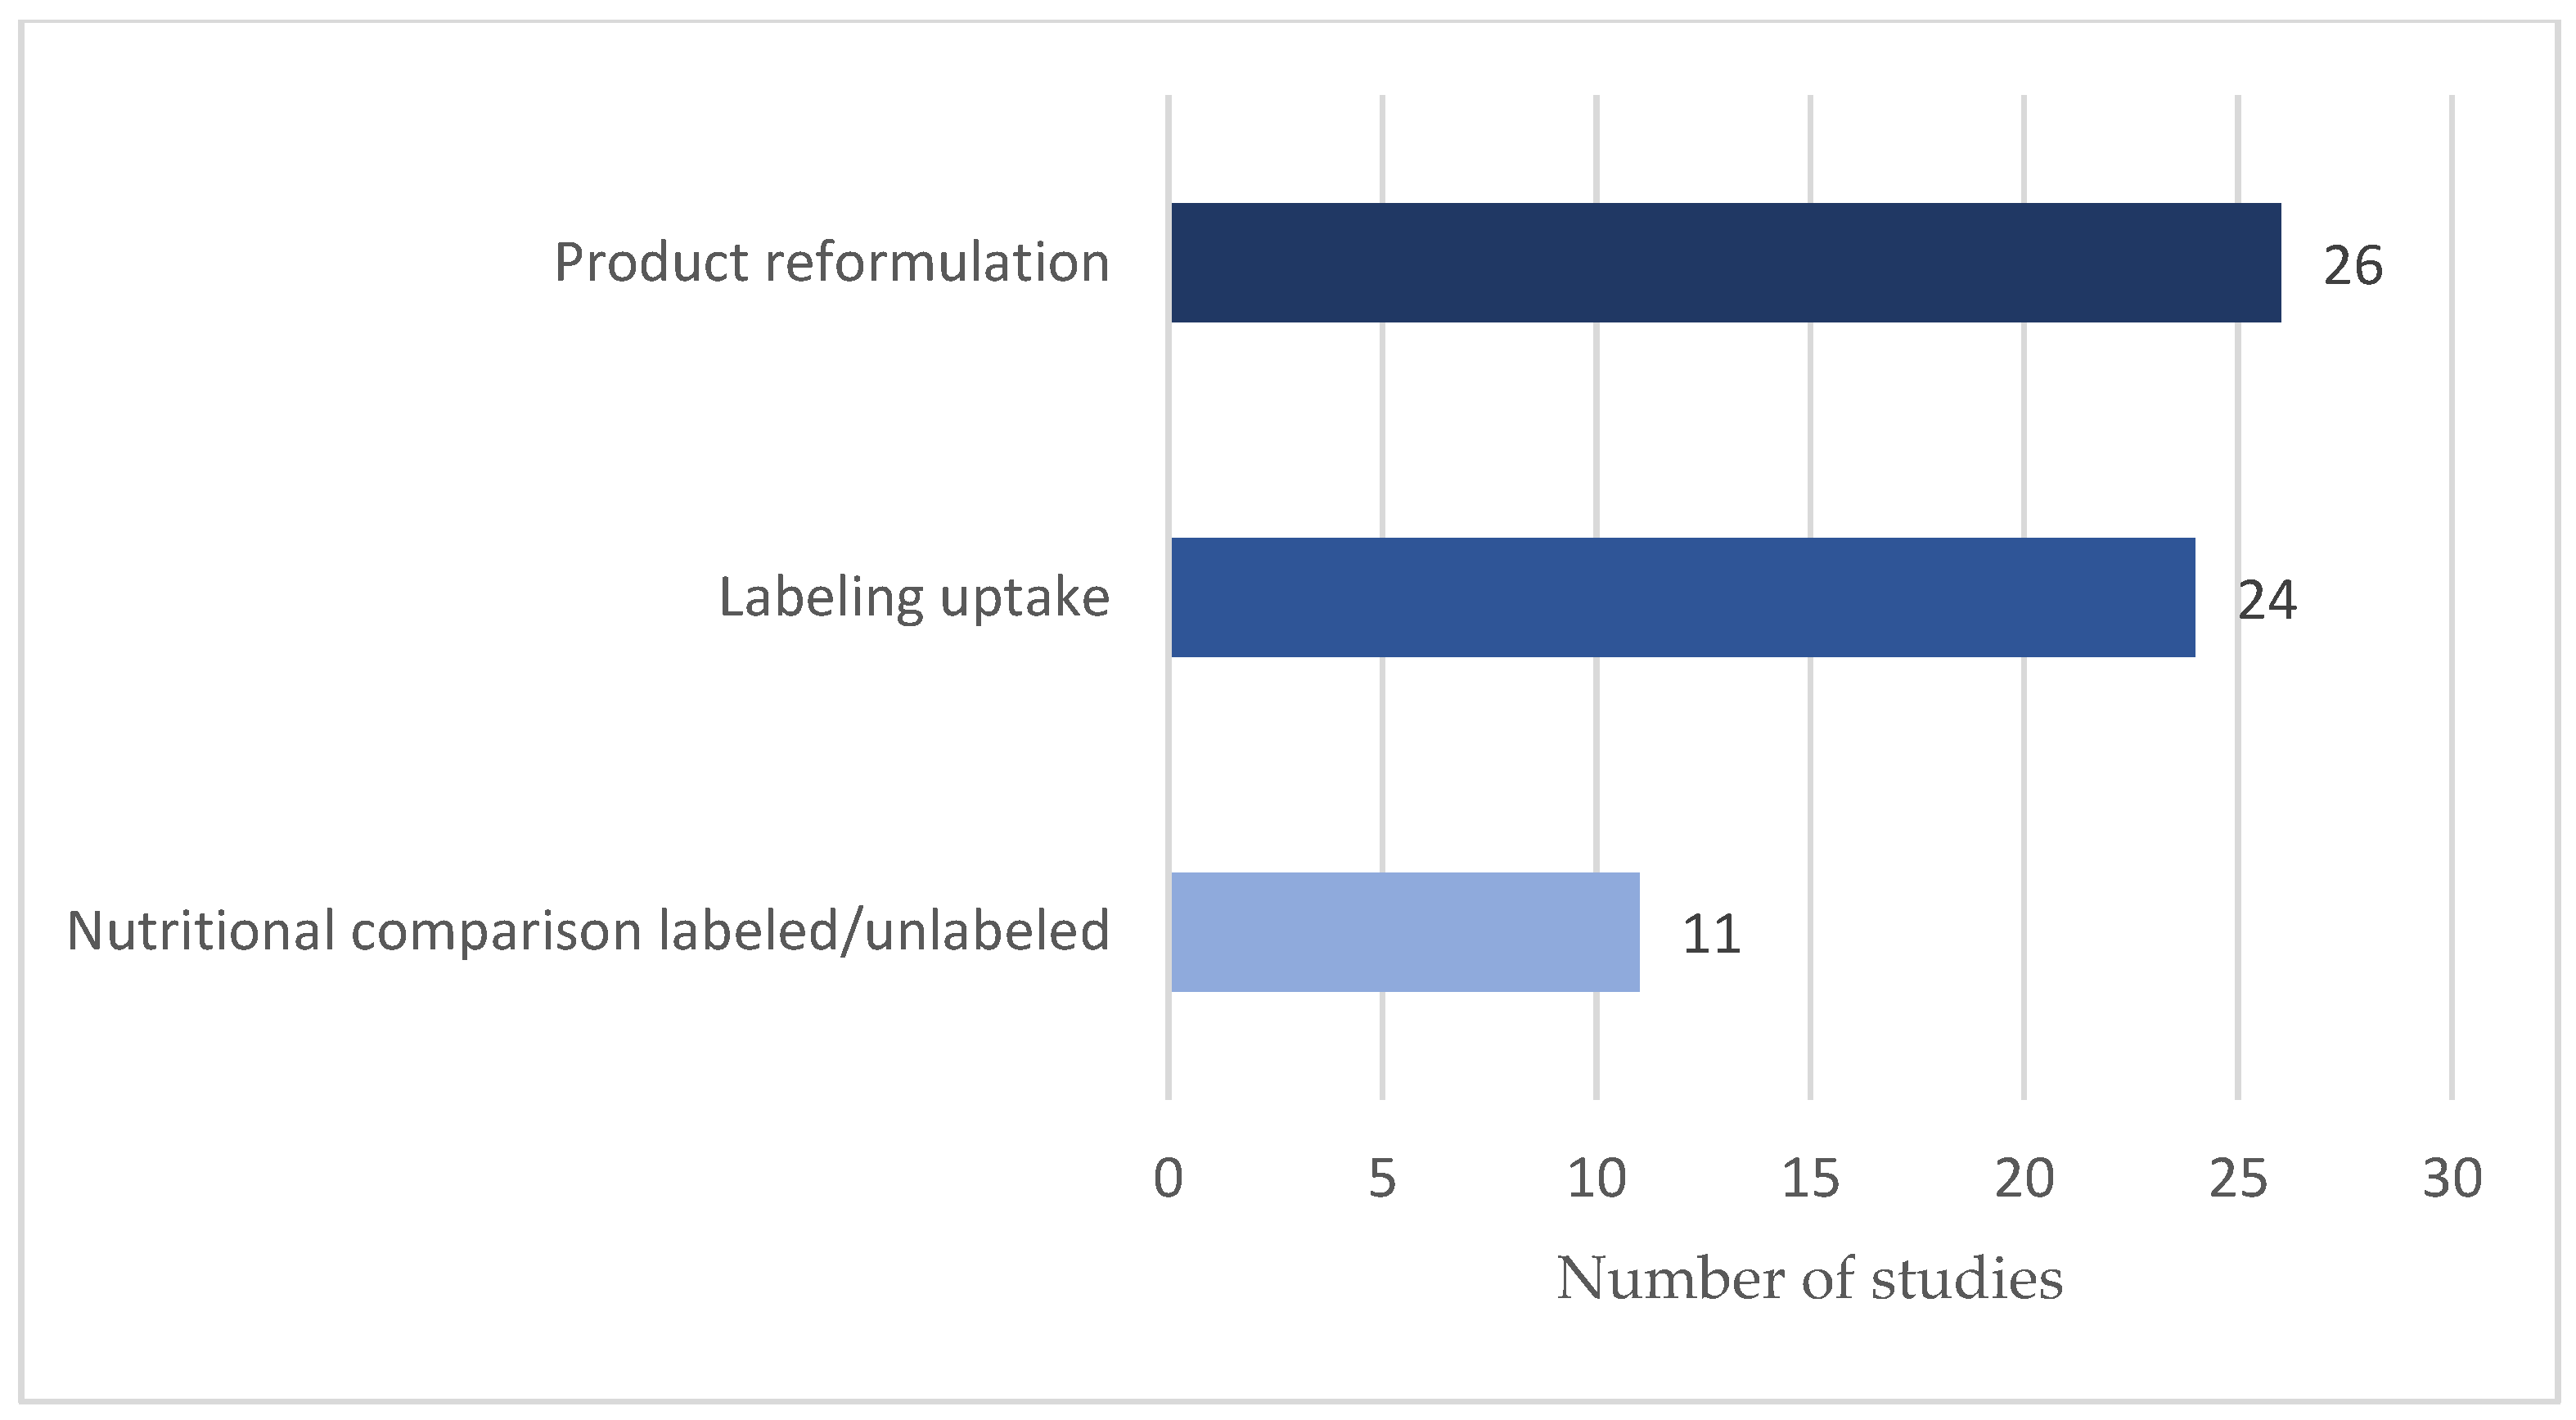
3. Results
3.1. Product Reformulation
3.2. Labeling Uptake
3.3. Nutritional Comparison between Labeled and Unlabeled Products
4. Discussion
5. Conclusions
Author Contributions
Funding
Institutional Review Board Statement
Informed Consent Statement
Data Availability Statement
Acknowledgments
Conflicts of Interest
Appendix A. Search Protocol
| Questions | What is the effect of front-of-package labels on food manufacturers’ practices? What effect do different front-of-package label designs have on product reformulation? What effect do different enforcement styles have on food manufacturers’ practices? | |
| Search Strategy | Database Sources | PubMed → 1980 results Public Affairs Information Service International (PAIS Index) →367 results Cochrane → 2 Reviews, 370 Trials SCOPUS → 7586 results ABI/Inform (Business and Management) → 1912 results. After excluding magazines and newspapers → 1280 results. Only retrieved the first 1000 more relevant due to site restrictions. Google Scholar Multiple database search using EBSCO → 6574 results Spanish database Scielo → 154 results added extra Spanish words Total: |
| Search Date & Terms | Search date: 1 September 2020 Second date: 9 May 2021 Third date: 28 May 2021 Key Terms: “Nutrition label*” “Nutrition logo” “Front of Pack*” “Food label*” “Warning Label*” Extra Key terms Spanish databases: “Logo nutricional” “Etiquetado nutricional” | |
| Ancestry Search | References of articles Grey literature Working papers | |
| Study Selection & Rating | Inclusion Criteria | Natural and quasi-experimental studies that evaluate modifications to the nutritional characteristics of the food and beverage supply after a government or non-government organization implemented a standardized interpretative FOP label or labelling uptake. Both voluntary and mandatory approaches included. The years included in the search included 1 January 1990, to 31 August 2020 Outcomes of interest: Product reformulation before and after labelling implementation. Nutrient-specific changes. Labelling uptake Nutritional comparison between labeled and unlabeled products English & Spanish language only. |
| Exclusion Criteria | FOP labeling referred to non-nutrient-based claims such as Organic, GMO, country of origin; product-specific industry claims; health or nutrition claims. Non-interpretative FOP label (monochrome numerical information). FOP for alcohol. No front-of-pack nutrition labels. Abstract or PDF not available | |
| Primary Screening | One person screening of titles and abstracts for relevance | |
| Secondary Screening | Two people screening of full articles for relevance | |
Appendix B. Methodology—Search Strategy and Key MESH Terms Included
References
- World Health Organization. Obesity and Overweight. 2021. Available online: https://www.who.int/news-room/fact-sheets/detail/obesity-and-overweight (accessed on 24 June 2021).
- Zobel, E.H.; Hansen, T.W.; Rossing, P.; von Scholten, B.J. Global Changes in Food Supply and the Obesity Epidemic. Curr. Obes. Rep. 2016, 5, 449–455. [Google Scholar] [CrossRef]
- Van Raaij, J.; Hendriksen, M.; Verhagen, H. Potential for improvement of population diet through reformulation of commonly eaten foods. Public Health Nutr. 2009, 12, 325–330. [Google Scholar] [CrossRef] [PubMed] [Green Version]
- Griffith, R.; O’Connell, M.; Smith, K. The Importance of Product Reformulation Versus Consumer Choice in Improving Diet Quality. Economica 2017, 84, 34–53. [Google Scholar] [CrossRef] [Green Version]
- Restrepo, B.J.; Rieger, M. Denmark’s Policy on Artificial Trans Fat and Cardiovascular Disease. Am. J. Prev. Med. 2016, 50, 69–76. [Google Scholar] [CrossRef]
- Gressier, M.; Sassi, F.; Frost, G. Healthy foods and healthy diets. How government policies can steer food reformulation. Nutrients 2020, 12, 1992. [Google Scholar] [CrossRef]
- Rothman, R.L.; Housam, R.; Weiss, H.; Davis, D.; Gregory, R.; Gebretsadik, T.; Shintani, A.; Elasy, T.A. Patient Understanding of Food Labels: The Role of Literacy and Numeracy. Am. J. Prev. Med. 2006, 31, 391–398. [Google Scholar] [CrossRef]
- Grunert, K.G.; Fernández-Celemín, L.; Wills, J.M.; Bonsmann, S.S.G.; Nureeva, L. Use and understanding of nutrition information on food labels in six European countries. J. Public Health 2010, 18, 261–277. [Google Scholar] [CrossRef] [PubMed] [Green Version]
- Barahona, N.; Otero, C.; Otero, S. Equilibrium Effects of Food Labeling Policies. Econometrica 2023, 91, 839–868. [Google Scholar] [CrossRef]
- Andrews, J.C.; Burton, S.; Kees, J. Is Simpler Always Better? Consumer Evaluations of Front-of-Package Nutrition Symbols. J. Public Policy Mark. 2011, 30, 175–190. [Google Scholar] [CrossRef] [Green Version]
- Hawkes, C.; Smith, T.G.; Jewell, J.; Wardle, J.; Hammond, R.A.; Friel, S.; Thow, A.M.; Kain, J. Smart food policies for obesity prevention. Lancet 2015, 385, 2410–2421. [Google Scholar] [CrossRef]
- World Cancer Research Fund International. Building Momentum: Lessons on Implementing a Robust Front-of-Pack Food Label; WCRFI: London, UK, 2019; Available online: https://www.wcrf.org/policy/our-publications/building-momentum-series/lessons-implementing-robust-front-of-pack-food-label (accessed on 31 May 2023).
- Egnell, M.; Talati, Z.; Hercberg, S.; Pettigrew, S.; Julia, C. Objective Understanding of Front-of-Package Nutrition Labels: An International Comparative Experimental Study across 12 Countries. Nutrients 2018, 10, 1542. [Google Scholar] [CrossRef] [Green Version]
- Roberto, C.A.; Bragg, M.A.; Seamans, M.J.; Mechulan, R.L.; Novak, N.; Brownell, K.D. Evaluation of Consumer Understanding of Different Front-of-Package Nutrition Labels, 2010–2011. Prev. Chronic Dis. 2012, 9, E149. [Google Scholar] [CrossRef] [Green Version]
- Roberto, C.A.; Ng, S.W.; Ganderats-Fuentes, M.; Hammond, D.; Barquera, S.; Jauregui, A.; Taillie, L.S. The Influence of Front-of-Package Nutrition Labeling on Consumer Behavior and Product Reformulation. Annu. Rev. Nutr. 2021, 41, 529–550. [Google Scholar] [CrossRef]
- Correa, T.; Fierro, C.; Reyes, M.; Carpentier, F.R.D.; Taillie, L.S.; Corvalan, C. Responses to the Chilean law of food labeling and advertising: Exploring knowledge, perceptions and behaviors of mothers of young children. Int. J. Behav. Nutr. Phys. Act. 2019, 16, 21. [Google Scholar] [CrossRef] [PubMed]
- Méjean, C.; Macouillard, P.; Péneau, S.; Hercberg, S.; Castetbon, K. Consumer acceptability and understanding of front-of-pack nutrition labels. J. Hum. Nutr. Diet. 2013, 26, 494–503. [Google Scholar] [CrossRef] [PubMed]
- Acton, R.B.; Jones, A.C.; Kirkpatrick, S.I.; Roberto, C.A.; Hammond, D. Taxes and front-of-package labels improve the healthiness of beverage and snack purchases: A randomized experimental marketplace. Int. J. Behav. Nutr. Phys. Act. 2019, 16, 46. [Google Scholar] [CrossRef]
- Levy, A.S.; Mathews, O.; Stephenson, M.; Tenney, J.E.; Schucker, R.E. The Impact of a Nutrition Information Program on Food Purchases. J. Public Policy Mark. 1985, 4, 1–13. [Google Scholar] [CrossRef]
- Fichera, E.; von Hinke, S. The response to nutritional labels: Evidence from a quasi-experiment. J. Health Econ. 2020, 72, 102326. [Google Scholar] [CrossRef]
- Song, J.; Brown, M.K.; Tan, M.; MacGregor, G.A.; Webster, J.; Campbell, N.R.C.; Trieu, K.; Ni Mhurchu, C.; Cobb, L.K.; He, F.J. Impact of color-coded and warning nutrition labelling schemes: A systematic review and network meta-analysis. PLoS Med. 2021, 18, e1003765. [Google Scholar] [CrossRef]
- Hawley, K.L.; Roberto, C.A.; Bragg, M.; Liu, P.; Schwartz, M.B.; Brownell, K.D. The science on front-of-package food labels. Public Health Nutr. 2013, 16, 430–439. [Google Scholar] [CrossRef] [PubMed]
- Shangguan, S.; Afshin, A.; Shulkin, M.; Ma, W.; Marsden, D.; Smith, J.; Saheb-Kashaf, M.; Shi, P.; Micha, R.; Imamura, F.; et al. A Meta-Analysis of Food Labeling Effects on Consumer Diet Behaviors and Industry Practices. Am. J. Prev. Med. 2019, 56, 300–314. [Google Scholar] [CrossRef]
- Page, M.J.; McKenzie, J.E.; Bossuyt, P.M.; Boutron, I.; Hoffmann, T.C.; Mulrow, C.D.; Shamseer, L.; Tetzlaff, J.M.; Akl, E.A.; Brennan, S.E.; et al. The PRISMA 2020 Statement: An Updated Guideline for Reporting Systematic Reviews. BMJ 2021, 372, n71. [Google Scholar] [CrossRef]
- Alé-Chilet, J.; Moshary, S. Beyond Consumer Switching: Supply Responses to Food Packaging and Advertising Regulations. SSRN Electron. J. 2020, 41, 211–432. [Google Scholar] [CrossRef]
- Kanter, R.; Vanderlee, L.; Vandevijvere, S. Front-of-package nutrition labelling policy: Global progress and future directions. Public Health Nutr. 2018, 21, 1399–1408. [Google Scholar] [CrossRef] [PubMed] [Green Version]
- Azzopardi, D.J.; Lacy, K.E.; Woods, J.L. Energy Density of New Food Products Targeted to Children. Nutrients 2020, 12, 2242. [Google Scholar] [CrossRef] [PubMed]
- Bablani, L.; Ni Mhurchu, C.; Neal, B.; Skeels, C.L.; Staub, K.E.; Blakely, T. The impact of voluntary front-of-pack nutrition labelling on packaged food reformulation: A difference-in-differences analysis of the Australasian Health Star Rating scheme. PLoS Med. 2020, 17, e1003427. [Google Scholar] [CrossRef] [PubMed]
- Brownbill, A.L.; Braunack-Mayer, A.; Miller, C. Health Star Ratings: What’s on the labels of Australian beverages? Health Promot. J. Aust. Off. J. Aust. Assoc. Health Promot. Prof. 2019, 30, 114–118. [Google Scholar] [CrossRef] [Green Version]
- Carter, O.B.J.; Mills, B.W.; Lloyd, E.; Phan, T. An independent audit of the Australian food industry’s voluntary front-of-pack nutrition labelling scheme for energy-dense nutrition-poor foods. Eur. J. Clin. Nutr. 2013, 67, 31–35. [Google Scholar] [CrossRef]
- Castro, T.; Mackay, S.; Young, L.; Ni Mhurchu, C.; Shaw, G.; Tawfiq, E.; Eyles, H. Comparison of Healthiness, Labelling, and Price between Private and Branded Label Packaged Foods in New Zealand (2015–2019). Nutrients 2021, 13, 2731. [Google Scholar] [CrossRef]
- Dummer, J. Sodium Reduction in Canadian Food Products: With the Health Check Program. Can. J. Diet. Prac. Res. 2012, 73, e227–e232. [Google Scholar] [CrossRef]
- Edalati, S.; Omidvar, N.; Roudsari, A.H.; Ghodsi, D.; Zargaraan, A. Development and implementation of nutrition labelling in Iran: A retrospective policy analysis. Int. J. Health Plan. Manag. 2020, 35, e28–e44. [Google Scholar] [CrossRef] [PubMed] [Green Version]
- Elliott, C. Tracking Kids’ Food: Comparing the Nutritional Value and Marketing Appeals of Child-Targeted Supermarket Products Over Time. Nutrients 2019, 11, 1850. [Google Scholar] [CrossRef] [Green Version]
- Jones, A.; Shahid, M.; Neal, B. Uptake of Australia’s Health Star Rating System. Nutrients 2018, 10, 997. [Google Scholar] [CrossRef] [PubMed] [Green Version]
- Kanter, R.; Reyes, M.; Vandevijvere, S.; Swinburn, B.; Corvalán, C. Anticipatory effects of the implementation of the Chilean Law of Food Labeling and Advertising on food and beverage product reformulation. Obes. Rev. 2019, 20, 129–140. [Google Scholar] [CrossRef] [PubMed]
- Lawrence, M.A.; Dickie, S.; Woods, J.L. Do Nutrient-Based Front-of-Pack Labelling Schemes Support or Undermine Food-Based Dietary Guideline Recommendations? Lessons from the Australian Health Star Rating System. Nutrients 2018, 10, 32. [Google Scholar] [CrossRef] [PubMed] [Green Version]
- Lindberg, R.; Nichols, T.; Yam, C. The Healthy Eating Agenda in Australia. Is Salt a Priority for Manufacturers? Nutrients 2017, 9, 881. [Google Scholar] [CrossRef] [Green Version]
- Louie, J.C.Y.; Dunford, E.K.; Walker, K.Z.; Gill, T.P. Nutritional quality of Australian breakfast cereals. Are they improving? Appetite 2012, 59, 464–470. [Google Scholar] [CrossRef] [Green Version]
- Herrera, A.M.M.; Crino, M.; Erskine, H.E.; Sacks, G.; Ananthapavan, J.; Ni Mhurchu, C.; Lee, Y.Y. Cost-Effectiveness of Product Reformulation in Response to the Health Star Rating Food Labelling System in Australia. Nutrients 2018, 10, 614. [Google Scholar] [CrossRef] [Green Version]
- Ni Mhurchu, C.; Eyles, H.; Choi, Y.-H. Effects of a Voluntary Front-of-Pack Nutrition Labelling System on Packaged Food Reformulation: The Health Star Rating System in New Zealand. Nutrients 2017, 9, 918. [Google Scholar] [CrossRef] [Green Version]
- Morrison, H.; Meloncelli, N.; Pelly, F.E. Nutritional quality and reformulation of a selection of children’s packaged foods available in Australian supermarkets: Has the Health Star Rating had an impact? Nutr. Diet. 2019, 76, 296–304. [Google Scholar] [CrossRef]
- Ning, S.X.; Mainvil, L.A.; Thomson, R.K.; McLean, R.M. Dietary sodium reduction in New Zealand: Influence of the Tick label. Asia Pac. J. Clin. Nutr. 2017, 26, 1133–1138. [Google Scholar]
- Peñaherrera, V.; Carpio, C.; Sandoval, L.; Sánchez, M.; Cabrera, T.; Guerrero, P.; Borja, I. Efecto del etiquetado de semáforo en el contenido nutricional y el consumo de bebidas gaseosas en Ecuador. Rev. Panam. Salud Pública 2018, 42, 1–8. [Google Scholar] [CrossRef] [PubMed]
- Pulker, C.E.; Trapp, G.S.A.; Scott, J.A.; Pollard, C.M. Alignment of Supermarket Own Brand Foods’ Front-of-Pack Nutrition Labelling with Measures of Nutritional Quality: An Australian Perspective. Nutrients 2018, 10, 1465. [Google Scholar] [CrossRef] [PubMed] [Green Version]
- Quintiliano Scarpelli, D.; Pinheiro Fernandes, A.C.; Rodriguez Osiac, L.; Pizarro Quevedo, T. Changes in Nutrient Declaration after the Food Labeling and Advertising Law in Chile: A Longitudinal Approach. Nutrients 2020, 12, 2371. [Google Scholar] [CrossRef] [PubMed]
- Quitral, V.; Arteaga, J.; Rivera, M.; Galleguillos, J.; Valdés, I. Comparación del contenido de azúcares y edulcorantes no calóricos en néctares y bebidas antes y después de implementar la ley chilena 20.606 TT—Comparison of sugar and non- caloric sweetener content in beverages before and after implementing Chilean la. Rev. Chil. Nutr. 2019, 46, 245–253. [Google Scholar] [CrossRef] [Green Version]
- Reyes, M.; Smith Taillie, L.; Popkin, B.; Kanter, R.; Vandevijvere, S.; Corvalán, C. Changes in the amount of nutrient of packaged foods and beverages after the initial implementation of the Chilean Law of Food Labelling and Advertising: A nonexperimental prospective study. PLoS Med. 2020, 17, e1003220. [Google Scholar] [CrossRef]
- Sacks, G.; Robinson, E.; Cameron, A.J.; Vanderlee, L.; Vandevijvere, S.; Swinburn, B. Benchmarking the Nutrition-Related Policies and Commitments of Major Food Companies in Australia, 2018. Int. J. Environ. Res. Public Health 2020, 17, 6118. [Google Scholar] [CrossRef]
- Shahid, M.; Neal, B.; Jones, A. Uptake of Australia’s Health Star Rating System 2014–2019. Nutrients 2020, 12, 1791. [Google Scholar] [CrossRef]
- Shi, Y.; Grech, A.L.; Allman-Farinelli, M. Changes in the nutritional quality of products sold in university vending machines since implementation of the health star rating in 2014; An environmental audit 11 Medical and Health Sciences 1117 Public Health and Health Services. BMC Public Health 2018, 18, 1255. [Google Scholar] [CrossRef]
- Taillie, L.S.; Ng, S.W.; Popkin, B.M. Gains Made By Walmart’s Healthier Food Initiative Mirror Preexisting Trends. Health Aff. 2015, 34, 1869–1876. [Google Scholar] [CrossRef] [Green Version]
- Thomson, R.K.; McLean, R.M.; Ning, S.X.; Mainvil, L.A. Tick front-of-pack label has a positive nutritional impact on foods sold in New Zealand. Public Health Nutr. 2016, 19, 2949–2958. [Google Scholar] [CrossRef]
- Van Camp, D.; Hooker, N.; Souza-Monteiro, D. Adoption of voluntary front of package nutrition schemes in UK food innovations. Br. Food J. 2010, 112, 580–591. [Google Scholar] [CrossRef]
- Van Camp, D.; Monteiro, D.M.D.S.; Hooker, N.H. Stop or go? How is the UK food industry responding to front-of-pack nutrition labels? Eur. Rev. Agric. Econ. 2012, 39, 821–842. [Google Scholar] [CrossRef]
- van der Bend, D.L.; Jansen, L.; van der Velde, G.; Blok, V. The influence of a front-of-pack nutrition label on product reformulation: A ten-year evaluation of the Dutch Choices programme. Food Chem. X 2020, 6, 100086. [Google Scholar] [CrossRef] [PubMed]
- Vandevijvere, S. Uptake of Nutri-Score during the first year of implementation in Belgium. Arch. Public Health 2020, 78, 107. [Google Scholar] [CrossRef] [PubMed]
- Vermote, M.; Bonnewyn, S.; Matthys, C.; Vandevijvere, S. Nutritional Content, Labelling and Marketing of Breakfast Cereals on the Belgian Market and Their Reformulation in Anticipation of the Implementation of the Nutri-Score Front-of-Pack Labelling System. Nutrients 2020, 12, 884. [Google Scholar] [CrossRef] [Green Version]
- Vyth, E.L.; Steenhuis, I.H.; Roodenburg, A.J.; Brug, J.; Seidell, J.C. Front-of-pack nutrition label stimulates healthier product development: A quantitative analysis. Int. J. Behav. Nutr. Phys. Act. 2010, 7, 65. [Google Scholar] [CrossRef] [Green Version]
- Williams, P.; McMahon, A.; Boustead, R. A case study of sodium reduction in breakfast cereals and the impact of the Pick the Tick food information program in Australia. Health Promot. Int. 2003, 18, 51–56. [Google Scholar] [CrossRef] [Green Version]
- Williams, P.; Duncan, R.; De Agnoli, K.; Hull, A.; Owers, A.; Wang, T. Front of pack daily intake labelling on Australian packaged foods: Introduction and use 2007–2009. Food Aust. 2010, 62, 583–588. Available online: https://www.scopus.com/inward/record.uri?eid=2-s2.0-78650600901&partnerID=40&md5=450df226412cb7bf1dfceb3bccedf8a1 (accessed on 31 May 2023).
- Young, L.; Swinburn, B. Impact of the Pick the Trick Food information programme on the salt content of food in New Zealand. Health Promot. Int. 2002, 17, 13–19. [Google Scholar] [CrossRef] [Green Version]
- Croker, H.; Packer, J.; Russell, S.J.; Stansfield, C.; Viner, R.M. Front of pack nutritional labelling schemes: A systematic review and meta-analysis of recent evidence relating to objectively measured consumption and purchasing. J. Hum. Nutr. Diet. 2020, 33, 518–537. [Google Scholar] [CrossRef] [PubMed]
- An, R.; Shi, Y.; Shen, J.; Bullard, T.; Liu, G.; Yang, Q.; Chen, N.; Cao, L. Effect of front-of-package nutrition labeling on food purchases: A systematic review. Public Health 2021, 191, 59–67. [Google Scholar] [CrossRef] [PubMed]
- Pietinen, P.; Valsta, L.M.; Hirvonen, T.; Sinkko, H. Labelling the salt content in foods: A useful tool in reducing sodium intake in Finland. Public Health Nutr. 2008, 11, 335–340. [Google Scholar] [CrossRef] [PubMed] [Green Version]
- De la Cruz-Góngora, V.; Torres, P.; Contreras-Manzano, A.; de la Mota, A.J.; Mundo-Rosas, V.; Villalpando, S.; Rodríguez-Oliveros, G. Understanding and acceptability by Hispanic consumers of four front-of-pack food labels. Int. J. Behav. Nutr. Phys. Act. 2017, 14, 28. [Google Scholar] [CrossRef] [PubMed] [Green Version]
- Vargas-Meza, J.; Jáuregui, A.; Contreras-Manzano, A.; Nieto, C.; Barquera, S. Acceptability and understanding of front-of-pack nutritional labels: An experimental study in Mexican consumers. BMC Public Health 2019, 19, 1751. [Google Scholar] [CrossRef] [Green Version]
- Global Food Research Program. Front-of-Package (FOP) Food Labelling: Empowering Consumers to Make Healthy Choices [FACT SHEET]. Chapel Hill. Available online: https://www.globalfoodresearchprogram.org/wp-content/uploads/2020/08/FOP_Factsheet_UNCGFRP_2020_September_Final.pdf (accessed on 26 August 2022).
- Santos, J.A.; Sparks, E.; Thout, S.R.; McKenzie, B.; Trieu, K.; Hoek, A.; Johnson, C.; McLean, R.; Arcand, J.; Campbell, N.R.C.; et al. The Science of Salt: A global review on changes in sodium levels in foods. J. Clin. Hypertens. 2019, 21, 1043–1056. [Google Scholar] [CrossRef] [Green Version]
- Shankar, P.; Ahuja, S.; Sriram, K. Non-nutritive sweeteners: Review and update. Nutrition 2013, 29, 1293–1299. [Google Scholar] [CrossRef]


| Number of Studies | Countries | FOP Label Design | Enforcement Style | |||||
|---|---|---|---|---|---|---|---|---|
| Non-Interpretative | Nutrient-Specific | Summary | Positive Endorsement | Mandatory | Voluntary | |||
| South America | 7 (18%) | Chile (6), Ecuador (1) | - | 7 | - | - | 7 | - |
| North America | 3 (8%) | Canada (2) USA (1) | - | - | - | 3 | - | 3 |
| Europe | 7 (18%) | UK (3), Belgium (2), The Netherlands (2) | 2 | 3 | 2 | 2 | - | 9 |
| Asia | 1 (2%) | Iran (1) | - | 1 | - | - | 1 | - |
| Oceania | 21 (54%) | Australia (16) New Zealand (6) | 6 | - | 14 | 5 | - | 25 |
| Total * | 39 | 10 | 8 | 11 | 16 | 10 | 8 | 37 |
| Design Classification | Type | Label Image | Country | Enforcement | Institution |
|---|---|---|---|---|---|
| Non-interpretative | Guideline Daily Amount (GDA) |  | UK | Voluntary | Food Industry |
| Daily Intake Guide (DIG) |  | Australia | Voluntary | Food Industry | |
| Energy Icon |  | Australia | Voluntary | Government | |
| Nutrient specific | Warning Labels |  | Chile | Mandatory | Government |
| Traffic Lights |  | UK | Voluntary | Government | |
| Traffic Lights |  | Iran | Mandatory | Government | |
| Traffic Lights |  | Ecuador | Mandatory | Government | |
| Summary | Nutri-Score |  | Belgium | Voluntary | Government |
| Health Star Rating |  | Australia and New Zealand | Voluntary | Government | |
| Positive endorsement | Pick the Tick |  | Australia and New Zealand | Voluntary | NGO |
| Choices Logo |  | The Netherlands | Voluntary | Food Industry | |
| Health Check |  | Canada | Voluntary | NGO | |
| Walmart initiative |  | USA | Voluntary | Food Industry |
| Author, Year | Country, Label Names, Year of Implementation | Sample | Thematic Findings | Key Findings |
|---|---|---|---|---|
| Alé-Chilet, 2021 [25] | Chile Warning Labels, 2016 | Breakfast cereal market (n = 131). 2016 to 2018. | Reformulation | Labeling implementation along with associated marketing restrictions induced a mean of 4% calorie and 8% sugar reduction of product nutritional content. |
| Azzopardi, 2020 [27] | Australia Health Star Rating, 2014 | Foods directed to children 5–12. (n = 548) Beverages excluded. 2014 to 2018 | Uptake Nutritional comparison | 18.2% of products were labeled. Bakery, Breakfast Cereals, and Snacks accounted for 80% of all labeled items. 76% of labeled products had a high HSR score (healthier). Similar energy content between labeled and un-labeled products (356 kcal/100 g vs. 381 kcal/100 g) |
| Bablani, 2020 [28] | Australia & New Zealand Health Star Rating, 2014 | Non-seasonal packaged unique products. Products with the HSR energy-only icon logos excluded. (n = 58,905) 2013 to 2019. | Uptake Reformulation | Low-scored (unhealthier) products were less likely to adopt HSR compared to high-scored (healthier) ones (<15%, over 35%, respectively) 4% sodium reduction in NZ and 2% in Australia; and 2% sugar reduction in NZ. No change in protein or saturated fat content. Greater reformulation for initially unhealthy products. |
| Barahona, 2020 [9] | Chile Warning Labels, 2016 | Breakfast cereal (n = 94). 2016 to 2018. | Reformulation | Sugar and calories reduction (12% and 3%, respectively after two years of policy implementation). Over 60% of these products, reformulated to fall right below the mandated threshold, thus avoiding the label. |
| Brownbill, 2019 [29] | Australia Health Star Rating, 2014 Energy icon, 2014 | Ready-to-drink (≤600 mL) non-dairy/non-alcoholic beverages (n = 762). 2016 | Uptake | 35% of beverages carried a FOP label; 28% displayed the energy-only icon and 7% the HSR label. Products carrying the star rating icon rated higher (healthier) being predominantly on 100% fruit juices (85.7%). Most star rating labeled beverages contained high amounts of sugar. |
| Carter, 2013 [30] | Australia Daily Intake Guide, 2006 | Packaged foods energy-dense but nutrient-poor (n = 728). 2012. | Uptake | The 66% of energy-dense nutrient-poor products carried the label. |
| Castro, 2021 [31] | New Zealand Health Star Rating, 2014 | Store-brands (n = 4266) branded (n = 19,318) food products across 21 food categories. 2015–2019. | Uptake Reformulation | By 2019, 92% of store-brand products displayed the HSR on the package compared with 17% on branded food products. During the study period, there was an increase in product labeling overall. No consistent changes in sodium or sugar contents. |
| Dummer, 2012 [32] | Canada Health Check, 1999 | Health Check program licensees’ products (n = 371). 2009 | Reformulation | One-hundred fifty labeled products self-reported to have reduced sodium before obtaining the label. |
| Edalati, 2020 [33] | Iran Traffic Light label, 2016 | Food products Date and sample number not reported. | Uptake Reformulation | An 80% of food products carried the traffic light label in 2018, when it became mandatory. Self-reported reformulation to comply with green labelling requirements in some products. Interviewees mentioned perceived increased fraud to obtain green labelling and addition of non-caloric sweeteners to replace sugars. |
| Elliot, 2019 [34] | Canada Health Check, 1999 | Child- directed food products. 2009 (n = 354) 2017 (n = 374). | Uptake | Only 5% of products were labeled with the Health Check in 2009 and by 2017 the label had been discontinued. |
| Fichera, 2020 [20] | UK Traffic Light label, 2006 | Store-brands and branded foods (n = 360,921) purchased by 20,707 households. 2005–2008. | Uptake Nutritional comparison Reformulation | Label was found on store-branded food of four food retailers in the UK. After labeling implementation, nutritional improvement in labeled and unlabeled store-branded foods. Retailers brought forward the time to discontinue some products to take place before labelling introduction. |
| Jones, 2018 [35] | Australia Health Star Rating, 2014 Energy icon, 2014 | Packaged foods (n = 15,767) 2014–2017 | Uptake Nutritional comparison | By 2017, 28% of products were labeled: 24% HSR and 4% energy icon only. A linear increase in uptake from 2014 to 2017. 76% of labeled products had high scores (healthier). 77% of products labeled with the energy icon had a low score (unhealthy). Most products were confectionery foods and non-alcoholic beverages. Labeled products had a higher mean HSR score (healthier) than unlabeled products. (unhealthier). |
| Kanter, 2019 [36] | Chile Warning Labels, 2016 | Packaged food and beverage products in 2015 (n = 5421) 2016 (n = 5479). | Reformulation | In preparation for label implementation, less than 5% reductions on targeted nutrients and caloric content and increments in nutrient of concern in some products. |
| Lawrence, 2018 [37] | Australia Health Star Rating, 2014 | New food products (n = 12,108) 2014–2017 | Uptake | 10% of the sample displayed the HSR. Majority of labeled products displayed a “healthier” score. More than half foods categorized as ‘non-nutritious” presented an HSR-high score (healthier). |
| Lindberg, 2017 [38] | Australia Pick the Tick, 1997 Health Star Rating, 2014 | Food products (n = 33 manufacturers self-report). 2010–2017 | Uptake Reformulation | Two manufacturers disclosed using the HSR label, and four used the Tick label. Self-reports indicated that Tick participation led four manufacturers to reduce salt content and one due to the HSR. |
| Louie, 2012 [39] | Australia Daily Intake Guide, 2006 | Breakfast cereals. 2004 (n = 128) 2010 (n = 197) | Nutritional comparison Reformulation | By 2010, no significant difference in nutritional composition between DIG-labeled and non-labeled. No significant difference in the nutritional composition of breakfast cereals during the study period. No product reformulation after label implementation. |
| Mantilla-Herrera et al., 2018 [40] | Australia Health Star Rating, 2014 | Pre-packaged food and beverage products available in both 2013 and 2016 (n = 14,986). | Uptake Reformulation | 7% of the sample carried the HSR in 2016. Labeled products reduced a mean of 2 kcal per 100 g. |
| Mhurchu, 2017 [41] | NZ Health Star Rating, 2014 | Matched food and beverages (n = 15,357). 2014–2016. | Uptake Nutritional comparison Reformulation | By 2016, 5% of packaged food and beverage displayed the HSR label. Higher uptakes on cereals, convenience foods, packaged fruit and vegetables, and sauces and spreads. Labeled products had higher energy density but lower saturated fat, total sugar, and sodium than unlabeled products. Greater reformulation of HSR-labeled products compared to non-labeled products. Sodium content of labeled products decreased by 5%, and sodium unlabeled increased a 3% in unlabeled products. |
| Morrison, 2019 [42] | Australia Health Star Rating, 2014 | Packaged food products marketed towards children 2013 (n = 156) 2016 (n = 252) | Uptake Nutritional comparison Reformulation | 26% of products displayed HSR label. Over 80% displayed a high score (healthier). Labeled products had lower mean energy and saturated fat content and higher mean protein and fiber content than non-HSR labeled products. All labeled products in 2013 were reformulated by 2016, compared to 61% of non-HSR labeled products. |
| Ning, 2017 [43] | NZ Pick the Tick, 1991 | Breakfast cereals, edible spreads, processed poultry, cooking sauces. (n = 52). 2011–2013. | Reformulation | 36% of products were formulated and reformulated. 46% mean sodium reduction. Breakfast cereals had the highest reformulation (59%). Manufacturers said that sodium reduction was, in addition to other drivers, influenced by the Pick the Tick program. |
| Peñaherrera, 2019 [44] | Ecuador Traffic Light Labels, 2014 | Soft drinks (n = 14 brands) 2013 to 2015 | Reformulation | 50% of soft drink brands reduced sugar (13% mean sugar reduction). However, of those, only 29% of products (2 brands) led to a yellow or green light change (healthier score). |
| Pulker, 2018 [45] | Australia Daily Intake Guide, 2006 Health Star Rating, 2014 | Supermarket own brand foods (n = 3940) 2017 | Uptake Nutritional comparison | 81.5% of products were labeled. No products included both labels. Over half displayed the HSR label and a quarter the DIG label. Nutrient-poor and ultra-processed foods were more likely than nutritious foods (vegetables, legumes, etc) to display the HSR label. |
| Quintiliano Scarpelli, 2020 [46] | Chile Warning Labels, 2016 | Packaged foods and beverages 2013 (n = 551) 2019 (n = 476) | Reformulation | Overall, sugar decreased by 15%. Over 50% sugar reduction in dairy, confitures, and sugary beverages. Energy reduction in flour-based foods, confitures, fats and oils, dairy and sugary drinks. Sodium reduction in fats and oils and spices (41%), condiments, and sauces (38%). Little reformulation in pastry, desserts and ice creams. Not significant changes on saturated fats. |
| Quitral, 2019 [47] | Chile Warning Labels, 2016 | Fruit juices and soft drinks. T0 periods prior to labeling implementation (month/year not reported) T1 2017 (n = 7) | Reformulation | 78% mean energy and 96% mean sugar content reduction. 128% increase in non-caloric sweeteners content. However, the study does not report statistical significance. |
| Reyes, 2020 [48] | Chile Warning Labels, 2016 | Packaged foods and beverages. 2015 or 2016 (n = 4055) 2017 (n = 3025). | Reformulation | Overall decrease in products displaying warning labels (from 51% to 44%). Most reformulated products fall right below the mandated threshold, thus avoiding the label. Beverages, milk-based drinks, breakfast cereals, sweet baked products, and spreads products carrying a sugar warning label decreased from 80% to 60%. Savory spreads, cheeses, ready-to-eat meals, soups, and sausages products labeled as high in sodium reduced from 74% to 27%. Savory spreads and breakfast cereals labeled as calories warning label decreased 38% and 25%, respectively. Limited change in saturated fat warning label appearance: savory spreads only (38% reduction of products) |
| Sacks, 2020 [49] | Australia Health Star Rating, 2014 | Companies operating in Australia. (n = 34) 2018 | Uptake | Over 50% of manufacturers publicly committed to label all or some of their products. Two large supermarkets committed to their full product range. No label on added sugars or trans fat. |
| Shahid, 2020 [50] | Australia Health Star Rating, 2014 Energy icon, 2014 | 15 food categories of eligible products (n = 17,477). 2014 to 2019 | Uptake Nutritional comparison | After 5 years of label implementation, a third of products displayed the HSR logo, and less than 10% the energy icon only. HSR label uptake had a linear annual increase of 7% since 2014. Higher labeling uptake by retailers than by manufacturers. More than three quarters of labeled products had high scores (healthier). Over 50% of fish and fish products, fruit and vegetables, and convenience foods, carried the HSR label. Under 30% of sugars, oils and sauces were labeled. Healthier products displaying the HSR logo compared to those not carrying the logo or displaying the energy icon only. |
| Shi, 2018 [51] | Australia Health Star Rating, 2014 | Packaged foods in vending machines. 2014 (n = 61 vending machines; 1836 slots. 2017 (n = 71 vending machines; 2458 slots) | Uptake | Under 10% of packaged food and beverages were labeled in 2017, and all of them received a high score (healthier). |
| Taillie, LS, Ng, SW, & Popkin, BM, 2015 [52] | USA Walmart initiative, 2011 | Households’ packaged food purchases Walmart (n = 1,212,803) Other chain retailers (n = 2,521,128). 2000 to 2013 | Reformulation | Compared to other chains, Walmart packaged food purchases had a greater reduction on energy density, total sugar, and sodium during the study period compared other chains. However, labeling did not seem to influence reformulation based on previous trends. |
| Thomson, 2016 [53] | New Zealand Pick the Tick, 1991 | Newly licensed Tick products from five food categories Edible Oil Spreads, Yoghurt & Dairy Desserts, Frozen Desserts, Ready Meals and Processed Poultry. (n = 45). 2011 to 2013. | Uptake Nutritional comparison Reformulation | Manufacturers self-reported consumer demands influenced Tick product development and sales. The label was used as a marketing strategy. Encouraged energy, saturated fat, trans fat, and sodium reductions. Tick products were 14% to 76% lower in energy, saturated fat, trans fat and sodium than non-Tick products. In 2017, the proportion of healthy snacks and beverages increased from 7 to 14% and 38 to 44% since 2014, respectively. |
| Van Camp, 2010 [54] | UK Guideline Daily Amount, 2005 Traffic Light labels, 2006 | Food and drinks released in the UK (n = 27,004) 2002 to 2008. | Uptake | GDA labeling was higher on “target” products designated by the UK government and “non-target” product as compared to the Traffic Light System (TLS) (42% vs. 26% and 20% vs. 4%, respectively) in 2008. TLS and GDA label use varies depending on company and food category. |
| Van Camp, 2012 [55] | UK Guideline Daily Amount, 2005 Traffic Light labels, 2006 | Bread, cakes, cereal, meat products, pastries, pizzas, prepared meals, sandwiches, crackers, salty snacks and cookies (n = 2201) 2007 to 2009. | Uptake Nutritional comparison Reformulation | TLS labels mostly present on “target” products designated by the UK government and branded products. Labeling increased over time. Products lower in sodium and sugar were more likely to carry both GDA and TLS. For meat and prepared meals, lower sodium and saturated fat showed higher odds to use TLS as compared to GDA. Sodium reduction trend over time on “target” TLS-labeled products. |
| van der Bend, 2020 [56] | The Netherlands Choices Logo, 2006 | Products, including 27 basic and non-basic product (sub) categories (n = 4343). 2006 to 2016. | Uptake Reformulation | Labeled products increased 161% over time. Reformulation varied by food category and nutrient. Trans fat and sodium were most likely to reduce as well as to have higher reductions. Energy density, saturated fat, and sugar reduction and fiber increase in half of food categories. Changes in added sugar content were not consistent over time. Saturated fat decreased by 18% and trans fat content by 48% in all products. |
| Vandevijvere, 2020 [57] | Belgium Nutri-Score, 2018 | Food products (n = 1781). 2019 | Uptake | 10% of products on the market in Belgium displayed the NS. About 90% of them were own-brand products from two major food retailers. About 56% of products displayed a healthy score while 26% of products displayed an unhealthy score. |
| Vermote, 2020 [58] | Belgium Nutri-Score, 2018 | Breakfast cereals (n = 275) 2017 and 2018. | Reformulation | Reformulation in anticipation of policy implementation: 3% fiber and 2% protein increase. 5% sugar and 20% sodium reduction. A or B scored products (healthier): 34% (2017) versus 37% (2018) D or E scored products (unhealthier): 22% (2017) versus 20% (2018). |
| Vyth, 2010 [59] | The Netherlands Choices Logo, 2006 | Fruit juices, processed meats, dairies, sandwiches, soups, sauces, sandwich fillings (n = 821). 2007 to 2009. | Reformulation | 20% of products were reformulated. 29% of products were newly developed. Reformulation and new product development mostly on soups and snacks. Caloric content reduction in dairy products, sandwich fillings (10% and 30%, respectively). Sugar reduction in dairy products and sauces (75% and 13%, respectively). Saturated fats reductions in meat and dairy products (43% and 30%, respectively). Sodium reduction was the most common change found in processed meats, sandwiches, soups and sandwich fillings (18%, 42%, 13%, 39%, respectively). 51% fiber increase in sandwiches. Newly developed sandwiches, had over 500% higher sugar than reference sandwiches, as well as 33% higher fiber. |
| Williams, 2003 [60] | Australia Pick the Tick, 1997 | Kellogg’s Breakfast cereals. 1997 (n = 12) | Reformulation | Two-thirds of the total breakfast cereals sales volume reduced sodium. Sodium reduction varied by product. Manufacturer required that reformulation did not affect consumer taste appeal. 40% mean sodium reduction (from 12% to 88%) 42% of reformulated products were eligible to be labeled. |
| Williams, 2010 [61] | Australia Daily Intake Guide, 2006 | Products at supermarkets. (n = not reported) 2007, 2008 and 2009. | Uptake | Labeling increased over time (66% in the six months between the last two surveys in 2009). 60% of products carried the energy only label 40% displayed energy plus additional nutrients. DIG mostly present in biscuits and crackers, cooking sauces, breakfast cereals, ice cream, soft drinks, processed meats, frozen foods, snack foods and juices and confectionery. Based on researchers’ estimation about 10% of products carried the DIG label in late 2009. |
| Young, 2002 [62] | New Zealand Pick the Tick, 1991 | Reformulated or formulated bread, breakfast cereals and margarine from companies participating in the Pick the Tick program. (n = 23). 1998 to 1999 | Reformulation | Sodium reduction in breakfast cereals by 61%, bread by 26%, and margarine by 11%. Manufacturers expressed that sodium changes were made to qualify to carry the label. |
Disclaimer/Publisher’s Note: The statements, opinions and data contained in all publications are solely those of the individual author(s) and contributor(s) and not of MDPI and/or the editor(s). MDPI and/or the editor(s) disclaim responsibility for any injury to people or property resulting from any ideas, methods, instructions or products referred to in the content. |
© 2023 by the authors. Licensee MDPI, Basel, Switzerland. This article is an open access article distributed under the terms and conditions of the Creative Commons Attribution (CC BY) license (https://creativecommons.org/licenses/by/4.0/).
Share and Cite
Ganderats-Fuentes, M.; Morgan, S. Front-of-Package Nutrition Labeling and Its Impact on Food Industry Practices: A Systematic Review of the Evidence. Nutrients 2023, 15, 2630. https://doi.org/10.3390/nu15112630
Ganderats-Fuentes M, Morgan S. Front-of-Package Nutrition Labeling and Its Impact on Food Industry Practices: A Systematic Review of the Evidence. Nutrients. 2023; 15(11):2630. https://doi.org/10.3390/nu15112630
Chicago/Turabian StyleGanderats-Fuentes, Montserrat, and Sherry Morgan. 2023. "Front-of-Package Nutrition Labeling and Its Impact on Food Industry Practices: A Systematic Review of the Evidence" Nutrients 15, no. 11: 2630. https://doi.org/10.3390/nu15112630