
Minerals and Trace Elements in 990 Beverages and Their Contribution to Dietary Reference Values for German Consumers
 , and
, and 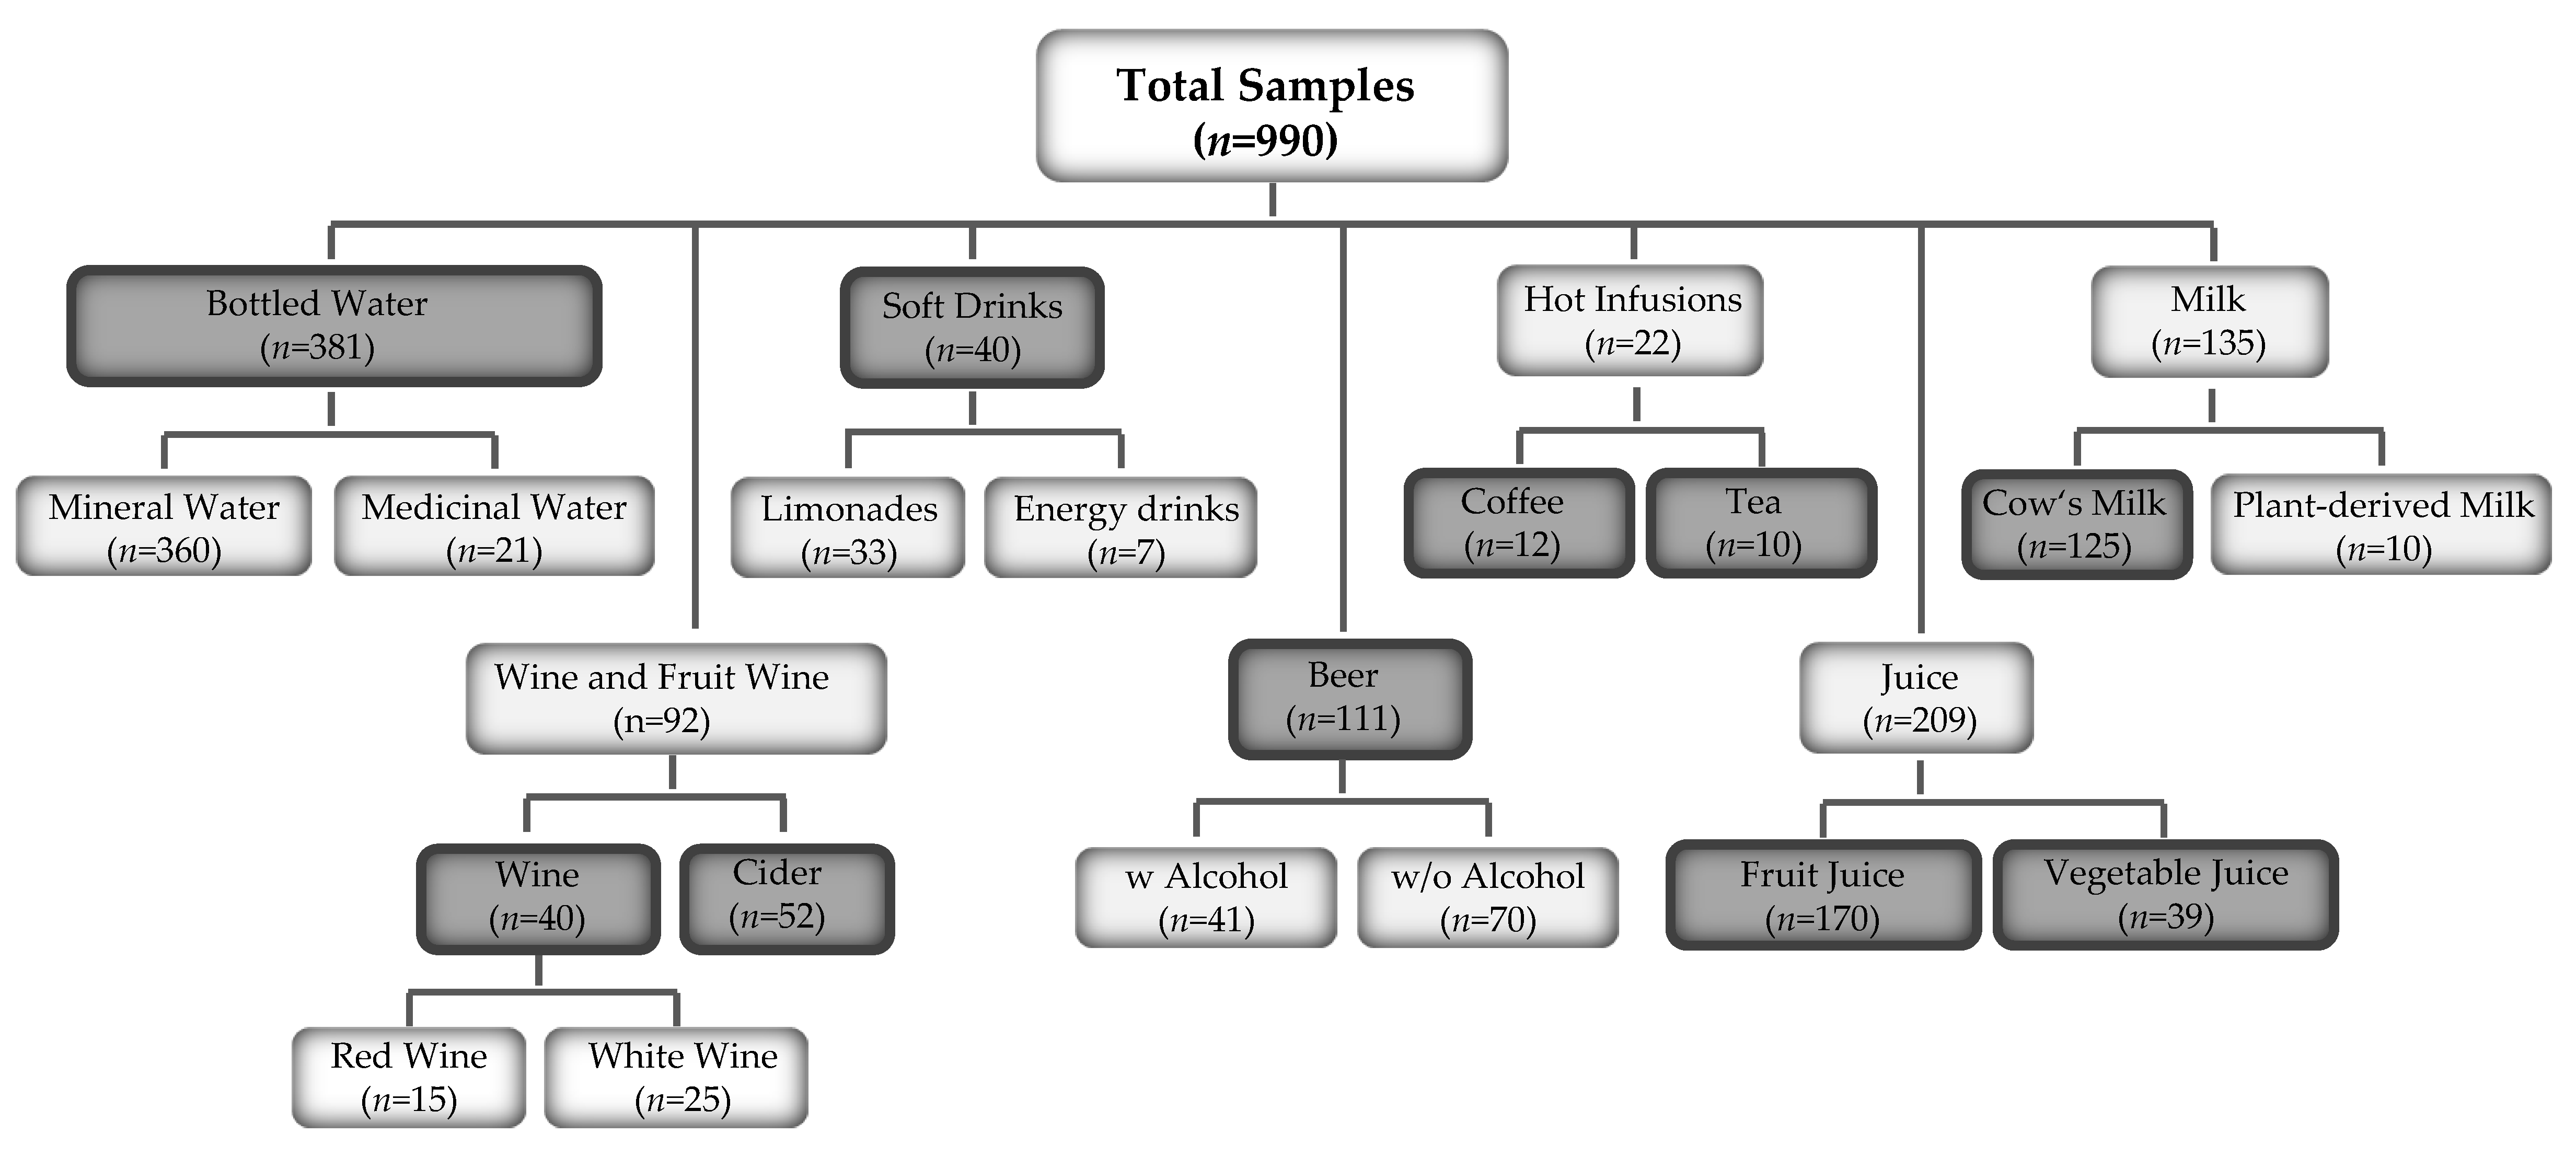
Abstract
:1. Introduction
2. Materials and Methods
2.1. Sampling of Beverages (Except Coffee and Tea)
2.2. Preparation of Coffee and Tea Samples
2.3. Analysis of Minerals and Statistical Analysis
3. Results
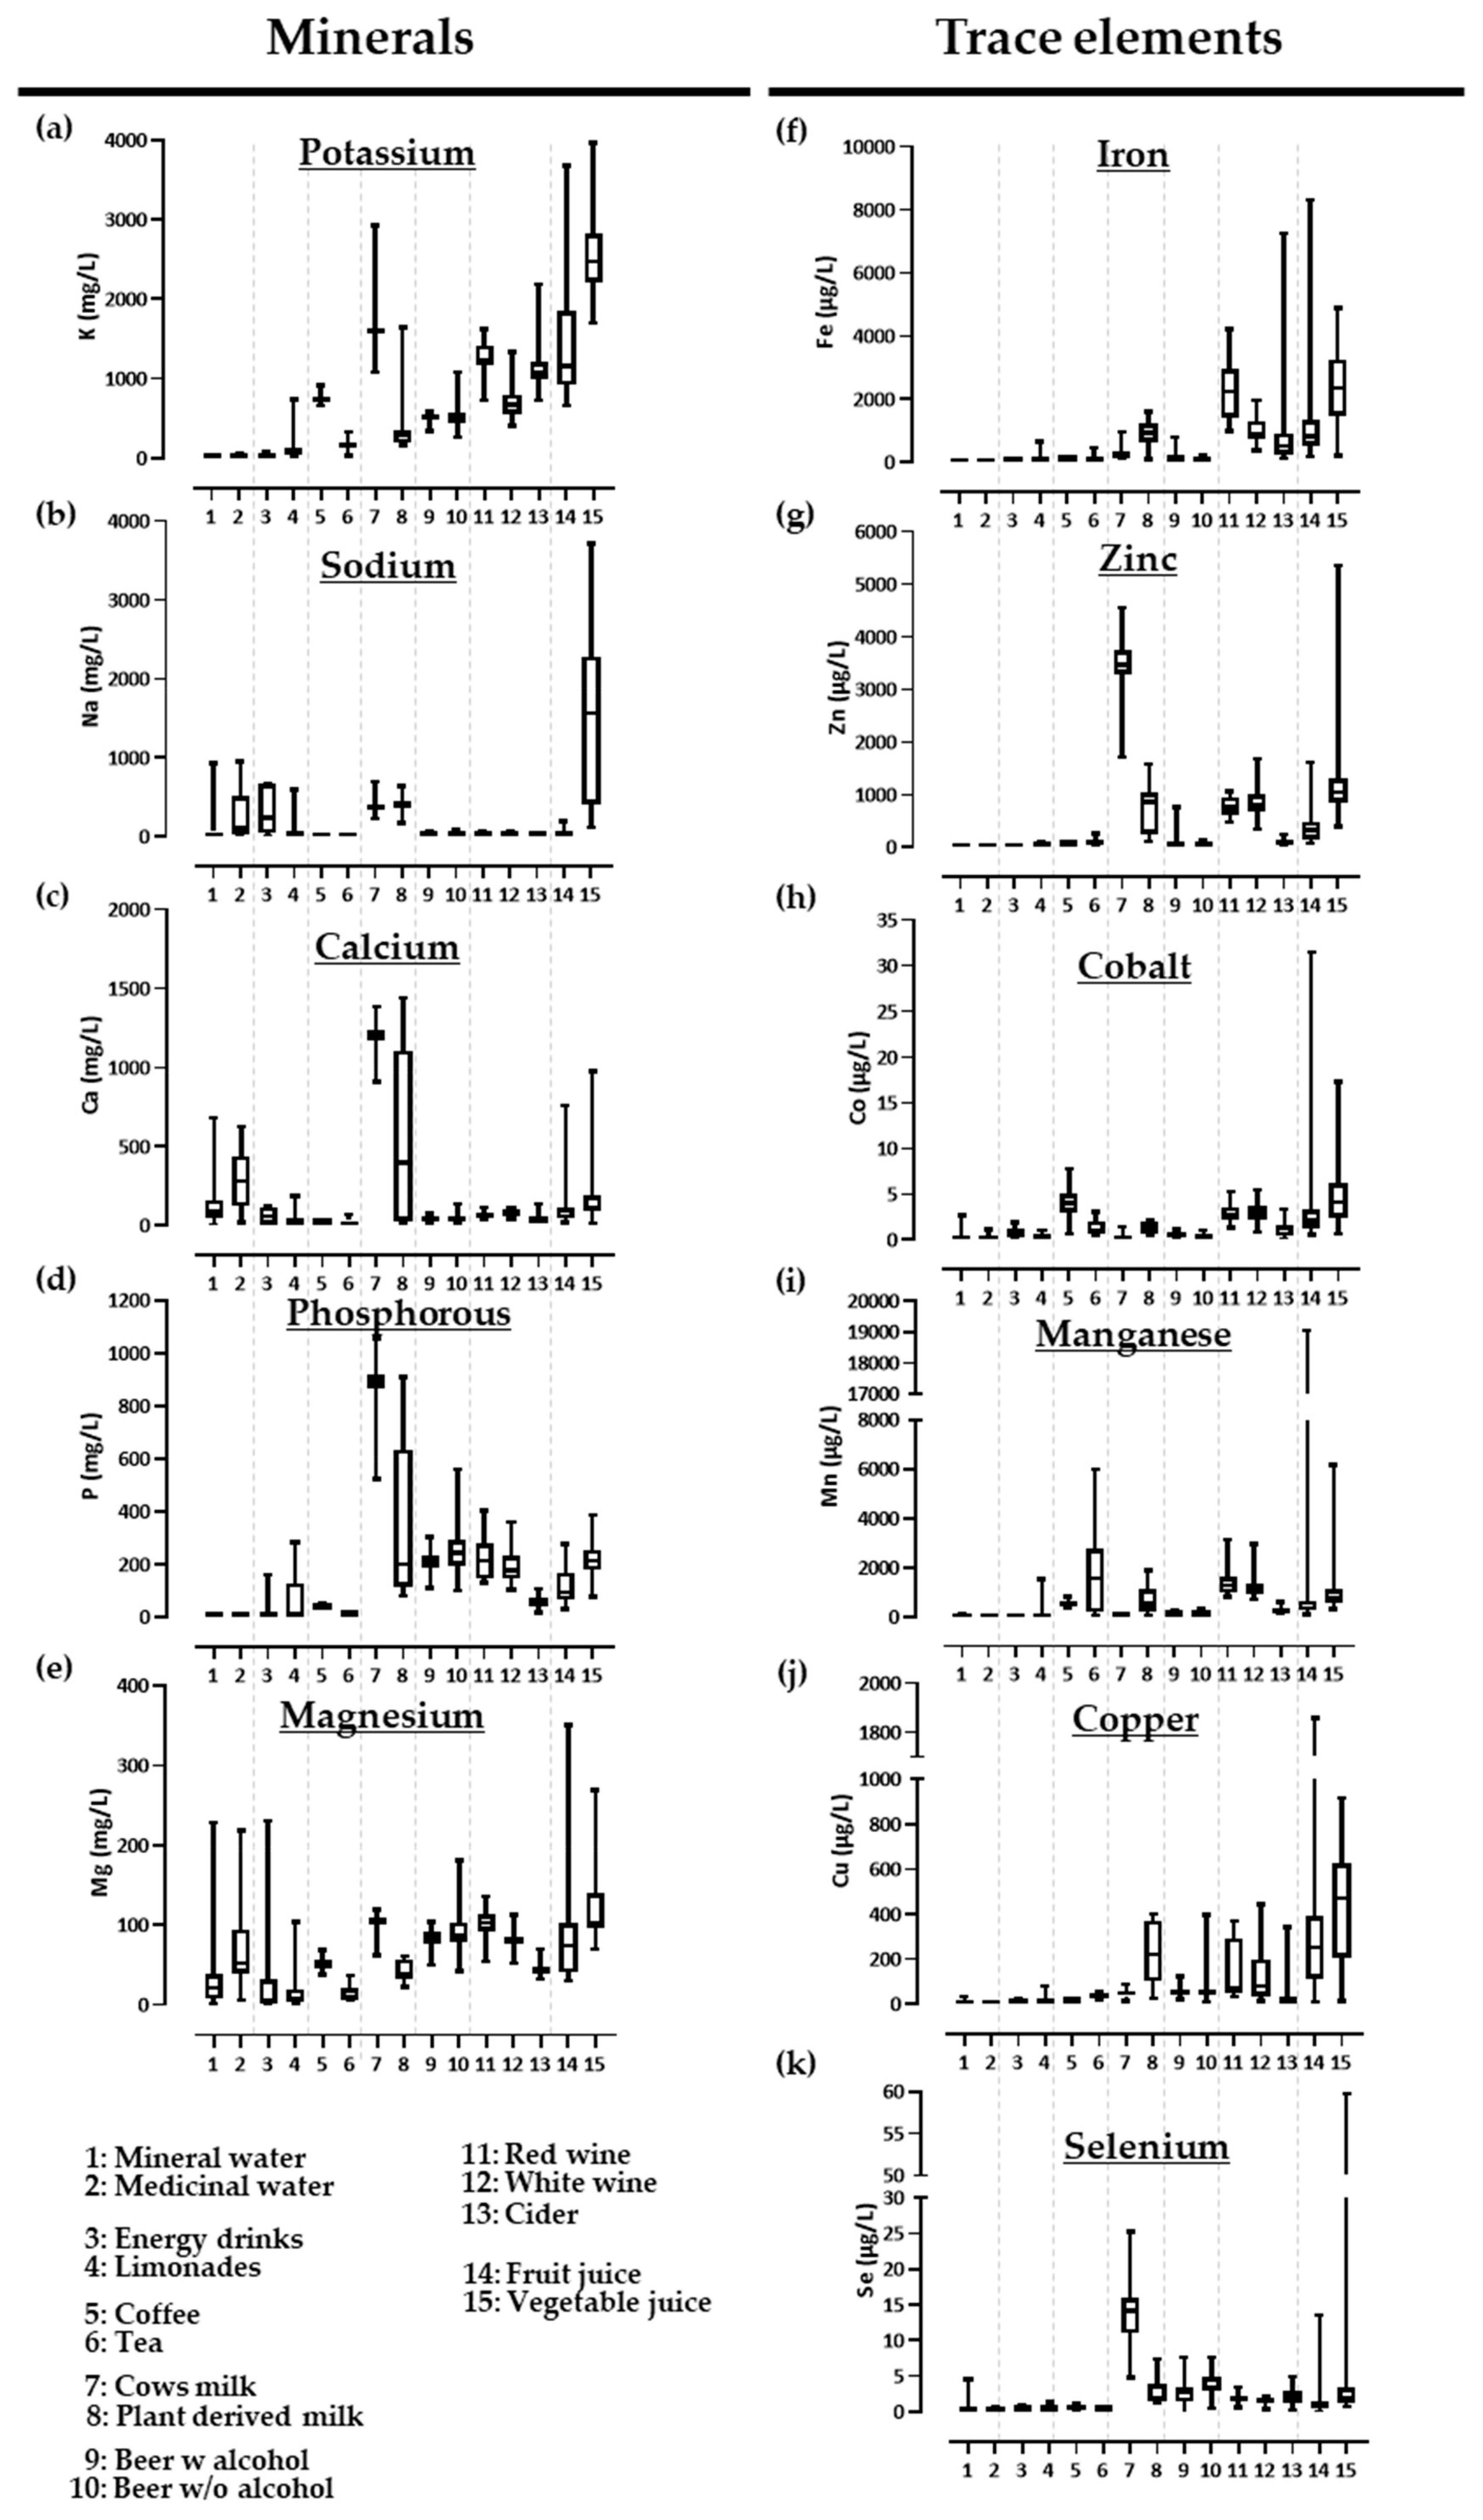
3.1. Concentration of Minerals and Trace Elements in Commercially Available Beverages in Germany
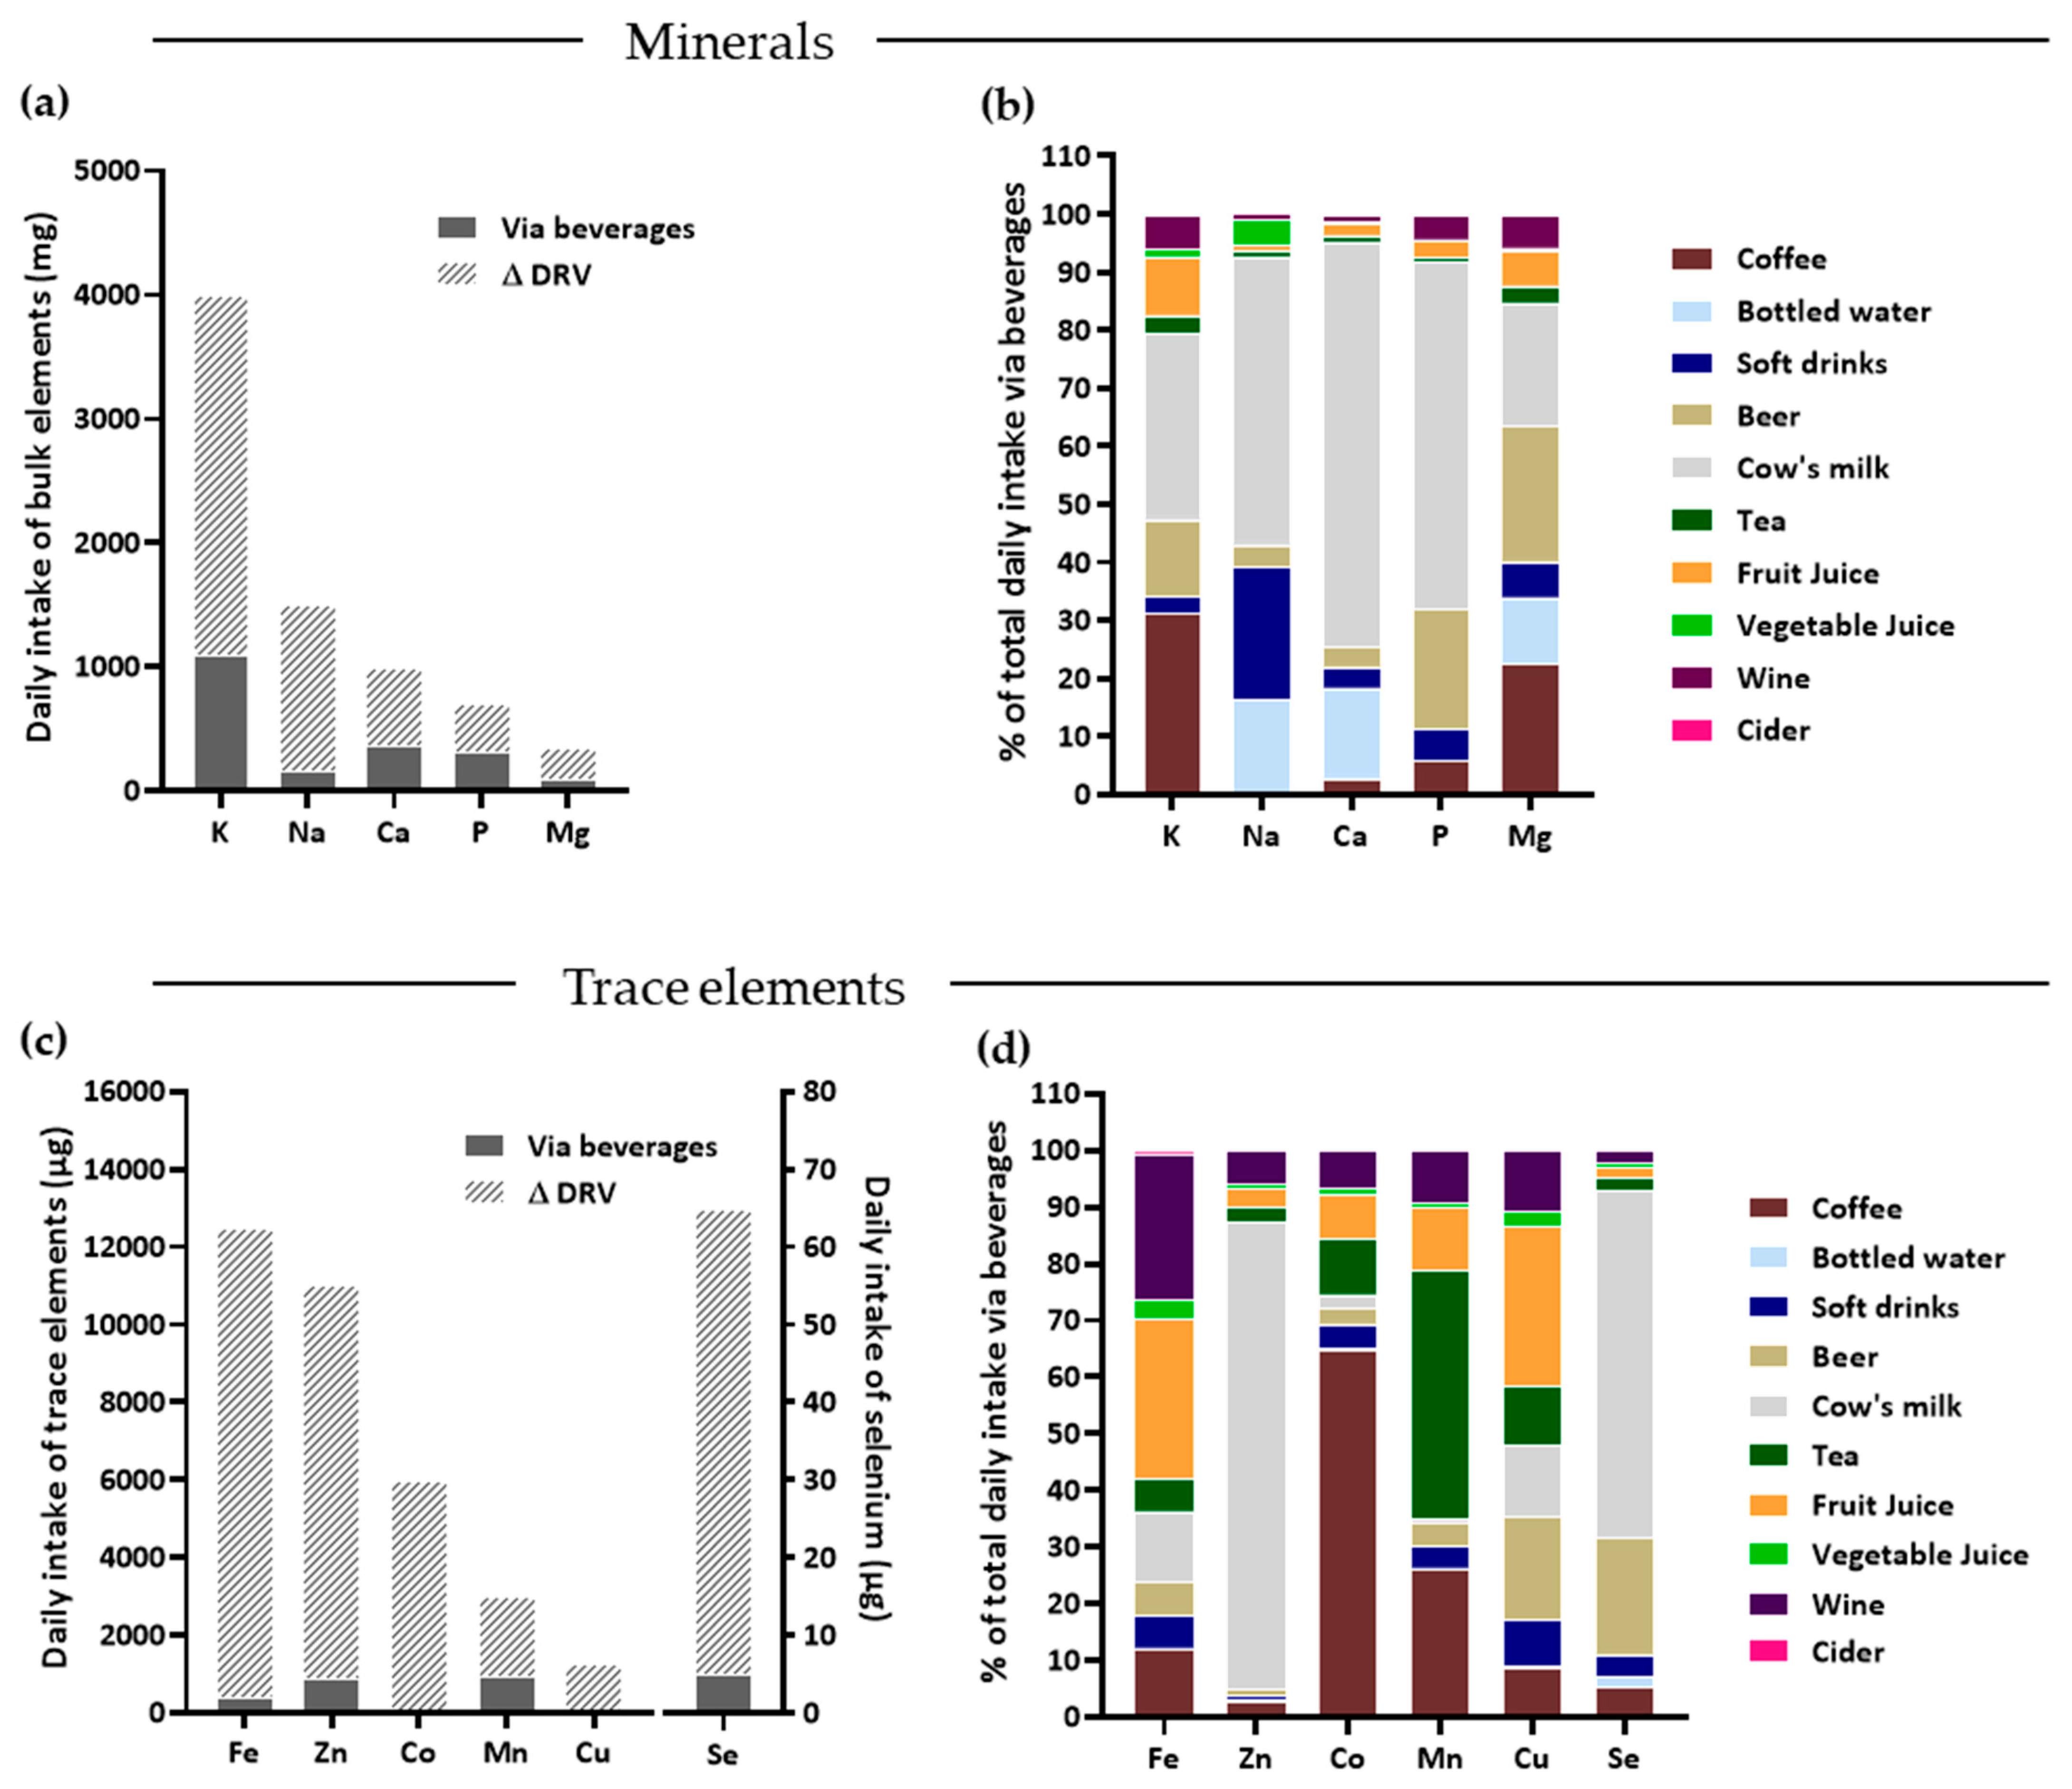
3.2. Contribution of Commercially Available Beverages in Germany to Meet Dietary Reference Values (DRVs)
4. Discussion
4.1. Contribution of Beverages to Selected Mineral DRVs for German Consumers
4.1.1. Calcium
4.1.2. Phosphorous
4.1.3. Potassium
4.1.4. Sodium
4.1.5. Magnesium
4.2. Contribution of Beverages to Selected Trace Element DRVs for German Consumers
4.2.1. Manganese
4.2.2. Zinc
4.2.3. Selenium
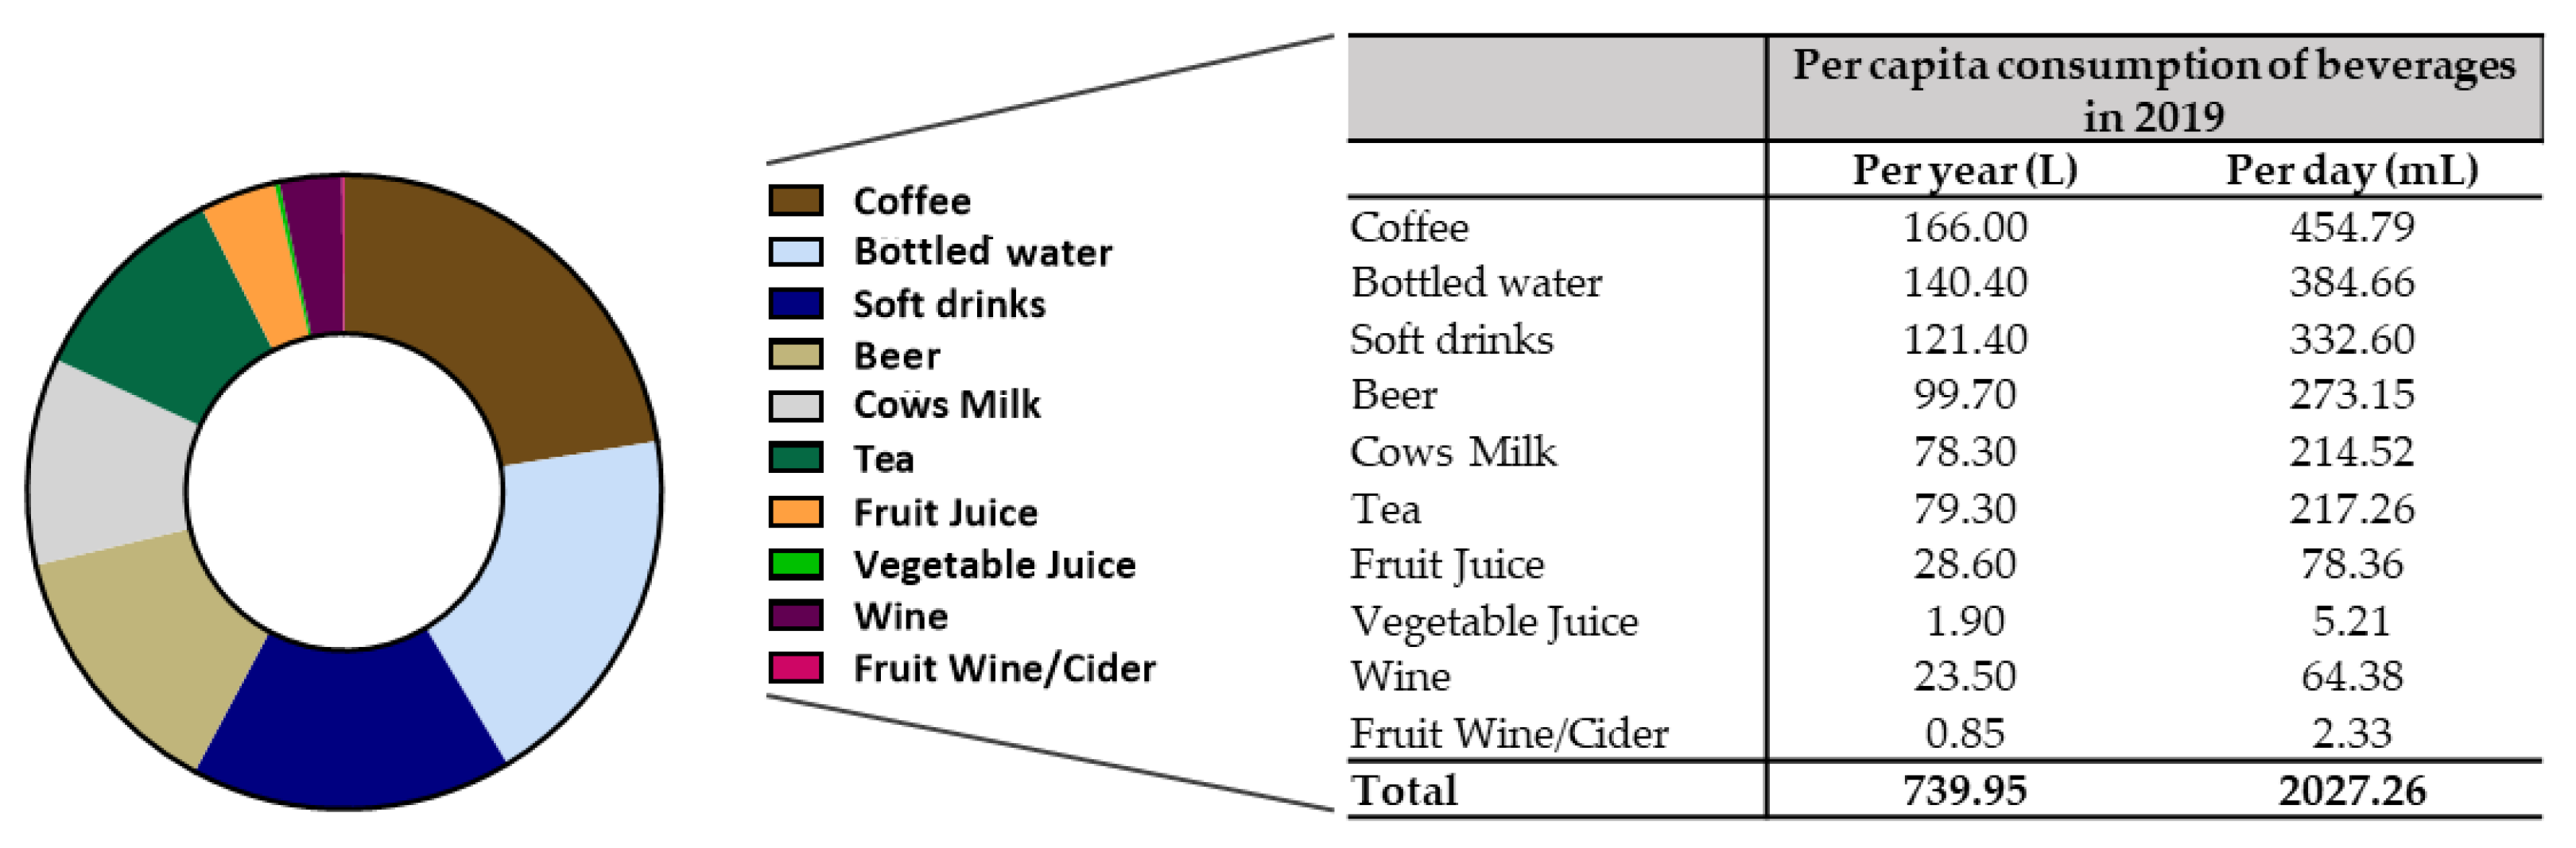
4.3. Beverage Consumption in Germany in Comparison to Other Selected Countries
4.4. Study Strengths and Limitations
5. Conclusions
Supplementary Materials
Author Contributions
Funding
Institutional Review Board Statement
Informed Consent Statement
Data Availability Statement
Conflicts of Interest
References
- Zoroddu, M.A.; Aaseth, J.; Crisponi, G.; Medici, S.; Peana, M.; Nurchi, V.M. The essential metals for humans: A brief overview. J. Inorg. Biochem. 2019, 195, 120–129. [Google Scholar] [CrossRef]
- Stathopoulou, M.G.; Kanoni, S.; Papanikolaou, G.; Antonopoulou, S.; Nomikos, T.; Dedoussis, G. Mineral intake. Prog. Mol. Biol. Transl. Sci. 2012, 108, 201–236. [Google Scholar] [CrossRef] [PubMed]
- Kobayashi, J. On geographical relations between the chemical nature of river water and death rate from apoplexy. Ber. Des Ohara Inst. Für Landwirtsch. Biol. Okayama Univ. 1957, 11, 12–21. [Google Scholar]
- Snopek, L.; Mlcek, J.; Sochorova, L.; Baron, M.; Hlavacova, I.; Jurikova, T.; Kizek, R.; Sedlackova, E.; Sochor, J. Contribution of red wine consumption to human health protection. Molecules 2018, 23, 1684. [Google Scholar] [CrossRef] [Green Version]
- Tahmassebi, J.F.; BaniHani, A. Impact of soft drinks to health and economy: A critical review. Eur. Arch. Paediatr. Dent. Off. J. Eur. Acad. Paediatr. Dent. 2020, 21, 109–117. [Google Scholar] [CrossRef] [Green Version]
- Osorio-Paz, I.; Brunauer, R.; Alavez, S. Beer and its non-alcoholic compounds in health and disease. Crit. Rev. Food Sci. Nutr. 2020, 60, 3492–3505. [Google Scholar] [CrossRef] [PubMed]
- Nutrition, EFSA Panel on Dietetic Products. Dietary Reference Values for Nutrients; Summary Report EFSA Supporting Publication; European Food Safety Authority (EFSA): Parma, Italy, 2017; Volume 2017, p. e15121.
- Referenzwerttabelle. Available online: https://www.dge.de/wissenschaft/referenzwerte/tool/ (accessed on 10 March 2022).
- Seidel, U.; Baumhof, E.; Hagele, F.A.; Bosy-Westphal, A.; Birringer, M.; Rimbach, G. Lithium-rich mineral water is a highly bioavailable lithium source for human consumption. Mol. Nutr. Food Res. 2019, 63, e1900039. [Google Scholar] [CrossRef] [PubMed]
- Seidel, U.; Haegele, F.A.; Baumhof, E.; Jans, K.; Seidler, Y.; Kremer, D.; Bakker, S.J.L.; Birringer, M.; Lüersen, K.; Bosy-Westphal, A.; et al. Boron contents of german mineral and medicinal waters and their bioavailability in Drosophila melanogaster and humans. Mol. Nutr. Food Res. 2021, 65, e2100345. [Google Scholar] [CrossRef] [PubMed]
- Pro-Kopf-Konsum von Getränken in Deutschland nach Segmenten in den Jahren 2003 bis 2020. Available online: https://de.statista.com/statistik/daten/studie/219408/umfrage/pro-kopf-verbrauch-von-getraenken-in-deutschland/ (accessed on 10 March 2022).
- Pro-Kopf-Konsum von Gemüsesaft und -nektar in Deutschland in den Jahren 2002 bis 2021. Available online: https://de.statista.com/statistik/daten/studie/167150/umfrage/pro-kopf-verbrauch-von-gemuesesaft-in-deutschland-seit-2002/ (accessed on 10 March 2022).
- Pro-Kopf-Verbrauch an Apfel- und Fruchtweinen in Deutschland. Available online: https://www.fruchtwein.org/verbrauch-deutschland.html (accessed on 10 March 2022).
- Lee, J.J.; Plain, A.; Beggs, M.R.; Dimke, H.; Alexander, R.T. Effects of phospho- and calciotropic hormones on electrolyte transport in the proximal tubule. F1000Research 2017, 6, 1797. [Google Scholar] [CrossRef] [PubMed] [Green Version]
- DGE. 14. DGE-Ernährungsbericht. Ernährung Med. 2021, 36, 44–45. [Google Scholar] [CrossRef]
- Bronner, F. Extracellular and intracellular regulation of calcium homeostasis. Sci. World J. 2001, 1, 919–925. [Google Scholar] [CrossRef] [PubMed]
- Schöfl, C. Update—Kalziumstoffwechsel. DMW Dtsch. Med. Wochenschr. 2019, 144, 1125–1132. [Google Scholar] [CrossRef] [PubMed]
- Heravi, A.S.; Michos, E.D. Vitamin D and calcium supplements: Helpful, harmful, or neutral for cardiovascular risk? Methodist DeBakey Cardiovasc. J. 2019, 15, 207. [Google Scholar] [CrossRef] [PubMed]
- Li, K.; Wang, X.-F.; Li, D.-Y.; Chen, Y.-C.; Zhao, L.-J.; Liu, X.-G.; Guo, Y.-F.; Shen, J.; Lin, X.; Deng, J. The good, the bad, and the ugly of calcium supplementation: A review of calcium intake on human health. Clin. Interv. Aging 2018, 13, 2443. [Google Scholar] [CrossRef] [Green Version]
- De la Guía-Galipienso, F.; Martínez-Ferran, M.; Vallecillo, N.; Lavie, C.J.; Sanchis-Gomar, F.; Pareja-Galeano, H. Vitamin D and cardiovascular health. Clin. Nutr. 2021, 40, 2946–2957. [Google Scholar] [CrossRef] [PubMed]
- Thorning, T.K.; Raben, A.; Tholstrup, T.; Soedamah-Muthu, S.S.; Givens, I.; Astrup, A. Milk and dairy products: Good or bad for human health? An assessment of the totality of scientific evidence. Food Nutr. Res. 2016, 60, 32527. [Google Scholar] [CrossRef] [Green Version]
- Sousa, A.; Kopf, K.A. Nutritional implications of an increasing consumption of non-dairy plant-based beverages instead of cow’s milk in Switzerland. Adv. Dairy Res. 2017, 5, 197. [Google Scholar] [CrossRef]
- Haas, R.; Schnepps, A.; Pichler, A.; Meixner, O. Cow milk versus plant-based milk substitutes: A comparison of product image and motivational structure of consumption. Sustainability 2019, 11, 5046. [Google Scholar] [CrossRef] [Green Version]
- Greupner, T.; Schneider, I.; Hahn, A. Calcium bioavailability from mineral waters with different mineralization in comparison to milk and a supplement. J. Am. Coll. Nutr. 2017, 36, 386–390. [Google Scholar] [CrossRef]
- Elmadfa, I.; Meyer, A.L. Patterns of drinking and eating across the European Union: Implications for hydration status. Nutr. Rev. 2015, 73 (Suppl. 2), 141–147. [Google Scholar] [CrossRef] [Green Version]
- Serna, J.; Bergwitz, C. Importance of dietary phosphorus for bone metabolism and healthy aging. Nutrients 2020, 12, 3001. [Google Scholar] [CrossRef] [PubMed]
- Vorland, C.J.; Stremke, E.R.; Moorthi, R.N.; Hill Gallant, K.M. Effects of excessive dietary phosphorus intake on bone health. Curr. Osteoporos. Rep. 2017, 15, 473–482. [Google Scholar] [CrossRef] [PubMed]
- Yamada, S.; Inaba, M. Potassium metabolism and management in patients with CKD. Nutrients 2021, 13, 1751. [Google Scholar] [CrossRef] [PubMed]
- Weaver, C.M.; Stone, M.S.; Lobene, A.J.; Cladis, D.P.; Hodges, J.K. What is the evidence base for a potassium requirement? Nutr. Today 2018, 53, 184. [Google Scholar] [CrossRef]
- Sun, H.; Weaver, C.M. Rise in potassium deficiency in the us population linked to agriculture practices and dietary potassium deficits. J. Agric. Food Chem. 2020, 68, 11121–11127. [Google Scholar] [CrossRef]
- Strohm, D.; Ellinger, S.; Leschik-Bonnet, E.; Maretzke, F.; Heseker, H.; Society, G.N. Revised reference values for potassium intake. Ann. Nutr. Metab. 2017, 71, 118–124. [Google Scholar] [CrossRef] [PubMed] [Green Version]
- Stone, M.S.; Martyn, L.; Weaver, C.M. Potassium intake, bioavailability, hypertension, and glucose control. Nutrients 2016, 8, 444. [Google Scholar] [CrossRef] [PubMed] [Green Version]
- Ungar, N.; Sieverding, M.; Stadnitski, T. Increasing fruit and vegetable intake. “Five a day” versus “just one more”. Appetite 2013, 65, 200–204. [Google Scholar] [CrossRef] [Green Version]
- Schienkiewitz, A.; Haftenberger, M.; Mensink, G.B.M. Time trends of non-alcoholic beverage consumption among adults in Germany, 1990–2011. Nutr. J. 2020, 19, 28. [Google Scholar] [CrossRef] [Green Version]
- Sarmugam, R.; Worsley, A. Current levels of salt knowledge: A review of the literature. Nutrients 2014, 6, 5534–5559. [Google Scholar] [CrossRef] [Green Version]
- O’Donnell, M.; Mente, A.; Yusuf, S. Sodium intake and cardiovascular health. Circ. Res. 2015, 116, 1046–1057. [Google Scholar] [CrossRef]
- Minegishi, S.; Luft, F.C.; Titze, J.; Kitada, K. Sodium handling and interaction in numerous organs. Am. J. Hypertens. 2020, 33, 687–694. [Google Scholar] [CrossRef] [PubMed]
- Grillo, A.; Salvi, L.; Coruzzi, P.; Salvi, P.; Parati, G. Sodium Intake and Hypertension. Nutrients 2019, 11, 1970. [Google Scholar] [CrossRef] [PubMed] [Green Version]
- Rust, P.; Ekmekcioglu, C. Impact of salt intake on the pathogenesis and treatment of hypertension. In Hypertension: From Basic Research to Clinical Practice; Springer: Berlin/Heidelberg, Germany, 2016; pp. 61–84. [Google Scholar]
- Dötsch-Klerk, M.; Pmm Goossens, W.; Meijer, G.; van Het Hof, K. Reducing salt in food; setting product-specific criteria aiming at a salt intake of 5 g per day. Eur. J. Clin. Nutr. 2015, 69, 799–804. [Google Scholar] [CrossRef] [Green Version]
- Klenow, S.; Thamm, M.; Mensink, G.B.M. Sodium intake in Germany estimated from sodium excretion measured in spot urine samples. BMC Nutr. 2016, 2, 36. [Google Scholar] [CrossRef] [Green Version]
- Volpe, S.L. Magnesium in disease prevention and overall health. Adv. Nutr. 2013, 4, 378S–383S. [Google Scholar] [CrossRef] [PubMed] [Green Version]
- Gröber, U.; Schmidt, J.; Kisters, K. Magnesium in prevention and therapy. Nutrients 2015, 7, 8199–8226. [Google Scholar] [CrossRef] [PubMed] [Green Version]
- Barbagallo, M.; Dominguez, L. Magnesium and aging. Curr. Pharm. Des. 2010, 16, 832–839. [Google Scholar] [CrossRef]
- Pinotti, L.; Manoni, M.; Ferrari, L.; Tretola, M.; Cazzola, R.; Givens, I. The contribution of dietary magnesium in farm animals and human nutrition. Nutrients 2021, 13, 509. [Google Scholar] [CrossRef]
- Cazzola, R.; Porta, M.D.; Manoni, M.; Iotti, S.; Pinotti, L.; Maier, J.A. Going to the roots of reduced magnesium dietary intake: A tradeoff between climate changes and sources. Heliyon 2020, 6, e05390. [Google Scholar] [CrossRef]
- Ismail, A.A.; Ismail, Y.; Ismail, A.A. Chronic magnesium deficiency and human disease; time for reappraisal? QJM Int. J. Med. 2018, 111, 759–763. [Google Scholar] [CrossRef] [PubMed] [Green Version]
- Sheehan, J.P.; Seelig, M. Interactions of magnesium and potassium in the pathogenesis of cardiovascular disease. Magnesium 1984, 3, 301–314. [Google Scholar] [PubMed]
- Toba, Y.; Kajita, Y.; Masuyama, R.; Takada, Y.; Suzuki, K.; Aoe, S. Dietary magnesium supplementation affects bone metabolism and dynamic strength of bone in ovariectomized rats. J. Nutr. 2000, 130, 216–220. [Google Scholar] [CrossRef] [Green Version]
- Rosanoff, A.; Dai, Q.; Shapses, S.A. Essential nutrient interactions: Does low or suboptimal magnesium status interact with vitamin D and/or calcium status? Adv. Nutr. 2016, 7, 25–43. [Google Scholar] [CrossRef] [PubMed] [Green Version]
- Olechno, E.; Puścion-Jakubik, A.; Socha, K.; Zujko, M.E. Coffee infusions: Can they be a source of microelements with antioxidant properties? Antioxidants 2021, 10, 1709. [Google Scholar] [CrossRef] [PubMed]
- Darret, G.; Couzy, F.; Antoine, J.-M.; Magliola, C.; Mareschi, J.-P. Estimation of minerals and trace elements provided by beverages for the adult in France. Ann. Nutr. Metab. 1986, 30, 335–344. [Google Scholar] [CrossRef] [PubMed]
- Gorinstein, S.; Zemser, M.; Libman, I.; Trakhtenberg, S.; Caspi, A. Effect of beer consumption on plasma magnesium: Randomized comparison with mineral water. J. R. Soc. Med. 1998, 91, 631–633. [Google Scholar] [CrossRef] [PubMed]
- Oh, H.E.; Deeth, H.C. Magnesium in milk. Int. Dairy J. 2017, 71, 89–97. [Google Scholar] [CrossRef] [Green Version]
- Sachse, B.; Kolbaum, A.E.; Ziegenhagen, R.; Andres, S.; Berg, K.; Dusemund, B.; Hirsch-Ernst, K.I.; Kappenstein, O.; Mueller, F.; Roehl, C. Dietary manganese exposure in the adult population in Germany—What does it mean in relation to health risks? Mol. Nutr. Food Res. 2019, 63, 1900065. [Google Scholar] [CrossRef] [PubMed]
- Street, R.; Szakova, J.; Drabek, O.; Mladkova, L. The status of micronutrients (Cu, Fe, Mn, Zn) in tea and tea infusions in selected samples imported to the Czech Republic. Czech J. Food Sci. 2006, 24, 62. [Google Scholar] [CrossRef] [Green Version]
- Haase, H.; Ellinger, S.; Linseisen, J.; Neuhäuser-Berthold, M.; Richter, M.; Society, G.N. Revised DA-CH-reference values for the intake of zinc. J. Trace Elem. Med. Biol. 2020, 61, 126536. [Google Scholar] [CrossRef] [PubMed]
- Roohani, N.; Hurrell, R.; Kelishadi, R.; Schulin, R. Zinc and its importance for human health: An integrative review. J. Res. Med. Sci. Off. J. Isfahan Univ. Med. Sci. 2013, 18, 144. [Google Scholar]
- Prasad, A.S. Impact of the discovery of human zinc deficiency on health. J. Trace Elem. Med. Biol. 2014, 28, 357–363. [Google Scholar] [CrossRef] [PubMed]
- Frederickson, C.J.; Suh, S.W.; Silva, D.; Frederickson, C.J.; Thompson, R.B. Zinc and health: Current status and future directions. J. Nutr. 2000, 130, 1471S–1483S. [Google Scholar] [CrossRef] [PubMed] [Green Version]
- Schwarz, K.; Foltz, C.M. Selenium as an integral part of factor 3 against dietary necrotic liver degeneration. J. Am. Chem. Soc. 1957, 79, 3292–3293. [Google Scholar] [CrossRef]
- Flohe, L.; Günzler, W.A.; Schock, H.H. Glutathione peroxidase: A selenoenzyme. FEBS Lett. 1973, 32, 132–134. [Google Scholar] [CrossRef] [Green Version]
- Rotruck, J.T.; Pope, A.L.; Ganther, H.E.; Swanson, A.B.; Hafeman, D.G.; Hoekstra, W.G. Selenium: Biochemical role as a component of glutathione peroxidase. Science 1973, 179, 588–590. [Google Scholar] [CrossRef]
- Lei, X.G.; Combs, G.F., Jr.; Sunde, R.A.; Caton, J.S.; Arthington, J.D.; Vatamaniuk, M.Z. Dietary selenium across species. Annu. Rev. Nutr. 2022, 42, 337–375. [Google Scholar] [CrossRef]
- Cobo-Angel, C.; Wichtel, J.; Ceballos-Márquez, A. Selenium in milk and human health. Anim. Front. 2014, 4, 38–43. [Google Scholar] [CrossRef]
- Netto, A.S.; Salles, M.S.V.; Júnior, L.C.R.; Cozzolino, S.M.F.; Gonçalves, M.T.M.; de Freitas Júnior, J.E.; Zanetti, M.A. Increasing selenium and vitamin E in dairy cow milk improves the quality of the milk as food for children. Nutrients 2019, 11, 1218. [Google Scholar] [CrossRef] [Green Version]
- Knowles, S.; Grace, N.; Knight, T.; McNabb, W.; Lee, J. Adding nutritional value to meatand milk from pasture-fed livestock. N. Z. Vet. J. 2004, 52, 342–351. [Google Scholar] [CrossRef] [PubMed]
- Kipp, A.P.; Strohm, D.; Brigelius-Flohé, R.; Schomburg, L.; Bechthold, A.E.; Leschik-Bonnet, E.; Heseker, H.; Society, G.N. Revised reference values for selenium intake. J. Trace Elem. Med. Biol. 2015, 32, 195–199. [Google Scholar] [CrossRef] [PubMed]
- Wang, M.; Li, B.; Li, S.; Song, Z.; Kong, F.; Zhang, X. Selenium in wheat from farming to food. J. Agric. Food Chem. 2021, 69, 15458–15467. [Google Scholar] [CrossRef] [PubMed]
- Robberecht, H.; Van Schoor, O.; Deelstra, H. Selenium and chromium content of European beers as determined by AAS. J. Food Sci. 1984, 49, 300–301. [Google Scholar] [CrossRef]
- Singh, G.M.; Micha, R.; Khatibzadeh, S.; Shi, P.; Lim, S.; Andrews, K.G.; Engell, R.E.; Ezzati, M.; Mozaffarian, D. Global, regional, and national consumption of sugar-sweetened beverages, fruit juices, and milk: A systematic assessment of beverage intake in 187 countries. PLoS ONE 2015, 10, e0124845. [Google Scholar] [CrossRef] [Green Version]
- Martin, C.B.; Wambogo, E.A.; Ahluwalia, N.; Ogden, C.L. Nonalcoholic Beverage Consumption among Adults: United States. 2015–2018; NCHS Data Brief; National Center for Health Statistics: Hyattsville, MD, USA, 2020; Volume 376.
- Nissensohn, M.; Sánchez-Villegas, A.; Galan, P.; Turrini, A.; Arnault, N.; Mistura, L.; Ortiz-Andrellucchi, A.; Edelenyi, F.S.; D’Addezio, L.; Serra-Majem, L. Beverage consumption habits among the European population: Association with total water and energy intakes. Nutrients 2017, 9, 383. [Google Scholar] [CrossRef] [Green Version]
- Kummetat, J.L.; Leonhard, A.; Manthey, J.; Speerforck, S.; Schomerus, G. Understanding the association between alcohol stigma and alcohol consumption within Europe: A cross-sectional exploratory study. Eur. Addict. Res. 2022, 28, 442–450. [Google Scholar] [CrossRef]
- Reyes, C.M.; Cornelis, M.C. Caffeine in the diet: Country-level consumption and guidelines. Nutrients 2018, 10, 1772. [Google Scholar] [CrossRef]


Publisher’s Note: MDPI stays neutral with regard to jurisdictional claims in published maps and institutional affiliations. |
© 2022 by the authors. Licensee MDPI, Basel, Switzerland. This article is an open access article distributed under the terms and conditions of the Creative Commons Attribution (CC BY) license (https://creativecommons.org/licenses/by/4.0/).
Share and Cite
Schaffer, S.; Rimbach, G.; Pieper, D.; Hommen, N.; Fischer, A.; Birringer, M.; Seidel, U. Minerals and Trace Elements in 990 Beverages and Their Contribution to Dietary Reference Values for German Consumers. Nutrients 2022, 14, 4899. https://doi.org/10.3390/nu14224899
Schaffer S, Rimbach G, Pieper D, Hommen N, Fischer A, Birringer M, Seidel U. Minerals and Trace Elements in 990 Beverages and Their Contribution to Dietary Reference Values for German Consumers. Nutrients. 2022; 14(22):4899. https://doi.org/10.3390/nu14224899
Chicago/Turabian StyleSchaffer, Sebastian, Gerald Rimbach, David Pieper, Niklas Hommen, Alexandra Fischer, Marc Birringer, and Ulrike Seidel. 2022. "Minerals and Trace Elements in 990 Beverages and Their Contribution to Dietary Reference Values for German Consumers" Nutrients 14, no. 22: 4899. https://doi.org/10.3390/nu14224899