
Metabolic Effects of Vitamin B1 Therapy under Overnutrition and Undernutrition Conditions in Sheep


Abstract
:1. Introduction
2. Materials & Methods
2.1. Ethical Statement
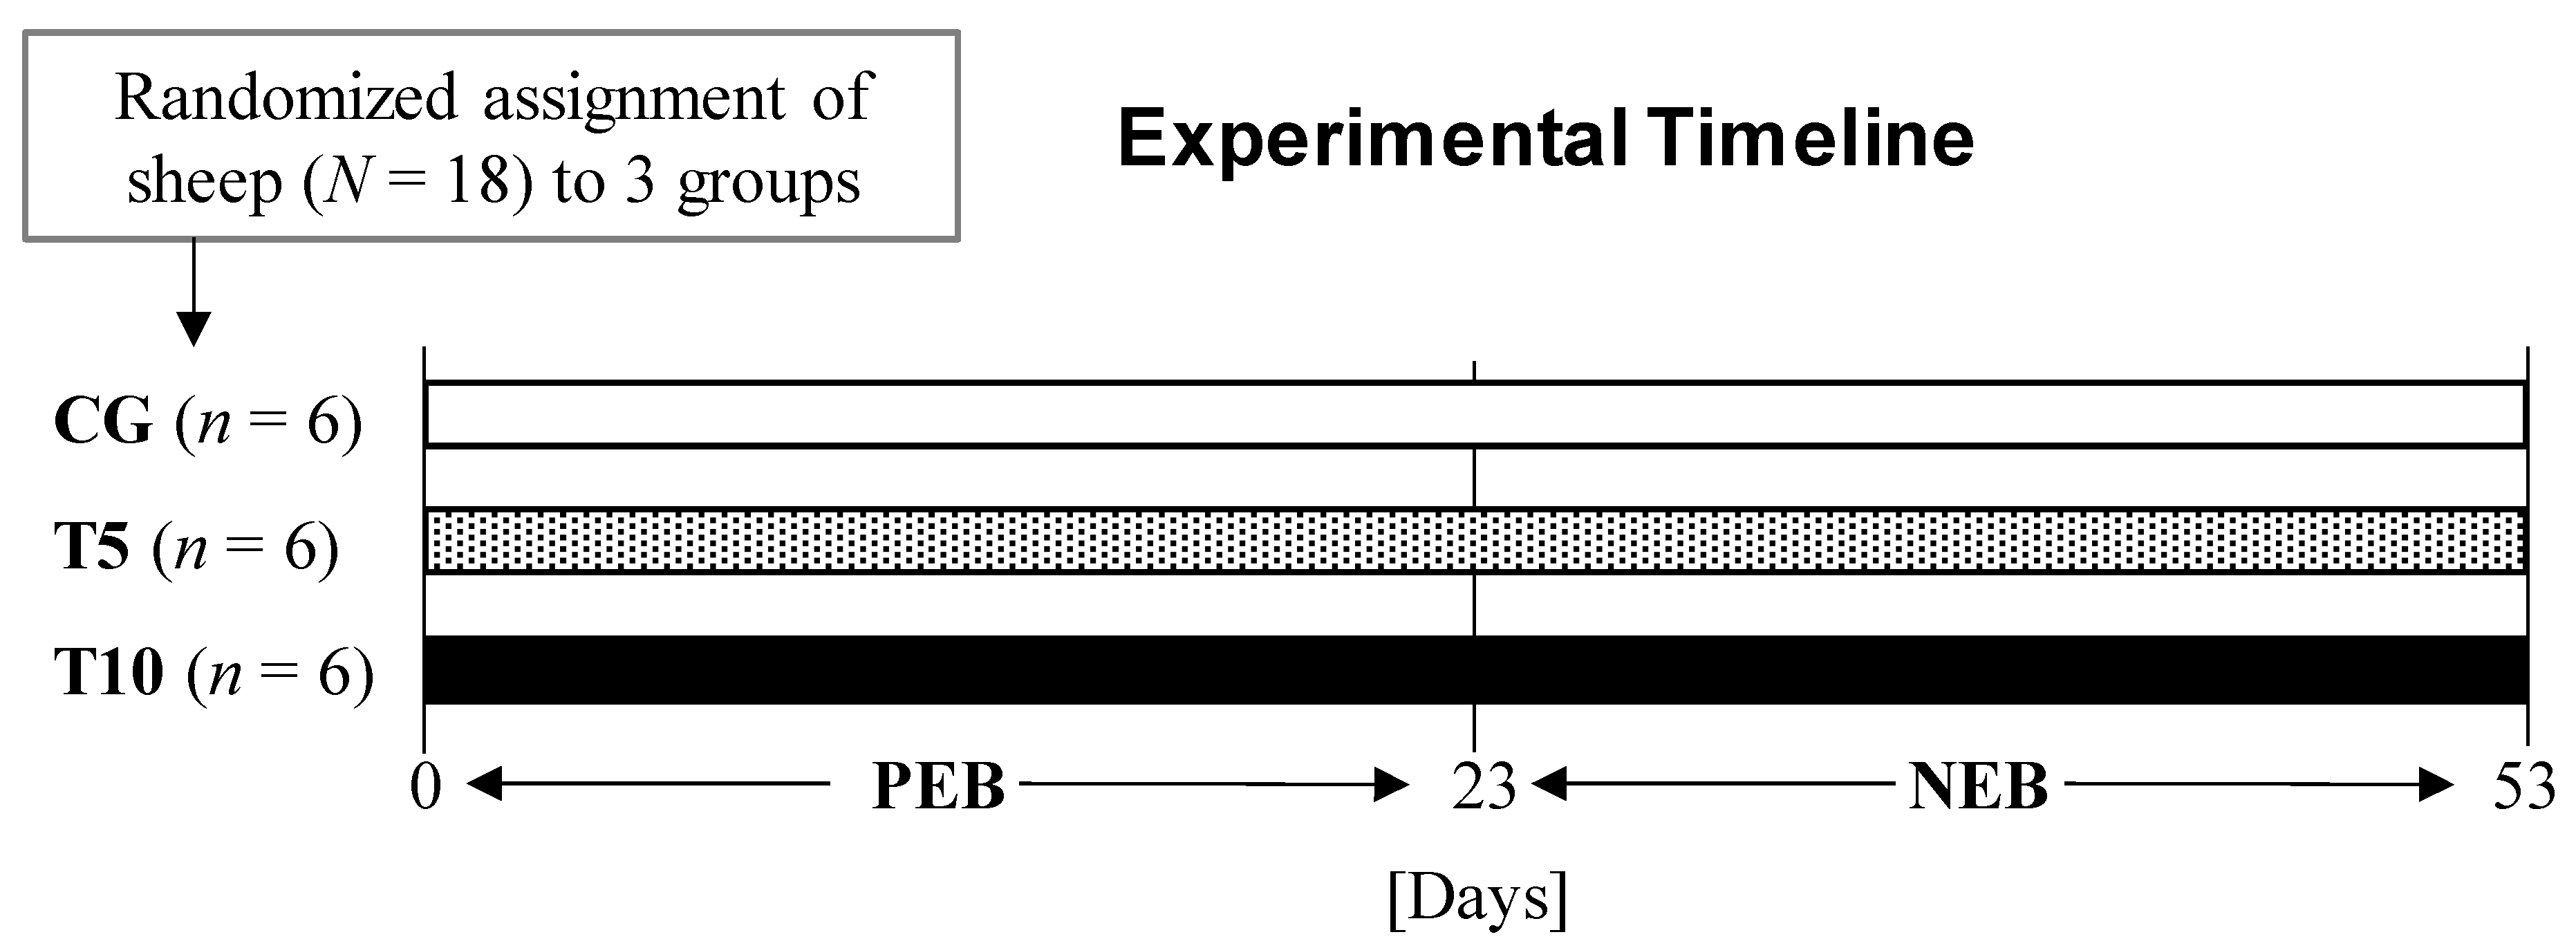
2.2. Animals and Experimental Design
2.3. Plasma and Serum Biochemical Analysis
2.4. Statistical Analysis
3. Results
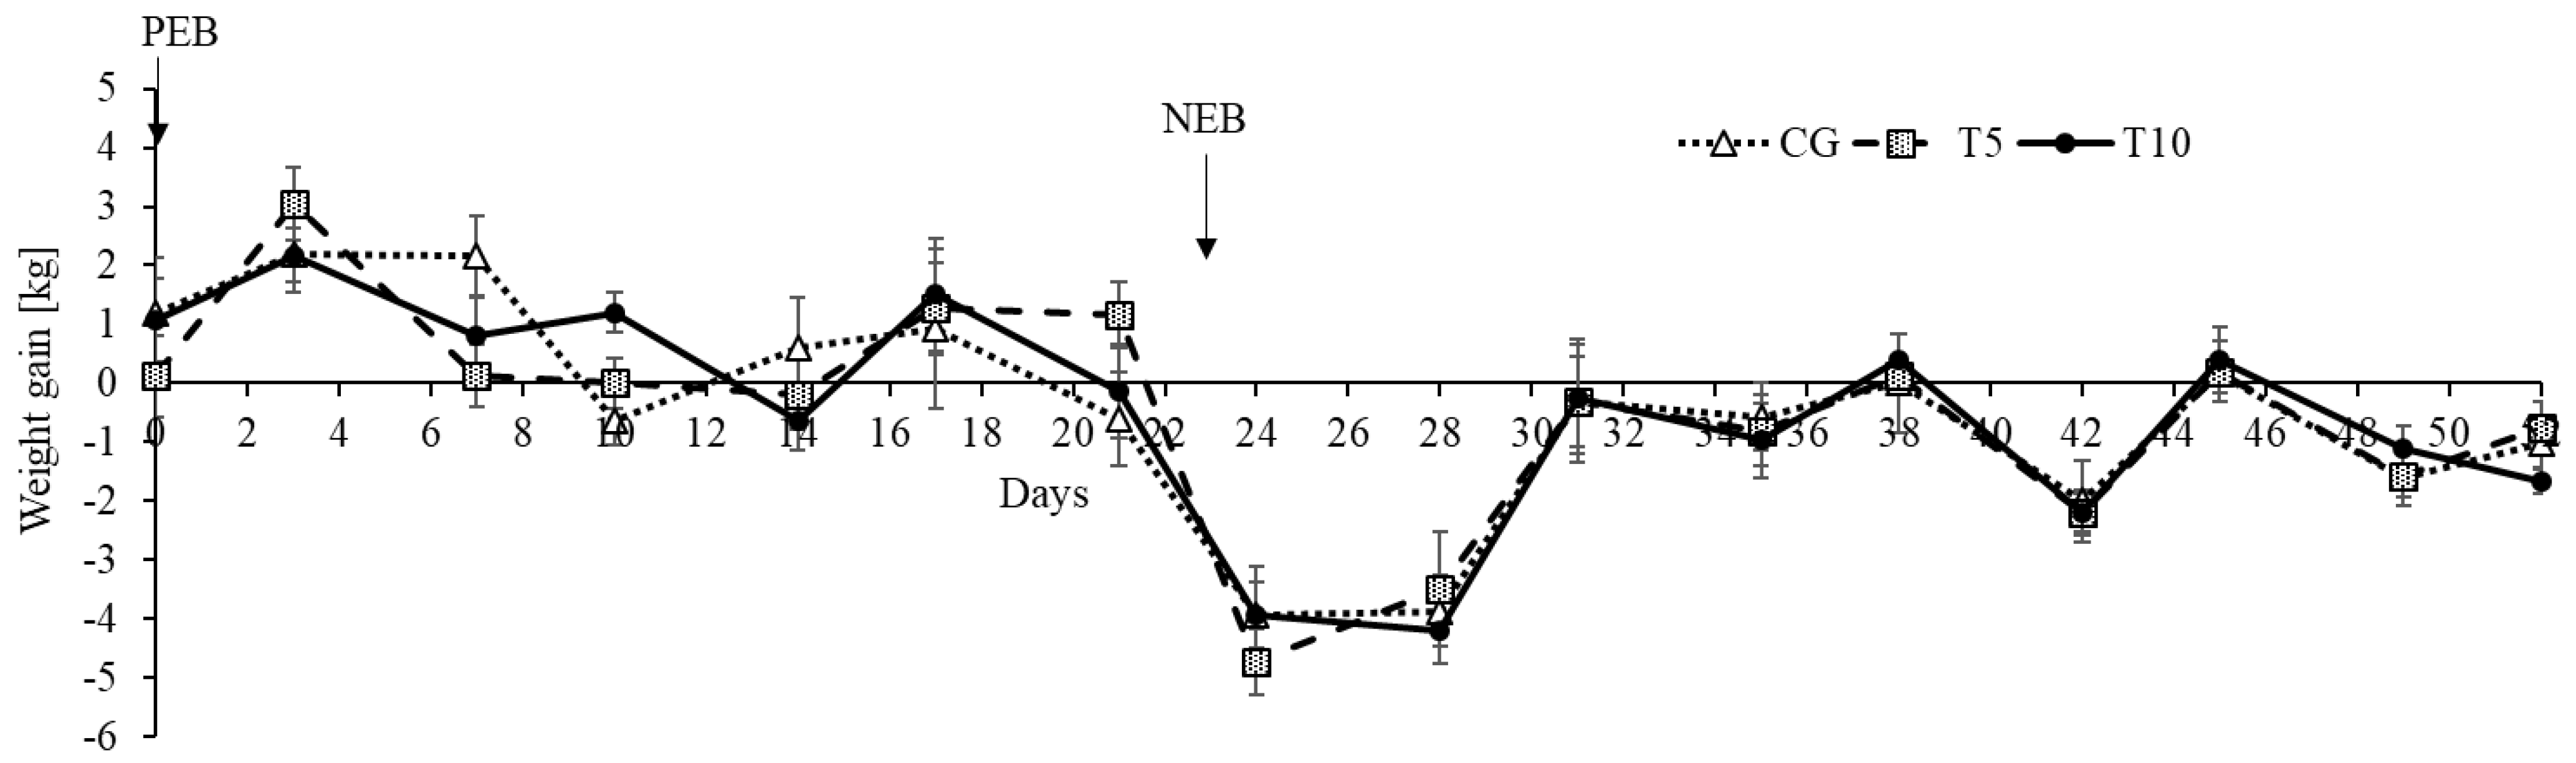
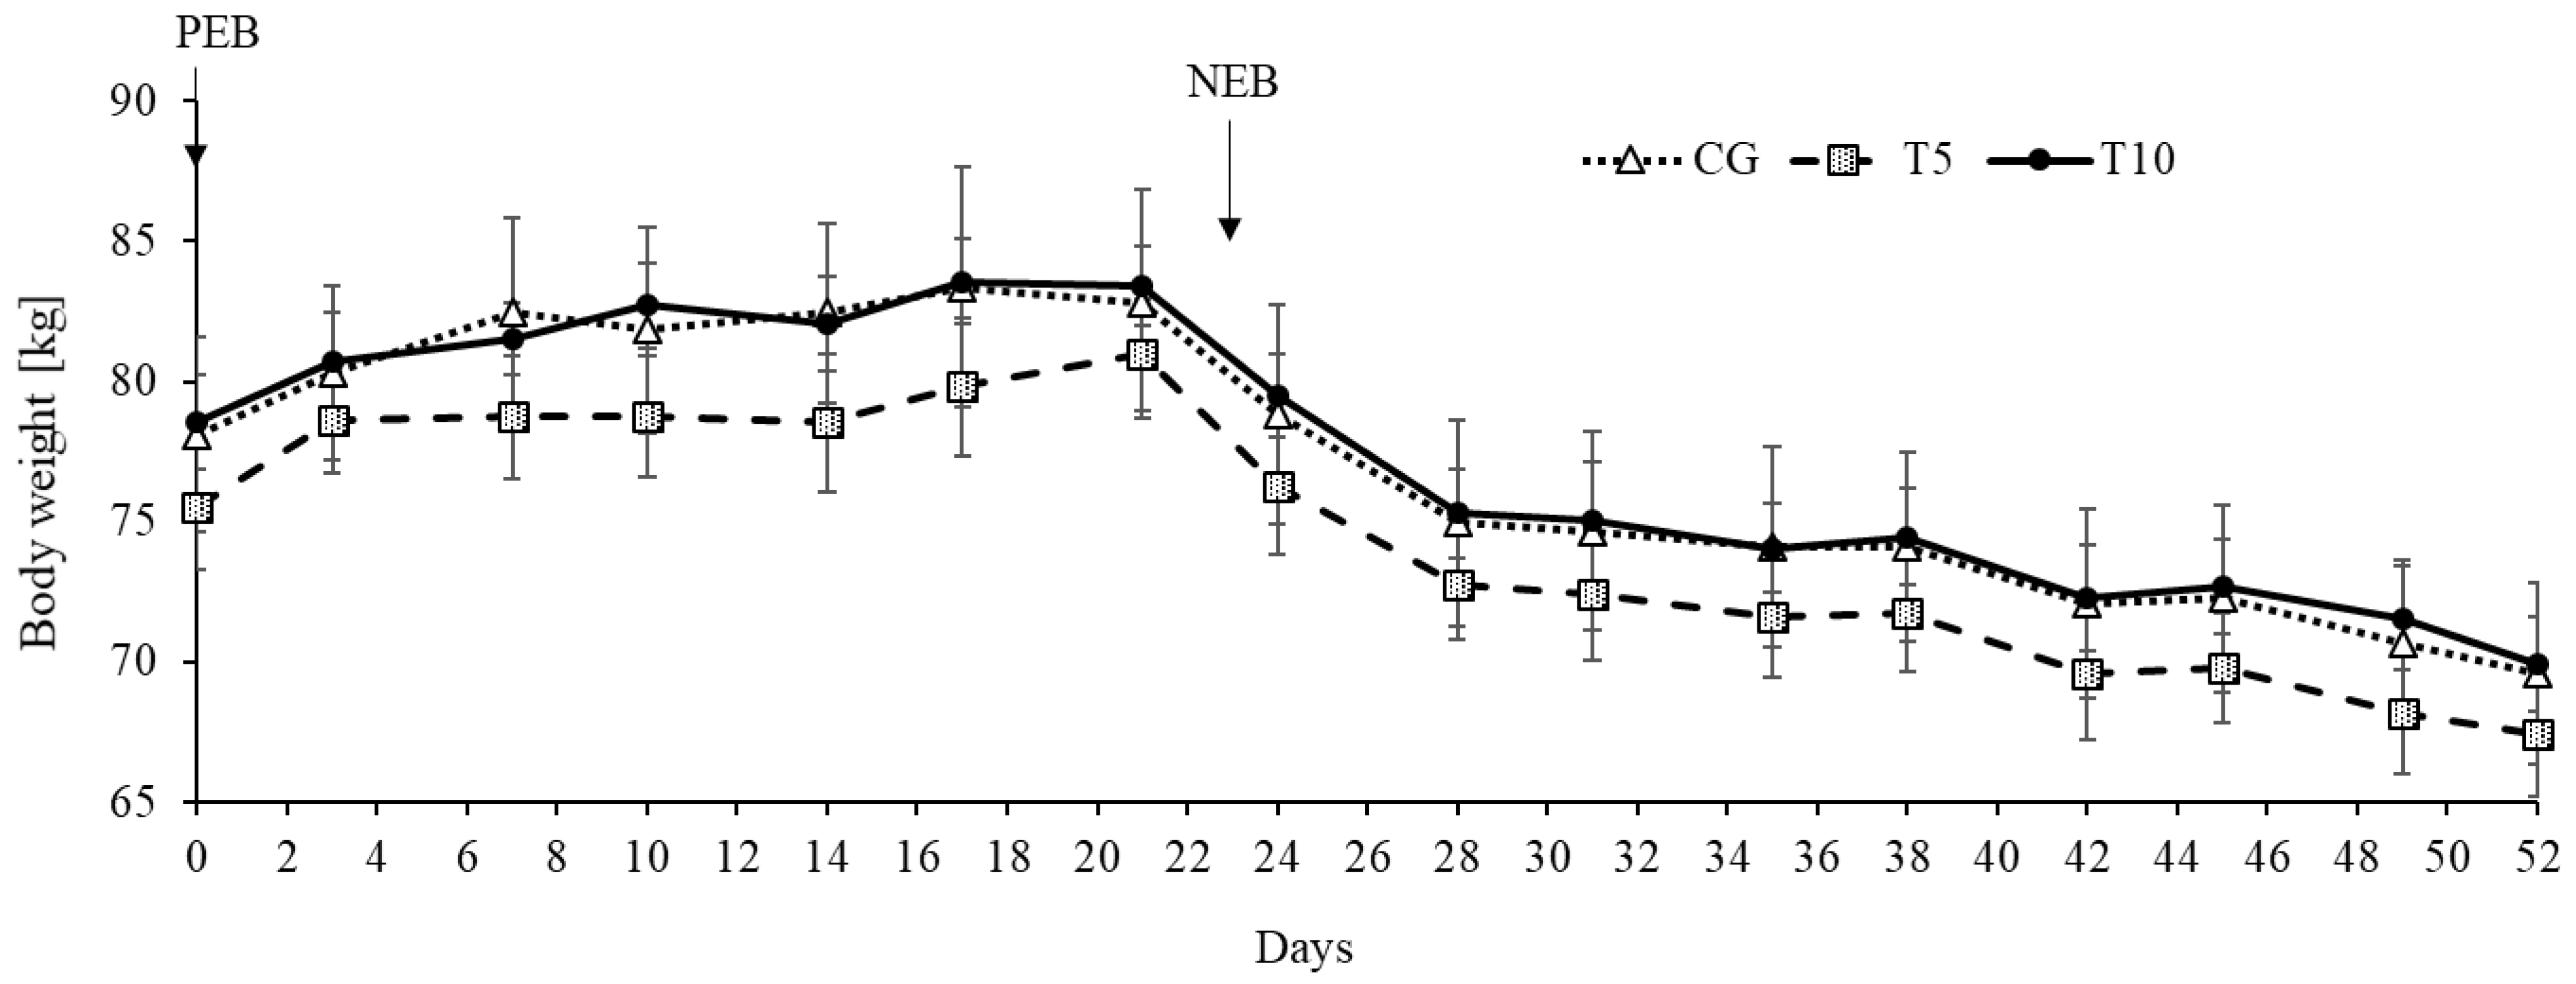
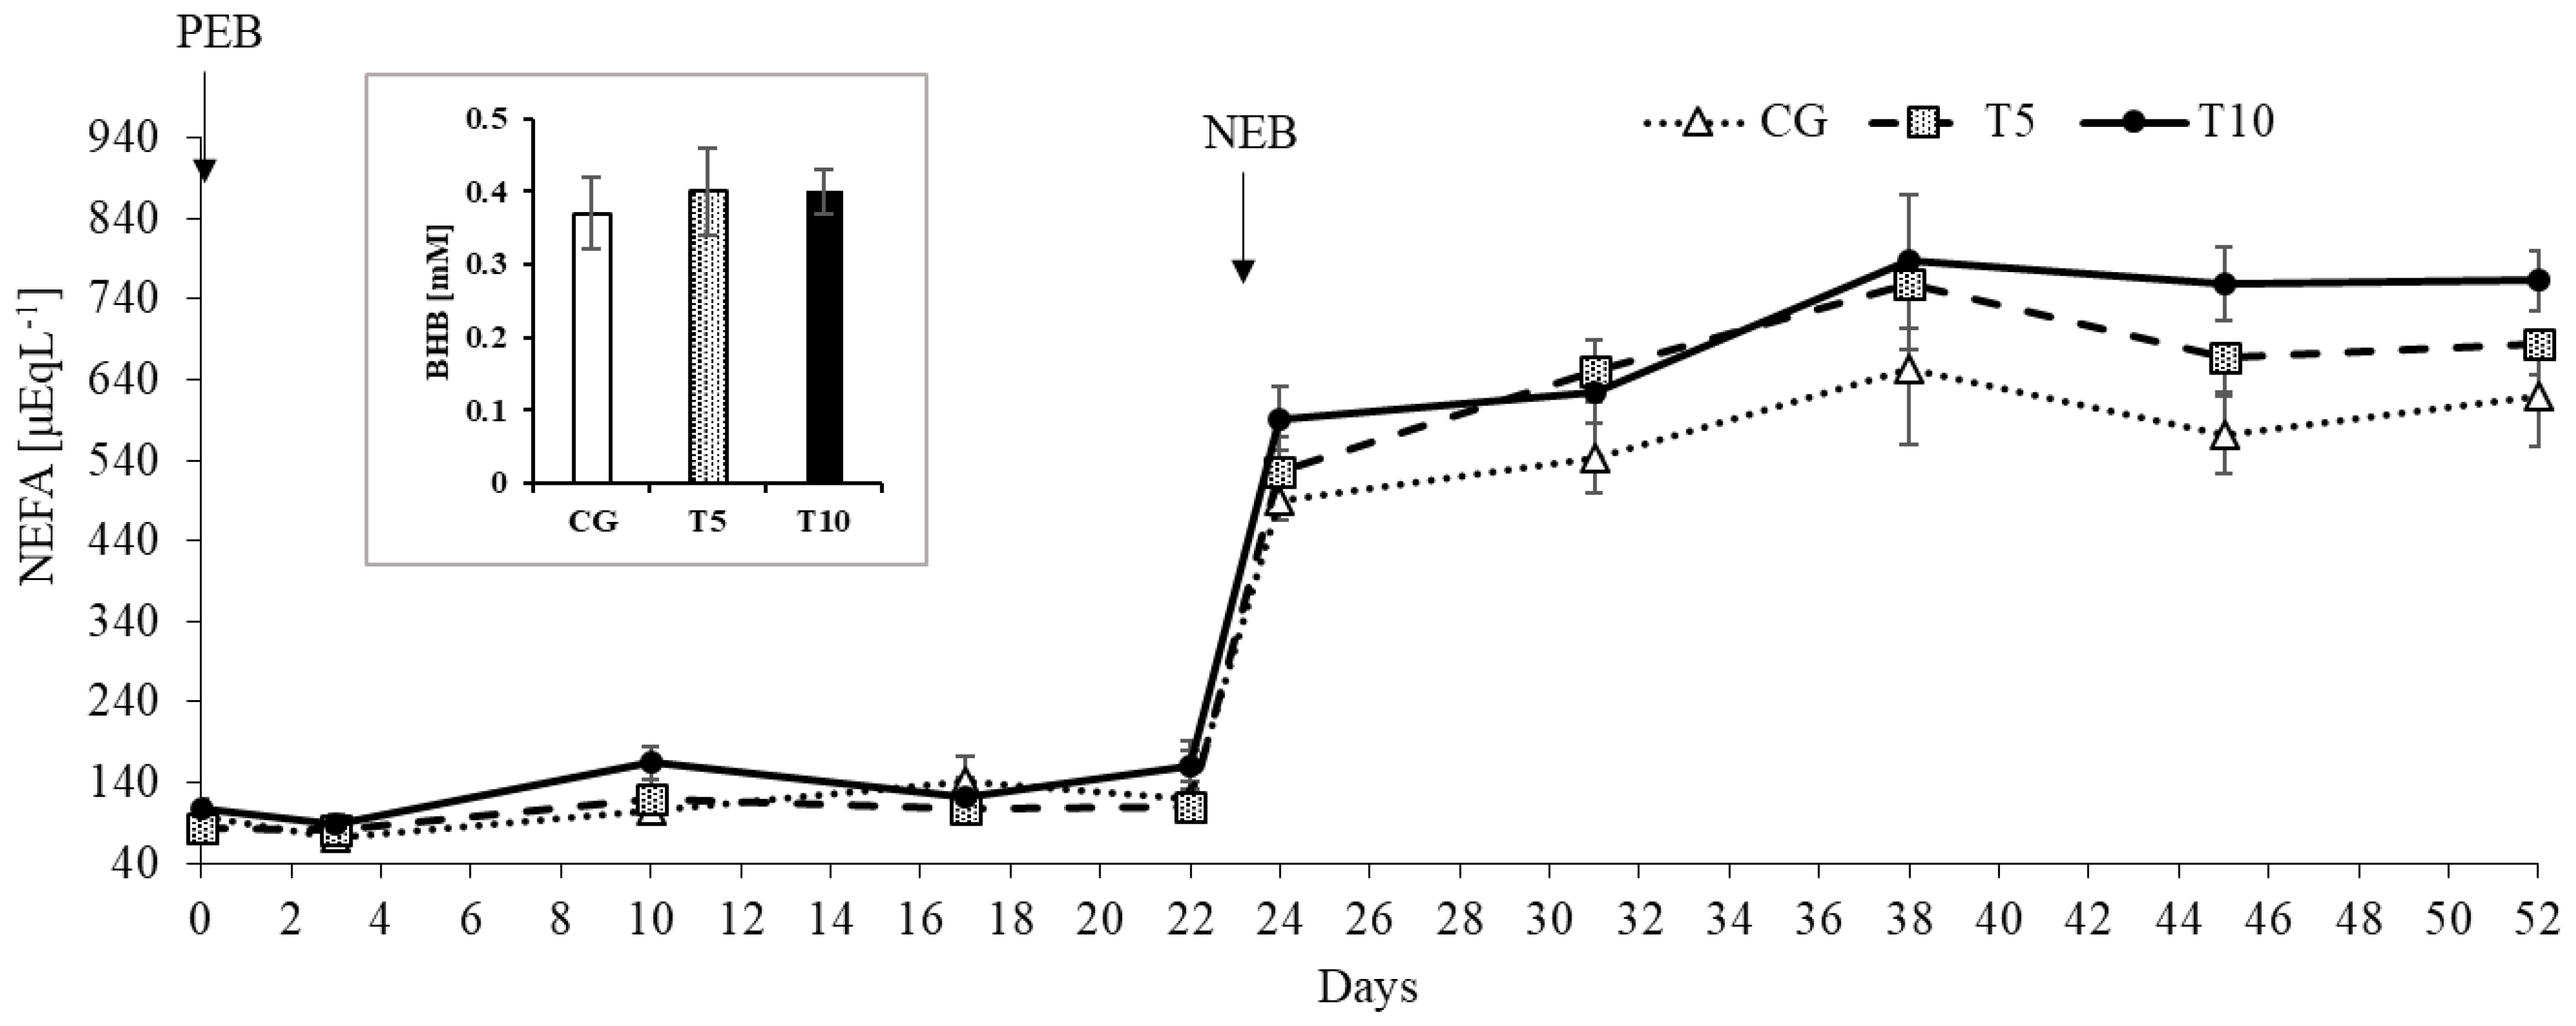
3.1. Thiamine Increased Adipose Lipolysis during NEB but Did Not Affect Body Weight
3.2. Thiamine Increased Serum Creatinine Concentrations
3.3. Thiamine Effects on Serum Mineral Concentrations
4. Discussion
5. Conclusions
Supplementary Materials
Author Contributions
Funding
Institutional Review Board Statement
Informed Consent Statement
Data Availability Statement
Conflicts of Interest
References
- Voskoboyev, A.I.; Ostrovsky, Y.M. Thiamin Pyrophosphokinase: Structure, Properties. And Role in Thiamin Metabolism. Ann. N. Y. Acad. Sci. 1982, 378, 161–176. [Google Scholar] [CrossRef] [PubMed]
- Manzetti, S.; Zhang, J.; Van Der Spoel, D. Thiamin function, metabolism, uptake, and transport. Biochemistry 2014, 53, 821–835. [Google Scholar] [CrossRef]
- Kerns, J.C.; Arundel, C.; Chawla, L.S. Thiamin deficiency in people with obesity. Adv. Nutr. 2015, 6, 147–153. [Google Scholar] [CrossRef] [PubMed] [Green Version]
- Ciszak, E.M.; Korotchkina, L.G.; Dominiak, P.M.; Sidhu, S.; Patel, M.S. Structural basis for flip-flop action of thiamin pyrophosphate-dependent enzymes revealed by human pyruvate dehydrogenase. J. Biol. Chem. 2003, 278, 21240–21246. [Google Scholar] [CrossRef] [Green Version]
- Hennig, J.; Kern, G.; Neef, H.; Spinka, M.; Bisswanger, H.; Hübner, G. Molecular mechanism of regulation of the pyruvate dehydrogenase complex from E. coli. Biochemistry 1997, 36, 15772–15779. [Google Scholar] [CrossRef] [PubMed]
- Holecek, M. Effect of starvation on branched-chain alpha-keto acid dehydrogenase activity in rat heart and skeletal muscle. Physiol. Res. 2001, 50, 19–24. [Google Scholar] [PubMed]
- Huang, H.M.; Zhang, H.; Xu, H.; Gibson, G.E. Inhibition of the α-ketoglutarate dehydrogenase complex alters mitochondrial function and cellular calcium regulation. Biochim. Biophys. Acta-Mol. Basis Dis. 2003, 1637, 119–126. [Google Scholar] [CrossRef] [Green Version]
- Butterworth, R.F. Effects of thiamine deficiency on brain metabolism: Implications for the pathogenesis of the wernicke-korsakoff syndrome. Alcohol Alcohol. 1989, 24, 271–279. [Google Scholar] [CrossRef] [PubMed]
- Kril, J.J. Neuropathology of thiamine deficiency disorders. Metab. Brain Dis. 1996, 11, 9–17. [Google Scholar] [CrossRef]
- Brown, G. Defects of thiamine transport and metabolism. J. Inherit. Metab. Dis. 2014, 37, 577–585. [Google Scholar] [CrossRef]
- Bocobza, S.E.; Malitsky, S.; Araújo, W.L.; Nunes-Nesi, A.; Meir, S.; Shapira, M.; Fernie, A.R.; Aharoni, A. Orchestration of Thiamin Biosynthesis and Central Metabolism by Combined Action of the Thiamin Pyrophosphate Riboswitch and the Circadian Clock in Arabidopsis. Plant Cell 2013, 25, 288–307. [Google Scholar] [CrossRef] [Green Version]
- Babaei-Jadidi, R.; Karachalias, N.; Kupich, C.; Ahmed, N.; Thornalley, P.J. High-dose thiamine therapy counters dyslipidaemia in streptozotocin-induced diabetic rats. Diabetologia 2004, 47, 2235–2246. [Google Scholar] [CrossRef] [Green Version]
- Alaei Shahmiri, F.; Soares, M.J.; Zhao, Y.; Sherriff, J. High-dose thiamine supplementation improves glucose tolerance in hyperglycemic individuals: A randomized, double-blind cross-over trial. Eur. J. Nutr. 2013, 52, 1821–1824. [Google Scholar] [CrossRef]
- Shimon, H.; Almog, S.; Vered, Z.; Seligmann, H.; Shefi, M.; Peleg, E.; Rosenthal, T.; Motro, M.; Halkin, H.; Ezra, D. Improved left ventricular function after thiamine supplementation in patients with congestive heart failure receiving long-term furosemide therapy. Am. J. Med. 1995, 98, 485–490. [Google Scholar] [CrossRef]
- Falder, S.; Silla, R.; Phillips, M.; Rea, S.; Gurfinkel, R.; Baur, E.; Bartley, A.; Wood, F.M.; Fear, M.W. Thiamine supplementation increases serum thiamine and reduces pyruvate and lactate levels in burn patients. Burns 2010, 36, 261–269. [Google Scholar] [CrossRef]
- Hammes, H.P.; Du, X.; Edelstein, D.; Taguchi, T.; Matsumura, T.; Ju, Q.; Lin, J.; Bierhaus, A.; Nawroth, P.; Hannak, D.; et al. Benfotiamine blocks three major pathways of hyperglycemic damage and prevents experimental diabetic retinopathy. Nat. Med. 2003, 9, 294–299. [Google Scholar] [CrossRef] [PubMed]
- Kalyesubula, M.; Mopuri, R.; Rosov, A.; Alon, T.; Edery, N.; Moallem, U.; Dvir, H. Hyperglycemia-stimulating diet induces liver steatosis in sheep. Sci. Rep. 2020, 10, 12189. [Google Scholar] [CrossRef] [PubMed]
- Kalyesubula, M.; Mopuri, R.; Asiku, J.; Rosov, A.; Yosefi, S.; Edery, N.; Bocobza, S.; Moallem, U.; Dvir, H. High-dose vitamin B1 therapy prevents the development of experimental fatty liver driven by overnutrition. Dis. Model. Mech. 2021, 14, dmm048355. [Google Scholar] [CrossRef] [PubMed]
- Gootwine, E.; Reicher, S.; Rozov, A. Prolificacy and lamb survival at birth in Awassi and Assaf sheep carrying the FecB (Booroola) mutation. Anim. Reprod. Sci. 2008, 108, 402–411. [Google Scholar] [CrossRef]
- National Research Council. Nutrient Requirements of Small Ruminants: Sheep, Goats, Cervids, and New World Camelids; The National Academies Press: Washington, DC, USA, 2007; ISBN 978-0-309-47323-1. [Google Scholar]
- Kalyesubula, M.; Rosov, A.; Alon, T.; Moallem, U.; Dvir, H. Intravenous Infusions of Glycerol Versus Propylene Glycol for the Regulation of Negative Energy Balance in Sheep: A Randomized Trial. Animals 2019, 9, 731. [Google Scholar] [CrossRef] [Green Version]
- Abdi, H.; Williams, L.J. Tukey’s honestly significant difference (HSD) test. In Encyclopedia of Research Design; Salkind, N.J., Ed.; Sage: Thousand Oaks, CA, USA, 2010; pp. 583–585. [Google Scholar]
- McGarry, J.D.; Foster, D.W. The regulation of ketogenesis from oleic acid and the influence of antiketogenic agents. J. Biol. Chem. 1971, 246, 6247–6253. [Google Scholar] [CrossRef]
- McGarry, J.D.; Foster, D.W. Regulation of hepatic fatty acid oxidation and ketone body production. Annu. Rev. Biochem. 1980, 49, 395–420. [Google Scholar] [CrossRef] [PubMed]
- Adewuyi, A.A.; Gruys, E.; van Eerdenburg, F.J. Non esterified fatty acids (NEFA) in dairy cattle. A review. Vet. Q. 2005, 27, 117–126. [Google Scholar] [CrossRef] [PubMed] [Green Version]
- Bubber, P.; Ke, Z.-J.; Gibson, G.E. Tricarboxylic acid cycle enzymes following thiamine deficiency. Neurochem. Int. 2004, 45, 1021–1028. [Google Scholar] [CrossRef]
- Aiello, S.E.; Moses, M.A.; Allen, D.G. The Merck Veterinary Manual, 11th ed.; Merck & Company, Incorporated: White Station, NJ, USA, 2016. [Google Scholar]
- Brosnan, J.T.; Brosnan, M.E. Creatine: Endogenous metabolite, dietary, and therapeutic supplement. Annu. Rev. Nutr. 2007, 27, 241–261. [Google Scholar] [CrossRef] [Green Version]
- Andrews, R.; Greenhaff, P.; Curtis, S.; Perry, A.; Cowley, A.J. The effect of dietary creatine supplementation on skeletal muscle metabolism in congestive heart failure. Eur. Heart J. 1998, 19, 617–622. [Google Scholar] [CrossRef] [Green Version]
- Page, A.; Flower, L.; Prowle, J.; Puthucheary, Z. Novel methods to identify and measure catabolism. Curr. Opin. Crit. Care 2021, 27, 361–366. [Google Scholar] [CrossRef] [PubMed]
- Patel, S.S.; Molnar, M.Z.; Tayek, J.A.; Ix, J.H.; Noori, N.; Benner, D.; Heymsfield, S.; Kopple, J.D.; Kovesdy, C.P.; Kalantar-Zadeh, K. Serum creatinine as a marker of muscle mass in chronic kidney disease: Results of a cross-sectional study and review of literature. J. Cachexia. Sarcopenia Muscle 2013, 4, 19–29. [Google Scholar] [CrossRef] [PubMed]
- Istasse, L.; Van Eenaeme, C.; Gabriel, A.; Clinquart, A.; Maghuin-Rogister, G.; Bienfait, J.M. The relationship between carcass characteristics, plasma hormones and metabolites in young fattening bulls. Vet. Res. Commun. 1990, 14, 19–26. [Google Scholar] [CrossRef] [PubMed]
- Shimomura, Y.; Honda, T.; Shiraki, M.; Murakami, T.; Sato, J.; Kobayashi, H.; Mawatari, K.; Obayashi, M.; Harris, R.A. Branched-chain amino acid catabolism in exercise and liver disease. J. Nutr. 2006, 136, 250S–253S. [Google Scholar] [CrossRef] [PubMed] [Green Version]
- Navarro, D.; Zwingmann, C.; Butterworth, R.F. Impaired oxidation of branched-chain amino acids in the medial thalamus of thiamine-deficient rats. Metab. Brain Dis. 2008, 23, 445–455. [Google Scholar] [CrossRef] [PubMed]
- Mkrtchyan, G.V.; Üçal, M.; Müllebner, A.; Dumitrescu, S.; Kames, M.; Moldzio, R.; Molcanyi, M.; Schaefer, S.; Weidinger, A.; Schaefer, U.; et al. Thiamine preserves mitochondrial function in a rat model of traumatic brain injury, preventing inactivation of the 2-oxoglutarate dehydrogenase complex. Biochim. Biophys. Acta-Bioenerg. 2018, 1859, 925–931. [Google Scholar] [CrossRef] [PubMed]


| Parameter | Positive Energy Balance | Negative Energy Balance | p-Values | ||||||||
|---|---|---|---|---|---|---|---|---|---|---|---|
| CG | T5 | T10 | SEM | CG | T5 | T10 | SEM | TRT | NS | TRT × NS | |
| Creatine Kinase, µL−1 | 181.3 | 184.7 | 185.0 | 10.3 | 124.3 | 195.7 | 137.2 | 17.2 | 0.43 | 0.04 | 0.14 |
| Albumin, gdL−1 | 4.09 | 4.31 | 4.17 | 0.06 | 4.30 | 4.53 | 4.47 | 0.06 | 0.32 | 0.0002 | 0.73 |
| AST, UL−1 | 93.5 | 126.7 | 113.6 | 9.1 | 90.6 | 214.7 | 221.6 | 38.9 | 0.23 | 0.11 | 0.47 |
| Total bilirubin, mgdL−1 | 0.05 | 0.02 | 0.03 | 0.008 | 0.14 | 0.13 | 0.19 | 0.01 | 0.21 | <0.0001 | 0.03 |
| Calcium, mgdL−1 | 10.11 | 9.11 | 10.33 | 0.22 | 9.83 | 9.50 | 10.22 | 0.15 | 0.04 | 0.98 | 0.30 |
| Cholesterol, mgdL−1 | 98.6 | 91.9 | 90.9 | 2.9 | 108.5 | 115.0 | 111.7 | 2.6 | 0.91 | <0.0001 | 0.21 |
| Creatinine, mgdL−1 | 0.72 * | 0.83 | 0.88 * | 0.03 | 0.82 § | 0.97 | 1.05 § | 0.04 | 0.05 | 0.0002 | 0.68 |
| Urea, mgdL−1 | 39.2 | 45.7 | 46.1 | 1.7 | 23.8 | 26.8 | 27.6 | 0.94 | 0.09 | <0.0001 | 0.66 |
| GGT, µL−1 | 68.2 | 75.5 | 82.3 | 3.5 | 53.8 | 74.2 | 71.5 | 5.4 | 0.14 | 0.15 | 0.65 |
| LDH, µL−1 | 798.8 | 1038.2 | 992.7 | 47.7 | 890.5 | 1624.3 | 1519.7 | 184.0 | 0.11 | 0.03 | 0.46 |
| Magnesium, µL−1 | 2.17 | 2.41 | 1.72 | 0.09 | 1.75 | 1.72 | 2.10 | 0.05 | 0.62 | <0.0001 | 0.21 |
| Phosphorous, mgdL−1 | 4.38 | 6.17 | 4.86 | 0.37 | 6.11 | 7.72 | 5.58 | 0.40 | 0.06 | 0.001 | 0.44 |
| Total Protein, gdL−1 | 7.58 | 7.42 | 7.51 | 0.13 | 7.37 | 7.44 | 7.55 | 0.1 | 0.93 | 0.56 | 0.45 |
| Triglycerides, mgdL−1 | 9.42 | 9.53 | 10.57 | 1.29 | 7.17 | 9.33 | 12.21 | 0.93 | 0.36 | 0.86 | 0.56 |
| Sodium, mmolL−1 | 144.3 | 145.2 | 145.0 | 0.4 | 149.3 | 148.8 | 148.8 | 0.44 | 0.98 | <0.0001 | 0.64 |
| Potassium, mmolL−1 | 5.04 | 5.13 | 5.23 | 0.09 | 5.19 | 5.29 | 5.26 | 0.09 | 0.72 | 0.34 | 0.90 |
| Chloride, mmolL−1 | 101.4 | 101.9 | 101.5 | 0.42 | 109.0 | 106.7 | 107.8 | 0.7 | 0.68 | <0.0001 | 0.37 |
| NEFA, µEqL−1 | 109.8 | 104.7 § | 134.6 § | 5.3 | 575.5 * | 657.6 | 704.9 * | 16.8 | 0.11 | <0.0001 | 0.01 |
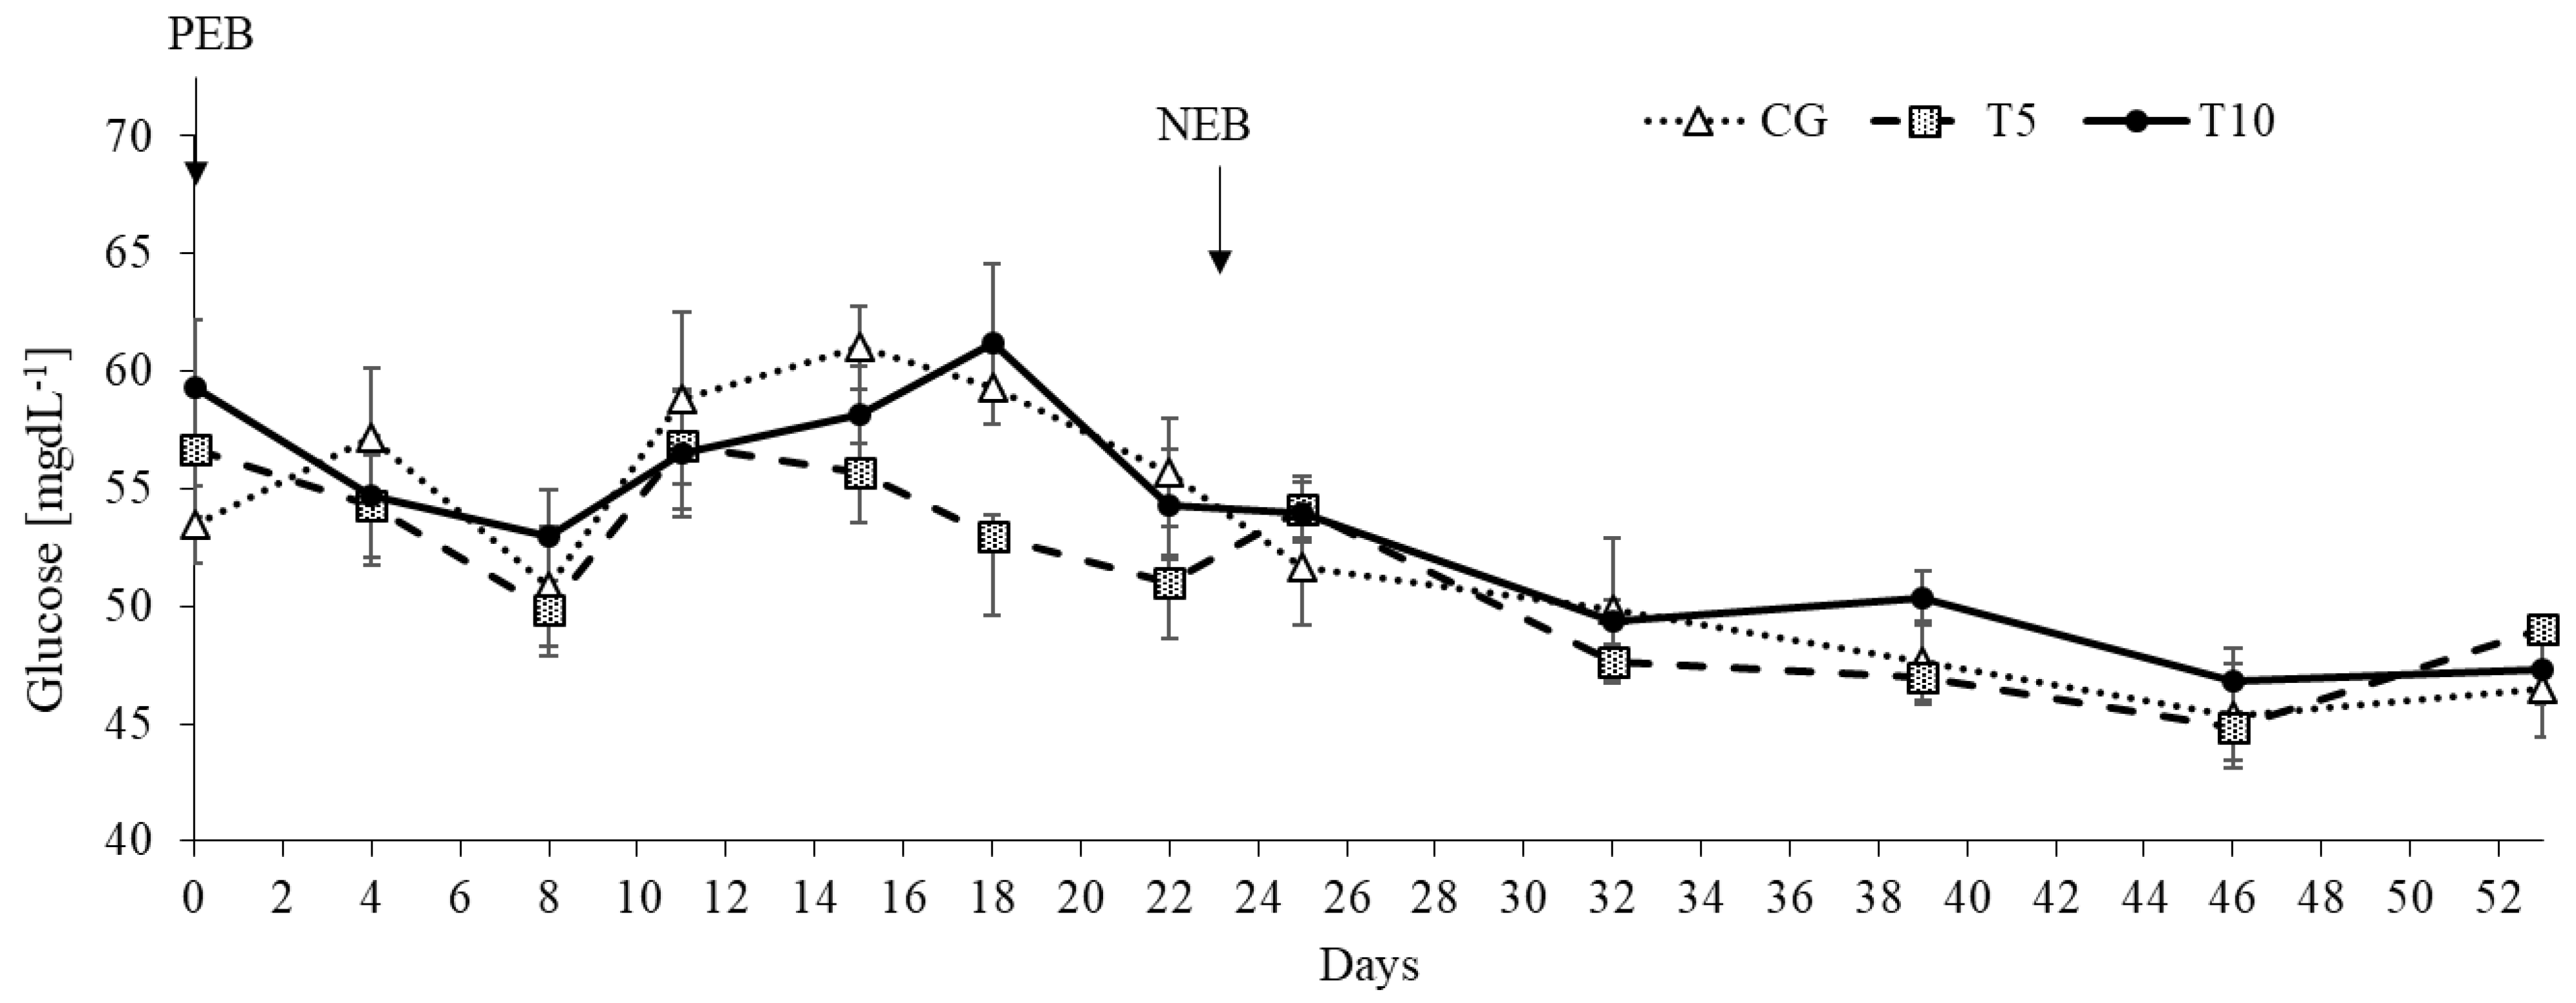
| Glucose, mgdL−1 | 57.1 | 53.4 | 56.3 | 0.54 | 48.2 | 48.5 | 49.6 | 0.64 | 0.54 | <0.0001 | 0.06 |
| Normalized weight gain, kgMCal−1 | 0.12 | 0.15 | 0.13 | 0.03 | −1.20 | −1.29 | −1.25 | 0.13 | 0.93 | <0.0001 | 0.93 |
| Normalized body weight, kgMCal−1 | 13.0 | 13.0 | 13.1 | 0.03 | 61.7 | 61.5 | 62.4 | 0.17 | 0.67 | <0.0001 | 0.02 |
Publisher’s Note: MDPI stays neutral with regard to jurisdictional claims in published maps and institutional affiliations. |
© 2021 by the authors. Licensee MDPI, Basel, Switzerland. This article is an open access article distributed under the terms and conditions of the Creative Commons Attribution (CC BY) license (https://creativecommons.org/licenses/by/4.0/).
Share and Cite
Kalyesubula, M.; Mopuri, R.; Rosov, A.; Bommel, G.V.; Dvir, H. Metabolic Effects of Vitamin B1 Therapy under Overnutrition and Undernutrition Conditions in Sheep. Nutrients 2021, 13, 3463. https://doi.org/10.3390/nu13103463
Kalyesubula M, Mopuri R, Rosov A, Bommel GV, Dvir H. Metabolic Effects of Vitamin B1 Therapy under Overnutrition and Undernutrition Conditions in Sheep. Nutrients. 2021; 13(10):3463. https://doi.org/10.3390/nu13103463
Chicago/Turabian StyleKalyesubula, Mugagga, Ramgopal Mopuri, Alexander Rosov, Guy Van Bommel, and Hay Dvir. 2021. "Metabolic Effects of Vitamin B1 Therapy under Overnutrition and Undernutrition Conditions in Sheep" Nutrients 13, no. 10: 3463. https://doi.org/10.3390/nu13103463