Technical Note

High-Resolution and Wide-Swath SAR Imaging with Space–Time Coding Array

National Key Laboratory of Radar Signal Processing, Xidian University, Xi’an 710071, China
*
Author to whom correspondence should be addressed.
Remote Sens. 2023, 15(9), 2465; https://doi.org/10.3390/rs15092465
Submission received: 30 March 2023 / Revised: 4 May 2023 / Accepted: 5 May 2023 / Published: 8 May 2023
(This article belongs to the Special Issue Radar Techniques and Imaging Applications)

Abstract

:
To achieve high-resolution and wide-swath (HRWS) synthetic aperture radar (SAR) images, this paper focuses on resolving the problem of separating range-ambiguous echoes with the space–time coding (STC) array. At the modeling stage, the transmit elements and pulses of the STC array are configured with time delay and phase coding modulation, which introduces extra degrees of freedom (DOFs) in the transmit domain. To separate the echoes corresponding to different range-ambiguity regions, the equivalent transmit beamforming is performed in the two-dimensional space–frequency domain. Moreover, in order to compensate for the loss of range resolution during the beamforming progress, the frequency splicing method is proposed. At the analysis stage, the distributed target simulation is provided to demonstrate the effectiveness of obtaining HRWS SAR images in the STC radar. Additionally, the performance of resolving range ambiguity is compared with the traditional radar in terms of the range-ambiguity-to-signal ratio (RASR).

1. Introduction

The synthetic aperture radar (SAR) has been extensively utilized in both military and civil applications due to its ability to provide high-resolution imaging for a specific area of interest [1,2,3,4]. Traditionally, to achieve high-resolution images in the azimuth, a high pulse repetitive frequency (PRF) is employed to avoid Doppler ambiguity [5,6]. On the contrary, a low PRF is utilized [7] to obtain a wide range swath. Therefore, both wide unambiguous swath coverage and high azimuth resolution present contradicting demands on the design of satellite SAR systems. For the case where Doppler ambiguity is present, the spectral reconstruction method [8,9] and the displaced phase center antenna (DPCA) method [10] at low PRF are proposed. In this study, we focus on resolving range ambiguity without Doppler ambiguity at high PRF.
Various techniques have been proposed in the literature to address the issue of range ambiguity in the application of high-resolution and wide-swath (HRWS) SAR [11,12,13,14,15,16,17,18,19,20,21,22,23]. Traditional methods have been discussed, such as the up–down chirp modulation [13,14,15] and sub-pulse techniques [16]. In [15], the up–down chirp modulation method was investigated, which weakens the energy of range ambiguity with mismatched processing rather than eliminating it. In [16], beamforming in azimuth and elevation was performed. However, due to the lack of effective system degrees of freedom (DOFs), the performance in resolving range ambiguity is limited. To this end, the multi-channel SAR system in the receive side, i.e., single-input-multiple-output (SIMO), was investigated with extra spatial DOFs [17]. The approaches of multiple range beams [18,19], multiple azimuth beams [20], and joint range–azimuth two-dimensional (2-D) beam scanning [21] were discussed. In [19], the multiple narrow beams in elevation were formed to discriminate range-ambiguity regions. In [22], the range-ambiguity suppression scheme was proposed based on azimuth phase coding. Moreover, in [23], the range beams were toggled to achieve unambiguous echoes, and the Doppler bandwidth could be enlarged with the azimuth beams in the Mosaic SAR system. However, this approach introduces the problem of high computational complexity.
Recently, compared to SIMO-SAR, multiple-input-multiple-output (MIMO)-SAR has received significant attention recently due to the increased transmit DOFs [24,25,26,27,28]. The MIMO-SAR system is divided into two categories based on the methods of separating transmit waveforms: same carrier frequency (SCF)-MIMO-SAR [29] and multiple carrier frequencies (MCF)-MIMO-SAR [30]. In SCF-MIMO-SAR, phase coding waveforms are designed considering the constraint of orthogonality. For instance, in [31], the frequency diverse array (FDA)-MIMO was studied to achieve HRWS imaging with the range DOFs at the transmit side. In [32], the space–pulse phase coding (SPPC) scheme was employed to separate the range-ambiguous regions in the spatial domain. On the other hand, the orthogonal frequency division multiplexing (OFDM) waveforms were utilized in MCF-MIMO-SAR [33,34,35,36]. In [36], the linear frequency modulated (LFM) waveforms with large time–bandwidth product were divided into several OFDM waveforms to improve the suppression performance. However, since the orthogonal waveforms suffer from recurrent lobes in the MIMO radar, the performance is limited in the presence of distributed targets [37].
The space–time coding (STC) technique was initially studied in communication systems [38,39,40]. It is now also employed in radar systems, which combine the fast time and spatial channel dimension [41,42,43,44], as well as the pulse and element dimension [45]. In [46], the spatial coverage capability of STC radar was examined, albeit at the cost of range resolution. Additionally, the transmit diversity technique based on circulating coding in the slow-time dimension is introduced. The property of wide angular coverage with stable gain is maintained, avoiding the loss of range resolution [47]. In particular, in [48], a novel space–time coding waveform scheme was proposed for MIMO-SAR. To sum up, the digital beamforming and waveform diversity technique are utilized in the advanced SAR system [49,50]. In our work, we prefer to apply the proposed STC scheme to resolve the problem of range ambiguity.
In this paper, the range-ambiguity problem is studied in the STC radar. At the modeling stage, the transmit elements and pulses are configured with time delay and phase coding. Moreover, the transmit beamforming is performed to obtain unambiguous echoes. Additionally, the frequency splicing method is studied to improve the range resolution, accounting for the bandwidth loss. In summary, the contributions are briefly summarized as follows:
  • A novel and simple space–time coding scheme is proposed to address the range-ambiguity issue, which is easy to be implemented in practice. Compared to the popular FDA radar, it does not necessitate a complicated orthogonal waveform design.
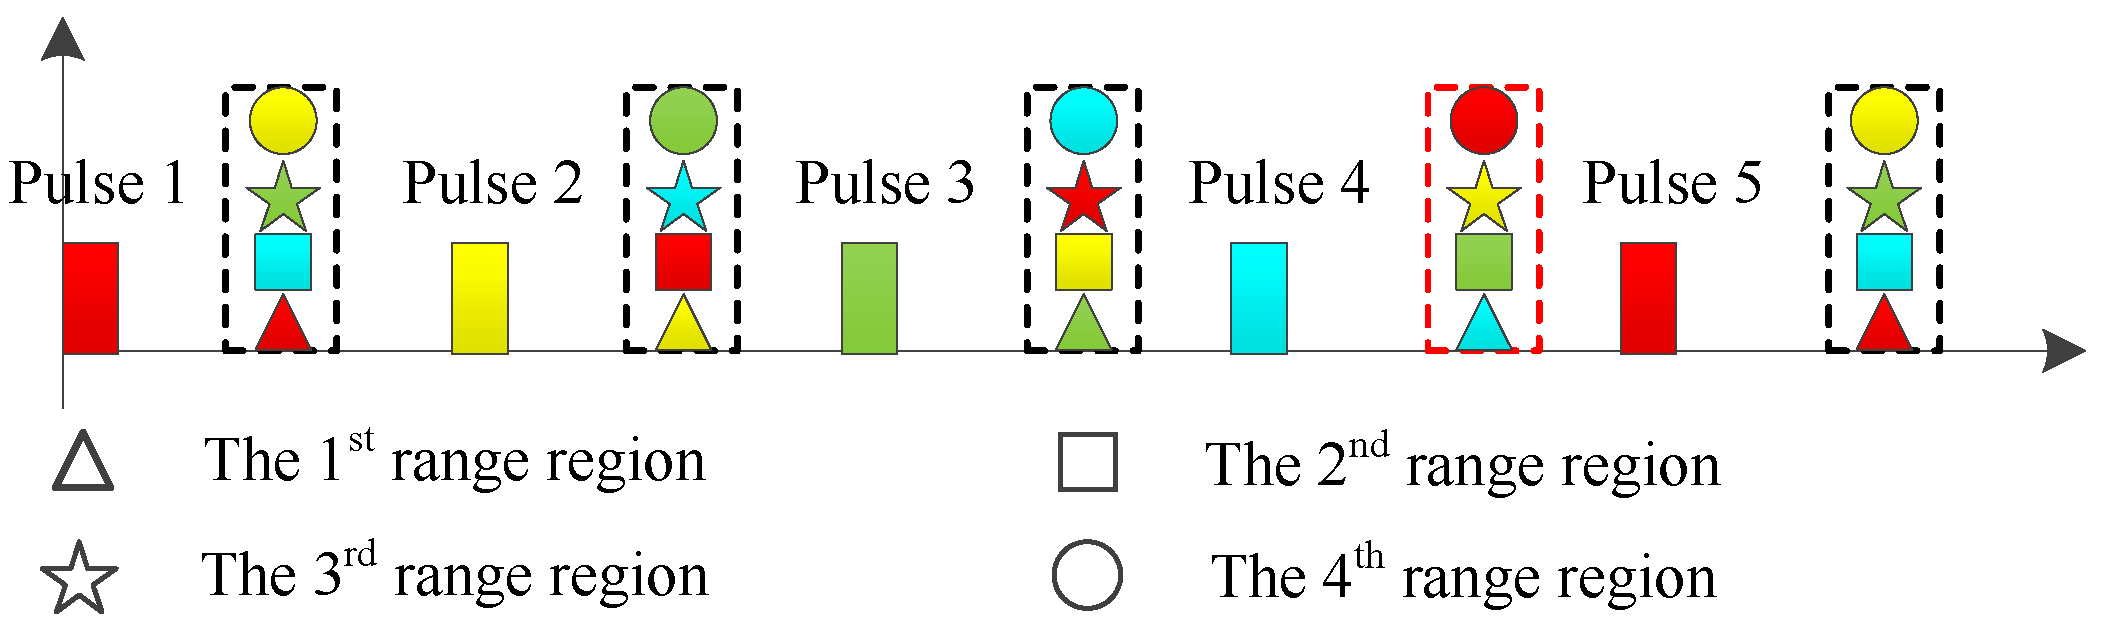
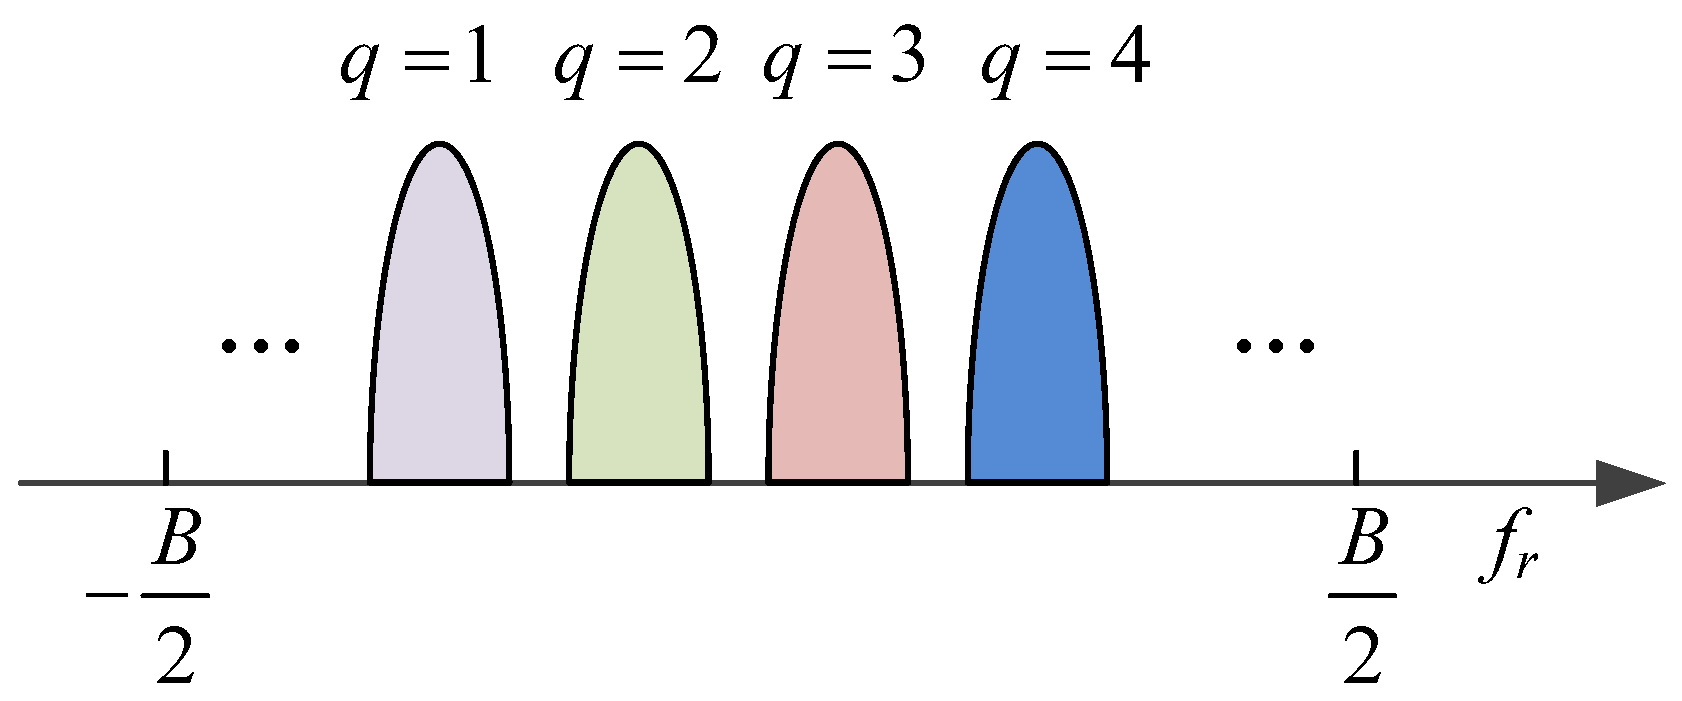
  • The range-ambiguity regions corresponding to different transmit spatial frequencies are separated by performing equivalent transmit beamforming.
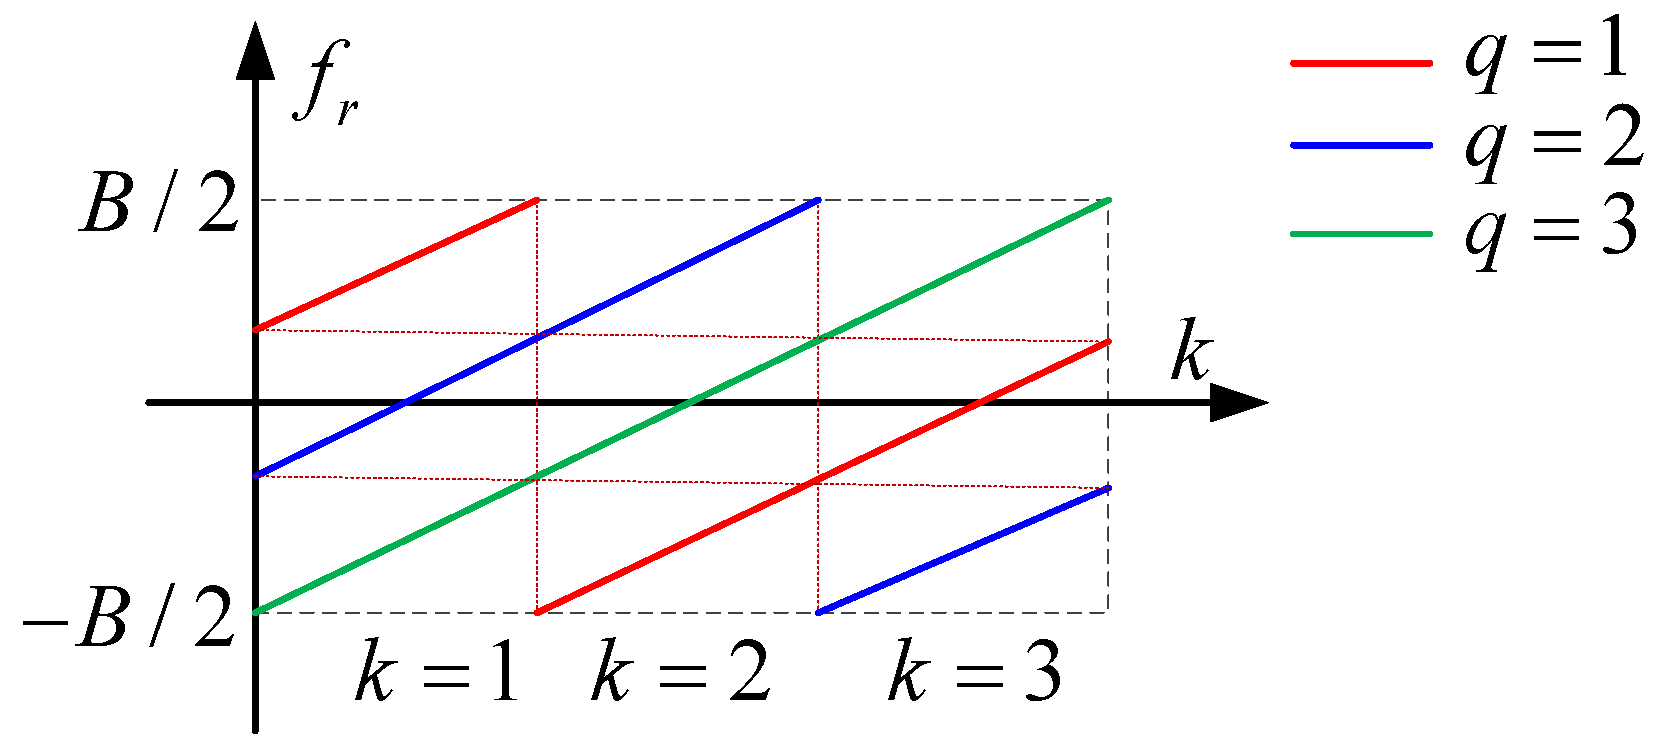
  • A method of frequency splicing is proposed to obtain high-range resolution imaging, avoiding the need to increase the system bandwidth.
At the analysis stage, the principle of transmit beamforming is validated with simulated results. Furthermore, numerical outcomes of distributed targets in terms of the range-ambiguity-to-signal ratio (RASR) are presented to illustrate the effectiveness of the developed method in resolving range ambiguity.
The structure of this paper is organized as follows: In Section 2, we devise the signal model of STC array. Section 3 presents the approach for separating range-ambiguous echoes. In Section 4, we present the numerical experimental results. Finally, conclusions are drawn in Section 5.

2. Signal Model

Let us consider transmit antennas in a uniform line array (ULA) configuration with M transmit elements. The baseband envelope of the m-th transmit element is expressed as
s t m 1 Δ t = rect t m 1 Δ t e j π γ t m 1 Δ t 2 ,
where the rectangular envelope rect t is denoted as
rect t = 1 , t < T p 0 , else ,
where T p denotes the pulse width, B is the bandwidth, γ = B T p represents the modulation frequency, and Δ t denotes a little time delay. Additionally, as shown in Figure 1, transmit channels and pulses are modulated with the coding phase b m , k , which can be expressed as
b m , k = e j 2 π k M m 1 .
Hence, the radiated electromagnetic wave is expressed as
s S T C t , k = m = 1 M b m , k s t m 1 Δ t e j 2 π f c t ,
where f c is the carrier frequency.
Assume that the STC array is adopted in the satellite-borne SAR platform along the flight direction, where the side-looking SAR geometry is depicted in Figure 2. It is known that the azimuth ambiguity arises when the Doppler bandwidth exceeds the designed PRF. However, the range swath is limited to the maximum unambiguous range R u = c 2 P R F . In the paper, we primarily focus on the issue of resolving range ambiguity under high PRF, where the Doppler ambiguity is avoided. After passing through mixers, filters, and analog-to-digital conversion, the echo of the n-th receive element without range ambiguity is expressed as
S n t r , t a = ξ m = 1 M b m , k rect t r m 1 Δ t τ n t a e j π γ t r m 1 Δ t τ n t a 2 e j 2 π f c τ n t a ,
where t r is the range fast time, t a = k P R F is the azimuth slow time, ξ is the complex echo amplitude (accounting for the transmit amplitude, phase, target reflectivity, and channel propagation effects), and τ n t a is the round-trip time delay of the received signal corresponding to the n-th received element, i.e.,
τ n t a = 2 R t a , R B n 1 d R sin θ c ,
where d R is the inter-element spacing of the receive array. The instant slant range is expressed as R t a , R B = R B 2 + V t a 2 , where V is the velocity of radar and R B is the nearest range from the target to the flight path.
In Figure 3, the range-ambiguity problem is illustrated. Specifically, the echo of the 1st range-ambiguity region corresponding to the k-th transmit pulse is received at the same pulse index. The range-ambiguity problem occurs in the radar where the echo of the q-th ( 1 q Q ) range-ambiguity region is received at the k + q -th pulse. As a result, at the k-th pulse, the received echo corresponding to the q-th range-ambiguity region is expressed as
S n , q t r , t a = ξ q m = 1 M b m , k q rect t r m 1 Δ t τ n t a e j π γ t r m 1 Δ t τ n t a 2 e j 2 π f c τ n t a ,
where ξ q is the complex amplitude of the target in the q-th range-ambiguity region.
With the range Fourier transform (the Fourier transform is performed by the fast Fourier transform (FFT) algorithm), the echo of Equation (7) can be expressed as
S n , q f r , t a = ξ q T P sinc f r T P m = 1 M e j 2 π k q M f r Δ t m 1 e j 2 π d R sin θ λ n 1 e j π f r γ 2 e j 2 π f c + f r 2 R t a , R B c ,
where sinc x = sin π x π x . The spectrum of the LFM signal exhibits a quadratic phase. To give the spectrum a flat shape with a linear phase, the compensation of the quadratic phase is required, which is expressed as
H c o m p f r = e j π f r 2 γ .
Subsequently, the echo can be rewritten as
S ˜ n , q f r , t a = ξ q T P sinc f r T P m = 1 M e j 2 π k q M f r Δ t m 1 e j 2 π d R sin θ λ n 1 e j 2 π f c + f r 2 R t a , R B c = ξ q T P sinc f r T P sin M π k q M f r Δ t sin π k q M f r Δ t e j M 1 π k q M f r Δ t e j 2 π d R sin θ λ n 1 e j 2 π f c + f r 2 R t a , R B c .
With the inverse Fourier transform of Equation (10) in range, it yields
S ˜ n , q t r , t a = ξ q T P B m = 1 M sinc B t r 2 R t a , R B c m 1 Δ t e j 2 π k q M m 1 e j 2 π d R sin θ λ n 1 e j 4 π f c R t a , R B c .

3. HRWS SAR Imaging Method

In this section, the transmit beamforming method is performed to separate range-ambiguity regions in the STC radar. According to Equation (10), the distribution of frequency spectra, as depicted in Figure 4, is governed by the amplitude envelope sin M π k q M f r Δ t sin π k q M f r Δ t . It is found that the spectra location is linked to the index of range ambiguity q. Therefore, the range-ambiguous echo can be separated by dividing the spectra.
Specifically, according to Equation (11), the range envelope is associated with the number of transmit elements. There are multiple point targets in the fast time domain due to the modulation of time delay Δ t , which is clearly shown in Figure 5. Furthermore, the phase difference of the m-th equivalent transmit element is discriminated from the range envelope of M targets. Therefore, the minimum delay time is
Δ t = 1 B .
Hence, the transmit steering vector of the range-ambiguity region is expressed as
Φ k , q = 0 , e j 2 π k q M , , e j 2 π k q M M 1 .
The transmit spatial frequency is written as
f T = k q M ,
where the transmit spatial frequency depends on the index of transmit pulse k and the index of range-ambiguity region q. Since the spectrum distribution is associated with the transmit spatial frequency, the equivalent transmit beamforming can be performed to select the range frequencies of range-ambiguity regions.
Specifically, the procedure of separating different range regions is carried out by transmit beamforming in Appendix A, which is performed by
S ^ n , q t r , t a = S ˜ n , q t r , t a h q ^ = ξ q T P B m = 1 M m = 1 M sinc B t r 2 R t a , R B c m m Δ t e j 2 π k q M m 1 e j 2 π k q ^ M m 1 e j 2 π d R sin θ λ n 1 e j 4 π f c R t a , R B c ,
where q ^ corresponds to the index of range region to be separated, ⊗ is the convolution operator, and the convolution function is defined as
h q ^ = m = 1 M sinc B t r m 1 Δ t e j 2 π k q ^ M m 1 .
In the following, the separation performance is analyzed with the following two cases.
Case I: q = q ^
To separate the q-th range region, i.e., q = q ^ , the frequency spectra are written as
w f r = sin 2 M π k q M f r Δ t sin 2 π k q M f r Δ t .
Figure 6 displays the spectra of adjacent pulses, corresponding to the index of transmit pulse k and range-ambiguity region q. The spectra of different range-ambiguity regions are distinguished in the range–frequency domain, and the spectra of adjacent pulses are distributed separately. It is worth noting that the reduction in bandwidth results in a degradation of the range resolution. In this regard, the spectra of adjacent pulses for the same range region can be utilized to improve the range resolution.
More specifically, the spectra of q-th range-ambiguity region are spliced with adjacent M pulses, which is expressed as
S n , q f r , t a = k = 1 M S ^ n , q f r , t a = ξ a r f r e j 4 π f c + f r R t a , R B c .
The derivation of Equation (18) is presented in Appendix B. By utilizing adjacent pulses, the range spectra are expanded by M times, compared to using a single pulse. Thus, the range resolution is M times better.
Case II: q q ^
In this case, the interference of other range-ambiguity regions is expressed as
S n , q f r , t a = ξ q T P sinc f r T P m = 1 M e j 2 π k q M f r Δ t m 1 m = 1 M e j 2 π k q ^ M f r Δ t m 1 e j 2 π d R s i n θ λ n 1 e j 2 π f c + f r 2 R t a , R B c .
Substituting Equation (A11) into the above formula yields
S n , q f r , t a = 0 .
Thus, the interference from the other range regions is effectively suppressed based on the processing method utilizing adjacent pulses. In fact, the range-ambiguity regions are separated completely since their echoes correspond to distinct spectra. It should be noted that the maximum resolvable range-ambiguity index is M.
Figure 7 illustrates the procedure of resolving range ambiguity in the STC radar. Firstly, the range-ambiguous echoes are received, where the delaying time and phase coding are designed at transmit elements and pulses. Secondly, the echoes from different ambiguous regions are separated by utilizing the equivalent DBF technique. Thirdly, the spectra of adjacent pulses are distributed at different bands, enabling the improvement of range resolution by using multi-band frequency splicing. Finally, separated SAR images corresponding to different range-ambiguity regions are achieved with the traditional SAR imaging algorithm. In the article, the range swath is expanded without resolution loss.

4. Simulation Results

In this section, the performance of resolving range ambiguity in the STC radar is examined with simulated data. The simulation parameters used to reproduce the simulation results are shown in Table 1. Additionally, the performance of achieving HRWA image is evaluated in terms of the range ambiguity-to-signal ratio (RASR).

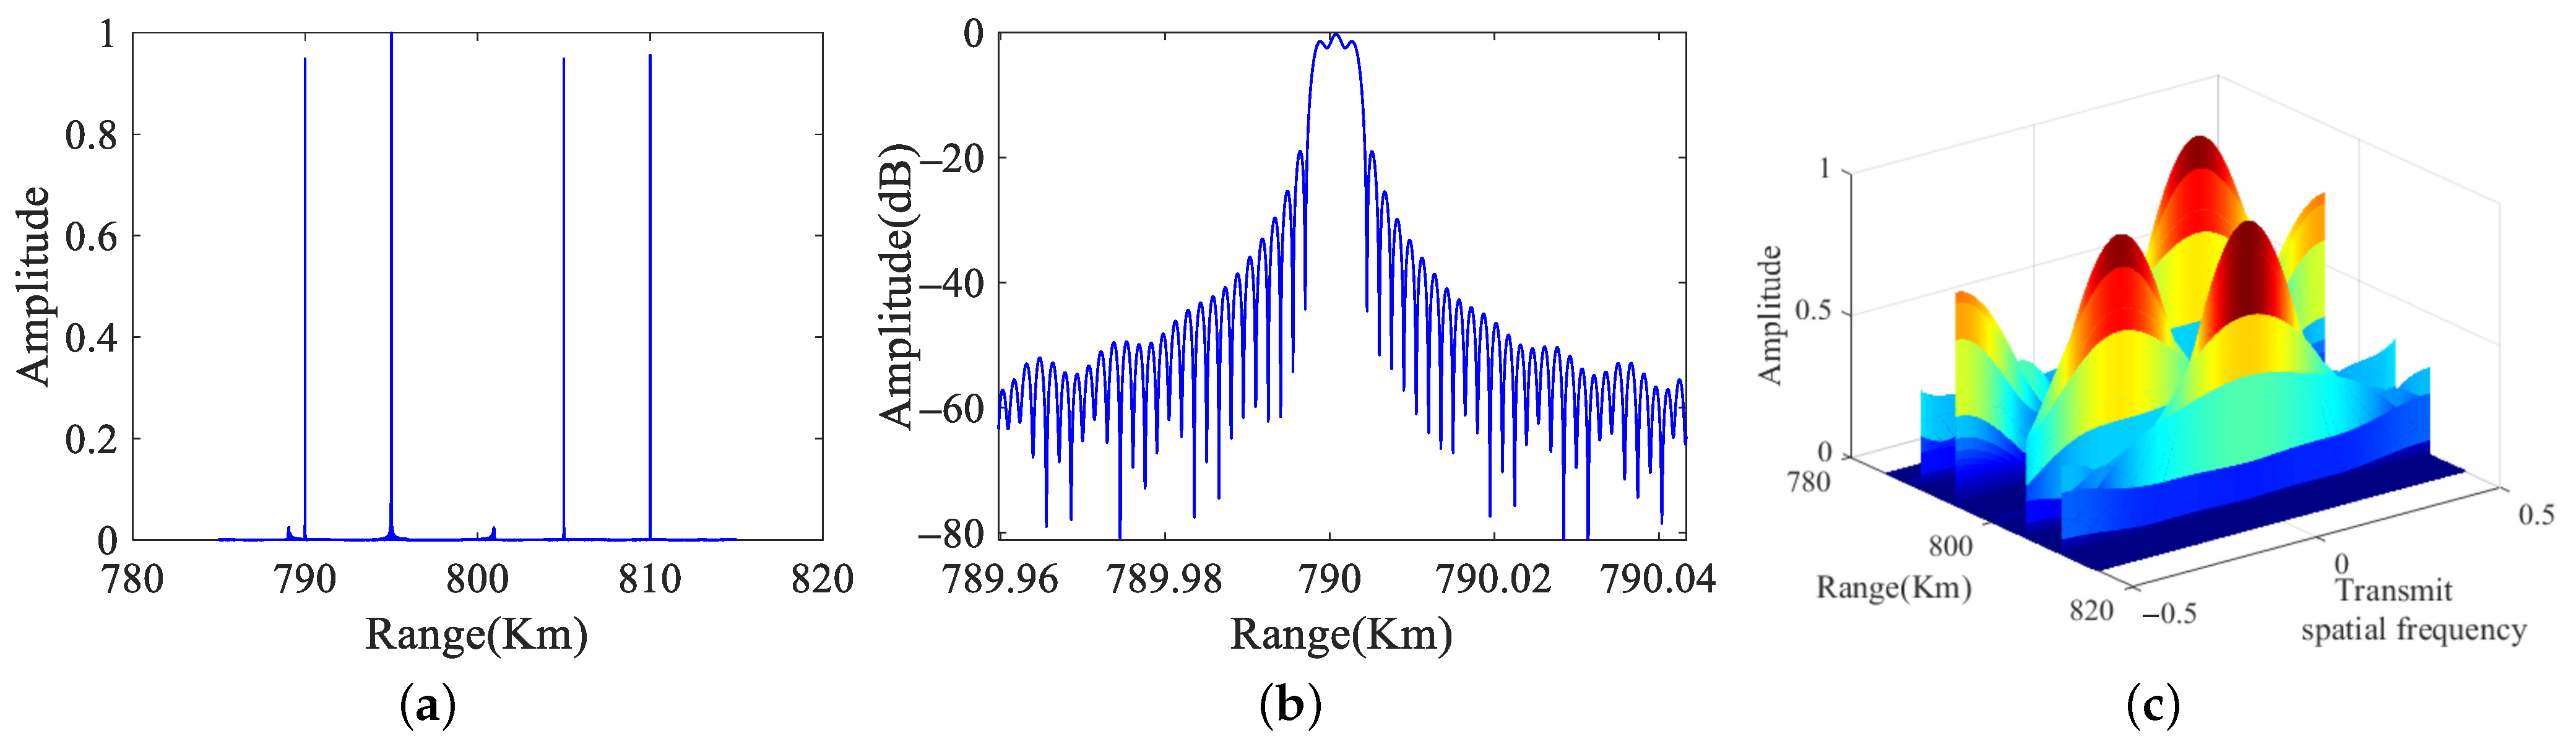
4.1. Simulation with Point-like Targets

In Figure 8, the spectra of adjacent pulses in joint range frequency and transmit spatial frequency domain are shown. It is observed that the transmit spatial frequency is modulated at each transmit pulse. In addition, the distribution of range spectrum is associated with the transmit spatial frequency. That is to say that the distribution of range spectrum is decided by the index of the transmit pulse. Thus, the range-ambiguity regions corresponding to different range spectra can be separated.
In order to verify the effectiveness in resolving range ambiguity, an illustrative example with point-like targets is examined. The targets situated in four range-ambiguity regions are randomly distributed at different range cells. The target parameters are shown in Table 2. To distinguish the range-ambiguous targets, the equivalent transmit beamforming is performed, as shown in Figure 9. Figure 9a shows the results in the range domain. It is seen that the four targets are received at different range cells. However, their indexes of range ambiguity cannot be determined in the range domain. Figure 9b shows the result of quadratic phase compensation in the range domain. It is seen that the envelope of the target is distributed at multiple range cells due to the time delay of the transmit element. Based on the separation of the target envelope, the equivalent phase in the transmit domain can be obtained. Figure 9c shows the distribution of the four targets in the transmit spatial frequency domain. Remarkably, different indexes of range ambiguity are distinguishable since they correspond to different transmit spatial frequencies.
Taking the separation of the first range-ambiguity region as an example, Figure 10 shows the separation results by utilizing the equivalent transmit beamforming. It can be seen in Figure 10a that target A in the first range-ambiguity region is separated effectively. However, as shown in Figure 10b, the resolution is relatively small due to the reduction in bandwidth. By performing the proposed frequency splicing method with multiple pulses, the range resolution is about four times better as can be seen in Figure 10c.

4.2. Simulation with Distributed Targets

In this subsection, a complex scene comprising distributed targets is used to demonstrate the effectiveness of the proposed method. The system parameters of the SAR array are shown in Table 1. The HRWS imaging results of different range-ambiguity regions are obtained with the range Doppler algorithm. The range–azimuth swath of the partial image is about 3 km × 3 km. The range–azimuth resolution is about 1.5 m × 1.5 m.
The HRWS imaging results of the first and second range regions are shown in Figure 11 with the FDA-MIMO radar [31] and the up–down chirp modulation method [15]. It can be seen in Figure 11a,b that the range-ambiguous echoes are able to be separated with FDA-MIMO by utilizing the DOFs in the range dimension. However, designing ideal orthogonal waveforms for the FDA-MIMO radar is challenging, leading to energy diffusion problems in range cells. In Figure 11c,d, the result with lower image quality is shown with the up–down chirp modulation method. Since the range-ambiguity regions correspond to the up and down chirp modulations, the range ambiguity is resolved by waveform mismatching, resulting in defocused images. Essentially, the method does not suppress ambiguity energy in the range domain.
In the STC radar, the HRWS image quality is enhanced by resolving the range ambiguity, as illustrated in Figure 12. The first range-ambiguity region and the second range-ambiguity region are separated, as shown in Figure 12a,c. The corresponding spectra profiles of the 325-th azimuth cell are shown in Figure 12b,d. Since the spectrum width is expended after frequency splicing, the range resolution is improved. The range profile of the 325-th azimuth cell is shown in Figure 13. The imaging result of STC radar exhibits a lower sidelobe, which demonstrates the effectiveness of the proposed method.
In this subsection, the performance in terms of computational complexity is analyzed. For comparison, assume that the number of range ambiguity is Q ( Q < M ), the sample points of the range dimension are L, and the number of azimuth pulses is P. The computational load of the STC method lies in the equivalent transmit beamforming and spectrum splicing with respect to the range-ambiguity index. The spectrum splicing can be performed with parallel processing. Thus, the computational load is O ( Q M P L ) . In the FDA-MIMO radar, the computational load lies in the waveform separation and the suppression of range ambiguity, which is O ( Q M 2 P L ) . Compared with the above methods, the complexity of the up–down chirp modulation algorithm is extremely low. However, the performance is limited, and only two range-ambiguity regions can be separated. Table 3 shows the results of the operational complexity of the three algorithms and the comparison results of the running time under the same conditions.

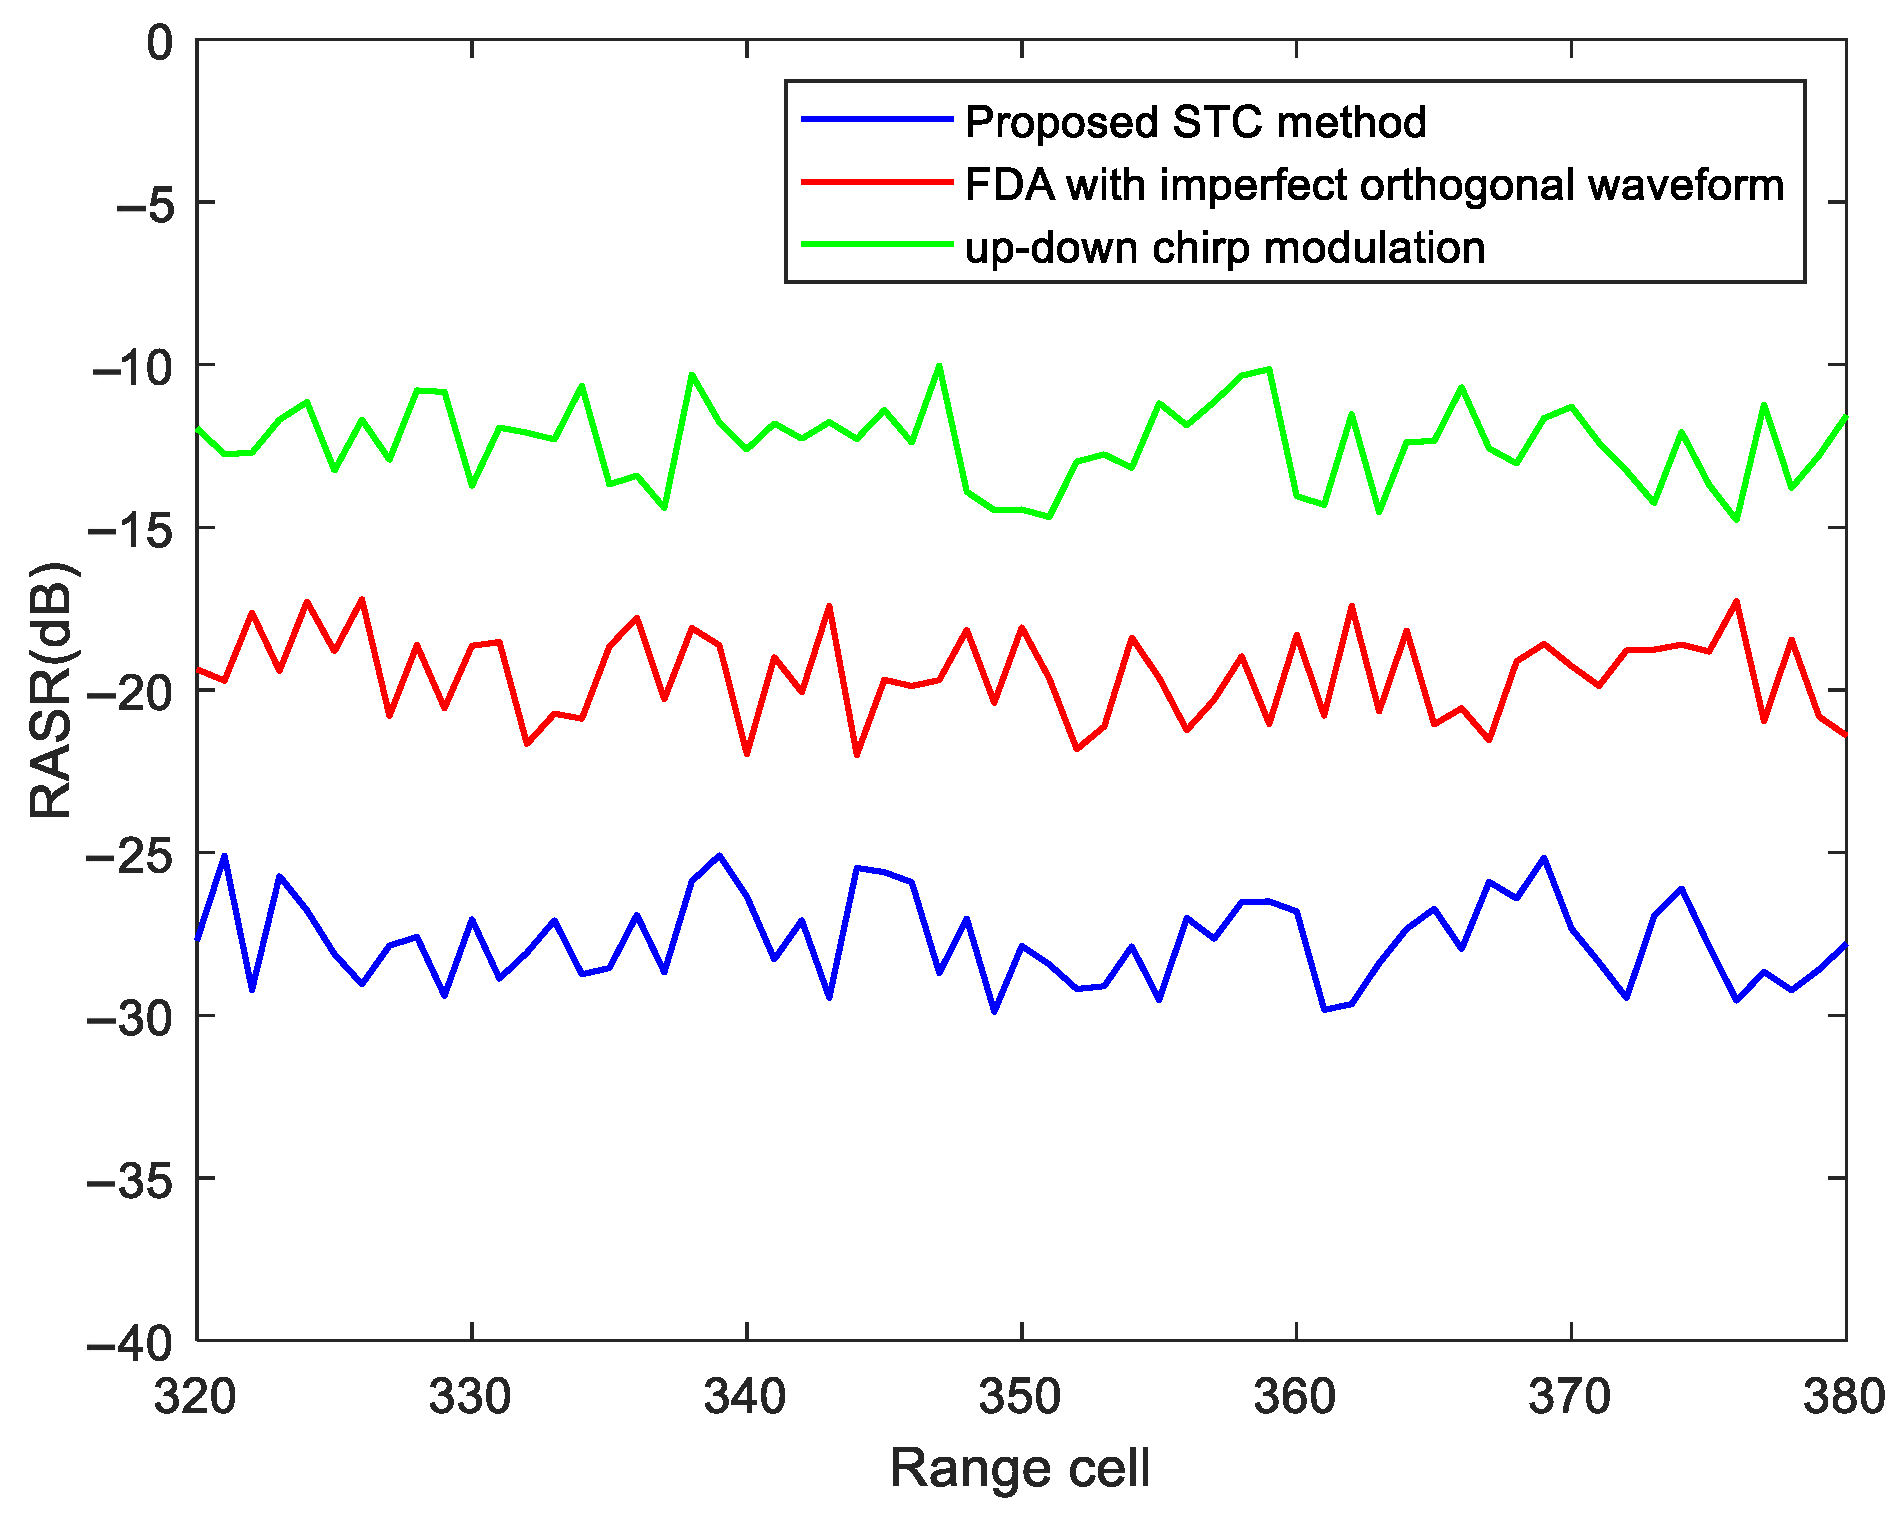
4.3. Performance of Range-Ambiguity Separation

In this paper, the performance of the range-ambiguity separation is evaluated by the RASR, which is defined as the ratio of the range-ambiguous signal power to the desired signal power, that is
R A S R = 10 log 10 i = 1 , i q Q B / 2 B / 2 S n , q f r , t a d f r B / 2 B / 2 S n , q f r , t a d f r .
The RASR values for imaging range-ambiguity regions are analyzed as a function of range cells, using the STC method, FDA-MIMO method, and the up–down chirp modulation method. By examining the results presented in Figure 14, we can infer that the RASR value for the range-ambiguity region is below −25 dB, indicating that the proposed method performs well in separating range-ambiguous echoes.

5. Discussion

Discussion 1: The proposed STC scheme resolves the issue of range ambiguity based on the obtained DOFs in the transmit domain. Observe that the transmit DOFs are contained in the range envelope. According to Equation (11), the target envelopes are related to the delay time Δ t . Thus, the design of an appropriate delay time in the future research is necessary.
Discussion 2: The range resolution is improved with the frequency splicing method. However, the orthogonality of coding holds in the scenario where the range migration of target can be ignored during M pulses. When the target is migrated, the range spectra need to be compensated or recovered without distortion. We will study it in depth in our future work.

6. Conclusions

The problem of range ambiguity in the HRWS SAR imaging is investigated with the STC technique. At the modeling stage, transmit elements and pulses are configured with time delay and phase coding. Thus, the spectrum distribution is related to the transmit spatial frequency. Furthermore, the range-ambiguity regions, corresponding to different transmit spatial frequencies, are separated by equivalent transmit beamforming. In addition, to improve the range resolution, the frequency splicing method is proposed by synthesizing adjacent pulses. At the analysis stage, the performance of equivalent transmit beamforming is assessed considering the range-ambiguous targets. Moreover, the simulated results of the distributed targets are provided to demonstrate the effectiveness of the proposed STC method.

Author Contributions

Conceptualization, K.Y. and S.Z.; methodology, K.Y. and S.Z.; software, K.Y. and B.Y.; validation, K.Y. and S.Z.; formal analysis, K.Y. and B.Y.; investigation, K.Y. and S.Z.; resources, S.Z. and L.L.; data curation, K.Y. and B.Y.; writing—original draft preparation, K.Y.; writing—review and editing, L.L. and S.Z.; visualization, K.Y. and B.Y.; supervision, L.L. and S.Z.; project administration, S.Z. and L.L.; funding acquisition, S.Z. and L.L. All authors have read and agreed to the published version of the manuscript.

Funding

This research was funded by the National Natural Science Foundation of China grant number 62101402, 61931016, and 62071344, the Science and Technology Innovation Team of Shaanxi Province grant number 2022TD-38, the China Postdoctoral Science Foundation number 2021TQ0261 and 2021M702547, and the SAST Innovation fund number SAST2022-041.

Data Availability Statement

Not applicable.

Conflicts of Interest

The authors declare no conflict of interest.

Appendix A. Derivations of Performing Transmit Beamforming

The process of convolution is carried out through multiplication in the frequency domain. The Fourier transform of Equation (16) is expressed as
H q ^ = m = 1 M e j 2 π k q ^ M f r Δ t m 1 .
The beamforming is performed in the range–frequency domain by
S ^ n , q f r , t a = S ˜ n , q f r , t a F F T t r h q = ξ q T P sinc f r T P m = 1 M e j 2 π k q M f r Δ t m 1 m = 1 M e j 2 π k q ^ M f r Δ t m 1 e j 2 π d R sin θ λ n 1 e j 2 π f c + f r 2 R t a , R B c .
The transmit beamforming result is expressed as
S ^ n , q t r , t a = ξ q T P B m = 1 M m = 1 M sinc B t r 2 R t a , R B c m m Δ t e j 2 π k q M m 1 e j 2 π k q ^ M m 1 e j 2 π d R sin θ λ n 1 e j 4 π f c R t a , R B c .

Appendix B. Derivation of Spectrum Splicing

Assume that F · represents the operation of the discrete Fourier transform. There exists a Fourier transform
F e j 2 π k M m 1 = M δ k k .
Let
A q = m = 1 M e j 2 π k q M f r Δ t m 1 ,
A q ^ = m = 1 M e j 2 π k q ^ M f r Δ t m 1 ,
and
a q m = e j 2 π q M + f r Δ t m 1 ,
a q ^ m = e j 2 π q ^ M + f r Δ t m 1 .
Then, we have
A q = F a q m = M δ k M q M + f r Δ t ,
A q ^ = F a q ^ m = M δ k M q ^ M + f r Δ t .
Hence, it yields
k = 1 M A q A q ^ = M 2 , q = q ^ 0 , q q ^ ,
i.e.,
k = 1 M sin M π k q M f r Δ t sin π k q M f r Δ t sin M π k q ^ M f r Δ t sin π k q ^ M f r Δ t = M 2 , q = q ^ 0 , q q ^ .
Substituting Equation (A12) into the spliced spectra yields Equation (18).

References

  1. Xu, G.; Zhang, B.J.; Yu, H.W.; Chen, J.L.; Xing, M.D.; Hong, W. Sparse Synthetic Aperture Radar Imaging from Compressed Sensing and Machine Learning: Theories, Applications and Trends. IEEE Geosci. Remote Sens. Mag. 2022, 10, 32–69. [Google Scholar] [CrossRef]
  2. Wang, R.; Loffeld, O.; Nies, H.; Knedlik, S.; Hagelen, M.; Essen, H. Focus FMCW SAR data using the wavenumber domain algorithm. IEEE Trans. Geosci. Remote Sens. 2010, 48, 2109–2118. [Google Scholar] [CrossRef]
  3. Zhang, S.X.; Xing, M.D.; Xia, X.G.; Guo, R.; Liu, Y.Y.; Bao, Z. Robust Clutter Suppression and Moving Target Imaging Approach for Multichannel in Azimuth High-Resolution and Wide-Swath Synthetic Aperture Radar. IEEE Trans. Geosci. Remote Sens. 2015, 53, 687–709. [Google Scholar] [CrossRef]
  4. Cruz, H.; Véstias, M.; Monteiro, J.; Neto, H.; Duarte, R.P. A Review of Synthetic-Aperture Radar Image Formation Algorithms and Implementations: A Computational Perspective. Remote Sens. 2022, 14, 1258. [Google Scholar] [CrossRef]
  5. Zuo, S.S.; Xing, M.D.; Xia, X.G.; Sun, G.C. Improved Signal Reconstruction Algorithm for Multichannel SAR Based on the Doppler Spectrum Estimation. IEEE J. Sel. Top. Appl. Earth Obs. Remote Sens. 2017, 10, 1425–1442. [Google Scholar] [CrossRef]
  6. Mittermayer, J.; Moreira, A.; Loffeld, O. Spotlight SAR data processing using the frequency scaling algorithm. IEEE Trans. Geosci. Remote Sens. 1999, 37, 2198–2214. [Google Scholar] [CrossRef]
  7. Dall, J.; Kusk, A. Azimuth phase coding for range ambiguity suppression in SAR. In Proceedings of the 2004 IEEE International Geoscience and Remote Sensing Symposium, Anchorage, AK, USA, 20–24 September 2004; Volume 3, pp. 1734–1737. [Google Scholar]
  8. Krieger, G.; Gebert, N.; Moreira, A. Unambiguous SAR signal reconstruction from nonuniform displaced phase center sampling. IEEE Geosci. Remote Sens. Lett. 2004, 1, 260–264. [Google Scholar] [CrossRef]
  9. Gebert, N.; Krieger, G.; Moreira, A. Digital beamforming on receive: Techniques and optimization strategies for high-resolution wide-swath SAR imaging. IEEE Trans. Aerosp. Electron. Syst. 2009, 45, 564–592. [Google Scholar] [CrossRef]
  10. Currie, A.; Brown, M.A. Wide-swath SAR. IEE Proc. F (Radar Signal Process.) 1992, 139, 122–135. [Google Scholar] [CrossRef]
  11. Liu, M.; Zhang, B.; Xu, Z.; Zhang, Y.; Zhong, L.; Wu, Y. Ambiguities Suppression for Azimuth Multichannel SAR Based on L2,q Regularization with Application to Gaofen-3 Ultra-Fine Stripmap Mode. IEEE J. Sel. Top. Appl. Earth Obs. Remote Sens. 2020, 14, 1532–1544. [Google Scholar] [CrossRef]
  12. Villano, M.; Krieger, G.; Moreira, A. Waveform-encoded SAR: A novel concept for nadir echo and range ambiguity suppression. In Proceedings of the 12th European Conference on Synthetic Aperture Radar, Aachen, Germany, 4–7 June 2018. [Google Scholar]
  13. Xu, W.; Huang, P.; Tan, W. Azimuth Phase Coding by Up and Down Chirp Modulation for Range Ambiguity Suppression. IEEE Access 2019, 7, 143780–143791. [Google Scholar] [CrossRef]
  14. Wang, W.Q.; Cai, J. MIMO SAR using chirp diverse waveform for wide-swath remote sensing. IEEE Trans. Aerosp. Electron. Syst. 2012, 48, 3171–3185. [Google Scholar] [CrossRef]
  15. Mittermayer, J.; Martínez, J.M. Analysis of range ambiguity suppression in SAR by up and down chirp modulation for point and distributed targets. In Proceedings of the 2003 IEEE International Geoscience and Remote Sensing Symposium, Toulouse, France, 21–25 July 2003; Volume 6, pp. 4077–4079. [Google Scholar]
  16. Gabele, M.; Krieger, G. Moving Target Signals in High ResolutionWide Swath SAR. In Proceedings of the 7th European Conference on Synthetic Aperture Radar, Friedrichshafen, Germany, 2–5 June 2008. [Google Scholar]
  17. Krieger, G.; Moreira, A. Potentials of digital beamforming in bi- and multistatic SAR. In Proceedings of the 2003 IEEE International Geoscience and Remote Sensing Symposium, Toulouse, France, 21–25 July 2003; Volume 1, pp. 527–529. [Google Scholar]
  18. Yang, T.; Lv, X.; Wang, Y.; Qian, J. Study on a Novel Multiple Elevation Beam Technique for HRWS SAR System. IEEE J. Sel. Top. Appl. Earth Obs. Remote Sens. 2015, 8, 5030–5039. [Google Scholar] [CrossRef]
  19. Griffiths, H.D.; Mancini, P. Ambiguity suppression in SARs using adaptive array techniques. In Proceedings of the 11th Annual International Geoscience and Remote Sensing Symposium, 3–6 June 1991; Volume 2, pp. 1015–1018. [Google Scholar]
  20. Yang, J.; Sun, G.C.; Wu, Y.F.; Xing, M.D. Range ambiguity suppression by azimuth phase coding in multichannel SAR systems. In Proceedings of the IET International Radar Conference 2013, Xi’an, China, 14–16 April 2013. [Google Scholar]
  21. Krieger, G.; Gebert, N.; Moreira, A. Multidimensional waveform encoding: A new digital beamforming technique for synthetic aperture radar remote sensing. IEEE Trans. Geosci. Remote Sens. 2007, 46, 31–46. [Google Scholar] [CrossRef]
  22. Cristallini, D.; Sedehi, M.; Lombardo, P. SAR imaging solutions based on azimuth phase coding. In Proceedings of the 7th European Conference on Synthetic Aperture Radar, Friedrichshafen, Germany, 2–5 June 2008. [Google Scholar]
  23. Naftaly, U.; Levy-Nathansohn, R. Overview of the TECSAR satellite hardware and Mosaic mode. IEEE Geosci. Remote Sens. Lett. 2008, 5, 423–426. [Google Scholar] [CrossRef]
  24. Cerutti-Maori, D.; Sikaneta, I.; Klare, J.; Gierull, C.H. MIMO SAR processing for multichannel high-resolution wide-swath radars. IEEE Trans. Geosci. Remote Sens. 2014, 52, 5034–5055. [Google Scholar] [CrossRef]
  25. Ender, J.H.; Klare, J. System architectures and algorithms for radar imaging by MIMO-SAR. In Proceedings of the 2009 IEEE Radar Conference, Pasadena, CA, USA, 4–8 May 2009. [Google Scholar]
  26. Cristallini, D.; Pastina, D.; Lombardo, P. Exploiting MIMO SAR potentialities with efficient cross-track constellation configurations for improved range resolution. IEEE Trans. Geosci. Remote Sens. 2011, 49, 38–52. [Google Scholar] [CrossRef]
  27. Wang, W.Q.; Cai, J. Ground moving target indication by MIMO SAR with multi-antenna in azimuth. In Proceedings of the 2011 IEEE International Geoscience and Remote Sensing Symposium, Vancouver, BC, Canada, 24–29 July 2011; pp. 1662–1665. [Google Scholar]
  28. Kim, J.-H.; Younis, M.; Moreira, A.; Wiesbeck, W. Spaceborne MIMO synthetic aperture radar for multimodal operation. IEEE Trans. Geosci. Remote Sens. 2015, 53, 2453–2466. [Google Scholar] [CrossRef]
  29. Li, J.; Stoica, P.; Zhu, X. MIMO radar waveform synthesis. In Proceedings of the 2008 IEEE Radar Conference, Rome, Italy, 26–30 May 2008. [Google Scholar]
  30. Nel, W.; Tait, J.; Lord, R.; Wilkinson, A. The use of a frequency domain stepped frequency technique to obtain high range resolution on the CSIR X-Band SAR system. In Proceedings of the IEEE AFRICON. 6th Africon Conference, George, South Africa, 2–4 October 2002. [Google Scholar]
  31. Wang, C.H.; Xu, J.W.; Liao, G.S.; Xu, X.F.; Zhang, Y.H. A range ambiguity resolution approach for high-resolution and wide-swath SAR imaging using frequency diverse array. IEEE J. Sel. Top. Signal Process. 2017, 11, 336–346. [Google Scholar] [CrossRef]
  32. Wang, H.B.; Zhang, Y.H.; Xu, J.W.; Liao, G.S.; Zeng, C. A novel range ambiguity resolving approach for high-resolution and wide-swath SAR imaging utilizing space-pulse phase coding. Signal Process. 2020, 168, 107323. [Google Scholar] [CrossRef]
  33. Wang, W.Q. Mitigating range ambiguities in high-PRF SAR with OFDM waveform diversity. IEEE Geosci. Remote Sens. Lett. 2012, 10, 101–105. [Google Scholar] [CrossRef]
  34. Riché, V.; Méric, S.; Baudais, J.Y.; Pottier, E. Investigations on OFDM signal for range ambiguity suppression in SAR configuration. IEEE Trans. Geosci. Remote Sens. 2014, 52, 4194–4197. [Google Scholar] [CrossRef]
  35. Riché, V.; Méric, S.; Baudais, J.Y.; Pottier, E. Optimization of OFDM SAR signals for range ambiguity suppression. In Proceedings of the 9th European Radar Conference, Amsterdam, The Netherlands, 31 October–2 November 2012; pp. 278–281. [Google Scholar]
  36. Riché, V.; Méric, S.; Pottier, E.; Baudais, J.Y. OFDM signal design for range ambiguity suppression in SAR configuration. In Proceedings of the 2012 IEEE International Geoscience and Remote Sensing Symposium, Munich, Germany, 22–27 July 2012; pp. 2156–2159. [Google Scholar]
  37. Krieger, G. MIMO-SAR: Opportunities and pitfalls. IEEE Trans. Geosci. Remote Sens. 2014, 52, 2628–2645. [Google Scholar] [CrossRef]
  38. Bevan, D.D.N.; Tanner, R.; Ward, C.R. Space-time coding for capacity enhancement in future-generation wireless communications networks. In Proceedings of the IEE Colloquium on Capacity and Range Enhancement Techniques for the Third Generation Mobile Communications and Beyond, London, UK, 11 February 2000; p. 8/1-811. [Google Scholar]
  39. Foschini, G.J.; Gans, M.J. On Limits of Wireless Communications in a Fading Environment when Using Multiple Antennas. Wirel. Pers. Commun. 1998, 6, 311–335. [Google Scholar] [CrossRef]
  40. Gesbert, D.; Shafi, M.; Shiu, D.S.; Smith, P.J.; Naguib, A. From theory to practice: An overview of MIMO space-time coded wireless systems. IEEE J. Sel. Area. Commun. 2003, 21, 281–302. [Google Scholar] [CrossRef]
  41. Lan, L.; Liao, G.S.; Xu, J.W.; Xu, Y.H.; So, H.C. Beampattern Synthesis Based on Novel Receive Delay Array for Mainlobe Interference Mitigation. IEEE Trans. Antenn. Propag. 2023, 71, 411–421. [Google Scholar] [CrossRef]
  42. Lan, L.; Xu, J.W.; Liao, G.S.; Zhang, Y.H.; Fioranelli, F.; So, H.C. Suppression of mainbeam deceptive jammer with FDA-MIMO radar. IEEE Trans. Veh. Technol. 2020, 69, 11584–11598. [Google Scholar] [CrossRef]
  43. Babur, G.; Aubry, P.; Chevalier, F.L. Antenna Coupling Effects for Space-Time Radar Waveforms: Analysis and Calibration. IEEE Trans. Antenn. Propag. 2014, 62, 2572–2586. [Google Scholar]
  44. Lan, L.; Marino, A.; Aubry, A.; Maio, A.D.; Liao, G.S.; Xu, J.W.; Zhang, Y.H. GLRT-based Adaptive Target Detection in FDA-MIMO Radar. IEEE Trans. Aerosp. Electron. Syst. 2021, 57, 597–613. [Google Scholar] [CrossRef]
  45. Wen, C.; Huang, Y.; Peng, J.; Wu, J.; Zheng, G.; Zhang, Y. Slow-time FDA-MIMO technique with application to STAP radar. IEEE Trans. Aerosp. Electron. Syst. 2022, 58, 74–95. [Google Scholar] [CrossRef]
  46. Babur, G.; Aubry, P.; Chevalier, F.L. Space-time codes for active antenna systems: Comparative performance analysis. In Proceedings of the IET International Radar Conference, Xi’an, China, 14–16 April 2013; p. 745. [Google Scholar]
  47. Li, S.; Zhang, L.; Liu, N.; Zhang, J.; Tang, S. Transmit diversity technique based on joint slow-time coding with circulating code. IET Radar Sonar Navig. 2017, 11, 1243–1250. [Google Scholar] [CrossRef]
  48. He, F.; Dong, Z.; Liang, D. A novel space-time coding alamouti waveform scheme for MIMO-SAR implementation. IEEE Geosci. Remote Sens. Lett. 2015, 12, 229–233. [Google Scholar]
  49. Krieger, G.; Gebert, N.; Younis, M.; Moreira, A. Advanced synthetic aperture radar based on digital beamforming and waveform diversity. In Proceedings of the 2008 IEEE Radar Conference, Rome, Italy, 26–30 May 2008. [Google Scholar]
  50. Wang, Y.F.; Li, H.P.; Han, S. Synthetic aperture imaging of antenna array coded. J. Radars 2023, 12, 1–12. [Google Scholar]
Figure 1. The modulation of delay and coding in STC radar.
Remotesensing 15 02465 g001
Figure 2. Geometric configuration of side-looking SAR.
Remotesensing 15 02465 g002
Figure 3. Illustration of range ambiguity.
Remotesensing 15 02465 g003
Figure 4. Distribution of range-ambiguity regions in the frequency domain.
Remotesensing 15 02465 g004
Figure 5. Distribution of target in the fast time domain.
Remotesensing 15 02465 g005
Figure 6. Spectra distribution of range ambiguous with different pulses.
Remotesensing 15 02465 g006
Figure 7. Procedure of imaging in the STC radar.
Remotesensing 15 02465 g007
Figure 8. Analysis of spectrum for different pulses.
Remotesensing 15 02465 g008
Figure 9. Performing transmit beamforming: (a) The four targets at different range-ambiguity regions. (b) Result of quadratic phase compensation for target A. (c) Result of transmit beamforming.
Remotesensing 15 02465 g009
Figure 10. Performance of range resolution: (a) Result of separating the first range-ambiguity region. (b) Result of single pulse. (c) Result of spectrum splicing with adjacent pulses.
Remotesensing 15 02465 g010
Figure 11. Partial SAR imaging results of different range regions with traditional methods: (a) Partial imaging result of first range-ambiguity region with the FDA-MIMO radar. (b) Partial imaging result of second range-ambiguity region with the FDA-MIMO radar. (c) Partial imaging result of first range-ambiguity region with up–down chirp modulation. (d) Partial imaging result of second range-ambiguity region with up–down chirp modulation.
Remotesensing 15 02465 g011
Figure 12. Partial SAR imaging results of different range regions with the proposed method: (a) Partial imaging result of first range-ambiguity region with the proposed method. (b) Spectra profile of the first region. (c) Partial imaging result of second range-ambiguity region with the proposed method. (d) Spectra profile of the second region.
Remotesensing 15 02465 g012
Figure 13. Range profile comparison of 325-th azimuth bin.
Remotesensing 15 02465 g013
Figure 14. Evaluation of separating range ambiguity with RASR.
Remotesensing 15 02465 g014
Table 1. Simulation parameters.
ParameterValueParameterValue
Carrier frequency5.3 GHzTransmit channels4
Pulse width40 usPulse repetition frequency6000
Signal bandwidth100 MHzRange-ambiguity number4
Array time delay0.01 usSlant range of scene center800 km
Effective radar velocity7100 m/sSlant range swath width100 km
Table 2. Target parameters.
ParameterValue
Target IndexTarget ATarget BTarget CTarget D
Range-ambiguity region1234
Real range (km)790820830835
Unambiguous range (km)790795805810
Table 3. Comparison of computational complexity.
MethodComputational LoadComputational Time
Proposed STC method O ( Q M P L ) 12.425 s
FDA-MIMO radar O ( Q M 2 P L ) 40.368 s
Up–down chirp modulation O ( 2 P L ) 3.732 s
Disclaimer/Publisher’s Note: The statements, opinions and data contained in all publications are solely those of the individual author(s) and contributor(s) and not of MDPI and/or the editor(s). MDPI and/or the editor(s) disclaim responsibility for any injury to people or property resulting from any ideas, methods, instructions or products referred to in the content.

