Technical Note

Land Subsidence in the Singapore Coastal Area with Long Time Series of TerraSAR-X SAR Data

1
School of Electrical and Control Engineering, North China University of Technology, Beijing 100144, China
2
Radar Monitoring Technology Laboratory, School of Information Science and Technology, North China University of Technology, Beijing 100144, China
3
School of Geomatics and Urban Spatial Informatics, Beijing University of Civil Engineering and Architecture, Beijing 102627, China
4
International Research Center of Big Data for Sustainable Development Goals (CBAS), Beijing 100094, China
5
Aerospace Information Research Institute (AIR), Chinese Academy of Sciences (CAS), Beijing 100094, China
*
Author to whom correspondence should be addressed.
Remote Sens. 2023, 15(9), 2415; https://doi.org/10.3390/rs15092415
Submission received: 30 March 2023 / Revised: 30 April 2023 / Accepted: 1 May 2023 / Published: 5 May 2023
(This article belongs to the Special Issue InSAR Imaging of Coastal Geohazards)

Abstract

:
Global sea level rise is a major environmental concern for many countries and cities, particularly for low-lying coastal areas where urban development is threatened by the combined effects of sea level rise and land subsidence. This study employed an improved two-layer network Persistent Scatterers Interferometric Synthetic Aperture Radar (PS-InSAR) technology to obtain high-precision land subsidence in Singapore from 2015 to 2019. Landsat images from 1973 to 2020 were also utilized to extract changes in Singapore’s coastline. Geological, topographical, and global sea level rise data were integrated to investigate the causes and impacts of land subsidence in Singapore. The results indicate that the areas with severe subsidence coincide with land reclamation areas, where subsidence is mainly due to soil consolidation. Based on WorldDEM, land subsidence, and sea level rise data, the maximum inundation depth in Singapore by 2050 is estimated to be 1.24 m, with the Marina Bay area in Singapore’s central business district being the most vulnerable to sea level rise. This study provides data support and a scientific basis for understanding the impact of land subsidence on Singapore’s coastal areas under the influence of multiple factors using advanced InSAR technology.

1. Introduction

The global mean sea level (GMSL) is predominantly influenced by the thermal expansion of seawater, glacier melting, and variations in land water storage [1]. Examination of satellite altimeter data indicates that GMSL has been steadily increasing at a rate of 3.2 mm/y from 1993 to 2009 [2,3,4]. This persistent trend of gradual sea level rise poses a significant threat to areas with low-lying topography or undergoing subsidence, especially highly populated and economically developed coastal cities. This phenomenon may result in intensified occurrences of land submergence, coastal erosion, and saltwater intrusion, which can potentially lead to severe outcomes. Presently, global sea level alterations are among the most significant environmental concerns worldwide.
Land subsidence is an environmental occurrence that manifests as the regional decline of ground elevation. It is a phenomenon caused by natural and anthropogenic factors resulting in the compression of surface soil [5]. At least 200 areas in 34 countries have suffered land subsidence in the past century [5]. These countries include but are not limited to China [6], India [7,8], and Iran [9]. Land reclamation and dike construction are examples of human activities that particularly impact coastal cities, leading to lowered elevations and dike heights, increasing the risk of seawater intrusion. When combined with rising sea levels, land subsidence exacerbates the relative sea level rise in coastal lowlands, leading to numerous environmental consequences, such as the destruction of ecosystems, the submergence of land, and the endangerment of coastal infrastructure and property [10,11,12]. As observed in Hampton Roads, USA [13], Jakarta [14] and Semarang [15], Indonesia, Shanghai [16], and Tianjin [17], China, coastal subsidence causes significant challenges in terms of comprehending and addressing its effects due to varying regional and city-specific factors that contribute to sea level rise. Thus, effective resolution of coastal subsidence remains a formidable task.
Singapore, a low-lying island nation with an average elevation of 15 m, is highly susceptible to the impacts of future sea level rise, with over 30% of its land situated below 5 m [18]. In an effort to better understand and mitigate the impacts of land subsidence, numerous studies have been conducted utilizing various measurement methods, including the Global Positioning System (GPS) and Interferometric Synthetic Aperture Radar (InSAR). Catalao et al. [19] employed InSAR and GPS technology to assess land subsidence in Singapore between 1995 and 2000, revealing that most reclaimed areas were stable while only four small subsidence areas were observed. Similarly, Wan et al. [20] utilized PS-InSAR technology to investigate land subsidence from 2006 to 2011 in Singapore, identifying significant subsidence in certain local areas with a maximum subsidence rate of −7 mm/y near the flat coastal area. Furthermore, Catalao et al. [21] employed PS-InSAR technology to investigate land subsidence in Singapore between 2011 and 2016 and used the results in conjunction with sea level rise data to produce an inundation risk map. These studies have highlighted that Singapore is experiencing elevated subsidence rates in some low-lying coastal areas, while the sea level in the Singapore Strait is rising at an average rate of 3.2 mm/y, with the average rate increasing annually [22]. Nonetheless, the current land subsidence map of Singapore has not been updated for the past six years, and the sensitivity of land subsidence in the region has not been investigated. As such, further research is necessary to fully understand the impacts of land subsidence and sea level rise on Singapore’s coastal areas. In addition, this study systematically analyzed Singapore’s future flooding analysis based on land subsidence and sea level rise. It has reference significance for other coastal cities.
This study aims to investigate the spatio-temporal evolution of land subsidence in Singapore over a period of four years. To achieve this goal, a significant archive of synthetic aperture radar (SAR) data was analyzed, covering the time period from February 2015 to October 2019. The analysis highlights the effectiveness and significance of an improved two-layer network PS-InSAR technique in monitoring geological instabilities, specifically in coastal areas prone to subsidence. Vulnerable areas of coastal subsidence were identified and subjected to detailed analysis. Moreover, the study examines the combined impacts of land subsidence and sea level rise on flood inundation in the region.

2. Study Area and Datasets
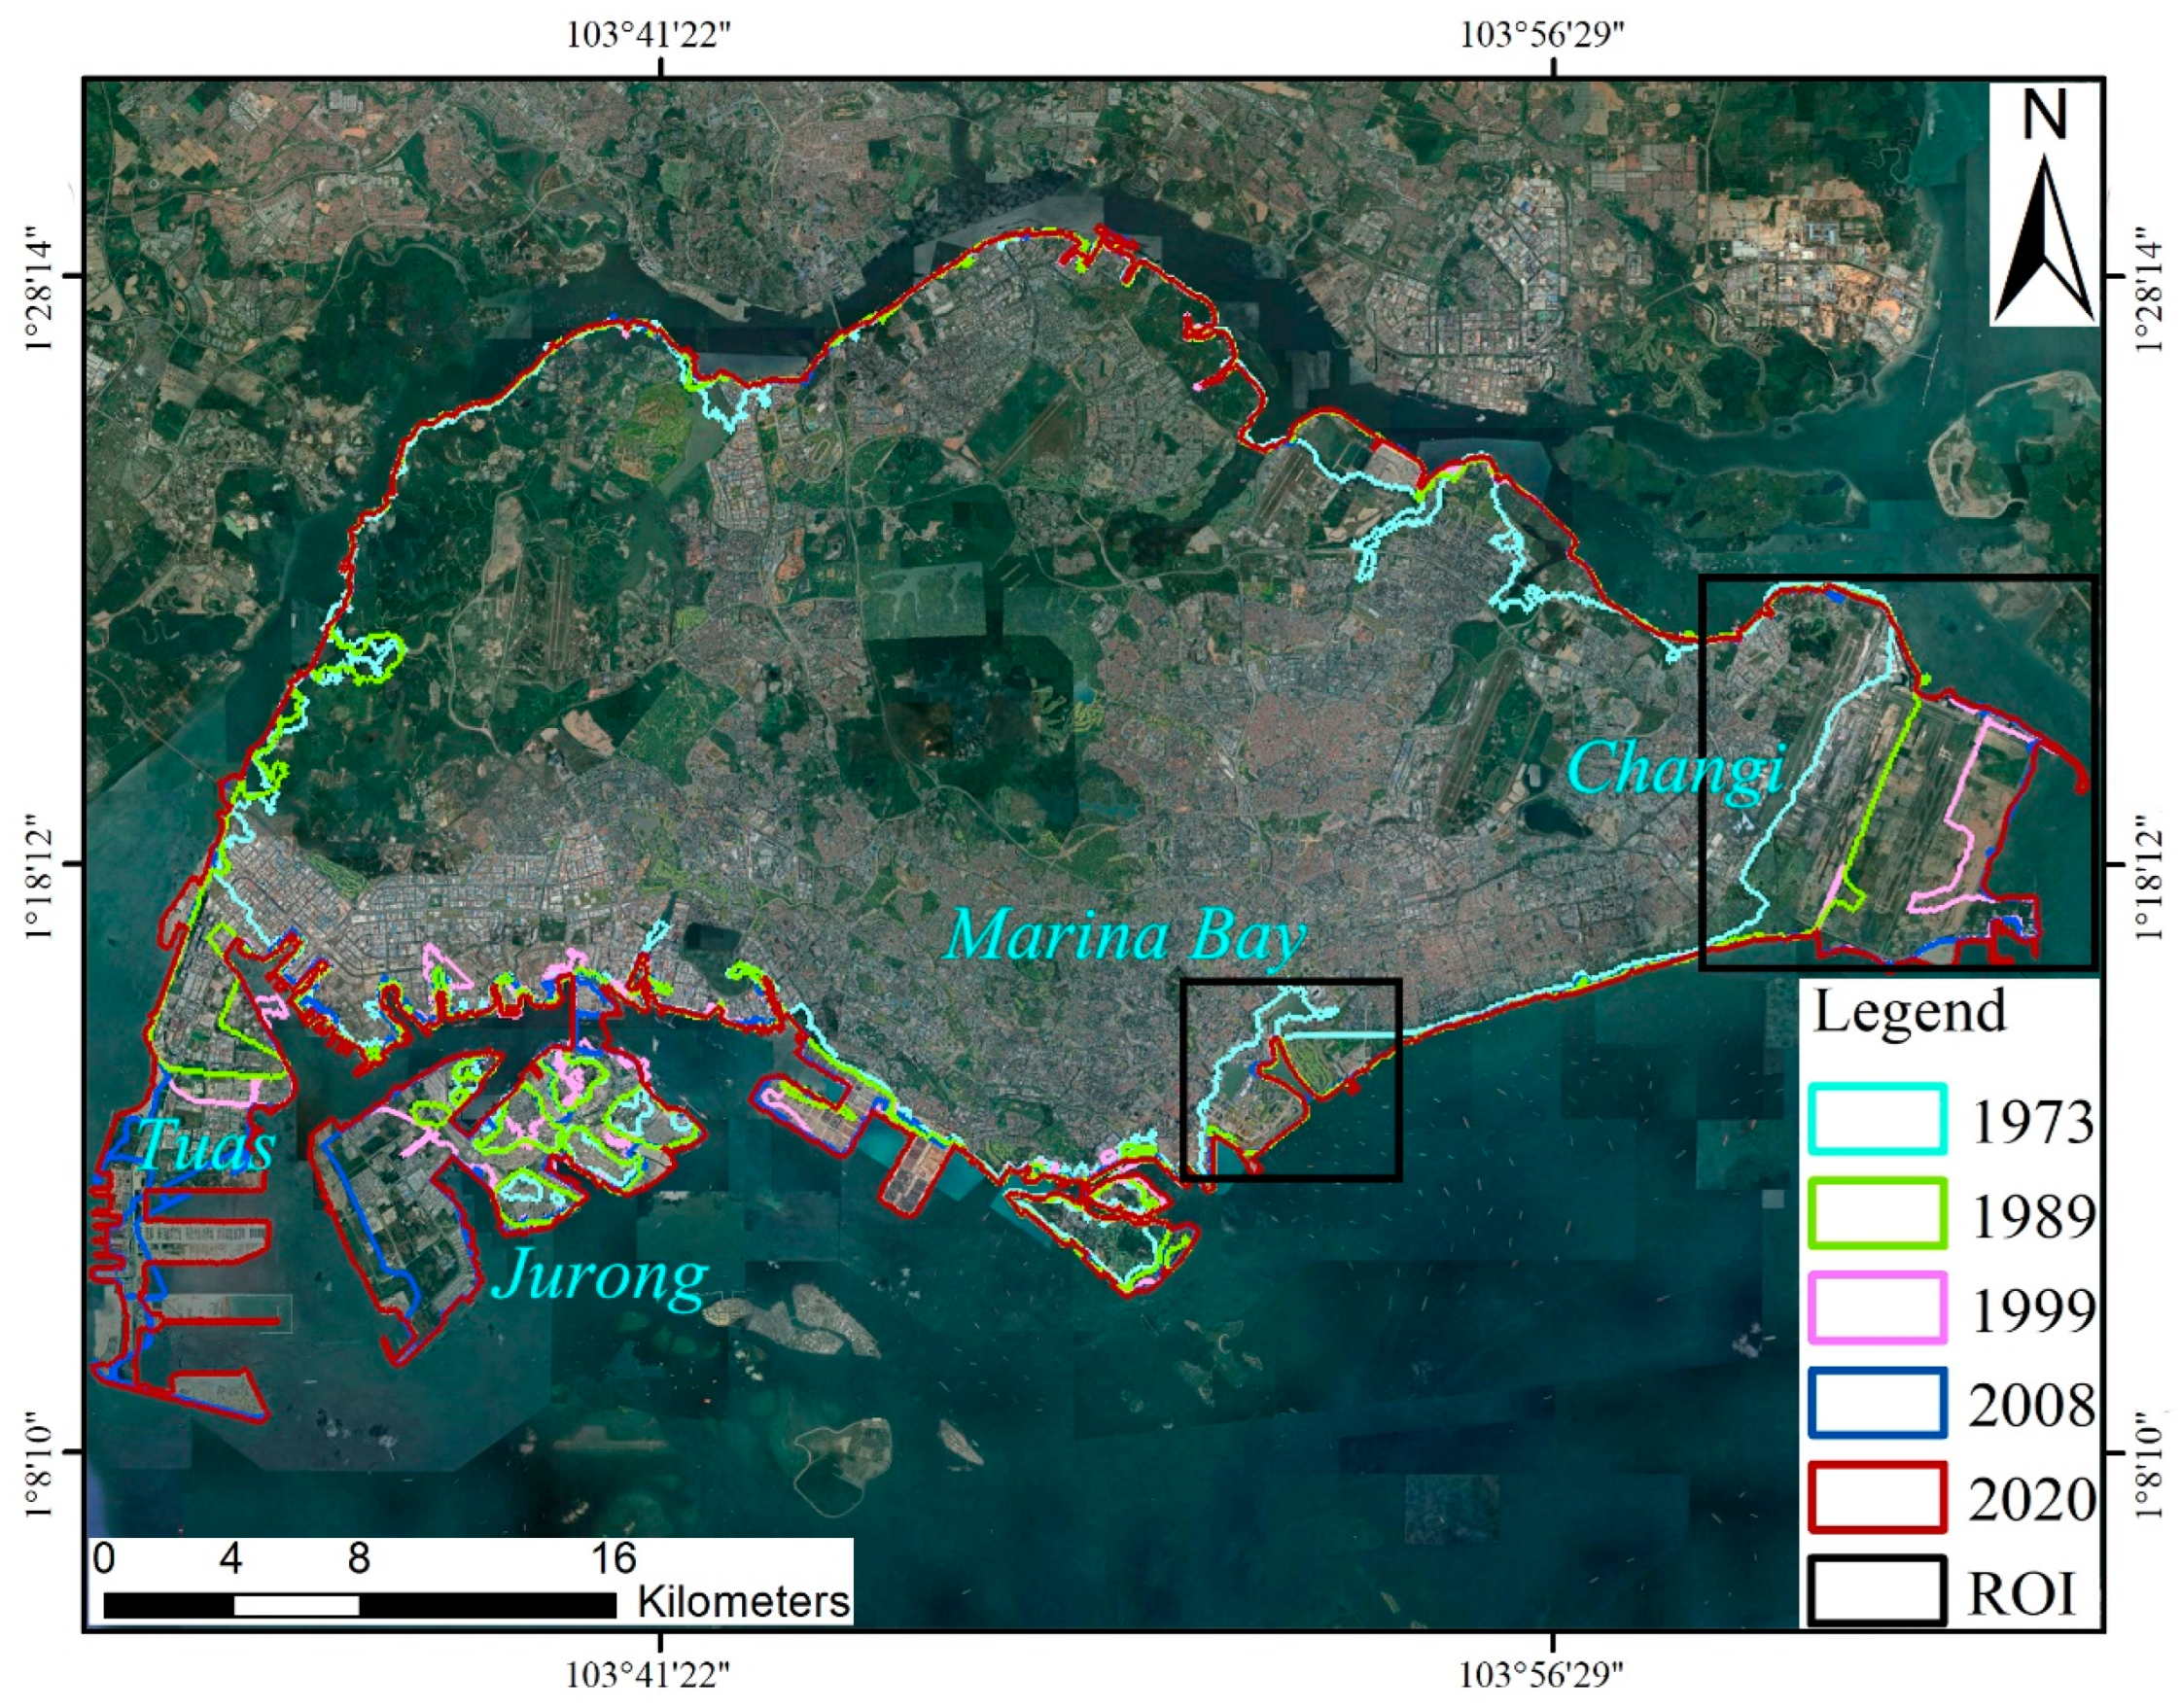
2.1. Study Area

Singapore is a prominent coastal city situated in Southeast Asia and it is entirely surrounded by sea. It is located within the geographic coordinates of 103°38′ to 104°06′ longitude and 1°09′ to 1°28′ latitude [23], comprising Singapore Island and 63 neighboring isles. The city has low-lying and flat terrain. Singapore experiences a tropical marine climate that is regulated by the equatorial low-pressure zone all year round and is characterized by high precipitation levels [21]. The temperature variations throughout the year and in a day are insignificant, with the average annual temperature ranging between 23 °C and 35 °C [24,25]. The geographical information of Singapore is illustrated in Figure 1. The geological materials of Singapore can be broadly divided into four main types: the igneous rocks consisting of the Bukit Timah granite and the Gornbak norite in the north and central-north; the sedimentary rocks of the Jurong Formation in the west and southwest; the Quaternary deposits of the Old Alluvium in the east; and recent deposits of the Kallang Formation of the alluvium member, the transitional member, and marine clay distributed throughout the island [26].

2.2. Datasets

This study employed a total of 48 high-resolution TerraSAR-X ascending orbit images obtained from 18 February 2015 to 31 October 2019 for processing with the PS-InSAR technique. The spatial resolution of the images is 3 m, and the details of the InSAR data acquisition are provided in Table 1. In addition, subsidence data from four GPS monitoring stations was collected from the Nevada Geodetic Laboratory GPS Networks Map (http://geodesy.unr.edu/NGLStationPages/gpsnetmap/GPSNetMap_MAG.html (accessed on 25 March 2023)). The locations of the GPS stations are illustrated in Figure 1. Moreover, Landsat satellite images were utilized to detect any changes in the Singapore coastline, and the details of the Landsat image acquisition are provided in Table 2. The 30 m WorldDEM [27] was used as topographic data for flood analysis. The WorldDEM product is based on the radar satellite data acquired during the TanDEM-X mission, collected from 1 January 2011 to 1 July 2015. The absolute vertical accuracy of WorldDEM is 4 m, and the relative vertical accuracy is 2 m (slops ≤ 20%).

3. Methodology

The study employs a two-step methodology to analyze land subsidence and land reclamation in Singapore. The first step involves generating a time series deformation map by processing SAR images through an improved two-layer network PS-InSAR technique to obtain high-precision land subsidence. The second step involves calculating the Modified Normalized Difference Water Index (MNDWI) [29] to demarcate the boundary of land reclamation in Singapore. The changes in land reclamation are quantified by comparing the statistical data across multiple time series boundaries. Finally, the study analyzes the impact of land reclamation on land subsidence by integrating high-precision land subsidence with the spatio-temporal data of land reclamation in Singapore. The methodology is illustrated in Figure 2.

3.1. Two-Layer Network PS-InSAR

The PS-InSAR technology utilized in this study relies on identifying stable and strong PS in a time series of SAR images to overcome the temporal and spatial decorrelation issues inherent in D-InSAR [30]. The phase information obtained from these points is used to estimate deformation, elevation residuals, and atmospheric delays through the construction of relevant functions. To achieve this, N-1 differential interferograms are generated by differencing each secondary image with the phase value of the PS in the master image. The information contained within each differential interferogram:
Δ ϕ D I n t = Δ ϕ d i s p + Δ ϕ t o p o _ r e s + Δ ϕ a t m o + Δ ϕ n o i s e
where Δ ϕ d i s p represents the Line of Sight (LOS) deformation phase, Δ ϕ t o p o _ r e s represents the terrain residual phase, Δ ϕ a t m o represents the atmospheric delay phase, and Δ ϕ n o i s e represents other error components, such as thermal noise [30]. PS exhibit stable scattering characteristics over a long time period, which make them less sensitive to temporal and spatial decorrelation and maintain high coherence within their respective radar resolution cells. We present a new PS-InSAR algorithm with a two-layer network. The proposed approach involves selecting a small set of PS with stable scattering characteristics and removing the atmospheric delay phase component during the phase filtering process. The selected high-quality PS are then used as local reference points to construct a global network and ensure a consistent starting baseline across the study area. Spatial densification of the PS is achieved by using a low threshold. Based on the densified PS and the optimized connection network, the final subsidence rate and residual topographic error are calculated to obtain a high-density deformation result. The approach is characterized by the following specific steps: (i) selection of high-quality PS in the first level; (ii) removal of atmospheric delay phase; (iii) construction of a global network; (iv) densification of PS in the second level; and (v) calculation of subsidence rate and residual topographic error, as depicted in Figure 2. The proposed method can provide high-density deformation information with improved accuracy.

3.2. Coastline Detection

A MNDWI was proposed by replacing the near-infrared band with the mid-infrared band, which has been found to be more effective in extracting water bodies in urban areas with high building density [29]. In this study, we adopted the MNDWI method to extract the coastline boundary of the main island of Singapore from Landsat imagery. The Landsat images were radiometrically calibrated and processed using the MNDWI formula [29] to obtain water body information. The MNDWI method offers the advantages of easy, accurate, and rapid extraction of water body information in urban areas. The MNDWI can be expressed as follows:
MNDWI = G r e e n M I R G r e e n + M I R
where G r e e n represents the reflectance of the green band, while M I R represents the reflectance of the mid-infrared band. The formula used to calculate the MNDWI value of each pixel was based on the reflectance of the green and mid-infrared bands, with lower MNDWI values indicating a higher likelihood of the pixel being a water body. However, the accuracy of MNDWI for extracting intertidal zones and muddy shorelines is limited, and the results were carefully examined and edited in areas with clear errors.

4. Results and Accuracy Assessment

4.1. Historical Land Reclamation

The expanding demand for land and the need for increased social development space have led to the use of land reclamation as a means of obtaining construction land, particularly for coastal cities [21]. Singapore is a prime example of a country that has implemented land reclamation to create new land. Over the years, Singapore’s land area has expanded by 25% from 581.5 km2 to 728.6 km2 due to land reclamation, and the government aims to further reclaim 100 km2 of land by 2030. While land reclamation has brought significant economic benefits and promoted the Singaporean economy, the long-term compaction of reclaimed land can result in land subsidence, thereby posing a threat to the safety of people’s lives and property by impacting the stability of both surface and underground buildings.
A detailed analysis of the changes in the coastline of the island from 1973 to 2020 is shown in Figure 3, which highlights that the reclamation activities were concentrated mainly in the southern region of the island, encompassing Marina Bay, Jurong, Changi, and Tuas. The Marina Bay area, which is a contemporary urban district located at the heart of Singapore, was created through land reclamation and completed in 1992. This area is characterized by high-rise buildings, shopping centers, cultural centers, and tourist attractions. In addition, Jurong Island, situated in the eastern part of Singapore, is the largest of Singapore’s outlying islands. Reclamation works for Jurong Island began in 1995 and were completed in 2009. Similarly, Singapore’s Changi Airport, one of the busiest airports globally, was also created through land reclamation. The project, which started in 1975, aimed to expand the airport’s area and capacity, supporting the country’s international trade and tourism industries. Furthermore, the Tuas Port, which is one of the most active seaports in Southeast Asia, has been developed through land reclamation. The project was initiated in 2015 to cater to the increasing demand for industrial and port-related activities in the region. Based on the analysis of Landsat images, the land area of Singapore’s main island has increased by 24% from 559.7 km2 in 1973 to 692.5 km2 in 2020, as presented in Figure 4.

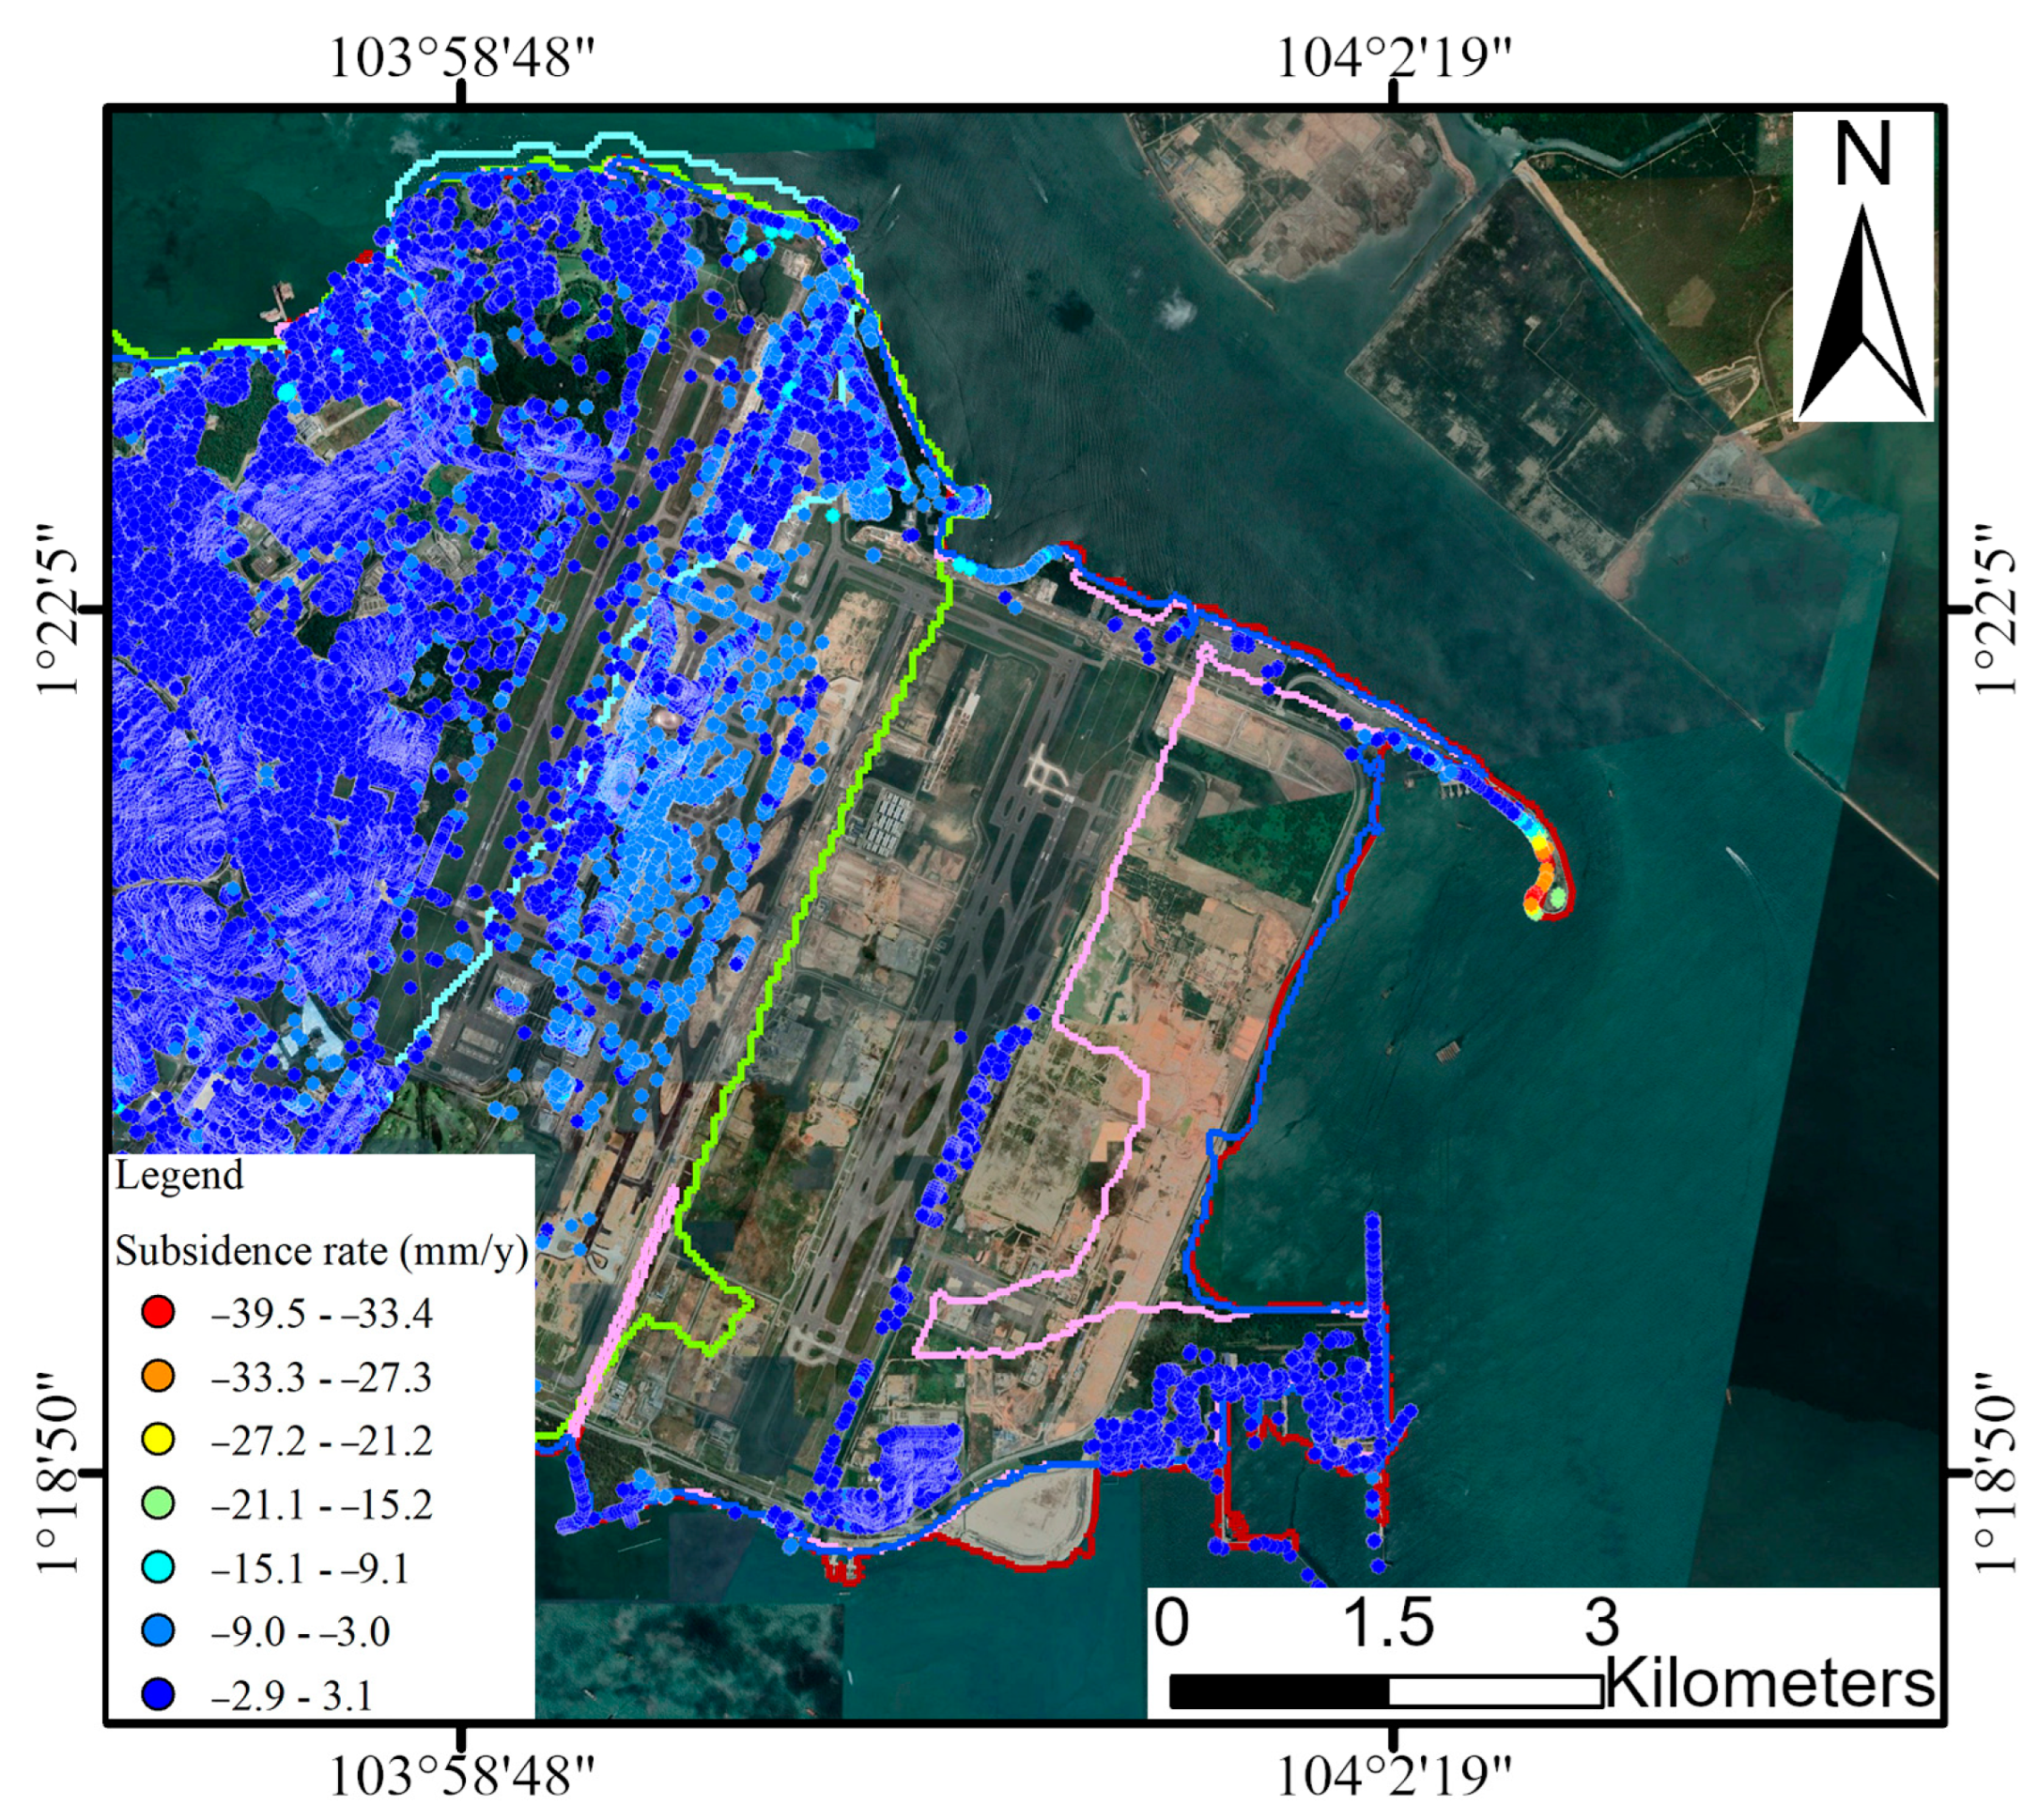
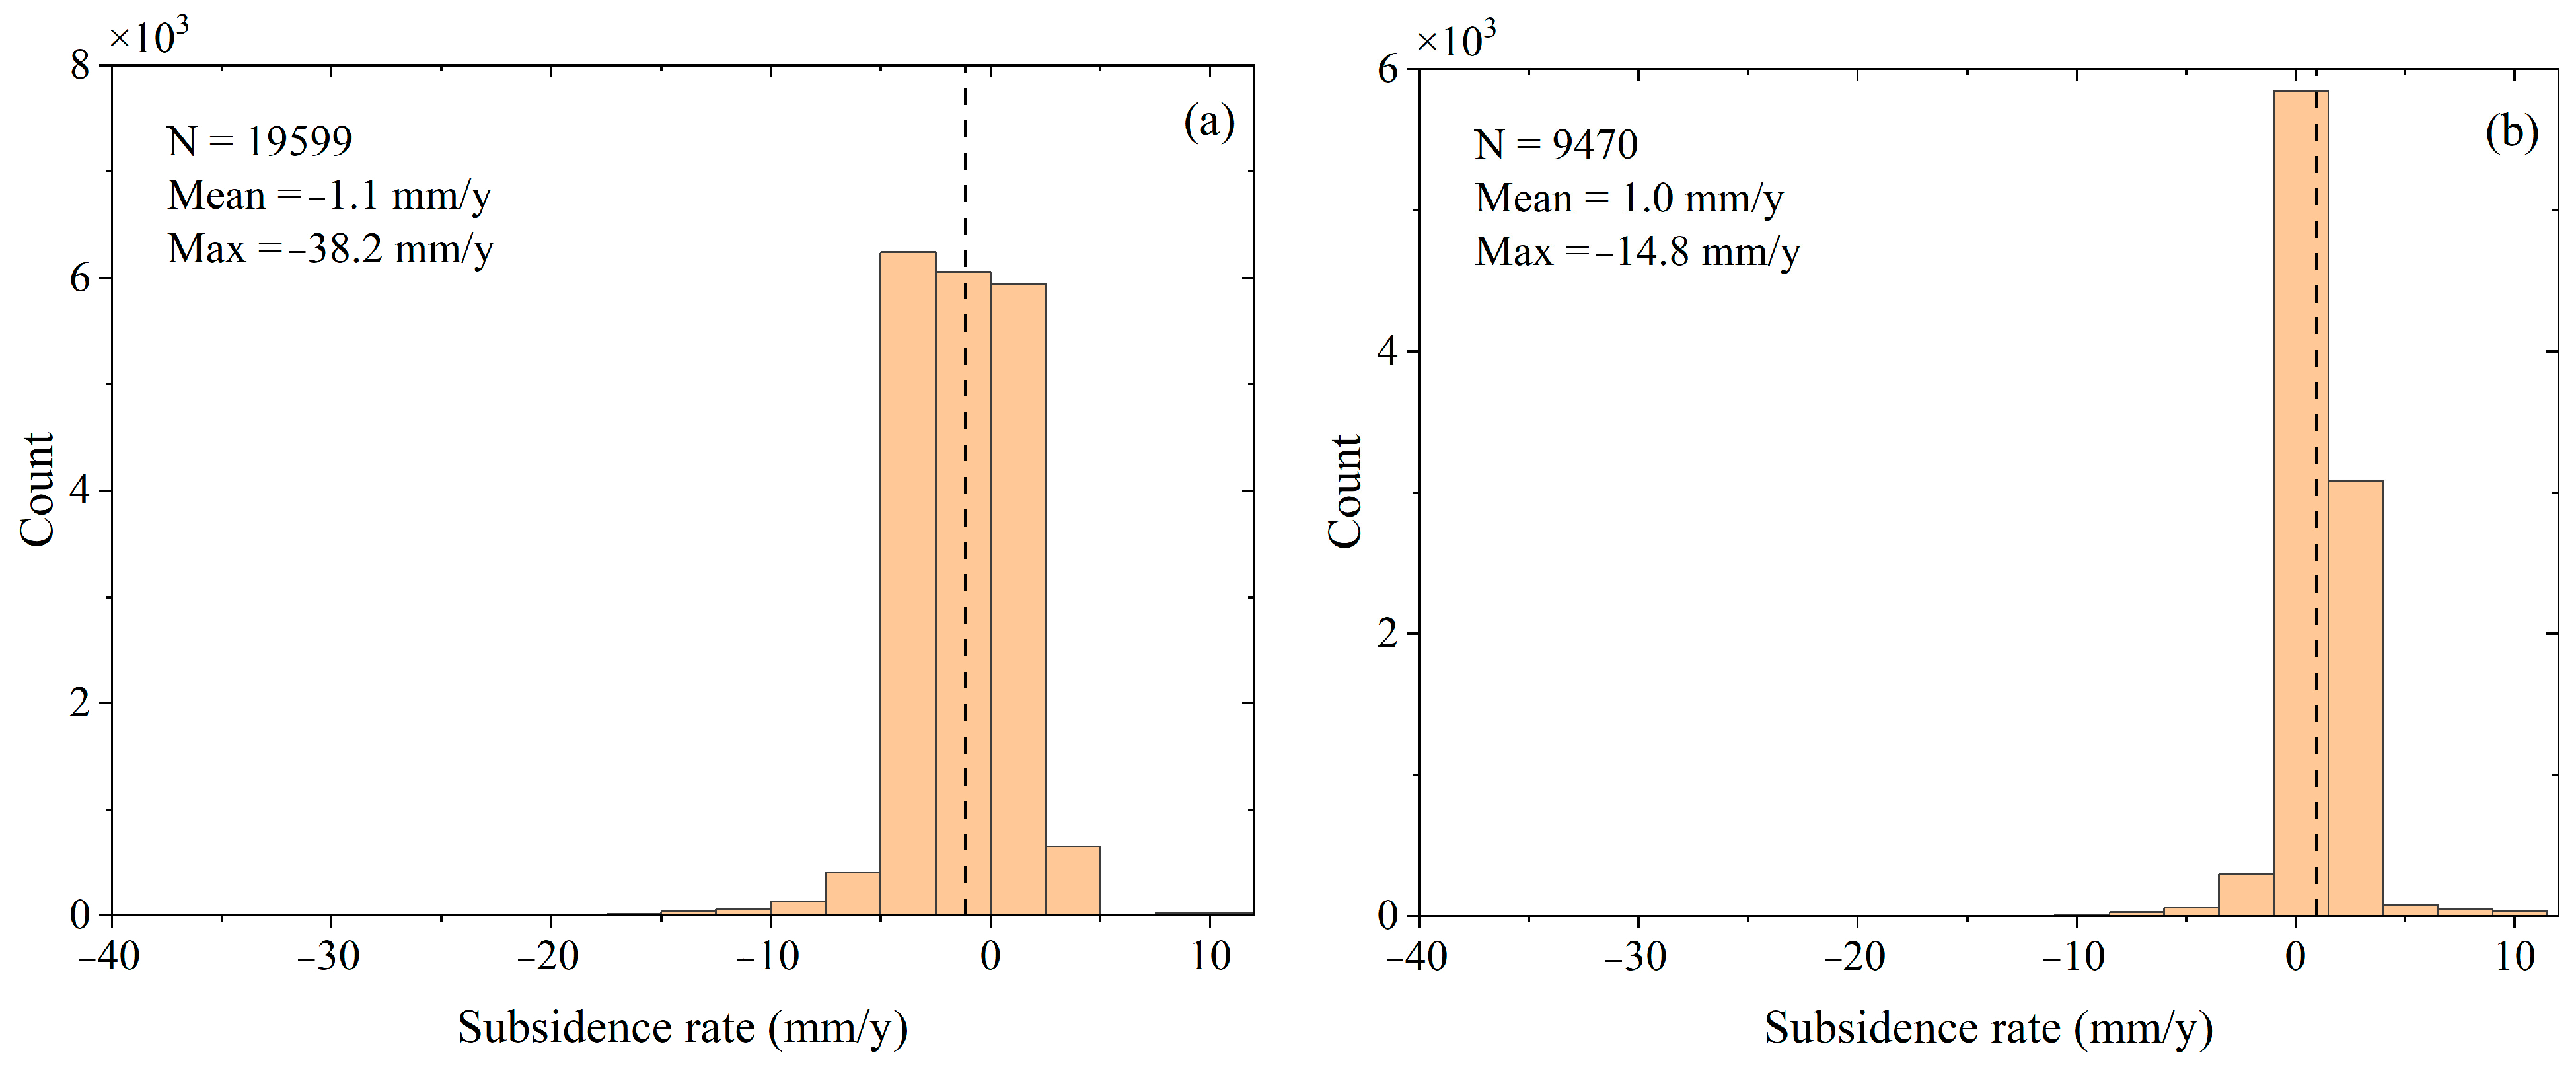
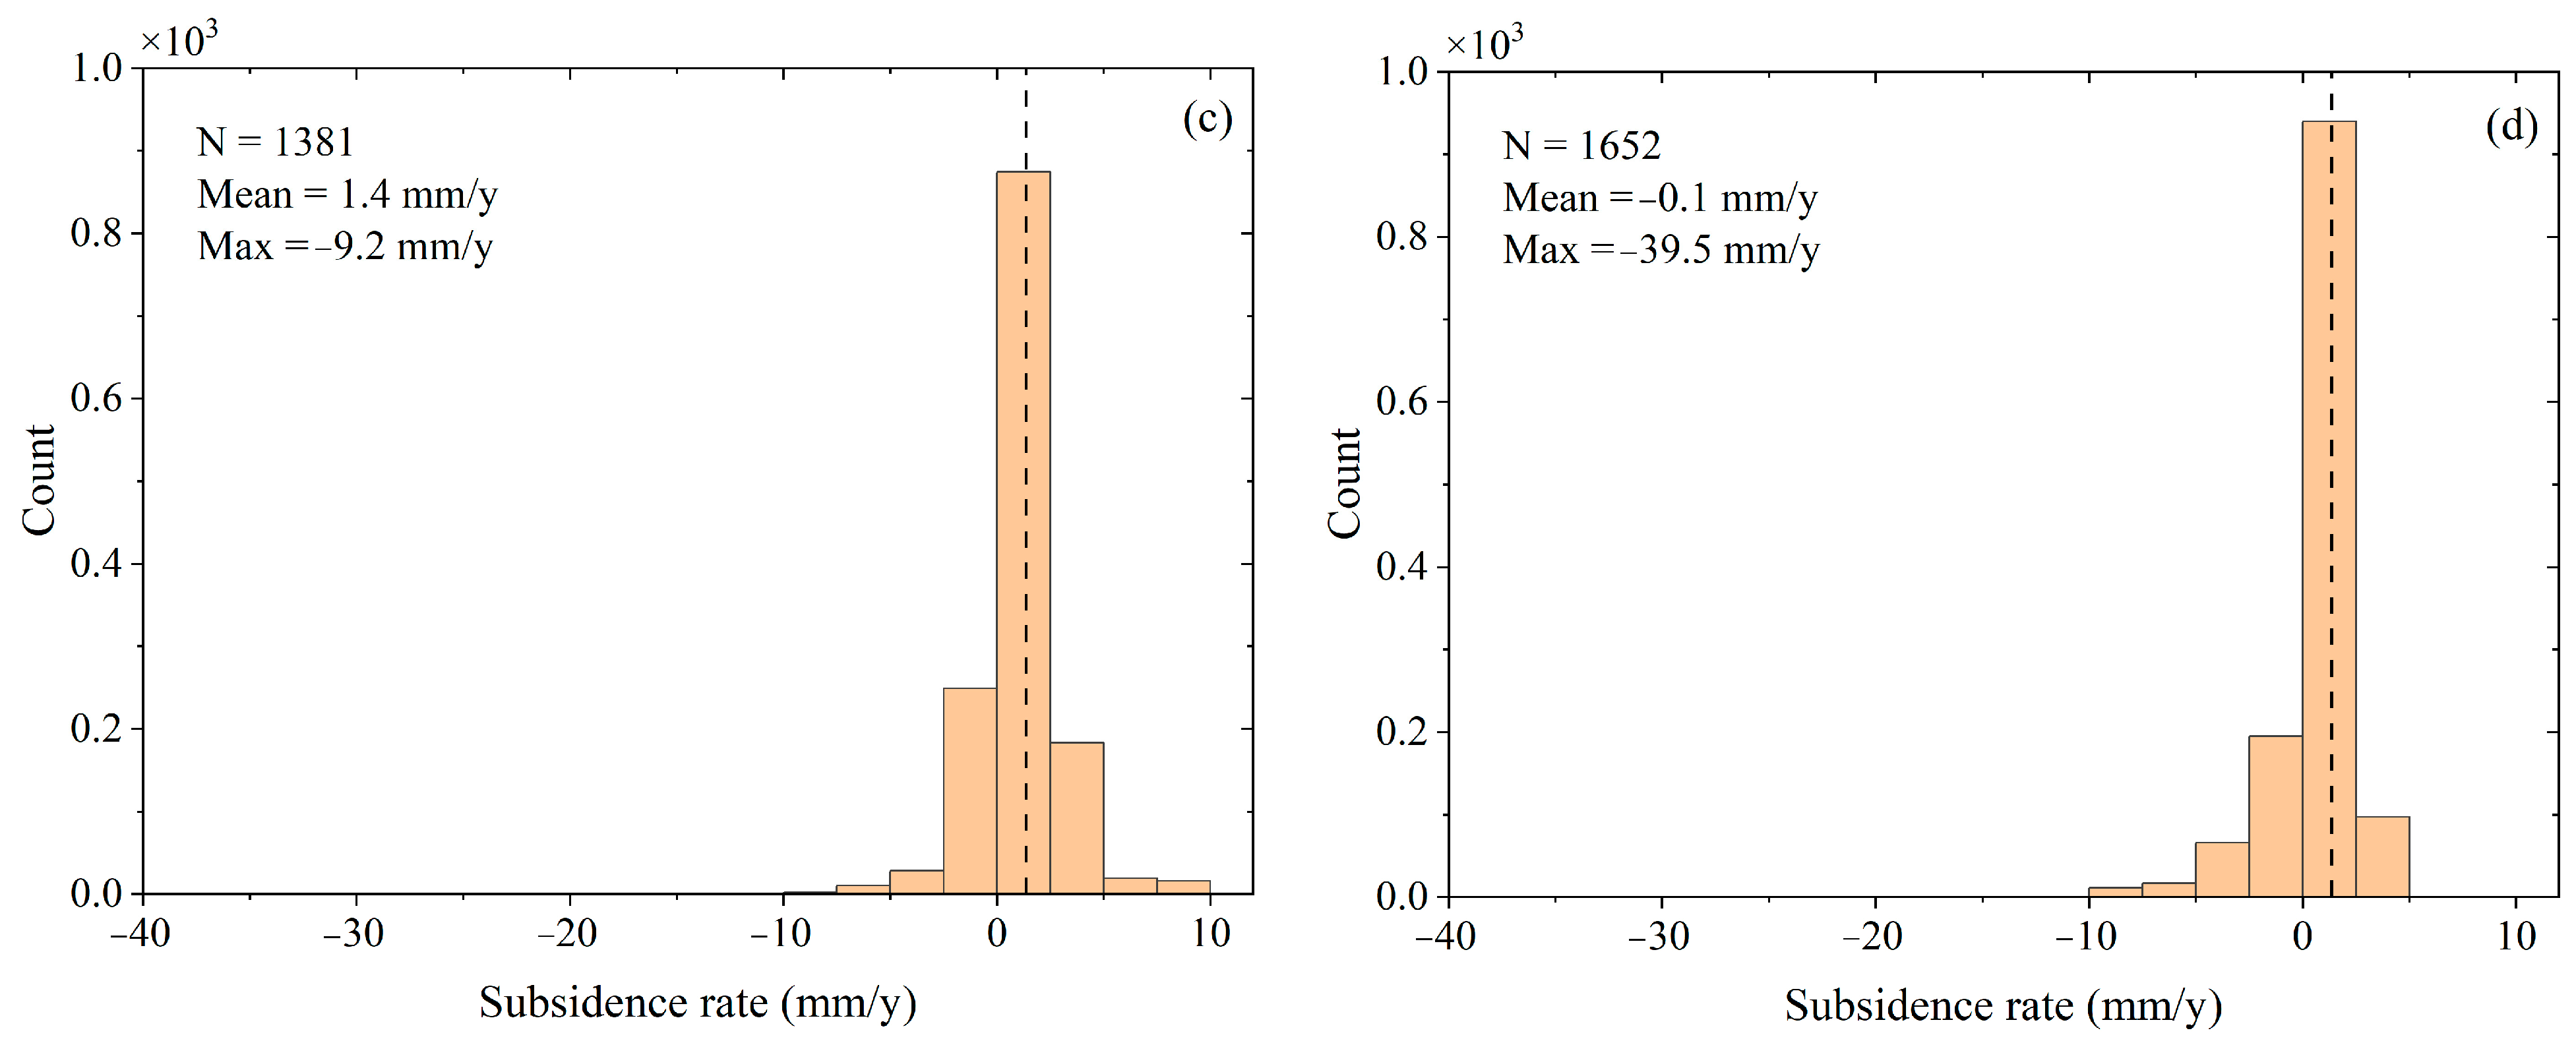
4.2. Land Subsidence

Based on a reference point on the building and assuming its stability, the subsidence rate was calculated. The reference point coordinates are 1.347139°N and 103.895854°E. The study area was characterized by a high number of artificial structures that acted as natural persistent scatterers, leading to a high density of PS. A total of 538,158 PS were identified over an area of approximately 447 km2, resulting in a point density of 1204 PS/km2. The high density of PS facilitated the provision of detailed information about the study area. The land subsidence rate was measured between 2015 and 2019, ranging from −39.5 mm/y to 10.4 mm/y. The land subsidence rate map in Figure 5 shows that the subsidence patterns were irregular, resulting from local site effects such as foundation construction and soil consolidation. Ground stability was observed in the inland areas, while the coastal areas, particularly Changi and Marina Bay, were characterized by pronounced subsidence phenomena. The highest subsidence rate observed was 39.5 mm/y, corresponding to a cumulative subsidence of 193.0 mm. The detailed spatial distribution of the subsidence area is introduced in Section 5.1.

4.3. Accuracy Assessment

To verify the accuracy of the PS-InSAR monitoring approach, this study utilized deformation data obtained from five GPS stations, which were selected based on the availability and continuity of the observation period using the Nevada Geodetic Laboratory GPS Networks Map [31]. The locations of the GPS stations are illustrated in Figure 1. The monitoring period spanned from 15 September 2015 to 17 September 2019. The SG99 station was excluded from the analysis due to the short observation period. To achieve a more precise comparison, the SLYG station was used as a reference benchmark to compare the relative subsidence rates of the other three stations. The comparison results in the line of sight direction are presented in Table 3. The accuracy of the PS-InSAR and GPS results is a root mean square error of 3.13 mm/y, indicating a good agreement. These findings validate the reliability of the PS-InSAR results for the study area.

5. Discussions

5.1. Subsidence Mechanisms

The present study revealed substantial land subsidence in the coastal regions of northeastern (Figure 6) and southern (Figure 7) Singapore, necessitating further investigation. The locations experiencing the highest subsidence rates in Singapore from 2015 to 2019 are closely related to the newly reclaimed areas. An analysis of the spatial distribution of subsidence and land reclamation together was considered. The most common reclamation techniques utilized in Singapore are tidal flat reclamation, beach reclamation, and offshore island reclamation. The soil layers in the reclamation areas include filled sand and recent deposits of the Kallang Formation. The fill is mostly made up of gravelly sand or clayey sand, occasionally with hard rock cores, shell fragments, or bricks, with thicknesses ranging from 5 to 12.5 m. The Kallang Formation consists of marine and delta clay with sand, with thicknesses ranging from 3 to 37 m. While the old alluvium consists of clayey sand with higher shear strength and compaction. In addition to these geological layers, some regions include the Bukit Timah Granite and Jurong Formation [26]. In recent years, solid waste has replaced traditional materials; consequently, some new geomaterials need to be found [32]. The primary subsidence areas in Singapore coincide with the land reclamation areas, involving geological layers of the Kallang Formation. Therefore, we postulate that soil consolidation, accelerated by the construction of numerous artificial facilities, is likely the cause of subsidence in this region.
The industrial and airport-related infrastructure in the Changi area, as shown in Figure 6, experienced an average subsidence rate of −2.0 mm/y with an average cumulative subsidence of −9.4 mm. In contrast, the Marina Bay area, predominantly Singapore’s central business district, exhibited an average subsidence rate of −0.8 mm/y with an average cumulative subsidence of −3.8 mm, as depicted in Figure 7. The combined impact of land subsidence and sea-level rise suggests that the risk of flooding in the southeastern region of Singapore is more severe.
A statistical analysis was conducted on land subsidence rates in land reclamation areas from 1973 to 2020, as presented in Figure 8. Figure 8a illustrates PS extracted from the land reclamation areas during 1973–1989, when 48.9 km2 of land was added and numerous facilities were constructed. The monitoring period of this study detected 19,599 PS. Similarly, Figure 8b depicts PS extracted from the land reclamation areas during 1989–1999, when 30.4 km2 of land was added and 9470 PS were detected during the monitoring period. Additionally, Figure 8c,d demonstrates PS extracted from the land reclamation areas during 1999–2008 and 2008–2020, respectively, when 25.4 km2 and 28.1 km2 of land were added, mostly wasteland areas were reclaimed, and 1381 and 1652 PS were detected during the monitoring period, respectively. A maximum subsidence rate of −39.5 mm/y was recorded on the coastal breakwater in Changi from 2008 to 2020, indicating soil compaction and subsidence in recent years. Further, during the land reclamation period from 1973 to 1989, significant subsidence was observed in the Marina Bay Golf Course in Marina East, with a subsidence rate of −38.2 mm/y.

5.2. Inundation Scenarios

As a coastal country such as Singapore, flood prevention is one of the most important tasks for sustainable urban development. With the continuous rise in sea level due to global warming and land subsidence, the risk of flooding in Singapore is increasing. The assessment of the potential flooding can be evaluated considering the combined effects of sea level rise and land subsidence. The latest report from the Intergovernmental Panel on Climate Change indicates an average global sea level rise of 3.7 mm/y over the past few decades [33]. By integrating this information with the land subsidence rate in Singapore from 2015 to 2019, the potential submerged land area can be evaluated, as shown in Figure 9. This analysis revealed that the central business district, particularly the coastal areas of Marina Bay, faces the highest risk. A subsidence of 1.24 m is predicted for 2020 to 2050. Moreover, it is necessary to consider other vulnerabilities, such as natural and anthropogenic ones. It is important to note that this is a simplified calculation method, but more complex models and algorithms could be influenced by several other factors, including climate change and urban development.

6. Conclusions

This study employs an improved two-layer network PS-InSAR technology to analyze land subsidence in Singapore between 2015 and 2019, generating a high spatiotemporal resolution subsidence map. The Landsat images were employed to detect variations in Singapore’s coastal boundary over a period spanning from 1973 to 2020. The maximum land subsidence rate during this period was −39.5 mm/y, with more pronounced subsidence areas compared to previous research. These areas are concentrated in Singapore’s historical reclamation sectors, particularly the southeast and northeast coastal regions. The area with a subsidence rate of more than −5 mm/y is about 3.4 km2, accounting for 0.79% of the study area. The maximum subsidence rate in the central business district is −38.2 mm/y, and the maximum subsidence rate in Changi Airport is −39.5 mm/y. The subsidence seems to be related to the compactation of the Kallang Formation and recent deposits. The study also considers the combined impact of land subsidence and sea-level rise on flooding risk, identifying the coastal area of Marina Bay as the most vulnerable. Without considering other natural, economic, and social vulnerabilities, the maximum relative subsidence in the Marina Bay coastal area between 2020 and 2050 is estimated to be 1.24 m. These findings provide a deeper understanding of land subsidence in Singapore. The method and application described in this paper can be used as a reference for other cities that are suffering from land subsidence and sea level rise.

Author Contributions

Conceptualization, Z.B. and Y.W. (Yanping Wang); methodology, Z.B.; software, Z.B.; validation, M.L.; formal analysis, Z.B.; investigation, Z.B.; resources, Z.B.; writing—original draft preparation, Z.B. and M.L.; writing—review and editing, Z.B., X.Z., Y.S., Y.W. (Yewei Wu), Y.L. and D.L.; visualization, Z.B.; supervision, Z.B.; project administration, Y.W. (Yanping Wang); funding acquisition, Y.W. (Yanping Wang). All authors have read and agreed to the published version of the manuscript.

Funding

This research was funded by key international cooperation projects of the National Natural Science Foundation of China, grant number 61860206013 and the Young Beijing Scholars Support Program.

Data Availability Statement

Not applicable.

Acknowledgments

We thank the German Aerospace Center (DLR) for their efforts in developing and distributing the remotely sensed SAR data.

Conflicts of Interest

The authors declare no conflict of interest.

References

  1. Chen, W.; Zhong, M.; Zhong, Y.L. Global mean sea level variations and the land water cycle at the inter-annual scale during the 2014-2016 El Niño episode. Chin. Sci. Bull. 2017, 62, 2116–2124. [Google Scholar] [CrossRef]
  2. Church, J.A.; White, N.J. Sea-level rise from the late 19th to the early 21st century. Surv. Geophys. 2011, 32, 585–602. [Google Scholar] [CrossRef]
  3. Jevrejeva, S.; Moore, J.C.; Grinsted, A.; Matthews, A.P.; Spada, G. Trends and acceleration in global and regional sea levels since 1807. Glob. Planet. Chang. 2014, 113, 11–22. [Google Scholar] [CrossRef]
  4. Hay, C.C.; Morrow, E.; Kopp, R.E.; Mitrovica, J.X. Probabilistic reanalysis of twentieth-century sea-level rise. Nature 2015, 517, 481–484. [Google Scholar] [CrossRef] [PubMed]
  5. Herrera-García, G.; Ezquerro, P.; Tomás, R.; Béjar-Pizarro, M.; López-Vinielles, J.; Rossi, M.; Mateos, R.M.; Carreón-Freyre, D.; Lambert, J.; Teatini, P.; et al. Mapping the global threat of land subsidence. Science 2021, 371, 34–36. [Google Scholar] [CrossRef] [PubMed]
  6. Bai, Z.; Wang, Y.; Balz, T. Beijing land subsidence revealed using PS-InSAR with long time series TerraSAR-X SAR data. Remote Sens. 2022, 14, 2529. [Google Scholar] [CrossRef]
  7. Malik, K.; Kumar, D.; Perissin, D. Assessment of subsidence in Delhi NCR due to groundwater depletion using TerraSAR-X and persistent scatterers interferometry. Imaging Sci. J. 2019, 67, 1–7. [Google Scholar] [CrossRef]
  8. Widada, S.; Zainuri, M.; Yulianto, G.; Satriadi, A.; Wijaya, Y.J. Estimation of land subsidence using sentinel image analysis and its relation to subsurface lithology based on resistivity data in the coastal area of Semarang City, Indonesia. J. Ecol. Eng. 2020, 21. [Google Scholar] [CrossRef]
  9. Azarakhsh, Z.; Azadbakht, M.; Matkan, A. Estimation, modeling, and prediction of land subsidence using Sentinel-1 time series in Tehran-Shahriar plain: A machine learning-based investigation. Remote Sens. Appl. Soc. Environ. 2022, 25, 100691. [Google Scholar] [CrossRef]
  10. Kooi, H. Land subsidence due to compaction in the coastal area of the Netherlands: The role of lateral fluid flow and constraints from well-log data. Glob. Planet. Chang. 2000, 27, 207–222. [Google Scholar] [CrossRef]
  11. Takagi, H.; Esteban, M.; Mikami, T.; Pratama, M.B.; Valenzuela, V.P.B.; Avelino, J.E. People’s perception of land subsidence, floods, and their connection: A note based on recent surveys in a sinking coastal community in Jakarta. Ocean Coast. Manag. 2021, 211, 105753. [Google Scholar] [CrossRef]
  12. Wu, P.C.; Wei, M.; D’Hondt, S. Subsidence in coastal cities throughout the world observed by InSAR. Geophys. Res. Lett. 2022, 49, e2022GL098477. [Google Scholar] [CrossRef]
  13. Buzzanga, B.; Bekaert, D.P.; Hamlington, B.D.; Sangha, S.S. Toward sustained monitoring of subsidence at the coast using InSAR and GPS: An application in Hampton Roads, Virginia. Geophys. Res. Lett. 2020, 47, e2020GL090013. [Google Scholar] [CrossRef]
  14. Hakim, W.L.; Achmad, A.R.; Lee, C.W. Land subsidence susceptibility mapping in jakarta using functional and meta-ensemble machine learning algorithm based on time-series InSAR data. Remote Sens. 2020, 12, 3627. [Google Scholar] [CrossRef]
  15. Malik, K.; Kumar, D.; Perissin, D.; Pradhan, B. Estimation of ground subsidence of New Delhi, India using PS-InSAR technique and Multi-sensor Radar data. Adv. Space Res. 2022, 69, 1863–1882. [Google Scholar] [CrossRef]
  16. Bao, X.; Zhang, R.; Shama, A.; Li, S.; Xie, L.; Lv, J.; Fu, Y.; Wu, R.; Liu, G. Ground deformation pattern analysis and evolution prediction of Shanghai Pudong International Airport based on PSI long time series observations. Remote Sens. 2022, 14, 610. [Google Scholar] [CrossRef]
  17. Tang, W.; Zhan, W.; Jin, B.; Motagh, M.; Xu, Y. Spatial variability of relative sea-level rise in Tianjin, China: Insight from InSAR, GPS, and tide-gauge observations. IEEE J. Sel. Top. Appl. Earth Obs. Remote Sens. 2021, 14, 2621–2633. [Google Scholar] [CrossRef]
  18. Ng, W.S.; Mendelsohn, R. The impact of sea level rise on Singapore. Environ. Dev. Econ. 2005, 10, 201–215. [Google Scholar] [CrossRef]
  19. Catalao, J.; Raju, D.; Fernandes, R.M.S. Mapping vertical land movement in Singapore using InSAR GPS. ESA Spec. Publ. 2013, 722, 54. [Google Scholar]
  20. Wan, Q.; Liew, S.C.; Kwoh, L.K. Persistent scatterer InSAR for ground deformation mapping using ALOS PALSAR data: A case study in Singapore. In Proceedings of the 2014 IEEE Geoscience and Remote Sensing Symposium, Quebec City, QC, Canada, 13–18 July 2014; 2014; pp. 441–444. [Google Scholar]
  21. Catalao, J.; Raju, D.; Nico, G. InSAR maps of land subsidence and sea level scenarios to quantify the flood inundation risk in coastal cities: The case of Singapore. Remote Sens. 2020, 12, 296. [Google Scholar] [CrossRef]
  22. Tkalich, P.; Vethamony, P.; Luu, Q.H.; Babu, M.T. Sea level trend and variability in the Singapore Strait. Ocean Sci. 2013, 9, 293–300. [Google Scholar] [CrossRef]
  23. Suresh, K. Singapore’s national climate change strategy. In Crucial Issues in Climate Change and the Kyoto Protocol: Asia and the World; World Scientific Publishing Company: Singapore, 2010; pp. 373–382. [Google Scholar]
  24. Tkalich, P.; Vethamony, P.; Babu, M.T.; Pokratath, P. Seasonal Sea Level Variability and Anomalies in the Singapore Strait. In Proceedings of the International Conference in Ocean Engineering, ICOE 2009 IIT Madras, Chennai, India, 1–5 February 2009. [Google Scholar]
  25. Chew, S.Y.; Wei, J. Major reclamation scheme for Marina city, Singapore. In Coastal Engineering 1980; ASCE: Online, 1980; pp. 2245–2260. [Google Scholar]
  26. Sharma, J.S.; Chu, J.; Zhao, J. Geological and geotechnical features of Singapore: An overview. Tunn. Undergr. Space Technol. 1999, 14, 419–431. [Google Scholar] [CrossRef]
  27. European Space Agency, Sinergise. Copernicus Global Digital Elevation Model; OpenTopography: San Diego, CA, USA, 2021. [Google Scholar] [CrossRef]
  28. Werninghaus, R.; Buckreuss, S. The TerraSAR-X mission and system design. IEEE Trans. Geosci. Remote Sens. 2009, 48, 606–614. [Google Scholar] [CrossRef]
  29. Xu, H. Modification of normalised difference water index (NDWI) to enhance open water features in remotely sensed imagery. Int. J. Remote Sens. 2006, 27, 3025–3033. [Google Scholar] [CrossRef]
  30. Ferretti, A.; Prati, C.; Rocca, F. Permanent scatterers in SAR interferometry. IEEE Trans. Geosci. Remote Sens. 2001, 39, 8–20. [Google Scholar] [CrossRef]
  31. Blewitt, G.; Hammond, W. Harnessing the GPS data explosion for interdisciplinary science. Eos 2018, 99. [Google Scholar] [CrossRef]
  32. Arulrajah, A.; Bo, M.W. Characteristics of Singapore marine clay at Changi. Geotech. Geol. Eng. 2008, 26, 431–441. [Google Scholar] [CrossRef]
  33. Masson-Delmotte, V.; Zhai, P.; Pirani, A.; Connors, S.L.; Péan, C.; Berger, S.; Zhou, B. Climate change 2021: The physical science basis. In Contribution of Working Group I to the Sixth Assessment Report of the Intergovernmental Panel on Climate Change; Cambridge University Press: Cambridge, UK; New York, NY, USA, 2021; Volume 2. [Google Scholar] [CrossRef]
Figure 1. Footprint of TerraSAR-X SAR images and the Nevada Geodetic Laboratory GPS Networks Map Stations (black circle) used for the land subsidence calibration and validation. The background is the Google Earth map.
Remotesensing 15 02415 g001
Figure 2. The flow for PS-InSAR and MNDWI.
Remotesensing 15 02415 g002
Figure 3. Land reclamation and its temporal and spatial evolution in Singapore. The ROI frames are located in Marina Bay and Changi.
Remotesensing 15 02415 g003
Figure 4. Evolution of land reclamation areas in Singapore.
Remotesensing 15 02415 g004
Figure 5. Subsidence rate derived from PS-InSAR of TerraSAR-X images between February 2015 and October 2019.
Remotesensing 15 02415 g005
Figure 6. Land subsidence maps of Changi. The curve color is the same as that in Figure 3.
Remotesensing 15 02415 g006
Figure 7. Land subsidence maps of Marina Bay. The curve color is the same as that in Figure 3.
Remotesensing 15 02415 g007
Figure 8. Statistics of subsidence rates in land reclamation areas. (a) 1973–1989; (b) 1989–1999; (c) 1999–2008; (d) 2008–2020. The dashed line represents mean subsidence rate.
Remotesensing 15 02415 g008aRemotesensing 15 02415 g008b
Figure 9. Potential flood inundation map from 2020 to 2050.
Remotesensing 15 02415 g009
Table 1. Properties of the TerraSAR-X datasets [28].
ParametersDescription
Product TypeSLC
Imagine ModeStripmap
Operating BandX
Wavelength (cm)3.1
PolarizationHH
Orbit directionAscending
Spatial resolution (m)3
No. of images48
Time range18 February 2015–31 October 2019
Table 2. Properties of the Landsat datasets.
Image NumberSatelliteAcquisition DateCloudiness (%)Spatial Resolution
1Landsat 117 October 19735.0060 m
2Landsat 43 July 19896.0060 m
3Landsat 52 April 199928.0030 m
4Landsat 522 February 200829.0030 m
5Landsat 85 November 202022.2130 m
Table 3. Comparison of PS-InSAR and GPS results.
GPS StationN (mm/y)E (mm/y)U (mm/y) V G P S L O S (mm/y) V I n S A R L O S (mm/y)Difference (mm/y)
SNPT−0.01−0.94−0.30−0.650.43−1.07
SNUS0.430.14−3.37−3.062.23−5.29
SRPT−0.210.13−1.59−1.39−0.91−0.48
Disclaimer/Publisher’s Note: The statements, opinions and data contained in all publications are solely those of the individual author(s) and contributor(s) and not of MDPI and/or the editor(s). MDPI and/or the editor(s) disclaim responsibility for any injury to people or property resulting from any ideas, methods, instructions or products referred to in the content.

