Article

Impact of Urbanization on Regional Rainfall-Runoff Processes: Case Study in Jinan City, China

1
Key Laboratory of Water Cycle & Related Land Surface Processes, Institute of Geographic Sciences and Natural Resources Research, Chinese Academy of Sciences, Beijing 100101, China
2
University of Chinese Academy of Sciences, Beijing 100049, China
3
State Key Laboratory of Water Resources & Hydropower Engineering Sciences, Wuhan University, Wuhan 430072, China
4
Beijing Key Laboratory of Urban Hydrological Cycle and Sponge City Technology, College of Water Sciences, Beijing Normal University, Beijing 100875, China
5
Key Laboratory of Ecosystem Network Observation and Modeling, Institute of Geographic Sciences and Natural Resources Research, Chinese Academy of Sciences, Beijing 100101, China
*
Author to whom correspondence should be addressed.
Remote Sens. 2023, 15(9), 2383; https://doi.org/10.3390/rs15092383
Submission received: 9 March 2023 / Revised: 28 April 2023 / Accepted: 28 April 2023 / Published: 1 May 2023

Abstract

:
Rapid urbanization has altered the regional hydrological processes, posing a great challenge to the sustainable development of cities. The TVGM-USWM model, a new urban hydrological model considering the nonlinear rainfall-runoff relationship and the flow routing in an urban drainage system, was developed in this study. We employed this model in the Huangtaiqiao drainage basin of Jinan City, China, and examined the impact of land cover changes due to urbanization on rainfall-runoff processes. Two urbanization scenarios were set up in the TVGM-USWM model during the design rainfall events with different return periods. Results showed that (1) the TVGM-USWM model demonstrated good applicability in the study area, and the RNS values of the flood events are all greater than 0.75 in both calibration and validation periods; (2) the proportion of impervious areas increased from 44.65% in 1990 to 71.00% in 2020, and urbanization played a leading role in the process of land cover change and manifested itself as a circular extensional expansion; and (3) urbanization showed a significant amplifying effect on the design flood processes, particularly for relatively big floods with small frequency, and the impact of urbanization on the time-to-peak of the design flood gradually decreased as the frequency of the design rainfall decreased. The results of this study can provide technical support for flood mitigation and the construction of a sponge city in Jinan City.

Graphical Abstract

1. Introduction

With the rapid development of society and economics during the past decades, a series of urban environmental problems, such as water scarcity, non-point source pollution and urban flooding, seriously threaten human security and pose a great challenge to the sustainable development of urban areas in China [1,2]. Approximately 55 percent of the world’s population lived in urban areas in 2018, and this figure is expected to rise to 68 percent by 2050 [3]. The regional hydrological cycle, an essential factor in flood management, has been significantly and profoundly affected by rapid urbanization and climate change, which may lead to more intensive precipitation extremes and severe disasters in the near future [4,5]. Flood scenarios (i.e., urbanization level and future climate) and flood risk reduction measures should be considered in the case of unknown future conditions and potential damages [6]. Several attempts have been made to tackle surface water flooding, such as the sponge city initiative in China, which supports decision making to improve urban water management and develop flood assessment frameworks [7,8]. Understanding the hydrological impacts of urban expansion is critical for urban planning and sustainable development to reduce flood risk and inform decision making.
Land cover, a fundamental parameter for environmental and ecological modeling, is crucial for the study of water balance, carbon cycle, food security and resource management [9,10,11]. Although satellite remote sensing and the Google Earth Engine have promoted powerful land cover monitoring to obtain pixel-wise image aggregations, the high-resolution continuous land cover data have seldom been explored in the existing research [12,13,14]. The dynamics of China’s land cover during 1985–2019 were investigated using CLCD, the fine-scale annual China land cover dataset, showing an increase in impervious surfaces (+148.71%) and water (+18.39%), a growth in forests (+4.34%), and a reduction of cropland (−4.85%) and grassland (−3.29%) [15]. Many researchers have studied the impact of the underlying surface condition, an important factor in the formation of floods, on hydrological responses, and the results showed that urbanization accelerated the confluence and increased surface runoff to a different degree [16,17]. Early research related urbanization to urban inundation, mainly using historical records from hydrological and meteorological stations, and complicated flood models have been widely applied with the dramatic improvement in computing power [18,19]. Based on long-term records, paved impervious materials are universally recognized as having a profound effect on the hydrological regime, such as blocked natural infiltration, greater magnitude of discharge and frequent recurrence of flood events, with artificial and natural conveyance routes complicating the hydrological response [20,21].
In recent years, the urban built-up area continued to expand, with the urbanization rate reaching 60.6% in 2019, altering the interception effect and infiltration capacity of the underlying surface as well as causing biochemical changes in the local environment [22,23]. During heavy rainfall, the free flow of the underground pipeline network is overloaded and backs up in the sewer inlets, resulting in waterlogging on the ground [24,25]. The safety of life and property and the living environment are affected by urban flooding/waterlogging, which is more complex and less predicted than that in the past [26,27]. It was reported that a flood disaster in Beijing in July 2012 severely disrupted the normal lives of citizens, resulting in 79 deaths, varying degrees of waterlogging on the streets and an estimated economic loss of CNY 11.64 billion [28]. In China, hundreds of densely populated cities experienced street flooding in recent decades, exposing millions of people in urban areas to severe disasters, especially during the monsoon season [29,30,31]. Although urban managers have attempted to predict and mitigate flooding, it is not practical to eliminate the risk due to various hydrological and hydraulic processes (i.e., heterogenous rainfall, complex topography and flow exchange between drainage networks) and the difficulty of accessing timely and high-resolution flood information [32,33]. It is essential to couple the discharge simulation, an important boundary condition in numerical drainage calculations, in both the natural river system and the pipeline network, where only a few models can accurately describe the hydrodynamic interaction [34,35].
Hydrological modeling in urban and peri-urban basins is a useful tool to understand and analyze increasing urban flooding, as well as help managers to make decisions [36,37]. The one-dimension or two-dimension hydrodynamical models can simulate flood depth, duration and associated hazards in urban areas as well as the benefits of green infrastructure [38]. SWMM, a typical one-dimensional urban hydrological model, can efficiently simulate the runoff generation and pipe flow processes, demonstrating good performance in urban areas [39,40]. The MIKE-Urban can model one-dimensional water movement in the pipeline network, while the MIKE-Flood is able to simulate the surface water distribution by solving a two-dimensional shallow water equation [41,42]. The InfoWorks ICM provides 1D sewer flow modeling and 2D surface water simulation, linking the pipeline network to the natural river system [43,44]. In addition to the difficulty of accessing detailed hydrological and hydraulic data, the urban flood modeling is complicated due to the specific hydrological processes, the heterogeneous nature of the underlying surface, and the complex connectivity between the overland surface and the sewer system in complex urban environments [45,46]. In line with the principle of ‘fit for purpose model’, we should be practical in our choice of an urban flood model that will perform the desired simulation with the required accuracy and within a reasonable time and computational load [47,48]. In order to improve simulation accuracy and computational efficiency, several efforts are essential, such as model simplification (i.e., simplifying the model structure and drainage networks), detail reduction (i.e., using lower resolution topographic data and larger time steps) and maximum utilization of computing resources (i.e., using graphics processing units and parallel computing) [49,50]. A distributed rainfall-runoff model provides the ability to manipulate temporal and spatial physical changes in the underlying surface, and it is typically used to investigate the impact of progressive urban development, particularly impervious cover, on the basin’s response to storm events over a period of time [51,52]. In most urban hydrological models, only the infiltration excess is considered in the runoff generation, whereas both infiltration excess and saturation excess runoff can occur in pervious areas [53,54,55]. The use of infiltration excess modeling may not accurately represent the rainfall-runoff relationship in urban areas with complex topography. The TVGM-USWM model is based on the time variant gain model (TVGM), which can describe the nonlinear rainfall-runoff relationship and has achieved satisfactory flood simulation results [56,57,58,59]. However, the original TVGM does not take into account the flow routing in urban drainage systems. Therefore, compared with TVGM and most urban hydrological models, the TVGM-USWM model can better represent the rainfall-runoff relationship of pervious surfaces in urban areas with complex topography.
Rapid socio-economic advancement and urban sprawl have had a notable impact on the regional hydrological cycle [60]. The TVGM-USWM model can be used as a powerful tool in urban stormwater management. The main purposes are to (1) develop a new urban hydrological model that takes into account the nonlinear rainfall-runoff relationship and the flow routing in urban drainage systems; (2) analyze the spatio-temporal change in land cover, especially impervious surface, in the Huangtaiqiao drainage basin from 1990 to 2020; and (3) investigate the impact of land cover change due to urbanization on rainfall-runoff processes in the Huangtaiqiao drainage basin. This study is expected to provide new ideas for urban flood simulation and assist in decision making for disaster mitigation.

2. Material and Methodology

2.1. Urban Hydrological Model

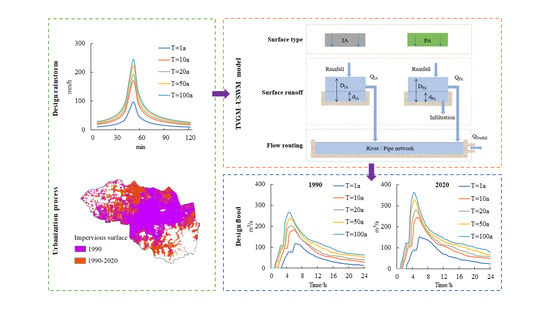
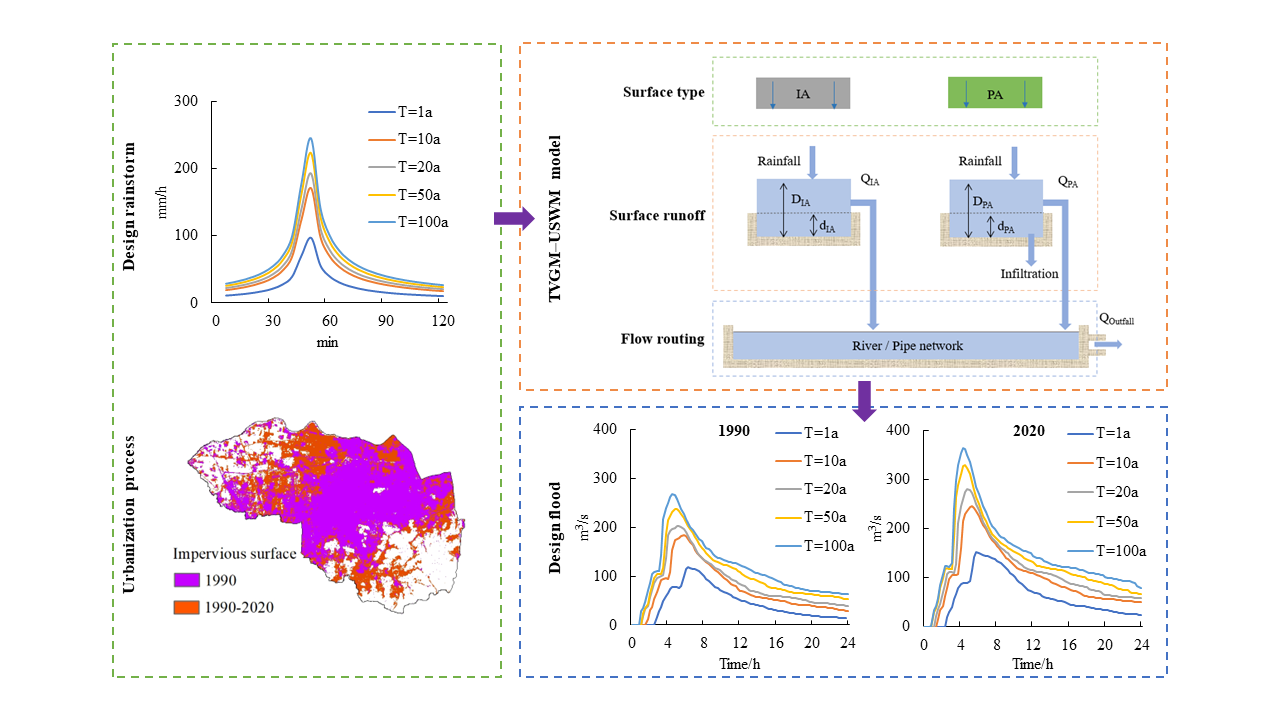
2.1.1. TVGM-USWM Model

The time variant gain model-urban storm water management (TVGM-USWM), a new distributed urban hydrological model that can describe the hydrological and hydraulic processes in urban areas, was developed in this study. The TVGM-USWM model, based on the time variant gain model (TVGM), considers nonlinear rainfall-runoff relationships and the flow routing in urban drainage systems. The TVGM-USWM model consists of two modules, the urban surface runoff module and the urban flow routing module, as shown in Figure 1. The sub-catchment can be classified into the impervious area (IA) and the pervious area (PA).
The runoff is considered to have linear relationship with the impervious area in a sub-catchment. The equation is expressed as follows:
R I A = P d I A P > d I A 0 P d I A
where RIA (mm) is the runoff yield of the impervious area. P (mm) is the rainfall. dIA (mm) is the depression storage depth of the impervious area.
The runoff is considered to have a nonlinear relationship with the pervious area. The equation is expressed as follows:
R P A = G × P d P A G × P > d P A 0 G × P d P A
G = g 1 ( W W m ) g 2 ( I I m ) g 3
where RPA (mm) is the runoff of the pervious area. G indicates the runoff coefficient of the pervious area. I (mm/h) and Im (mm/h) are the rainfall intensity and maximum rainfall intensity, respectively. g1 is the average runoff generation coefficient. g2 is the influence exponent of soil moisture. g3 is the influence exponent of rainfall intensity. g1, g2 and g3 are all in the range of 0 to 1. W (mm) and Wm (mm) are the soil field capacity and saturation moisture capacity, respectively. dPA (mm) is the depression storage depth of the pervious area.
In a sub-catchment, the total runoff can be expressed as follows:
R S = R I A × A I A A S + R P A × A P A A S
where RS (mm) is the total runoff yield of a sub-catchment. AS (km2) is the total area of a sub-catchment. AIA (km2) is the area of the impervious area. APA (km2) is the area of the pervious area.
For a flood event, the initial soil moisture is computed by
P a ( t ) = K a ( P a ( t 1 ) + P ( t ) ) W i = m i n ( W m , P a )
where Pa(t) (mm) is the antecedent precipitation at time t. Wi (mm) is the initial soil moisture. Ka is the dimensionless recession parameter.
By modeling the sub-catchment as a nonlinear reservoir, the overland flow is simulated.
Q = 1.49 n × W × S 1 / 2 × ( d d S ) 5 / 3
where Q (m3/s) is the discharge flow rate. W (m) is the width. S is the average slope of the sub-catchment. n is the roughness coefficient of a surface. d (m) is the ponded water depth of a surface. dS (m) is the depression storage depth of a surface.
Dynamic wave is used for one-dimensional hydrodynamic modeling of unsteady free surface flow in channel and pipe networks. Dynamic wave solves the full form of Saint-Venant equations, coupling the solution for flow in pipes and water levels at nodes. Backwater effects, flow reversal and pressurized flow can be considered in the modeling. The conservation of mass and momentum can be defined as follows:
A t + Q x = 0
Q t + ( Q 2 / A ) x + g A H x + g A S f = 0
where A (m2) is the flow cross-sectional area. Q (m3/s) is the streamflow. H (m) is the water depth. g (m/s2) is the gravitational acceleration. x (m) is the distance. t (s) is the time. Sf is the friction slope.
The TVGM-USWM model parameters and their ranges for model calibration are listed in Table 1.

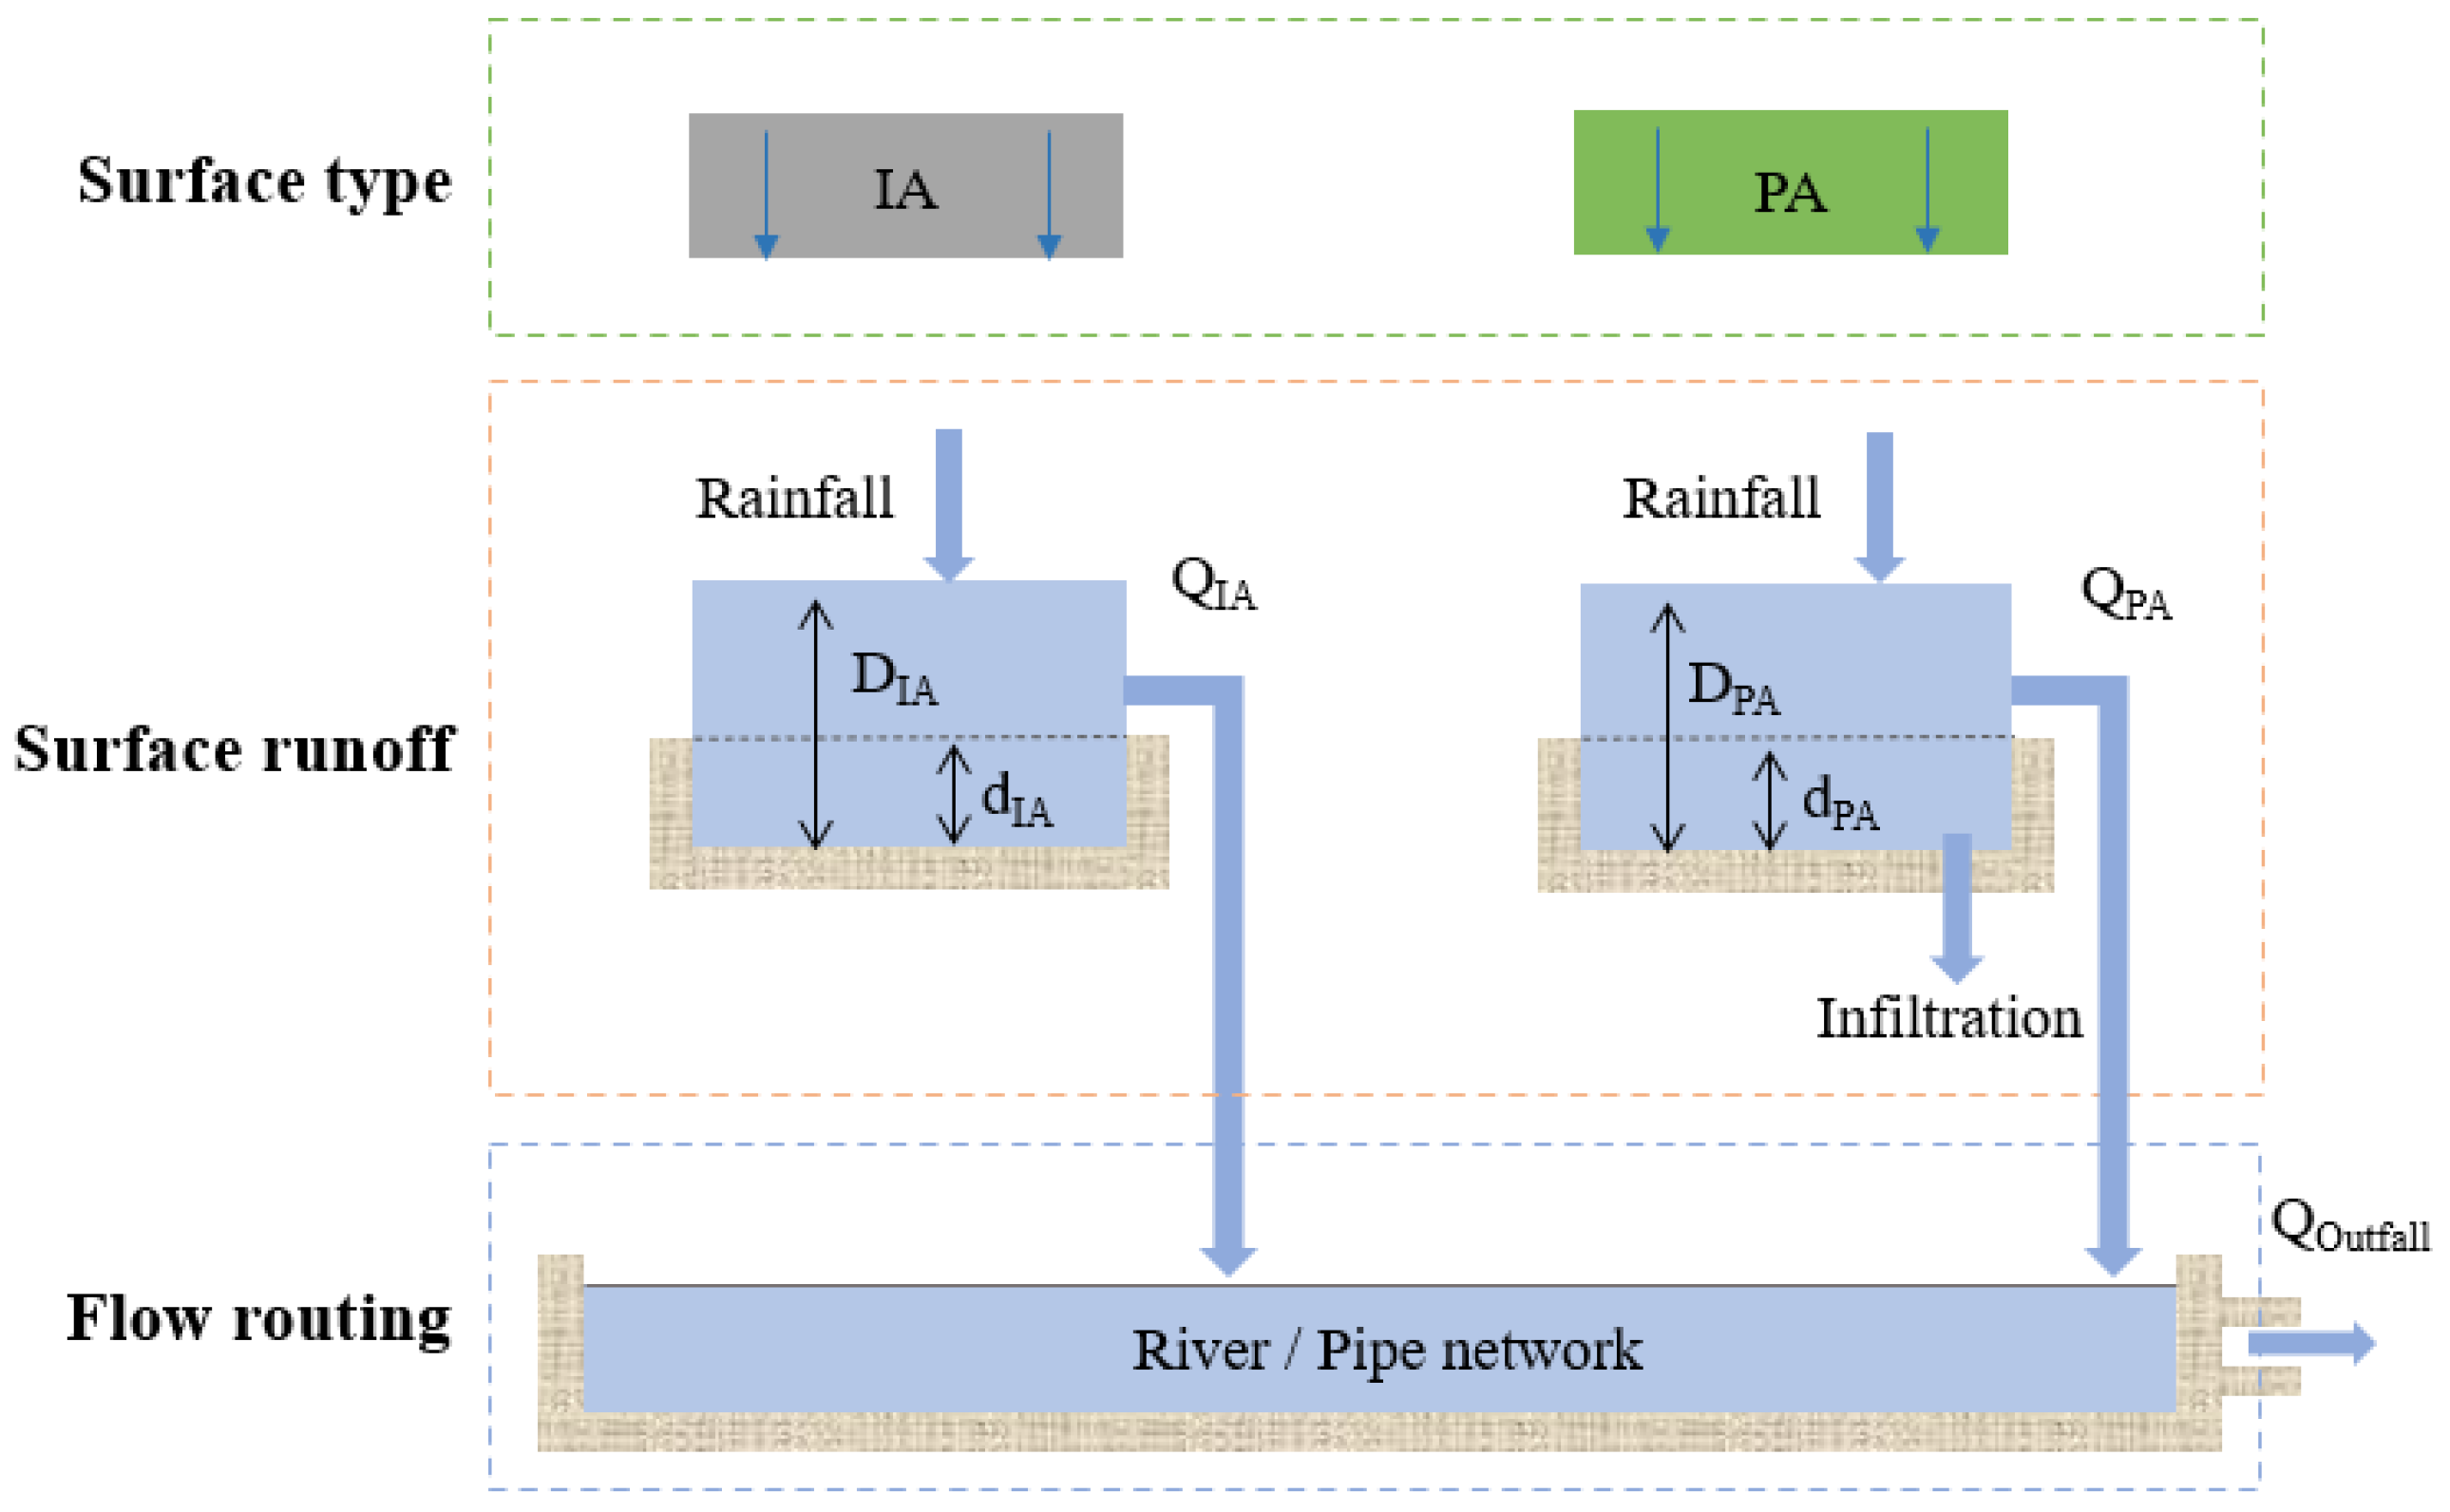
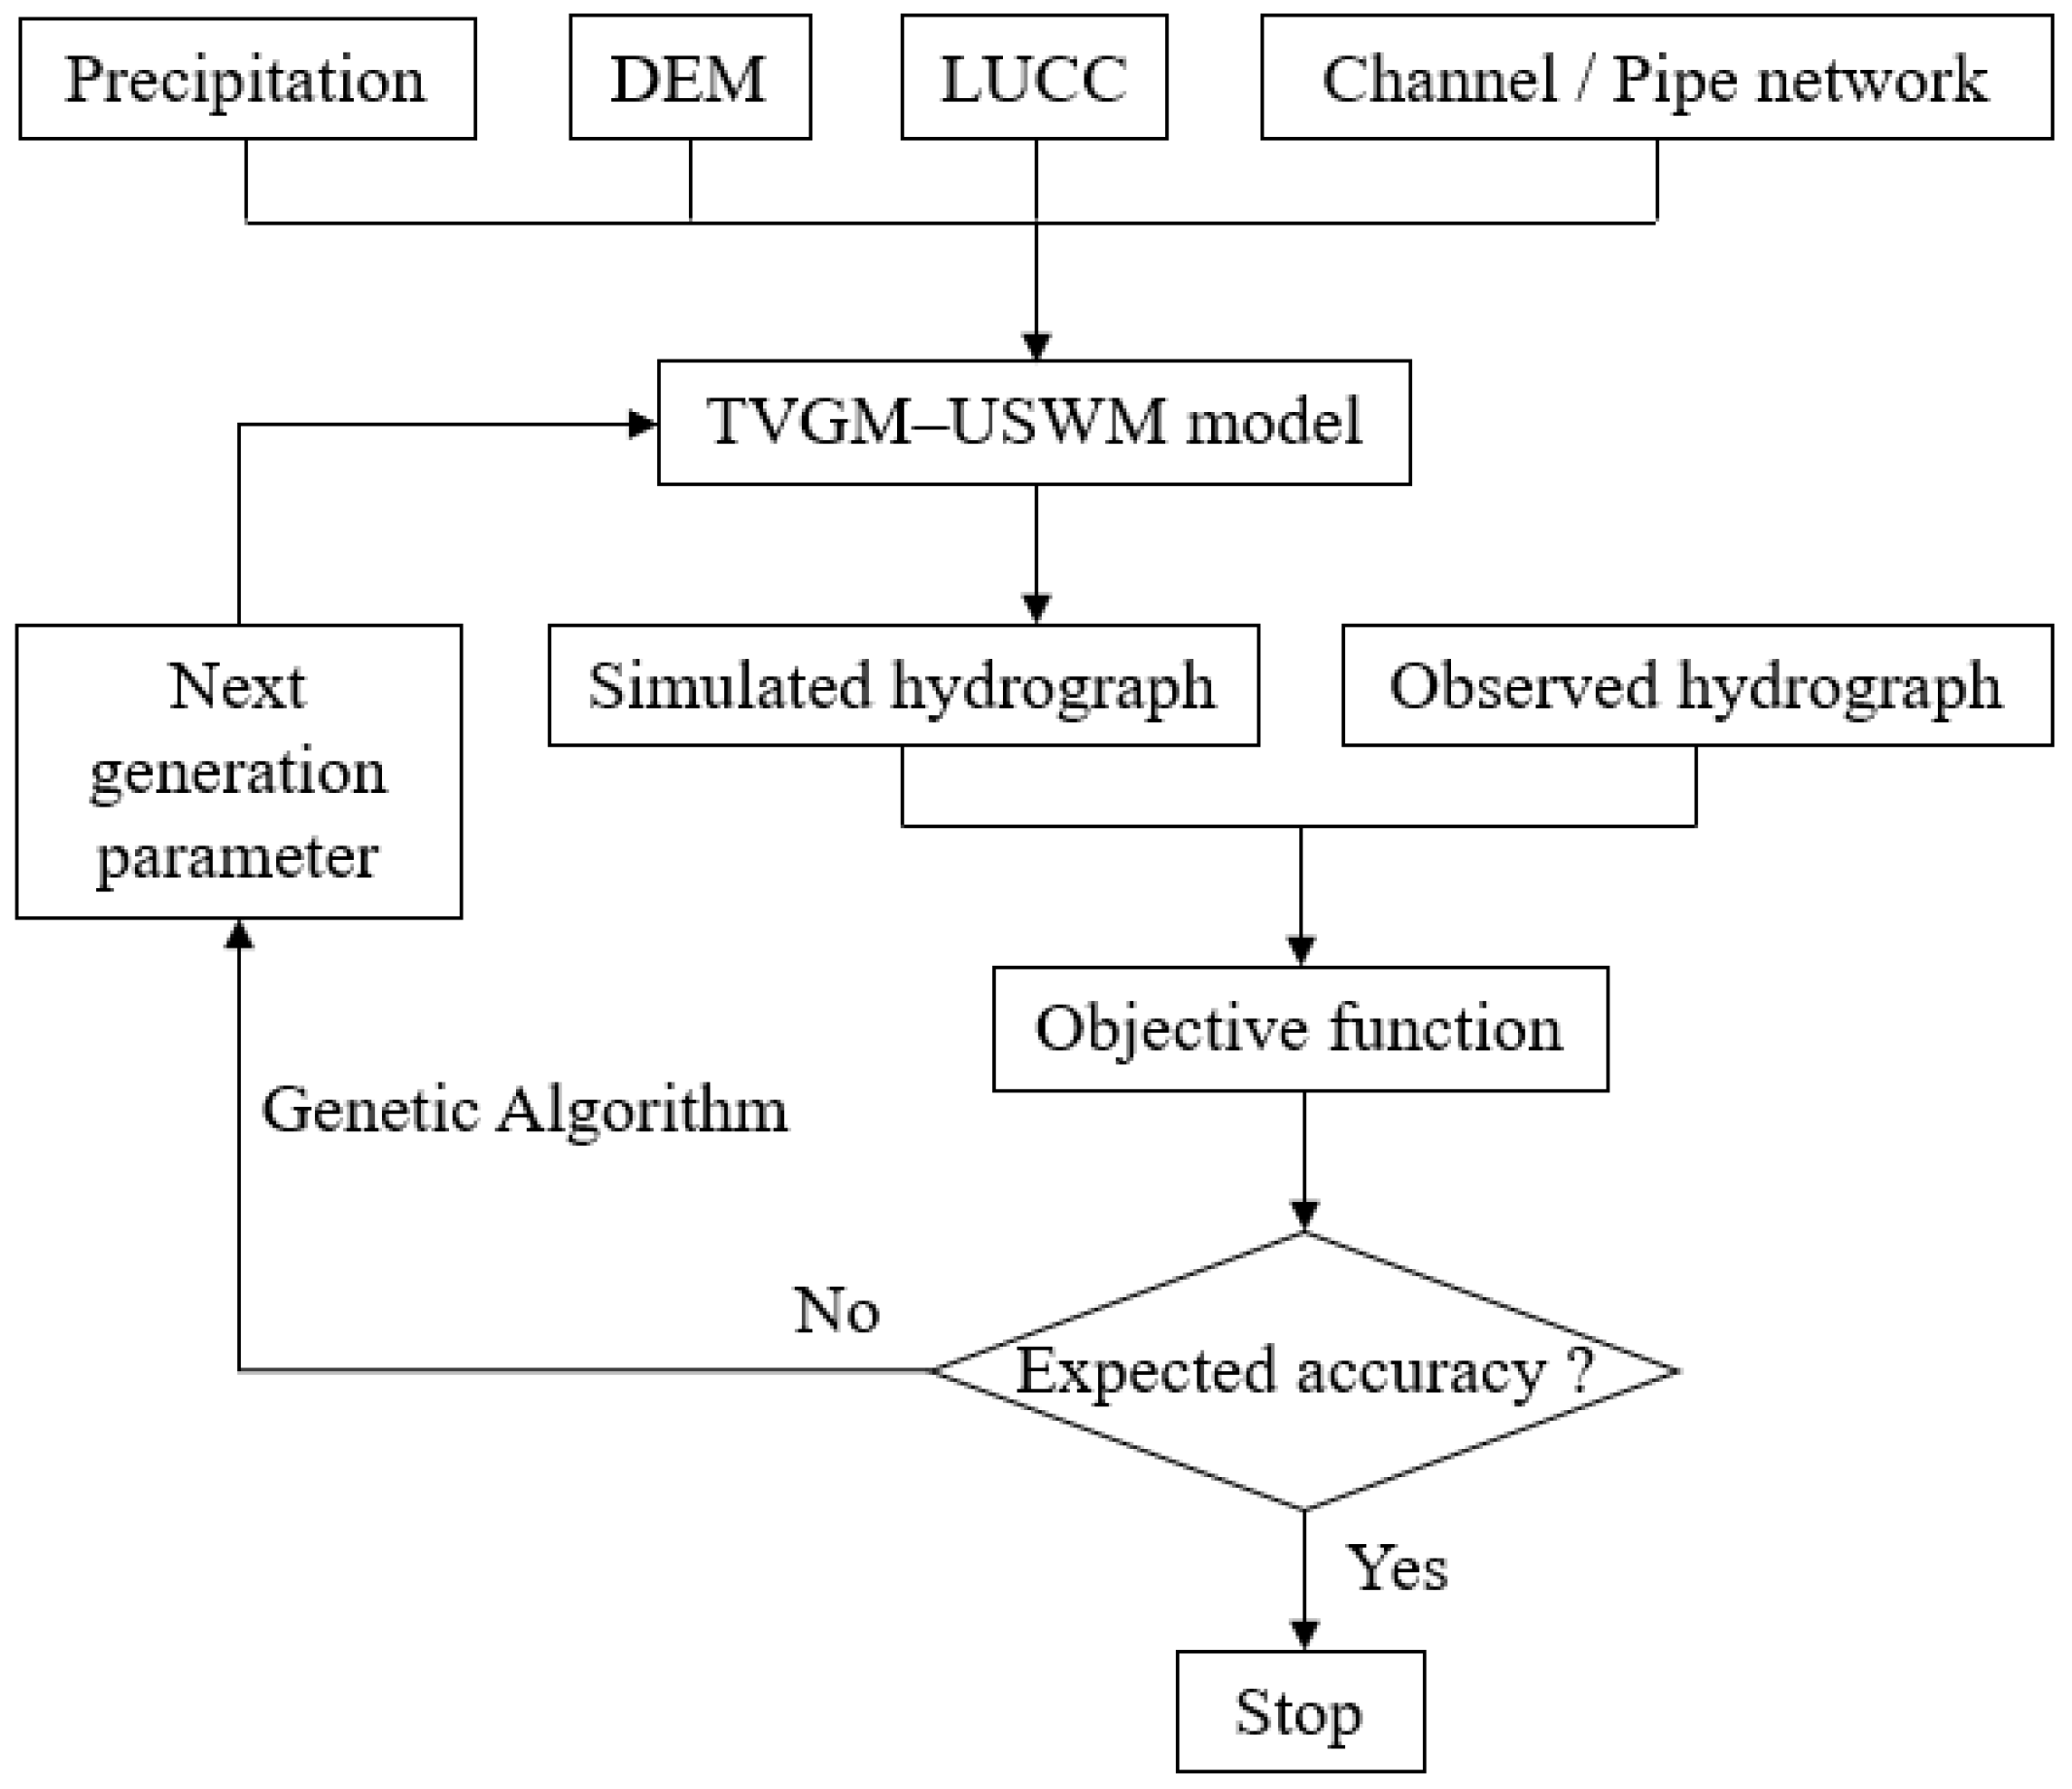
2.1.2. Model Parameter Optimization

The flood events were divided into two groups, with three floods being used for model calibration and the remaining three floods being used for model validation. During the calibration period, the genetic algorithm is used for the automatic optimization of sensitive parameters of the TVGM-USWM model. Nash-Sutcliffe efficiency (RNS) is selected as the objective function to optimize. The parameter optimization structure diagram of the TVGM-USWM model is shown in Figure 2.
In addition, the Nash-Sutcliffe efficiency (RNS), relative peak flow error (REP) and time-to-peak error (AET) were applied to assess the performance of the TVGM-USWM model in simulating flood events. The three evaluation criteria are indicated below:
R N S = 1 t = 1 N q t o b s q t s i m 2 t = 1 N q t o b s q ¯ o b s 2
R E P = q p o b s q p s i m q p o b s × 100 %
A E T = T p o b s T p s i m
where N represents the number of observed discharges. q t o b s (m3/s), q p o b s (m3/s) and T p o b s (0.5 h) denote the observed streamflow, observed peak flow and observed peak time, respectively. q t s i m (m3/s), q p s i m (m3/s) and T p s i m (0.5 h) are the simulated streamflow, simulated peak flow and simulated peak time, respectively. q ¯ o b s (m3/s) is the average value of q t o b s .

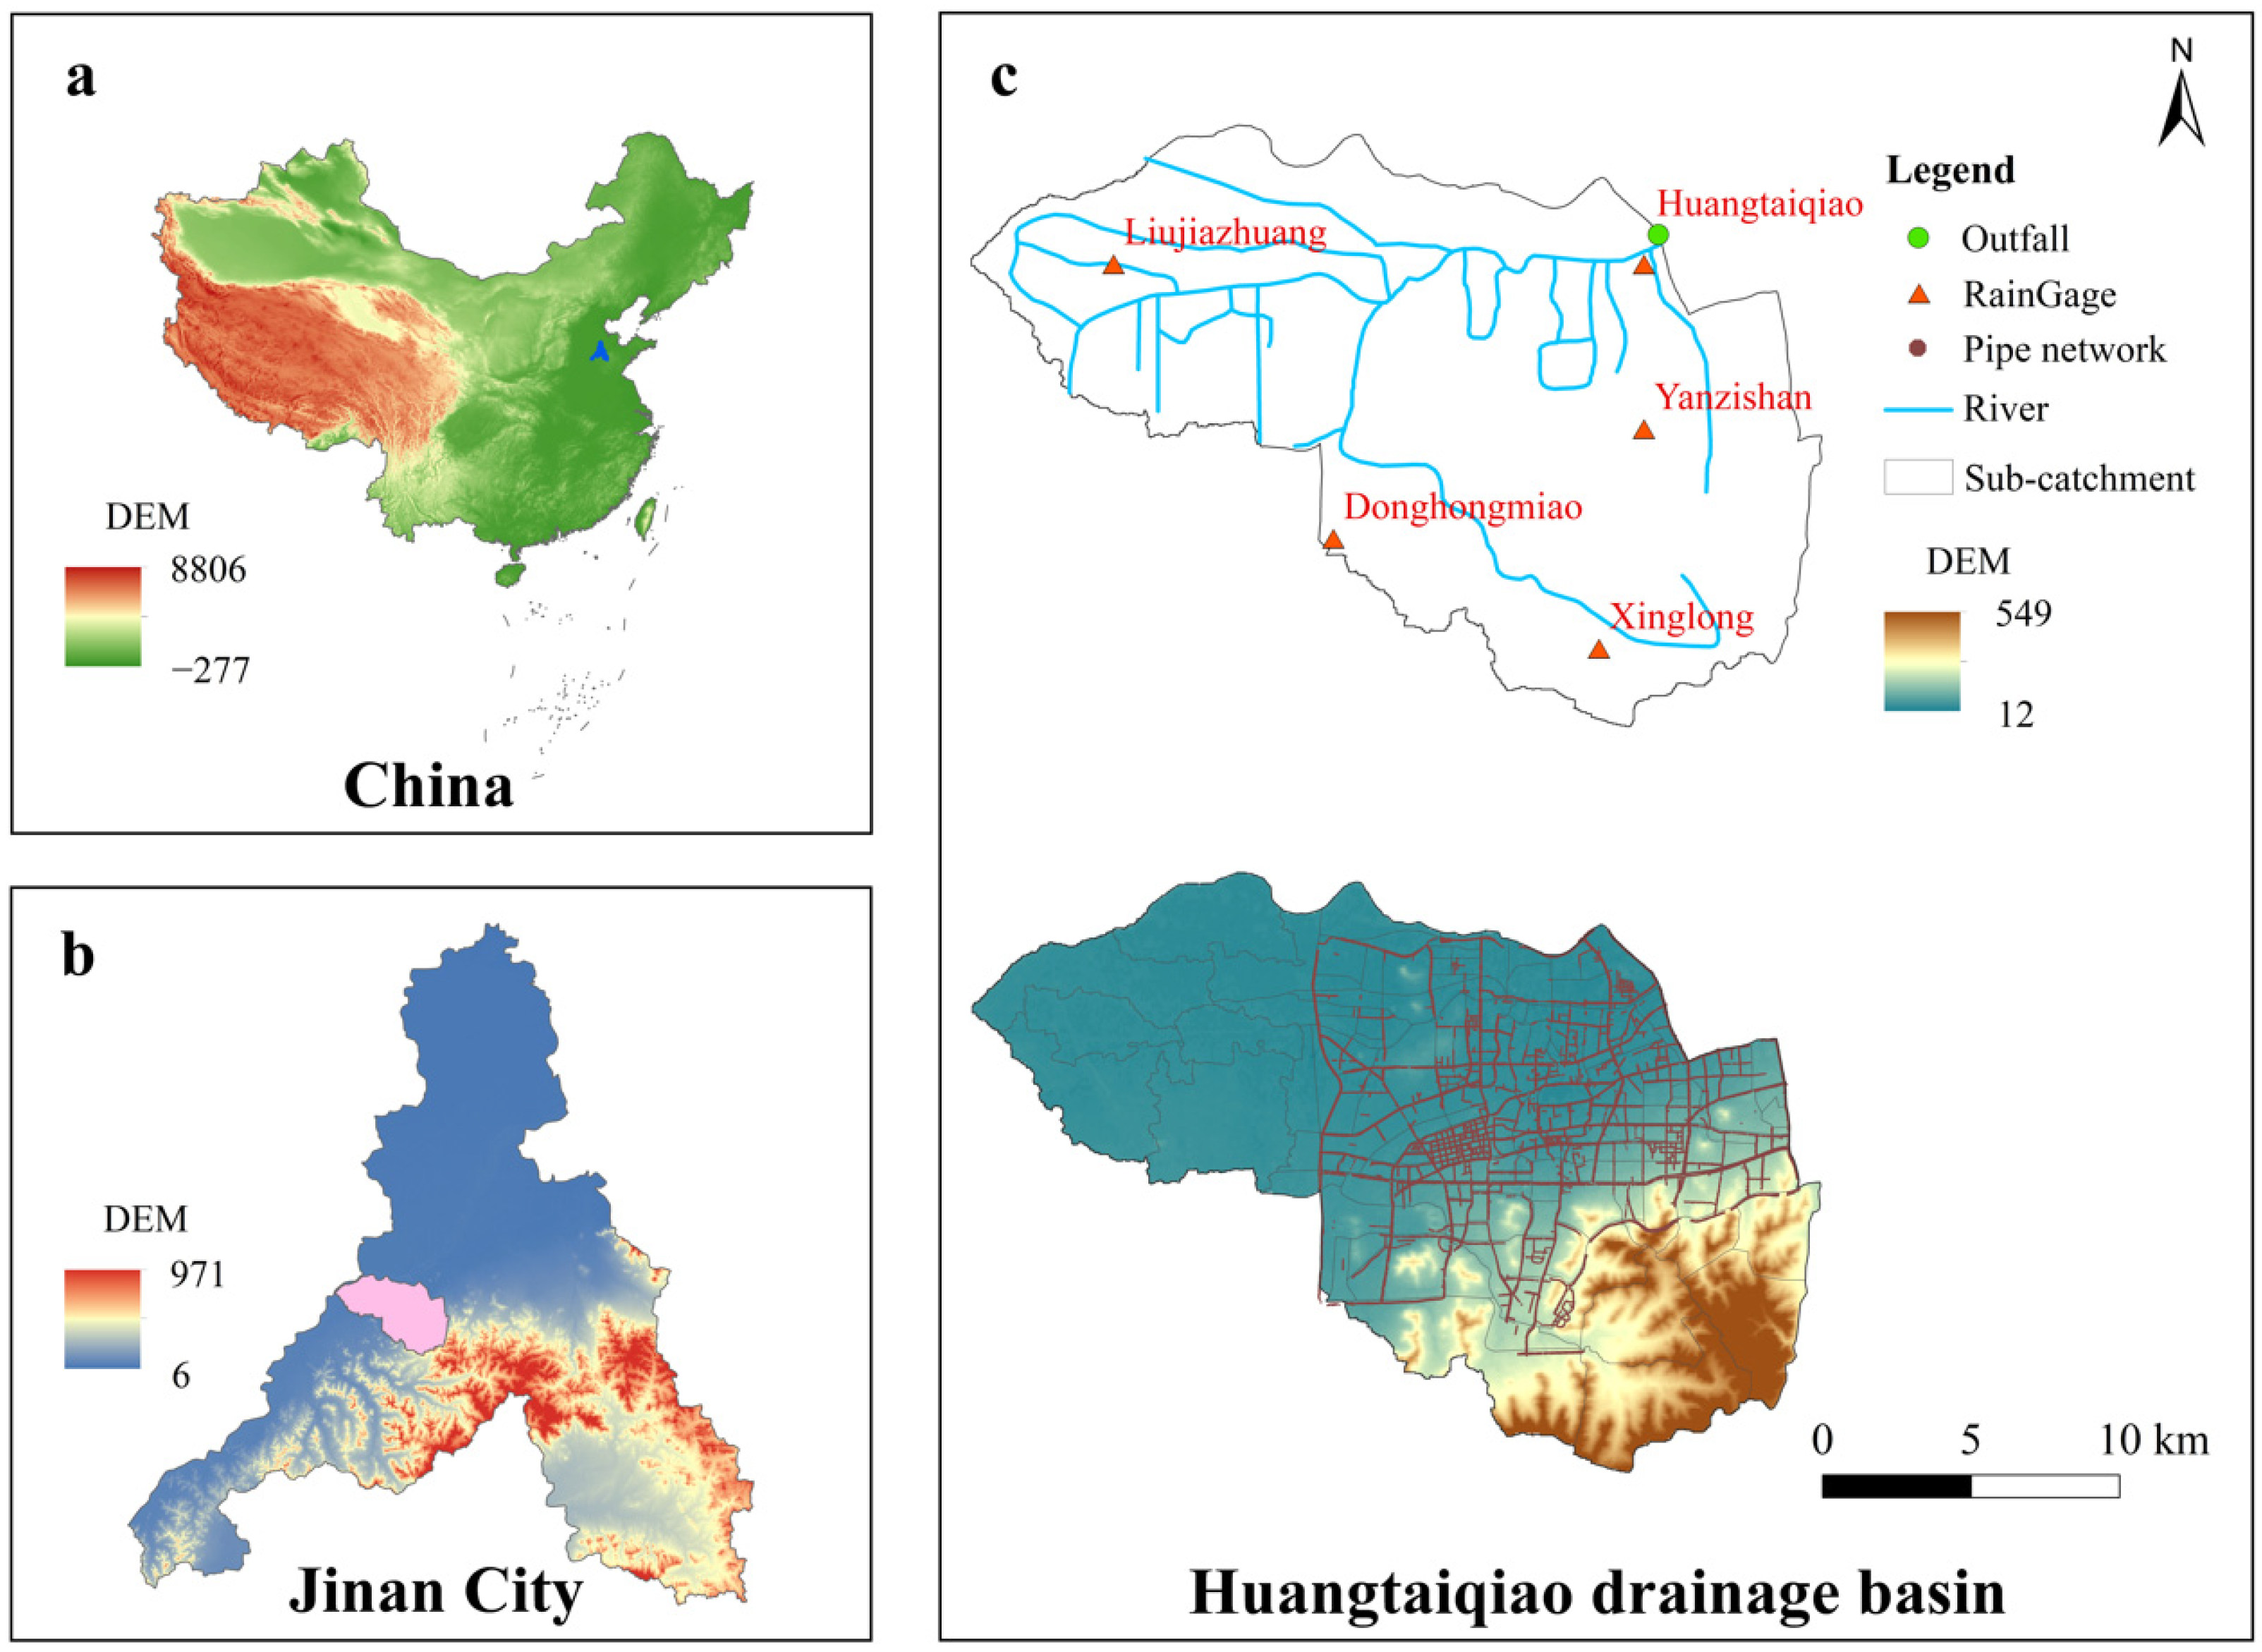
2.2. Study Area Description

The Huangtaiqiao drainage basin is located in Jinan City (116°11′–117°45′E, 36°02′–37°31′N), China, and its control area is about 326 km2, as shown in Figure 3. The study area consists of the main urban area, the western plain area and the southern mountainous area. The terrain is high in the south and low in the north, with an elevation range of 12–549 m. The river in the area is part of the Xiaoqing River, with the main channel of the Xiaoqing River and its tributaries. The tributaries on the south bank are rain-sourced mountain rivers with a plume-like distribution. The tributaries of the north bank are mainly irrigation channels.
Jinan City has a warm temperate continental monsoon climate, with cold winters and hot summers and simultaneous rain and heat. Rainfall is often unevenly distributed in both space and time, with short duration and high intensity. The drainage system in the old town, which is the main drainage channel in Jinan City, has small sections of drainage pipes that are prone to clogging and have limited drainage capacity. The main urban area has low infiltration and low natural capacity to store floodwater. During heavy rainfall, floodwater from the southern mountainous area can be released into the main urban area, which tends to rise sharply and fall slowly, increasing the risk of flooding in the city.

2.3. Data Description

The data required to develop the TVGM-USWM model include digital elevation model (DEM), land cover data, network of channels and pipes, hydrological data and meteorological data. DEM, using ASTER GDEM 30M, was obtained from the Geospatial Data Cloud (https://www.gscloud.cn, accessed on 25 December 2022). ArcGIS was employed to calculate topographic parameters, such as elevation and slope of the study area. Land cover data used the annual China land cover dataset (CLCD), which contains 30 m annual land cover in China from 1990 to 2019 (https://doi.org/10.5281/zenodo.4417810 (accessed on 25 December 2022). The imperviousness of each sub-catchment was calculated on the basis of land cover data. The network of channels and pipes, meteorological data and hydrological data were provided by the Jinan Hydrology Bureau. Five rain gauges with observed hourly rainfall data series are located in the basin. The sub-catchments controlled by each rain gauge were determined using the Thiessen polygon method. The hydrological station was located at the outlet of the basin, providing 30 min discharge data.
The Huangtaiqiao drainage basin was divided into 195 sub-catchments based on the topography and the urban drainage system. The urban drainage system was generalized based on the network of channels and pipes. The channel cross-section was set to a trapezoidal shape. The pipe cross-section was set to a circular shape. The dimensions of the channels and pipes were set in accordance with the measurement information.

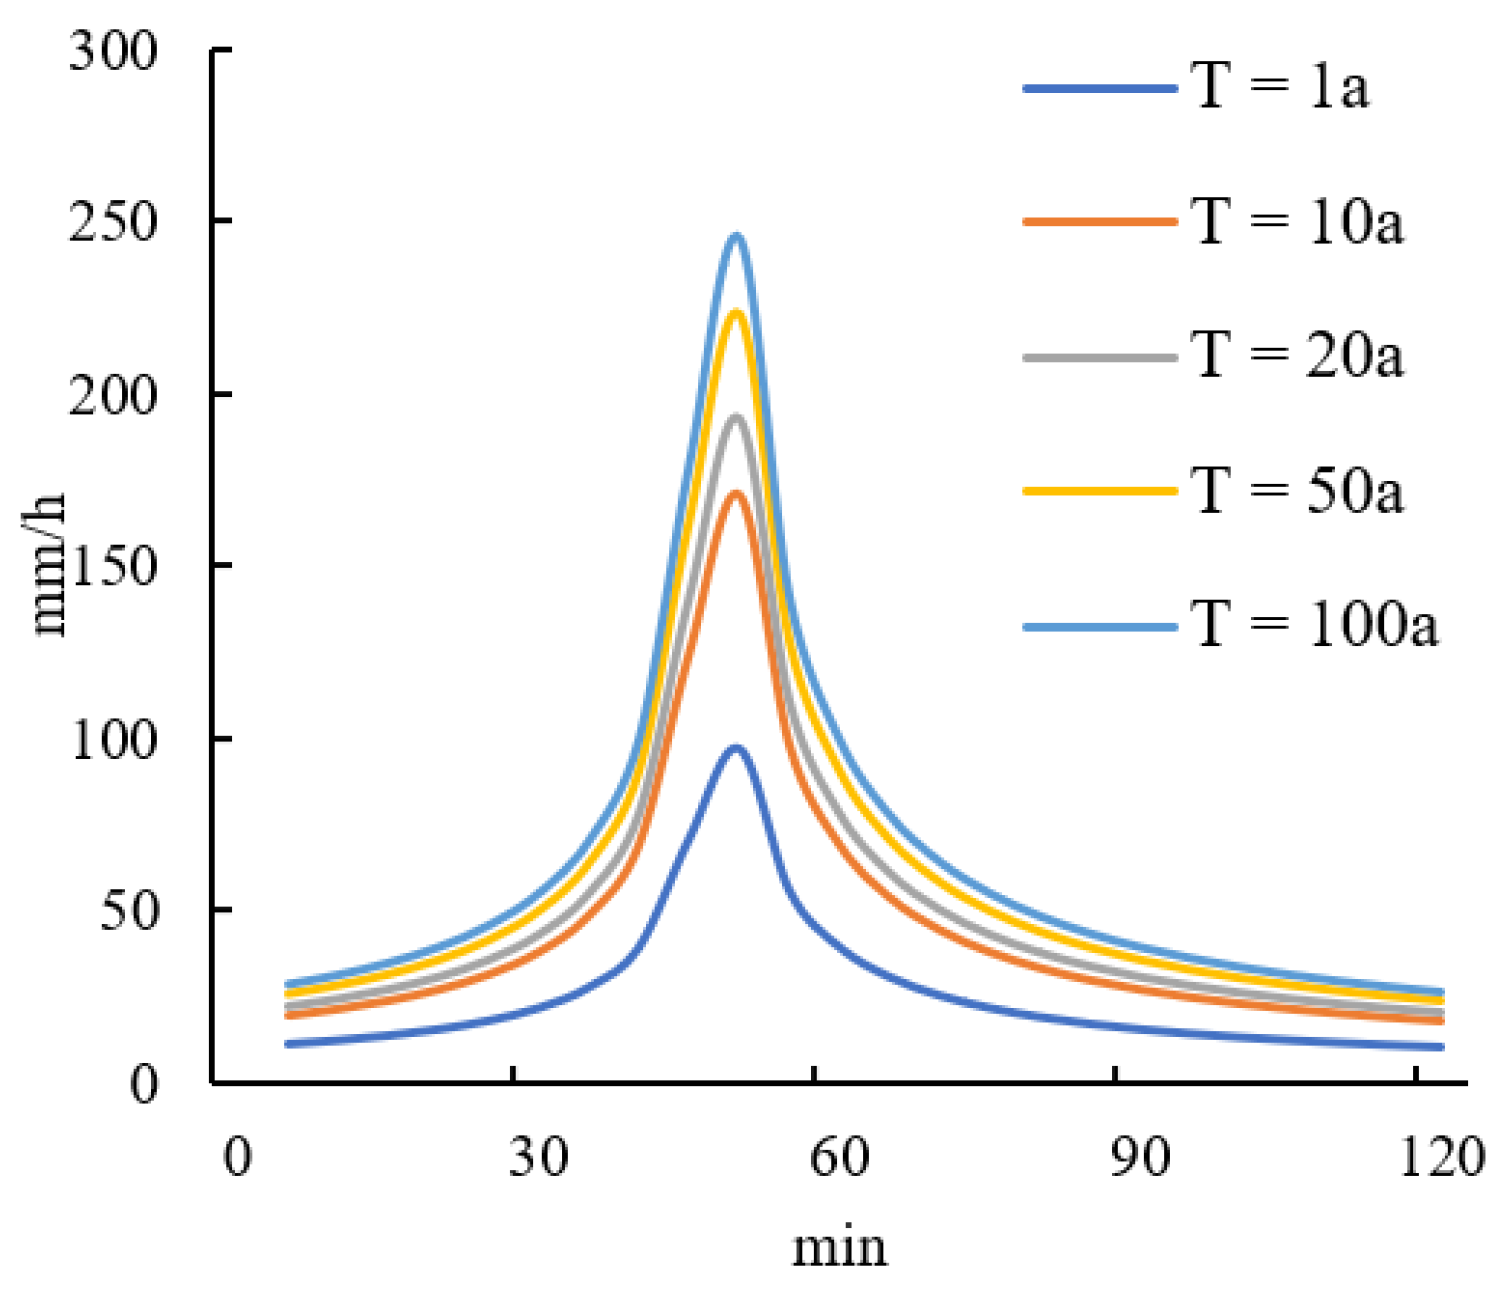
2.4. Design Rainstorm

The design rainfall intensity was calculated using the rainstorm intensity formula in Jinan City [61]. The Chicago rainfall pattern was adopted to distribute the rainfall of the design rainstorm, with a rainfall peak coefficient of 0.4 and a time step of 5 min [62]. The rainfall intensity is calculated as:
i = 11.197 ( 1 + 0.7673 lg T ) ( t + 11.0911 ) 0.6645
i a = a ( 1 c ) t a 1 r + b t a 1 r + b c + 1
i b = a ( 1 c ) t b r + b t b r + b c + 1
where i (mm/min) denotes the rainfall intensity. T(a) denotes the return period. t (min) denotes the duration of rainfall. ia (mm/min) denotes the rainfall intensity after the peak. ib (mm/min) denotes the rainfall intensity before the peak. ta (min) denotes the rainfall duration after the peak. tb (min) denotes the rainfall duration before the peak. r denotes the peak ratio. a, b and c are the parameters determined as follows:
a = 11.197(1 + 0.7673 1gT), b = 11.0911, c = 0.6645
The 120 min rainfall process in five return periods (T = 1a, T = 10a, T = 20a, T = 50a and T = 100a) was selected as the design rainstorm process. The design rainfall processes with different return periods are shown in Figure 4.

3. Results Analysis and Discussion

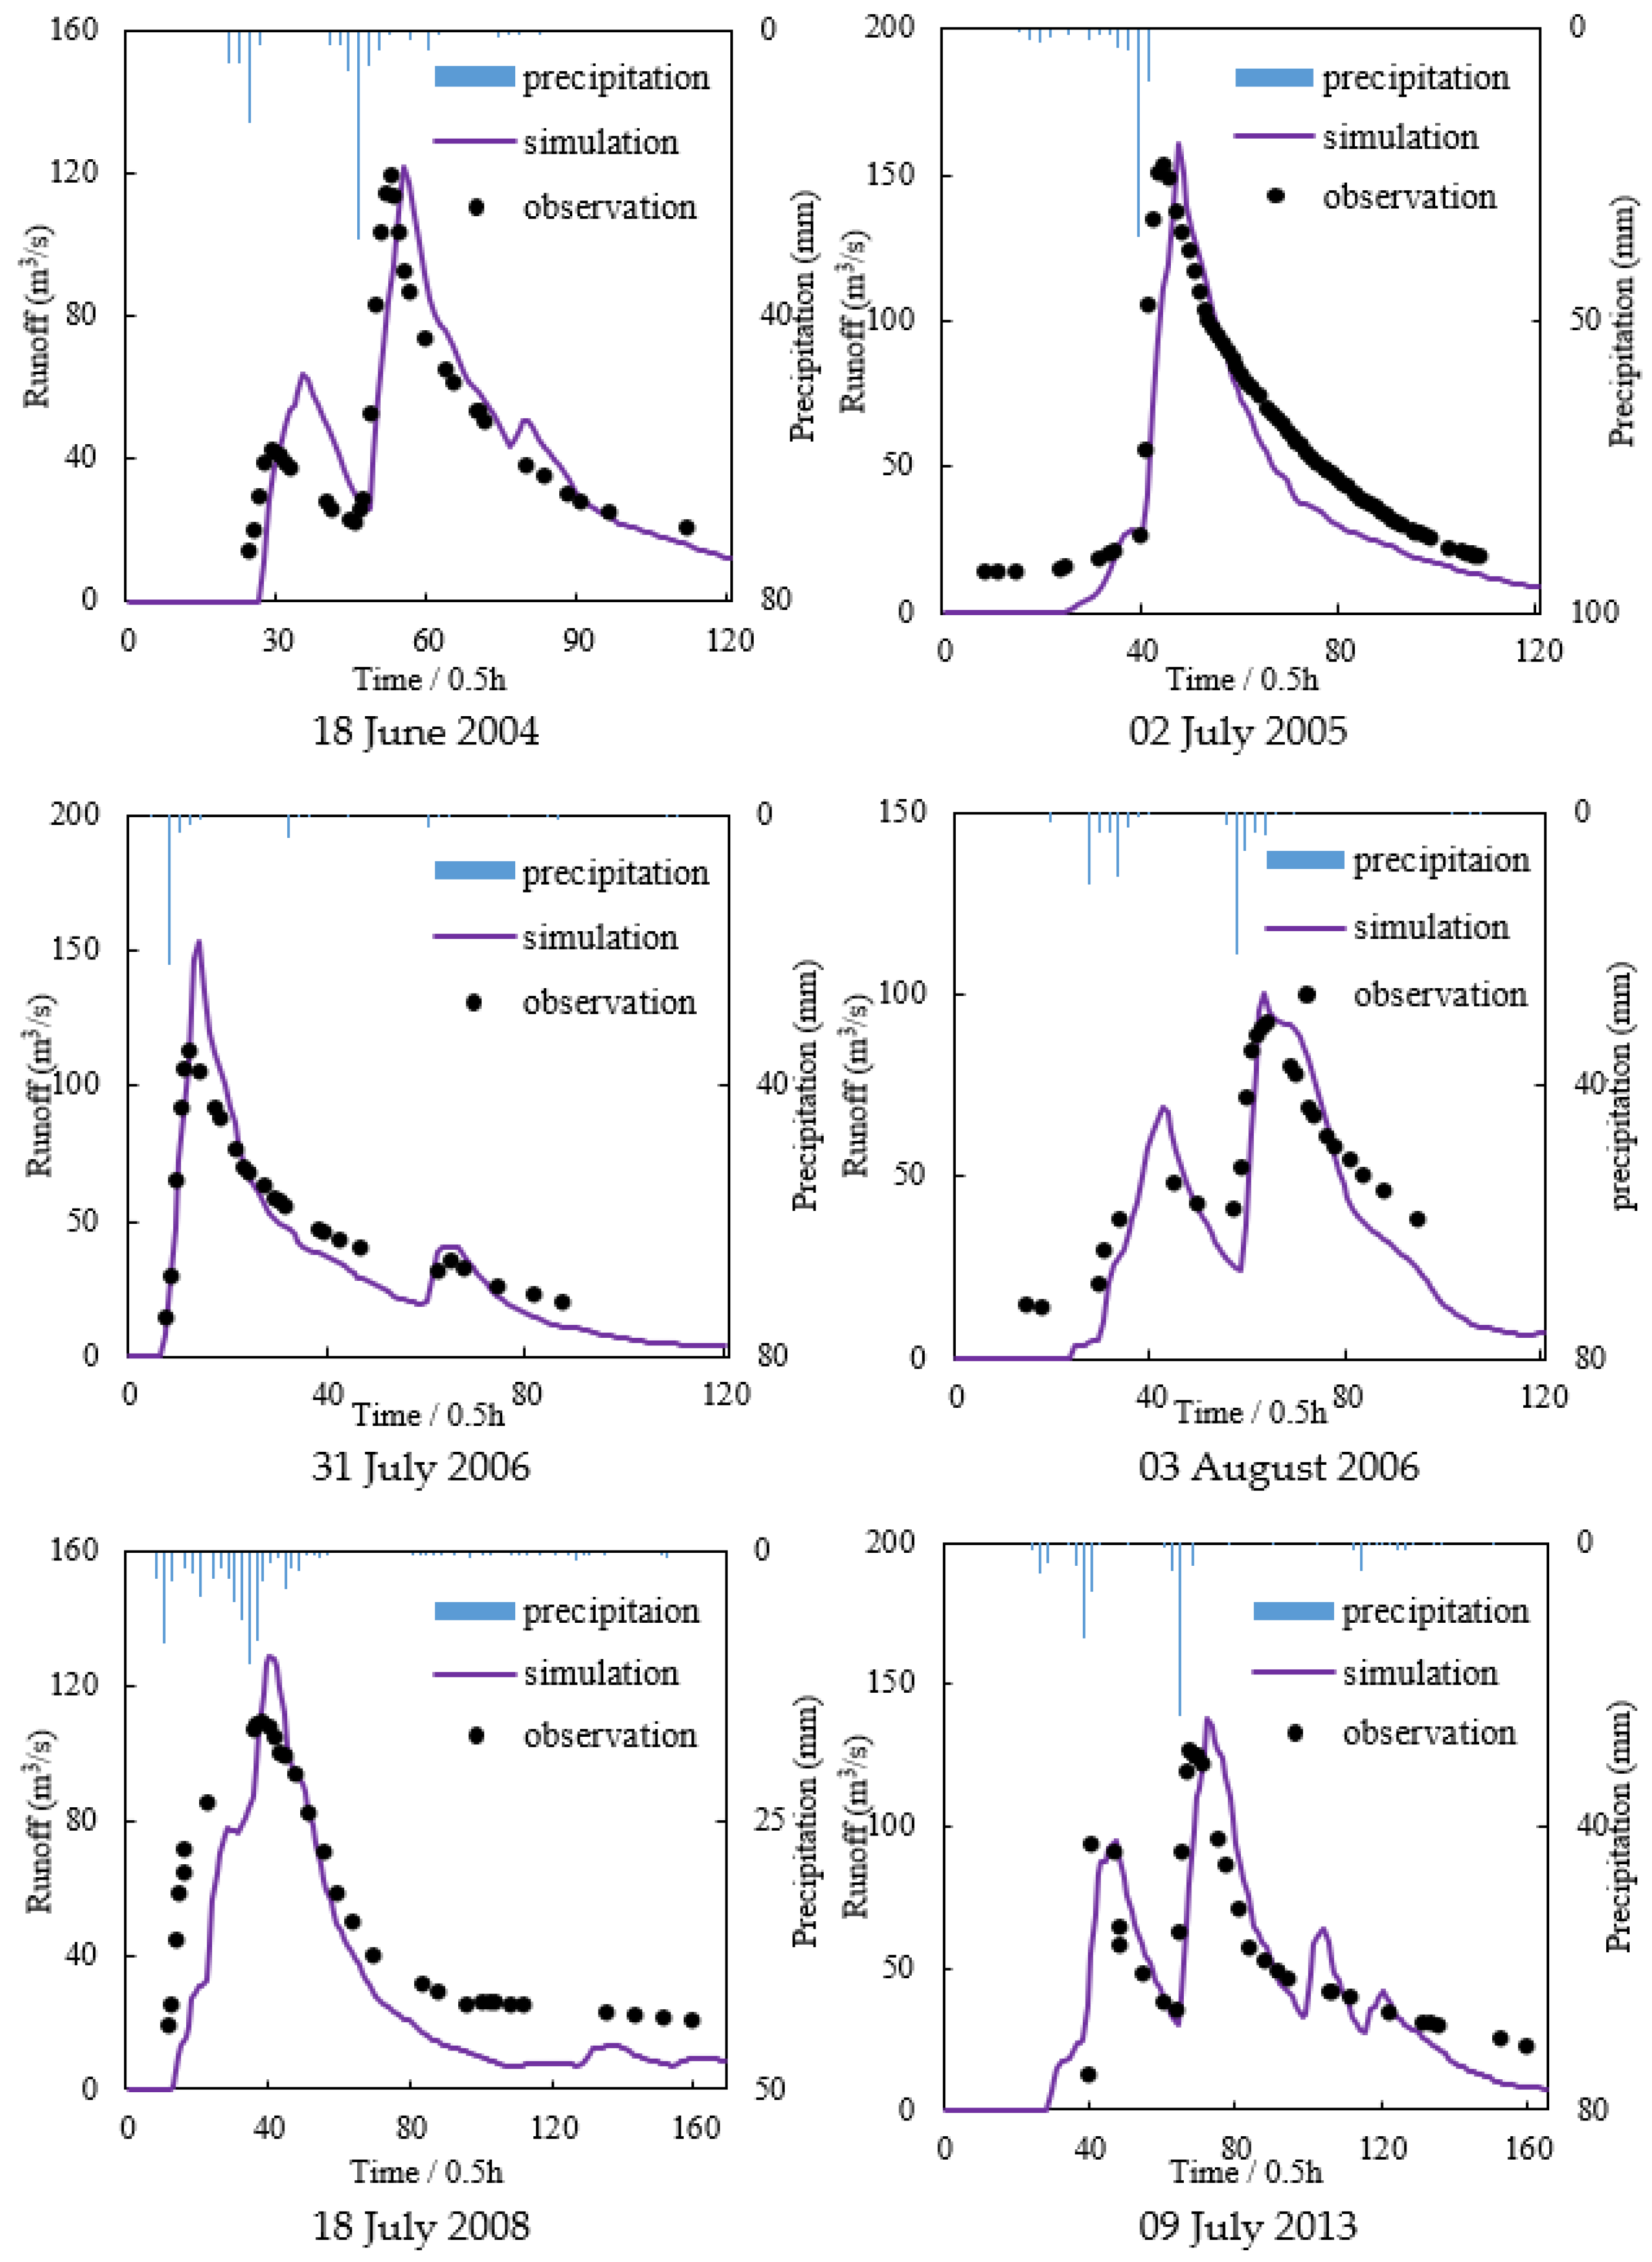
3.1. Model Calibration and Validation

In the study, the genetic algorithm was used to calibrate the sensitive parameters of the TVGM-USWM model. The Nash-Sutcliffe efficiency (RNS) was used as the objective function. The floods of 18 June 2004, 2 July 2005 and 3 August 2006 were selected for model calibration, and the floods of 31 July 2006, 18 July 2008 and 9 July 2013 were selected for model validation. Simulated versus observed flood hydrographs in the Huangtaiqiao drainage basin are shown in Figure 5.
The Nash-Sutcliffe efficiency (RNS), relative peak flow error (REP) and time-to-peak error (AET) were adopted to evaluate the performance of the flood simulation. The simulation performance of the flood events is shown in Table 2. In both the calibration and validation periods, the RNS values of the flood events are all above 0.75, with an average value of 0.85. The REP values are smaller than 17%, except for the 31 July 2006 flood event. The AET values are all within 1.5 h. The TVGM-USWM model demonstrated good applicability in the study area.

3.2. Impact of Urbanization on Rainfall-Runoff Processes

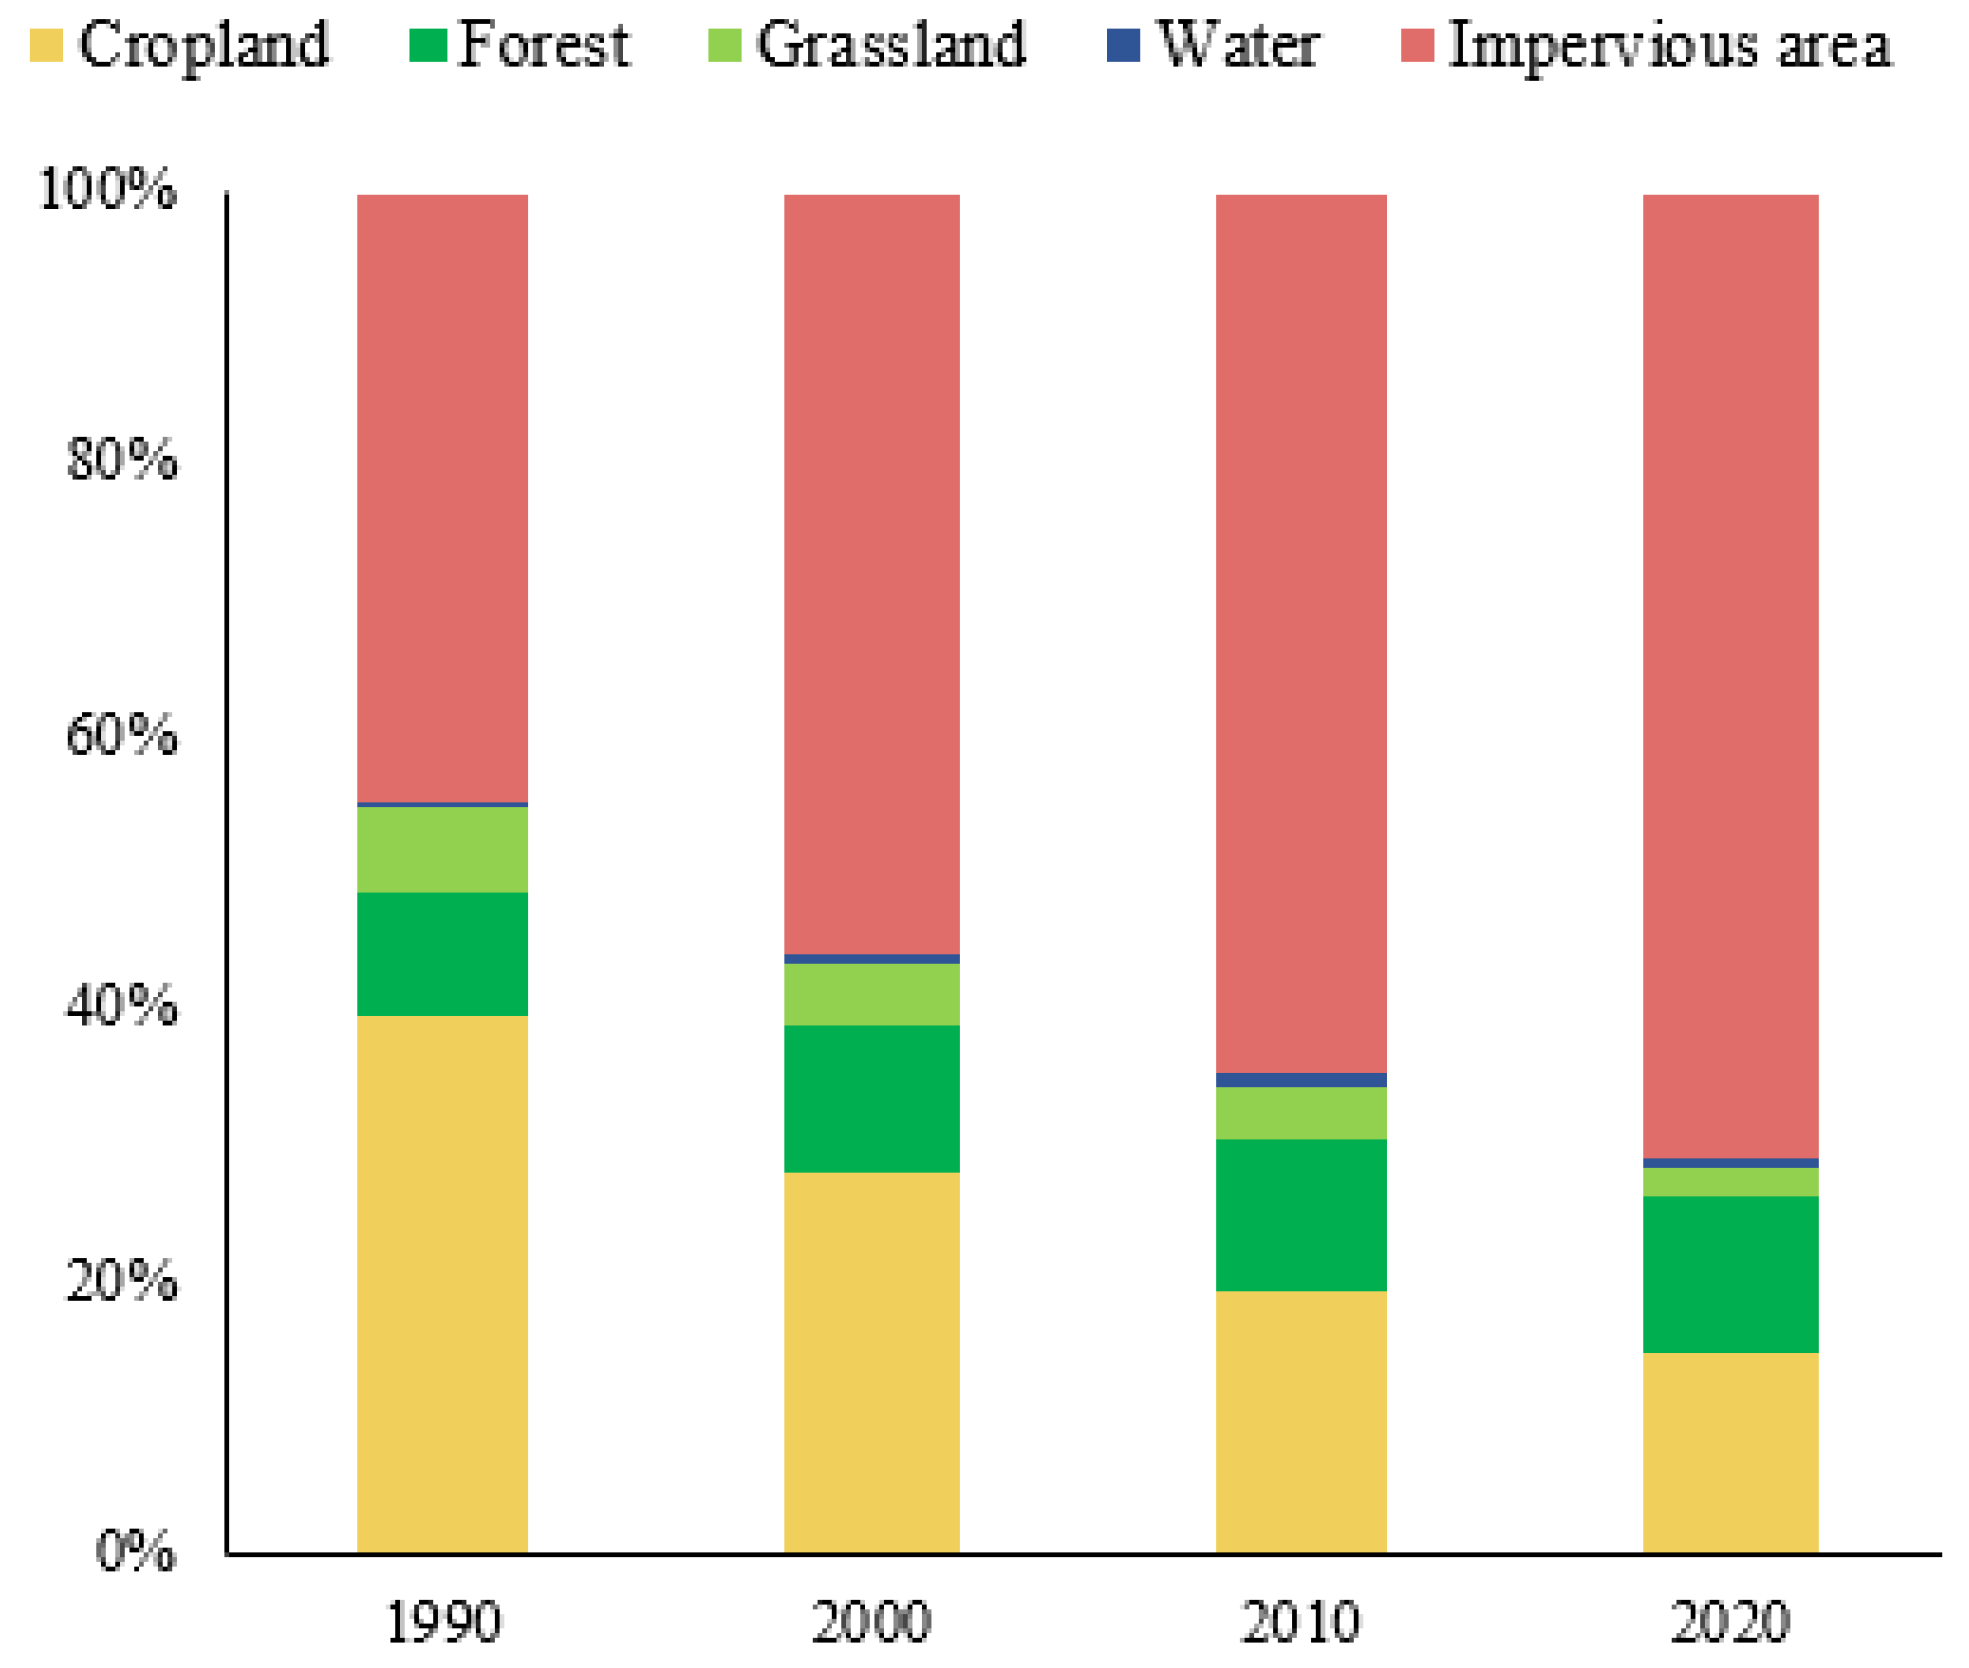
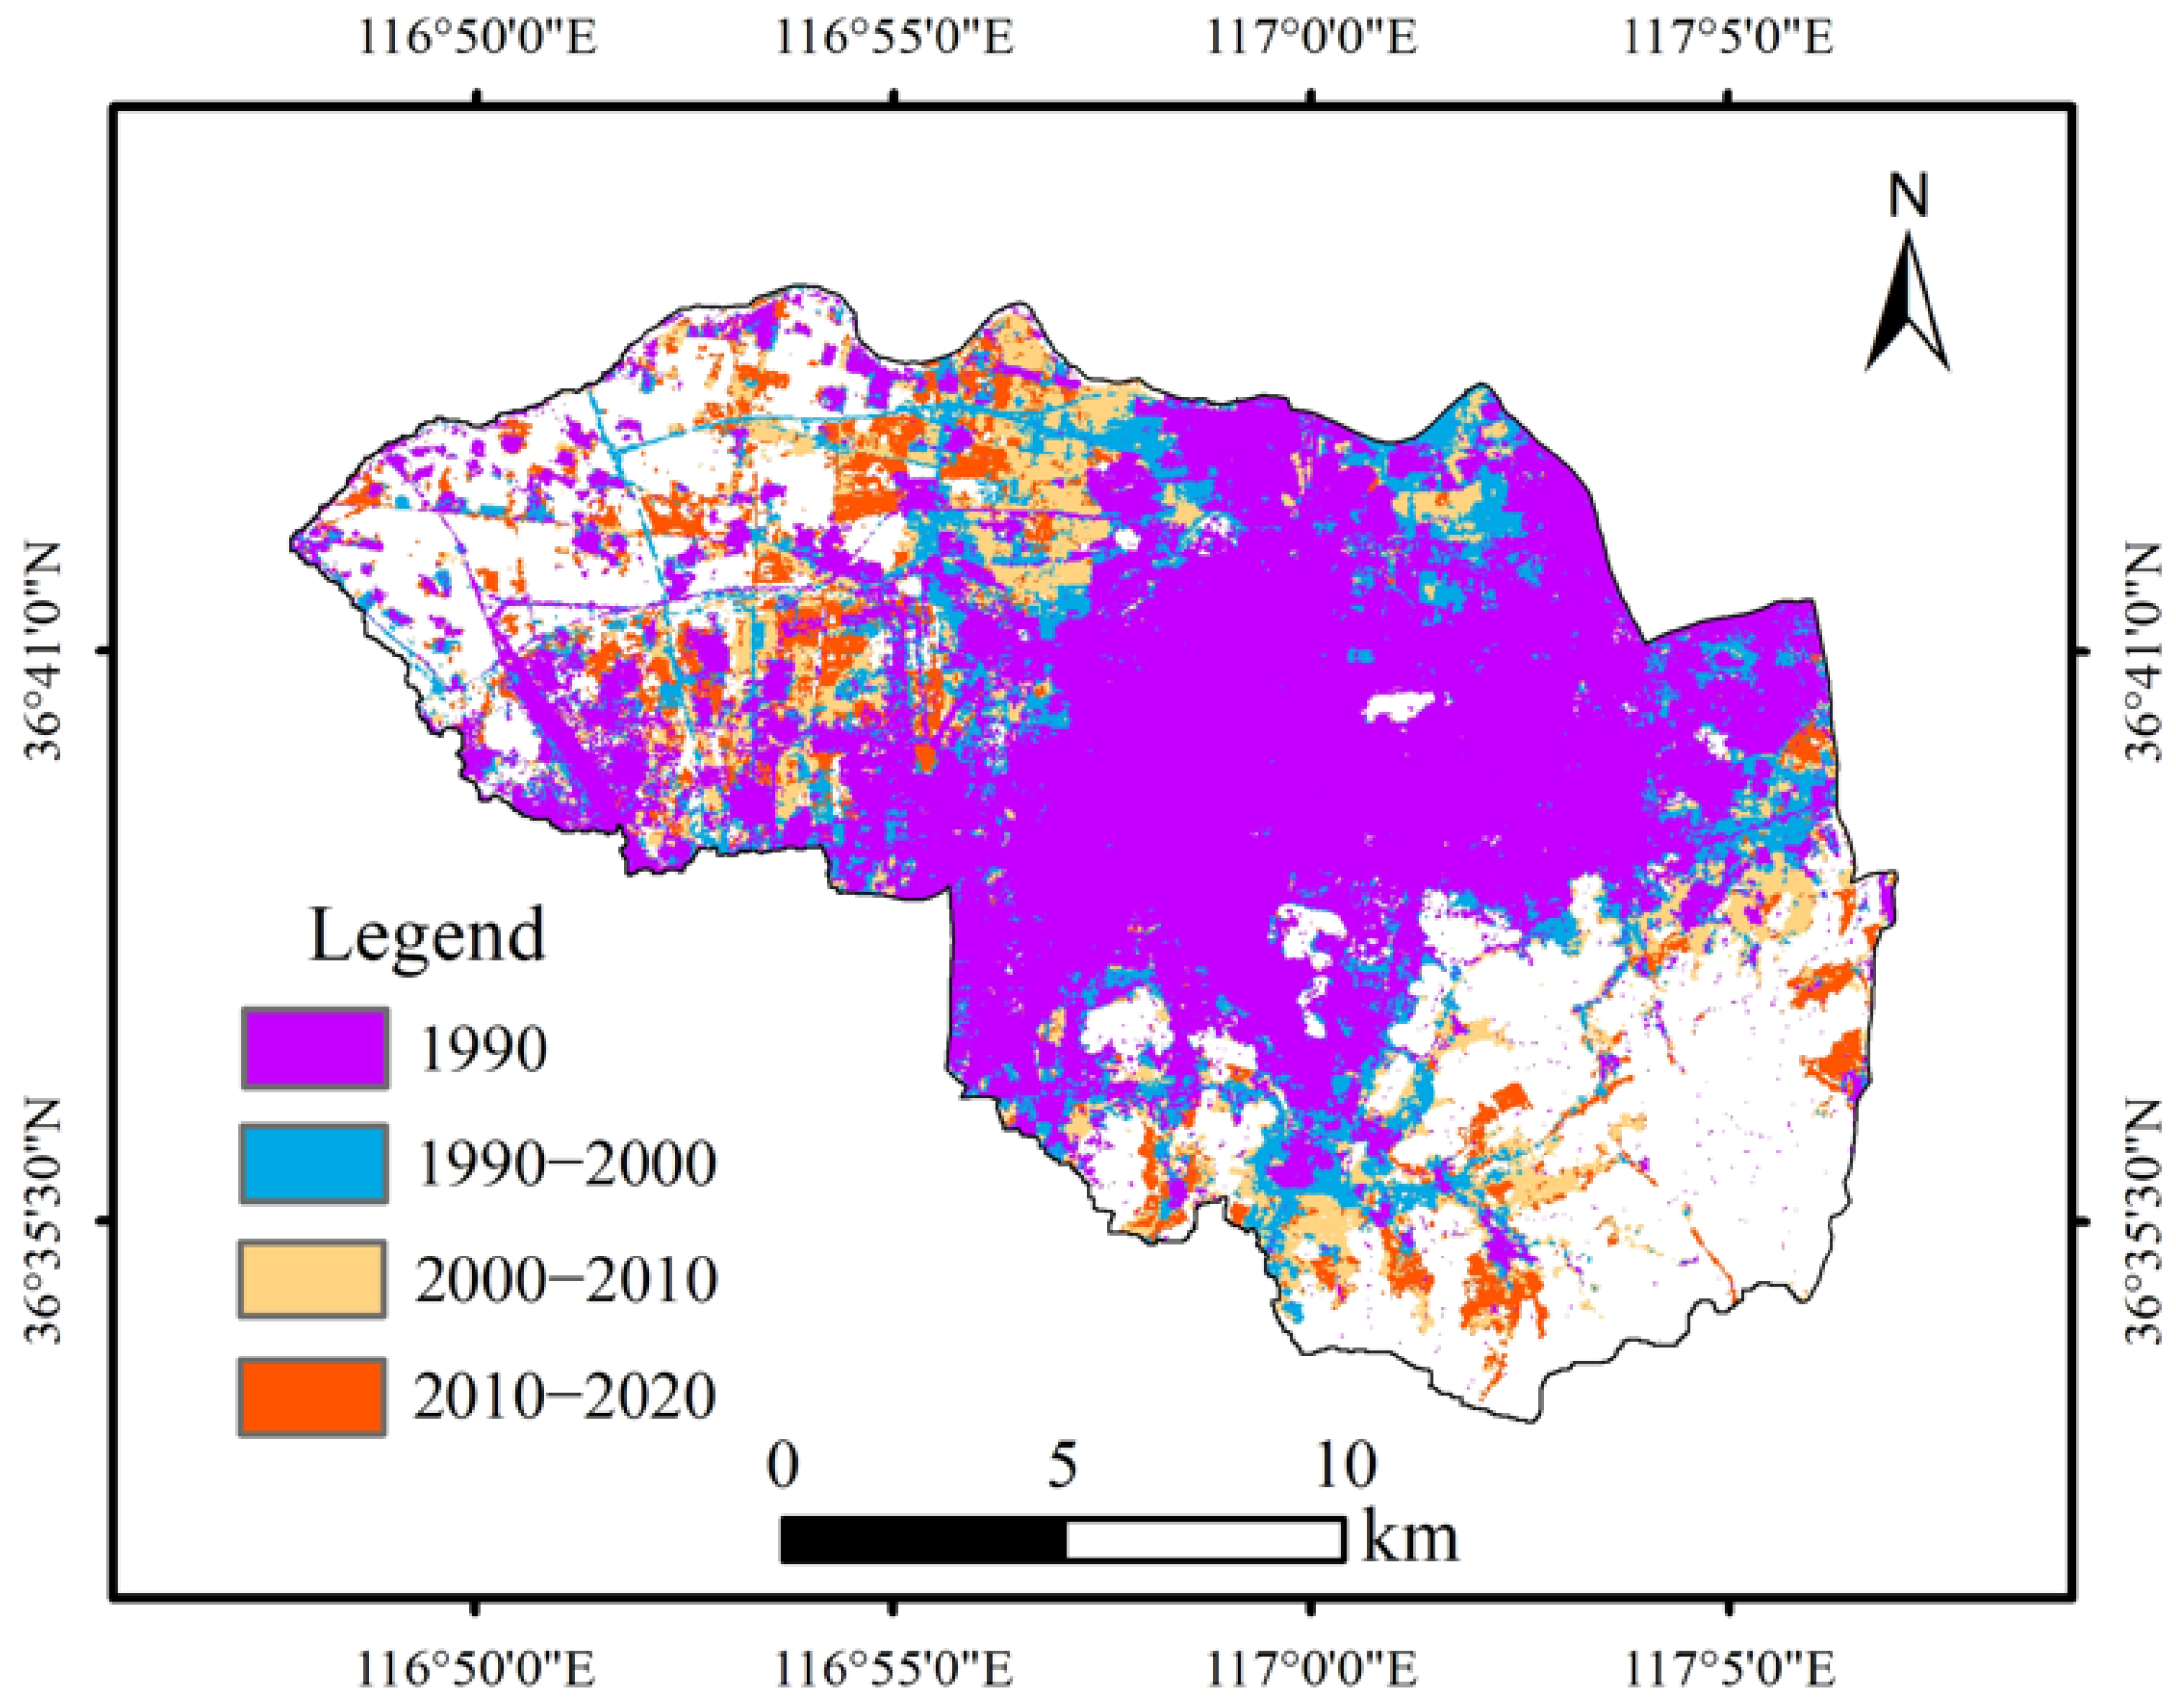
3.2.1. Urbanization Process

We analyzed the land cover changes in the Huangtaiqiao drainage basin from 1990 to 2020, and the proportions of each land cover class are shown in Figure 6. Over the past 30 years, the area has experienced significant urbanization. The proportion of impervious areas continued to increase from 44.65% in 1990 to 71.00% in 2020, which shows an increase of 1.6 times relative to that in 1990. The proportion of cropland and grassland had continued to decline. The cropland decreased from 39.4% in 1990 to 14.89% in 2020. The grassland decreased from 6.54% in 1990 to 2.1% in 2020. The proportion of forests increased slightly from 9.12% in 1990 to 11.45% in 2020. The proportion of surface water changed very little.
There has been an unprecedented sprawl of impervious areas over the last 30 years. The spatial expansion of impervious surface in the Huangtaiqiao drainage basin from 1990 to 2020 is shown in Figure 7. Urbanization manifested itself mainly as a circular extensional expansion. The expansion of the impervious surface was mainly concentrated in the western plain area and southern mountainous area. Within the main urban area, land that was not used for construction was progressively developed. The number of pervious areas, such as cropland and grassland, significantly decreased as a result. In the study area, urbanization played a leading role in the process of land cover change.

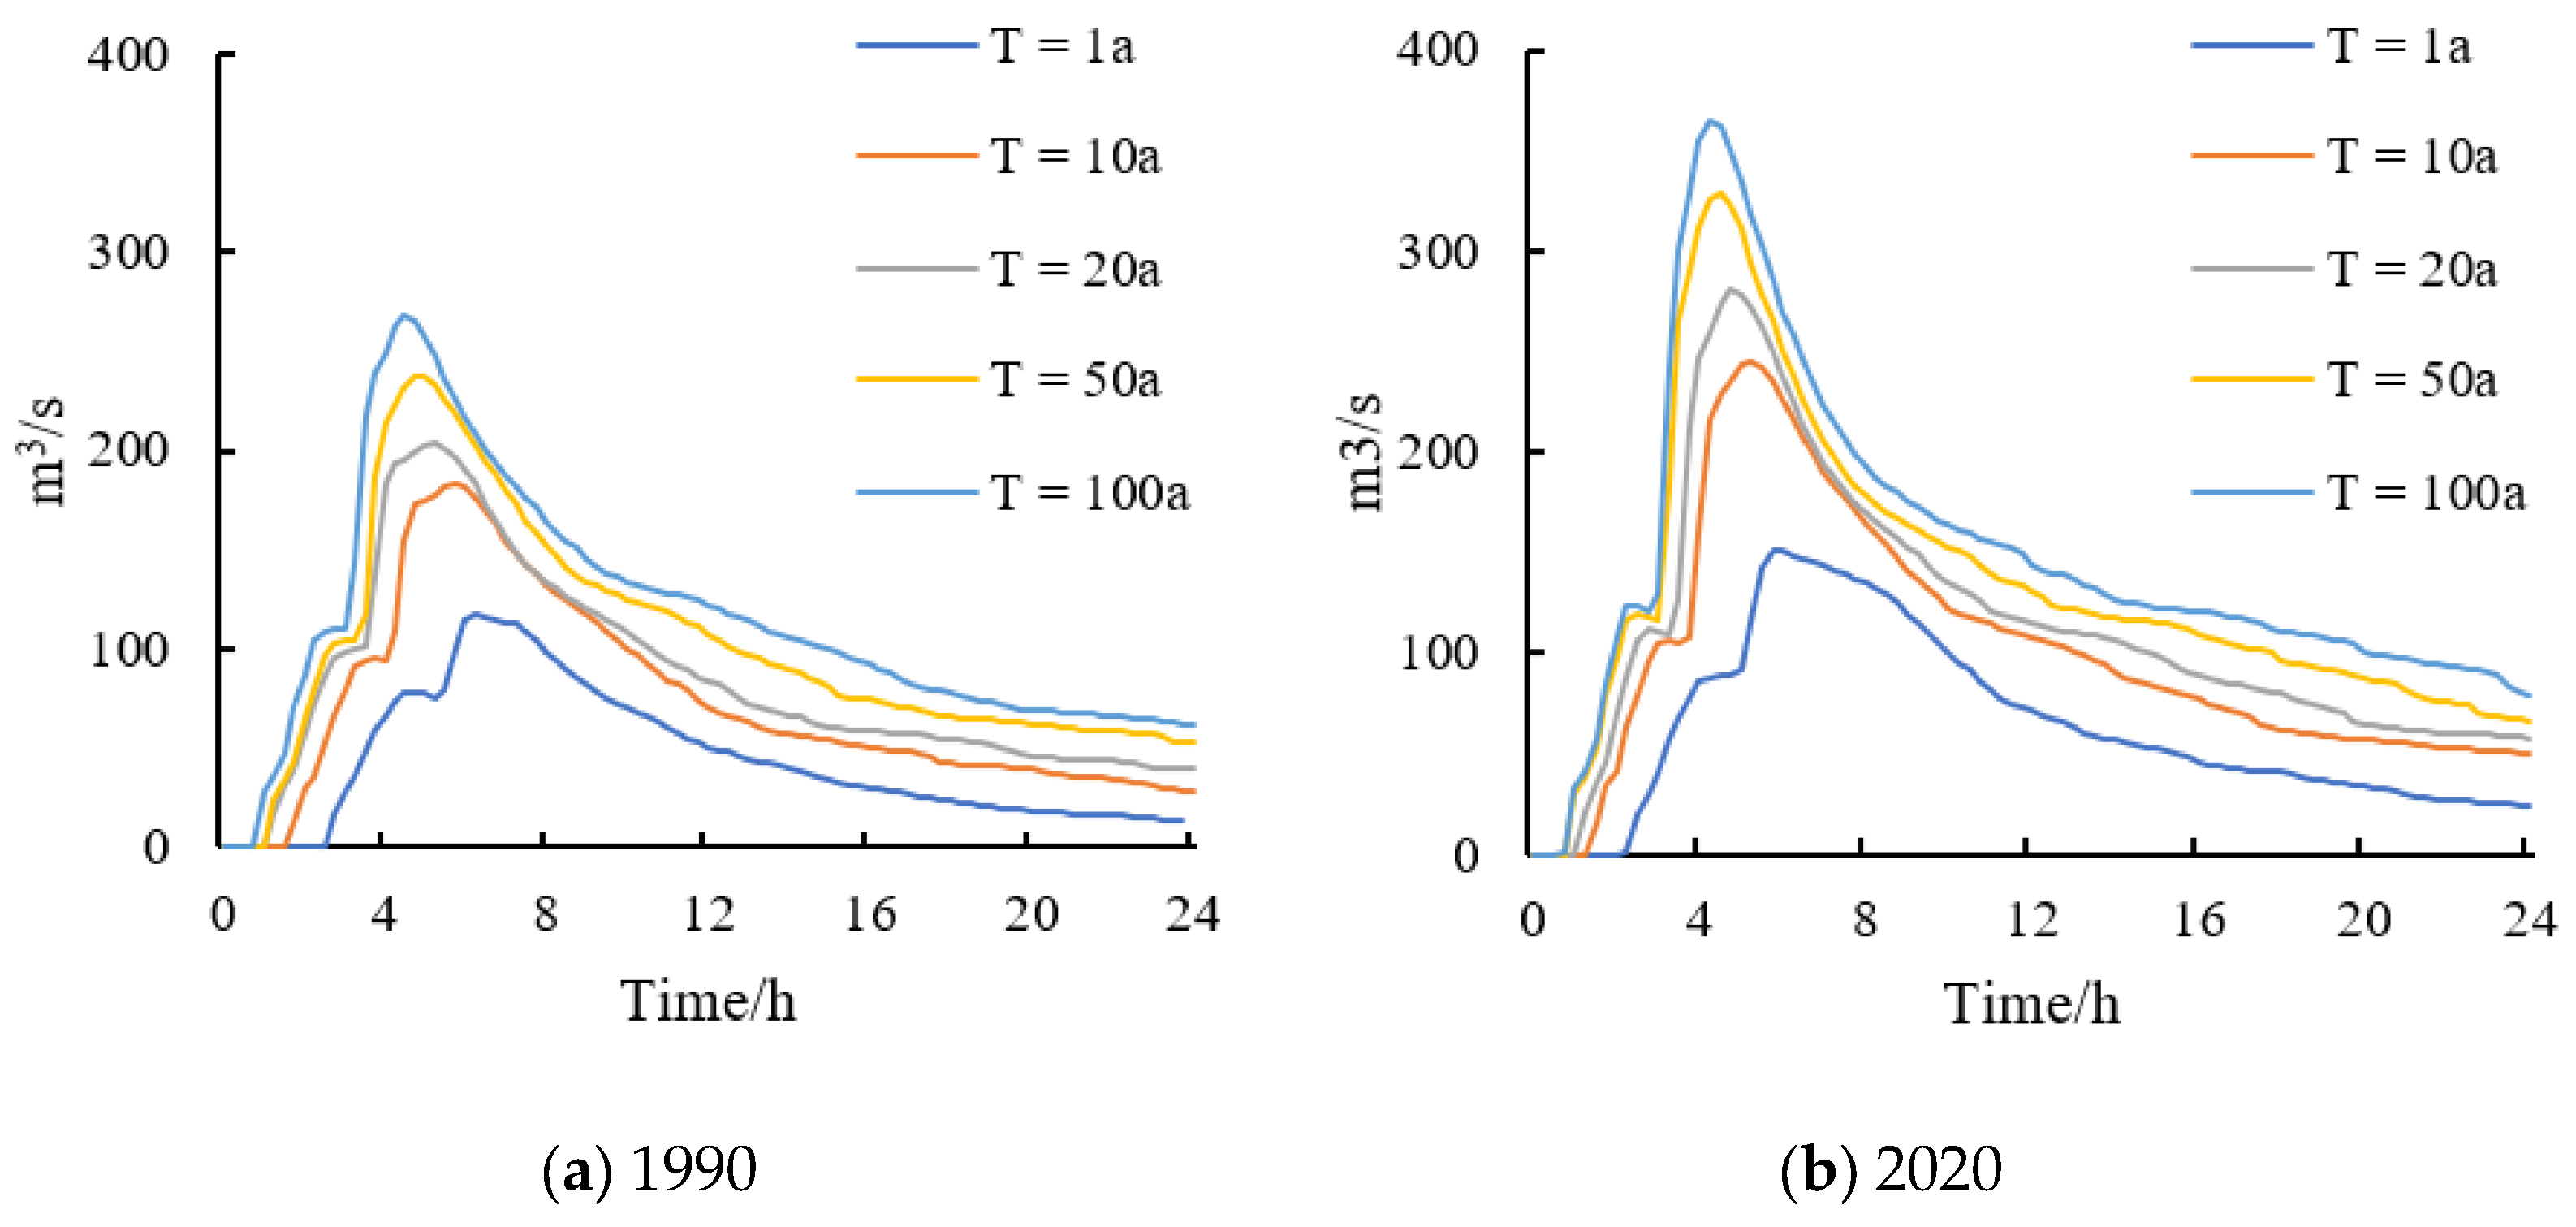
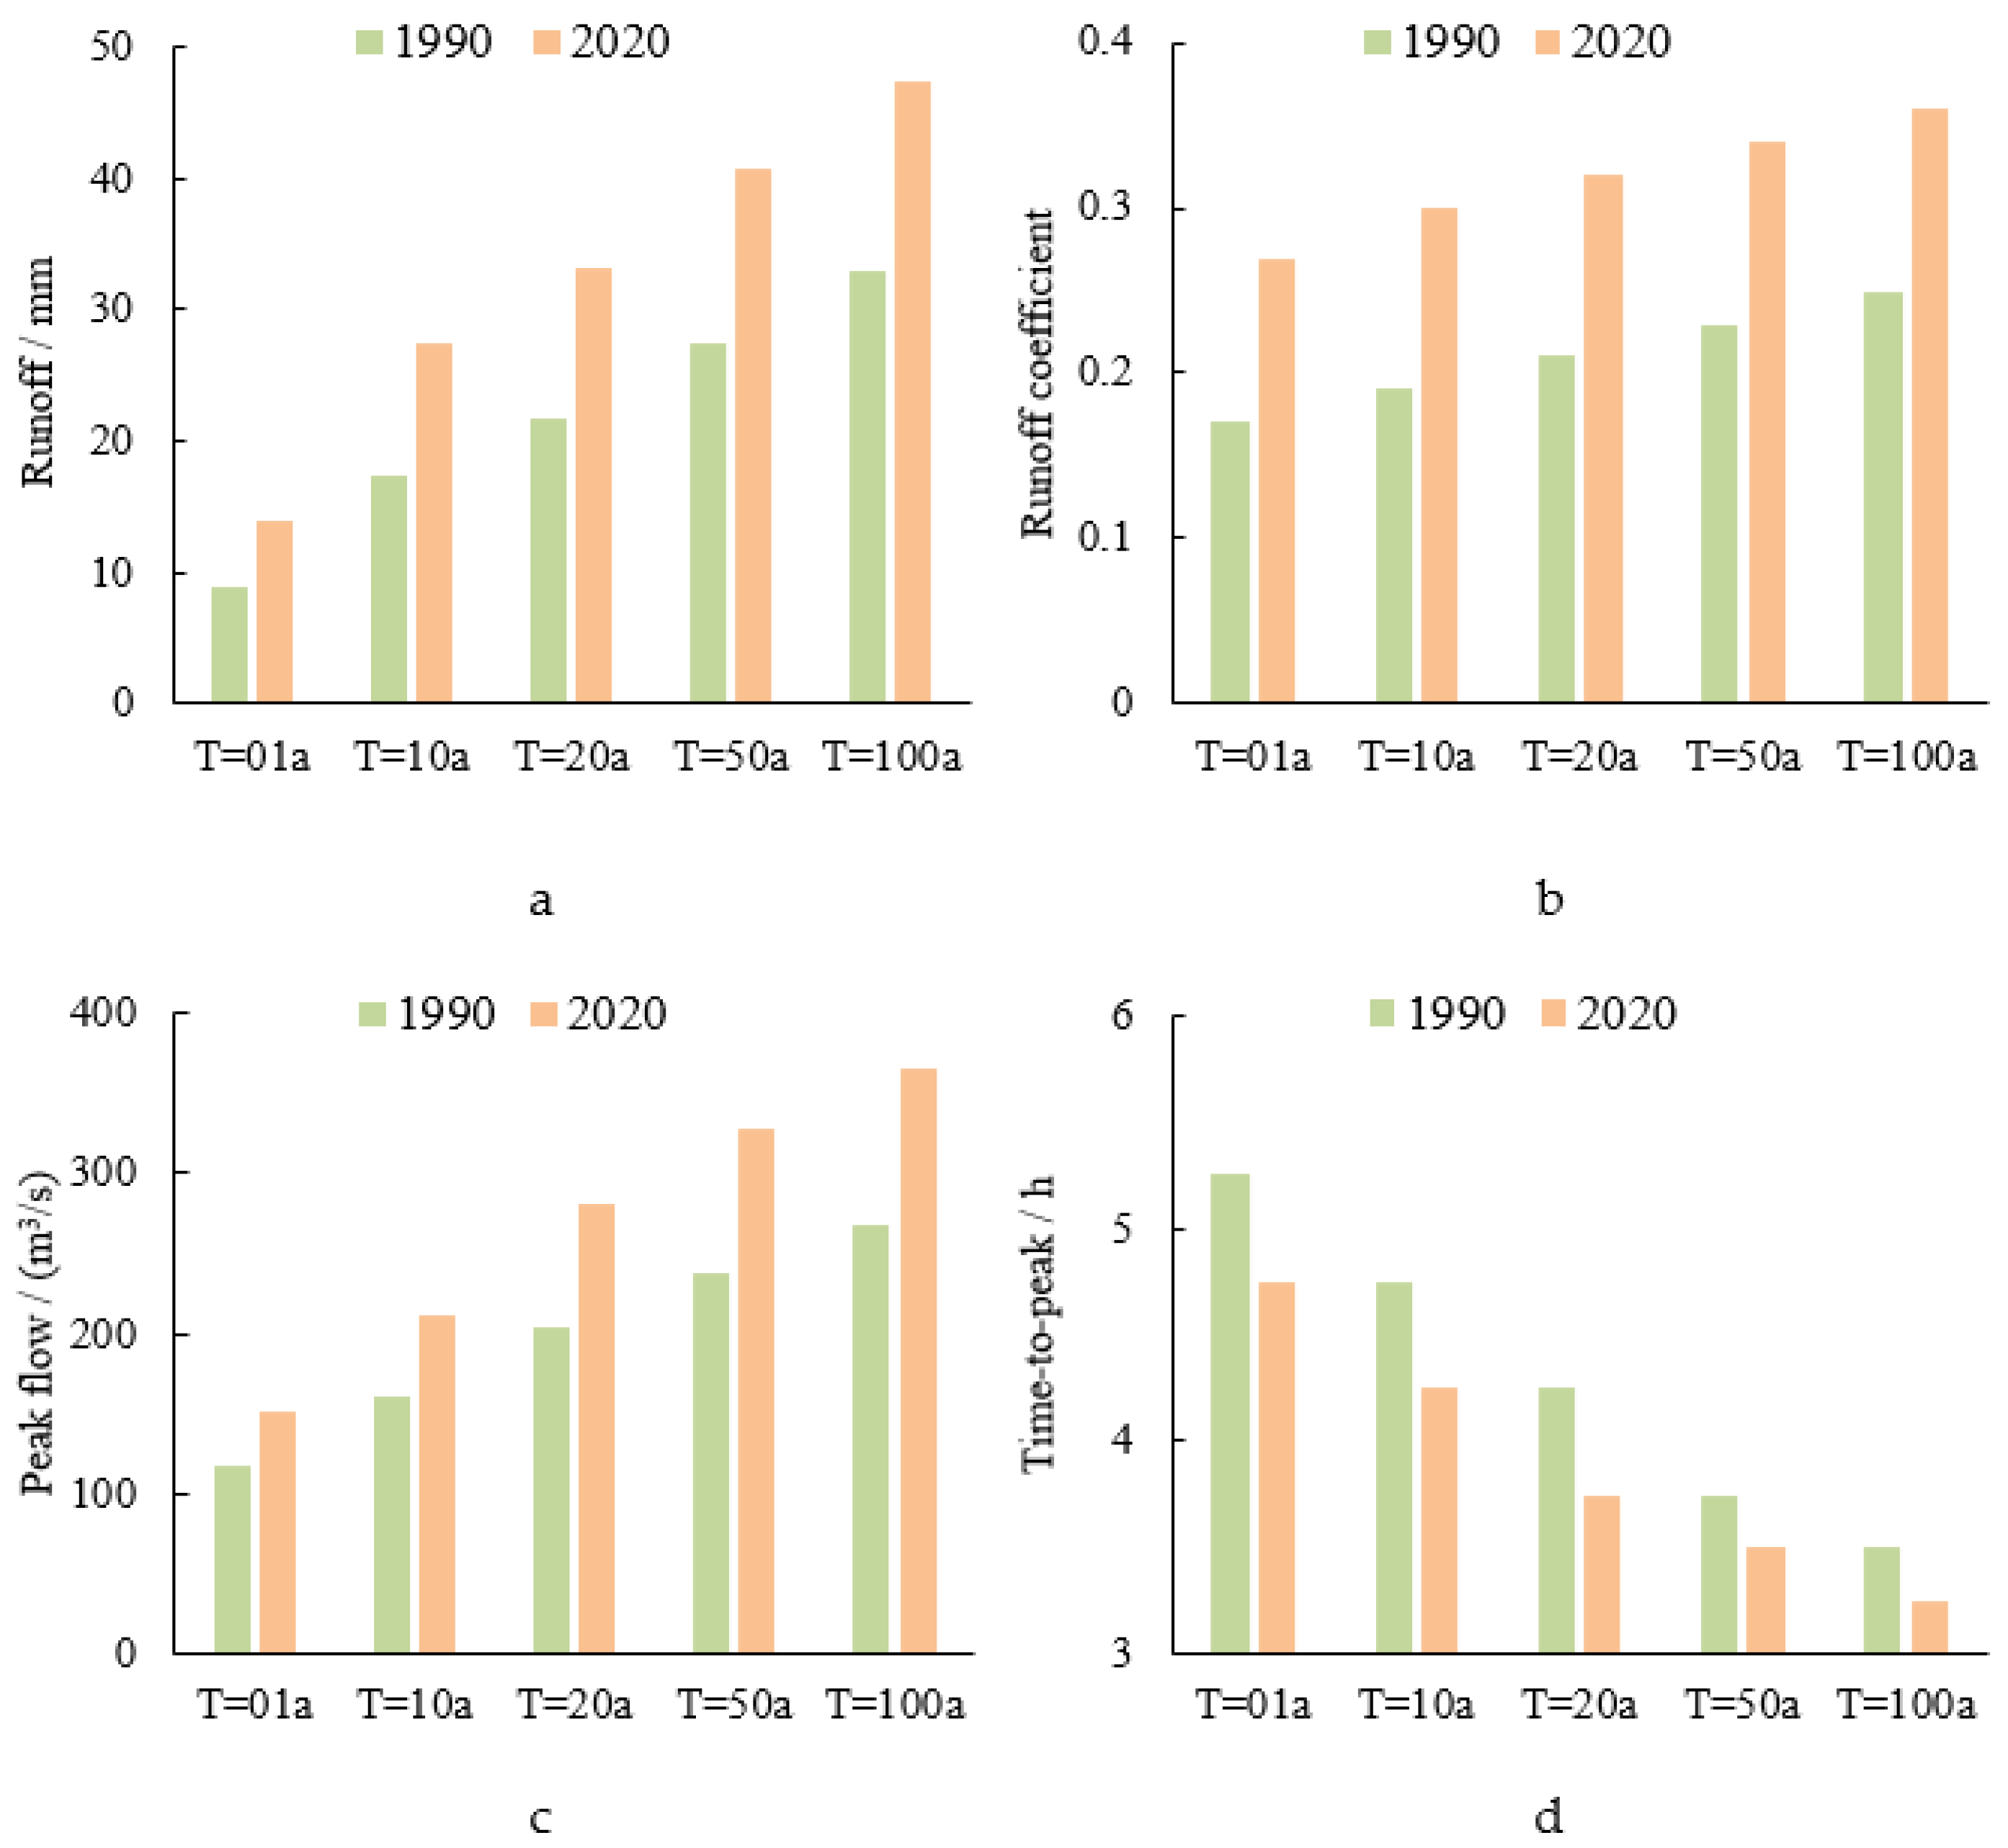
3.2.2. Design Flood Process

Based on the land cover in 1990 and 2020, two urbanization simulation scenarios were set up in the TVGM-USWM model. The impact of urbanization on rainfall-runoff processes in the area was analyzed under the design rainfall processes with different return periods. The design flood hydrographs for the two urbanization scenarios are shown in Figure 8. The statistical characteristics of the design flood processes are shown in Table 3 and Figure 9.
When the return period was 1 year, the values of the runoff coefficient, peak flow and time-to-peak were 0.17, 117.51 and 5.25 in the 1990 urbanization scenario and 0.27, 151.7 and 4.75 in the 2020 urbanization scenario. When the return period was 10 years, these values were 0.19, 161.35 and 4.75 in the 1990 urbanization scenario and 0.3, 211.2 and 4.25 in the 2020 urbanization scenario. When the return period was 20 years, these values were 0.21, 203.31 and 4.25 in the 1990 urbanization scenario and 0.32, 280.81 and 3.75 in the 2020 urbanization scenario. When the return period was 50 years, these values were 0.23, 237.29 and 3.75 in the 1990 urbanization scenario and 0.34, 328.74 and 3.5 in the 2020 urbanization scenario. When the return period was 100 years, these values were 0.25, 268.38 and 3.5 in the 1990 urbanization scenario and 0.36, 364.64 and 3.25 in the 2020 urbanization scenario. Furthermore, as the frequency of the design rainfall decreased, the runoff, runoff coefficient and peak flow gradually increased. The values in the 2020 urbanization scenario were higher than those in the 1990 urbanization scenario. However, the opposite is true for the time-to-peak.
Urbanization has a significant amplifying effect on design flood processes. In the scenario with a relatively low level of urbanization, the runoff coefficient increased from 0.17 (T = 01a) to 0.25 (T = 100a), with an increase of 0.08. The runoff depth increased from 8.82 mm (T = 01a) to 32.89 mm (T = 100a), with an increase of 24.07 mm. The peak flow increased from 117.51 m3/s (T = 01a) to 268.38 m3/s (T = 100a), with an increase of 150.87 m3/s. In the scenario with a relatively high level of urbanization, the runoff coefficient increased from 0.27 (T = 01a) to 0.36 (T = 100a), with an increase of 0.09. The runoff depth increased from 14.02 mm (T = 01a) to 47.36 mm (T = 100a), with an increase of 33.34 mm. The peak flow increased from 151.7 m3/s (T = 01a) to 364.64 m3/s (T = 100a), with an increase of 212.94 m3/s. It showed that the increasing trends of runoff coefficient, runoff depth and peak flow were more pronounced in the scenario with a relatively high level of urbanization.
Under the relatively small design rainfall with big frequency (T = 01a), the runoff coefficient in the relatively high urbanization scenario increased by 0.1 compared to that in the relatively low urbanization scenario. The runoff depth in the relatively high urbanization scenario increased by 5.2 mm compared to that in the relatively low urbanization scenario. The peak flow in the relatively high urbanization scenario is 1.29 times higher than that in the relatively low urbanization scenario. Under the relatively big design rainfall with small frequency (T = 100a), the runoff coefficient in the relatively high urbanization scenario increased by 0.11 compared to that in the relatively low urbanization scenario. The runoff depth in the relatively high urbanization scenario increased by 14.47 mm compared to that in the relatively low urbanization scenario. The peak flow in the relatively high urbanization scenario is 1.36 times higher than that in the relatively low urbanization scenario. It showed that the expansion of impervious surfaces due to urbanization had a more significant amplifying effect on the relatively big design flood with small frequency.
Under the design rainfall T01a, T10a and T20a, the time-to-peak of design floods in the relatively high urbanization scenario is 0.5 h earlier than that in the relatively low urbanization scenario. Under the design rainfall T50a and T100a, the time-to-peak of design floods in the relatively high urbanization scenario is 0.25 h earlier than that in the relatively low urbanization scenario. It showed that the time-to-peak of floods at relatively big frequencies became earlier, while those at relatively small frequencies changed little. As the frequency of the design rainfall decreased, the impact of urbanization on the time-to-peak of the design flood gradually diminished.
Compared with the design flood process in the 1990 urbanization scenario, the design flood process in the 2020 urbanization scenario has the phenomenon of “getting taller, sharper, and thinner”. The increase in impervious surfaces in the basin accelerated the rate of slope convergence, and the time-to-peak flow was earlier. Urbanization has changed the rainfall-runoff process in the basin. Pervious surfaces were replaced by impervious surfaces, resulting in poor capability for infiltration and water stagnation of the underlying surface. The basin became less resilient to flooding, especially in urban areas. The tributaries on the south bank of the Xiaoqing River have steep slopes, and floodwater from the southern mountains can quickly flow into the central urban area. The reduction of pervious surfaces in the southern mountains could have an exacerbating effect on flooding/waterlogging.

4. Discussion

In this study, a new urban hydrological model, the TVGM-USWM model, was developed. Many studies indicate that the pervious surface plays an important role in urban flood modeling, and that both infiltration excess runoff and saturation excess runoff can occur, but it is difficult to determine the pervious areas where infiltration excess and saturation excess occur [63,64]. Most urban hydrological models consider only the infiltration excess in runoff generation, which may not accurately represent the rainfall-runoff relationship in urban areas with complex topography [53,54,55]. The TVGM-USWM model uses a similar method of runoff generation in pervious areas as the TVGM model and considers flow routing in urban drainage systems. The TVGM-USWM model can describe complex runoff generation mechanisms and the interaction between artificial and natural drainage networks, which is a difficulty in urban flood simulation. The model performed well in simulating urban stormwater hydrographs, as shown in Figure 5 and Table 2, demonstrating good applicability in urban flood simulation. Thus, compared to most urban hydrological models, the TVGM-USWM model can reflect the complex runoff generation mechanisms of pervious surfaces in urban areas.
The objective of this research was to analyze the long-term land cover change in the study area. To this aim, the sequential and 30 m resolution land cover monitoring (CLCD) via satellite is useful for the assessment and land surface process modeling at basin scale. With an overall accuracy of 79.31% calculated from more than 5000 visually interpreted samples, the sequential and 30 m resolution land cover monitoring (CLCD) via satellite is useful for fine-scale assessment and land surface process modeling [15]. In addition to a commercial pre-order schedule adopted by Landsat 5, the primary limitation of the CLCD is the discontinuous spatial and temporal acquisition of Landsat 5, which restricted its application prior to 1990 [65]. For fine-scale urban flood modeling and forecasting, more detailed and real-time urbanization information is required, as the 30-metre pixel resolution of Landsat imagery is still significantly larger than many man-made structures [66,67]. Fine-scale land cover information can be obtained by interpreting remote sensing data, such as from the Sentinel-2 (20 m) and Sentinel-1 (10 m) satellites. There is also auxiliary data used to interpret the training samples, such as Google Earth images and Google Maps photos. An automatic framework can be developed on Google Earth Engine (GEE) using mapping algorithms [68,69,70]. Only with consistently accurate and high-resolution monitoring of human settlements will it be possible to satisfy the data requirements of urban planning and the construction of sponge cities in China.
Rapid urban sprawl has had a significant impact on the regional hydrological cycle and flood management [71,72,73]. The impact of land cover changes due to urbanization on regional rainfall-runoff processes was examined in this study. Our study focused on changes in hydrological elements (i.e., discharge, peak flow and time-to-peak) under the design rainfall processes. Our results will help to clarify the impact of urbanization on hydrological processes in semi-humid cities and can provide scientific support for the planning of sponge cities. There are also some limitations to this study. The underlying surface in the TVGM-USWM model can only be divided into the impervious area and the pervious area, which may not be well suited to urban flood modeling where high accuracy is required. The drainage system before urbanization is not available, but the aim of this study was to focus on land cover change, so the results are still highly reliable. The uncertain impacts of future climate change and urban development were not considered in this study. In addition, the pilot area for the construction of a ‘sponge city’ in Jinan City is located within the study area, and it will be important to assess the impact of LID facilities on stormwater mitigation. Future research will explore these issues in more detail.

5. Conclusions

The TVGM-USWM model, a new urban hydrological model that considers the nonlinear rainfall-runoff relationship and the flow routing in urban drainage systems, was developed in this study. We analyzed the land cover change in the Huangtaiqiao drainage basin of Jinan City, China, from 1990 to 2020. Two urbanization scenarios were set up in the TVGM-USWM model. During the design rainfall events with different return periods, we studied the impact of urbanization-induced land cover change on rainfall-runoff processes in the study area. The main conclusions are summarized as follows:
  • The TVGM-USWM model demonstrated good applicability in Jinan City, simulating both single-peak and multi-peak urban floods well. In both calibration and validation periods, the RNS values of the flood events are all greater than 0.75. Most REP values are smaller than 17%, and the AET values are all within 1.5 h.
  • The study area has experienced significant urbanization. The proportion of impervious areas increased from 44.65% in 1990 to 71.00% in 2020. Urbanization played a leading role in the process of land cover changes and manifested itself as a circular extensional expansion, mainly concentrating in the western plain area and southern mountainous area.
  • Urbanization had a significant amplifying effect on design flood processes. The increasing trend of runoff coefficient, runoff depth and peak flow was more pronounced in the scenario with a relatively high level of urbanization. Meanwhile, urbanization had a more significant amplifying effect on the relatively big design flood with small frequency. When the frequency of design rainfall decreased, the impact of urbanization on the time-to-peak of the design flood gradually decreased.

Author Contributions

Conceptualization, Y.Z.; methodology, Y.Z., J.X. and Z.X.; software, Y.Z.; validation, C.Y.; formal analysis, Y.Z.; investigation, Z.X.; resources, Y.Q.; data curation, Y.Z.; writing—original draft preparation, Y.Z.; writing—review and editing, Z.X.; visualization, J.S.; supervision, J.X. and Y.Q.; project administration, J.X., Z.X. and Y.Q. All authors have read and agreed to the published version of the manuscript.

Funding

This study was supported by the Natural Science Foundation of China (No. 41890824 and No. 52239003).

Data Availability Statement

The data that has been used is confidential.

Conflicts of Interest

The authors declare no conflict of interest.

References

  1. Bertilsson, L.; Wiklund, K.; Tebaldi, I.D.M.; Rezende, O.M.; Veról, A.P.; Miguez, M.G. Urban flood resilience–A multi-criteria index to integrate flood resilience into urban planning. J. Hydrol. 2019, 573, 970–982. [Google Scholar] [CrossRef]
  2. Luo, P.P.; Luo, M.T.; Li, F.Y.; Qi, X.G.; Huo, A.D.; Wang, Z.H.; He, B.; Takara, K.; Nover, D.; Wang, Y.H. Urban flood numerical simulation: Research, methods and future perspectives. Environ. Model. Softw. 2022, 156, 105478. [Google Scholar] [CrossRef]
  3. United Nations. World Population Prospects: The 2018 Revision; United Nations: New York, NY, USA, 2019. [Google Scholar]
  4. Nanding, N.; Chen, Y.; Wu, H.; Dong, B.; Tian, F.; Lott, F.C.; Tett, S.F.B.; Rico-Ramirez, M.A.; Chen, Y.; Huang, Z.; et al. Anthropogenic Influences on 2019 July Precipitation Extremes Over the Mid–Lower Reaches of the Yangtze River. Front. Environ. Sci. 2020, 8, 603061. [Google Scholar] [CrossRef]
  5. Li, R.; Li, D.; Nanding, N.; Wang, X.; Fan, X.; Chen, Y.; Tian, F.; Tett, S.F.B.; Dong, B.; Lott, F.C. Anthropogenic Influences on Heavy Precipitation during the 2019 Extremely Wet Rainy Season in Southern China. Bull. Am. Meteorol. Soc. 2021, 102, S103–S109. [Google Scholar] [CrossRef]
  6. Apel, H.; Thieken, A.; Merz, B.; Bloschl, G. A Probabilistic Modelling System for Assessing Flood Risks. Nat. Hazards 2006, 38, 79–100. [Google Scholar] [CrossRef]
  7. Zha, X.; Luo, P.; Zhu, W.; Wang, S.; Lyu, J.; Zhou, M.; Huo, A.; Wang, Z. A bibliometric analysis of the research on Sponge City: Current situation and future development direction. Ecohydrology 2021, 14, 2328. [Google Scholar] [CrossRef]
  8. Morrison, A.; Westbrook, C.; Noble, B. A review of the flood risk management governance and resilience literature. J. Flood Risk Manag. 2017, 11, 291–304. [Google Scholar] [CrossRef]
  9. Kabeja, C.; Li, R.; Rwatangabo, D.E.R.; Duan, J. Monitoring Land Use/Cover Changes by Using Multi-Temporal Remote Sensing for Urban Hydrological Assessment: A Case Study in Beijing, China. Remote Sens. 2022, 14, 4273. [Google Scholar] [CrossRef]
  10. Wang, S.T.; Luo, P.P.; Xu, C.Y.; Zhu, W.; Cao, Z.; Ly, S. Reconstruction of Historical Land Use and Urban Flood Simulation in Xi’an, Shannxi, China. Remote Sens. 2023, 14, 6067. [Google Scholar] [CrossRef]
  11. Yang, Q.; Huang, X.; Tang, Q. Global assessment of the impact of irrigation on land surface temperature. Sci. Bull. 2020, 65, 1440–1443. [Google Scholar] [CrossRef]
  12. Zhang, H.; Qi, Z.; Li, X.; Chen, Y.; Wang, X.; He, Y. An Urban Flooding Index for Unsupervised Inundated Urban Area Detection Using Sentinel-1 Polarimetric SAR Images. Remote Sens. 2021, 13, 4511. [Google Scholar] [CrossRef]
  13. Gokon, H.; Endo, F.; Koshimura, S. Detecting Urban Floods with Small and Large Scale Analysis of ALOS-2/PALSAR-2 Data. Remote Sens. 2023, 15, 532. [Google Scholar] [CrossRef]
  14. Bai, H.; Li, Z.W.; Guo, H.L.; Chen, H.P.; Luo, P.P. Urban Green Space Planning Based on Remote Sensing and Geographic Information Systems. Remote Sens. 2022, 14, 4213. [Google Scholar] [CrossRef]
  15. Yang, J.; Huang, X. The 30 m annual land cover dataset and its dynamics in China from 1990 to 2019. Earth Syst. Sci. Data 2021, 13, 3907–3925. [Google Scholar] [CrossRef]
  16. Shen, Q.; Cong, Z.; Lei, H. Evaluating the impact of climate and underlying surface change on runoff within the Budyko framework: A study across 224 catchments in China. J. Hydrol. 2017, 554, 251–262. [Google Scholar] [CrossRef]
  17. Gao, Y.; Yuan, Y.; Wang, H.; Schmidt, A.R.; Wang, K.; Ye, L. Examining the effects of urban agglomeration polders on flood events in Qinhuai River basin, China with HEC-HMS model. Water Sci. Technol. 2017, 75, 2130–2138. [Google Scholar] [CrossRef]
  18. Moscrip, A.L.; Montgomery, D.R. Urbanization, Flood Frequency, and Salmon Abundance in Puget Lowland Streams. JAWRA J. Am. Water Resour. Assoc. 1997, 33, 1289–1297. [Google Scholar] [CrossRef]
  19. Prosdocimi, I.; Kjeldsen, T.R.; Miller, J.D. Detection and attribution of urbanization effect on flood extremes using nonstationary flood-frequency models. Water Resour. Res. 2015, 51, 4244–4262. [Google Scholar] [CrossRef]
  20. Braud, I.; Breil, P.; Thollet, F.; Lagouy, M.; Branger, F.; Jacqueminet, C.; Kermadi, S.; Michel, K. Evidence of the impact of urban-ization on the hydrological regime of a medium-sized periurban catchment in France. J. Hydrol. 2013, 485, 5–23. [Google Scholar] [CrossRef]
  21. Braud, I.; Fletcher, T.; Andrieu, H. Hydrology of peri-urban catchments: Processes and modelling. J. Hydrol. 2013, 485, 1–4. [Google Scholar] [CrossRef]
  22. Luo, P.; Xu, C.; Kang, S.; Huo, A.; Lyu, J.; Zhou, M.; Nover, D. Heavy metals in water and surface sediments of the Fenghe River Basin, China: Assessment and source analysis. Water Sci. Technol. 2021, 84, 3072–3090. [Google Scholar] [CrossRef] [PubMed]
  23. Luo, P.P.; Mu, Y.; Wang, S.T.; Zhu, W.; Mishra, B.K.; Huo, A.D.; Zhou, M.M.; Lyu, J.Q.; Hu, M.C.; Duan, W.L. Exploring sustaina-ble solutions for the water environment in Chinese and Southeast Asian cities. AMBIO 2021, 51, 1199–1218. [Google Scholar] [CrossRef] [PubMed]
  24. Maksimović, Č.; Prodanovic, D.; Boonya-Aroonnet, S.; Leitao, J.P.; Djordjevic, S.; Allitt, R. Overland flow and pathway analysis for modelling of urban pluvial flooding. J. Hydraul. Res. 2009, 47, 512–523. [Google Scholar] [CrossRef]
  25. Wang, J.; Liu, J.H.; Mei, C.; Wang, H.; Lu, J.H. A multi-objective optimization model for synergistic effect analysis of integrated green-gray-blue drainage system in urban inundation control. J. Hydrol. 2022, 609, 127725. [Google Scholar] [CrossRef]
  26. Xu, Z.; Zhao, G. Impact of urbanization on rainfall-runoff processes: Case study in the Liangshui River Basin in Beijing, China. Proc. Int. Assoc. Hydrol. Sci. 2016, 373, 7–12. [Google Scholar] [CrossRef]
  27. Aich, V.; Liersch, S.; Vetter, T.; Fournet, S.; Andersson, J.C.; Calmanti, S.; van Weert, F.H.; Hattermann, F.F.; Paton, E.N. Flood projections within the Niger River Basin under future land use and climate change. Sci. Total. Environ. 2016, 562, 666–677. [Google Scholar] [CrossRef]
  28. Yin, J.; Yu, D.; Wilby, R. Modelling the impact of land subsidence on urban pluvial flooding: A case study of downtown Shanghai, China. Sci. Total. Environ. 2016, 544, 744–753. [Google Scholar] [CrossRef]
  29. Kulp, S.A.; Strauss, B.H. New elevation data triple estimates of global vulnerability to sea-level rise and coastal flooding. Nat. Commun. 2019, 10, 4844. [Google Scholar] [CrossRef]
  30. Xia, J.; Zhang, Y.Y.; Xiong, L.H.; He, S.; Wang, L.F.; Yu, Z.B. Opportunities and challenges of the Sponge City construction relat-ed to urban water issues in China. Sci. China Earth Sci. 2017, 60, 652–658. [Google Scholar] [CrossRef]
  31. Xu, Y.-S.; Shen, S.-L.; Lai, Y.; Zhou, A.-N. Design of sponge city: Lessons learnt from an ancient drainage system in Ganzhou, China. J. Hydrol. 2018, 563, 900–908. [Google Scholar] [CrossRef]
  32. Rollason, E.; Bracken, L.J.; Hardy, R.J.; Large, A.R.G. The importance of volunteered geographic information for the valida-tion of flood inundation models. J. Hydrol. 2018, 562, 267–280. [Google Scholar] [CrossRef]
  33. Wu, Y.Y.; She, D.X.; Xia, J.; Song, J.Y.; Xiao, T.; Zhou, Y. The quantitative assessment of impact of pumping capacity and LID on urban flood susceptibility based on machine learning. J. Hydrol. 2023, 617, 129116. [Google Scholar] [CrossRef]
  34. Eldho, T.; Zope, P.; Kulkarni, A. Urban Flood Management in Coastal Regions Using Numerical Simulation and Geographic Information System. In Integrating Disaster Science and Management; Elsevier: London, UK, 2018; pp. 205–219. [Google Scholar] [CrossRef]
  35. Mignot, E.; Li, X.; Dewals, B. Experimental modelling of urban flooding: A review. J. Hydrol. 2019, 568, 334–342. [Google Scholar] [CrossRef]
  36. Epps, T.H.; Hathaway, J.M. Establishing a framework for the spatial identification of effective impervious Areas in Gauged Basins: Review and case study. J. Sustain. Water Built Environ. 2018, 4, 05018001. [Google Scholar] [CrossRef]
  37. O’Donnell, E.; Thorne, C.; Ahilan, S.; Arthur, S.; Birkinshaw, S.; Butler, D.; Kapetas, L. The blue-green path to urban flood resilience. Blue-Green Syst. 2020, 2, 28–45. [Google Scholar] [CrossRef]
  38. David, A.; Schmalz, B. Flood hazard analysis in small catchments: Comparison of hydrological and hydrodynamic approaches by the use of direct rainfall. J. Flood Risk Manag. 2020, 13, 12639. [Google Scholar] [CrossRef]
  39. Luo, P.P.; Liu, L.M.; Wang, S.T.; Ren, B.M.; He, B.; Nover, D. Influence assessment of new Inner Tube Porous Brick with absorbent concrete on urban floods control. Case Stud. Constr. Mater. 2022, 17, e01236. [Google Scholar]
  40. Martins, R.; Leandro, J.; Djordjevic, S. Influence of sewer network models on urban flood damage assessment based on coupled 1D/2D models. J. Flood Risk Manag. 2018, 11, S717–S728. [Google Scholar] [CrossRef]
  41. Bisht, D.S.; Chatterjee, C.; Kalakoti, S.; Upadhyay, P.; Sahoo, M.; Panda, A. Modeling urban floods and drainage using SWMM and MIKE URBAN: A case study. Nat. Hazards 2016, 84, 749–776. [Google Scholar] [CrossRef]
  42. Papaioannou, G.; Loukas, A.; Vasiliades, L.; Aronica, G.T. Flood inundation mapping sensitivity to riverine spatial resolution and modelling approach. Nat. Hazards 2016, 83, 117–132. [Google Scholar] [CrossRef]
  43. Bailey, O.; Arnot, T.; Blokker, M.; Kapelan, Z.; Vreeburg, J.; Hofman, J. Developing a stochastic sewer model to support sewer design under water conservation measures. J. Hydrol. 2019, 573, 908–917. [Google Scholar] [CrossRef]
  44. Cheng, T.; Xu, Z.; Yang, H.; Hong, S.; Leitao, J.P. Analysis of effect of rainfall patterns on urban flood process by coupled hydrological and hydrodynamicmodeling. J. Hydrol. Eng. 2020, 25, 04019061. [Google Scholar] [CrossRef]
  45. Chapi, K.; Singh, V.P.; Shirzadi, A.; Shahabi, H.; Bui, D.T.; Pham, B.T.; Khosravi, K. A novel hybrid artificial intelligence approach for flood susceptibility assessment. Environ. Model. Softw. 2017, 95, 229–245. [Google Scholar] [CrossRef]
  46. Leandro, J.; Schumann, A.; Pfister, A. A step towards considering the spatial heterogeneity of urban key features in urban hydrology flood modelling. J. Hydrol. 2016, 535, 356–365. [Google Scholar] [CrossRef]
  47. Wright, L.; Esward, T.J. Fit for purpose models for metrology: A model selection methodology. J. Phys. Conf. Ser. 2013, 459, 012039. [Google Scholar] [CrossRef]
  48. Haasnoot, M.; van Deursen, W.; Guillaume, J.; Kwakkel, J.; van Beek, E.; Middelkoop, H. Fit for purpose? Building and evaluating a fast, integrated model for exploring water policy pathways. Environ. Model. Softw. 2014, 60, 99–120. [Google Scholar] [CrossRef]
  49. Guidolin, M.; Chen, A.S.; Ghimire, B.; Keedwell, E.C.; Djordjević, S.; Savić, D.A. A weighted cellular automata 2D inundation model for rapid flood analysis. Environ. Model. Softw. 2016, 84, 378–394. [Google Scholar] [CrossRef]
  50. Davidsen, S.; Löwe, R.; Thrysøe, C.; Arnbjerg-Nielsen, K. Simplification of one-dimensional hydraulic networks by automated processes evaluated on 1D/2D deterministic flood models. J. Hydroinform. 2017, 19, 686–700. [Google Scholar] [CrossRef]
  51. Zhao, G.; Gao, H.; Cuo, L. Effects of Urbanization and Climate Change on Peak Flows over the San Antonio River Basin, Texas. J. Hydrometeorol. 2016, 17, 2371–2389. [Google Scholar] [CrossRef]
  52. Huang, Q.Y.; Wang, J.; Li, M.Y.; Fei, M.L.; Dong, J.G. Modeling the influence of urbanization on urban pluvial flooding: A scenario-based case study in Shanghai, China. Nat. Hazards 2017, 87, 1035–1055. [Google Scholar] [CrossRef]
  53. Zhang, Y.; Xia, J.; Yu, J.; Randall, M.; Zhang, Y.; Zhao, T.; Pan, X.; Zhai, X.; Shao, Q. Simulation and assessment of urbanization impacts on runoff metrics: Insights from landuse changes. J. Hydrol. 2018, 560, 247–258. [Google Scholar] [CrossRef]
  54. Raei, E.; Alizadeh, M.R.; Nikoo, M.R.; Adamowski, J. Multi-objective decision-making for green infrastructure planning (LID-BMPs) in urban storm water management under uncertainty. J. Hydrol. 2019, 579, 124091. [Google Scholar] [CrossRef]
  55. Hettiarachchi, S.; Wasko, C.; Sharma, A. Can antecedent moisture conditions modulate the increase in flood risk due to climate change in urban catchments? J. Hydrol. 2019, 571, 11–20. [Google Scholar] [CrossRef]
  56. Xia, J. Identification of a Constrained Nonlinear Hydrological System Described by Volterra Functional Series. Water Resour. Res. 1991, 27, 2415–2420. [Google Scholar]
  57. Xia, J.; O’Connor, K.; Kachroo, R.; Liang, G. A non-linear perturbation model considering catchment wetness and its application in river flow forecasting. J. Hydrol. 1997, 200, 164–178. [Google Scholar] [CrossRef]
  58. Xia, J.; Wang, G.S.; Tan, G.; Ye, A.Z.; Huang, G.H. Development of distributed time-variant gain model for nonlinear hydrological systems. Sci. China Ser. D-Earth Sci. 2005, 48, 713–723. [Google Scholar] [CrossRef]
  59. Wang, G.; Xia, J.; Chen, J. Quantification of effects of climate variations and human activities on runoff by a monthly water balance model: A case study of the Chaobai River basin in northern China. Water Resour. Res. 2009, 45, W00A11. [Google Scholar] [CrossRef]
  60. Hou, X.; Feng, L.; Tang, J.; Song, X.P.; Liu, J.G.; Zhang, Y.L.; Wang, J.J.; Xu, Y.; Dai, Y.H.; Zheng, Y.; et al. Anthropogenic transformation of Yangtze Plain freshwater lakes: Patterns, drivers and impacts. Remote Sens. Environ. 2020, 248, 111998. [Google Scholar] [CrossRef]
  61. Cheng, T.; Huang, B.; Yang, Z.; Qiu, J.; Zhao, B.; Xu, Z. On the effects of flood reduction for green and grey sponge city measures and their synergistic relationship—Case study in Jinan sponge city pilot area. Urban Clim. 2022, 42, 101058. [Google Scholar] [CrossRef]
  62. Keifer, C.J.; Chu, H.H. Synthetic Storm Pattern for Drainage Design. J. Hydraul. Div. 1957, 83, 1332-1–1332-25. [Google Scholar] [CrossRef]
  63. Lim, T.C. Predictors of urban variable source area: A cross-sectional analysis of urbanized catchments in the United States. Hydrol. Process. 2016, 30, 4799–4814. [Google Scholar] [CrossRef]
  64. Voter, C.B.; Loheide, S.P. Urban Residential Surface and Subsurface Hydrology: Synergistic Effects of Low-Impact Features at the Parcel Scale. Water Resour. Res. 2018, 54, 8216–8233. [Google Scholar] [CrossRef]
  65. Pekel, J.-F.; Cottam, A.; Gorelick, N.; Belward, A.S. High-resolution mapping of global surface water and its long-term changes. Nature 2016, 540, 418–422. [Google Scholar] [CrossRef] [PubMed]
  66. Yang, J.; Gong, P.; Fu, R.; Zhang, M.; Chen, J.; Liang, S.; Xu, B.; Shi, J.; Dickinson, R. Erratum: The role of satellite remote sensing in climate change studies. Nat. Clim. Chang. 2013, 4, 74. [Google Scholar] [CrossRef]
  67. Yu, C.; Huang, X.; Chen, H.; Godfray, H.C.J.; Wright, J.S.; Hall, J.W.; Gong, P.; Ni, S.Q.; Qiao, S.C.; Huang, G.R.; et al. Managing nitrogen to restore water quality in China. Nature 2019, 567, 516–520. [Google Scholar] [CrossRef]
  68. Lin, L.G.; Wei, X.D.; Luo, P.P.; Wang, S.N.; Kong, D.H.; Yang, J. Ecological Security Patterns at Different Spatial Scales on the Loess Plateau. Remote Sens. 2023, 15, 1011. [Google Scholar] [CrossRef]
  69. Lyu, H.; Lu, H.; Mou, L.; Li, W.; Wright, J.; Li, X.; Li, X.; Zhu, X.X.; Wang, J.; Yu, L.; et al. Long-Term Annual Mapping of Four Cities on Different Continents by Applying a Deep Information Learning Method to Landsat Data. Remote Sens. 2018, 10, 471. [Google Scholar] [CrossRef]
  70. Huang, X.; Hu, T.; Li, J.Y.; Wang, Q.; Benediktsson, J.A. Mapping urban areas in china using multisource data with a novel ensemble SVM method. IEEE Trans. Geosci. Remote 2018, 56, 4258–4273. [Google Scholar] [CrossRef]
  71. Guo, B.; Wu, H.; Pei, L.; Zhu, X.; Zhang, D.; Wang, Y.; Luo, P. Study on the spatiotemporal dynamic of ground-level ozone concentrations on multiple scales across China during the blue sky protection campaign. Environ. Int. 2022, 170, 107606. [Google Scholar] [CrossRef]
  72. Wang, Z.; Luo, P.; Zha, X.; Xu, C.; Kang, S.; Zhou, M.; Nover, D.; Wang, Y. Overview assessment of risk evaluation and treatment technologies for heavy metal pollution of water and soil. J. Clean. Prod. 2022, 379, 134043. [Google Scholar] [CrossRef]
  73. Li, J.; Gao, Y.; Huang, X. The impact of urban agglomeration on ozone precursor conditions: A systematic investigation across global agglomerations utilizing multi-source geospatial datasets. Sci. Total Environ. 2020, 704, 135458. [Google Scholar] [CrossRef] [PubMed]
Figure 1. Frame diagram of the TVGM-USWM model.
Remotesensing 15 02383 g001
Figure 2. Structure diagram of the TVGM-USWM model parameter optimization.
Remotesensing 15 02383 g002
Figure 3. Location and information of the Huangtaiqiao drainage basin.
Remotesensing 15 02383 g003
Figure 4. The 120 min rainfall processes of different return periods.
Remotesensing 15 02383 g004
Figure 5. The simulation of flood events at the outlet of the Huangtaiqiao drainage basin.
Remotesensing 15 02383 g005
Figure 6. Temporal changes of land covers in the Huangtaiqiao drainage basin from 1990 to 2020.
Remotesensing 15 02383 g006
Figure 7. Spatial expansion of impervious area in the Huangtaiqiao drainage basin from 1990 to 2020.
Remotesensing 15 02383 g007
Figure 8. The design flood hydrographs for different urbanization scenarios.
Remotesensing 15 02383 g008
Figure 9. Characteristics of hydrological elements in design flood processes.
Remotesensing 15 02383 g009
Table 1. The TVGM-USWM model parameters and their ranges for model calibration.
IDNameDefinitionRange
1NIAManning’s n—impervious area0.011~0.05
2NPAManning’s n—pervious area0.011~0.41
3dIAStorage depth—impervious area/mm1~20
4dPAStorage depth—pervious area/mm1~50
5g1Average runoff generation coefficient0~1
6g2Exponent reflecting the impact of soil moisture on runoff0~1
7g3Exponent reflecting the impact of rainfall intensity on runoff0~1
8WmMaximum moisture storage capacity/mm100~1000
9WdStorage capacity recovery time/days3~7
10CSInfiltration coefficient of depression storage in pervious area during dry weather0.01~0.3
11NriverManning’s n—river channel0.010~0.140
12NpipeManning’s n—pipeline0.010~0.026
Table 2. The simulation performance of flood events.
PeriodFloodRNSREPAET
Calibration period18 June 20040.772.27%−1
2 July 20050.854.36%−1
3 August 20060.878.64%0.5
Validation
period
31 July 20060.8834.47%−0.5
18 July 20080.7617%−1
9 July 20130.828.28%−1.5
Table 3. Changes in design flood processes under different urbanization scenarios.
Return PeriodUrbanization
Scenario
Precipitation
mm
Runoff
mm
Runoff
Coefficient
Peak Flow
m3/s
Time-to-Peak
h
T = 01a199051.918.820.17117.515.25
202051.9114.020.27151.74.75
T = 10a199091.7317.430.19161.354.75
202091.7327.520.3211.24.25
T = 20a1990103.7221.780.21203.314.25
2020103.7233.190.32280.813.75
T = 50a1990119.5727.50.23237.293.75
2020119.5740.650.34328.743.5
T = 100a1990131.5632.890.25268.383.5
2020131.5647.360.36364.643.25
Disclaimer/Publisher’s Note: The statements, opinions and data contained in all publications are solely those of the individual author(s) and contributor(s) and not of MDPI and/or the editor(s). MDPI and/or the editor(s) disclaim responsibility for any injury to people or property resulting from any ideas, methods, instructions or products referred to in the content.

