
Combining LSTM and PLUS Models to Predict Future Urban Land Use and Land Cover Change: A Case in Dongying City, China


Abstract
:1. Introduction
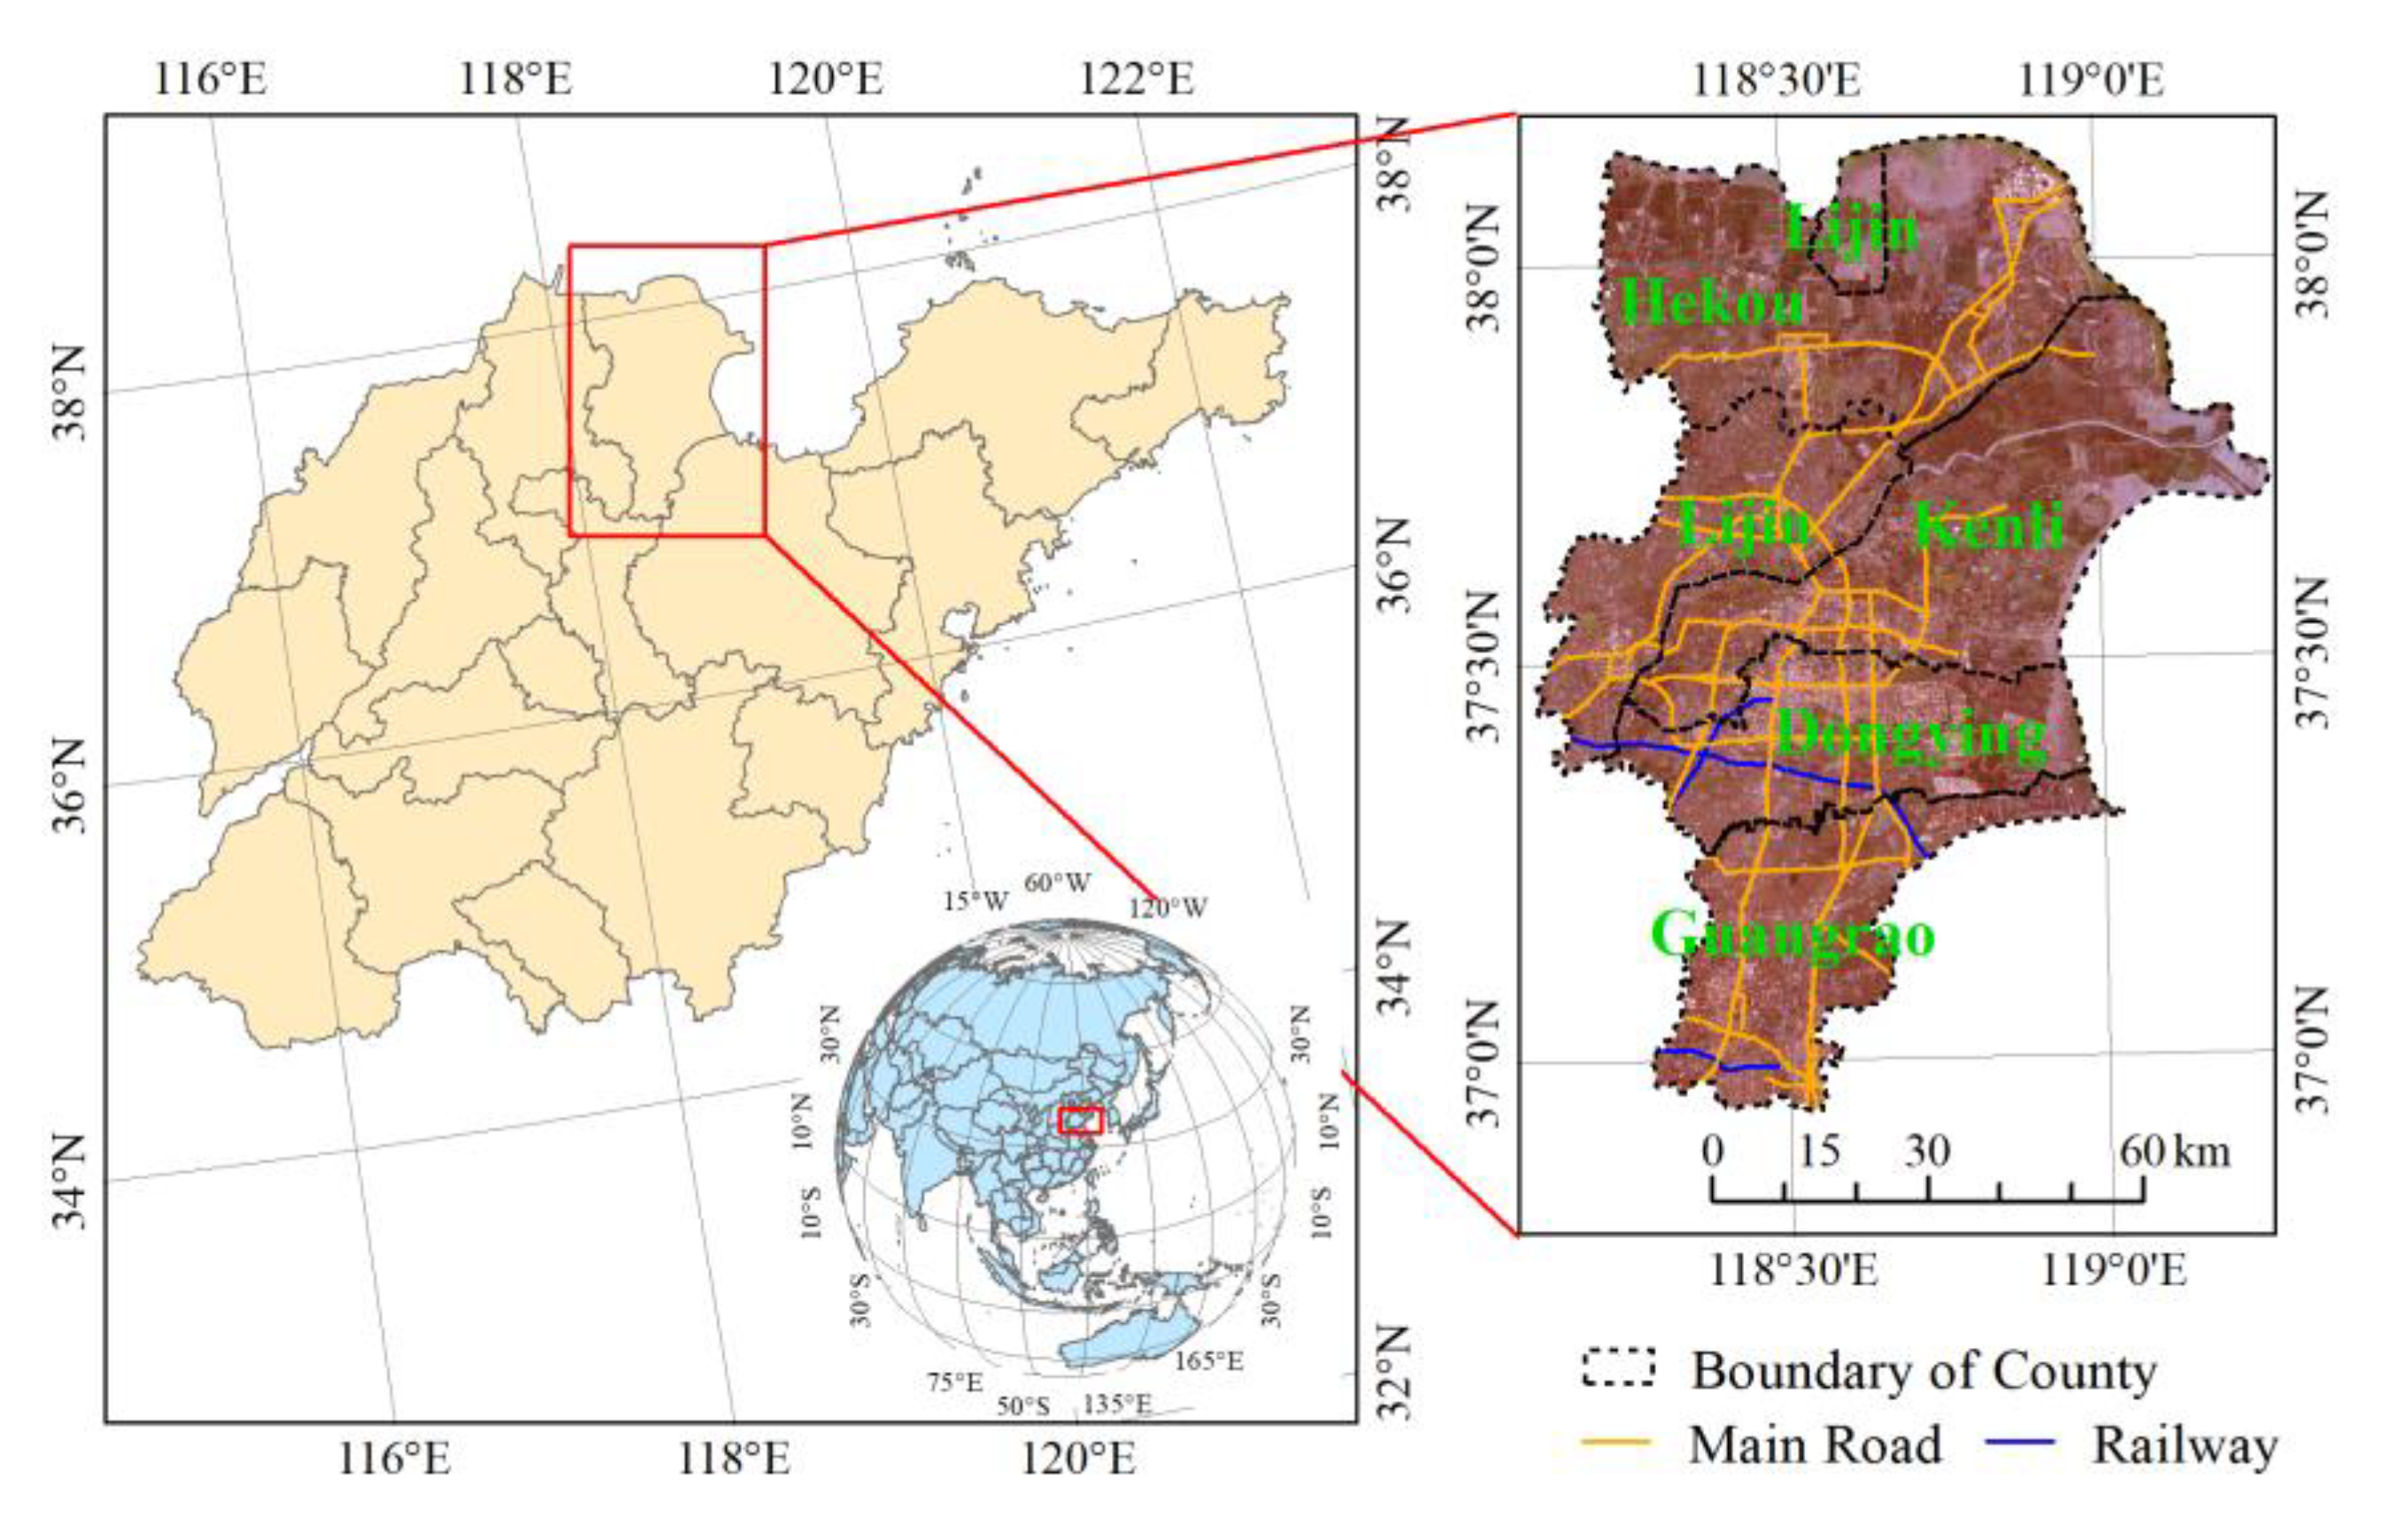
2. Study Area
3. Material and Methods
3.1. Data Acquisition
3.2. Methodology
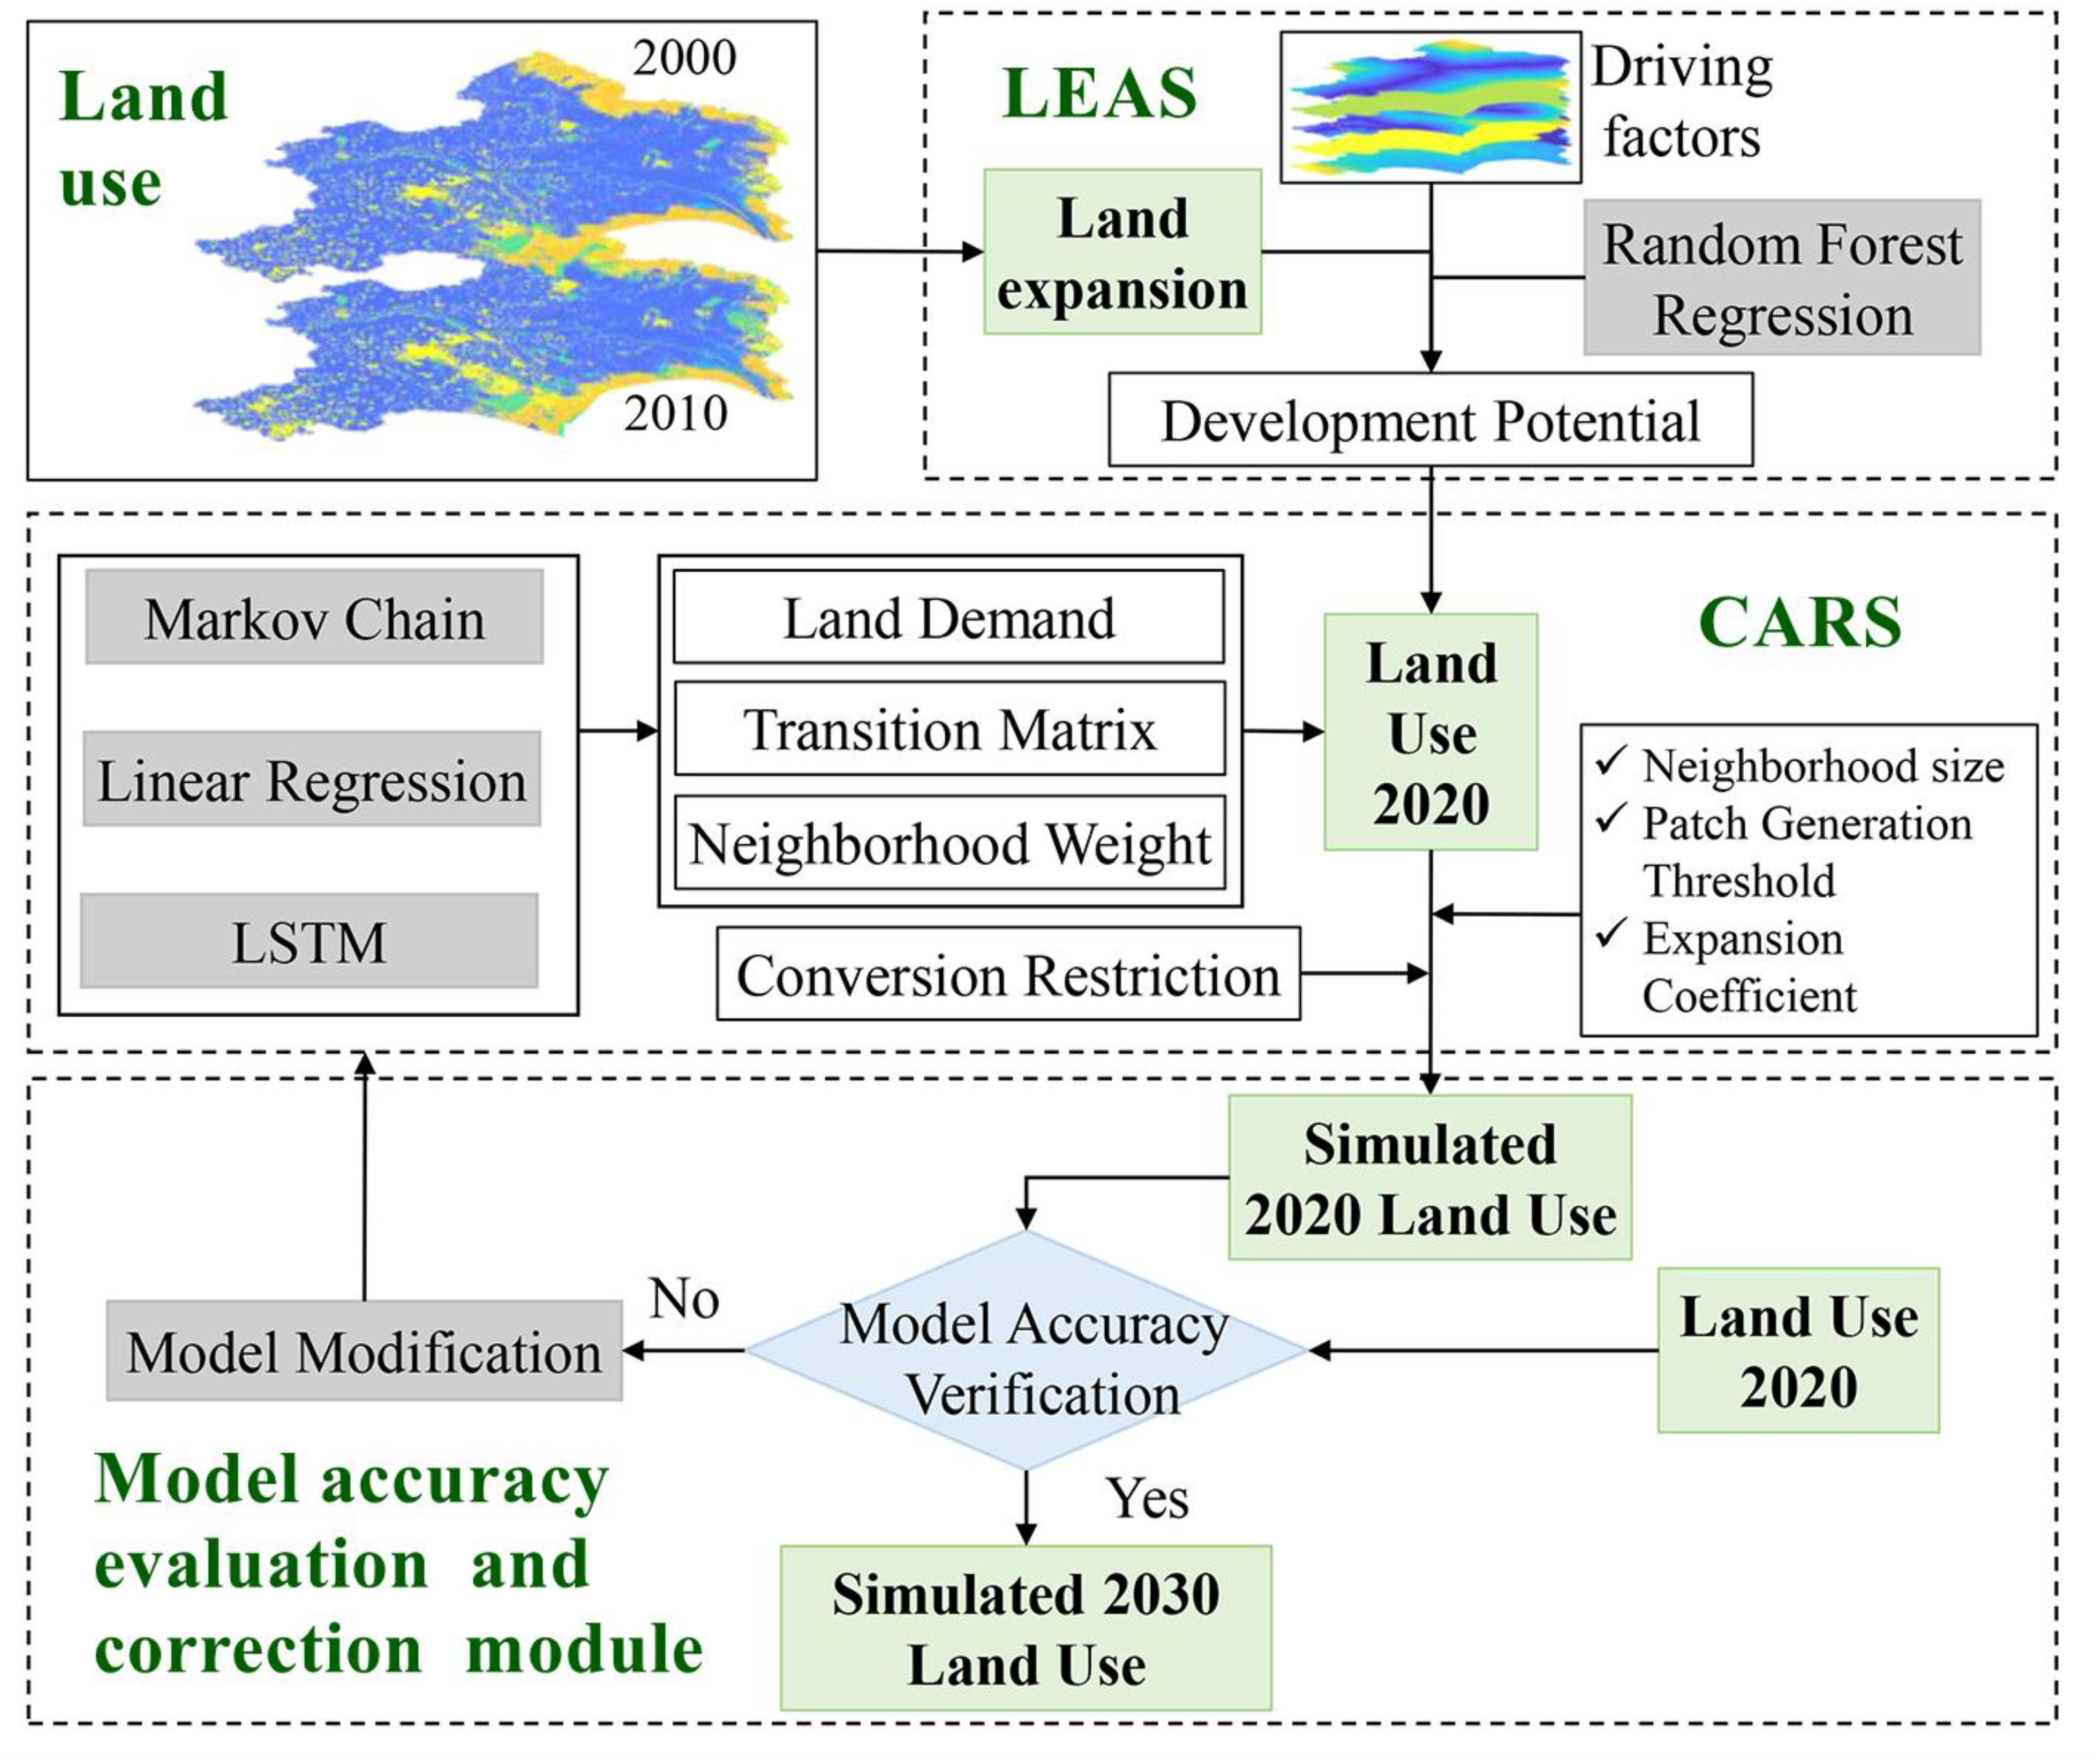
3.2.1. Research Framework
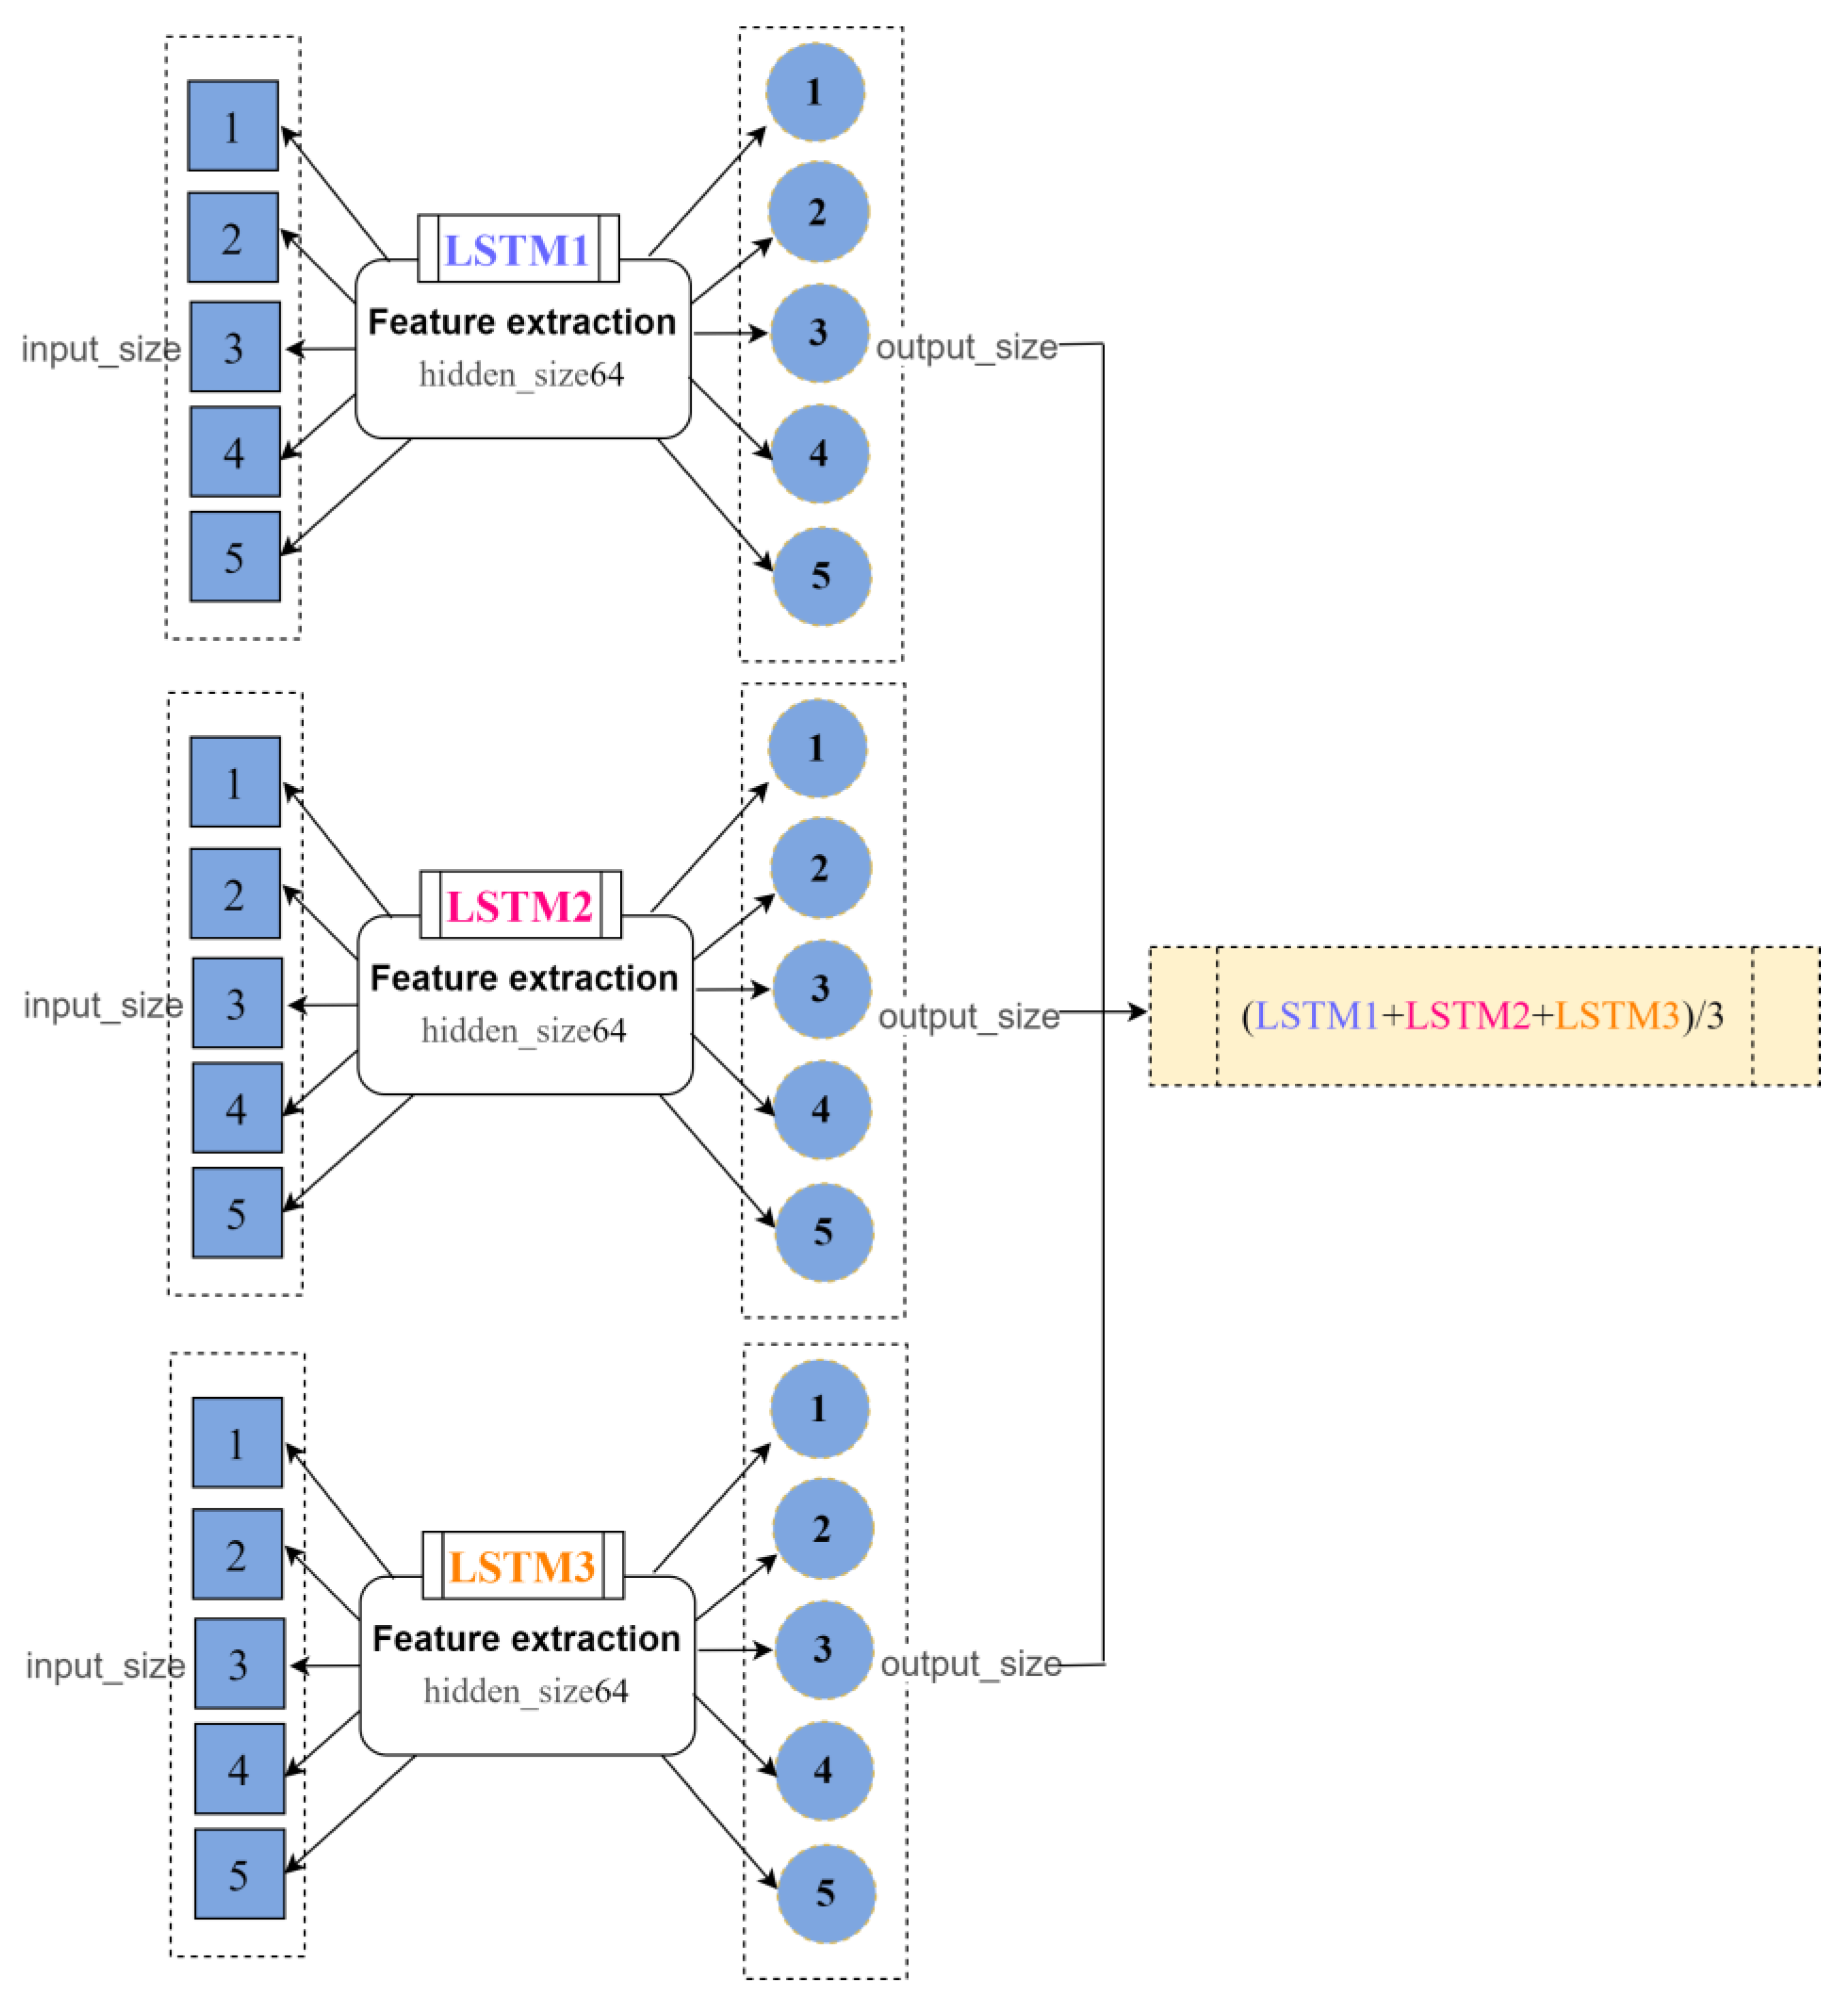
3.2.2. Long Short-Term Memory
3.2.3. Patch-Generating Land Use Simulation Model
- 1.
- Land expansion analysis strategy
- 2.
- CA model based on multi-type random patch seeding
3.2.4. Accuracy Verification
4. Results
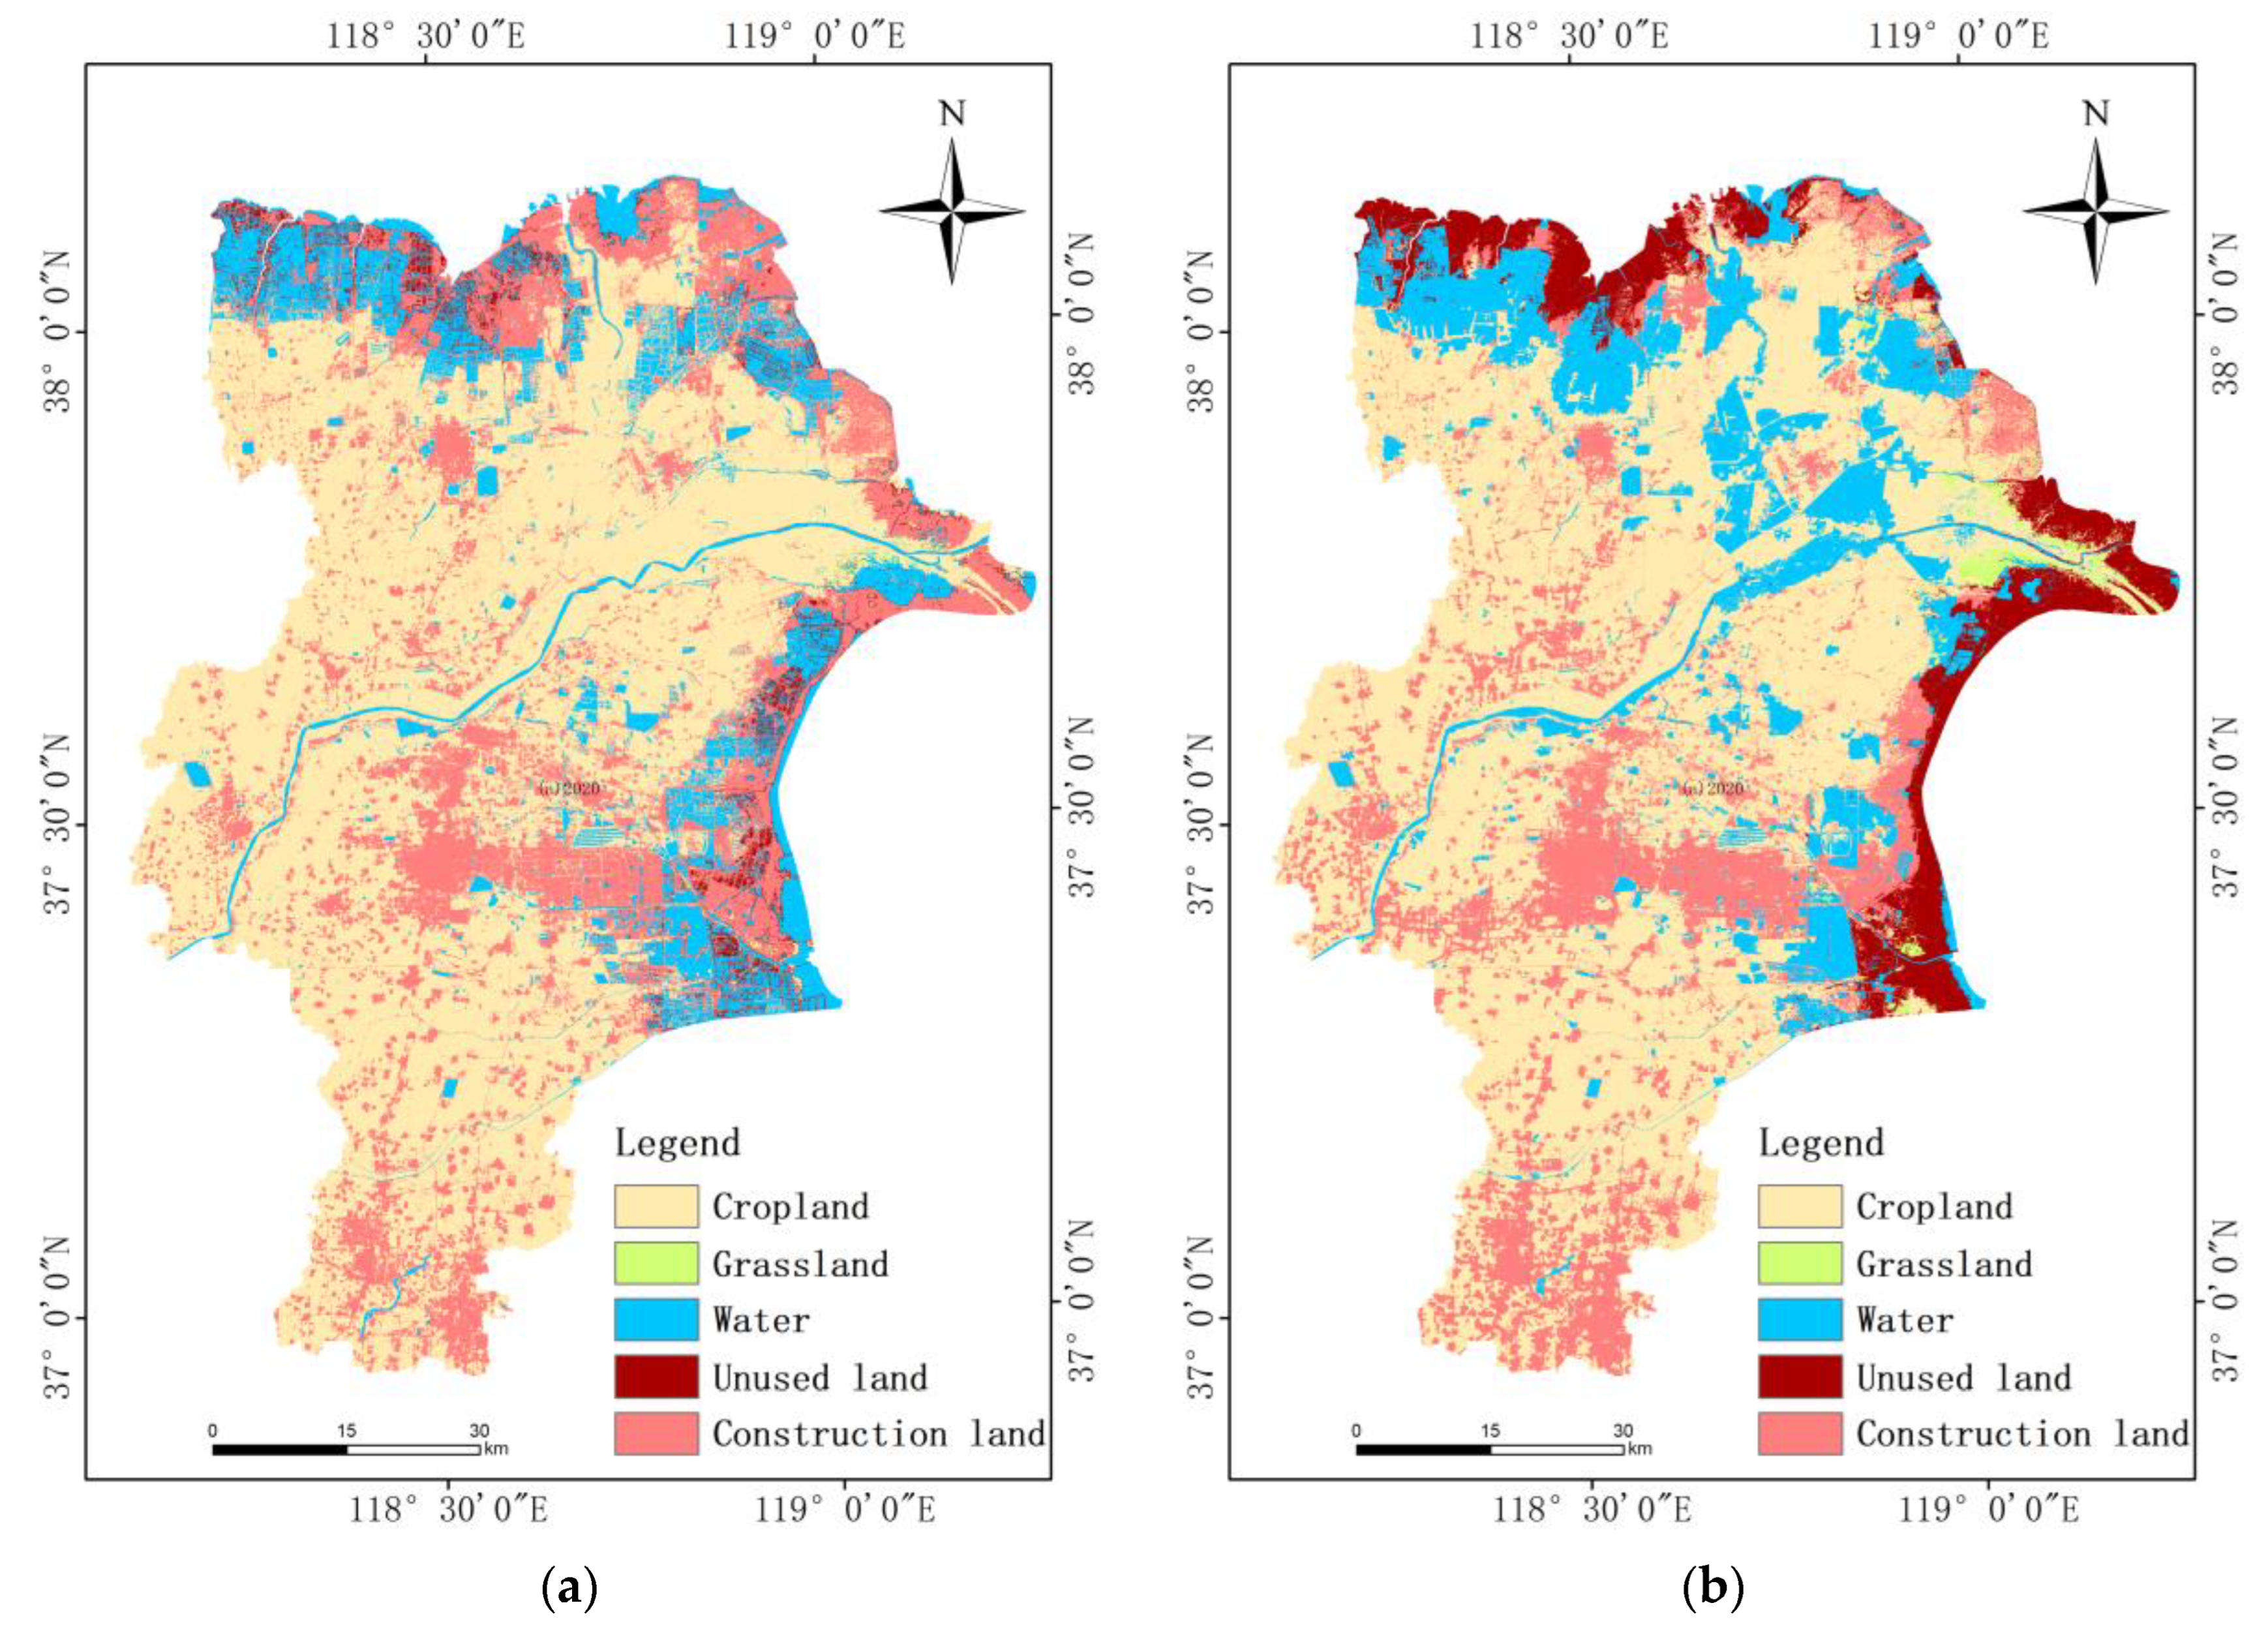
4.1. Land Use Multi-Scenario Simulation
4.2. PLUS Simulation of Natural Development Scenario
4.3. PLUS Simulation of Ecological Development Priority Scenario
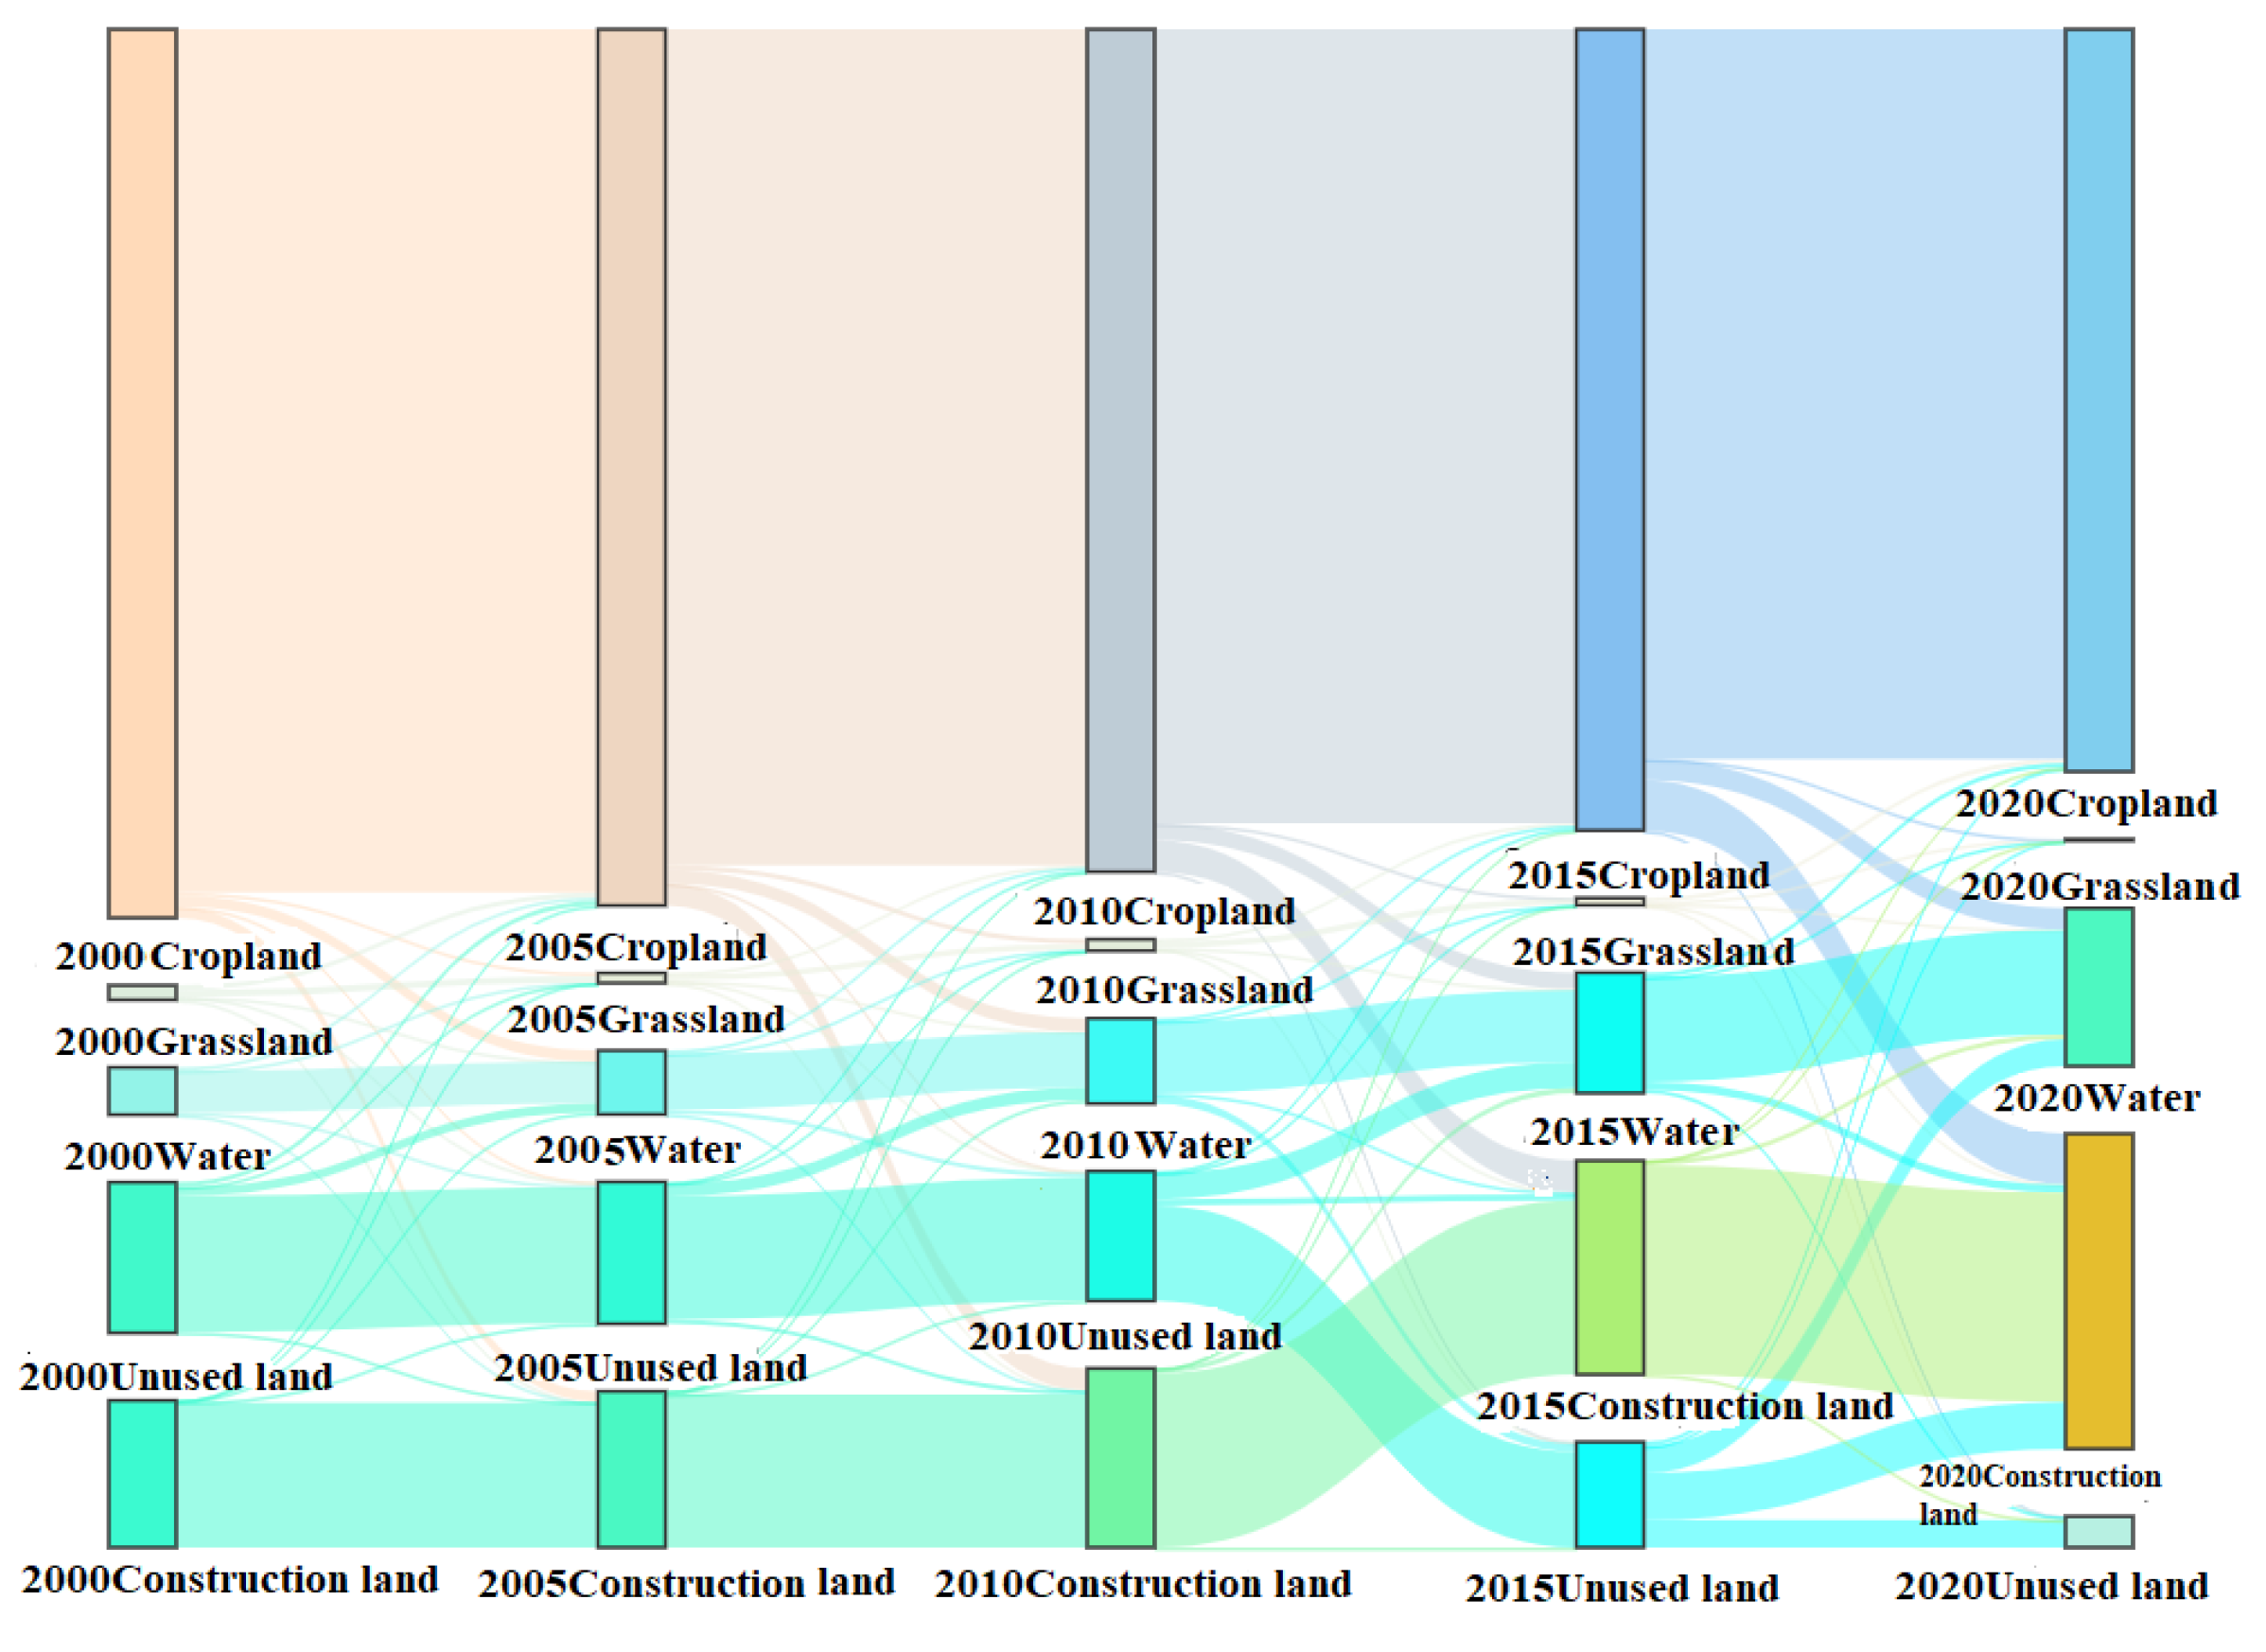
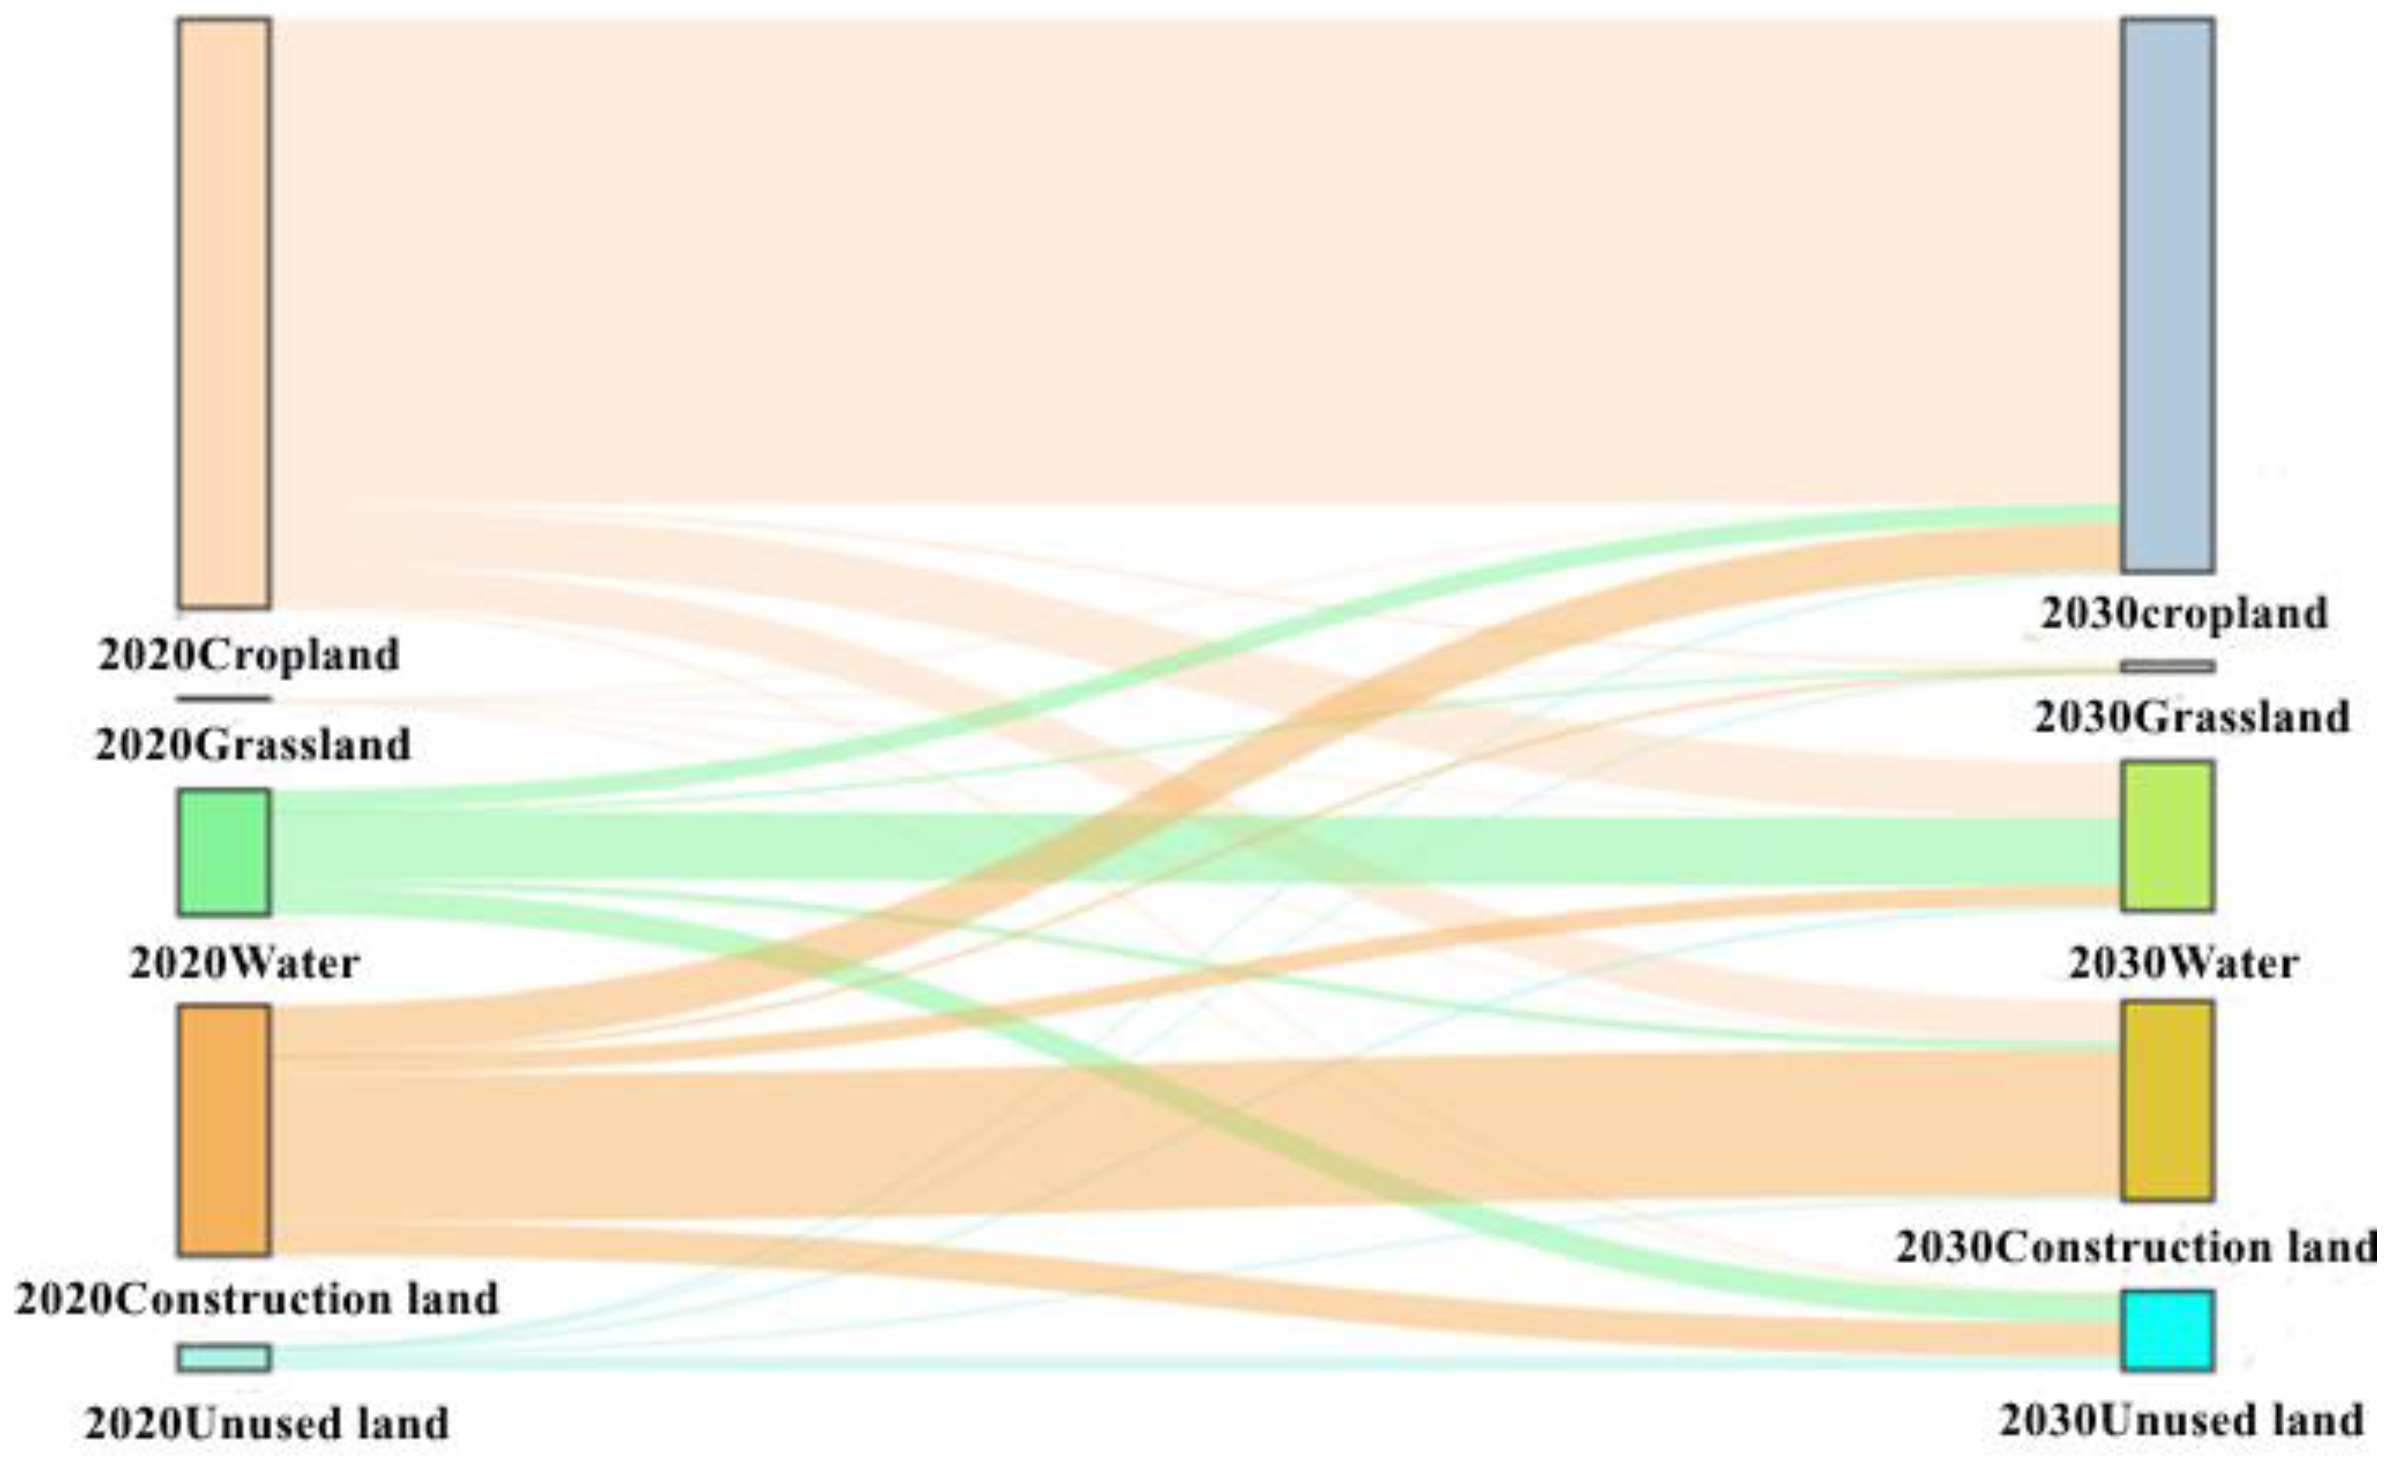
4.4. Land Use Conversion from 2020 to 2030
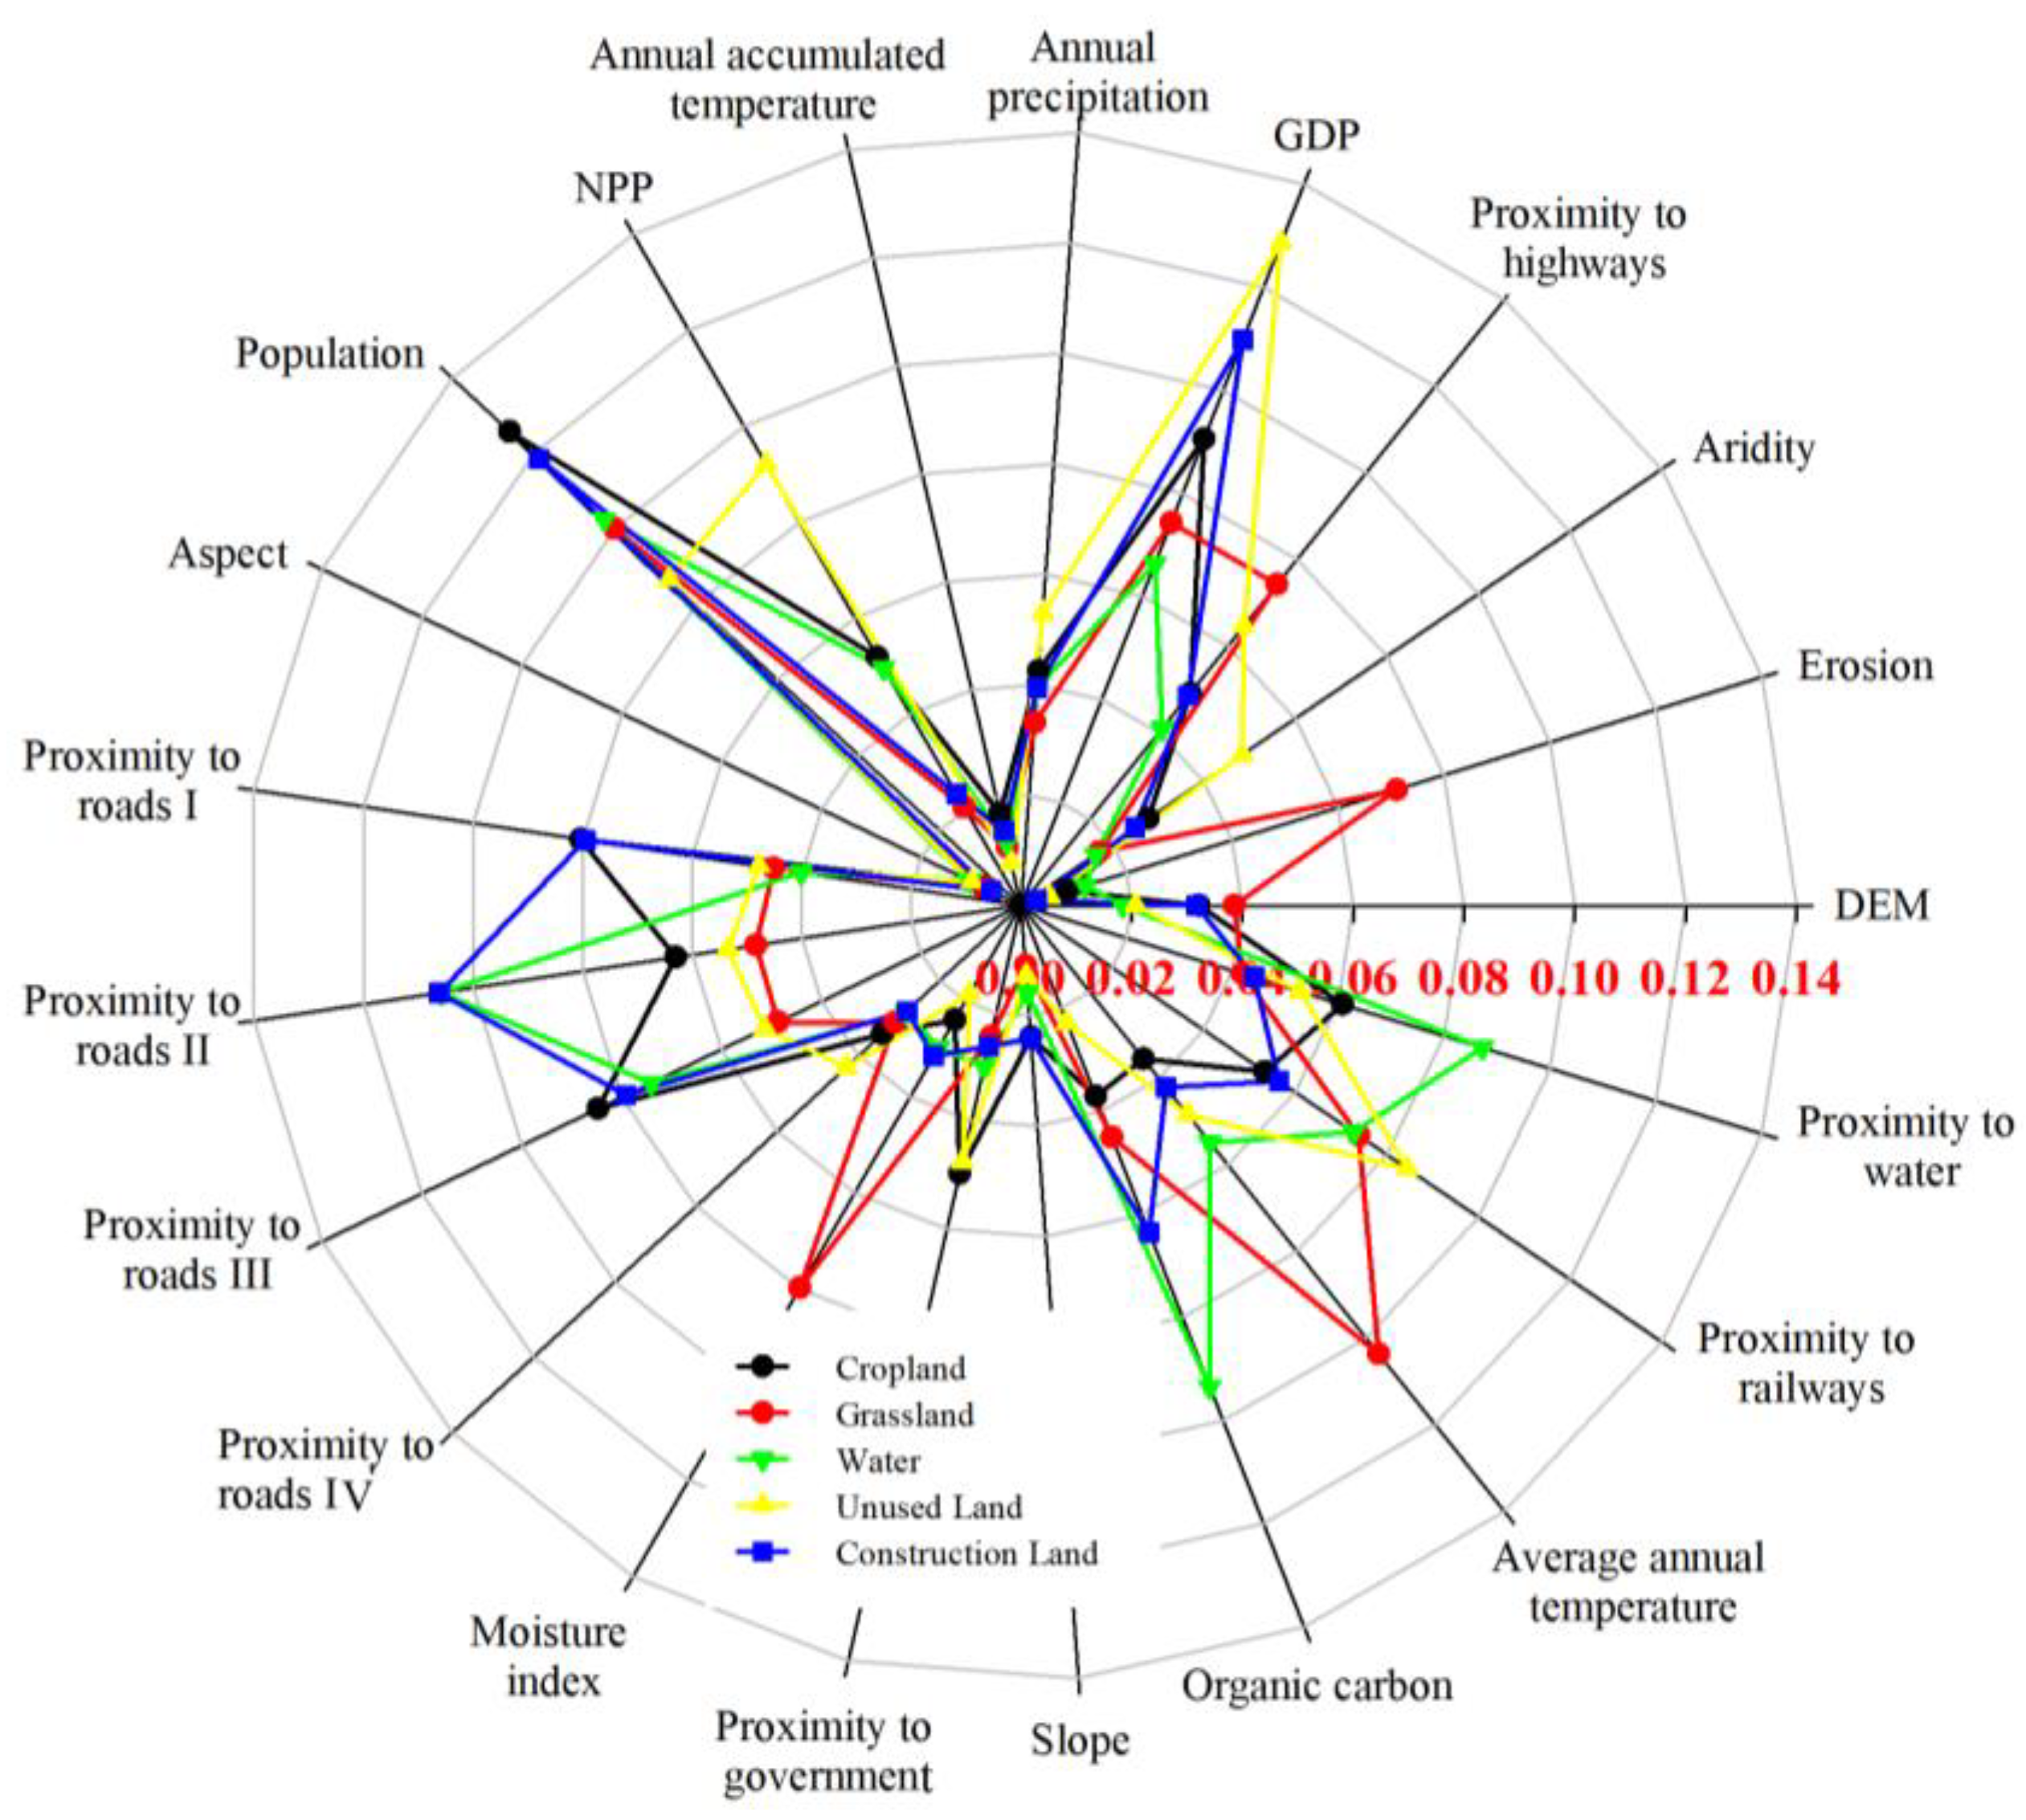
4.5. Contribution of Driving Factors
5. Discussion
5.1. Uniqueness of the Study Area
5.2. Improved PLUS Model Based on LSTM
5.3. Multi-Scenario Analysis
6. Conclusions
Author Contributions
Funding
Data Availability Statement
Conflicts of Interest
References
- Brown, D.G.; Walker, R.; Manson, S.; Seto, K. Modeling land use and land cover change. In Land Change Science: Observing, Monitoring and Understanding Trajectories of Change on the Earth’s Surface; Kluwer Academic Publisher: London, UK, 2004; pp. 395–409. [Google Scholar] [CrossRef]
- Ilyasd, M.; Yasir, M.; Hossain, M.S. Urban Area Extraction and Land Use Land Cover Monitoring of Charsadda District, Pakistan. Earth Sci. Malays. (ESMY) 2022, 6, 96–102. [Google Scholar] [CrossRef]
- Baker, W.L. A review of models of landscape change. Landsc. Ecol. 1989, 2, 111–133. [Google Scholar] [CrossRef]
- Lambin, E.F. Modelling and monitoring land-cover change processes in tropical regions. Prog. Phys. Geogr. 1997, 21, 375–393. [Google Scholar] [CrossRef]
- Aburas, M.M.; Ahamad, M.S.S.; Omar, N.Q. Spatio-temporal simulation and prediction of land-use change using conventional and machine learning models: A review. Environ. Monit. Assess. 2019, 191, 205. [Google Scholar] [CrossRef]
- Alghais, N.; Pullar, D. Modelling future impacts of urban development in Kuwait with the use of ABM and GIS. Trans. GIS 2018, 22, 20–42. [Google Scholar] [CrossRef]
- Islam, K.; Jashimuddin, M.; Nath, B.; Nath, T.K. Land use classification and change detection by using multi-temporal remotely sensed imagery: The case of Chunati wildlife sanctuary, Bangladesh. Egypt. J. Remote Sens. Space Sci. 2018, 21, 37–47. [Google Scholar] [CrossRef]
- Ji, W.; Ma, J.; Twibell, R.W.; Underhill, K. Characterizing urban sprawl using multi-stage remote sensing images and landscape metrics. Comput. Environ. Urban Syst. 2006, 30, 861–879. [Google Scholar] [CrossRef]
- Mundia, C.N.; Aniya, M. Analysis of land use/cover changes and urban expansion of Nairobi city using remote sensing and GIS. Int. J. Remote Sens. 2005, 26, 2831–2849. [Google Scholar] [CrossRef]
- Huang, W.; Liu, H.; Luan, Q.; Jiang, Q.; Liu, J.; Liu, H. Detection and prediction of land use change in Beijing based on remote sensing and GIS. Int. Arch. Photogramm. Remote Sens. Spat. Inf. Sci 2008, 37, 75–82. [Google Scholar]
- Liu, M.; Hu, Y.; Chang, Y.; He, X.; Zhang, W. Land use and land cover change analysis and prediction in the upper reaches of the Minjiang River, China. Environ. Manag. 2009, 43, 899–907. [Google Scholar] [CrossRef] [PubMed]
- Araya, Y.H.; Cabral, P. Analysis and modeling of urban land cover change in Setúbal and Sesimbra, Portugal. Remote Sens. 2010, 2, 1549–1563. [Google Scholar] [CrossRef]
- KantaKumar, N.L.; Sawant, N.G.; Kumar, S. Forecasting urban growth based on GIS, RS and SLEUTH model in Pune metropolitan area. Int. J. Geomat. Geosci. 2011, 2, 568–579. [Google Scholar]
- Park, S.; Jeon, S.; Choi, C. Mapping urban growth probability in South Korea: Comparison of frequency ratio, analytic hierarchy process, and logistic regression models and use of the environmental conservation value assessment. Landsc. Ecol. Eng. 2012, 8, 17–31. [Google Scholar] [CrossRef]
- Al-Sharif, A.A.; Pradhan, B. Monitoring and predicting land use change in Tripoli Metropolitan City using an integrated Markov chain and cellular automata models in GIS. Arab. J. Geosci. 2014, 7, 4291–4301. [Google Scholar] [CrossRef]
- Tayyebi, A.; Pekin, B.K.; Pijanowski, B.C.; Plourde, J.D.; Doucette, J.S.; Braun, D. Hierarchical modeling of urban growth across the conterminous USA: Developing meso-scale quantity drivers for the Land Transformation Model. J. Land Use Sci. 2013, 8, 422–442. [Google Scholar] [CrossRef]
- Mishra, V.N.; Rai, P.K.; Mohan, K. Prediction of land use changes based on land change modeler (LCM) using remote sensing: A case study of Muzaffarpur (Bihar), India. J. Geogr. Inst. Jovan Cvijic SASA 2014, 64, 111–127. [Google Scholar] [CrossRef]
- Liu, X.; Liang, X.; Li, X.; Xu, X.; Ou, J.; Chen, Y.; Li, S.; Wang, S.; Pei, F. A future land use simulation model (FLUS) for simulating multiple land use scenarios by coupling human and natural effects. Landsc. Urban Plan. 2017, 168, 94–116. [Google Scholar] [CrossRef]
- Qiang, Y.; Lam, N.S. Modeling land use and land cover changes in a vulnerable coastal region using artificial neural networks and cellular automata. Environ. Monit. Assess. 2015, 187, 57. [Google Scholar] [CrossRef]
- Abdullahi, S.; Pradhan, B. Sustainable brownfields land use change modeling using GIS-Based weights-of-evidence approach. Appl. Spat. Anal. Policy 2016, 9, 21–38. [Google Scholar] [CrossRef]
- Abdullahi, S.; Pradhan, B.; Mojaddadi, H. City compactness: Assessing the influence of the growth of residential land use. J. Urban Technol. 2018, 25, 21–46. [Google Scholar] [CrossRef]
- Mustafa, A.; Rienow, A.; Saadi, I.; Cools, M.; Teller, J. Comparing support vector machines with logistic regression for calibrating cellular automata land use change models. Eur. J. Remote Sens. 2018, 51, 391–401. [Google Scholar] [CrossRef]
- Zhang, Y.; Luo, J.; Zhang, Y.; Huang, Y.; Cai, X.; Yang, J.; Mao, D.; Li, J.; Tuo, X.; Zhang, Y. Resolution Enhancement for Large-Scale Real Beam Mapping Based on Adaptive Low-Rank Approximation. IEEE Trans. Geosci. Remote Sens. 2022, 60, 1–21. [Google Scholar] [CrossRef]
- Wang, P.; Yu, P.; Lu, J.; Zhang, Y. The mediation effect of land surface temperature in the relationship between land use-cover change and energy consumption under seasonal variations. J. Clean. Prod. 2022, 340, 130804. [Google Scholar] [CrossRef]
- Zhang, S.; Bai, X.; Zhao, C.; Tan, Q.; Luo, G.; Wang, J.; Li, Q.; Wu, L.; Chen, F.; Li, C. Global CO2 consumption by silicate rock chemical weathering: Its past and future. Earth’s Future 2021, 9, e2020EF001938. [Google Scholar] [CrossRef]
- Xu, L.; Liu, X.; Tong, D.; Liu, Z.; Yin, L.; Zheng, W. Forecasting urban land use change based on cellular automata and the PLUS model. Land 2022, 11, 652. [Google Scholar] [CrossRef]
- Liu, X.; Kong, M.; Tong, D.; Zeng, X.; Lai, Y. Property rights and adjustment for sustainable development during post-productivist transitions in China. Land Use Policy 2022, 122, 106379. [Google Scholar] [CrossRef]
- Tong, D.; Chu, J.; Han, Q.; Liu, X. How land finance drives urban expansion under fiscal pressure: Evidence from Chinese cities. Land 2022, 11, 253. [Google Scholar] [CrossRef]
- Liu, X.; Li, Z.; Fu, X.; Yin, Z.; Liu, M.; Yin, L.; Zheng, W. Monitoring House Vacancy Dynamics in The Pearl River Delta Region: A Method Based on NPP-VIIRS Night-Time Light Remote Sensing Images. Land 2023, 12, 831. [Google Scholar] [CrossRef]
- Liu, Z.; Xu, J.; Liu, M.; Yin, Z.; Liu, X.; Yin, L.; Zheng, W. Remote sensing and geostatistics in urban water-resource monitoring: A review. Mar. Freshw. Res. 2023. [Google Scholar] [CrossRef]
- Sun, R.; Fu, L.; Cheng, Q.; Chiang, K.-W.; Chen, W. Resilient Pseudorange Error Prediction and Correction for GNSS Positioning in Urban Areas. IEEE Internet Things J. 2023. [Google Scholar] [CrossRef]
- Liu, Y.; Zhang, K.; Li, Z.; Liu, Z.; Wang, J.; Huang, P. A hybrid runoff generation modelling framework based on spatial combination of three runoff generation schemes for semi-humid and semi-arid watersheds. J. Hydrol. 2020, 590, 125440. [Google Scholar] [CrossRef]
- Xu, D.; Zhu, D.; Deng, Y.; Sun, Q.; Ma, J.; Liu, F. Evaluation and empirical study of Happy River on the basis of AHP: A case study of Shaoxing City (Zhejiang, China). Mar. Freshw. Res. 2023. [Google Scholar] [CrossRef]
- Zhao, X.; Wang, P.; Yasir, M.; Liu, Z. Decision support system based on spatial and temporal pattern evolution of ecological environmental quality in the Yellow River Delta from 2000 to 2020. Soft Comput. 2022, 26, 11033–11044. [Google Scholar] [CrossRef]
- Liang, X.; Guan, Q.; Clarke, K.C.; Liu, S.; Wang, B.; Yao, Y. Understanding the drivers of sustainable land expansion using a patch-generating land use simulation (PLUS) model: A case study in Wuhan, China. Comput. Environ. Urban Syst. 2021, 85, 101569. [Google Scholar] [CrossRef]
- Lu, C.; Qi, X.; Zheng, Z.; Jia, K. PLUS-model based multi-scenario land space simulation of the Lower Yellow River Region and its ecological effects. Sustainability 2022, 14, 6942. [Google Scholar] [CrossRef]
- Lin, Z.; Peng, S. Comparison of multimodel simulations of land use and land cover change considering integrated constraints-A case study of the Fuxian Lake basin. Ecol. Indic. 2022, 142, 109254. [Google Scholar] [CrossRef]
- Bao, S.; Yang, F. Spatio-temporal dynamic of the land use/cover change and scenario simulation in the southeast coastal shelterbelt system construction project region of China. Sustainability 2022, 14, 8952. [Google Scholar] [CrossRef]
- Yang, W.; Du, J.; He, H.; Yang, W.; Chen, L. Urban growth boundary delimitation in Guangzhou city based on PLUS-UGB multi-scenarios simulation. Geospat. Inf 2022, 20, 38–42. [Google Scholar]
- Gao, L.; Tao, F.; Liu, R.; Wang, Z.; Leng, H.; Zhou, T. Multi-scenario simulation and ecological risk analysis of land use based on the PLUS model: A case study of Nanjing. Sustain. Cities Soc. 2022, 85, 104055. [Google Scholar] [CrossRef]
- Li, X.; Fu, J.; Jiang, D.; Lin, G.; Cao, C. Land use optimization in Ningbo City with a coupled GA and PLUS model. J. Clean. Prod. 2022, 375, 134004. [Google Scholar] [CrossRef]
- Wang, J.; Zhang, J.; Xiong, N.; Liang, B.; Wang, Z.; Cressey, E.L. Spatial and temporal variation, simulation and prediction of land use in ecological conservation area of Western Beijing. Remote Sens. 2022, 14, 1452. [Google Scholar] [CrossRef]
- Rumelhart, D.E.; Hinton, G.E.; Williams, R.J. Learning representations by back-propagating errors. Nature 1986, 323, 533–536. [Google Scholar] [CrossRef]
- Yu, Y.; Si, X.; Hu, C.; Zhang, J. A review of recurrent neural networks: LSTM cells and network architectures. Neural Comput. 2019, 31, 1235–1270. [Google Scholar] [CrossRef]
- Xu, T.; Zhou, D.; Li, Y. Integrating ANNs and Cellular Automata–Markov Chain to Simulate Urban Expansion with Annual Land Use Data. Land 2022, 11, 1074. [Google Scholar] [CrossRef]
- Boulila, W.; Ghandorh, H.; Khan, M.A.; Ahmed, F.; Ahmad, J. A novel CNN-LSTM-based approach to predict urban expansion. Ecol. Inform. 2021, 64, 101325. [Google Scholar] [CrossRef]
- Wang, H.; Zhao, X.; Zhang, X.; Wu, D.; Du, X. Long time series land cover classification in China from 1982 to 2015 based on Bi-LSTM deep learning. Remote Sens. 2019, 11, 1639. [Google Scholar] [CrossRef]
- Mohanrajan, S.N.; Loganathan, A. Novel vision transformer–based bi-LSTM model for LU/LC prediction—Javadi Hills, India. Appl. Sci. 2022, 12, 6387. [Google Scholar] [CrossRef]
- Yang, J.; Huang, X. The 30 m annual land cover dataset and its dynamics in China from 1990 to 2019. Earth Syst. Sci. Data 2021, 13, 3907–3925. [Google Scholar] [CrossRef]
- Hochreiter, S.; Schmidhuber, J. Long short-term memory. Neural Comput. 1997, 9, 1735–1780. [Google Scholar] [CrossRef]
- Tsokos, C.P.; Welch, R. Bayes discrimination with mean square error loss. Pattern Recognit. 1978, 10, 113–123. [Google Scholar] [CrossRef]
- Perica, S.; Foufoula-Georgiou, E. Model for multiscale disaggregation of spatial rainfall based on coupling meteorological and scaling descriptions. J. Geophys. Res. Atmos. 1996, 101, 26347–26361. [Google Scholar] [CrossRef]
- Pontius, R.G.; Boersma, W.; Castella, J.-C.; Clarke, K.; De Nijs, T.; Dietzel, C.; Duan, Z.; Fotsing, E.; Goldstein, N.; Kok, K. Comparing the input, output, and validation maps for several models of land change. Ann. Reg. Sci. 2008, 42, 11–37. [Google Scholar] [CrossRef]


| Land Type | Cropland | Grassland | Water | Unused Land | Construction Land |
|---|---|---|---|---|---|
| Cropland | 4290.78 | 4.17 | 304.91 | 16.76 | 678.65 |
| Grassland | 39.51 | 4.47 | 15.57 | 4.92 | 22.16 |
| Water | 46.93 | 0.05 | 206.77 | 6.23 | 22.36 |
| Unused land | 45.11 | 0.53 | 347.81 | 153.98 | 350.76 |
| Construction Land | 1.59 | 0.01 | 66.89 | 3.79 | 804.10 |
| Data Type | Data Name | Sources |
|---|---|---|
| Natural factors | Slope | Original acquisition |
| Aspect | Original acquisition | |
| Soil erosion | http://www.resdc.cn | |
| DEM | https://earthdata.nasa.gov/ | |
| Average annual temperature | http://www.resdc.cn | |
| Annual accumulated temperature | http://www.resdc.cn | |
| Annual precipitation | http://www.resdc.cn | |
| Moisture index | http://www.resdc.cn | |
| Aridity | http://www.resdc.cn | |
| NPP | https://lpdaac.usgs.gov/ | |
| Soil organic carbon | https://data.isric.org/ | |
| Social and economic factors | population density | http://www.resdc.cn |
| GDP | http://www.resdc.cn | |
| Accessibility factors | Adjacent to highways | Euclidean distance |
| Adjacent to railways | Euclidean distance | |
| Adjacent to water | Euclidean distance | |
| Adjacent to government | Euclidean distance | |
| Adjacent to roads I (Multilane road) | Euclidean distance | |
| Adjacent to roads II (Two-lane road) | Euclidean distance | |
| Adjacent to roads III (Mixed driving two-lane road) | Euclidean distance | |
| Adjacent to roads IV (Mixed two-lane or single-lane road) | Euclidean distance |
| Land Type | 2020 Dongying District | 2030 Dongying District | 2020 Guangrao County | 2030 Guangrao County | 2020 Lijin County | 2030 Lijin County |
|---|---|---|---|---|---|---|
| Cropland | 539.78 | 481.52 | 782.60 | 720.11 | 897.45 | 850.63 |
| Grassland | 0.78 | 5.60 | 0.11 | 2.64 | 0.01 | 0.19 |
| Water | 148.24 | 126.05 | 77.10 | 46.31 | 53.82 | 51.25 |
| Unused land | 34.41 | 84.15 | 13.50 | 47.81 | 15.00 | 52.70 |
| Construction Land | 423.66 | 449.55 | 297.14 | 353.58 | 231.51 | 243.02 |
| Land Type | 2020 Hekou District | 2030 Hekou District | 2020 Kenli District | 2030 Kenli District |
|---|---|---|---|---|
| Cropland | 998.44 | 959.85 | 1204.68 | 1140.27 |
| Grassland | 0.53 | 6.66 | 7.8 | 51.65 |
| Water | 410.83 | 577.86 | 251.27 | 321.63 |
| Unused land | 76.79 | 200.55 | 45.97 | 211.74 |
| Construction Land | 456.38 | 198.05 | 469.46 | 253.9 |
| Prediction Method of Land Use Demand | Markov Chain | Linear Regression | LSTM L1 Loss | LSTM L2 Loss |
|---|---|---|---|---|
| 2020FoM | 0.0852 | 0.0928 | 0.1335 | 0.1293 |
| Number of Land Use Rasters | Cropland | Grassland | Water | Unused Land | Construction Land |
|---|---|---|---|---|---|
| Actual number in 2020 | 4915486 | 10257 | 1046601 | 206312 | 2086697 |
| MC-based predicts number of simulations | 4900257 | 111142 | 943662 | 679400 | 1645803 |
| LR-based predicts number of simulations | 5258616 | 49011 | 796388 | 713674 | 1345696 |
| LSTM L1 loss-based predicts number of simulations | 4940619 | 11282 | 1094461 | 221467 | 1997524 |
| Error (%) | 0.51% | 9.99% | 4.57% | 7.34% | −4.27% |
Disclaimer/Publisher’s Note: The statements, opinions and data contained in all publications are solely those of the individual author(s) and contributor(s) and not of MDPI and/or the editor(s). MDPI and/or the editor(s) disclaim responsibility for any injury to people or property resulting from any ideas, methods, instructions or products referred to in the content. |
© 2023 by the authors. Licensee MDPI, Basel, Switzerland. This article is an open access article distributed under the terms and conditions of the Creative Commons Attribution (CC BY) license (https://creativecommons.org/licenses/by/4.0/).
Share and Cite
Zhao, X.; Wang, P.; Gao, S.; Yasir, M.; Islam, Q.U. Combining LSTM and PLUS Models to Predict Future Urban Land Use and Land Cover Change: A Case in Dongying City, China. Remote Sens. 2023, 15, 2370. https://doi.org/10.3390/rs15092370
Zhao X, Wang P, Gao S, Yasir M, Islam QU. Combining LSTM and PLUS Models to Predict Future Urban Land Use and Land Cover Change: A Case in Dongying City, China. Remote Sensing. 2023; 15(9):2370. https://doi.org/10.3390/rs15092370
Chicago/Turabian StyleZhao, Xin, Ping Wang, Songhe Gao, Muhammad Yasir, and Qamar Ul Islam. 2023. "Combining LSTM and PLUS Models to Predict Future Urban Land Use and Land Cover Change: A Case in Dongying City, China" Remote Sensing 15, no. 9: 2370. https://doi.org/10.3390/rs15092370