
Spatial–Temporal Changes in Land Use and Their Driving Forces in the Circum-Bohai Coastal Zone of China from 2000 to 2020


Abstract
:1. Introduction
2. Study Area and Data
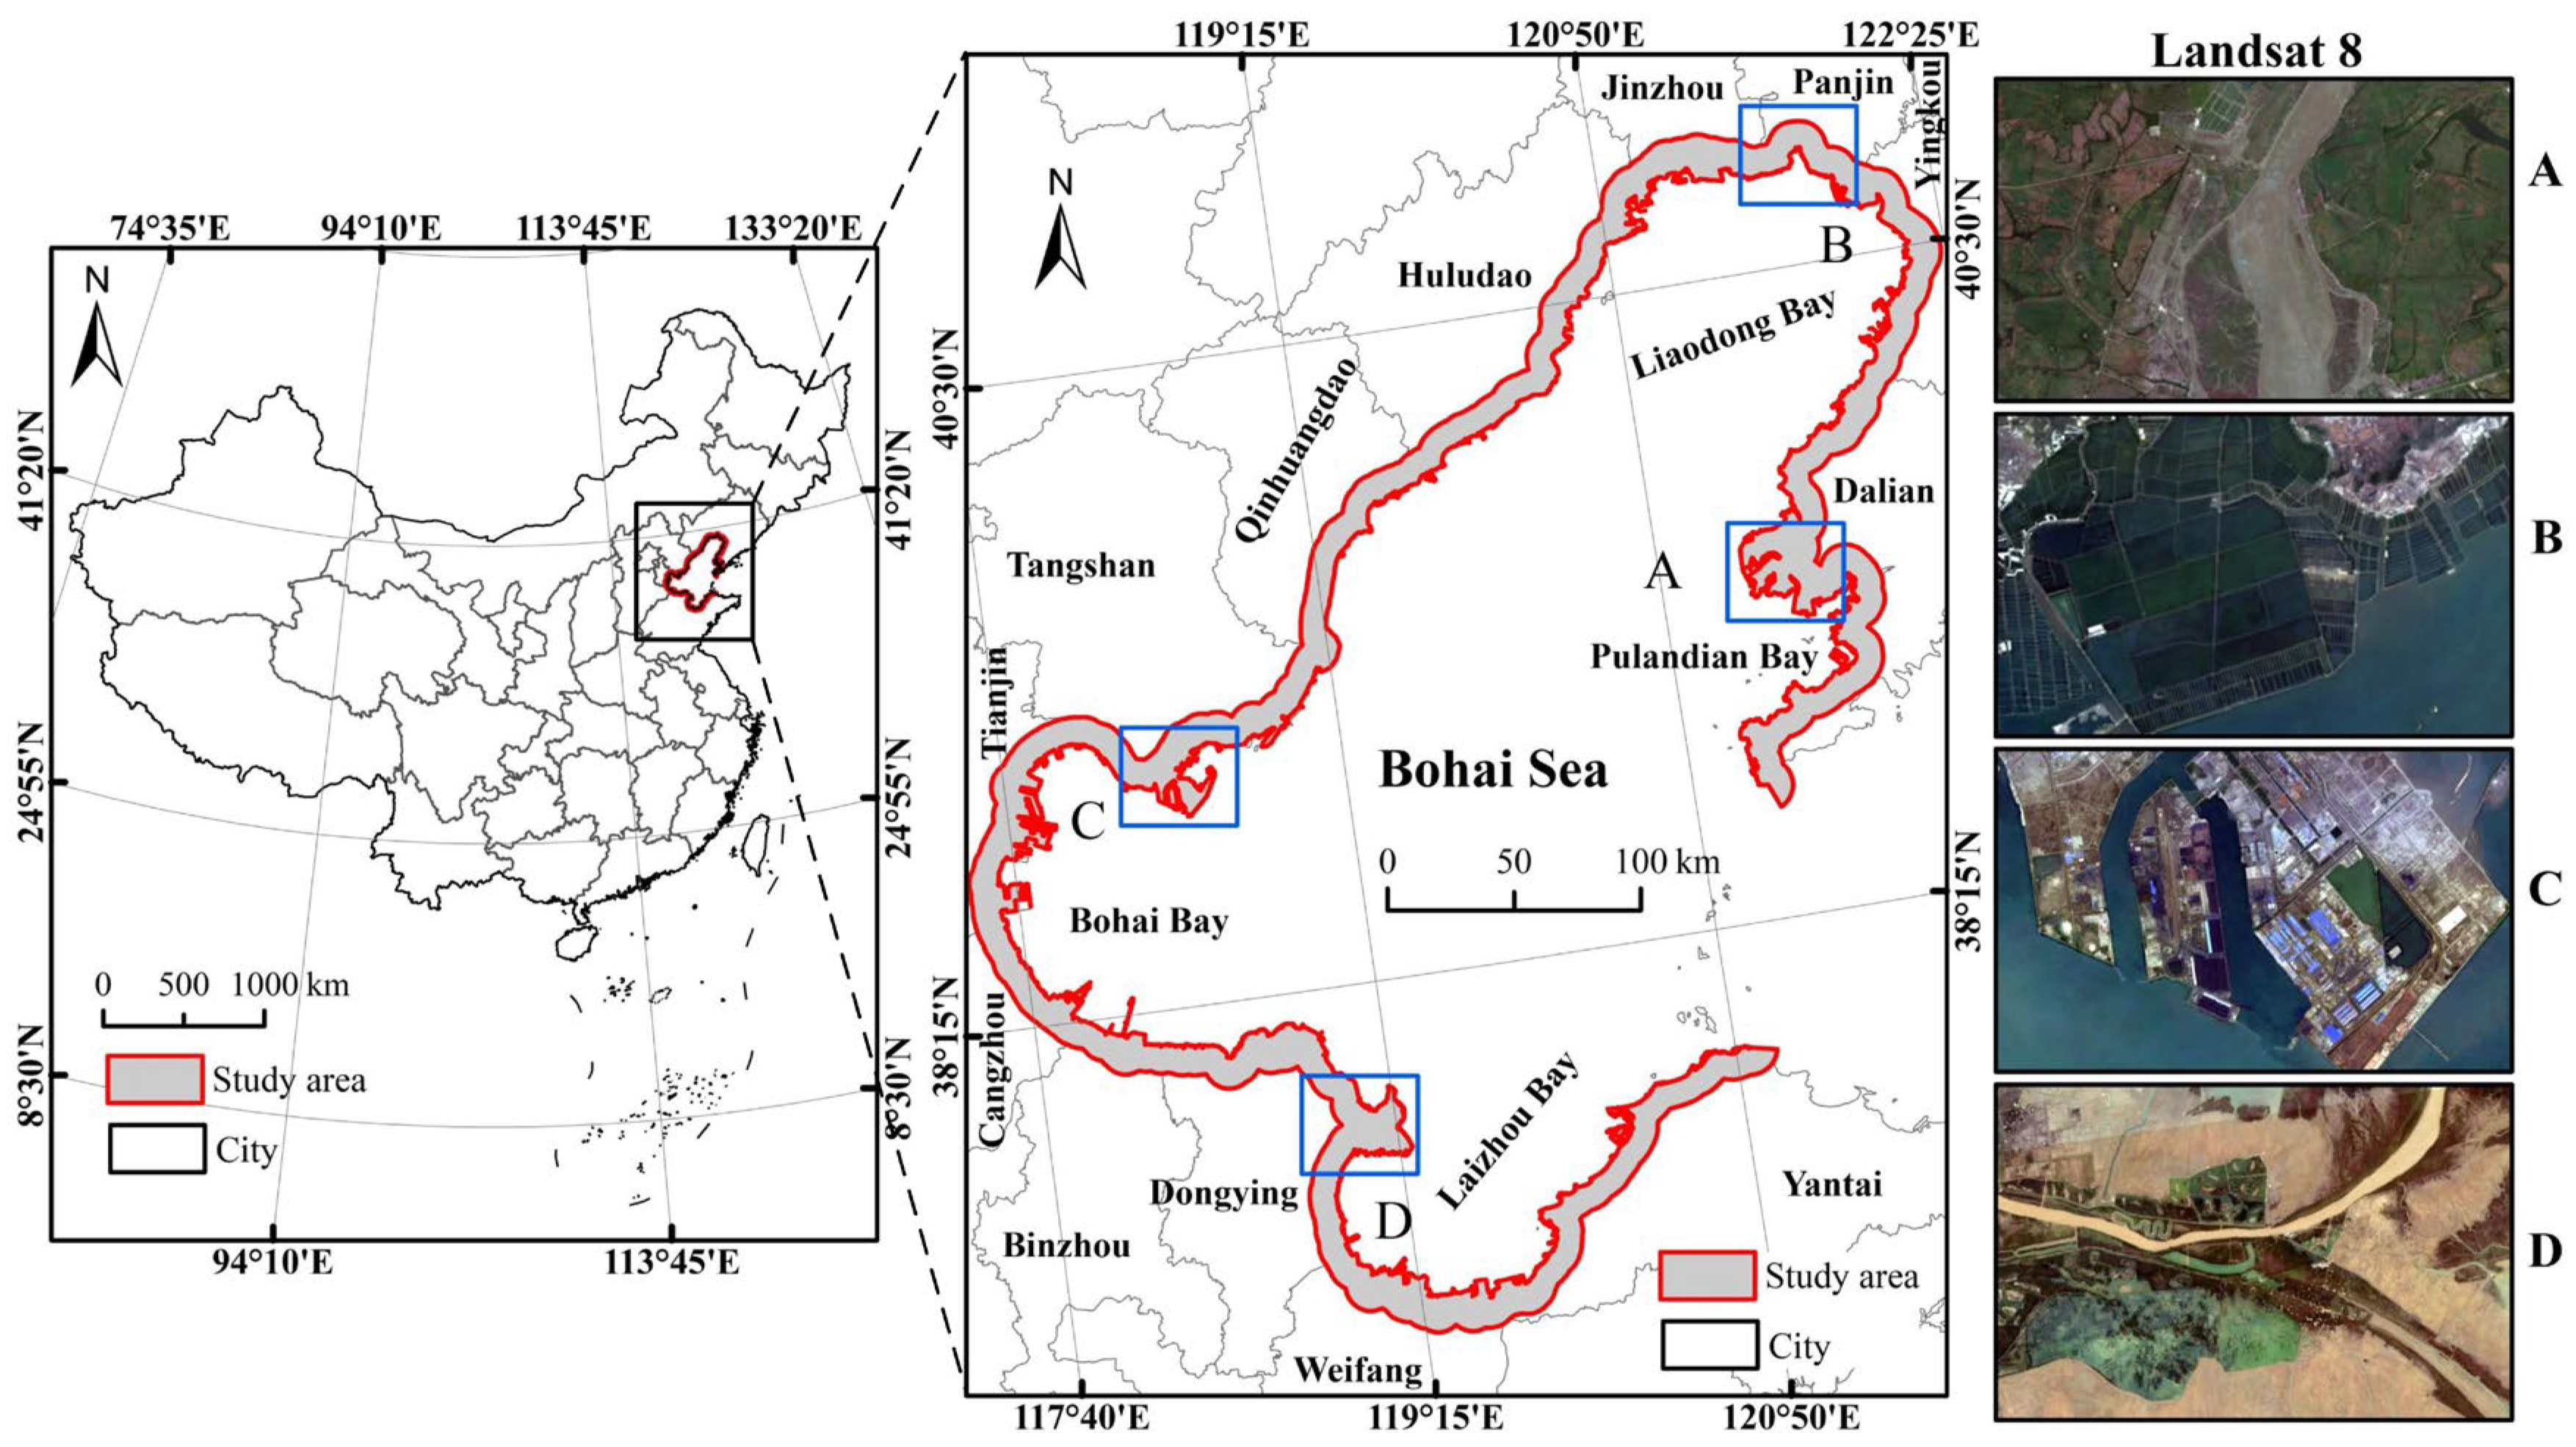
2.1. Study Area
2.2. Data
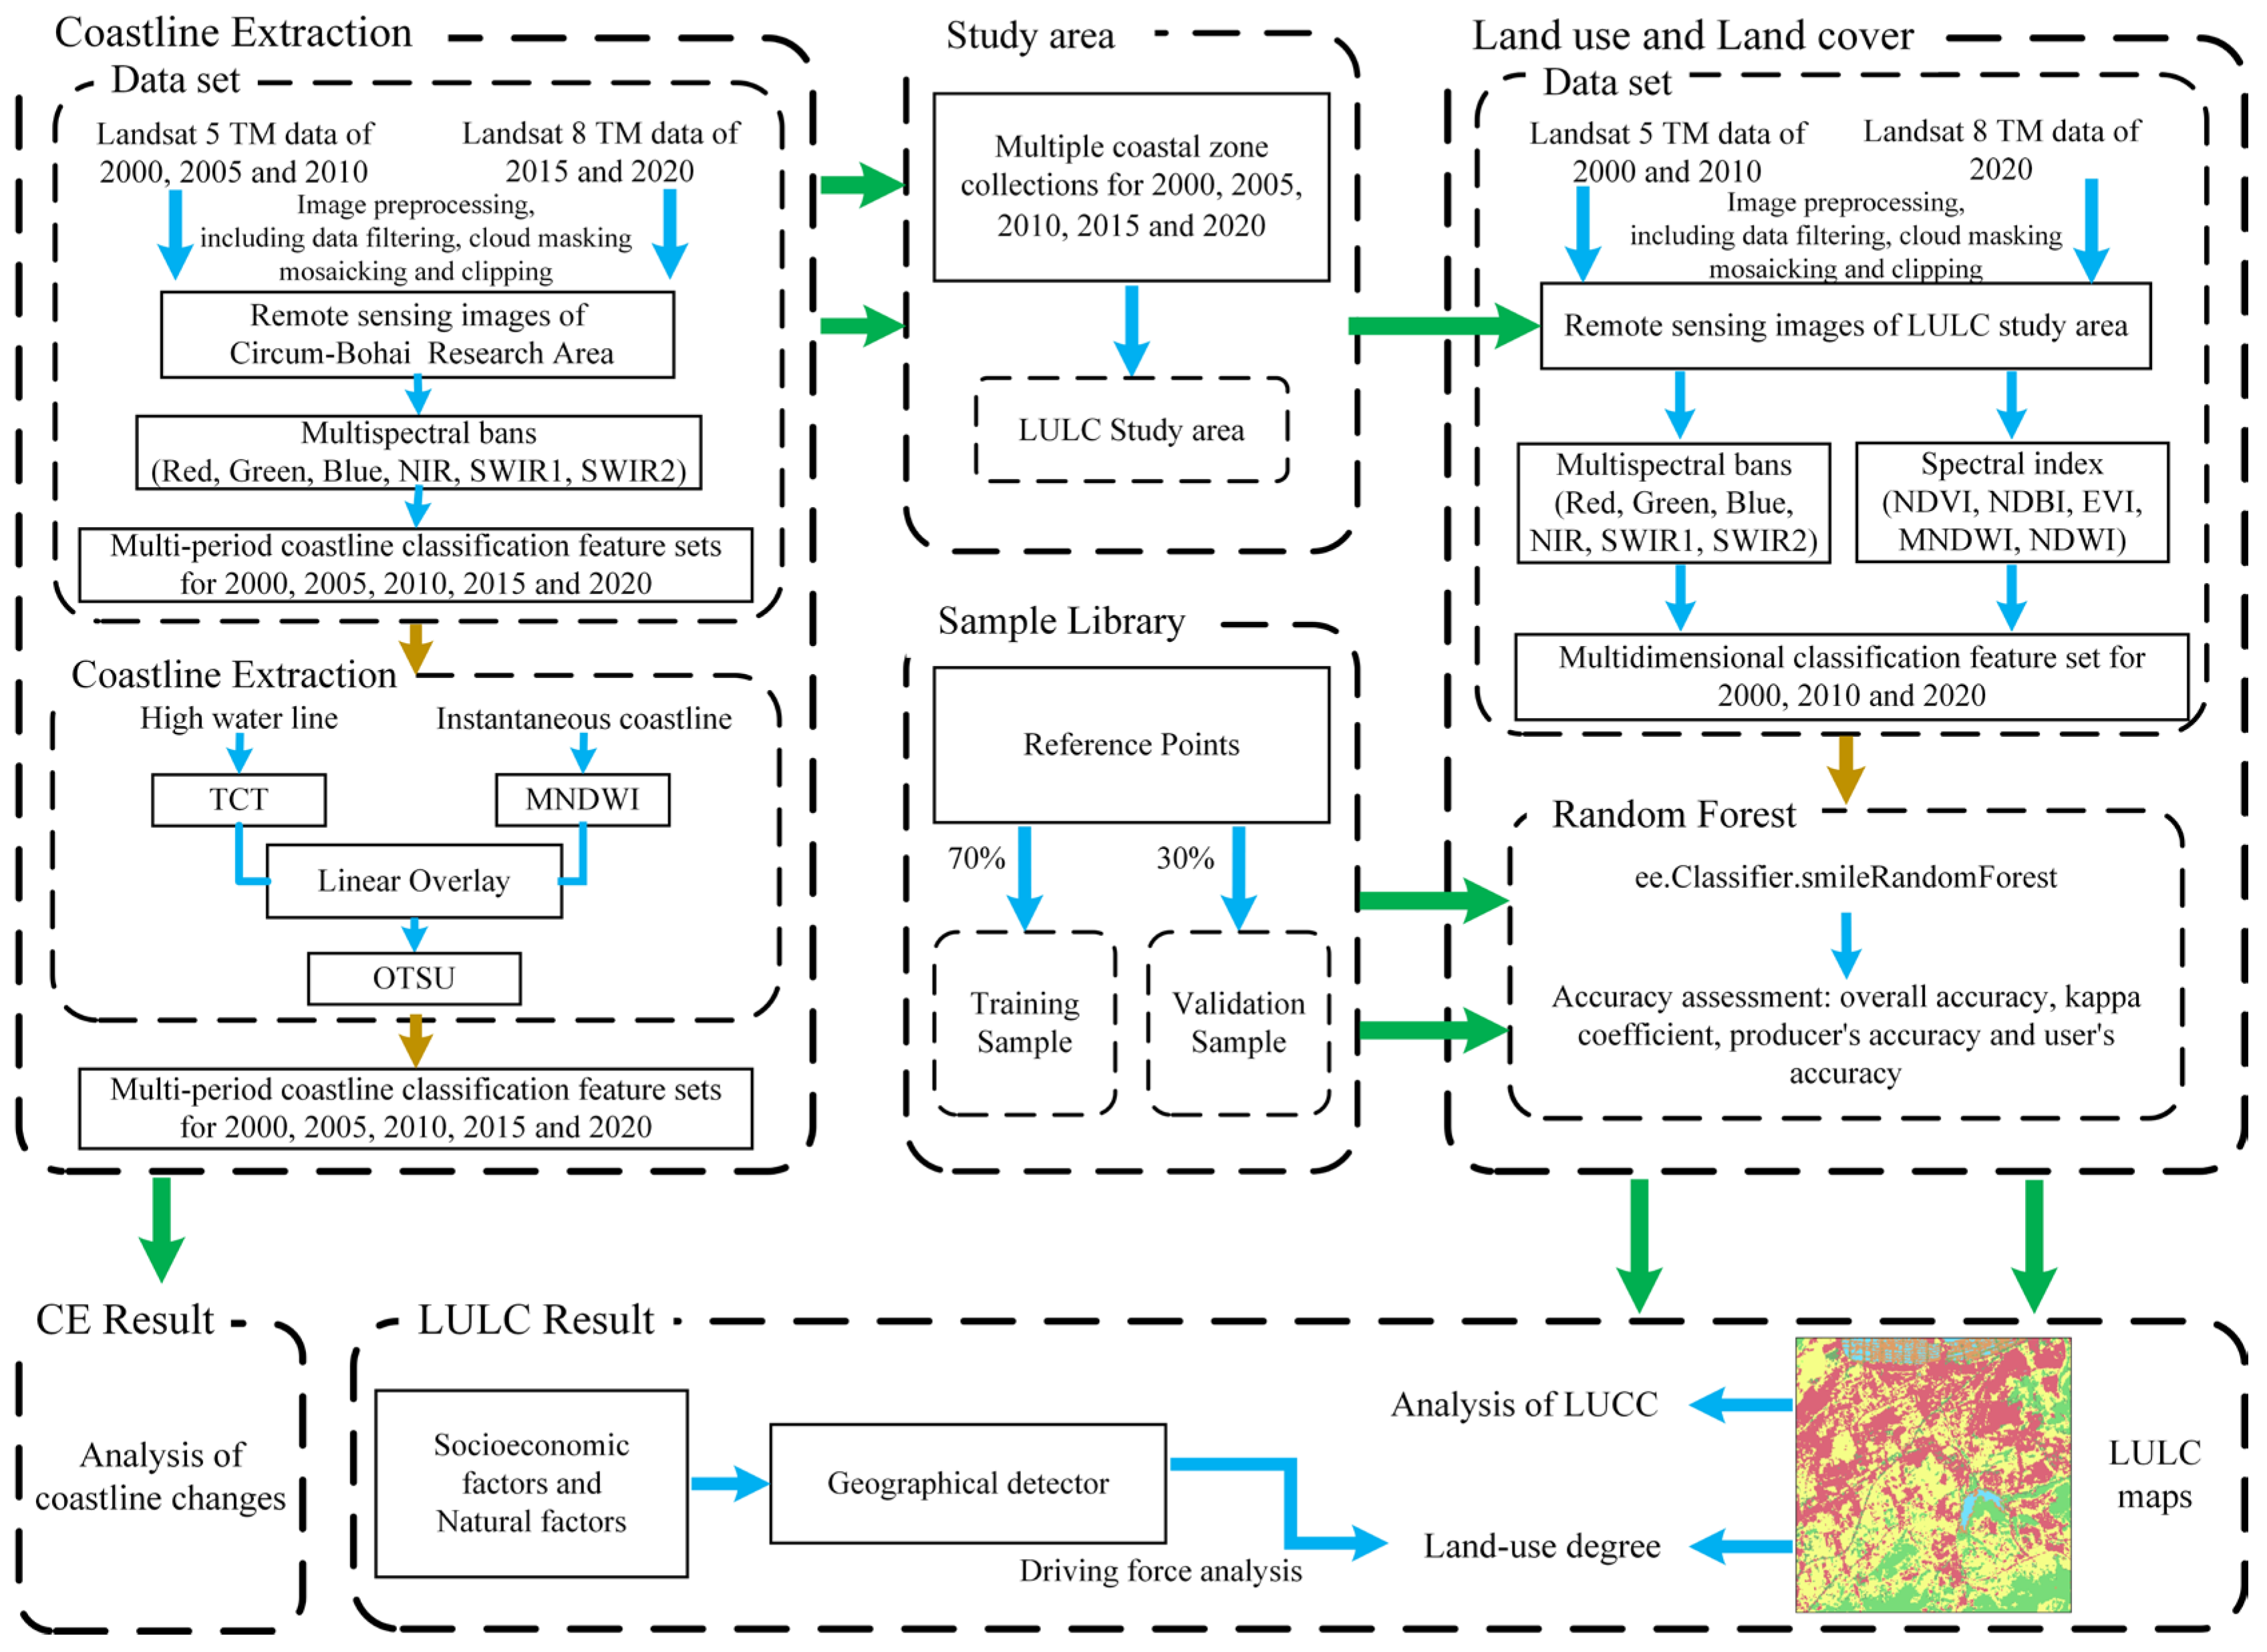
3. Methodology
3.1. Long Time-Series Coastline Extraction Method
3.1.1. Water Index Method
3.1.2. Otsu Threshold Method (OTSU)
3.2. Coastal Land Use Classification
3.2.1. Coastal LULC Classification and Its Accuracy Evaluation
3.2.2. Land Use Degree Index
3.3. Geographic Detector
4. Results
4.1. Coastline Change Analysis
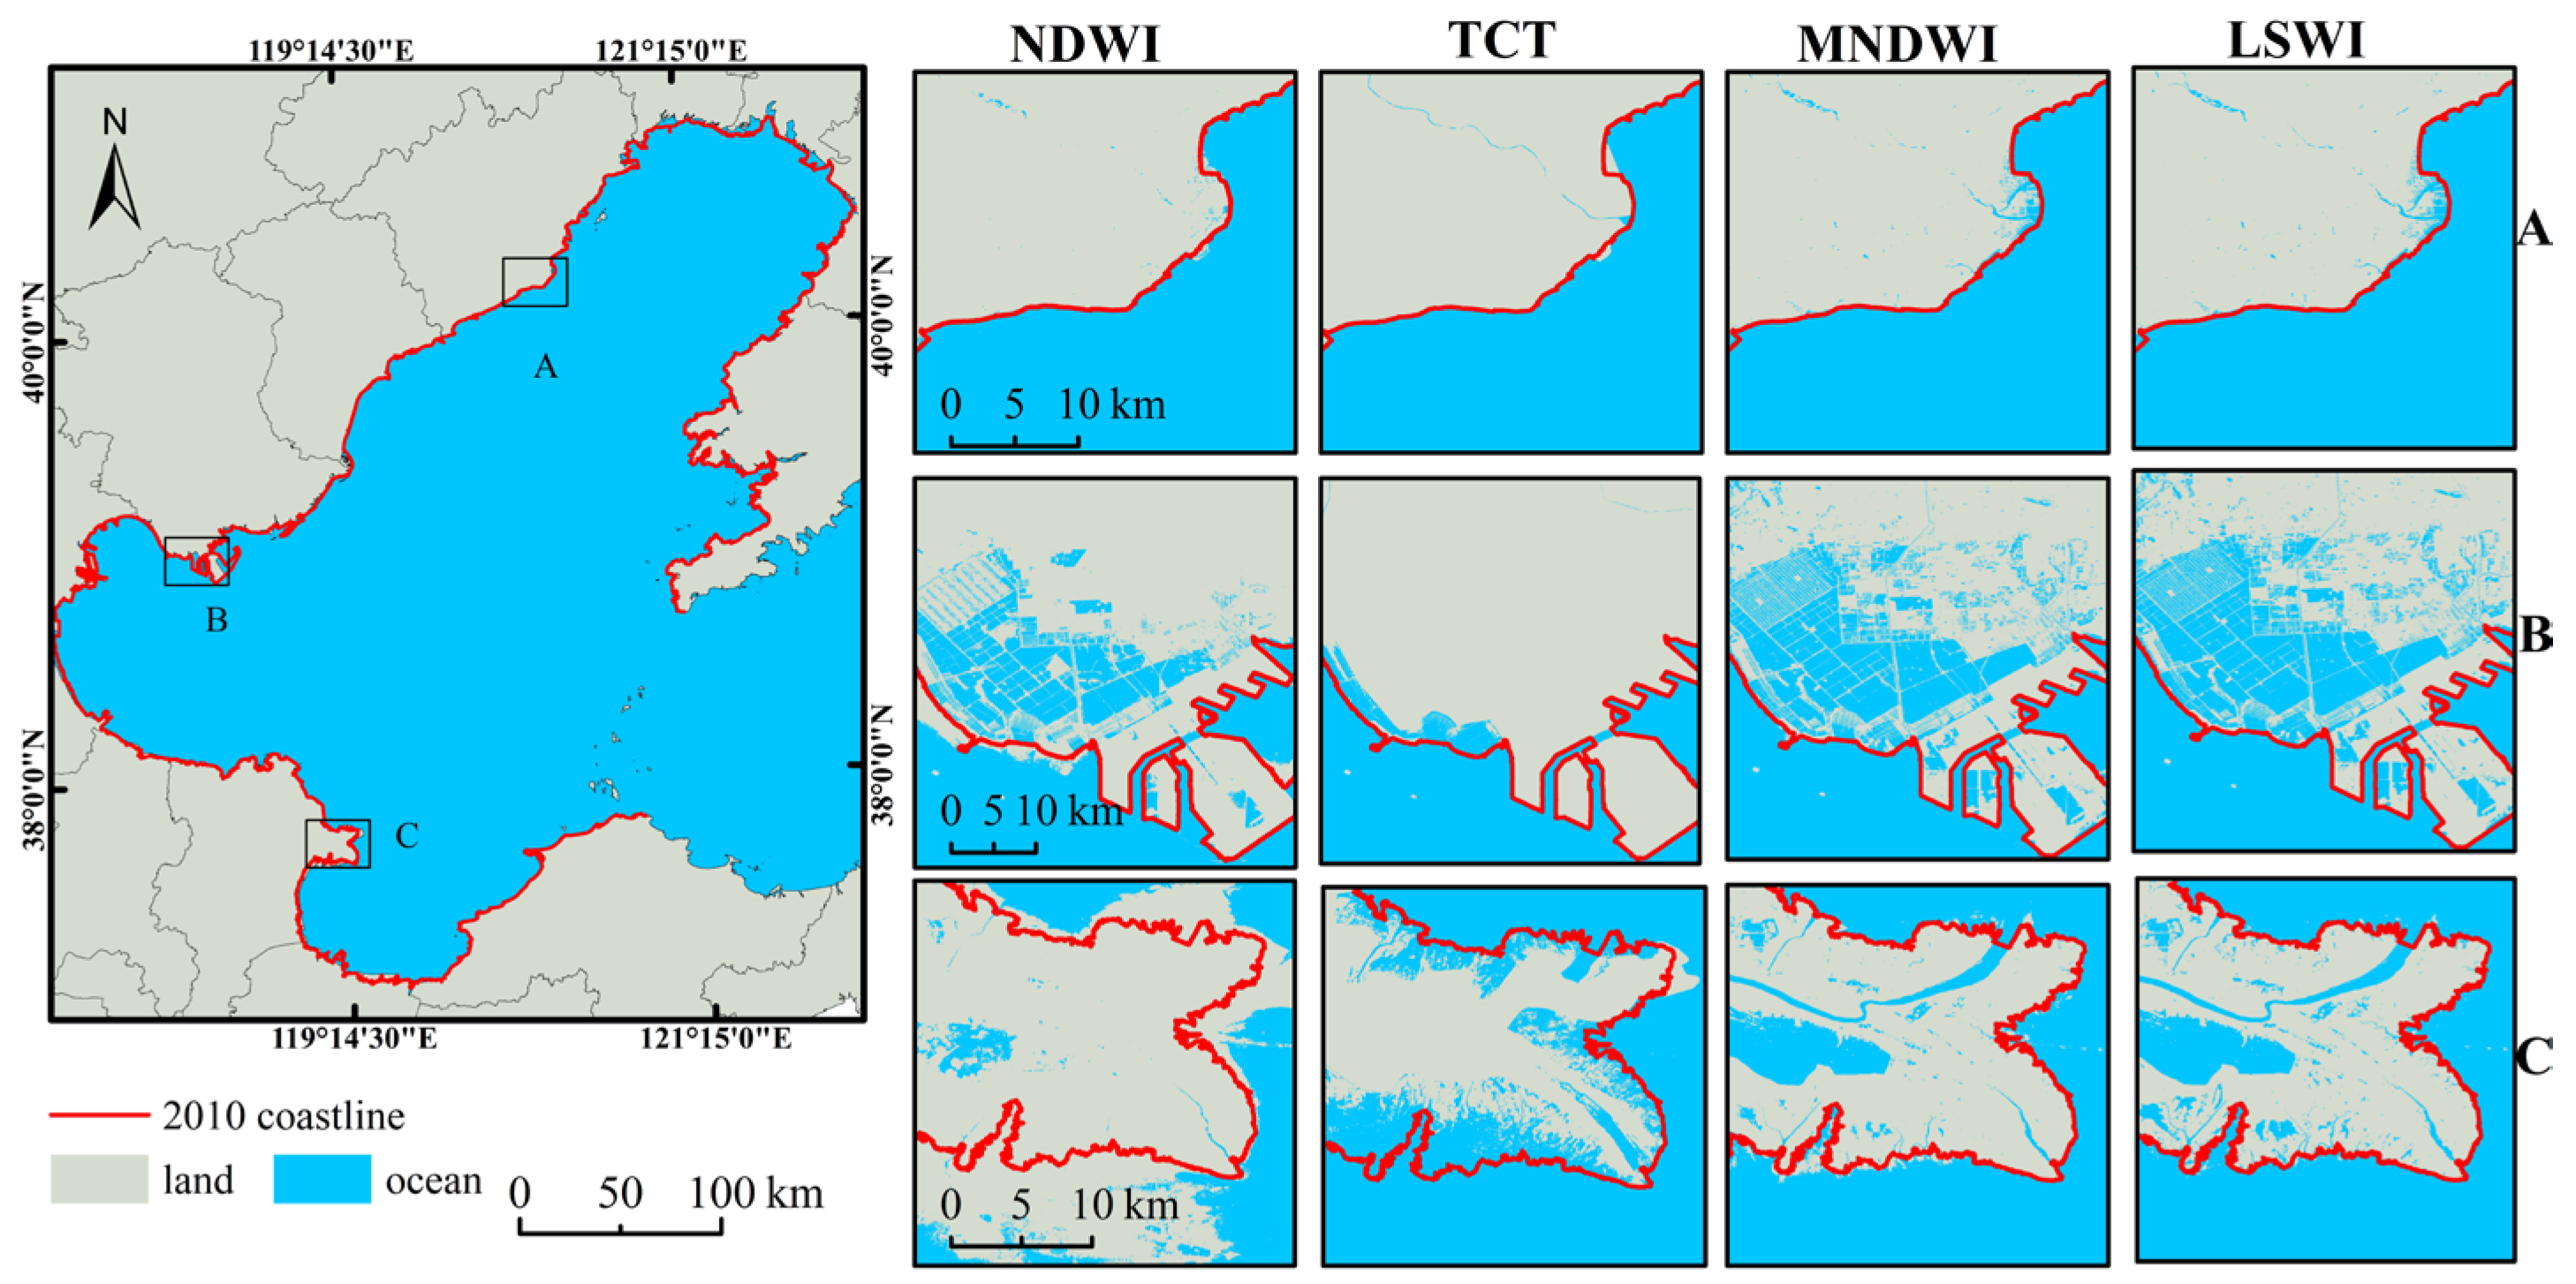
4.1.1. Validation of Coastline Extraction Method
4.1.2. Coastline Change Analysis
4.2. Long Time-Series LUCC Analysis of Coastal Zone
4.2.1. Accuracy Evaluation
4.2.2. LULC Change Analysis
4.2.3. LULC Spatiotemporal Change Analysis
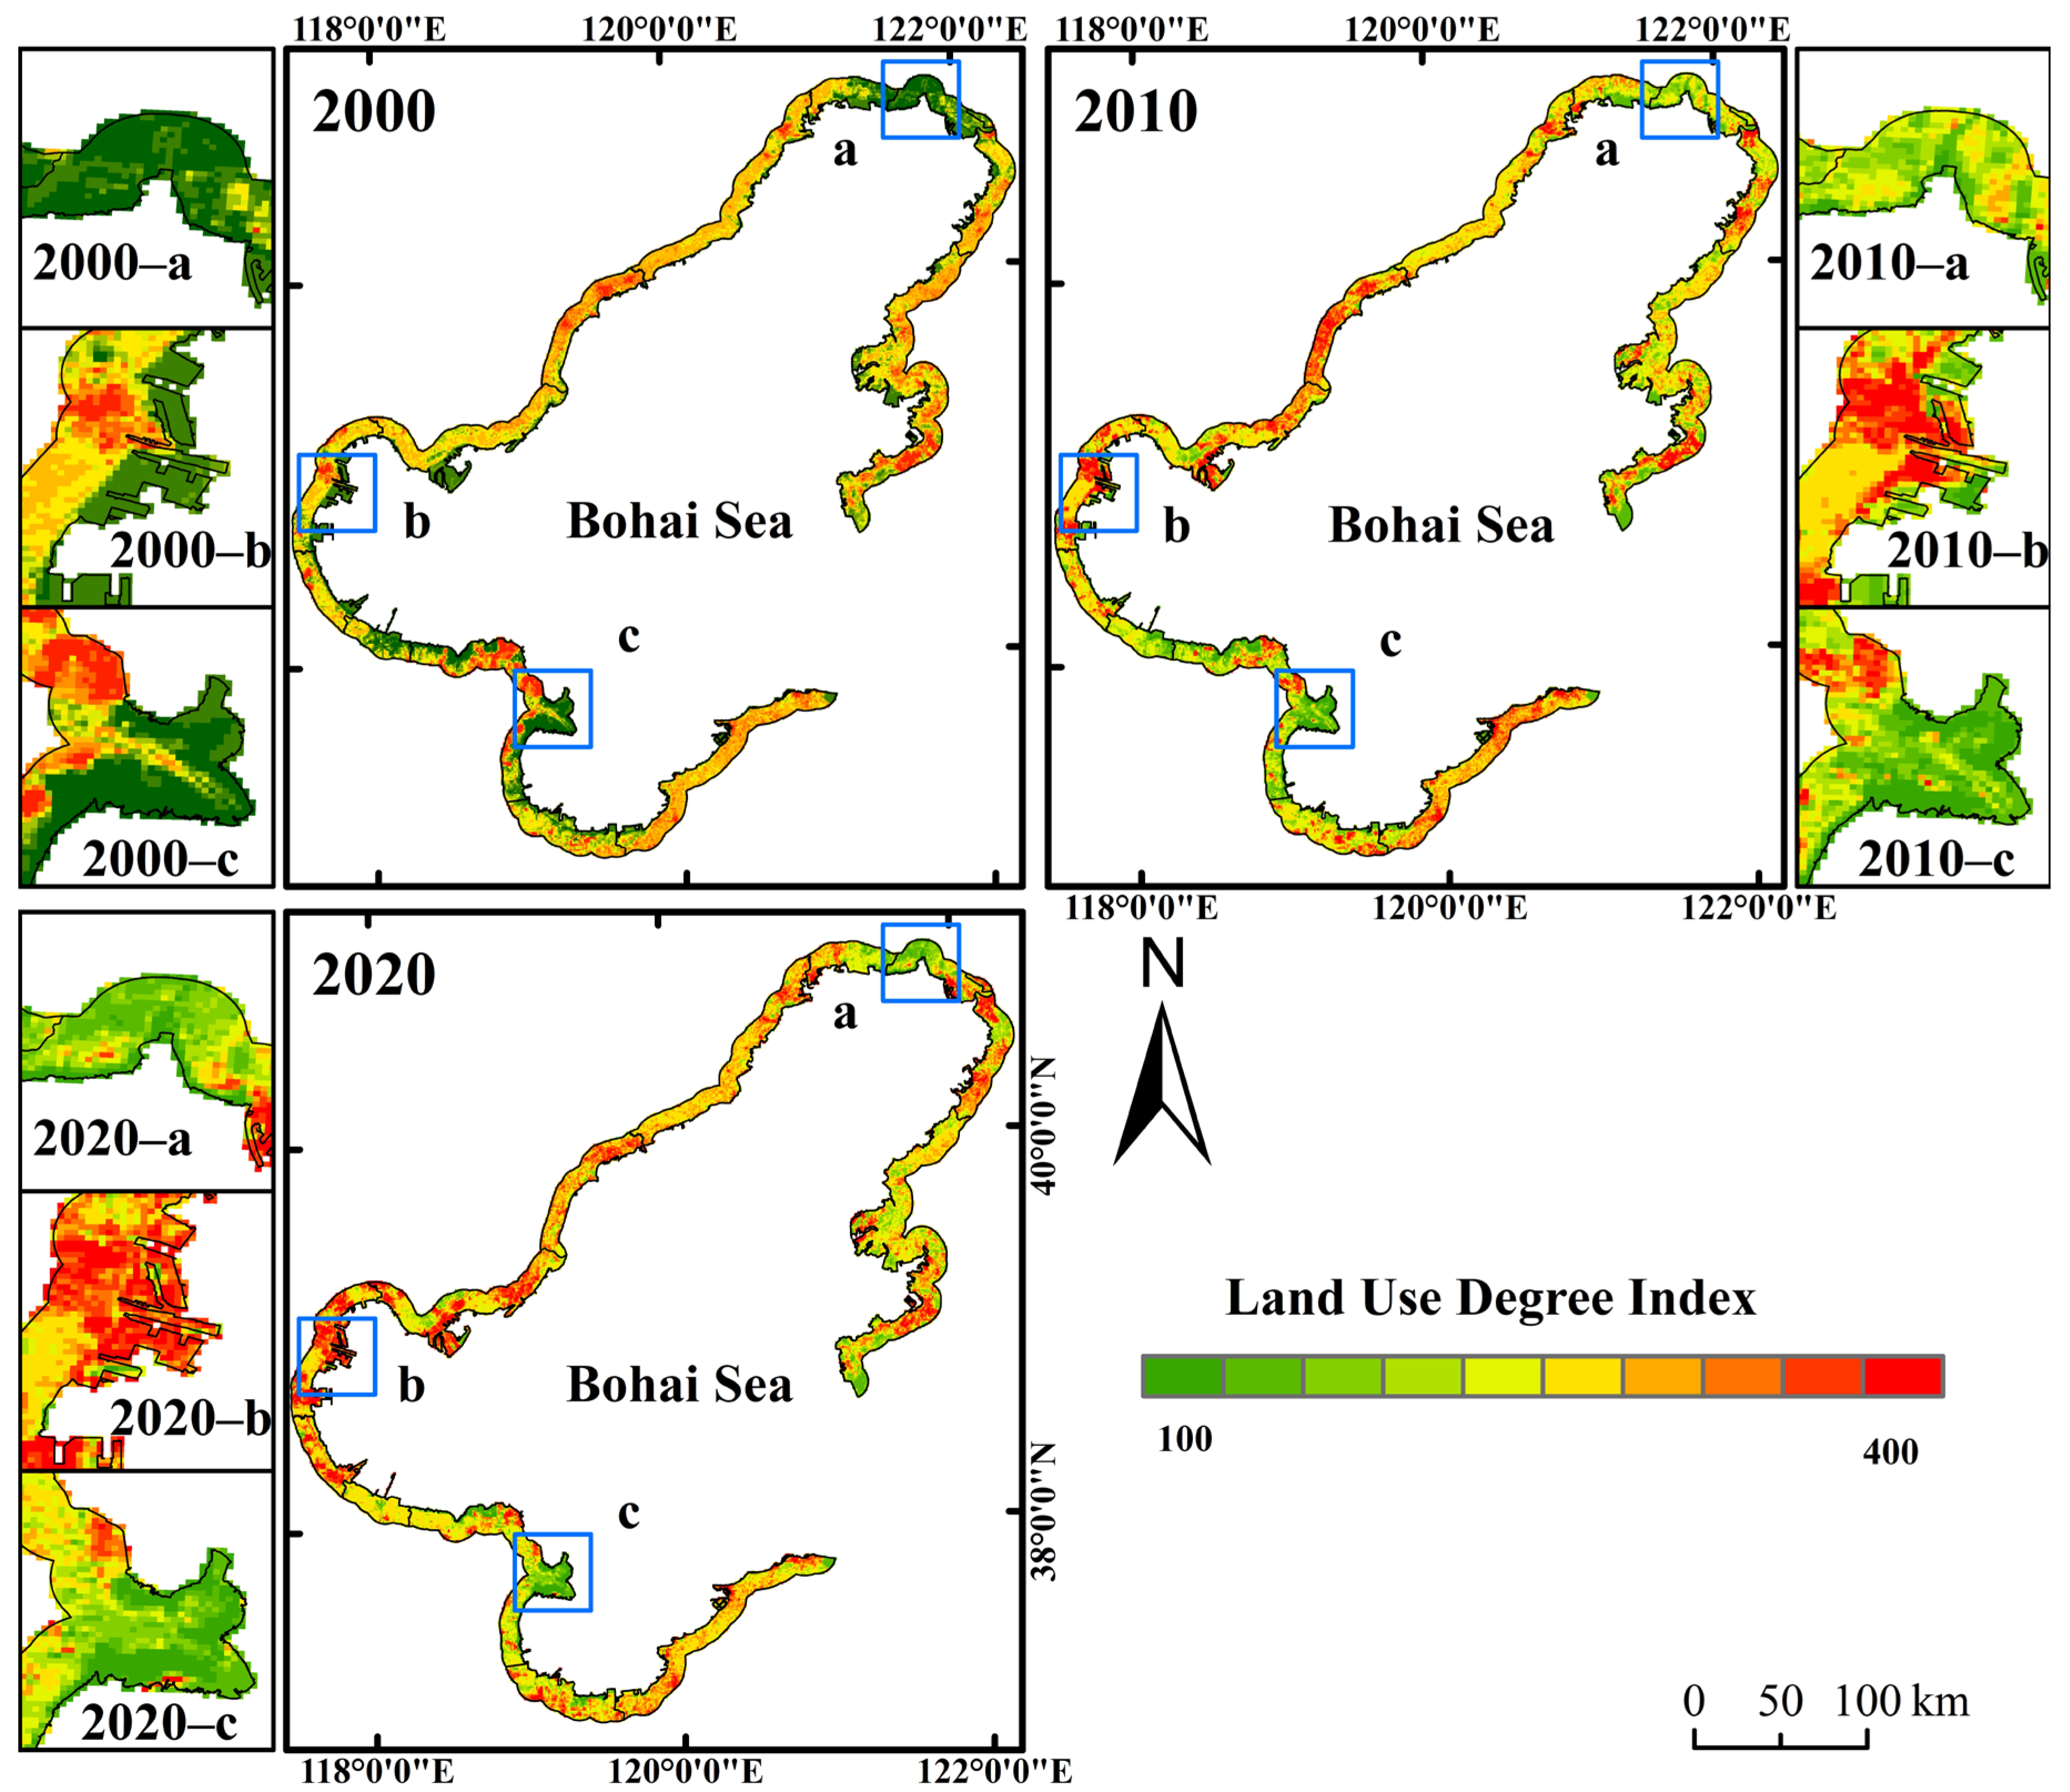
4.2.4. Land Use Degree Index
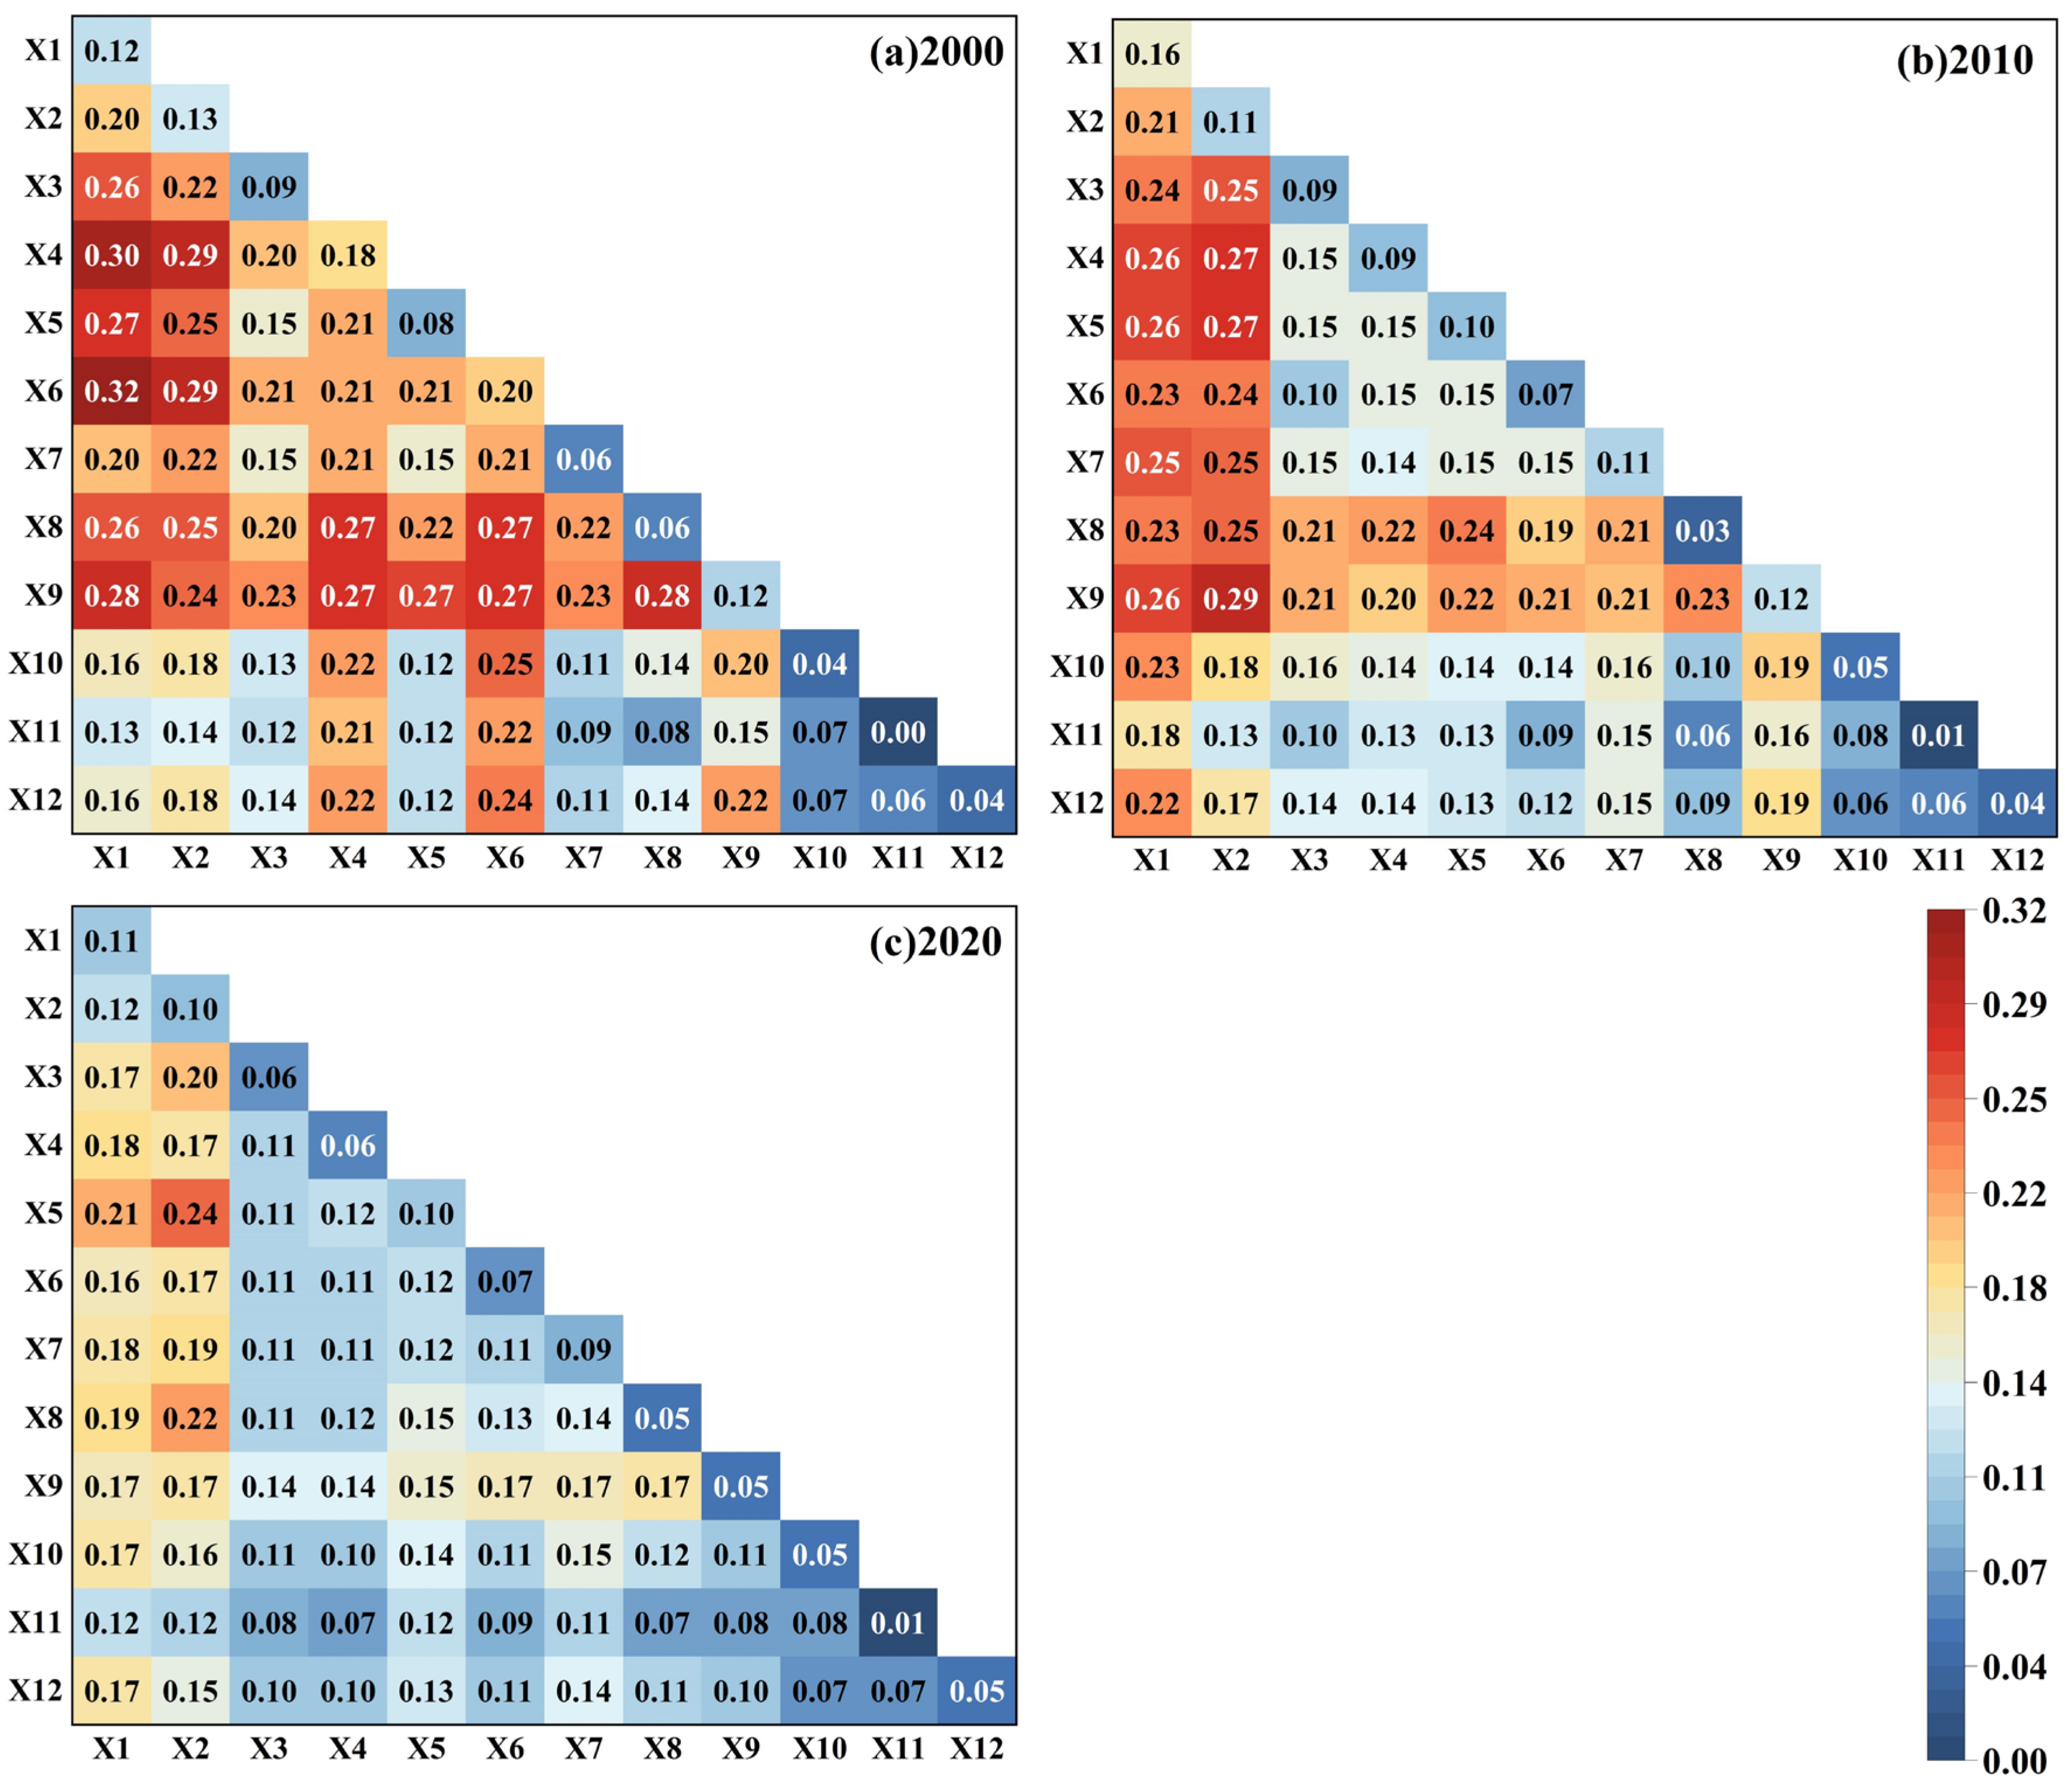
4.3. Analysis of LUCC Driving Factors
5. Discussion
6. Conclusions
- (1)
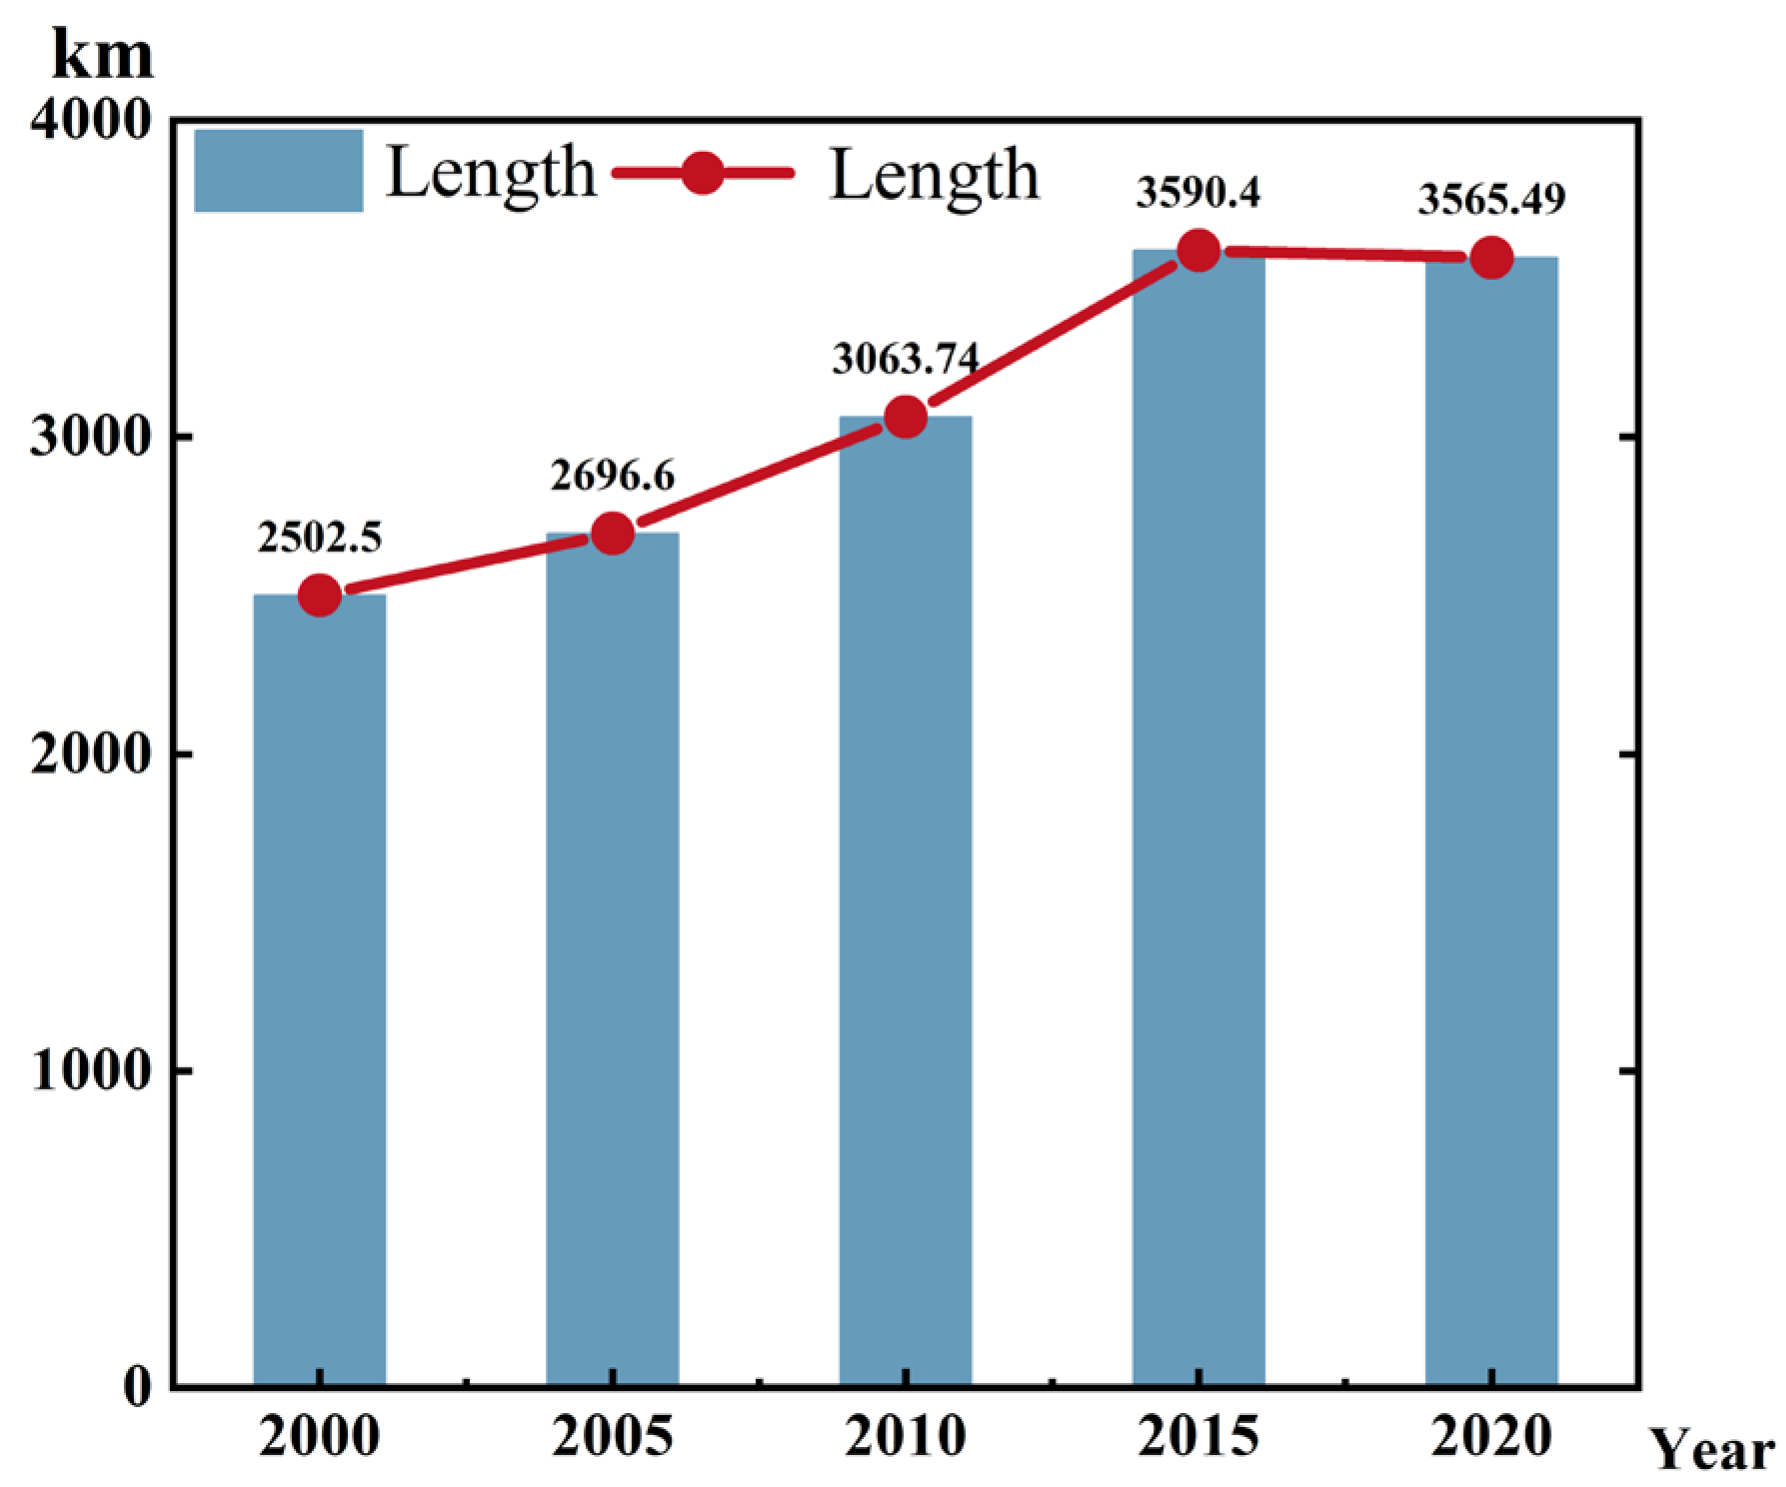
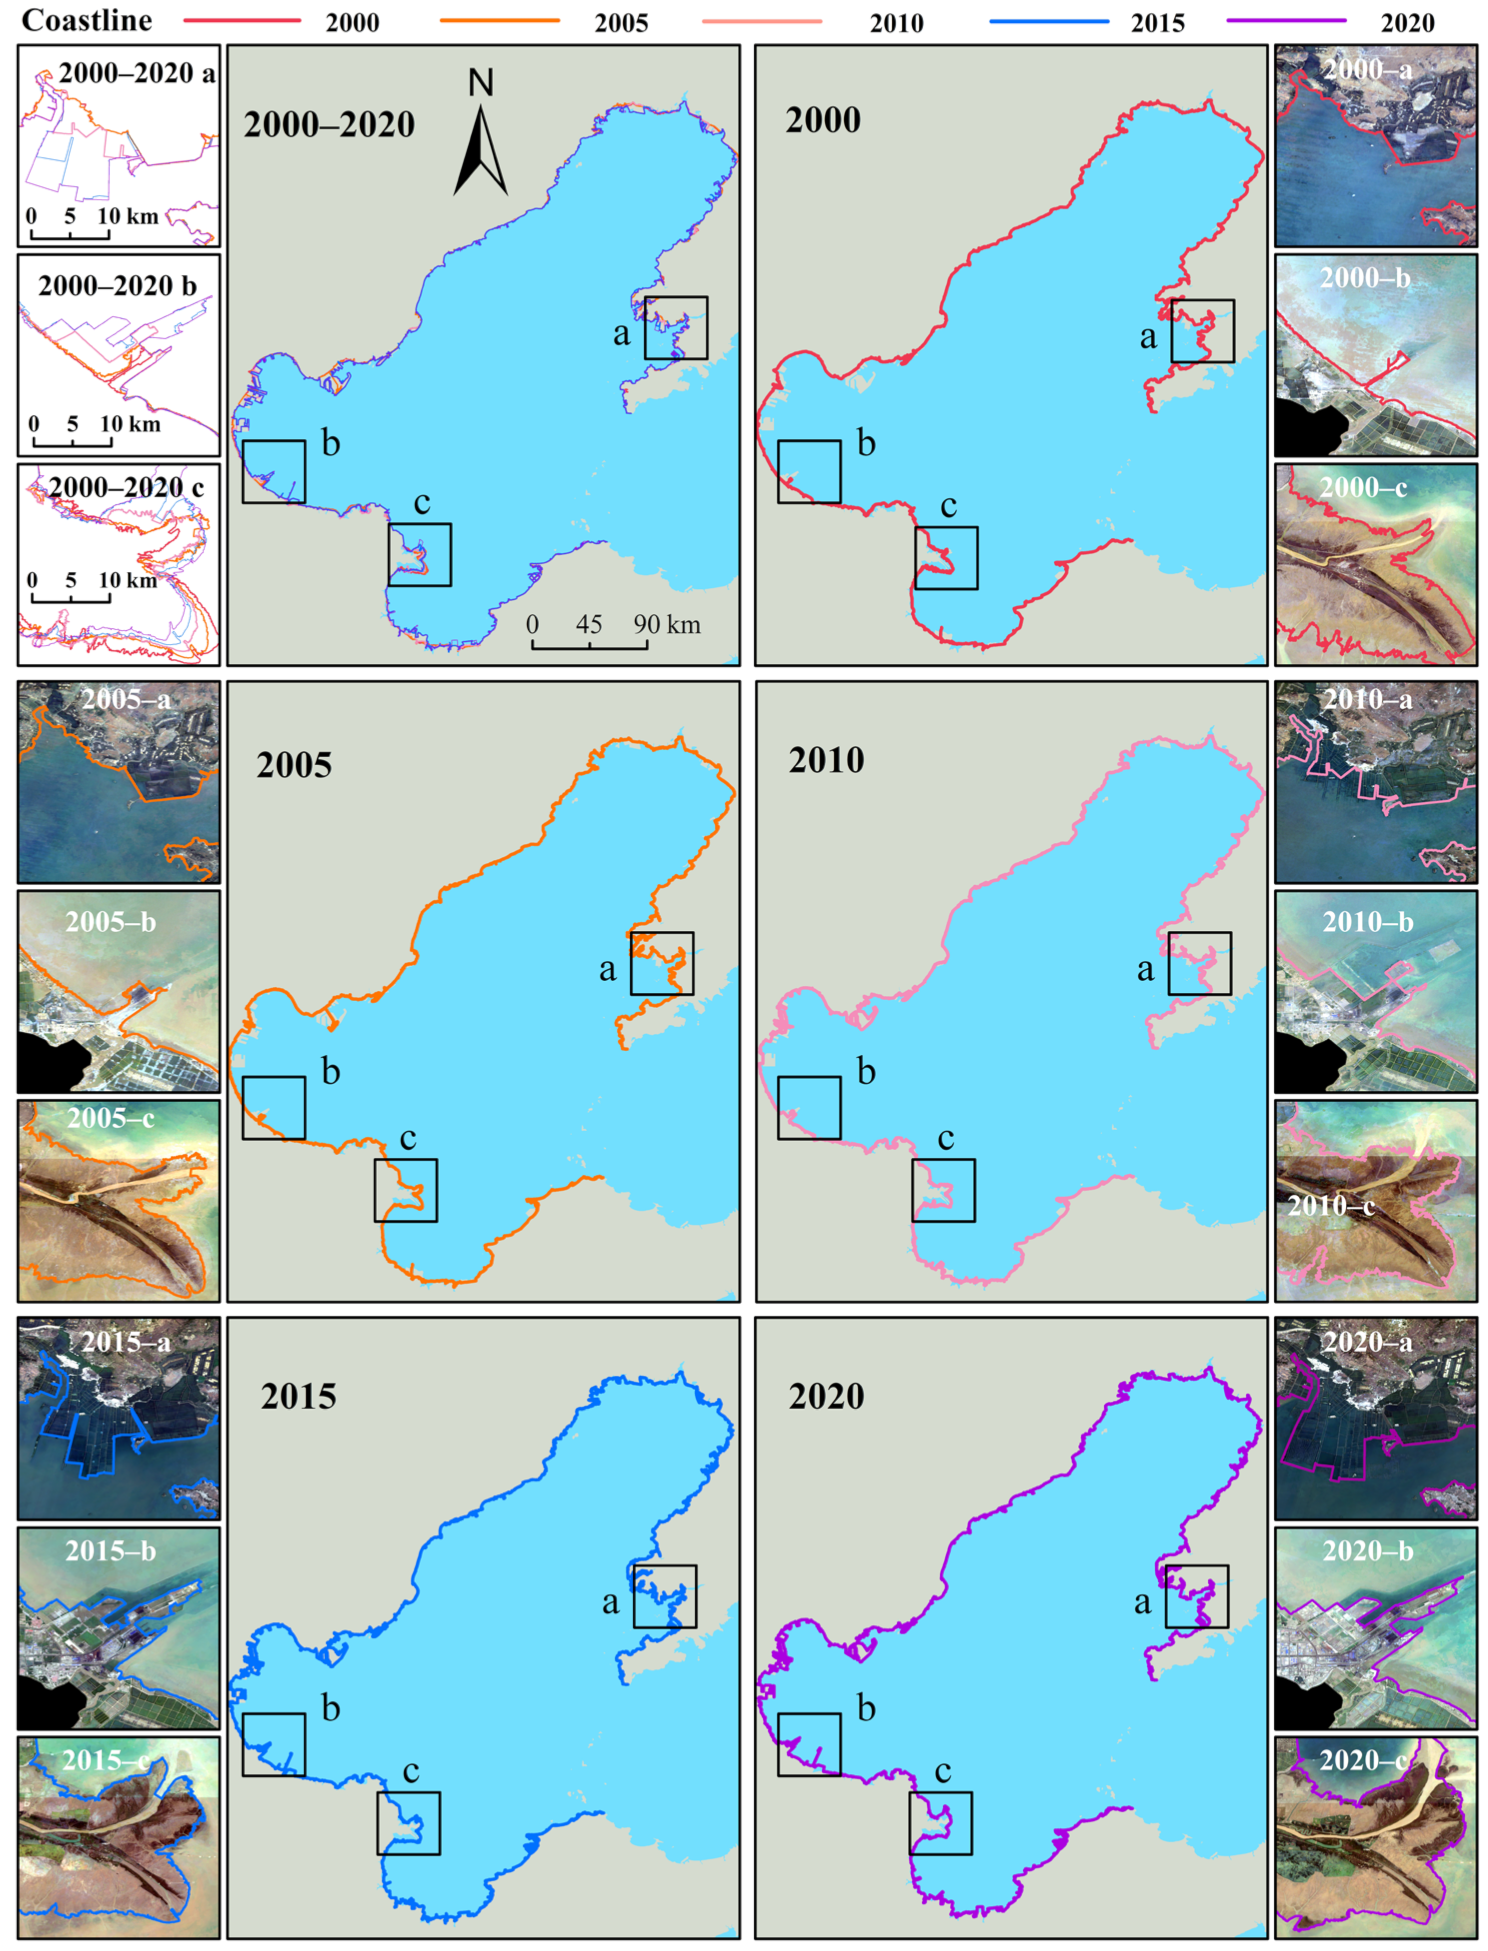
- The length of the Circum-Bohai coastline underwent fluctuating changes from 2000 to 2020, displaying a phenomenon of initial increase followed by a decrease. The temporal changes of the coastline exhibited a slow–fast–slow trend, corresponding to periods of 2000 to 2005, 2005 to 2015, and 2015 to 2020. Spatially, there was a trend of land-to-sea expansion, with the change areas predominantly located in the three major bay areas of Laizhou Bay, Bohai Bay, and Liaodong Bay. This change can be attributed to human activities as the main driving force.
- (2)
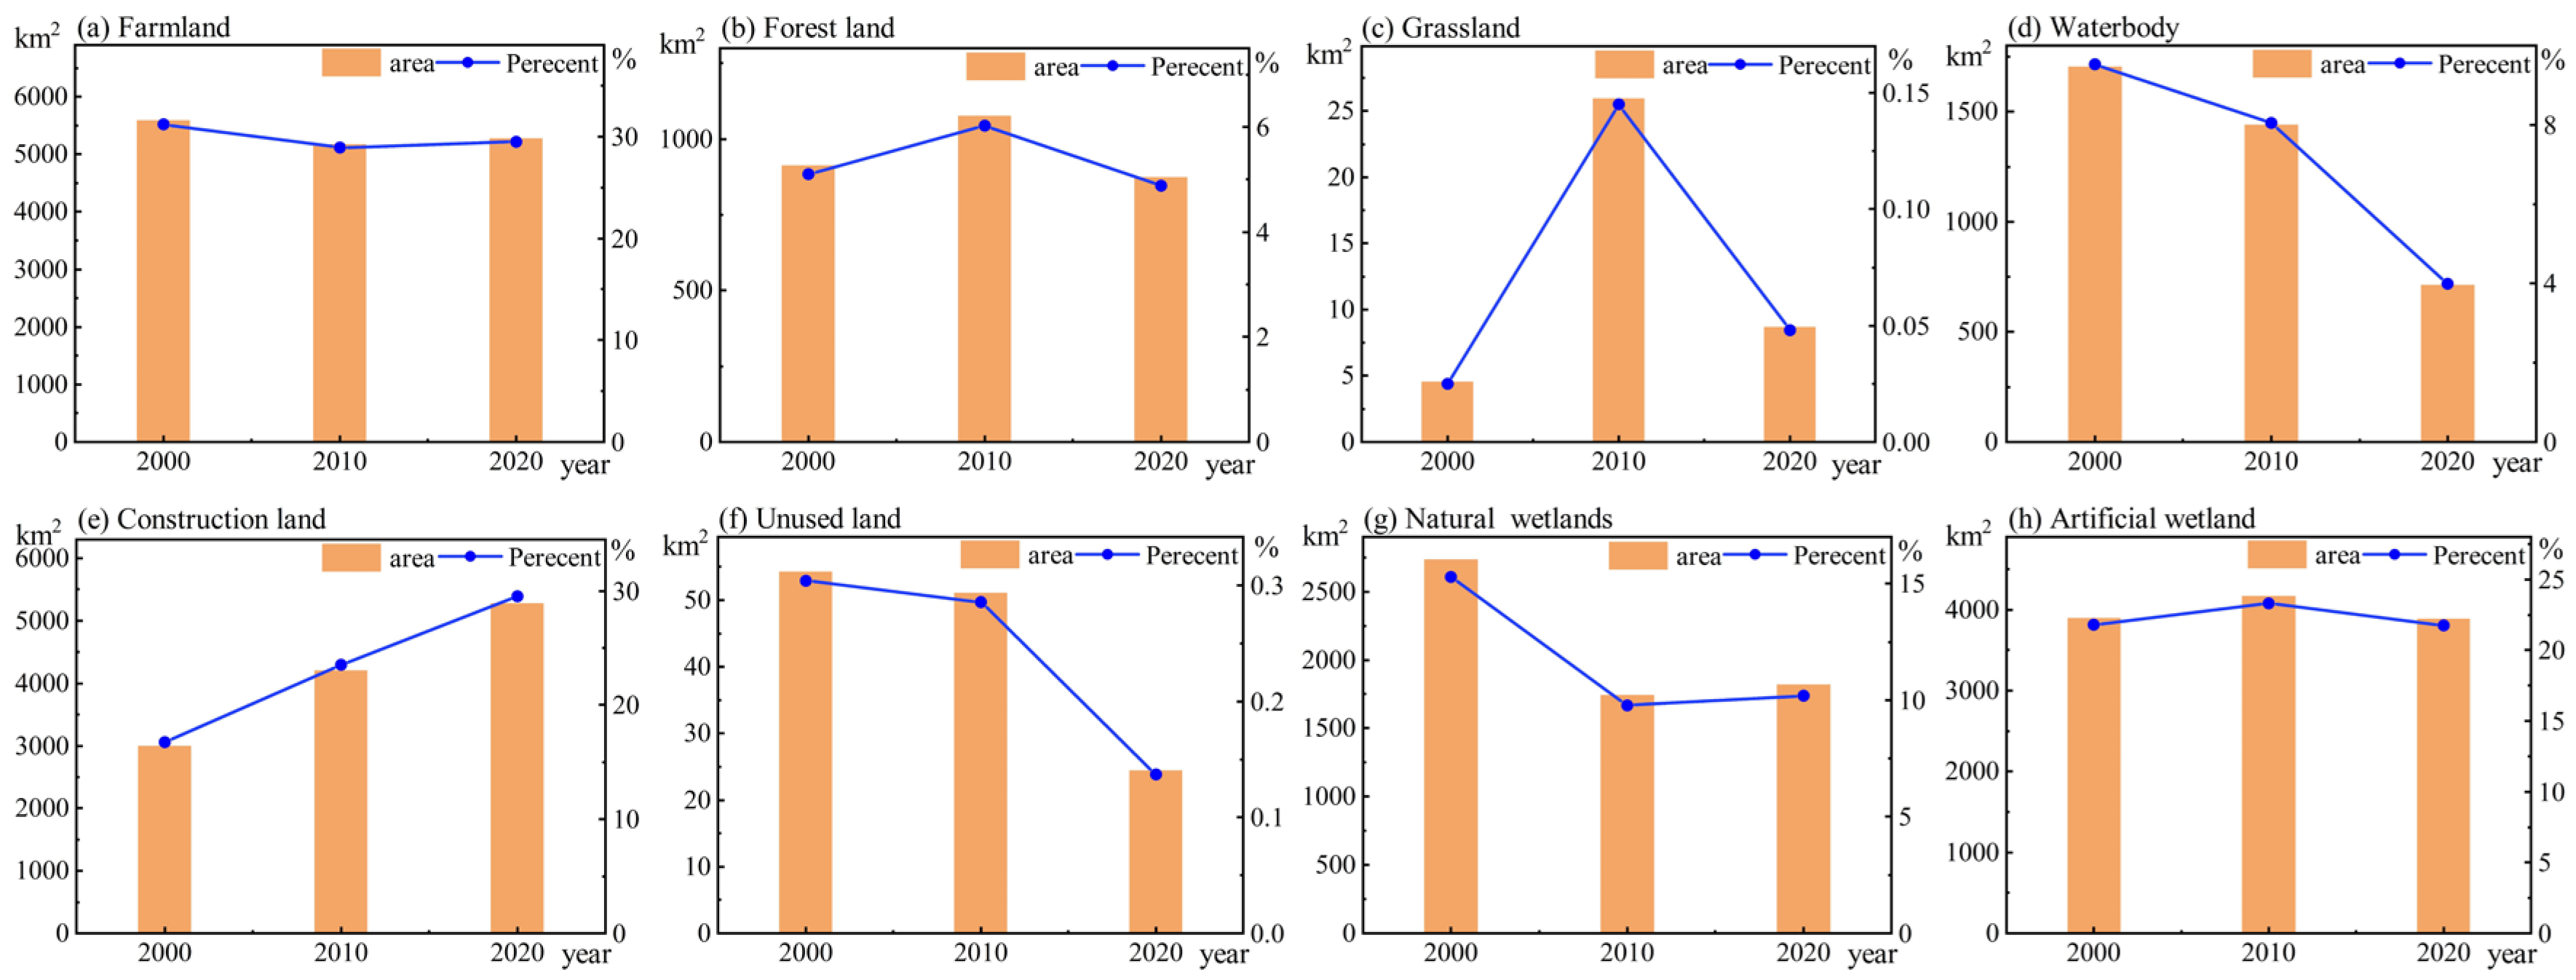
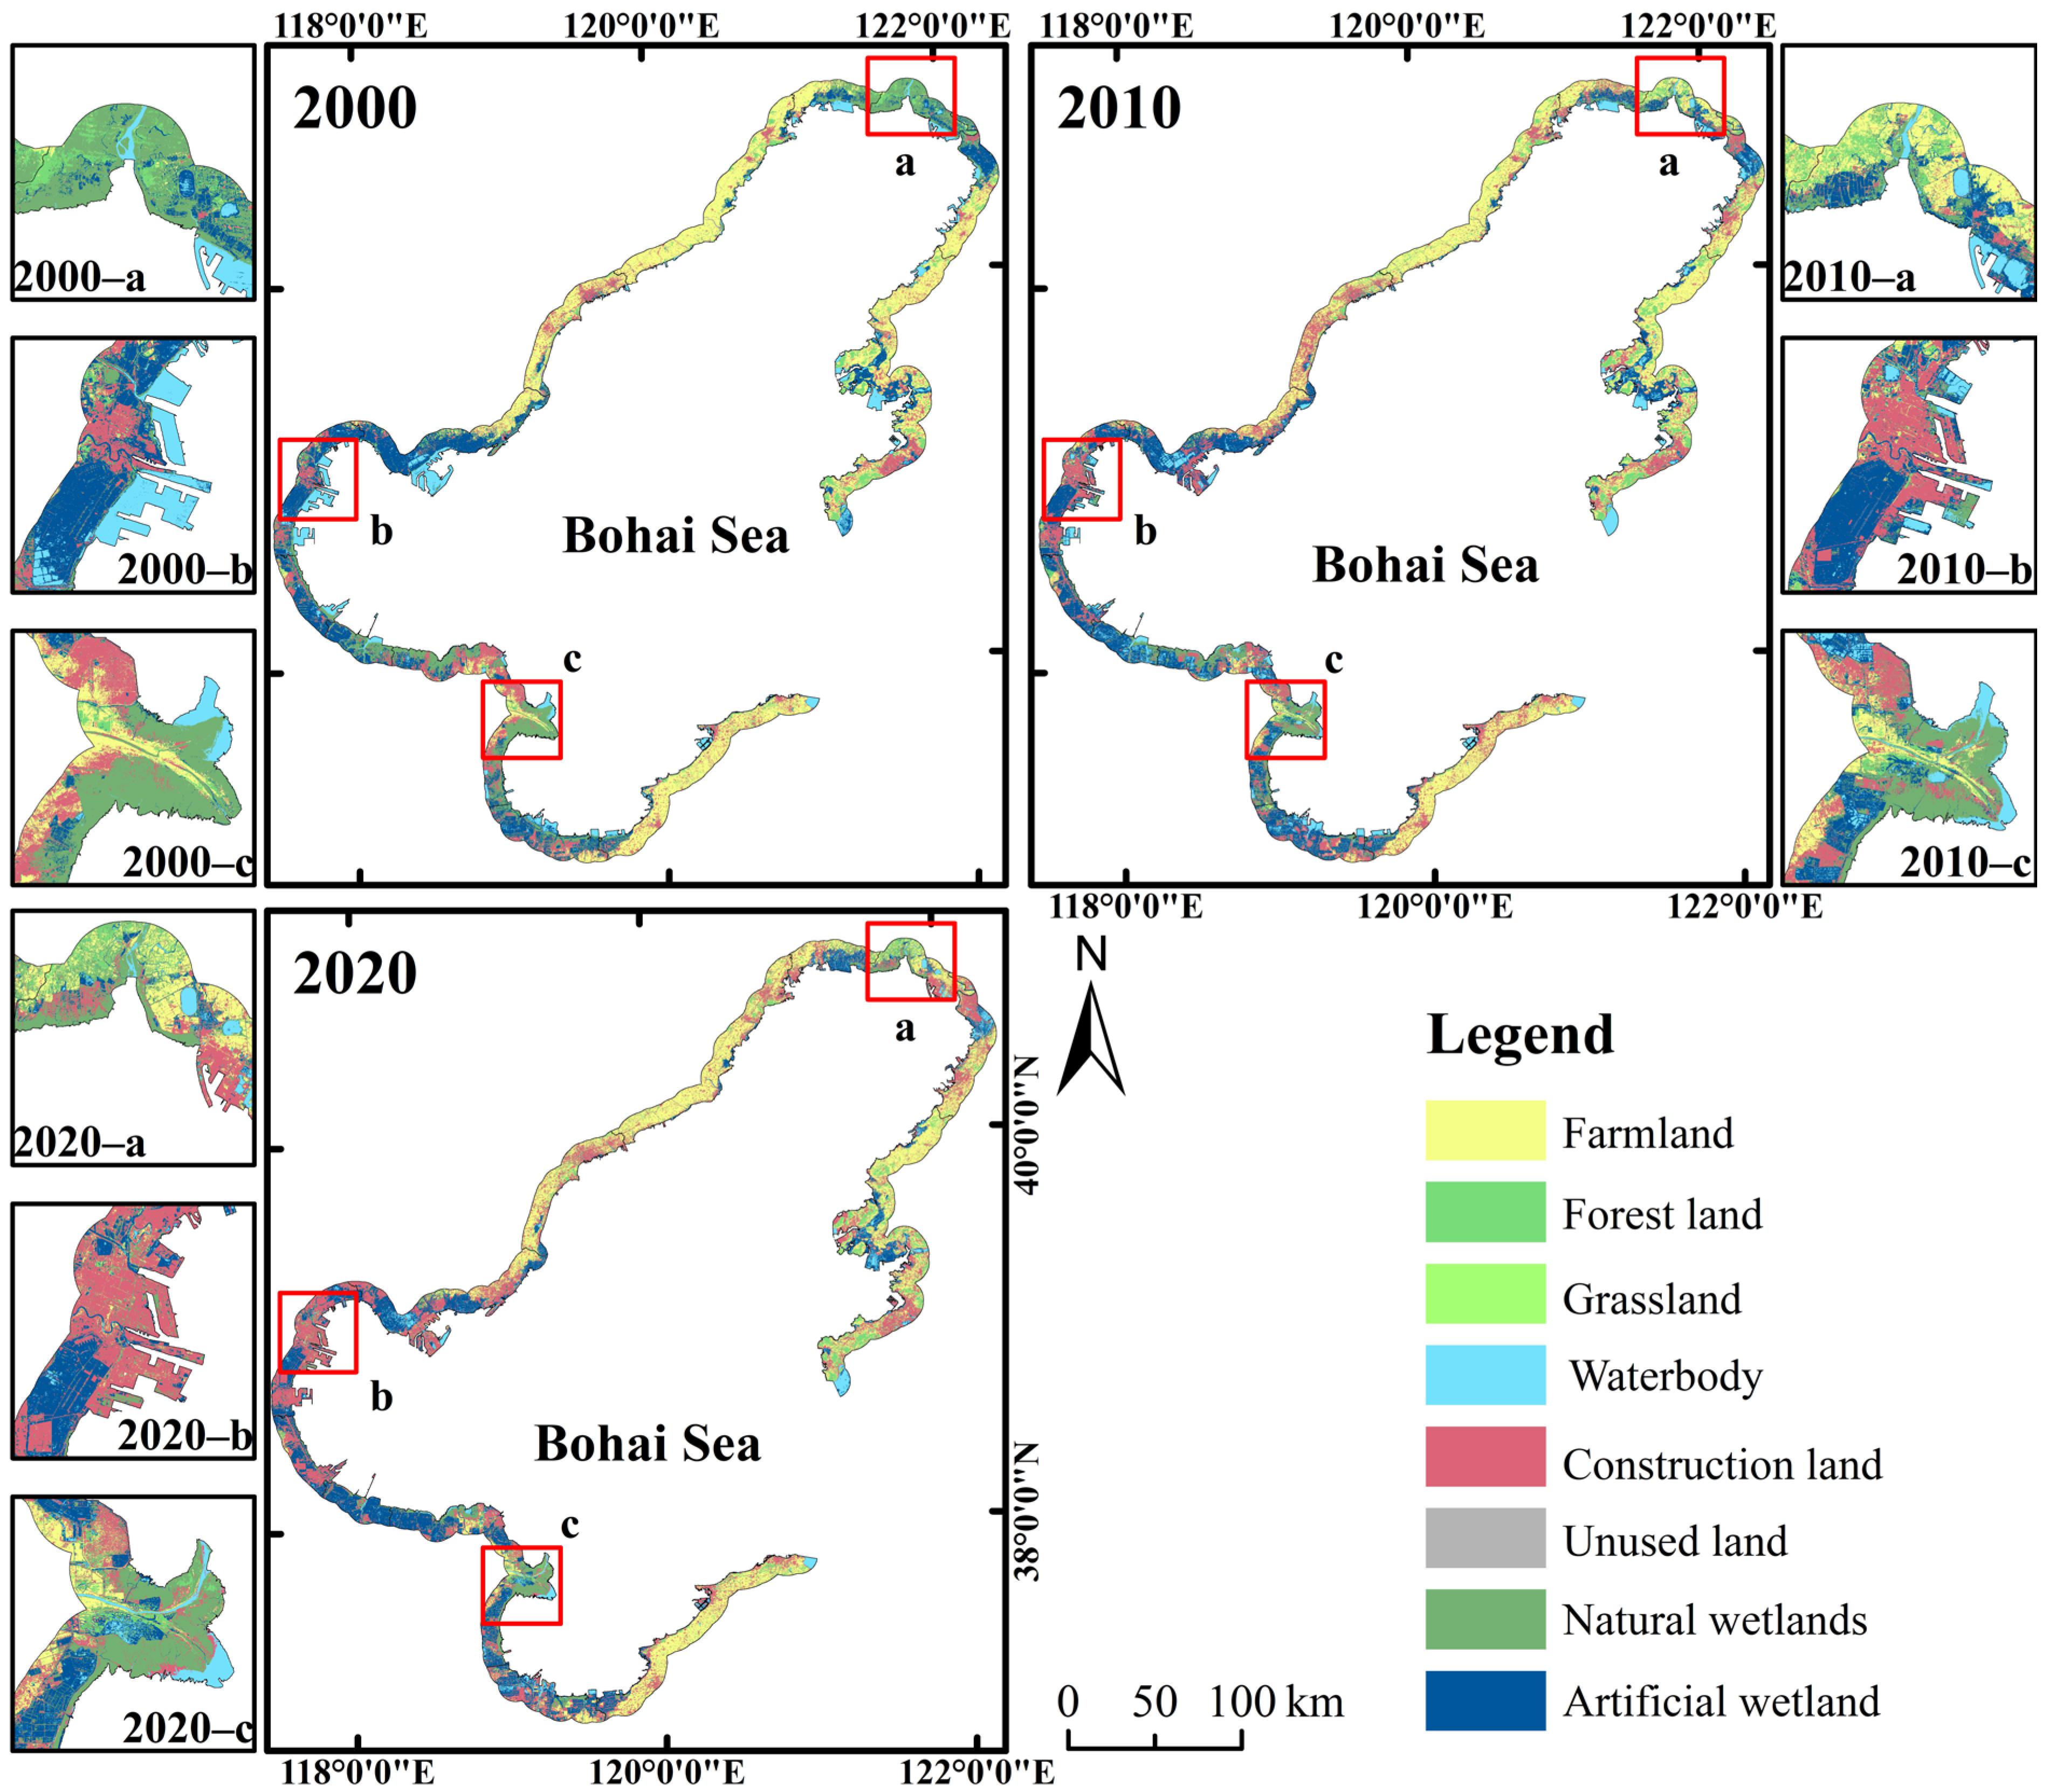
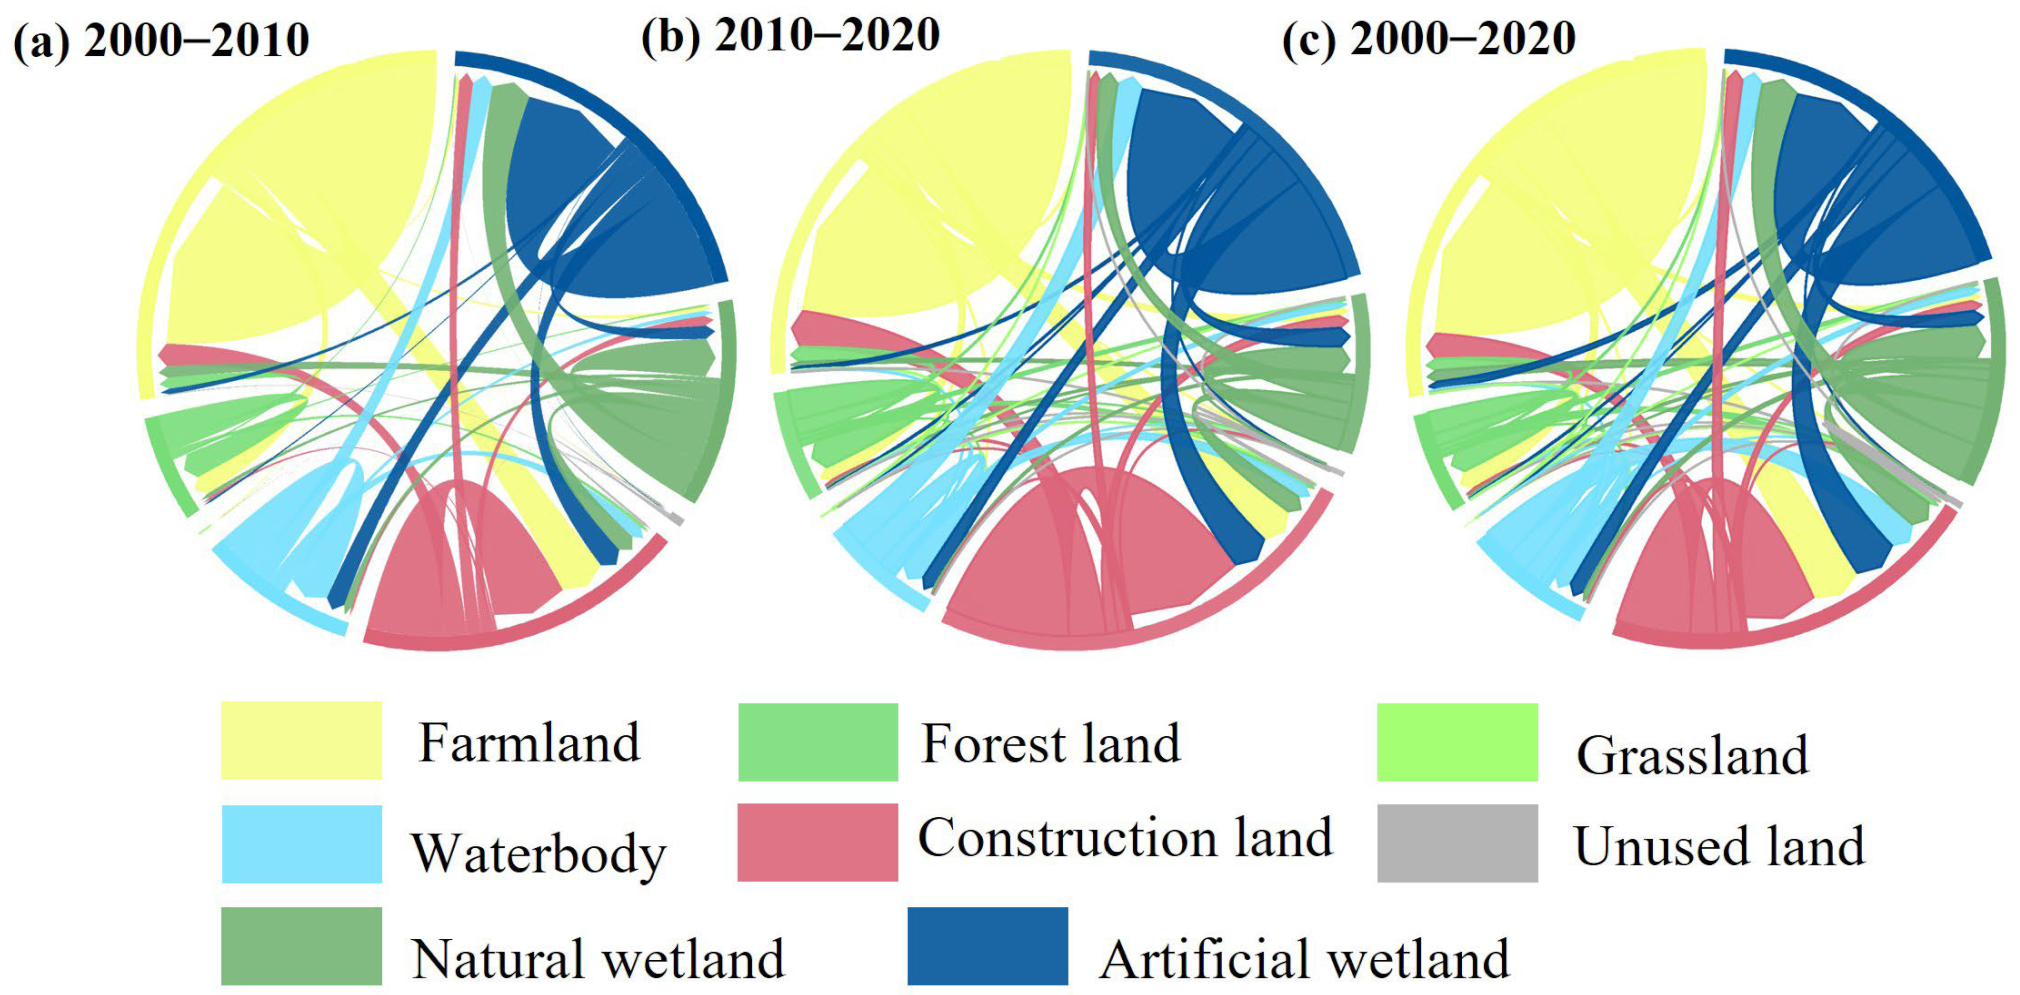
- From 2000 to 2020, the types of LULC area are mainly farmland and construction land, followed by artificial wetlands and natural wetlands. The proportion of farmland and artificial wetland has remained unchanged, while the area of construction land has increased, and the natural wetlands and waterbodies have degraded. In terms of land type conversion, farmland and artificial wetland are primarily converted into construction land, while natural wetland is mainly converted into artificial wetland. From the perspective of land development, the utilization degree of Bohai Bay, Liaodong Bay, and Laizhou Bay is obviously higher than that of other regions, and it has gradually deepened over time.
- (3)
- From 2000 to 2020, the added value of the secondary industry, urbanization rate, and population density were the single driving factors that significantly impacted the LUD in the study area. The interaction between GDP and the added value of the secondary industry has a significant impact on LULC change in the Circum-Bohai coastal zone.
Author Contributions
Funding
Informed Consent Statement
Data Availability Statement
Conflicts of Interest
References
- Uddin, K.; Khanal, N.; Chaudhary, S.; Maharjan, S.; Thapa, R.B. Coastal morphological changes: Assessing long-term ecological transformations across the northern Bay of Bengal. Environ. Chall. 2020, 1, 100001. [Google Scholar] [CrossRef]
- Liu, Y.; Li, B.; Wang, Y.; Chen, L.; Li, X.; Hou, X. Evaluation of ecological connectivity in the coastal zone of Laizhou Bay-Yellow River Delta based on ecosystem service value. Acta Ecol. Sin. 2019, 39, 7514–7524. [Google Scholar] [CrossRef]
- Cui, J.; Zhu, M.; Mi, H.; Liu, Y. Evaluation of Eco-Environmental Quality and Analysis on Spatio-Temporal Variation in Jinan, China. Pol. J. Environ. Stud. 2022, 31, 1061–1072. [Google Scholar] [CrossRef] [PubMed]
- Yang, X.; Meng, F.; Fu, P.; Zhang, J.; Liu, Y. Instability of remote sensing ecological index and its optimisation for time frequency and scale. Ecol. Inform. 2022, 72, 101870. [Google Scholar] [CrossRef]
- Kang, Y.; Meng, Q.; Liu, M.; Zou, Y.; Wang, X. Crop classification based on red edge features analysis of GF-6 WFV data. Sensors 2021, 21, 4328. [Google Scholar] [CrossRef]
- Wu, Y.; Liu, Z. Research progress on methods of automatic coastline extraction based on remote sensing images. Natl. Remote Sens. Bull. 2019, 23, 582–602. [Google Scholar] [CrossRef]
- Gens, R. Remote sensing of coastlines: Detection, extraction and monitoring. Int. J. Remote Sens. 2010, 31, 1819–1836. [Google Scholar] [CrossRef]
- McFeeters, S.K. The use of the Normalized Difference Water Index (NDWI) in the delineation of open water features. Int. J. Remote Sens. 1996, 17, 1425–1432. [Google Scholar] [CrossRef]
- Kauth, R.J.; Thomas, G. The tasselled cap–A graphic description of the spectral-temporal development of agricultural crops as seen by Landsat. In Proceedings of the LARS Symposia, West Lafayette, IN, USA, 29 June–1 July 1976; p. 159. [Google Scholar]
- Feyisa, G.L.; Meilby, H.; Fensholt, R.; Proud, S.R. Automated Water Extraction Index: A new technique for surface water mapping using Landsat imagery. Remote Sens. Environ. 2014, 140, 23–35. [Google Scholar] [CrossRef]
- Hossain, M.S.; Yasir, M.; Wang, P.; Ullah, S.; Jahan, M.; Hui, S.; Zhao, Z. Automatic shoreline extraction and change detection: A study on the southeast coast of Bangladesh. Mar. Geol. 2021, 441, 106628. [Google Scholar] [CrossRef]
- Bamdadinejad, M.; Ketabdari, M.J.; Chavooshi, S.M.H. Shoreline extraction using image processing of satellite imageries. J. Indian Soc. Remote Sens. 2021, 49, 2365–2375. [Google Scholar] [CrossRef]
- Xu, H. Modification of normalised difference water index (NDWI) to enhance open water features in remotely sensed imagery. Int. J. Remote Sens. 2006, 27, 3025–3033. [Google Scholar] [CrossRef]
- Zollini, S.; Alicandro, M.; Cuevas-González, M.; Baiocchi, V.; Dominici, D.; Buscema, P.M. Shoreline extraction based on an active connection matrix (ACM) image enhancement strategy. J. Mar. Sci. Eng. 2019, 8, 9. [Google Scholar] [CrossRef]
- Niculescu, S.; Bengoufa, S.; Mihoubi, M.; Belkessa, R.; Abbad, K. Rocky shoreline extraction using a deep learning model and object-based image analysis. Remote Sens. Spat. Inf. Sci. 2021, 43, 23–29. [Google Scholar] [CrossRef]
- Fisher, A.; Flood, N.; Danaher, T. Comparing Landsat water index methods for automated water classification in eastern Australia. Remote Sens. Environ. 2016, 175, 167–182. [Google Scholar] [CrossRef]
- Otsu, N. A threshold selection method from gray-level histograms. IEEE Trans. Syst. Man Cybern. 1979, 9, 62–66. [Google Scholar] [CrossRef]
- Wang, E.; Hu, S.; Han, H.; Liu, C. Research on ice concentration in Heilong River based on the UAV low-altitude remote sensing and OTSU algorithm. J. Hydraul. Eng. 2022, 53, 68–77. [Google Scholar] [CrossRef]
- Qu, L.A.; Chen, Z.; Li, M.; Zhi, J.; Wang, H. Accuracy improvements to pixel-based and object-based lulc classification with auxiliary datasets from Google Earth engine. Remote Sens. 2021, 13, 453. [Google Scholar] [CrossRef]
- Wang, M.; Zhang, H.; Zhang, Y.; Lin, M.; Gong, P. Evolution analysis of land use pattern in the Changjiang River Delta coastal zone in recent 39 years. Haiyang Xuebao 2020, 42, 142–154. [Google Scholar] [CrossRef]
- Hou, W.; Hou, X.; Sun, M.; Song, B. Land use/land cover change along low-middle latitude coastal areas of Eurasia and their driving forces from 2000 to 2010. World Reg. Stud. 2021, 30, 813–825. [Google Scholar] [CrossRef]
- Breiman, L. Random forests. Mach. Learn. 2001, 45, 5–32. [Google Scholar] [CrossRef]
- Liu, C.; Li, W.; Zhu, G.; Zhou, H.; Yan, H.; Xue, P. Land use/land cover changes and their driving factors in the Northeastern Tibetan Plateau based on Geographical Detectors and Google Earth Engine: A case study in Gannan Prefecture. Remote Sens. 2020, 12, 3139. [Google Scholar] [CrossRef]
- Ma, Y.; Jiang, Q.; Meng, Z.; Li, Y.; Wang, D.; Liu, H. Classification of Land Use in Farming Area Based on Random Forest Algorithm. Trans. Chin. Soc. Agric. Mach. 2016, 47, 297–303. [Google Scholar] [CrossRef]
- Zhang, H.; Qin, N.; Wang, J.; Li, M.; Yang, A.x.; Lu, Q. Spatiotemporal Pattern and Driving Factors of Land Use in Guangxi Coastal Zone. Res. Soil Water Conserv. 2022, 29, 367–374. [Google Scholar] [CrossRef]
- Han, Y.; Zhu, J.; Wei, D.; Wang, F. Spatial-Temporal Effect of Sea–Land Gradient on Land Use Change in Coastal Zone: A Case Study of Dalian City. Land 2022, 11, 1302. [Google Scholar] [CrossRef]
- Cui, J.; Zhu, M.; Liang, Y.; Qin, G.; Li, J.; Liu, Y. Land use/land cover change and their driving factors in the Yellow River Basin of Shandong Province based on google earth Engine from 2000 to 2020. ISPRS Int. J. Geo-Inf. 2022, 11, 163. [Google Scholar] [CrossRef]
- Tang, S.; Song, L.; Wan, S.; Wang, Y.; Jiang, Y.; Liao, J. Long-Time-Series Evolution and Ecological Effects of Coastline Length in Coastal Zone: A Case Study of the Circum-Bohai Coastal Zone, China. Land 2022, 11, 1291. [Google Scholar] [CrossRef]
- Nie, T.; Dong, G.; Jiang, X.; Lei, Y. Spatio-temporal changes and driving forces of vegetation coverage on the loess plateau of Northern Shaanxi. Remote Sens. 2021, 13, 613. [Google Scholar] [CrossRef]
- Zhang, Z.; Hu, B.; Qiu, H.; Deng, Y. Spatio-temporal Differentiation and Driving Mechanism of Ecological Environment Vulnerability in Southwest Guangxi Karst-Beibu Gulf Coastal Zone. J. Geo-Inf. Sci. 2021, 23, 456–466. [Google Scholar] [CrossRef]
- Lou, P.; Fu, B.; Lin, X.; Bi, L.; Ma, R.; Tang, T. Influence of Land Use Change on Ecosystem Service Value Based on GEE in the Beijing-Tianjin-Hebei Region from 1998 to 2018. Environ. Sci. 2019, 40, 5473–5483. [Google Scholar] [CrossRef]
- Dong, J.; Xiao, X.; Menarguez, M.A.; Zhang, G.; Qin, Y.; Thau, D.; Biradar, C.; Moore, B., III. Mapping paddy rice planting area in northeastern Asia with Landsat 8 images, phenology-based algorithm and Google Earth Engine. Remote Sens. Environ. 2016, 185, 142–154. [Google Scholar] [CrossRef] [PubMed]
- Xia, H.; Zhao, J.; Qin, Y.; Yang, J.; Cui, Y.; Song, H.; Ma, L.; Jin, N.; Meng, Q. Changes in water surface area during 1989–2017 in the Huai River Basin using Landsat data and Google earth engine. Remote Sens. 2019, 11, 1824. [Google Scholar] [CrossRef]
- Yang, X.; Meng, F.; Fu, P.; Zhang, Y.; Liu, Y. Spatiotemporal change and driving factors of the Eco-Environment quality in the Yangtze River Basin from 2001 to 2019. Ecol. Indic. 2021, 131, 108214. [Google Scholar] [CrossRef]
- Yang, X.; Meng, F.; Fu, P.; Wang, Y.; Liu, Y. Time-frequency optimization of RSEI: A case study of Yangtze River Basin. Ecol. Indic. 2022, 141, 109080. [Google Scholar] [CrossRef]
- Dai, S.; Yi, X.; Luo, H.; Li, H.; Li, M.; Zheng, Q.; Hu, Y. Mapping Land Use in Hainan Island Based on Google Earth Engine and Landsat Time Series Data. Chin. J. Trop. Crops 2021, 42, 3351–3357. [Google Scholar] [CrossRef]
- Yu, L.; Sun, L.; Zhang, D.; Liu, S.; Xie, Z.; Ping, X. Extraction of land-cover and wetland area in Bohai Rim region based on Google Earth Engine. Chin. J. Appl. Ecol. 2020, 31, 4091–4098. [Google Scholar] [CrossRef]
- Jiang, T.; Wu, G.; Niu, P.; Cui, Z.; Bian, X.; Xie, Y.; Shi, H.; Xu, X.; Qu, K. Short-term changes in algal blooms and phytoplankton community after the passage of Super Typhoon Lekima in a temperate and inner sea (Bohai Sea) in China. Ecotoxicol. Environ. Saf. 2022, 232, 113223. [Google Scholar] [CrossRef] [PubMed]
- Wei, F.; Han, G.; Han, M.; Zhang, J.; Li, Y.; Zhao, J. Temporal-spatial Dynamic Evolution and Mechanism of Shoreline and the Sea Reclamation in the Bohai Rim During 1980–2017. Sci. Geogr. Sin. 2019, 39, 997–1007. [Google Scholar] [CrossRef]
- Sun, B.; Zuo, S.; Xie, H.; Li, H.; Yang, Z. Analysis of impact effects and changes of the coastline in the Bohai Bay during the past 40 years. J. East China Norm. Univ. 2017, 4, 139–148. [Google Scholar] [CrossRef]
- Zhang, Y.; Liu, Y.; Zhang, X.; Huang, H.; Qin, K.; Bai, Z.; Zhou, X. Correlation Analysis between Land-Use/Cover Change and Coastal Subsidence in the Yellow River Delta, China: Reviewing the Past and Prospecting the Future. Remote Sens. 2021, 13, 4563. [Google Scholar] [CrossRef]
- Liu, Y.; Hou, X.; Li, X.; Song, B.; Wang, C. Assessing and predicting changes in ecosystem service values based on land use/cover change in the Bohai Rim coastal zone. Ecol. Indic. 2020, 111, 106004. [Google Scholar] [CrossRef]
- Zhang, D.-D.; Zhang, L. Land cover change in the central region of the lower Yangtze River based on Landsat imagery and the Google Earth Engine: A case study in Nanjing, China. Sensors 2020, 20, 2091. [Google Scholar] [CrossRef] [PubMed]
- Chen, C.; Chen, H.; Liang, J.; Huang, W.; Xu, W.; Li, B.; Wang, J. Extraction of water body information from remote sensing imagery while considering greenness and wetness based on Tasseled Cap transformation. Remote Sens. 2022, 14, 3001. [Google Scholar] [CrossRef]
- Song, Y.; Wang, Y.; Du, B.; Wang, J.; Dong, X. Detection of Overlapped Bullet Holes Based on Improved Otsu’s Thresholding Method. Acta Armamentarii 2022, 43, 924. [Google Scholar] [CrossRef]
- Wan, J.; Lin, S.; Mei, T.; Lin, Z.; Guo, T. Image Enhancement Algorithm of Electrowetting Display Based on Image Segmentation and Dynamic Histogram Equalization. Acta Photonica Sin. 2022, 51, 0210005. [Google Scholar] [CrossRef]
- Wu, R.; Hu, X.; Mei, H.; He, J.; Yang, J. Spatial Susceptibility Assessment of Landslides Based on Random Forest: A Case Study from Hubei Section in the Three Gorges Reservoir Area. Earth Sci. J. China Univ. Geosci. 2021, 46, 321–330. [Google Scholar] [CrossRef]
- Zhu, Y.; Zeng, Y.; Zhang, M. Extract of land use/cover information based on HJ satellites data and object-oriented classification. Trans. Chin. Soc. Agric. Eng. (Trans. CSAE) 2017, 33, 258–265. [Google Scholar] [CrossRef]
- Wang, N.; Li, Q.; Du, X.; Zhang, Y.; Zhao, L.; Wang, H. Identification of main crops based on the univariate feature selection in Subei. Natl. Remote Sens. Bull. 2017, 21, 519–530. [Google Scholar] [CrossRef]
- Pan, L.; Xia, H.; Yang, J.; Niu, W.; Wang, R.; Song, H.; Guo, Y.; Qin, Y. Mapping cropping intensity in Huaihe basin using phenology algorithm, all Sentinel-2 and Landsat images in Google Earth Engine. Int. J. Appl. Earth Obs. Geoinf. 2021, 102, 102376. [Google Scholar] [CrossRef]
- Zhuang, D.; Liu, J. Study on the model of regional differentiation of land use degree in China. J. Nat. Resour. 1997, 12, 105–111. [Google Scholar]
- Liu, H.; Zheng, M.; Liu, J.; Zheng, X. Sustainable land use in the trans-provincial marginal areas in China. Resour. Conserv. Recycl. 2020, 157, 104783. [Google Scholar] [CrossRef]
- Wang, J.; Xu, C. Geodetector: Principle and prospective. Acta Geogr. Sin. 2017, 72, 116–134. [Google Scholar] [CrossRef]
- Xu, J.; Liu, S.; Zhao, S.; Wu, X.; Hou, X.; An, Y.; Shen, Z. Spatiotemporal dynamics of water yield service and its response to urbanisation in the Beiyun river Basin, Beijing. Sustainability 2019, 11, 4361. [Google Scholar] [CrossRef]
- Hou, X.; Zhang, H.; Li, D.; Hou, W.; Song, Y. Development trend, environmental and ecological impacts, and policy recommendations for Bohai Sea reclamation. Acta Ecol. Sin. 2018, 38, 3311–3319. [Google Scholar] [CrossRef]


| Sensor | Spatial Resolution(m) | Year | Band Used |
|---|---|---|---|
| Landsat-5 TM | 30 | 2000, 2005, 2010 | Blue, Green, Red |
| Landsat-8 OLI | 30 | 2015, 2020 | NIR, SWIR |
| Type | Influencing Factors | Index | Unit |
|---|---|---|---|
| X1 | population density | Ten thousand people/km2 | |
| X2 | gross domestic product | billion CNY | |
| X3 | secondary industry added value | million CNY | |
| Socioeconomic | X4 | tertiary industry added value | million CNY |
| factor | X5 | urbanization rate | % |
| X6 | total fishery output | million tons | |
| X7 | port throughput | million tons | |
| Physical factor | X8 | annual average precipitation | mm |
| X9 | annual average temperature | °C | |
| X10 | slope | / | |
| X11 | aspect | ° | |
| X12 | elevation | m |
| Type | Uncultivated Land | Ecological Land | Agricultural Land | Construction Land |
|---|---|---|---|---|
| LULC types | Unused land (sand and bare land) Natural wetlands (beach, wetland) | Grassland Forest land Waterbody (seawater, inland freshwater) | Farmland Artificial wetland (saltern, coastal reclamation, artificial breeding) | Construction land (urban, residential area, traffic land, and industrial land) |
| Index of Classification | 1 | 2 | 3 | 4 |
| LUCC Types | 2000 | 2010 | 2020 | |||
|---|---|---|---|---|---|---|
| PUA (%) | PPA (%) | PUA (%) | PPA (%) | PUA (%) | PPA (%) | |
| Farmland | 88.42 | 94.28 | 87.76 | 93.93 | 89.57 | 94.5 |
| Forest land | 90.63 | 93.55 | 92.3 | 93.98 | 91.72 | 92.36 |
| Grassland | 100 | 50 | 100 | 72.73 | 100 | 25 |
| Waterbody | 96.95 | 92.03 | 86.25 | 92.62 | 87.5 | 90.51 |
| Construction land | 90.77 | 91.47 | 89.34 | 90.76 | 94.72 | 96.34 |
| Unused land | 85.71 | 88.24 | 90 | 46.15 | 100 | 60.71 |
| Natural wetlands | 90.09 | 86.96 | 71.19 | 79.25 | 91.04 | 88.41 |
| Artificial wetland | 94.06 | 90.91 | 90.86 | 82.87 | 93.13 | 91.35 |
| POA (%) | 91.15 | 88.54 | 92.08 | |||
| Kappa coefficient | 0.89 | 0.86 | 0.90 | |||
| Year | X1 | X2 | X3 | X4 | X5 | X6 | X7 | X8 | X9 | X10 | X11 | X12 | |
|---|---|---|---|---|---|---|---|---|---|---|---|---|---|
| 2000 | q | 0.12 | 0.13 | 0.08 | 0.18 | 0.08 | 0.19 | 0.06 | 0.06 | 0.11 | 0.04 | 0.01 | 0.04 |
| p | 0 | 0 | 0 | 0 | 0 | 0 | 0 | 0 | 0 | 0 | 0 | 0 | |
| 2010 | q | 0.09 | 0.09 | 0.10 | 0.07 | 0.11 | 0.03 | 0.12 | 0.05 | 0.01 | 0.04 | 0.09 | 0.09 |
| p | 0 | 0 | 0 | 0 | 0 | 0 | 0 | 0 | 0 | 0 | 0 | 0 | |
| 2020 | q | 0.06 | 0.06 | 0.10 | 0.07 | 0.09 | 0.05 | 0.05 | 0.05 | 0.01 | 0.05 | 0.06 | 0.06 |
| p | 0 | 0 | 0 | 0 | 0 | 0 | 0 | 0 | 0 | 0 | 0 | 0 |
Disclaimer/Publisher’s Note: The statements, opinions and data contained in all publications are solely those of the individual author(s) and contributor(s) and not of MDPI and/or the editor(s). MDPI and/or the editor(s) disclaim responsibility for any injury to people or property resulting from any ideas, methods, instructions or products referred to in the content. |
© 2023 by the authors. Licensee MDPI, Basel, Switzerland. This article is an open access article distributed under the terms and conditions of the Creative Commons Attribution (CC BY) license (https://creativecommons.org/licenses/by/4.0/).
Share and Cite
Cui, J.; Ji, W.; Wang, P.; Zhu, M.; Liu, Y. Spatial–Temporal Changes in Land Use and Their Driving Forces in the Circum-Bohai Coastal Zone of China from 2000 to 2020. Remote Sens. 2023, 15, 2372. https://doi.org/10.3390/rs15092372
Cui J, Ji W, Wang P, Zhu M, Liu Y. Spatial–Temporal Changes in Land Use and Their Driving Forces in the Circum-Bohai Coastal Zone of China from 2000 to 2020. Remote Sensing. 2023; 15(9):2372. https://doi.org/10.3390/rs15092372
Chicago/Turabian StyleCui, Jian, Wenxin Ji, Peng Wang, Mingshui Zhu, and Yaohui Liu. 2023. "Spatial–Temporal Changes in Land Use and Their Driving Forces in the Circum-Bohai Coastal Zone of China from 2000 to 2020" Remote Sensing 15, no. 9: 2372. https://doi.org/10.3390/rs15092372