Article

Local Convergence Index-Based Infrared Small Target Detection against Complex Scenes

1
School of Information and Communication Engineering, University of Electronic Science and Technology of China, Chengdu 611731, China
2
Laboratory of Imaging Detection and Intelligent Perception, University of Electronic Science and Technology of China, Chengdu 611731, China
*
Author to whom correspondence should be addressed.
Remote Sens. 2023, 15(5), 1464; https://doi.org/10.3390/rs15051464
Submission received: 29 December 2022 / Revised: 2 March 2023 / Accepted: 4 March 2023 / Published: 6 March 2023
(This article belongs to the Special Issue Computer Vision and Machine Learning Application on Earth Observation)

Abstract

:
Infrared small target detection (ISTD) plays a crucial role in precision guidance, anti-missile interception, and military early-warning systems. Existing approaches suffer from high false alarm rates and low detection rates when detecting dim and small targets in complex scenes. A robust scheme for automatically detecting infrared small targets is proposed to address this problem. First, a gradient weighting technique with high sensitivity was used for extracting target candidates. Second, a new collection of features based on local convergence index (LCI) filters with a strong representation of dim or arbitrarily shaped targets was extracted for each candidate. Finally, the collective set of features was inputted to a random undersampling boosting classifier (RUSBoost) to discriminate the real targets from false-alarm candidates. Extensive experiments on public datasets NUDT-SIRST and NUAA-SIRST showed that the proposed method achieved competitive performance with state-of-the-art (SOTA) algorithms. It is also important to note that the average processing time was as low as 0.07 s per frame with low time consumption, which is beneficial for practical applications.

1. Introduction

Infrared small target detection is one of the key technologies for infrared search and tracking systems and it is extensively used in a variety of applications such as aerospace, navigation, and early-warning systems [1,2].
In the context of small target detection in infrared images, a complex scene is a scene with a large number of objects and background features, such as buildings, clouds, shadows, noise, etc., that can make it difficult for algorithms to distinguish between the true targets and their surrounding environment and clutter. Additionally, a complex scene may involve multiple targets with varying sizes and intensities. Conversely, some datasets used in earlier research on infrared small target detection were considered as containing simple scenes due to their relatively clean backgrounds with minimal interference, as shown in Figure 1.
Due to the limitations of remote infrared sensing imaging, some useful features (e.g., texture features) are difficult to extract due to the small target size, complex background, clutter, and noise, which can lead to high false alarm rates and low detection rates of detection algorithms [3]. Therefore, IR small target detection algorithms that are function robustly with complex scenes are the focus of IR search-and-tracking research.
Generally, infrared small target detection methods can be classified into non-deep learning and deep learning methods.
Deep learning methods, especially convolutional neural networks (CNNs), can automatically learn high-level features from raw data, eliminating the need for feature engineering. Therefore, they are particularly suitable for classifying targets with complex color, texture, and shape features in visible light images. Deep learning has been introduced into the field of infrared small target detection, achieving promising results [4,5,6,7]. However, deep learning usually requires a large amount of annotated data and computational resources to achieve satisfactory performance.
Non-deep learning methods rely on prior knowledge. These methods [8,9,10,11,12,13] require significant expertise and effort in mathematical modeling or feature engineering, making it challenging to achieve optimal results. For the task of infrared small target detection, owing to the lack of color, texture, and shape features of small targets in infrared images and the fact that their shapes are all similar to a 2D Gaussian distribution, it is feasible to design handcrafted features for description.
Owing to the fact that there is a shortage of real data for small targets in practical applications, there are large-sized images in practical applications that make it difficult to train and apply deep learning; moreover, infrared target detection is a risk-sensitive task which requires the algorithm to be interpretable. We therefore propose a novel method for detecting infrared small targets using local convergence index (LCI) filters [14] and a random undersampling boosting classifier (RUSBoost) [15]. First, target candidates are extracted using a multi-scale, multi-directional, gradient weighting technique, which helps to detect dim, small targets with weak boundaries. Second, features are extracted for each candidate based on each candidate’s intensity, geometry, and LCI response (LCI filters are based on gradient convergence rather than intensity, which can effectively represent low-contrast objects in a densely cluttered background). Third, the feature set is fed into the boosting classifier to distinguish between real targets and false-alarm candidates. We determined that RUSBoost was an appropriate classifier, since our dataset was skewed, with a small number of true target candidates and a large number of false-alarm candidates.
The major contributions of this research can be summarized as follows:
  • A novel detection scheme for infrared small targets based on an LCI filter is proposed, with a high detection rate and a low false alarm rate that outperforms SOTA techniques; the scheme also has low time consumption and is beneficial for practical applications against complex scenes.
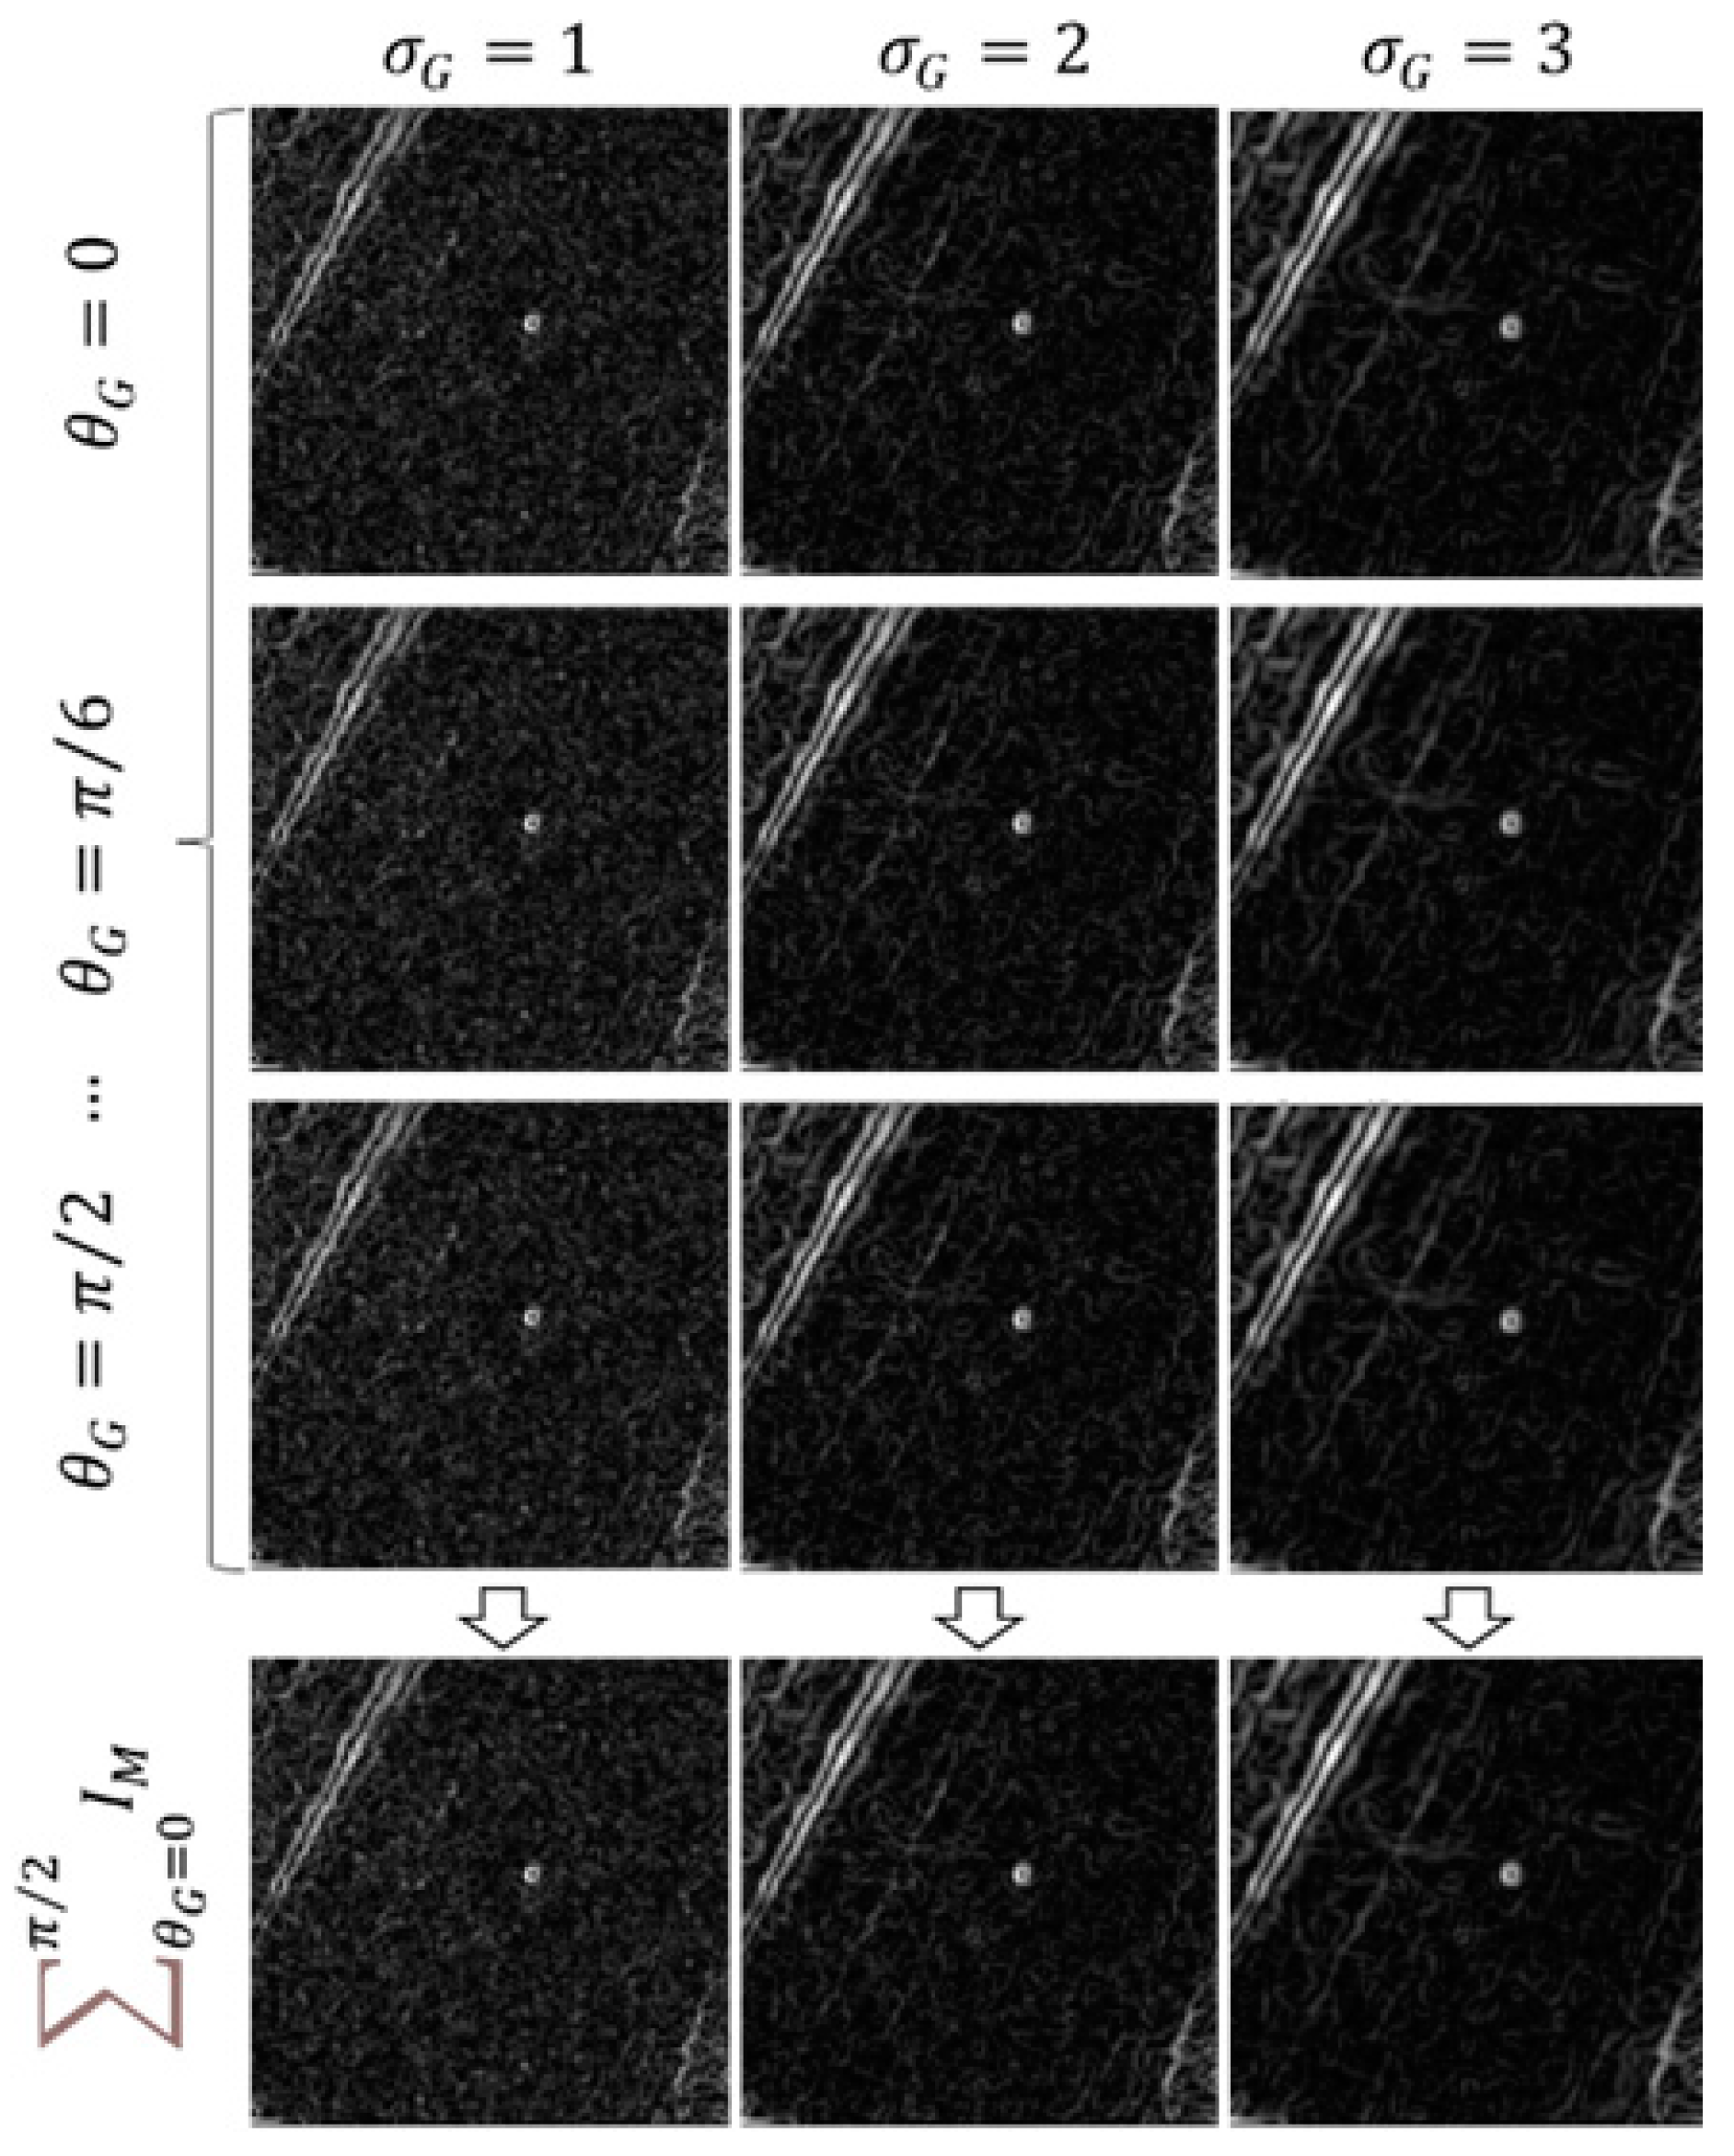
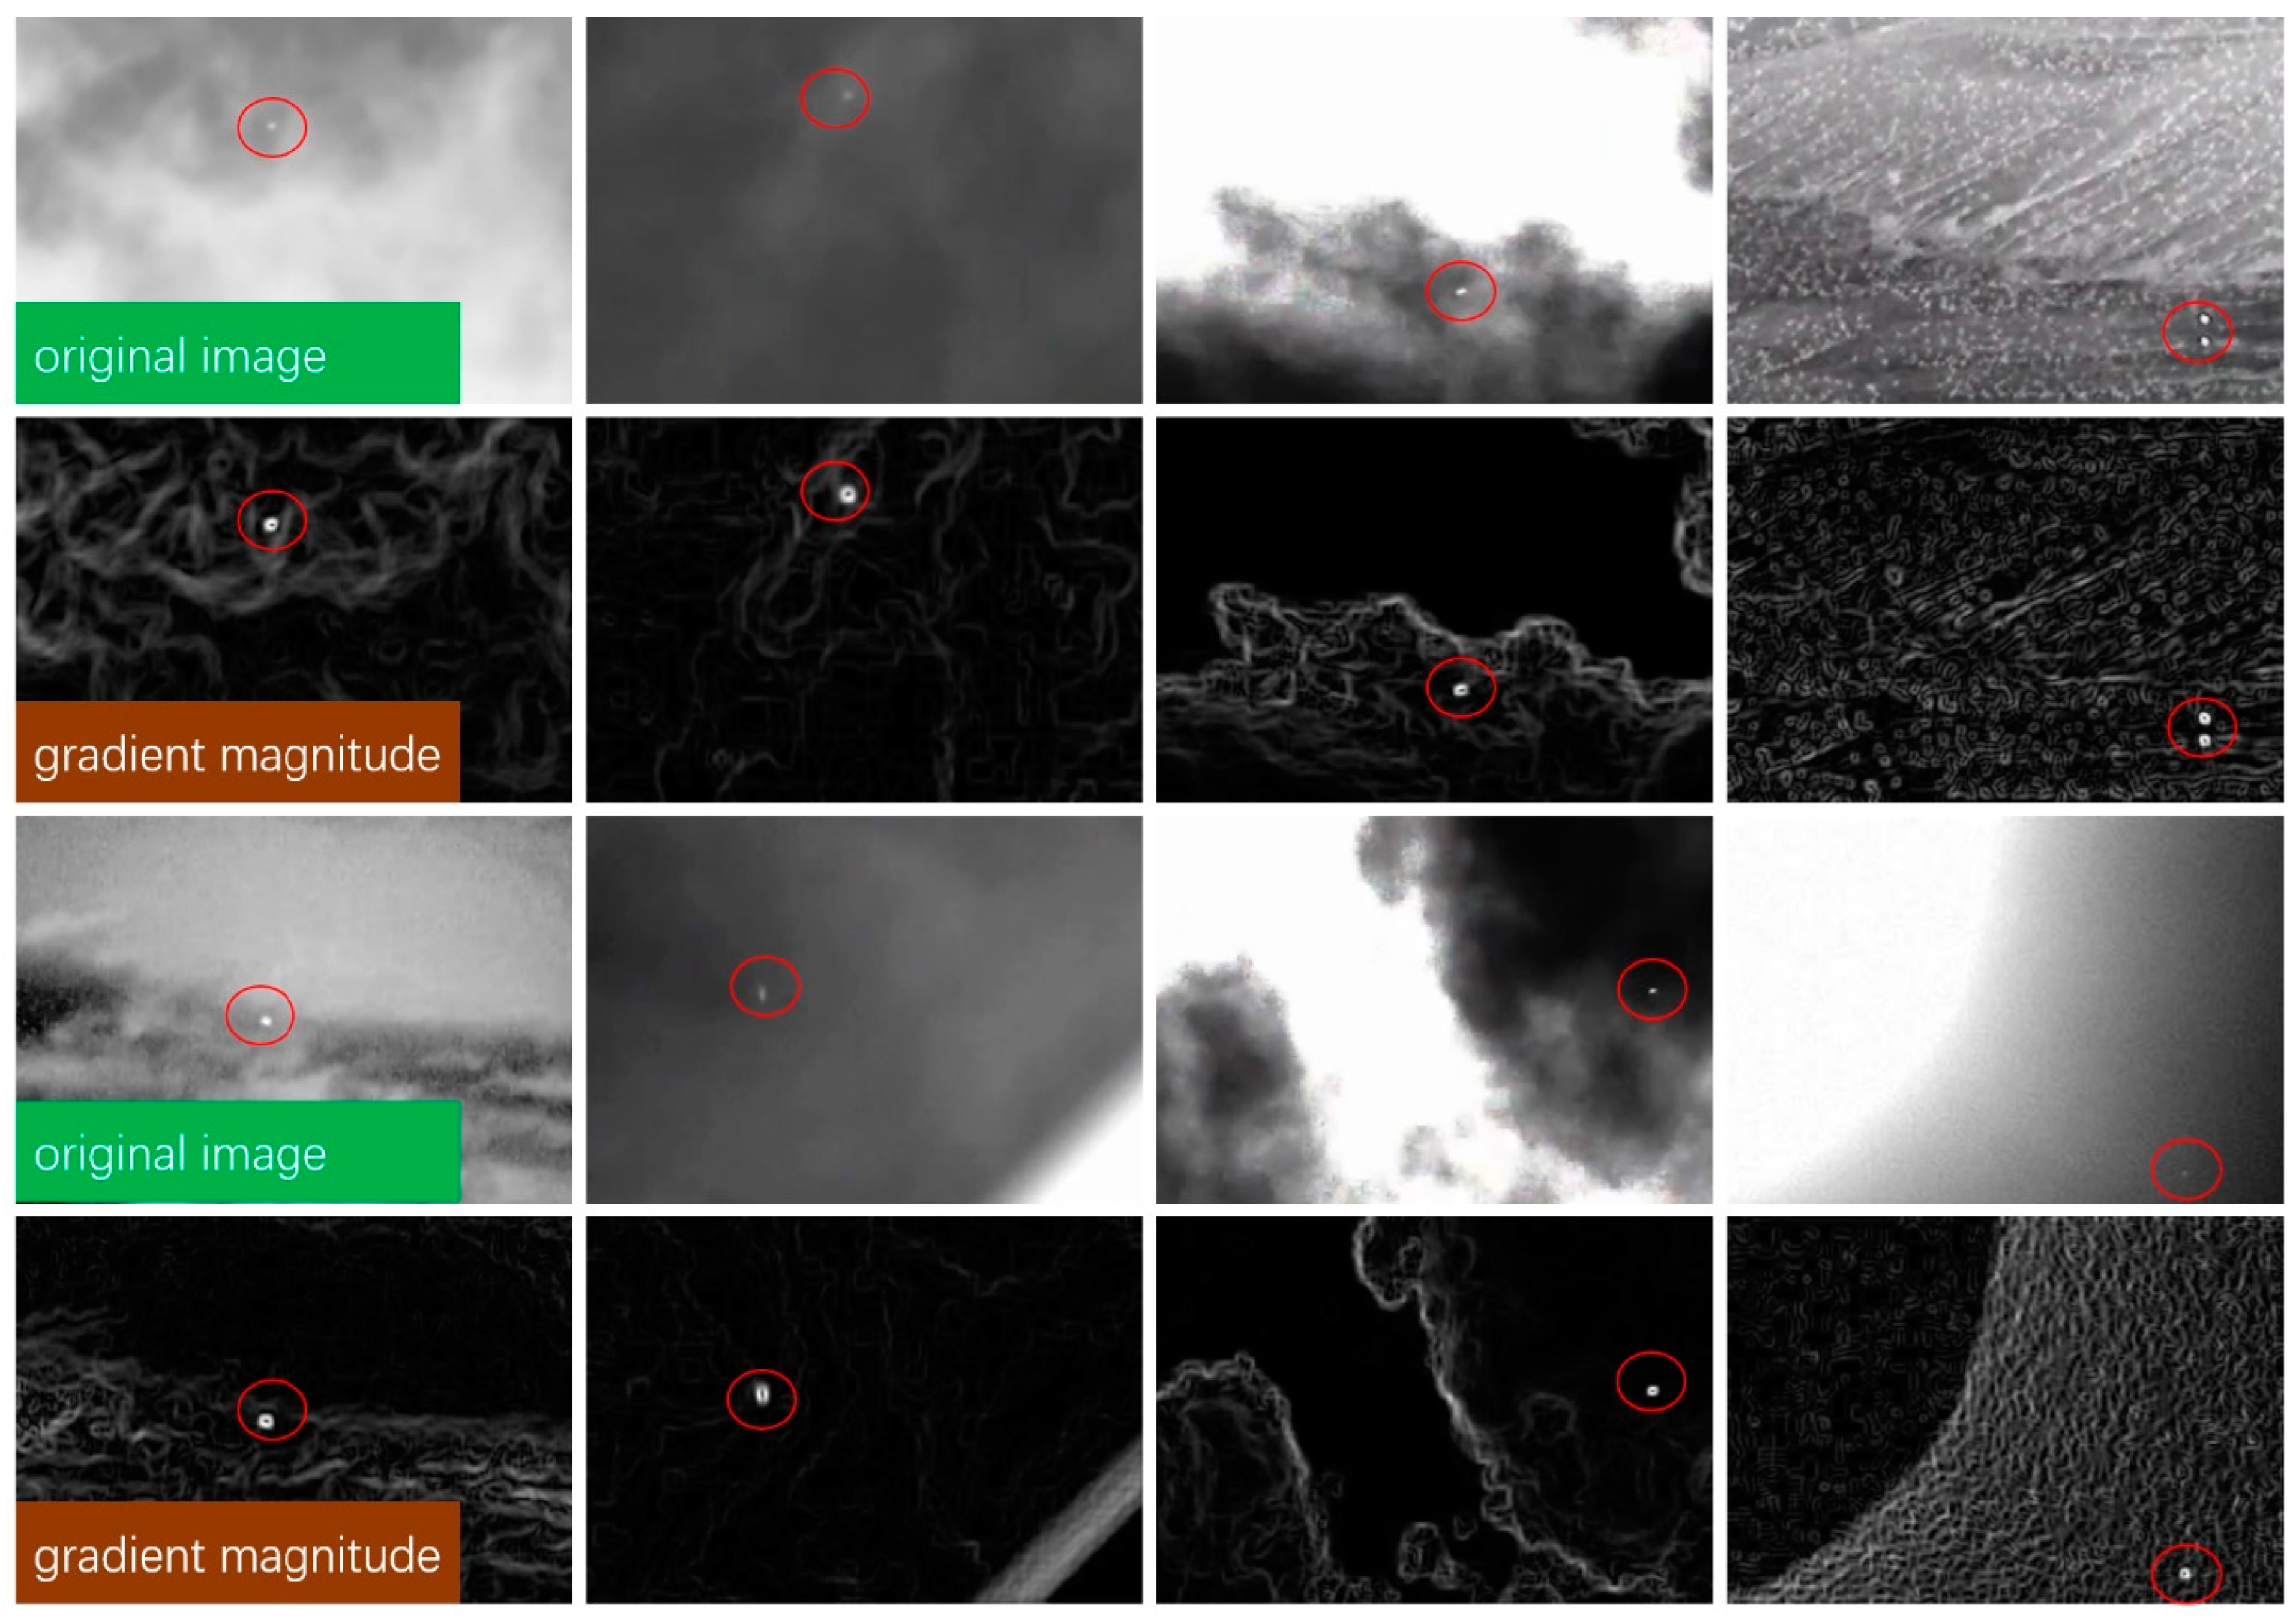
  • In the coarse detection stage of candidate regions, the sensitivity and accuracy of infrared small target detection are significantly improved by introducing a multi-scale and multi-directional gradient weighting strategy.
  • To solve the imbalance problem between true targets and false-alarm sources for infrared small target detection, we used RUSBoost as a classifier, which combines undersampling and ensemble learning. For larger sample sizes, undersampling can fully reflect its advantages and improve the operational efficiency while balancing the dataset.
The remaining part of the work is structured as follows: Section 2 describes the presented methodology, Section 3 goes into detail about the experiments used to demonstrate the effectiveness of the approach, and Section 4 provides the conclusion.

2. Methodology

2.1. Related Works

Infrared small target detection algorithms can be broadly classified into data-driven deep neural networks or model-driven algorithms that do not learn. Typically, deep neural networks consider infrared small target detection as a semantic segmentation task. Li et al. [4] modified a U-shaped structured network for infrared small target detection using a densely nested interactive module and obtained good target detection results. Hou et al. [5] proposed a robust infrared small target detection network in which a handcrafted feature extraction structure was designed based on the local saliency of small infrared targets and embedded in a convolutional neural network. Zhang et al. [6] proposed an attention-guided pyramidal context network, which constructs a framework combining contextual pyramidal modules and attention mechanisms to integrate contextual information. Dai et al. [7] introduced a unique deep network for infrared small target detection that integrates labeled data and domain knowledge with discriminative networks and standard model-driven approaches. Although these methods perform better than model-driven algorithms, a higher detection rate depends on more and better-labeled samples. In addition, these methods have a low generalization capability due to various dense clutter in practical applications.
Non-learning, model-driven approaches depend heavily on prior knowledge in infrared scenes and mainly include background estimation-based, target saliency-based, and sparse representation-based approaches. Background estimation-based methods—including top-hat operations, median filtering, maximum filtering, and morphological reconstruction—may incorrectly detect edge clutter as targets in complex scenes. Target saliency-based approaches, such as the local contrast metric (LCM) [8] and the multi-scale patch-based contrast measure (MPCM) [9], have a reduced detection rate when the target is dim and small. For sparse representation-based algorithms, the detection task is modeled as a convex optimization problem by exploiting the low-rank nature of the background image and the sparseness of the target image. Gao et al. [10] proposed an infrared patch image (IPI) model that can separate small target images from background images by reconstructing low-rank and sparse matrices. Based on Gao’s study, the sparse prior information, and non-local autocorrelation prior information of the target, researchers developed the column-weighted IPI model [11], the nonnegative infrared patch image model (NIPPS) [12], and the tensor kernel parametric partial sum model (PSTNN) [13]. For conventional infrared images, these approaches provide reliable small-target detection capabilities. For infrared images with dim objects or complicated backgrounds, however, high-intensity clutter may readily compromise detection accuracy. In addition, the image decomposition and iterative optimization activities of the above methods are time-consuming and difficult to use for real-time target detection.

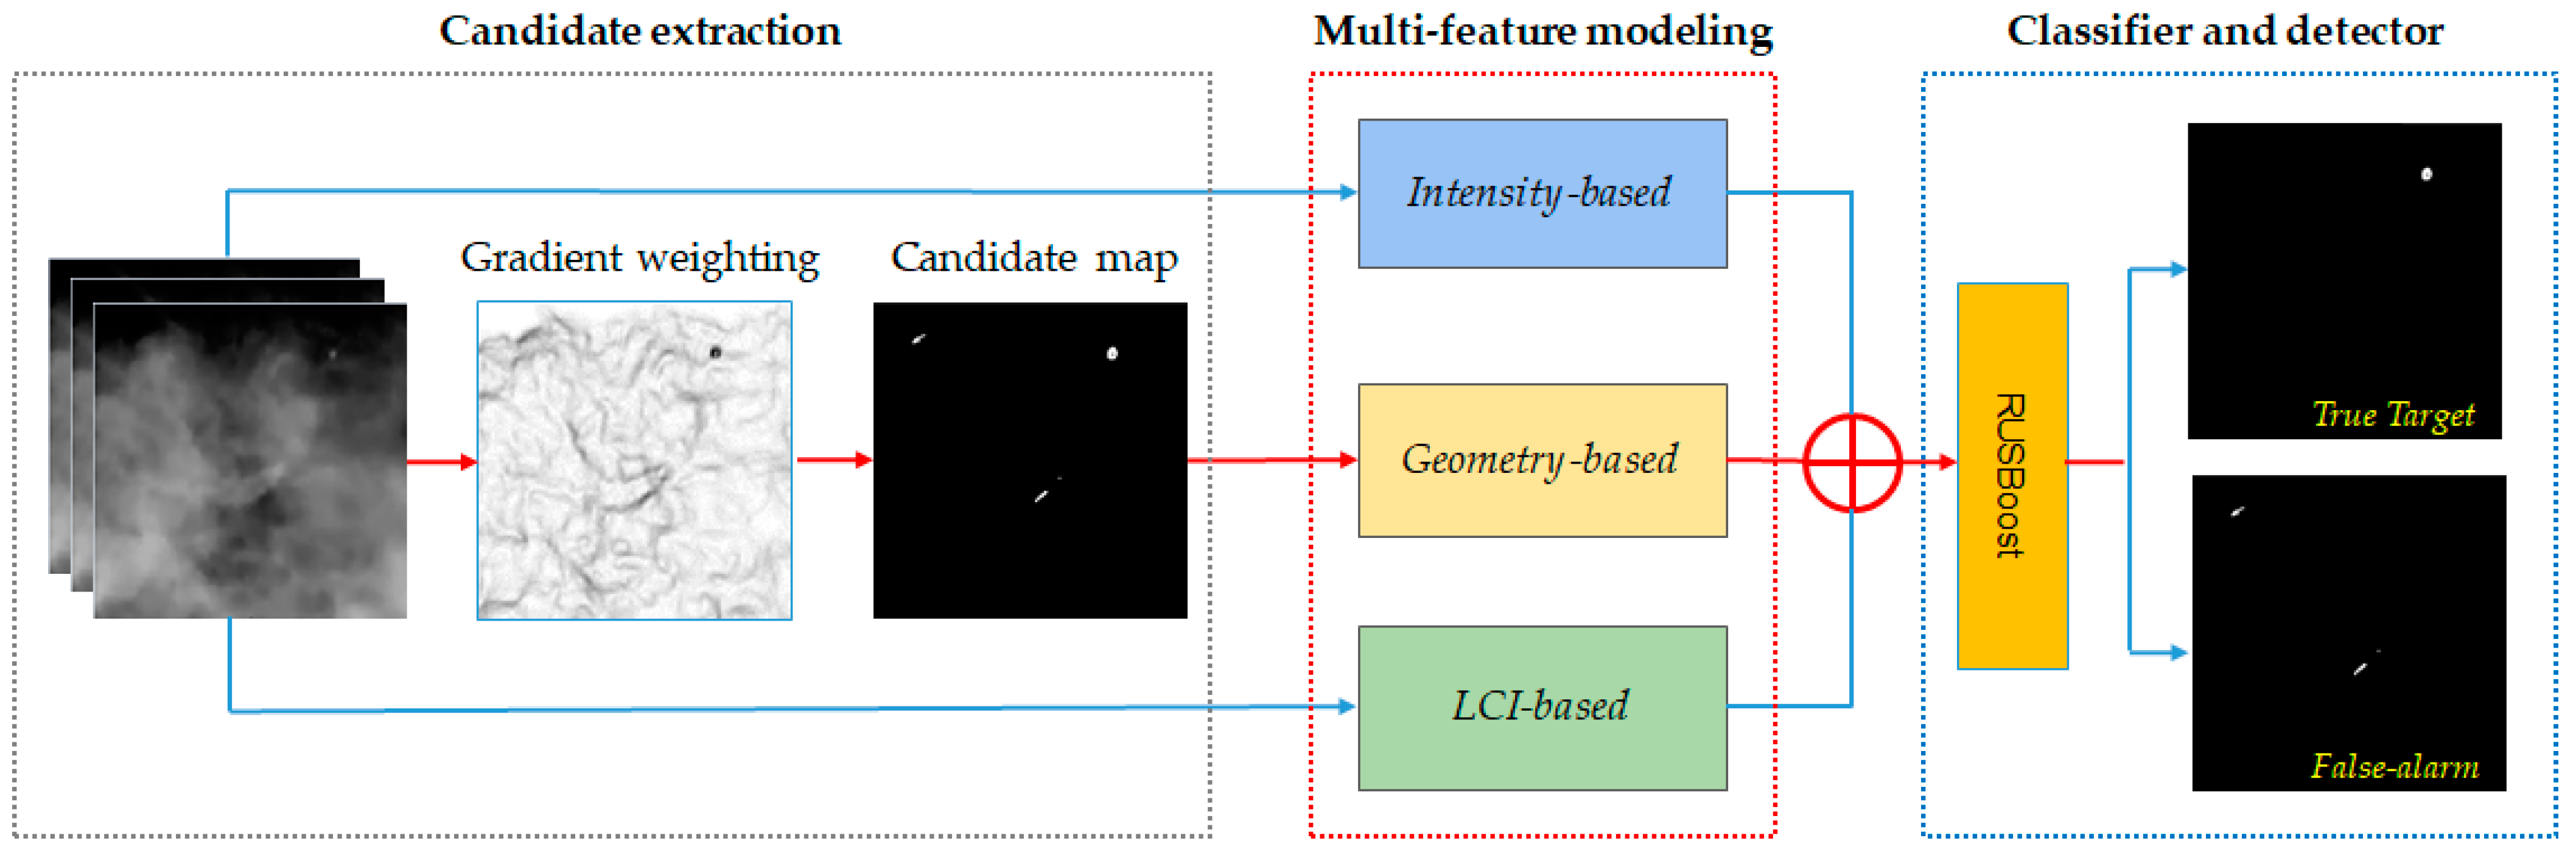
2.2. Overall Framework

To detect small targets in complex scenes, a fast algorithm with high sensitivity can be used initially to extract dim target candidates. Then, a multi-feature model can be built, and a classifier can be applied to further reduce false-alarm candidates. This reliable scheme has been used for small object detection in medical images, such as fundus lesion detection [16,17,18] and lung nodule detection [19]. Figure 2 shows the overall framework of the proposed algorithm, which includes candidate extraction using multi-directional and multi-scale Gaussian derivative kernels, multi-feature modeling using a local convergence index filter, and candidate classification by training a RUSBoost classifier.

2.3. Candidate Extraction

Since infrared small targets usually exhibit stronger intensity in the local context [20], edge features will exist even for dim targets. The edges of targets are very different from those of other targets in terms of background clutter: edges of clutter are usually disconnected or long, while edges of targets are short and encircling. Therefore, edge detection algorithms can be used to extract candidates of infrared small targets. Compared with other techniques, multi-directional and multi-scale Gaussian derivative kernels can easily remove background noise and enhance the gradient boundaries of small targets [21].
The directional derivatives of the Gaussian kernel in different directions were obtained as Gaussian derivative kernels for different scales and orientations, which were calculated using Equation (1):
G D ( x , y , σ G , θ G ) = G ( x , y , σ G ) σ G 2 ( x cos θ G + y sin θ G ) ,
where G ( x , y , σ G ) = ( 1 / 2 π σ G 2 ) e ( x 2 + y 2 ) / 2 σ G 2 is the Gaussian kernel and σ G { 1 , 2 , 3 } px is its corresponding standard deviation, which is used to regulate the scale of the kernel. θ G { 0 , π / 6 , π / 3 , π / 2 } is the rotation angle.
Then, the gradient significance values for different scales and different orientations were obtained by the convolution of the original infrared image ( I O ) with the rotated Gaussian derivative kernel:
I M ( x , y , σ G , θ G ) = [ ( ω ( θ G ) G D ( x , y , σ G , θ G ) I O ( x , y ) ) 2 + ( ω ( θ G + π / 2 ) G D ( x , y , σ G , θ G + π / 2 ) I O ( x , y ) ) 2 ] 1 / 2 ,
where is the convolution operator, and ω ( θ G ) is the normalization factor of the Gaussian derivative kernel G D ( x , y , σ G , θ G ) . Samples of gradient significance images for different scales and orientations are shown in Figure 3.
In I M , a pixel with a smaller gradient magnitude means its corresponding area is smooth, and a pixel with a higher value is the edge of the image. First, we normalized I M to obtain I N M . Then, the gradient-weighted image was obtained by:
I W ( x , y , σ G , θ G ) = 1 I N M ( x , y , σ G , θ G ) 2 1 + I N M ( x , y , σ G , θ G ) 2 ,
The final gradient-weighted image I W O S was obtained by summing I W of all orientations and scales as follows, and adaptive threshold processing was applied to I W O S to obtain the binary candidate image I C A N .
I W O S ( x , y , σ G ) = σ G = 1 3 θ G = 0 π / 2 I W ( x , y , σ G , θ G )
Then, a set of infrared small targets ( C k { 1 , , N C } , where N C is the total number of components) was extracted from each component by analyzing the connected components in each candidate image. To further remove false-alarm candidates with significant differences from the small targets (e.g., large cirrus clouds and long edges), the aspect ratio of the area of the object and the minimum bounding rectangle were calculated, thus reducing the false positive rate, complexity, and time consumption for the next step. In our experiments, if the area of the object and the aspect ratio of the minimum bounding rectangle were less than 400 px and 4, respectively, the object was included in the final selection of candidate set M k { 1 , , N s } . The parameters were adjusted to provide the maximum detection rate.

2.4. Multi-Feature Modeling

In this step, we constructed a multi-feature model for each candidate, in which we extracted three types of features, namely intensity-based features, geometry-based features, and LCI-based features [22]. Table 1 describes the features we used in the proposed method.

2.4.1. Intensity-Based Features

Intensity features are integral to feature extraction in many image classification methods [23,24,25]. We used a candidate region extraction algorithm based on edge extraction, so some candidate regions were edges of complex backgrounds with intensity features that were often quite different from those of bright true targets. The features we used included mean ( I m e a n ), standard deviation ( I s t d ), entropy ( I e n t ), energy ( I e n e ), skewness ( I s k e ), and contrast ( I c o n ), which were extracted from the target in the center of the candidate areas.

2.4.2. Geometry-Based Features

Geometric features are also significant features that can be used to characterize the overall shape of a target [26]. Real targets tend to have smoother edges and more rounded geometry than false targets [20,27]. We can extract geometric properties to describe the shape of the candidate, mainly including the following:
  • Rectangularity ( S r e c ): the ratio of the target area to the area of the enclosing matrix.
  • Roundness ( S c i r ): the ratio of the target area to the square of the outer contour perimeter.
  • Solidity ( S s o l ): the ratio of the target area to the convex area.
  • Eccentricity ( S e c c ): the ratio of the distance between the focal point and the long axis length of the ellipse with a same second moment as the region.

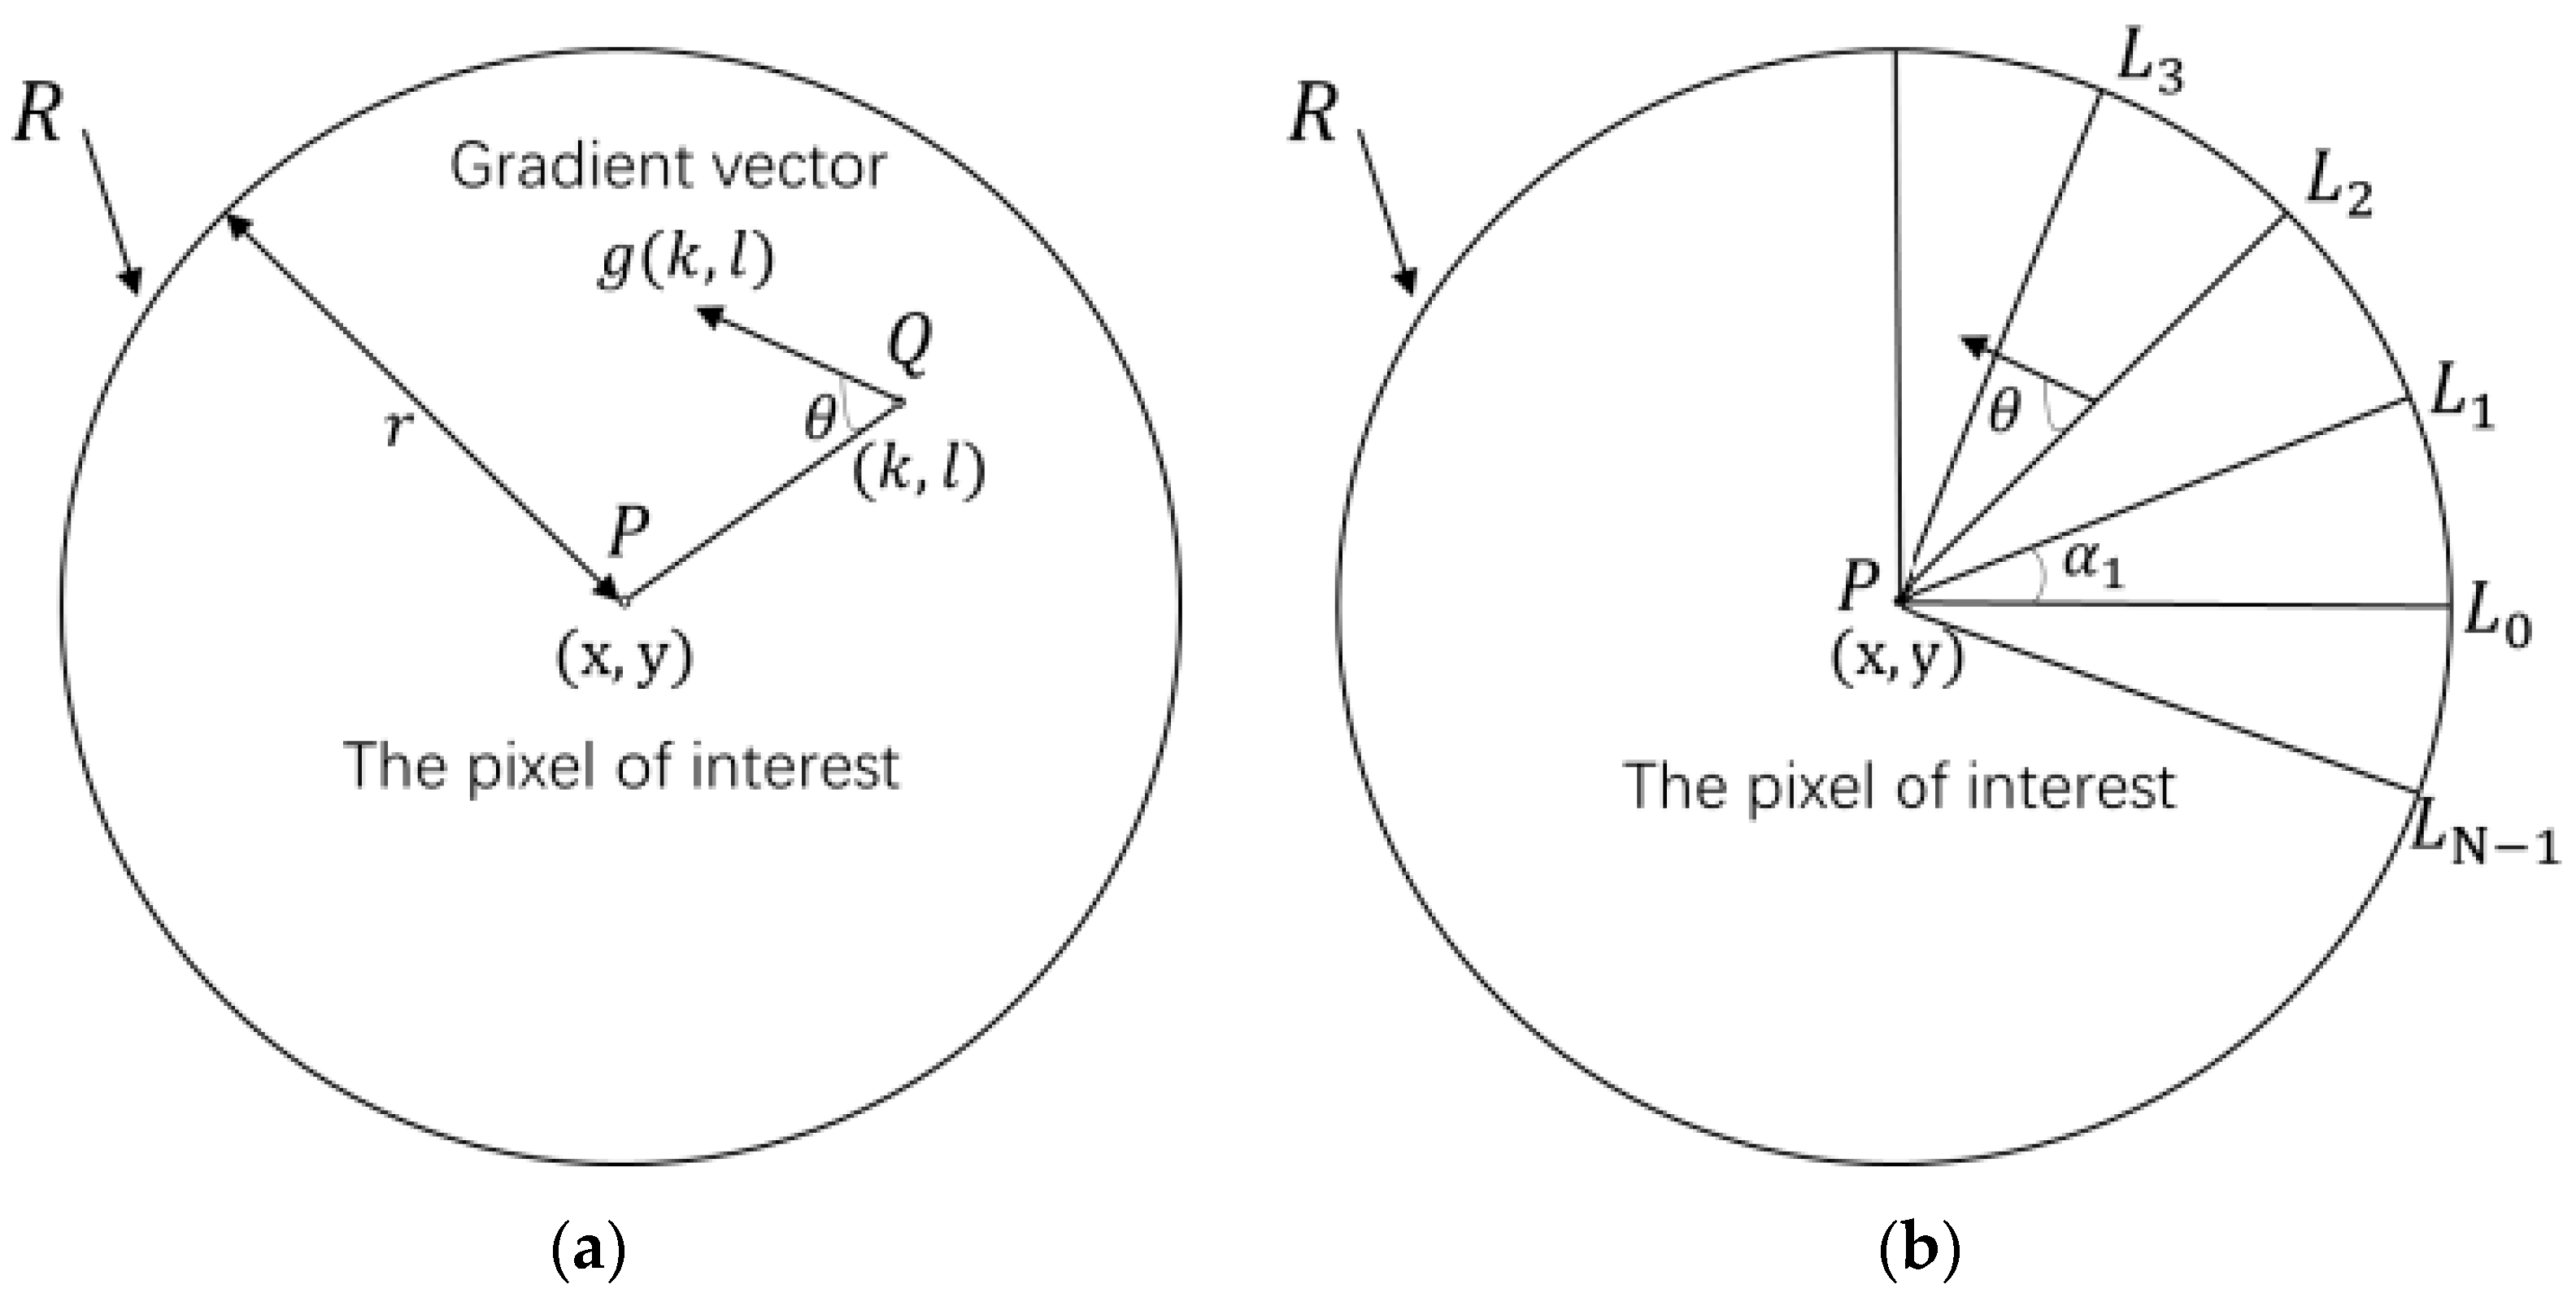
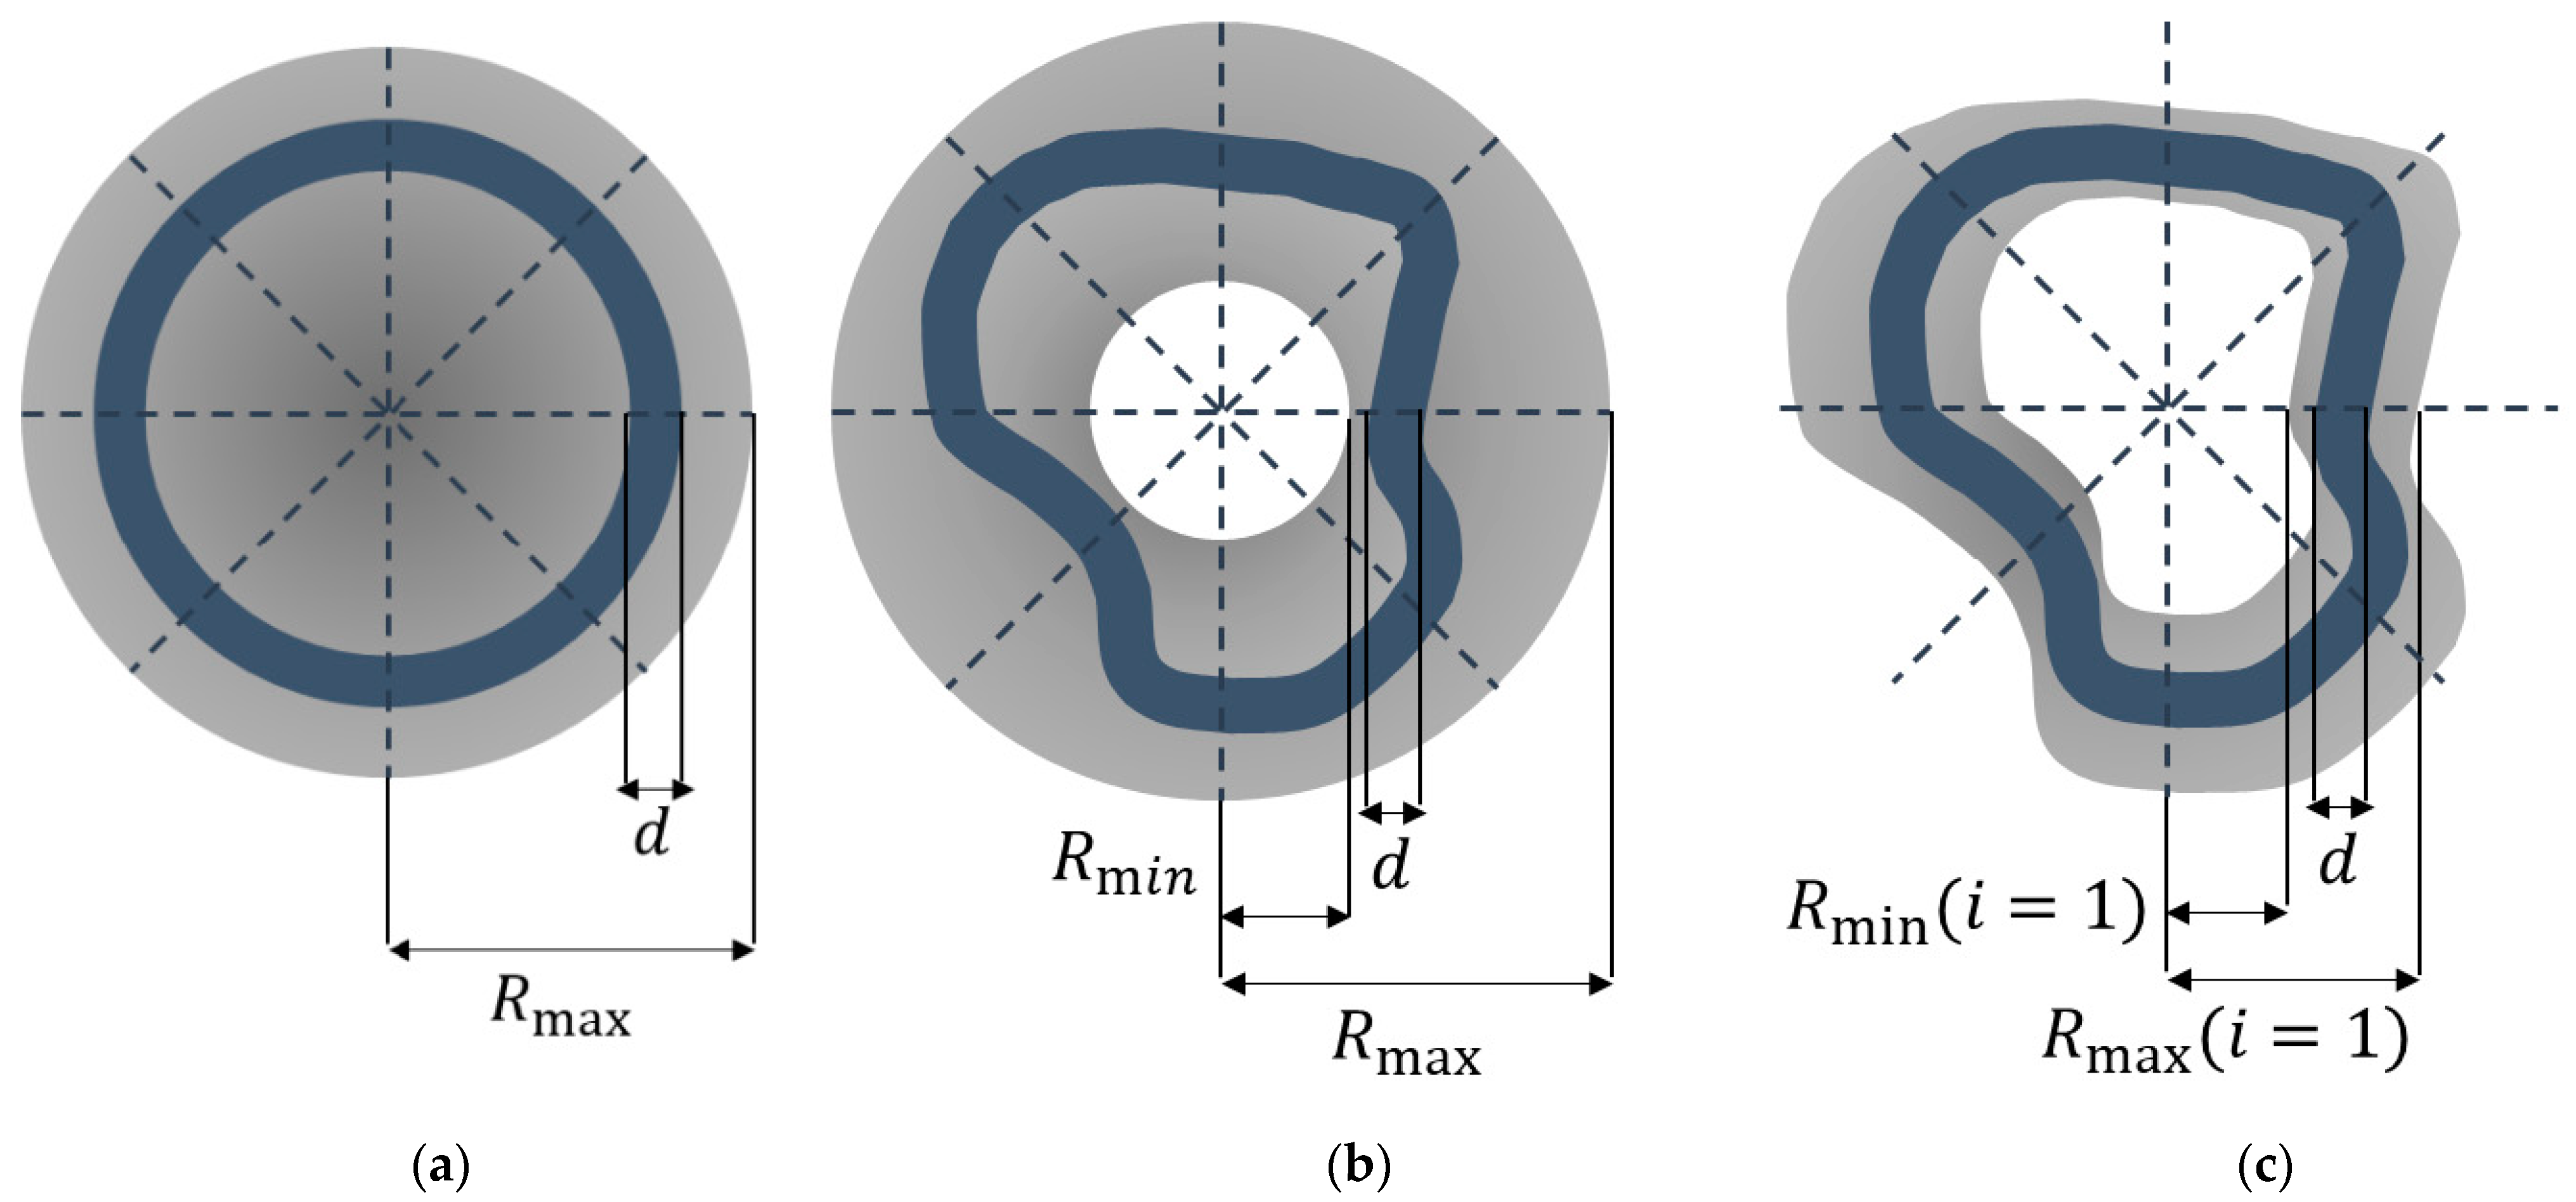
2.4.3. LCI-Based Features

Local convergence index (LCI) filter features are obtained mainly by gradient convergence without intensity information, and thus can characterize small, low-contrast, infrared targets hidden in a cluttered background [14]. The LCI filter measures the convergence degree of the surrounding pixels to the central pixel of interest by means of the gradient map of a local region (support region)., as shown in Figure 4. Given a two-dimensional input image, P ( x , y ) is a pixel of interest, Q ( k , l ) is a pixel in the support region, and the support region is a circular area of radius r . The angle θ ( k , l ) is the orientation of the gradient vector g ( k , l ) for line P Q ¯ . cos θ ( k , l ) calculates the convergence index of the gradient vector at ( k , l ) . The final convergence index (CI) is defined as the average of the convergence index at all pixels as follows:
C I ( x , y ) = 1 M ( k , l ) S cos θ ( k , l ) ,
where M is the number of points in the support region S , and θ ( k , l ) is the gradient vector of points ( k , l ) . The output of CI is between −1 and +1. If all gradient vectors point to the pixel of interest, CI will get a maximum of +1, which can be used to describe a small target in the shape of a bottom cap. For a small infrared target with a gray level higher than the background, its value tends to −1.
In practical calculations, CI of all pixels in S is usually not calculated. As shown in Figure 4b, the points are obtained by sampling in N directions with the pixel of interest as the starting point. The angle θ in the support region line L i is calculated as follows:
θ ( x , y , α i , m ) = α i ϕ ( x , y , α i , m ) ϕ ( x , y , α i , m ) = tan 1 ( x I ( x + m sin ( α i ) , y + m cos ( α i ) ) x I ( x + m sin ( α i ) , y + m cos ( α i ) ) ) ,
where ϕ ( x , y , α i , m ) is the angle related to the gradient vector, and its coordinates lie in the α i direction of the pixel of interest with the radial coordinate m .
Different CI filters are formed according to different support regions and search methods, among which the adaptive ring filter (ARF) [28] and the sliding band filter (SBF) [29] are the most typical CI filters.
The support region of an ARF is a ring band, and the radius can be adaptively changed, as shown in Figure 5a. The response of an ARF is given by:
F ARF ( x , y ) = max 0 r R max 1 N × d i = 1 N m = r r + d cos ( θ ( α i , m ) ) ,
where N denotes the number of support region lines as described above, R max is the radius of the support region, and d is the width of the band. The value m on different support lines is the same, so the support region is a circle (T) or a ring, which facilitates the extraction of convergent features for small circular targets.
We take the center coordinate of each candidate as the point of interest for the ARF. In addition to the filtering results, the radius that causes the maximum response is calculated and used as an LCI feature:
R ARF ( x , y ) = max 0 r R max 1 N × d i = 1 N m = r r + d cos ( θ ( α i , m ) ) ,
where R ARF is the radius that causes the maximum response, corresponding to the highest convergence of the point of interest ( x , y ) .
Since the shape of a small target is not necessarily circular, the SBF allows a more flexible characterization of target convergence properties. As shown in Figure 5b, the SBF’s support region is a band of fixed width with different radii in each direction, and the response is obtained by:
F SBF ( x , y ) = 1 N i = 1 N [ max R min r R max m = r r + d cos ( θ ( α i , m ) ) ] ,
where R min and R max are the inner and outer sliding band limits, respectively.
Similarly, we use SBF response at the center of the candidate region as one of the local convergence index features. Considering that the SBF has different radii on different support lines, the average radius can be used as the second feature:
R SBF ( x , y , i ) = arg max R min r R max m = r r + d cos ( θ ( α i , m ) ) ,
R SBF ¯ ( x , y ) = 1 N i = 1 N R S B F ( x , y , i ) ,
where different support lines have different R SBF ( x , y , i ) , and R SBF ¯ ( x , y ) is the average radius.
Although the above two methods have a certain ability to describe small infrared targets, they still have drawbacks: the search area is a fixed circular region, while the actual data of small infrared targets may have different scales and shapes, making it difficult to find a definite support region for CI index calculation. Setting a larger region will be time-consuming and introduce more errors. The search region should ideally be more adaptive according to the shape of the target. Therefore, we propose a new CI filter called the Deformable Region Filter (DRF). The DRF has an adaptive support region, which is related to the target shape, as shown in Figure 5c.
The gradient method is used to obtain the candidate regions of small infrared targets. Thus, the white pixel region in the binary candidate image I C A N , with sufficient gradient information, can be used as the search region. The search region can be described as follows:
S R = { ( x , y ) | I C E ( x , y ) = 1 } ,
where I C E is the result of dilating I C A N using 3 × 3 structural elements to obtain a larger search field. The average of all coordinates in S R is calculated as the coordinate of the pixel of interest. Subsequently, this coordinate is used as the origin of the coordinate system.
Then the points on the support region line I i can be obtained by:
L i = { ( x , y ) | x = [ m cos α i ] , y = [ m sin α i ] , m 1 } ,
where α i = 2 π ( i 1 ) / N , i { 1 , , N } , [ x ] is for rounding x . Theoretically, a larger N means a smaller angle, which allows for a more accurate description of the convergence of a target in multiple directions. Since small targets in this study occupied fewer than 200 pixels, the value of N was set to 36.
The set of coordinates of the support region in a certain direction can be expressed as:
S R L i = S R L i .
Considering the special case where S R L i is an empty set, we complement it using the adjacent support line S R L i 1 , which can be obtained as follows:
S R L i = { ( x , y ) | x = [ m cos α i ] , y = [ m sin α i ] , R min ( i 1 ) m R max ( i 1 ) } ,
where R min ( i 1 ) and R max ( i 1 ) correspond to the maximum and minimum distances from the point on the line E to the pixel of interest, respectively.
The final response of the DRF is obtained by:
F DRF ( x , y ) = 1 N i = 1 N [ max R min ( i ) r R max ( i ) m = r r + d cos ( θ ( α i , m ) ) ]
and the average radius can be obtained by:
R DRF ( x , y , i ) = max R min ( i ) r R max ( i ) m = r r + d cos ( θ ( α i , m ) )
R DRF ¯ ( x , y ) = 1 N i = 1 N R DRF ( x , y , i ) .
We conducted ARF, SBF and DRF filtering, respectively, on normalized images, and used the obtained filtering response and estimated radius as LCI features for subsequent classification. To maximize the LCI response of the infrared small target, we reversed the obtained gradient.
The complete feature set F consisted of 16 features, including 6 intensity-based features, 4 geometry-based descriptors, and 6 LCI-based features, as detailed in Table 2. All features were extracted from each candidate in set M and normalized before input to the classifier.

2.5. Classifier and Detector

In many infrared small target detection algorithms, there is a problem of detecting more false targets than real targets, which forms uneven categories. Therefore, we used RUSBoost [30] in the classification step to distinguish between real targets and false-alarm candidates.
RUSBoost uses an adaptive boosting classifier (AdaBoost) [31] to train the sample set and random undersampling (RUS) [15] technology to solve the problem of class imbalance.
The main idea of the Adaboost algorithm is to train multiple weak classifiers through different sample sets and conduct joint evaluation on the final samples; that is, combine multiple weak classifiers into a strong classifier. During the training process of each weak classifier, the weight of the samples changes adaptively. The weight of the wrongly predicted samples increases in the next round of training, while the weight of the correctly predicted samples decreases [31].
Before training, the category distribution of the dataset can be changed by using RUS technology [15]. The class imbalance problem can be solved by randomly deleting instances from most classes to get a specific sample distribution. In particular, in each iteration of the AdaBoost algorithm, RUSBoost randomly undersamples a subset of the majority class, causing the weak learner to be trained using a balanced dataset. Each weak learner generates a prediction of the new input data weighted by the learner’s stage values. The sum of all weighted predictions is assigned as the final classification result.
In the context of infrared small target classification, RUSBoost was a suitable classifier, as we were dealing with skewed datasets with a few true target candidates and mostly false-alarm candidates.
The details of the RUSBoost classifier are given in Algorithm 1 [22]. This study used decision trees as weak learners in the RUSBoost algorithm. During training, the number of trees was set to 90, and the learning rate was 0.03. Validation experiments were performed using five-fold cross-validation on dataset NUAA-SIRST [32] and dataset NUDT-SIRST [33].
Algorithm 1. RUSBoost Classifier [22]
Input: Set D of training samples ( F 1 , L 1 ) , , ( F m , L m ) where m is the number of training samples, F i F and l i L = { 1 , 1 }
Output: RUSBoost classifier H ( x )
1: W 1 ( i ) = 1 m for all i
2:for t = 1: T do
3:   D random undersampling (RUS) training set D
4:   W ˜ i extract weights for the subset D ˜
5:  Call Weaklearn with subset D ˜ and weights W ˜ t to get weak classifier h t :
6:     h t = arg min 1 | W ˜ t | W ˜ ( i ) [ l i h j ( F i ) ] , h j H
7:  Pseudo-loss calculation for D and W t :
8:     ε t = 1 m W t ( i ) [ l i h j ( F i ) ]
9:  Weight update parameter:
10:     α t = 1 2 ln 1 e t e t
11:  Update weights and normalization:
12:     W t + 1 ( i ) = W t ( i ) exp ( α t l i h t ( F i ) ) / i = 1 m W t + 1 ( i )
13:end for
14:Output and final classifier:
15:   H ( x ) = t = 1 T α t h t ( x ) / j = 1 T α t

3. Experiment Set

In this section, the evaluation metrics are introduced first. Then the candidate extraction, feature extraction, candidate classification, and final algorithm are evaluated and compared.

3.1. Evaluation Metrics

In the candidate extraction step, recall ( R e ) and false positives per image (FPI) were used to assess its performance and were calculated as follows:
R e = T c o r r e c t T A L L , F P I = N N 1 ,
where T A L L is the number of extracted candidates and T c o r r e c t is the number of candidates with true target. N 1 is the number of true images in a dataset and N is the number of candidates with false target.
Then, we used receiver operating characteristics (ROC) [34] and the area under ROC curve (AUC) to evaluate the performance of classification and the significance of each feature.
The final result evaluation metrics for infrared small target detection algorithms mainly included pixel-level and target-level evaluations. Semantic segmentation network-based approaches mainly use pixel-level evaluations, such as intersection over union (IoU), accuracy, and recall values. These metrics are primarily concerned with evaluating the target’s shape and do not apply to small targets that lack shape information and texture. Traditional algorithms mainly use target-level measures such as detection rate and false alarm rate, which are more important criteria for single-frame detection. If the center of a candidate region was more than three pixels away from the nearest target, we considered it an incorrectly predicted one.
Intersection over union (IoU): IoU is a pixel-level evaluation metric. It focuses on the shape of the measured object and is calculated by the area of the intersection divided by the area of the union of predicted and labeled areas.
I o U = A I A U ,
where A I and A U are the interaction areas and all areas.
Recall ( R e ): R e is a target-level evaluation metric calculated as Equation (19). False alarm rate ( F a ): F a is another target-level evaluation metric. It quantifies the ratio of incorrectly predicted pixels to the total number of pixels.
F a = P f a l s e P A L L ,
where P f a l s e and P A L L are the number of incorrectly predicted pixels and total pixels, respectively.

3.2. Datasets

We used the NUAA-SIRST dataset and the NUDT-SIRST dataset to evaluate our proposed algorithm, and their information is shown in Table 2.

4. Results

4.1. Candidate Extraction Evaluation

Candidate extraction is a crucial step in the algorithm, which requires high recall and low FPI. Higher recall at this stage ensures higher recall for the final algorithm, and lower FPI reduces the time consumption and false alarm rate F a of the final algorithm. Table 3 shows the recall and FPI of the proposed infrared small target candidate extraction technique.
The proposed method achieved a sensitivity of 0.9834 on the NUAA-SIRST dataset, with a corresponding FPI of 2.86. On the NUDT-SIRST dataset, the sensitivity and FPI values were 0.9665 and 1.86, respectively. These results demonstrate that our candidate extraction algorithm had high sensitivity and generated a low average number of negative samples per image. Figure 6 displays the original images and their corresponding gradient magnitude images.
The gradient magnitude was obtained as a core step of candidate extraction and was calculated using Equation (2). As shown in the figure, the proposed method exhibited a strong response to dim targets with bright and complex backgrounds, facilitating the easy extraction of targets later.

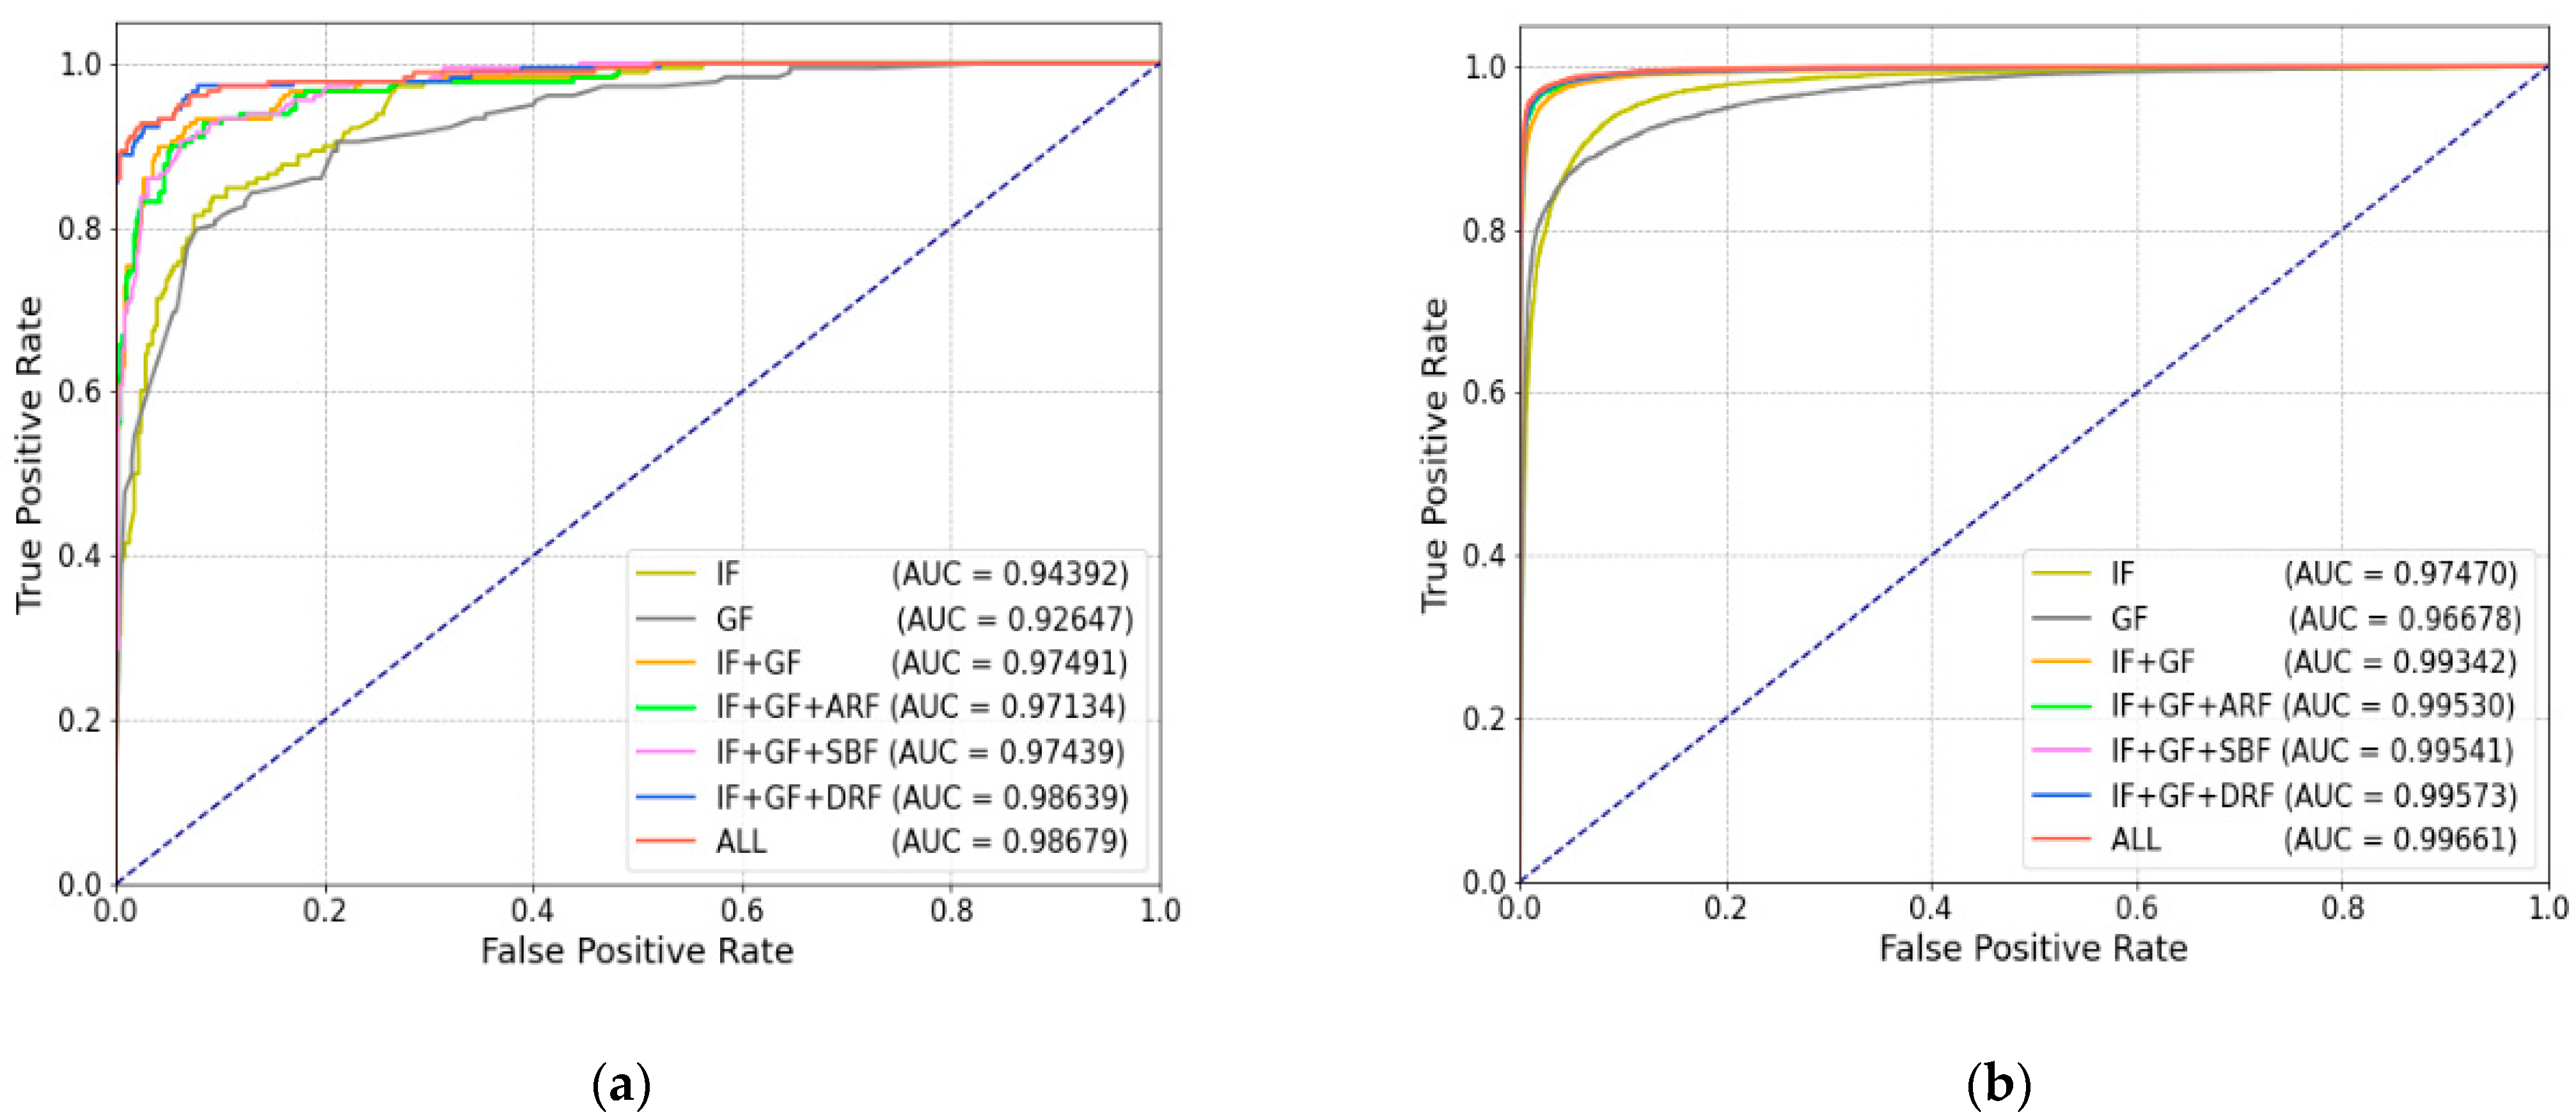
4.2. Candidate Classification Evaluation

In the process of multi-feature modeling, we extracted intensity features (IF) to describe the grayscale statistics of the target; geometric features (GF) to describe the shape of the target; and LCI features (LCI) to describe the gradient convergence of the target, which included the ARF feature (ARF), SBF feature (SBF), and the DRF feature (DRF) proposed by us. The ROC curve and AUC value were used to measure the classification performance of different features, and the results are shown in Table 4 and Figure 7. On the real dataset NUAA-SIRST, the AUC value was 0.97491 when using only intensity and geometric features for classification, which increased to 0.98679 after adding LCI features. Weak targets were easy to miss when using only intensity characteristics and geometric shapes of targets; however, adding LCI features that measure gradient but are not affected by intensity enabled correct identification of such targets. Therefore, the performance of the model was improved with the introduction of LCI features. At the same time, the addition of our proposed DRF feature also improved the model performance, with an AUC value of 0.98639.
Figure 7b shows the results on the synthetic dataset NUDT-SIRST. Excellent results were obtained using only the geometry and intensity information of the target, with an AUC value of 0.99342. This was possible because the same object was used for many different backgrounds in synthetic images. The LCI features did not significantly improve the model, and its AUC value was 0.99661.
In terms of time consumption, the extraction time for intensity features, geometric features, and LCI features in each candidate region was 0.001 s, 0.001 s, and 0.01 s, respectively.

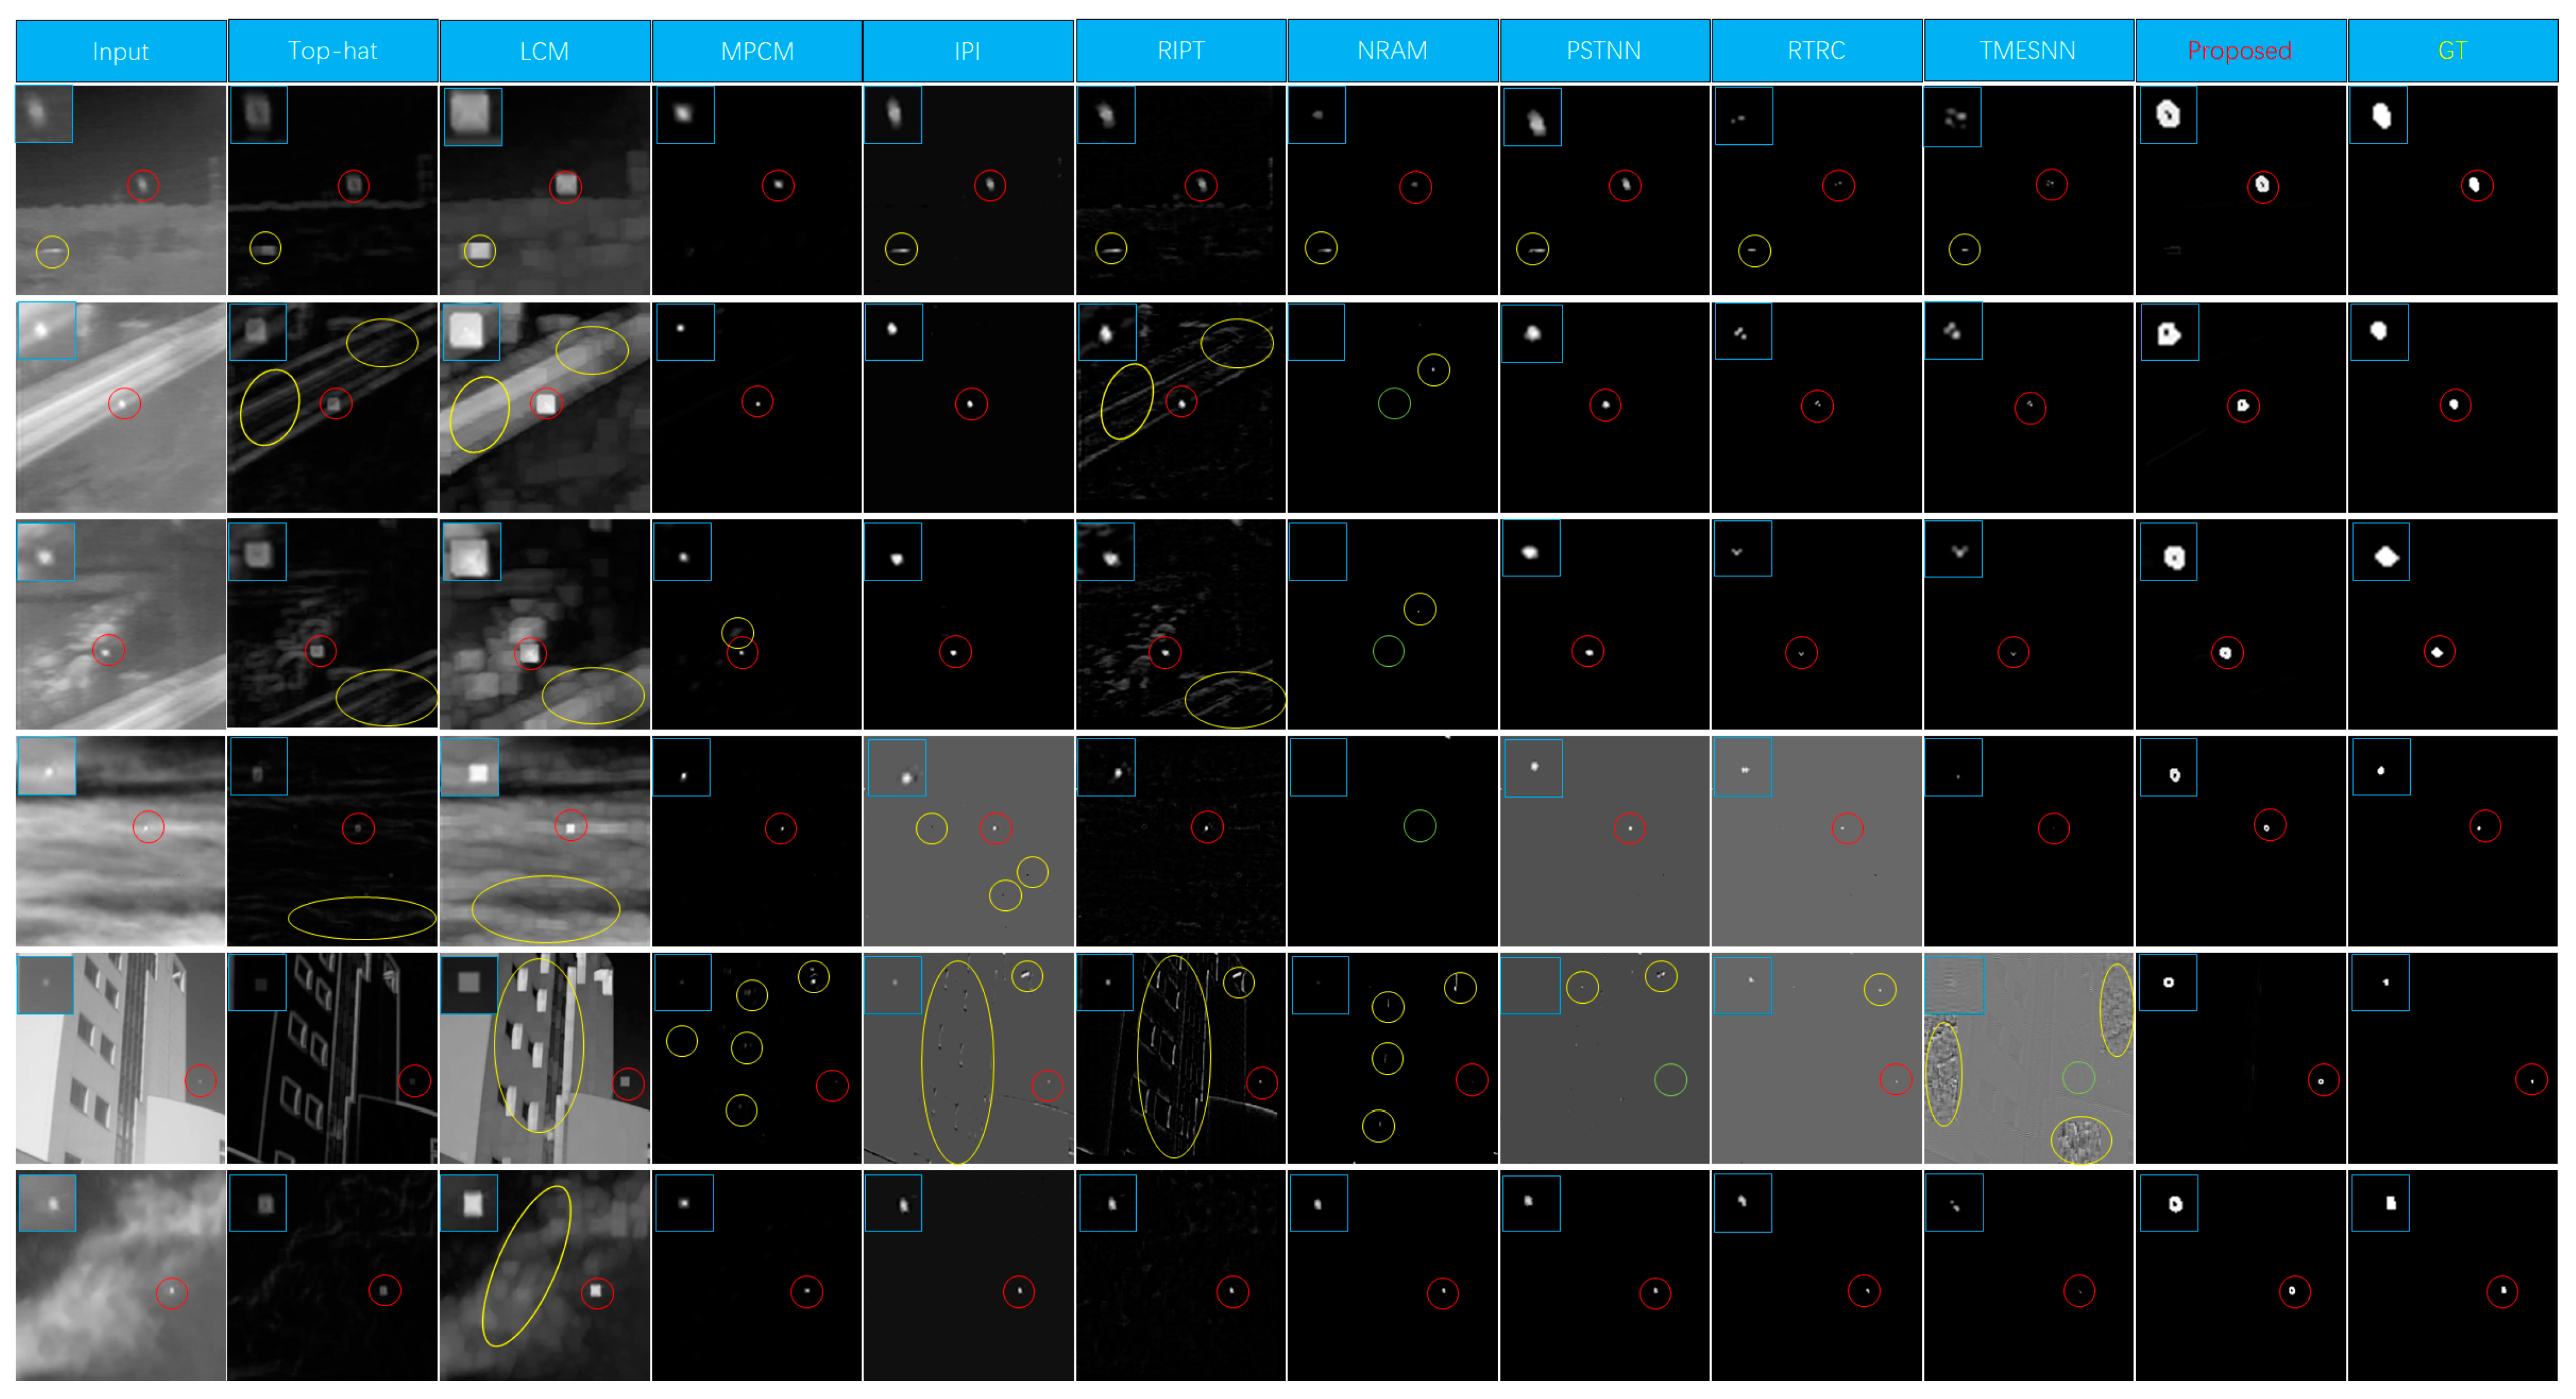
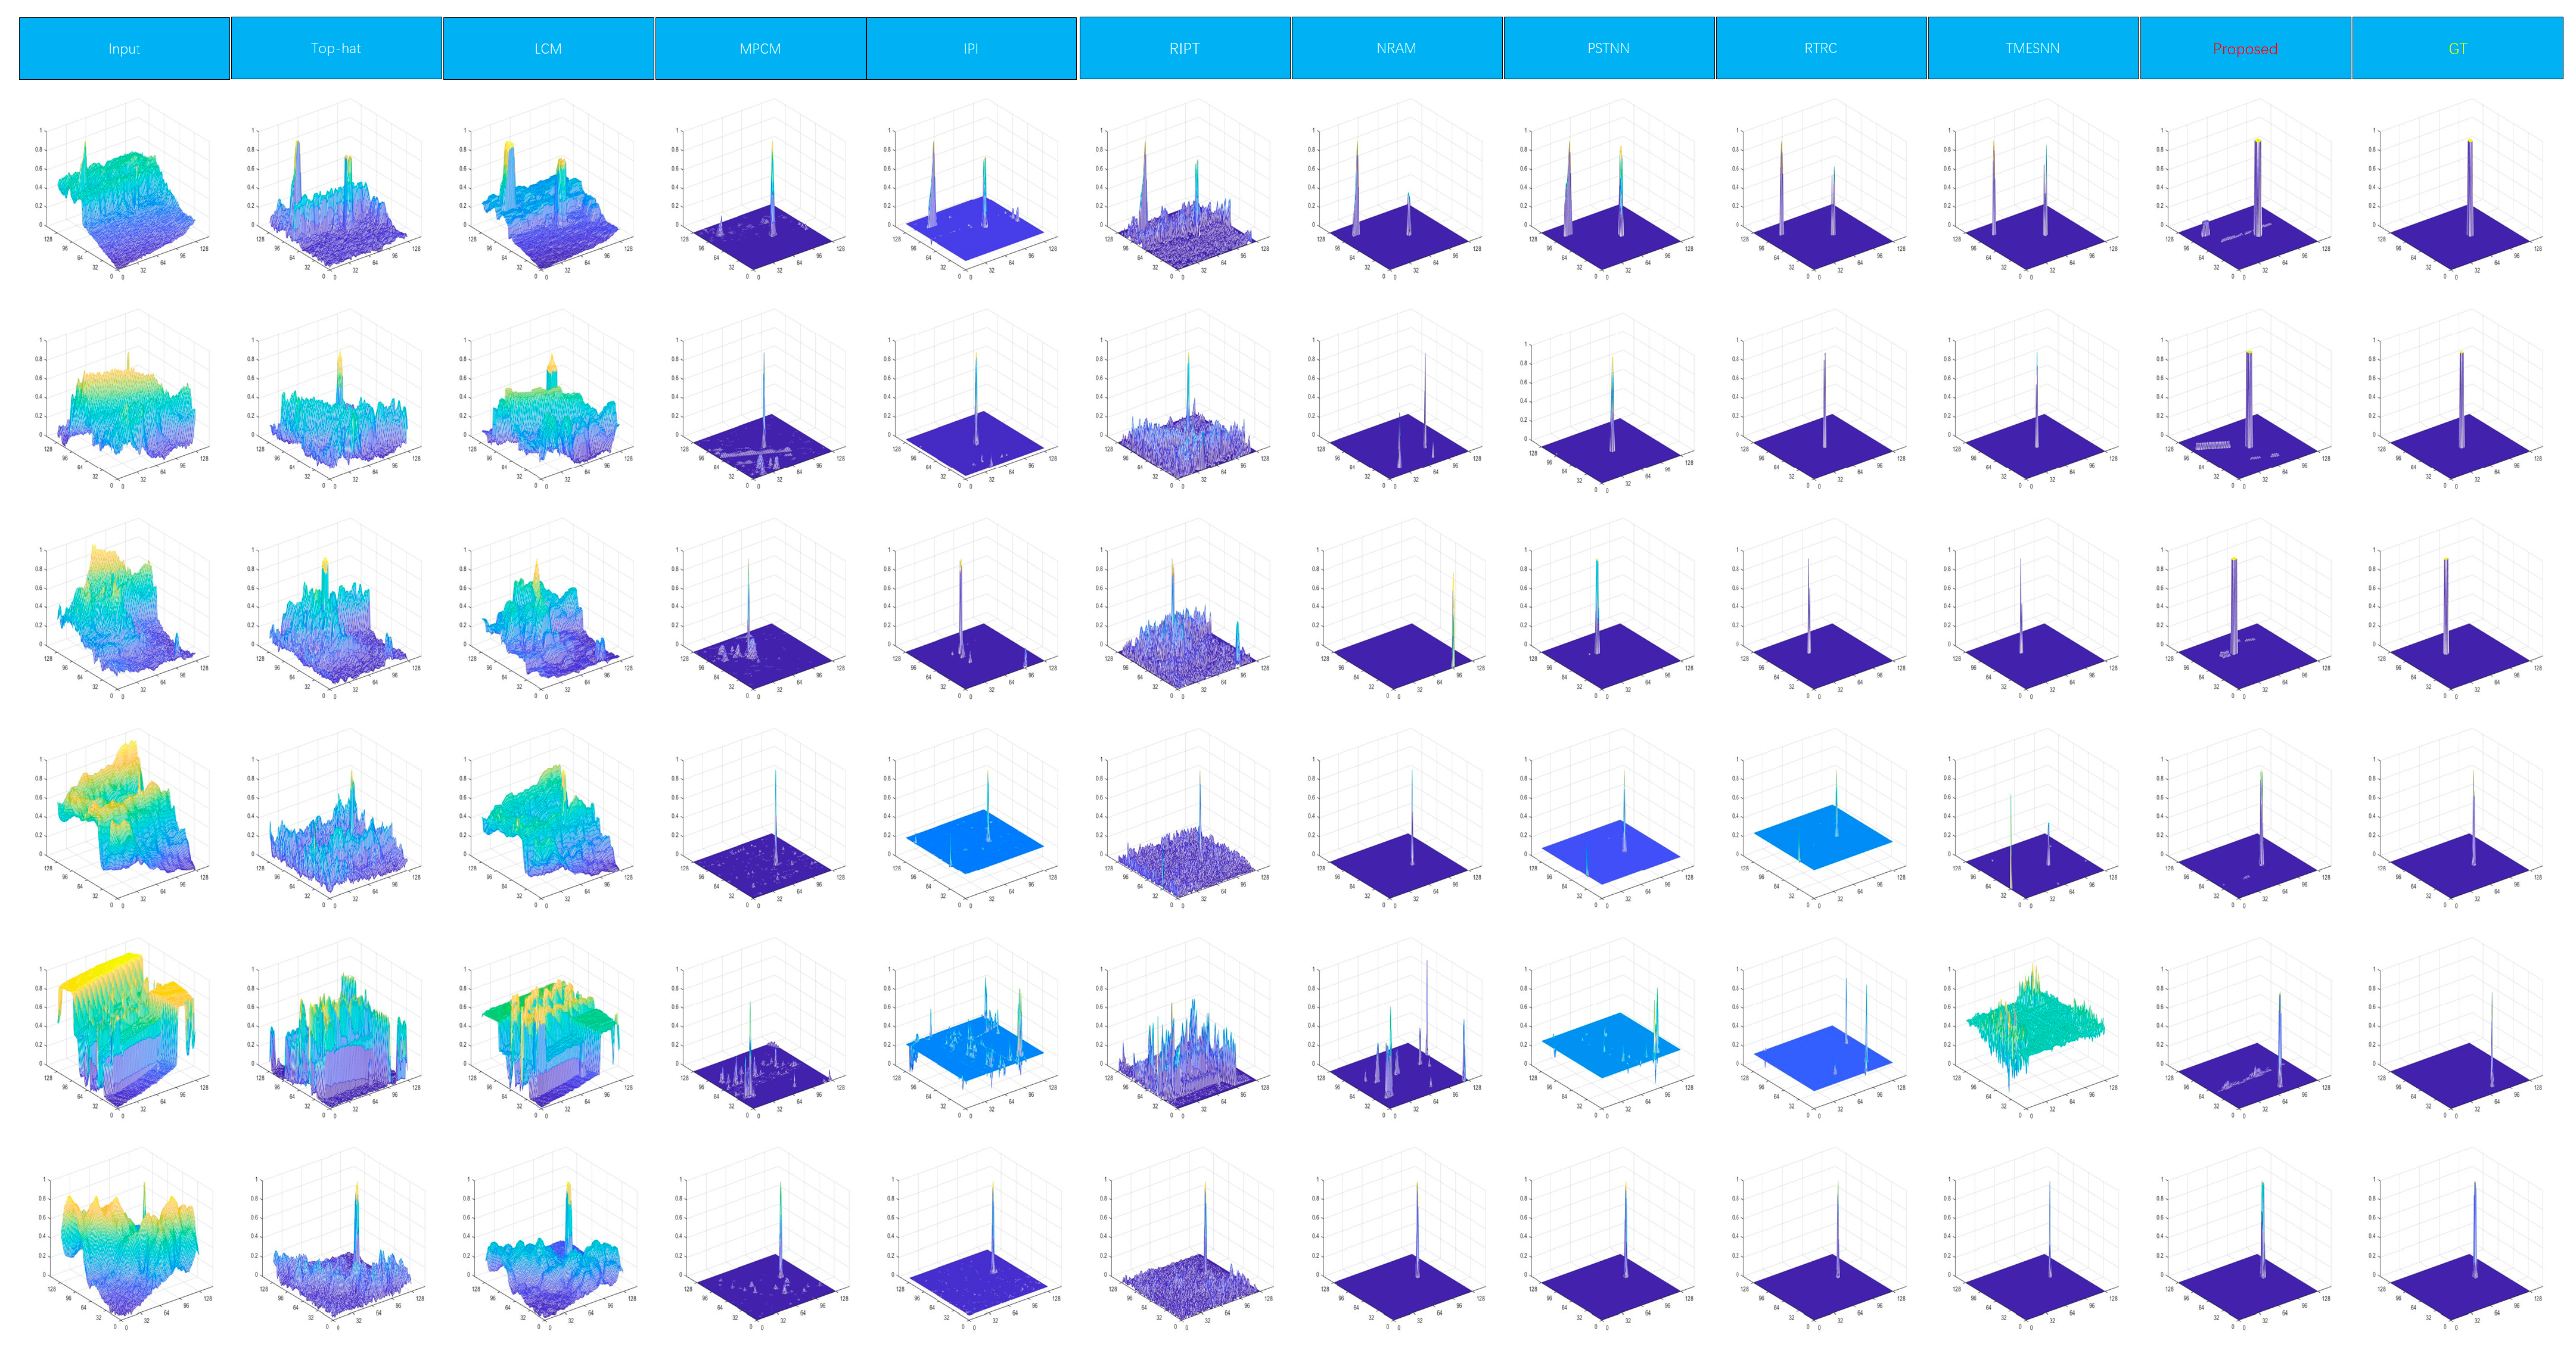
4.3. Detection Results

Table 5 shows IoU, R e , and F a values achieved on NUDT-SIRST and NUAA-SIRST datasets by our method compared with different SOTA methods: Filter-based methods include top-hat [35] and max–median [36]; local contrast-based methods include WSLCM [37] and TLLCM [38]; local rank-based methods include IPI [10], NRAM [39], RIPT [40], PSTNN [13], and MSLSTIPT [41]; CNN-based methods include MDvsFA-cGAN [33], ACM [32], and ALCNet [7]. Since our candidate extraction algorithm adopted the edge extraction method, we successively performed the morphological closing operation and corrosion operation on the candidate mask to eliminate holes and excessive edges when calculating IoU. Regarding IoU value at the pixel level, our algorithm was not better than CNN networks on pixel segmentation but it was better than traditional algorithms, such as filter-based, local contrast-based, and local rank-based methods. CNN-based algorithms, such as MDvsFA-cGAN, ACM, and ALCNet, achieve higher R e than other traditional algorithms due to their data-driven approach, which aims to minimize loss or maximize accuracy. On target-level evaluation metrics, the values of R e in datasets NUDT-SIRST and NUAA-SIRST were 0.9064 and 0.9060, respectively, which were lower than those of ACM and ALCNet, but higher than those of most traditional algorithms. Although the detection rate of our algorithm was lower than that of the CNN-based algorithms, our framework can be applied to images with different resolutions and requires fewer images to train the model. Additionally, our algorithm appeared to be more effective in eliminating false alarms, with the values of F a in the two datasets being 9.833 × 10 6 and 9.06 × 10 6 , respectively, which were much lower than in other traditional algorithms, and the average F a of the two datasets was lower than that of ALCNet. In the candidate extraction step, we extracted all targets that met the gradient threshold through gradient weight technology, which contained a large number of true targets, which explains why the detection rate of our algorithm was higher than most traditional algorithms. However, less consideration was given to the problem of false alarm removal. Therefore, in the next step, we further applied multi-feature modeling and classification to remove false alarms.
For better visualization, Figure 8 and Figure 9 show qualitative evaluations on two datasets of different methods, including top-hat [35], LCM [8], MPCM [9], IPI [10], RIPT [40], NRAM [39], PSTNN [13], RTRC [42], TMESNN [43] and our proposed method. Classic infrared target detection algorithms, such as top-hat and LCM, cannot avoid the occurrence of false alarms in various scenarios. Models based on low-rank decomposition, such as IPI, RIPT, and NRAM, perform well in simple scenarios but slightly worse in complex ones. For example, the image containing a complex background in line 5 shows a large number of false alarms, and PSTNN and TMESNN even missed the weak target. Our approach generated accurate target localization and segmentation with a very low false alarm rate compared with traditional methods.
The proposed algorithm was also evaluated for time consumption. It consisted of three processes: candidate extraction, multi-feature modeling, and feature classification. Table 6 shows the running time of each step of the process on NUAA-SIRST. In the candidate extraction step, multiple convolution operations were first used to find the target candidate region, which consumed 0.02 s. Then, image blocks were extracted for subsequent feature extraction, which took approximately 0.002 s to extract an image block. Therefore, the running time of this step was mainly determined by the number of extracted candidates. Considering that the number of candidates ranged from 0 to 20, the running time of this step was roughly between 0.02 s and 0.06 s. Meanwhile, feature extraction expended 0.012 s of time for each candidate, so the running time of the multi-feature modeling step ranged from 0 s to 0.24 s. The average discriminant time of the final classifier was 0.04 s. In other words, the algorithm took longer to run for complex backgrounds, such as buildings, because more candidates could be extracted and classified. For relatively simple backgrounds, such as the sky, the time consumption was as low as 0.07 s, which shows the practical application potential of this algorithm. We also made a comparison with other algorithms in terms of time consumption, and the results are shown in Table 7. Although our algorithm was not the fastest, compared with PSTNN and NRAM with similar speed, it had greater advantages in detection rate and false alarm elimination.

5. Conclusions

In this paper, a novel approach for infrared small target detection was proposed by combining gradient weighting with LCI features, and small infrared targets were accurately identified using RUSBoost. The problem that detection algorithms are prone to false and missing detections under complex scenes was explicitly addressed by this method. LCI-based descriptors were shown to characterize low-contrast objects well, since the LCI filters were gradient convergence-based. Extensive experiments on NUDT-SIRST and NUAA-SIRST datasets demonstrated that the performance of the proposed method was competitive with SOTA but with lower time consumption. The proposed method has limitations in its single-frame nature since it is specifically designed for single-frame infrared target detection applications. In applications that allow for multiple frames, multi-frame-based algorithms can obtain more temporal information from the image sequences, which can enable better suppression of noise similar to targets in the images. Our future works will focus on improving the detection of infrared small targets in high-frequency regions, including skyline and horizontal plane lines. To achieve this goal, we plan to explore an integrated learning framework that combines deep features with physical characteristics. We believe that this approach could effectively enhance the detection performance of infrared dim small targets and provide more reliable solutions for real-world applications.

Author Contributions

All authors have contributed substantially to, and are in agreement with the content of, the manuscript. Conception/design, provision of study materials, and the collection and assembly of data: S.C., J.D. and J.L.; data analysis and interpretation: Z.L. and J.H.; manuscript preparation: S.C., J.D., J.L. and Z.P.; final approval of the manuscript: S.C., J.D., J.L., Z.L., J.H. and Z.P. The guarantor of the paper takes responsibility for the integrity of the work as a whole, from its inception to publication. All authors have read and agreed to the published version of the manuscript.

Funding

This work was supported by Natural Science Foundation of Sichuan Province of China (Grant No.2022NSFSC0574) and partially supported by National Natural Science Foundation of China (Grant No.61775030, Grant No.61571096).

Data Availability Statement

Not applicable.

Conflicts of Interest

The authors declare no conflict of interest.

References

  1. Kong, X.; Yang, C.; Cao, S.; Li, C.; Peng, Z. Infrared Small Target Detection via Non-Convex Tensor Fibered Rank Approximation. IEEE Trans. Geosci. Remote Sens. 2022, 60, 50003219. [Google Scholar] [CrossRef]
  2. Zhu, Q.; Zhu, S.; Liu, G.; Peng, Z. Infrared Small Target Detection Using Local Feature-based Density Peaks Searching. IEEE Geosci. Remote Sens. Lett. 2022, 19, 6507805. [Google Scholar] [CrossRef]
  3. Wang, G.; Tao, B.; Kong, X.; Peng, Z. Infrared Small Target Detection Using Non-Overlapping Patch Spatial-Temporal Tensor Factorization with Capped Nuclear Norm Regularization. IEEE Trans. Geosci. Remote Sens. 2022, 60, 5001417. [Google Scholar]
  4. Li, B.; Xiao, C.; Wang, L.; Wang, Y.; Lin, Z.; Li, M.; An, W.; Guo, Y. Dense Nested Attention Network for Infrared Small Target Detection. IEEE Trans. Image Process. 2022; accepted. [Google Scholar] [CrossRef]
  5. Hou, Q.; Wang, Z.; Tan, F. RISTDnet: Robust Infrared Small Target Detection Network. IEEE Geosci. Remote Sens. Lett. 2021, 99, 1–5. [Google Scholar] [CrossRef]
  6. Zhang, T.; Li, L.; Cao, S.; Pu, T.; Peng, Z. Attention-Guided Pyramid Context Networks for Detecting Infrared Small Target Under Complex Background. IEEE Trans. Aerosp. Electron. Syst. 2023, 1–13. [Google Scholar] [CrossRef]
  7. Dai, Y.; Wu, Y.; Zhou, F. Attentional Local Contrast Networks for Infrared Small Target Detection. IEEE Trans. Geosci. Remote Sens. 2021, 59, 9813–9824. [Google Scholar] [CrossRef]
  8. Chen, C.; Li, H.; Wei, Y. A Local Contrast Method for Small Infrared Target Detection. IEEE Trans. Geosci. Remote Sens. 2014, 52, 574–581. [Google Scholar] [CrossRef]
  9. Wei, Y.; You, X.; Li, H. Multiscale patch-based contrast measure for small infrared target detection. Pattern Recognit 2016, 58, 216–226. [Google Scholar] [CrossRef]
  10. Gao, C.; Meng, D.; Yang, Y. Infrared patch-image model for small target detection in a single image. IEEE Trans. Image Process. 2013, 22, 4996–5009. [Google Scholar] [CrossRef]
  11. Dai, Y.; Wu, Y.; Song, Y. Infrared small target and background separation via column-wise weighted robust principal component analysis. Infrared Phys. Technol. 2016, 77, 421–430. [Google Scholar] [CrossRef]
  12. Dai, Y.; Wu, Y.; Song, Y. Non-negative infrared patch-image model: Robust target-background separation via partial sum minimization of singular values. Infrared Phys. Technol. 2017, 81, 182–194. [Google Scholar] [CrossRef]
  13. Zhang, L.; Peng, Z. Infrared Small Target Detection Based on Partial Sum of the Tensor Nuclear Norm. Remote Sens. 2019, 11, 382. [Google Scholar] [CrossRef] [Green Version]
  14. Kobatake, H.; Hashimoto, S. Convergence index filter for vector fields. IEEE Trans. Image Process. 1999, 8, 1029–1038. [Google Scholar] [CrossRef]
  15. Van Hulse, J.; Khoshgoftaar, T.M.; Napolitano, A. Experimental perspectives on learning from imbalanced data. In Proceedings of the 24th International Conference on Machine Learning, New York, NY, USA, 20–24 June 2007; pp. 935–942. [Google Scholar]
  16. Deng, J.; Tang, P.; Zhao, X.; Pu, T.; Qu, C.; Peng, Z. Local Structure Awareness-Based Retinal Microaneurysm Detection with Multi-Feature Combination. Biomedicines 2022, 10, 124. [Google Scholar] [CrossRef]
  17. Zhao, X.; Wang, H.; Peng, Z. Fine segmentation of fundus optic disc based on SLIC superpixel. In Proceedings of the AOPC 2019: AI in Optics and Photonics, Beijing, China, 7–9 July 2019; Volume 11342, pp. 155–163. [Google Scholar]
  18. Wang, H.; Yuan, G.; Zhao, X.; Peng, L.; Wang, Z.; He, Y.; Qu, C.; Peng, Z. Hard exudate detection based on deep model learned information and multi-feature joint representation for diabetic retinopathy screening. Comput. Methods Programs Biomed. 2020, 191, 105398. [Google Scholar] [CrossRef]
  19. Sun, L.; Wang, Z.; Pu, H.; Yuan, G.; Guo, L.; Pu, T.; Peng, Z. Spectral Analysis for Pulmonary Nodule Detection Using Optimal Fractional S-Transform. Comput. Biol. Med. 2020, 119, 103075. [Google Scholar] [CrossRef]
  20. Huang, S.; Liu, Y.; He, Y.; Zhang, T.; Peng, Z. Structure adaptive clutter suppression for infrared small target detection: Chain-growth filtering. Remote Sens. 2020, 12, 47. [Google Scholar] [CrossRef] [Green Version]
  21. Yang, N.; Yan, B.; Liu, M. Coefficient design for combination pulse based on the Gaussian pulse derivatives. J. Yangzhou Univ. (Nat. Sci. Ed.) 2009, 12, 40–43. [Google Scholar]
  22. Dashtbozorg, B.; Zhang, J.; Romeny, B. Retinal Microaneurysms Detection using Local Convergence Index Features. IEEE Trans. Image Process. 2018, 27, 3300–3315. [Google Scholar] [CrossRef] [PubMed] [Green Version]
  23. Peng, Z.; Zhang, Q.; Wang, J.; Zhang, Q. Dim target detection based on nonlinear multi-feature fusion by Karhunen-Loeve transform. Opt. Eng. 2004, 43, 2954–2958. [Google Scholar]
  24. Wang, X.; Peng, Z.; Kong, D.; He, Y. Infrared dim and small target detection based on stable multi-subspace learning in heterogeneousscene. IEEE Trans. Geosci. Remote Sens. 2017, 55, 5481–5493. [Google Scholar] [CrossRef]
  25. Huang, S.; Peng, Z.; Wang, Z.; Wang, X.; Li, M. Infrared Small Target Detection by Density Peaks Searching and Maximum-gray Region Growing. IEEE Geosci. Remote Sens. Lett. 2019, 19, 1919–1923. [Google Scholar] [CrossRef]
  26. Wang, Y.; Peng, Z.; He, Y. The optimal fractional S transform of seismic signals based on normalized second-order central moment. J. Appl. Geophys. 2016, 129, 8–16. [Google Scholar] [CrossRef]
  27. Fan, X.; Xu, Z.; Zhang, J.; Huang, Y.; Peng, Z.; Wei, Z.; Guo, H. Dim small target detection based on high-order cumulant of motion estimation. Infrared Phys. Technol. 2019, 99, 86–101. [Google Scholar] [CrossRef]
  28. Wei, J.; Hagihara, Y.; Kobatake, H. Detection of cancerous tumors on chest X-ray images-candidate detection filter and its evaluation. IEEE Trans. Image Process. 1999, 3, 397–401. [Google Scholar]
  29. Pereira, C.S.; Fernandes, H.; Mendonça, A.M.; Campilho, A. Detection of lung nodule candidates in chest radiographs. In Pattern Recognition and Image Analysis; Publishing House: Berlin, Germany, 2007; pp. 170–177. [Google Scholar]
  30. Seiffert, C.; Khoshgoftaar, T.M.; Van Hulse, J.; Napolitano, A. RUSBoost: A Hybrid Approach to Alleviating Class Imbalance. IEEE Trans. Syst. Man Cybern.-Part A Syst. Hum. 2010, 40, 185–197. [Google Scholar] [CrossRef]
  31. Nock, R.; Lefaucheur, P. A robust boosting algorithm. In Proceedings of the 13th European Conference on Machine Learning, Helsinki, Finland, 19–23 August 2002; pp. 319–330. [Google Scholar]
  32. Dai, Y.; Wu, Y.; Zhou, F.; Barnard, K. Asymmetric contextual modulation for infrared small target detection. In Proceedings of the IEEE/CVF Winter Conference on Applications of Computer Vision, Virtual, 5–9 January 2021; pp. 950–959. [Google Scholar]
  33. Wang, H.; Zhou, L.; Wang, L. Miss detection vs. false alarm: Adversarial learning for small object segmentation in infrared images. In Proceedings of the IEEE/CVF International Conference on Computer Vision, Seoul, Korea, 27 October–2 November 2019; pp. 8509–8518. [Google Scholar]
  34. Cao, S.; Wu, F.; Lian, R.; Zhang, Y.; Peng, Z. Infrared dim target detection via hand-crafted features and deep information combination. In Proceedings of the 17th IEEE Conference on Industrial Electronics and Applications (ICIEA 2022), Chengdu, China, 17–20 July 2022; pp. 3215–3231. [Google Scholar]
  35. Rivest, J.-F.; Fortin, R. Detection of dim targets in digital infrared imagery by morphological image processing. Opt. Eng. 1996, 35, 1886–1893. [Google Scholar] [CrossRef]
  36. Deshpande, S.D.; Er, M.H.; Venkateswarlu, R.; Chan, P. Maxmean and max-median filters for detection of small targets. Signal Data Process. Small Targets 1999, 3809, 74–83. [Google Scholar]
  37. Han, J.; Moradi, S.; Faramarzi, I.; Zhang, H.; Zhao, Q.; Zhang, X.; Li, N. Infrared small target detection based on the weighted strengthened local contrast measure. IEEE Geosci. Remote Sens. Lett. 2020, 6, 24–28. [Google Scholar] [CrossRef]
  38. Han, J.; Moradi, S.; Faramarzi, I.; Liu, C.; Zhang, H.; Zhao, Q. A local contrast method for infrared small-target detection utilizing a tri-layer window. IEEE Geosci. Remote Sens. Lett. 2019, 17, 1822–1826. [Google Scholar] [CrossRef]
  39. Zhang, L.; Peng, L.; Zhang, T.; Cao, S.; Peng, Z. Infrared small target detection via non-convex rank approximation minimization joint l2, 1 norm. Remote Sens. 2019, 10, 1821. [Google Scholar] [CrossRef] [Green Version]
  40. Dai, Y.; Wu, Y. Reweighted infrared patch-tensor model with both nonlocal and local priors for single-frame small target detection. IEEE J. Sel. Top. Appl. Earth Obs. Remote Sens. 2017, 10, 3752–3767. [Google Scholar] [CrossRef] [Green Version]
  41. Sun, Y.; Yang, J.; An, W. Infrared Dim and Small Target Detection via Multiple Subspace Learning and Spatial-Temporal Patch-Tensor Mode. IEEE Trans. Geosci. Remote Sens. 2021, 59, 3737–3752. [Google Scholar] [CrossRef]
  42. Goldfarb, D.; Qin, Z. Robust low-rank tensor recovery: Models and algorithms. SIAM J. Matrix Anal. Appl. 2014, 35, 225–253. [Google Scholar] [CrossRef] [Green Version]
  43. Yang, J.; Zhao, X.; Ji, T.; Ma, T.; Huang, T. Low-rank tensor train for tensor robust principal component analysis. Appl. Math. Comput. 2020, 367, 124783. [Google Scholar] [CrossRef]
Figure 1. Samples of simple and complex scenes. (a,b) Simple scenes. (c,d) Complex scenes used in our experiments.
Remotesensing 15 01464 g001
Figure 2. The overall framework of the proposed algorithm.
Remotesensing 15 01464 g002
Figure 3. Gradient significance images in different scales and orientations.
Remotesensing 15 01464 g003
Figure 4. The convergence index (CI) filter. (a) Support region and the angle θ ( k , l ) . (b) Union of N half-lines.
Remotesensing 15 01464 g004
Figure 5. Some specific LCI filters: (a) adaptive ring filter; (b) sliding band filter, and (c) deformable region filter, where the search region is specified in dark gray and the region with the maximum filter response (support region) is specified in dark blue.
Remotesensing 15 01464 g005
Figure 6. The original images and their gradient magnitude images. The images in the first and third rows are the original image, and the images in the second and fourth rows are the gradient magnitude images. Red circles highlight the targets in the images.
Remotesensing 15 01464 g006
Figure 7. ROC curve of candidate classification with different features on two datasets: (a) results on NUAA-SIRST, and (b) results on NUDT-SIRST.
Remotesensing 15 01464 g007
Figure 8. Qualitative results of different methods. Left-top corner of the target area is expanded for better visibility. Red, yellow, and green circles highlight the successfully detected targets, false alarms, and miss detections, respectively. Close to the ground truth (GT), our method provided output with accurate target localization and segmentation with a decreased false alarm rate.
Remotesensing 15 01464 g008
Figure 9. 3D visualization of results of different methods on six test images.
Remotesensing 15 01464 g009
Table 1. Description of extracted features in multi-feature modeling.
TypeNameDescription
Intensity-based features I m e a n , I s t d , I s k e The mean, standard deviation and skewness
I e n t , I e n e The entropy and energy
I c o n The contrast
Geometry-based features S r e c Ratio of the target area to the area of the enclosing matrix
S c i r Ratio of the target area to the square of the perimeter of the outer contour
S s o l Ratio of the target area to the convex area
S e c c Ratio of distance between the foci and the major axis length of the ellipse with a same second moment as the region
LCI-based features F A R F , R A R F ARF filter responses on and its radius average
F S B F , R S B F ¯ SBF filter responses on and its radius average
F D R F , R D R F ¯ DRF filter responses on and its radius average
Table 2. Main characteristics of the datasets we used.
DatasetsImage TypeBackgroundNITarget Type
NUAA-SIRSTRealCloud/city/sea427Point/spot/extended
NUDT-SIRSTSyntheticCloud/City/Sea/Field/Highlight1327Point/spot/extended
Table 3. Candidate extraction results.
DatasetsRecallFPI
NUAA-SIRST0.98342.86
NUDT-SIRST0.96651.86
Table 4. Candidate classification results.
Feature SubsetNUAA-SIRSTNUDT-SIRST
IF0.944120.9747
GF0.9380.96678
IF + GF0.970830.99342
IF + GF + ARF0.974250.9953
IF + GF + SBF0.975590.99541
IF + GF + DRF0.987620.99573
All0.988820.99661
Table 5. IoU, R e , and F a values achieved on the NUDT-SIRST and NUAA-SIRST datasets.
MethodNUDT-SIRSTNUAA-SIRST
IoU R e F a IoU R e F a
(×10−2)(×10−2)(×10−6)(×10−2)(×10−2)(×10−6)
Top-hat [35]20.7278.41166.77.14379.841012
Max–median [36]4.19758.4136.894.17269.255.33
WSLCM [37]2.28356.8213091.15877.955446
TLLCM [38]2.17662.0116081.02979.095899
IPI [11]17.7674.4941.2325.6785.5511.47
NRAM [39]6.92756.419.2712.1674.5213.85
RIPT [40]29.4491.85344.311.0579.0822.61
PSTNN [13]14.8566.1344.1722.477.9529.11
MSLSTIPT [41]8.34247.4888.110.382.131131
MDvsFA-cGAN [33]75.1490.4725.3460.389.3556.35
ACM [32]67.0895.6710.1870.3393.913.728
ALCNet [7]81.496.519.26173.3396.5730.47
Proposed49.6490.649.83344.3590.69.06
Table 6. Time consumption of each step of the process.
StepTime (s)
Candidate extraction0.02–0.06
Multi-feature modeling0.01–0.24
Classifier and detector0.04
Table 7. Processing time for each image in the NUAA-SIRST dataset by different algorithms.
MethodTime (s)
Top-hat0.1056
LCM7.3676
MPCM0.1261
IPI5.4185
NRAM0.1507
PSTNN0.1687
RTRC0.7576
TMESNN0.1393
proposed0.1652
Disclaimer/Publisher’s Note: The statements, opinions and data contained in all publications are solely those of the individual author(s) and contributor(s) and not of MDPI and/or the editor(s). MDPI and/or the editor(s) disclaim responsibility for any injury to people or property resulting from any ideas, methods, instructions or products referred to in the content.

