Article

Individual Tree-Crown Detection and Species Identification in Heterogeneous Forests Using Aerial RGB Imagery and Deep Learning

1
Department of Environmental Systems Science, Institute of Terrestrial Ecosystems, ETH Zurich, 8092 Zurich, Switzerland
2
Forest Resources and Management, Swiss Federal Institute for Forest, Snow and Landscape WSL, 8903 Birmensdorf, Switzerland
3
Forest Dynamics, Swiss Federal Institute for Forest, Snow and Landscape Research WSL, 8903 Birmensdorf, Switzerland
*
Author to whom correspondence should be addressed.
Remote Sens. 2023, 15(5), 1463; https://doi.org/10.3390/rs15051463
Submission received: 9 February 2023 / Revised: 24 February 2023 / Accepted: 4 March 2023 / Published: 6 March 2023
(This article belongs to the Section Forest Remote Sensing)

Abstract

:
Automatic identification and mapping of tree species is an essential task in forestry and conservation. However, applications that can geolocate individual trees and identify their species in heterogeneous forests on a large scale are lacking. Here, we assessed the potential of the Convolutional Neural Network algorithm, Faster R-CNN, which is an efficient end-to-end object detection approach, combined with open-source aerial RGB imagery for the identification and geolocation of tree species in the upper canopy layer of heterogeneous temperate forests. We studied four tree species, i.e., Norway spruce (Picea abies (L.) H. Karst.), silver fir (Abies alba Mill.), Scots pine (Pinus sylvestris L.), and European beech (Fagus sylvatica L.), growing in heterogeneous temperate forests. To fully explore the potential of the approach for tree species identification, we trained single-species and multi-species models. For the single-species models, the average detection accuracy (F1 score) was 0.76. Picea abies was detected with the highest accuracy, with an average F1 of 0.86, followed by A. alba (F1 = 0.84), F. sylvatica (F1 = 0.75), and Pinus sylvestris (F1 = 0.59). Detection accuracy increased in multi-species models for Pinus sylvestris (F1 = 0.92), while it remained the same or decreased slightly for the other species. Model performance was more influenced by site conditions, such as forest stand structure, and less by illumination. Moreover, the misidentification of tree species decreased as the number of species included in the models increased. In conclusion, the presented method can accurately map the location of four individual tree species in heterogeneous forests and may serve as a basis for future inventories and targeted management actions to support more resilient forests.

Graphical Abstract

1. Introduction

Forests cover about 31% of the global land area and are home to 80% of the Earth’s terrestrial biodiversity [1]. Humans rely on forests for countless ecosystem services, but these ecosystems are highly vulnerable to human-caused climate change. In a dynamic climate, accurately mapping tree species distributions is critical for managing native and invasive vegetation [2,3], designing policies to ensure the provision of ecosystem services [4,5], and monitoring physiological stress [6,7]. Yet, tree species monitoring is a challenging task that is time-consuming, costly, and limited to a small spatial and temporal scale, and the data are often not publicly available [8]. Remote sensing, however, can contribute significantly to addressing these challenges and there is a clear call to integrate new technologies from that field into forestry and ecology [9,10,11].
Many forest applications and machine learning classification processes are based on satellite data (e.g., MODIS, Landsat, and Sentinel-2) that enable the coverage of vast areas. For tree species identification, these satellite data have a high temporal resolution but a low spatial resolution, making accurate identification of individual tree species challenging [12]. Nevertheless, the increasing availability of high-resolution remote sensing data combined with the use of Deep Learning (DL) algorithms, such as Convolutional Neural Networks (CNNs), is proving to be extremely useful for detailed large-scale ecosystem analysis [13,14]. CNNs can be trained to perform different classification tasks, depending on the architecture chosen [15,16]. The four main CNN image classification methods differ in their complexity, data input, and data output: (i) semantic segmentation provides pixel-based classification and is currently used in several applications for species mapping [17,18,19]; (ii) object detection makes it possible to geolocate, identify, and count individual trees [20,21]; (iii) instance segmentation can detect objects and predict pixel-level instances on objects by integrating the previous methods (i) and (ii) [22,23]; and (iv) panoptic segmentation goes one step further and integrates semantic and instance segmentation, delivering a unifying output (e.g., tree species and the surrounding environment). Out of these methods, semantic segmentation is the most established and frequently applied method for species mapping, land use, and vegetation cover classification [17,18,19,24].
Mapping the locations of individual trees and quantifying them are important tasks in forestry. Of the four CNN methods described above, object detection has the advantage of being able to geolocate and identify individual trees while also incorporating data from a variety of tree species, making the object detection model transferable to other regions [25]. Object detection architectures fall into two categories: one-step algorithms such as RetinaNet [26], You Only Look Once (YOLO) [27], and Single-Shot Detector (SDD) [28], and two-step algorithms such as the R-CNN family (e.g., Fast R-CNN, Faster R-CNN, and Mask R-CNN). One-step algorithms are considered more computationally efficient, while two-step algorithms deliver more precise output [16]. Faster R-CNN improves on Fast R-CNN by introducing Region Proposal Networks (RPNs) to efficiently predict region proposals, enabling end-to-end training and faster object detection [29]. Hence, Faster R-CNN reduces the computation time required for object detection while improving the accuracy over Fast R-CNN. Faster R-CNN can aid with automated data analysis and improve our understanding of ecological processes, thus it has been employed in several ecological applications [30,31,32,33].
The availability of high-resolution data, the variables used, and the forest heterogeneity play key roles in determining whether tree species can be accurately identified with CNNs. While CNN methods have provided good results in detecting trees in urban areas or plantations [7,30,34,35], identifying tree species in heterogeneous forests remains a challenge [36]. Moreover, studies frequently rely on specialized and expensive sensors to detect tree species in forests, such as hyperspectral, multispectral, or LiDAR sensors, which provide more information but often require longer processing times [37,38,39]. In recent decades, high-resolution aerial RGB imagery that is easy to use and available at low cost has become widely accessible [40]. The development of an object detection approach using only aerial RGB imagery would enable the cost-effective monitoring of tree species with broad application potential. Further, this could help address ongoing challenges, such as the differentiation between various tree species when visual differences are subtle, model generalizability, imbalanced classes, variability in annotation, and complex tree canopy structures.
Here, we aimed to evaluate the potential of an end-to-end object detection approach based on aerial RGB imagery for the efficient and highly automated detection of individual tree crowns and identification of tree species. To accomplish this, we trained and tested the Faster R-CNN algorithm on a large, annotated dataset with different tree species growing under various site conditions. We used open-source high-resolution aerial RGB imagery and ground-truth data from four tree species that are widespread in Europe and are of great economic and ecological importance: the three evergreen conifer species Norway spruce (Picea abies (L.) H. Karst.), silver fir (Abies alba Mill.), and Scots pine (Pinus sylvestris L.), and the deciduous broadleaf species European beech (Fagus sylvatica L.). Specifically, we (i) assessed the performance of the Faster R-CNN algorithm in enhancing model performance; (ii) compared the detection performance of single- and multi-species models; and (iii) assessed the influence of site conditions and stand structures on the accuracy of tree species identification.

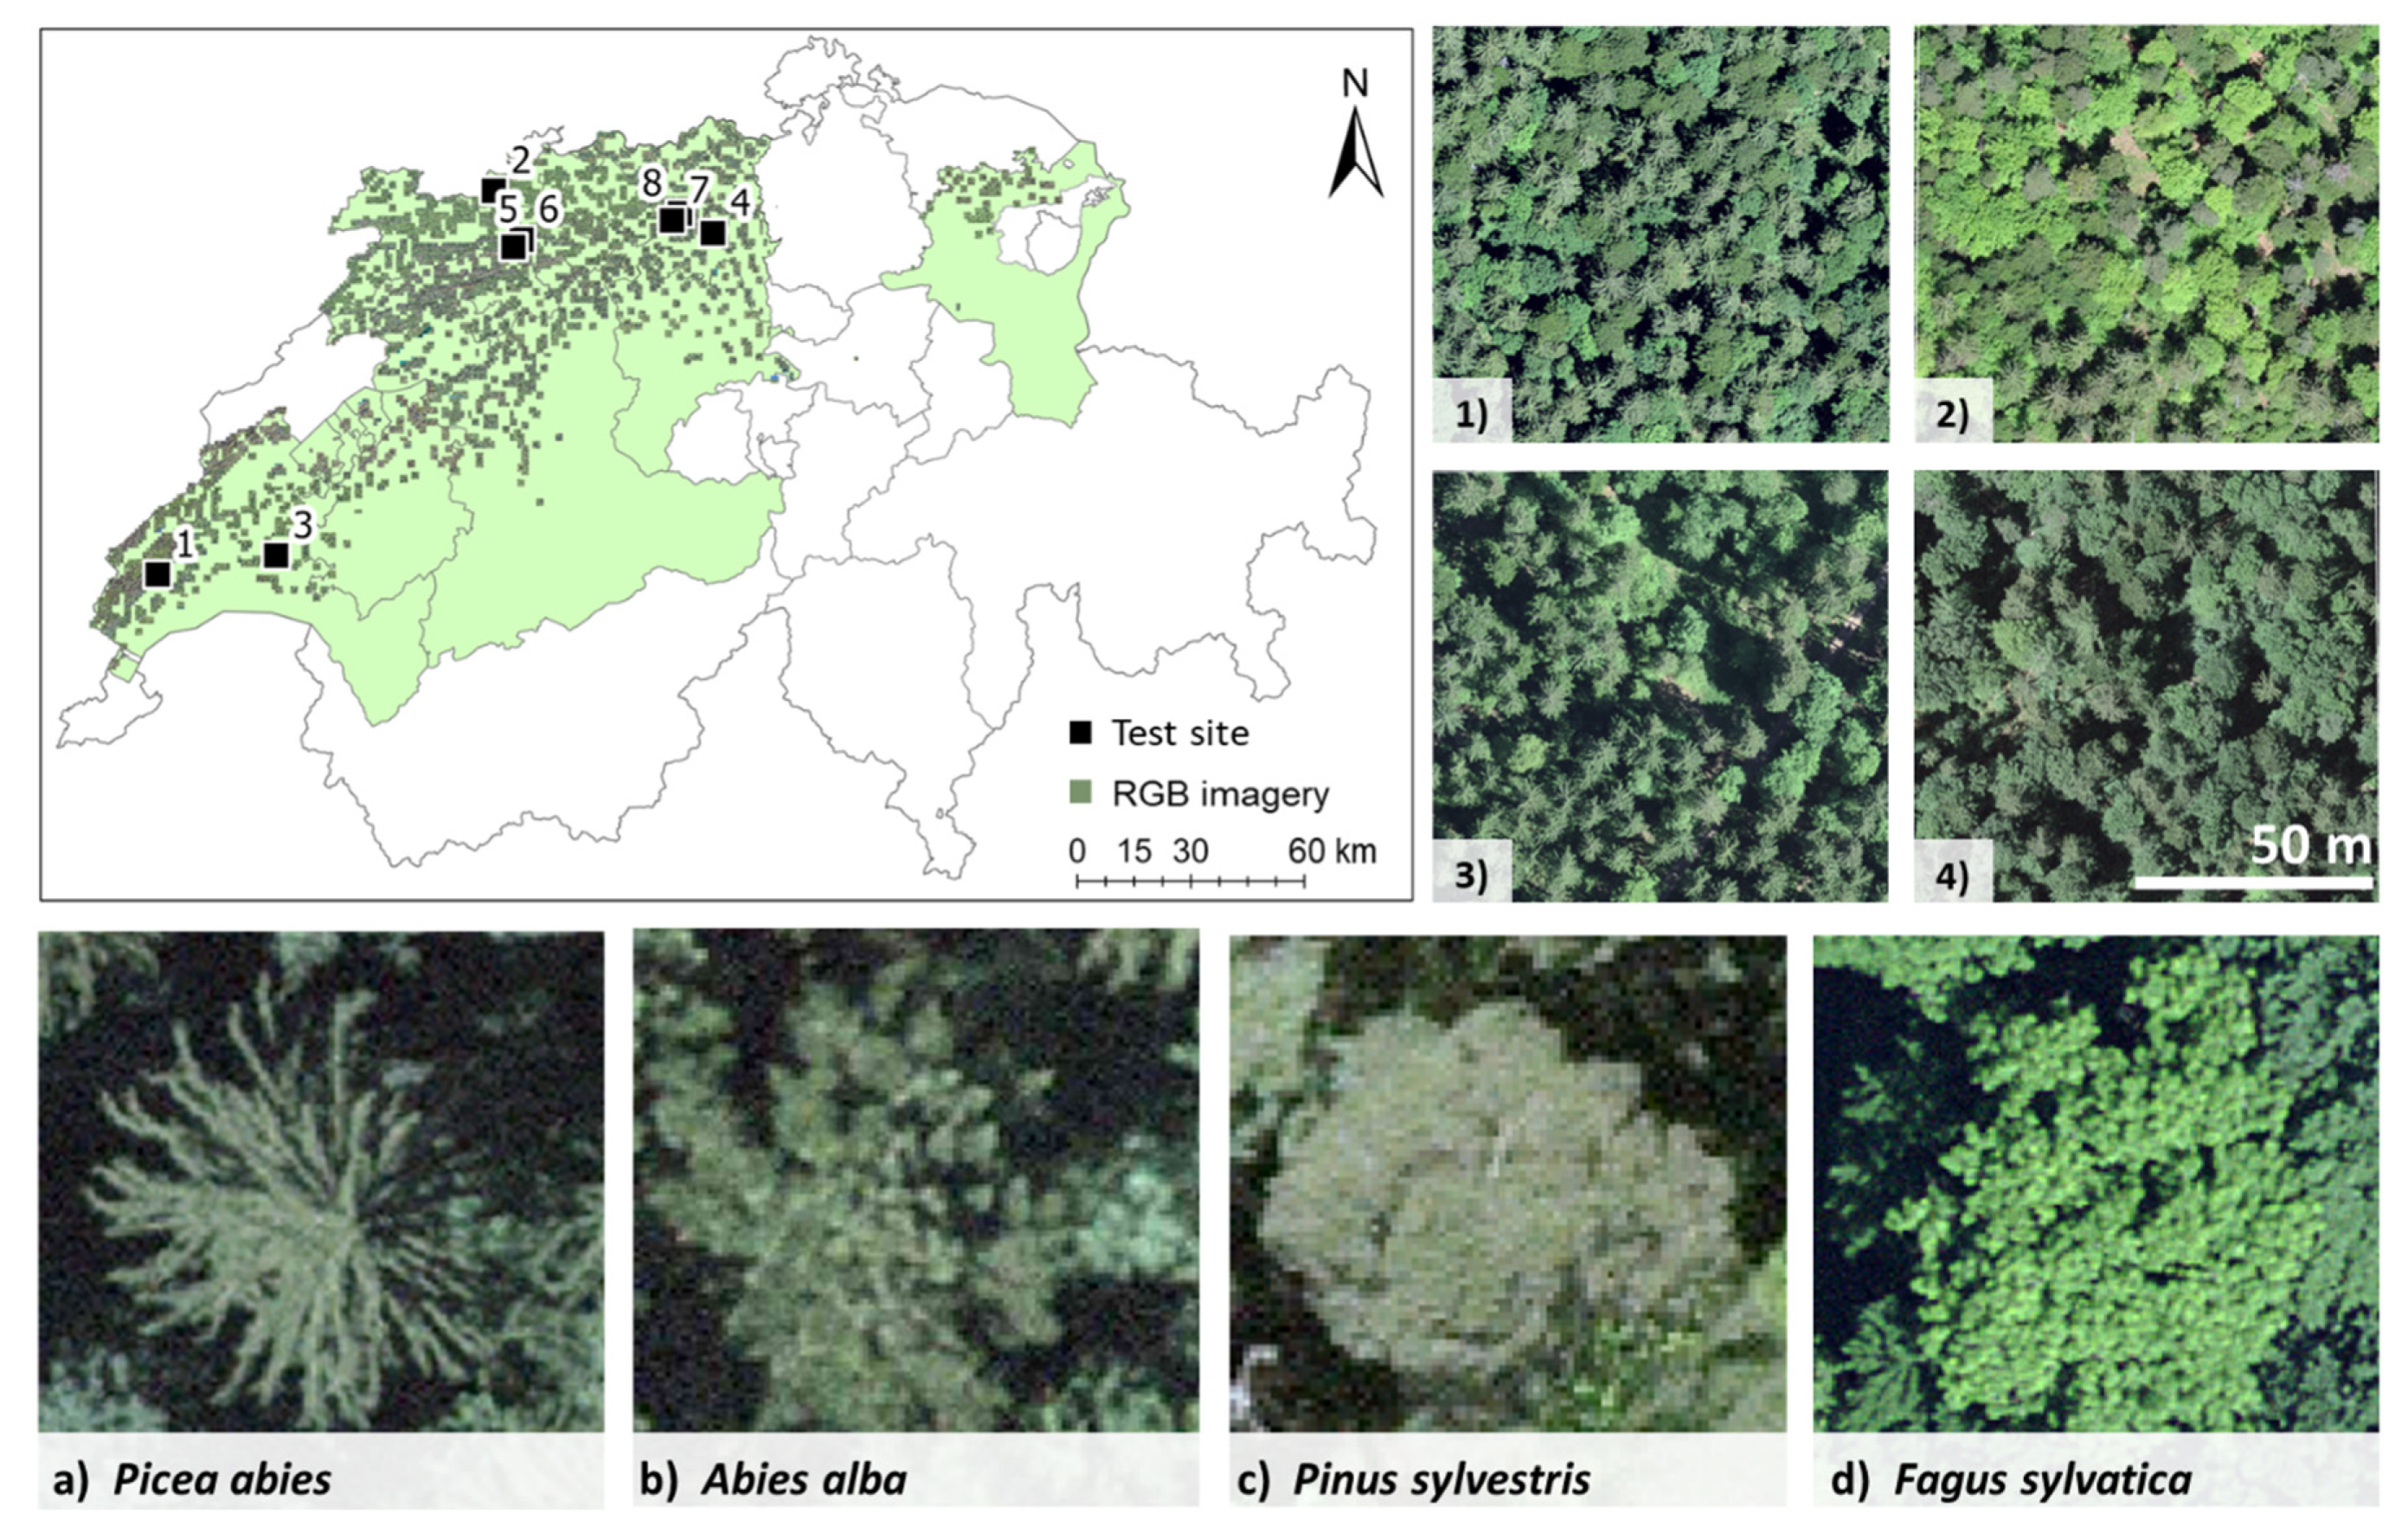
2. Materials and Methods
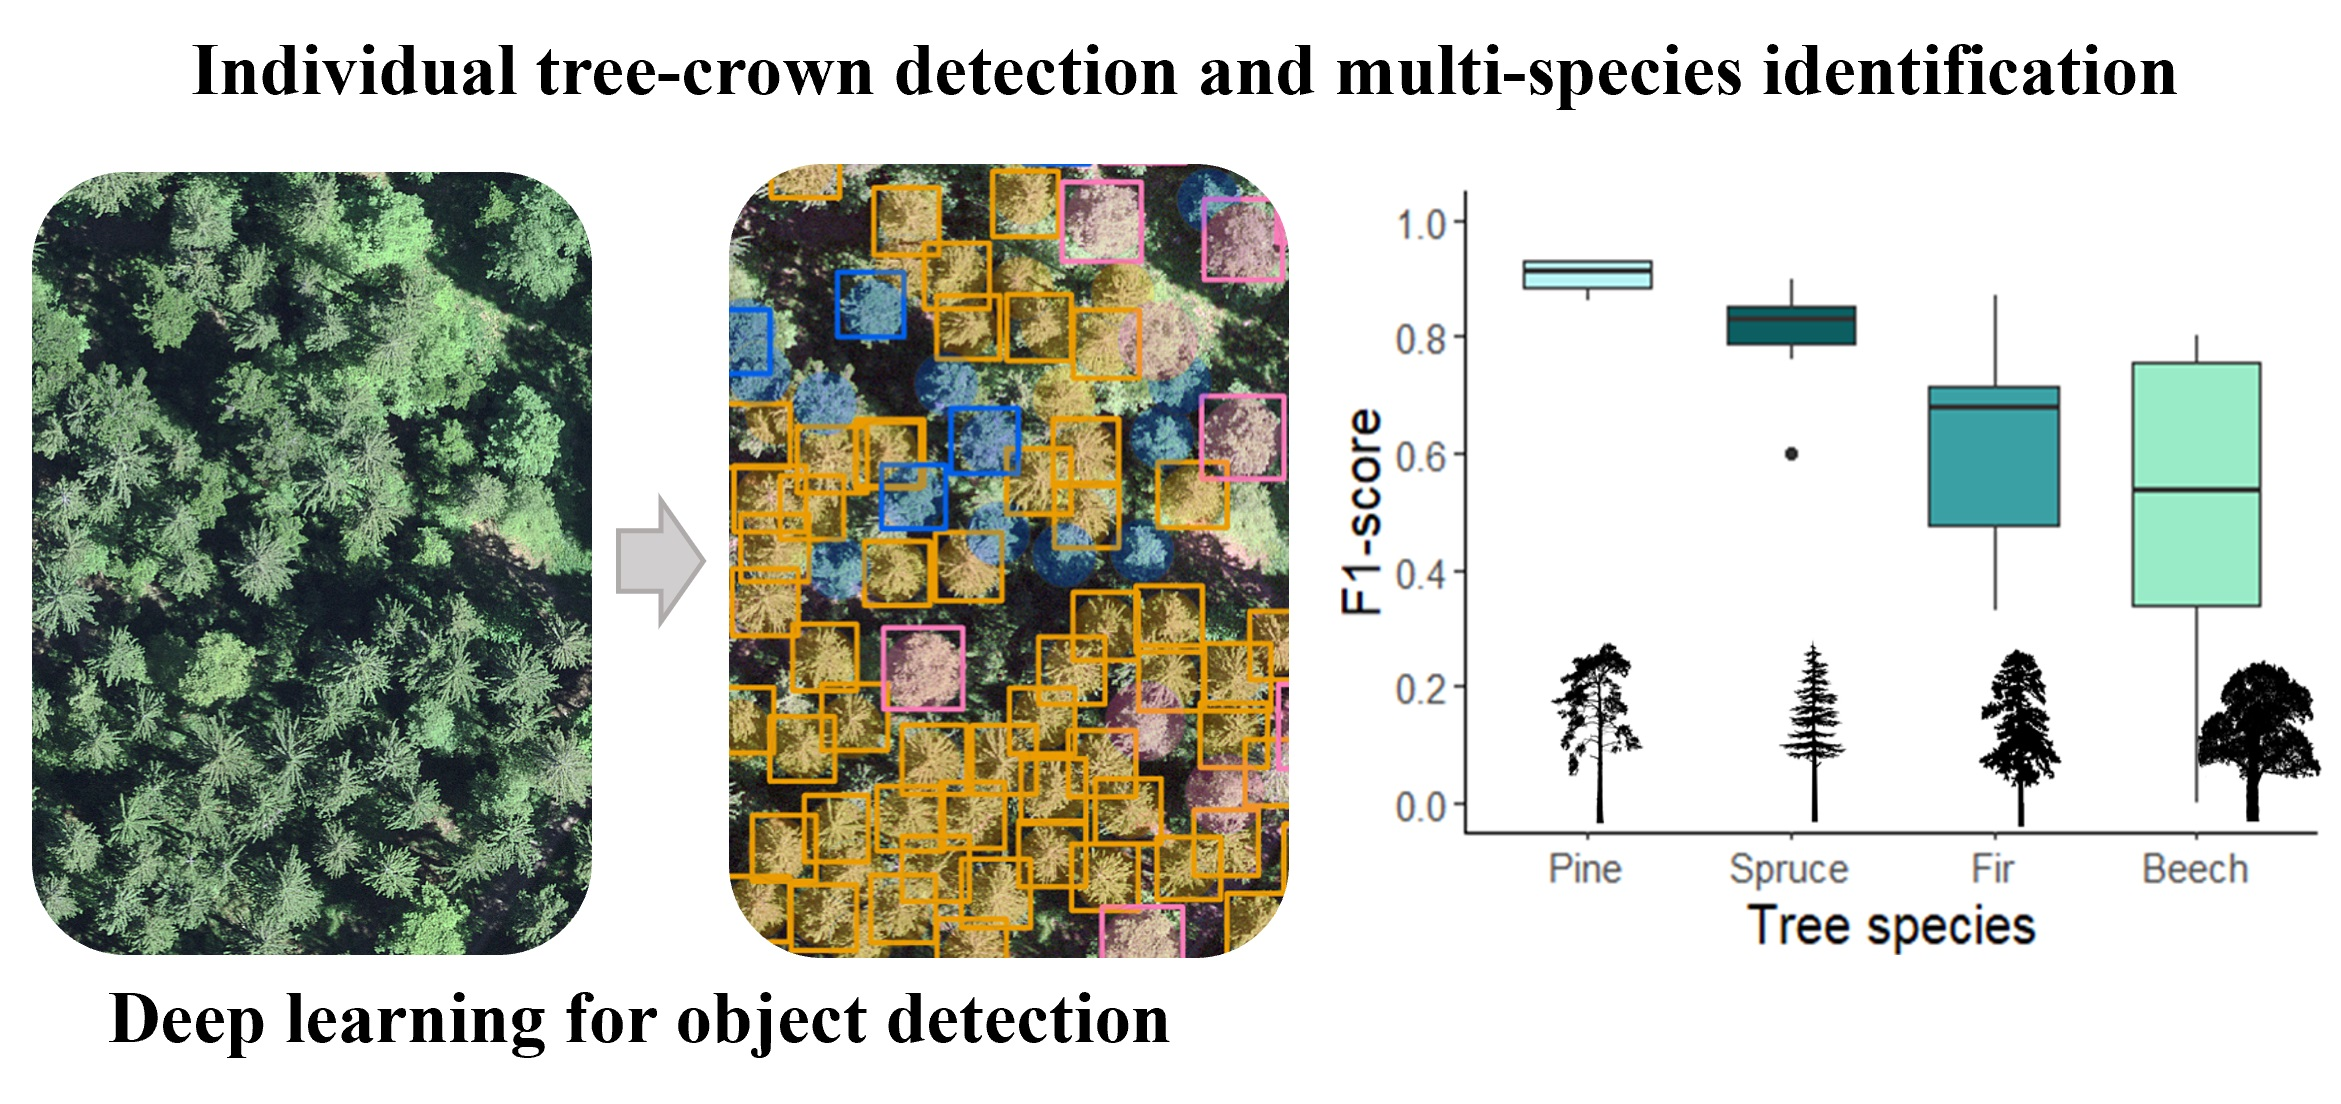
2.1. Study Area

The study area is situated in the northern part of Switzerland, in the Central Plateau and Jura regions. Forests cover around 24% of the Central Plateau and 47% of the Jura region. The study area falls within the boundaries of nine cantons: Vaud, Fribourg, Bern, Solothurn, Luzern, Aargau, Jura, Basel-Landschaft, and St. Gallen (Figure 1) [41]. Within the study area, the elevation ranges from 400 to 1200 m a.s.l. and the climate is temperate [42]. The upper parts of the study area are dominated by coniferous forests, with, e.g., Picea abies, A. alba, and Pinus sylvestris, whereas the lower parts are dominated by mixed and broadleaf forests, with, e.g., F. sylvatica L., maple (Acer spp.), European ash (Fraxinus excelsior L.), and oak (Quercus spp.) [43].

2.2. Data

2.2.1. Aerial RGB Imagery

The Federal Office of Topography Swisstopo provides open-source aerial orthophotos (SWISSIMAGE) at a 10 cm resolution across Switzerland [44]. The data were downloaded from the Swisstopo website [44]. The image acquisition is carried out with the ADS100 camera from Leica Geosystems (Heerbrugg, Switzerland). This sensor is based on push broom scanning technology. The SWISSIMAGE product is orthorectified using the digital terrain model (DTM) “swissALTI3D” at 50 cm resolution and is updated every 3 years. SWISSIMAGE collection takes place during either summer or winter, and the recording date of the orthophoto image tiles is not provided with the metadata. For the analysis, orthophotos from the vegetation period (i.e., the period when trees had fully developed leaves) were downloaded for nine cantons between 2017 and 2021 (1 × 1 km tiles; Figure 1). A mosaic was created from the downloaded tiles, which formed the basis for further processing.

2.2.2. Training and Validation Data

To develop a CNN model, the reference dataset has to be split into training, validation, and test data [14]. Commonly used datasets for the development of CNNs, such as COCO [45], KITTI [46], and Open Images Dataset [47], provide a large amount of data but are not representative of the studied tree species. In forestry, reference data usually come from ground-based surveys as geolocated point observations. Hence, in this study, a new dataset for tree species was created, based on ground-truth data and aerial RGB imagery.
A dataset of 17,610 geolocated trees was compiled from three main sources: Arborizer data [48], Long-term Forest Ecosystem Research program (LWF) data [49], and Swiss National Forest Inventory (NFI) data [50]. The ground-truth dataset was gathered between 1995 and 2020 and includes information on tree species, coordinates, diameter at breast height (dbh), and social status (dominant, co-dominant, dominated, suppressed, and none). There are certain class imbalances because the data are based on real-world reference data; for instance, Pinus sylvestris is less represented in the dataset. For data processing, the ArcGIS Pro (v. 2.9.0) software was used.
The geolocated tree (i.e., the ground-truth points) from the NFI and LWF datasets did not always perfectly overlap with the corresponding tree canopy on the aerial RGB imagery. This inaccuracy was mainly due to two reasons. First, all tree ground-truth points are subject to some error which is usually in the sub-meter range [50]. Second, the tiles of the SWISSIMAGE orthophotos are georectified using a DTM [44]. However, tree crowns are above the Earth’s surface and can have a tilt effect. Even if the ground-truth points on the ground are accurate, the crown can be shifted on the aerial RGB imagery. Based on dbh (conifers ≥ 20 cm, deciduous ≥ 25 cm), social status (dominant and co-dominant), and visual inspection, the dataset of 17,610 geolocated trees was filtered to ensure that the tree crowns were visible on the orthophotos. A manual correction was performed where ground-truth points did not overlap perfectly with the associated tree crown on the orthophoto. For instance, if the ground truth point did not overlap perfectly with the tree canopy, it was either moved to the nearest tree canopy of that species or deleted if it was clearly mislabeled. This data pre-filtering and cleaning was performed to obtain the most informative training data possible.
The tree-crown extent was generated automatically using a buffer of 4 m for coniferous and 5 m for deciduous trees. The buffer size was chosen after multiple tests and represented the best approximation of crown extent over the whole dataset. This resulted in a total of 11,437 and 10,614 geolocated trees for training and validation, respectively (Table 1). For the Deep Learning (DL) approach, training data were extracted based on the ground-truth data and the SWISSIMAGE dataset. Image tiles with a 256 × 256-pixel size stride were generated as TIFs, using the PASCAL VOC format. The dataset was split into 90% for training and 10% for validation. The data split was performed on a spatial basis to ensure that no neighboring trees appeared in both the training and validation datasets. To test the augmentation potential, the model was trained without and with augmentation (rotating the tiles 90°). The training data can be accessed at https://doi.org/10.5281/zenodo.7528566.

2.2.3. Test Data

A test dataset is used to independently evaluate the performance of the final CNNs. To optimize the generalization of the CNN models, multiple test sites with a wide variety of environmental conditions are desirable [37]. Here, eight independent test sites were used to assess the object detection models’ generalization performance and transferability to forest stands with different species combinations and site conditions (Figure 1). Four 1-ha test sites were chosen, each with at least three of the examined species. The other four test 1-ha sites were selected from a heterogeneous forest with diverse forest stand conditions and a slope of 3 to 10°. Specifically, two test sites were in forest stands with low illuminance, on a north-facing slope of ~35°, and homogeneous tree density, while the other two test sites were in forests with optimal illuminance, a slope of ~3°, and homogeneous and heterogeneous tree density, respectively. The test data were mapped manually based on expert knowledge. In total, the test dataset consisted of 823 trees.
The workflow of data processing, model training, and accuracy assessment is presented in Figure 2. The Picea abies models were tested on sites with different tree densities (a young forest monoculture and a mature mixed forest) and illumination levels (north-facing slope with heavy shading and a forest stand with no shading).

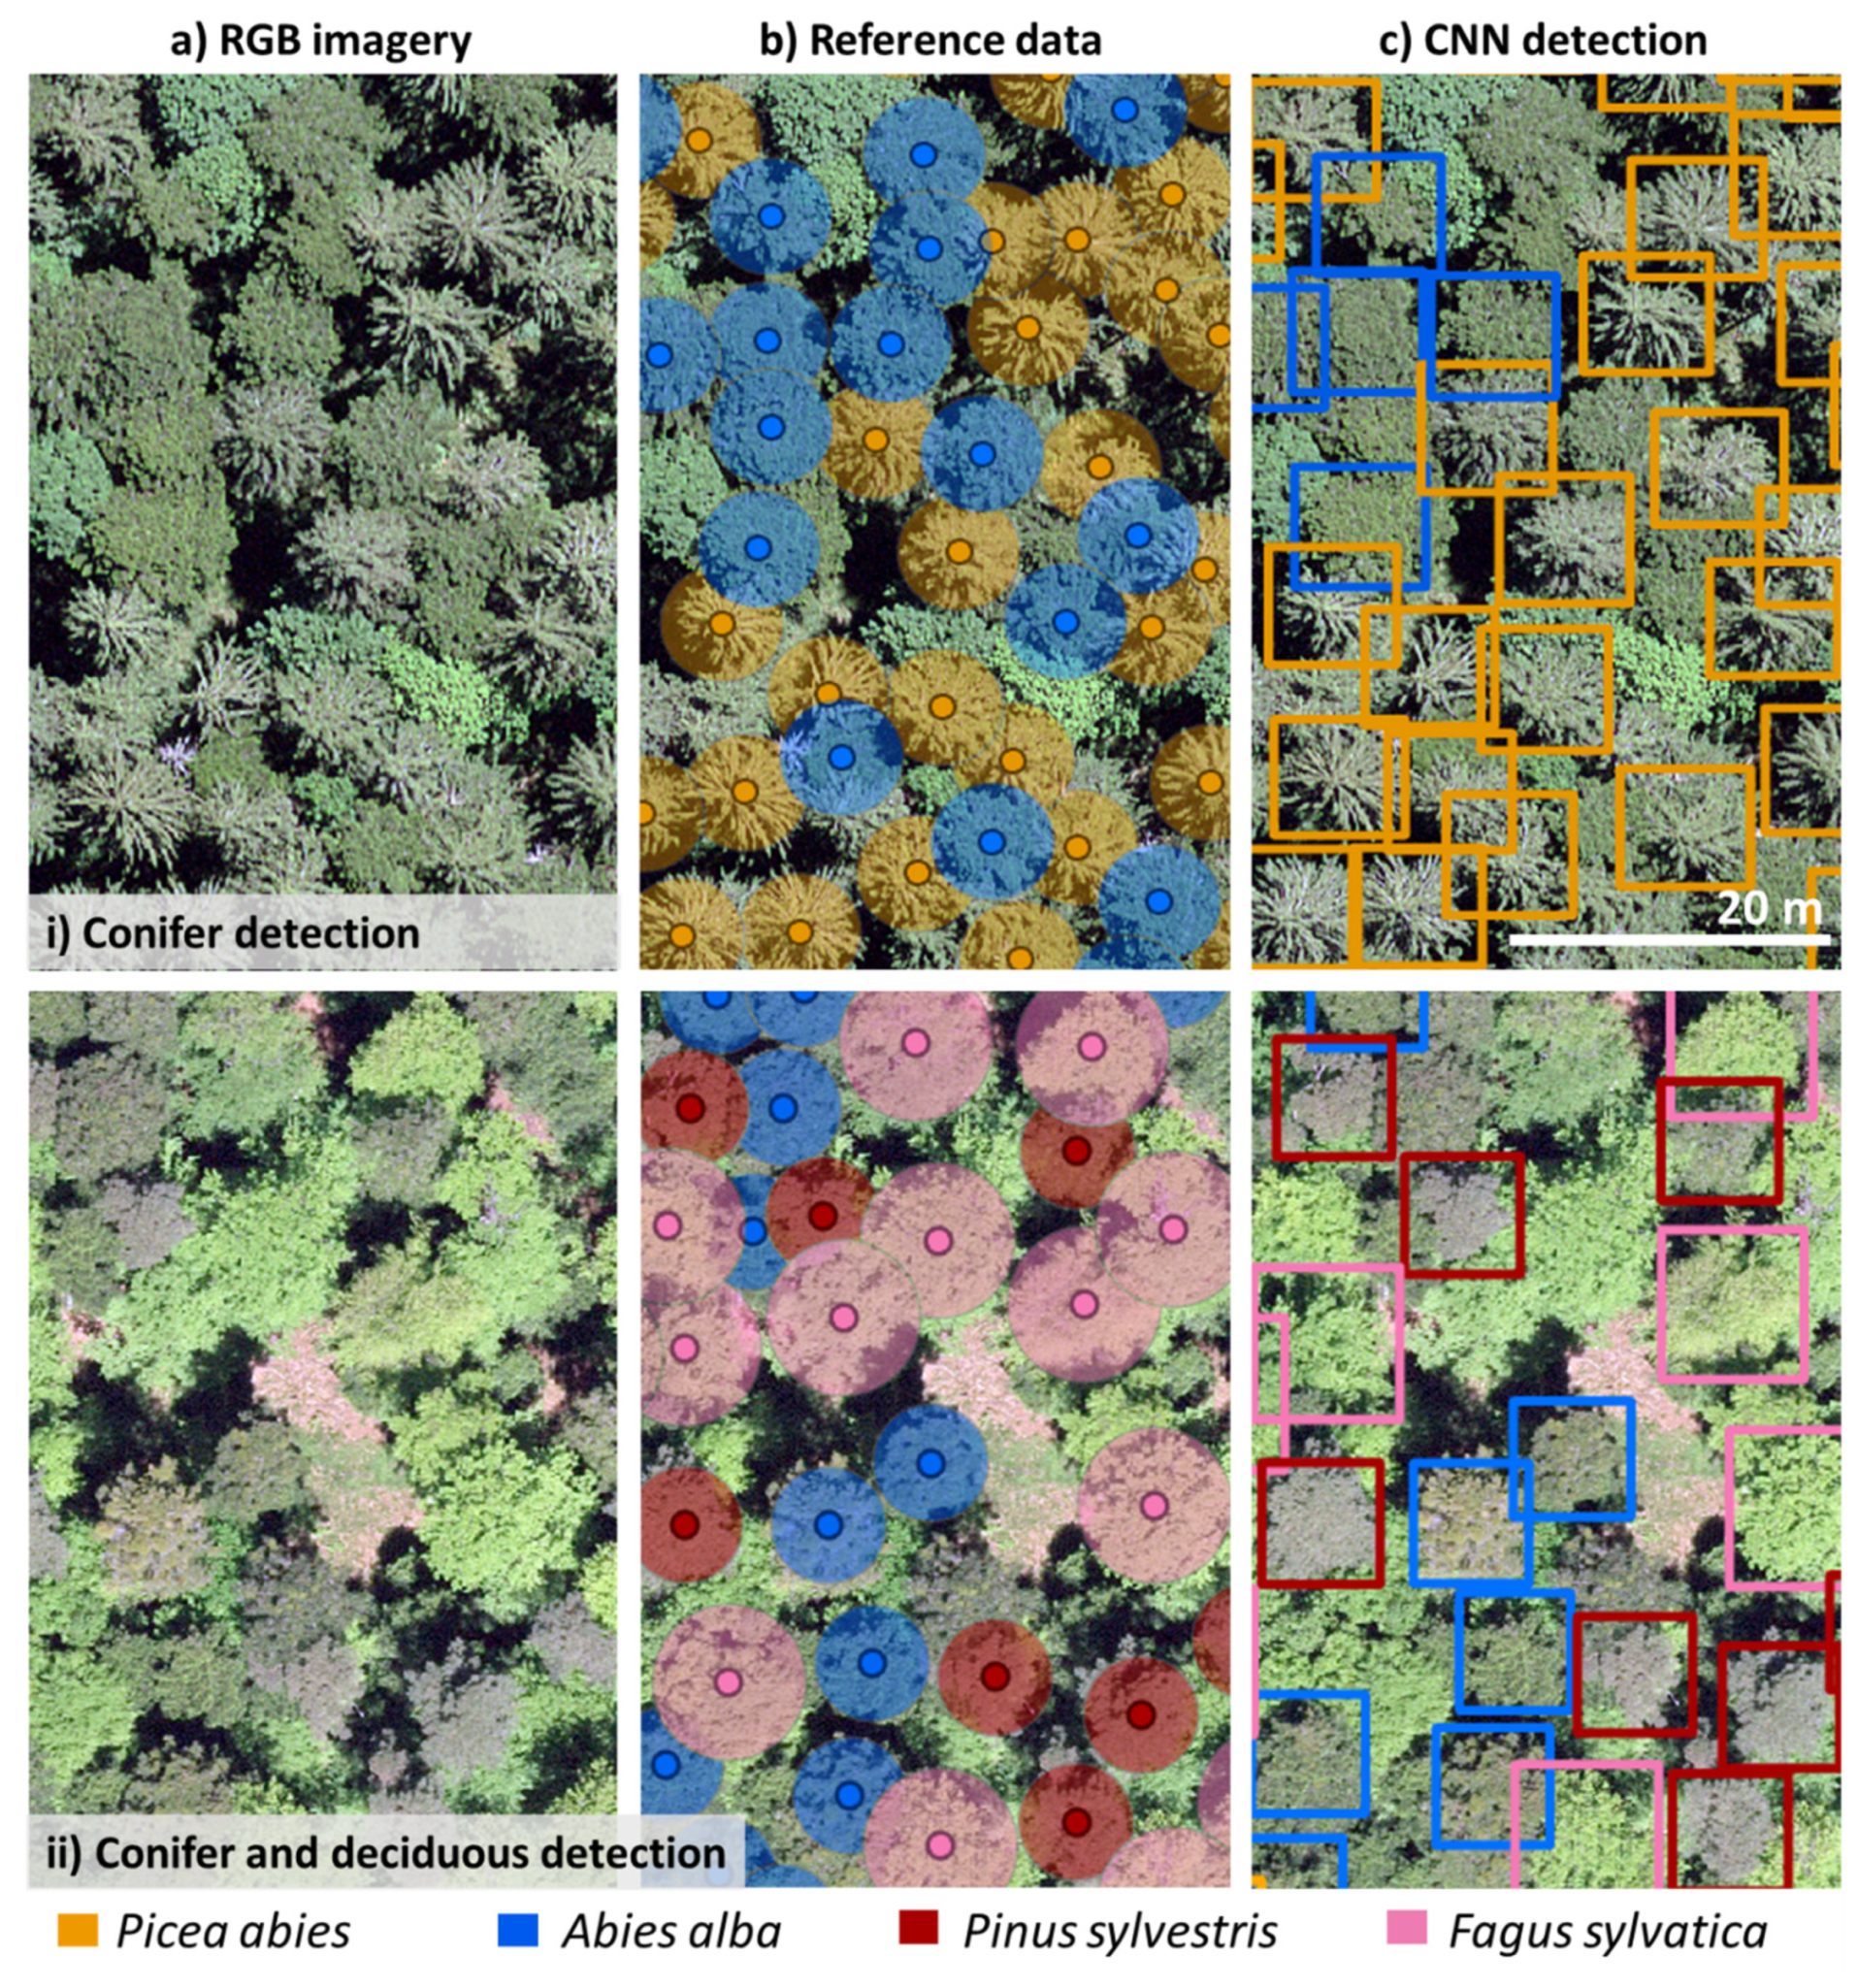
2.3. CNN-Based Tree Species Mapping

The Faster R-CNN architecture [29] with a ResNet-101 backbone was investigated. Faster R-CNN consists of two modules, a deep fully convolutional network that proposes regions (RPN) and a detector that uses the proposed regions [29]. Faster R-CNN was trained over 50 epochs, using non-overlapping chips with a size of 256 × 256 pixels (25.6 × 25.6 m) and a batch size of 16. These network hyperparameters were chosen based on prior tuning. The backbone’s weights and biases were unfrozen so they could be adjusted to fit the training samples and enhance object detection performance. To optimize the network training flow, Stochastic Gradient Descent with a learning rate of 0.0001 was used. The original Faster R-CNN uses the log loss (also called cross-entropy loss) as a classification loss (Lclas) and a smooth L1 loss as a regression loss function [29]. The Focal Loss function was used, which is an enhancement of the Cross-Entropy Loss function and addresses class imbalance during training [26]. To limit the possibility of false negatives for smaller tree canopies that blend in with the background, the minimum confidence threshold was adjusted to 0.5.
Early stopping was used as the regularization technique to avoid overfitting. During training, validation loss was monitored to assess when to stop model training. This reduced the risk of overfitting, shortened training time, and produced better results. All Faster R-CNN models trained with non-augmented training data input reached a minimum validation loss during 50 epochs. Training time ranged from 30 min for single species to over 6 h for multi-species detection, and from 3 to over 14 h for augmented training data. In some cases, the object detection approach returned more than one bounding box for the same object, which is a tiling side effect. To correct this, duplicate bounding boxes with the lowest confidence were removed using the non-maximum suppression approach [7,51,52]. Thus, if two bounding boxes overlapped by more than 70%, the box with the lowest confidence value was removed. Our models’ weights and training data can be accessed at https://doi.org/10.5281/zenodo.7528566.

2.4. Model Performance Assessment

The performance of the Faster R-CNN model on test data was assessed using five accuracy metrics: (1) precision, (2) recall, (3) F1 score (F1), (4) intersection over union (IoU), and (5) average precision (AP). F1 is a weighted average of the precision and recall that is robust for imbalanced datasets, with values closer to 1 indicating higher accuracy [14]. The IoU threshold for this study was 0.5. IoU is the ratio between the area of intersection and the area of the union of the predicted bounding box and the ground-truth bounding box. AP is the area under the precision-recall curve, i.e., the precision average across all recall values between 0 and 1 at an IoU threshold. IoU was used to determine if a predicted result was a true positive (TP) or a false positive (FP).
P r e c i s i o n = T P T P + F P = C o r r e c t l y   p r e d i c t e d   i n d i v i d u a l   t r e e s A l l   p r e d i c t e d   i n d i v i d u a l   t r e e s
R e c a l l = T P T P + F N = C o r r e c t l y   p r e d i c t e d   i n d i v i d u a l   t r e e s A l l   g r o u n d - t r u t h e d   i n d i v i d u a l   t r e e s
F 1 - s c o r e = P r e c i s i o n × R e c a l l P r e c i s i o n + R e c a l l 2
I o U = b b o x   P r e d b b o x R e f b b o x   P r e d     b b o x R e f
A P = 0 1 p ( r ) d r k = 1 n p k ( r k r k 1 )
In the precision and recall function, TP represents the number of correctly detected trees, FP is the number of incorrectly detected trees, and FN (false negative) is the number of trees that the model failed to detect. In the AP function, r and p represent the recall and precision, respectively, and pk and rk are the recall and precision values at the kth subinterval of the interval from 0 to 1 [53]. A confusion matrix was used to represent the performance of each model (single- and multi-species models), including TP, FP, and FN.

3. Results

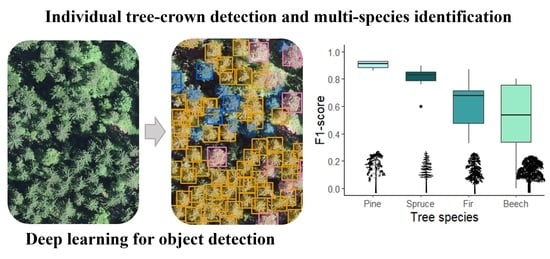
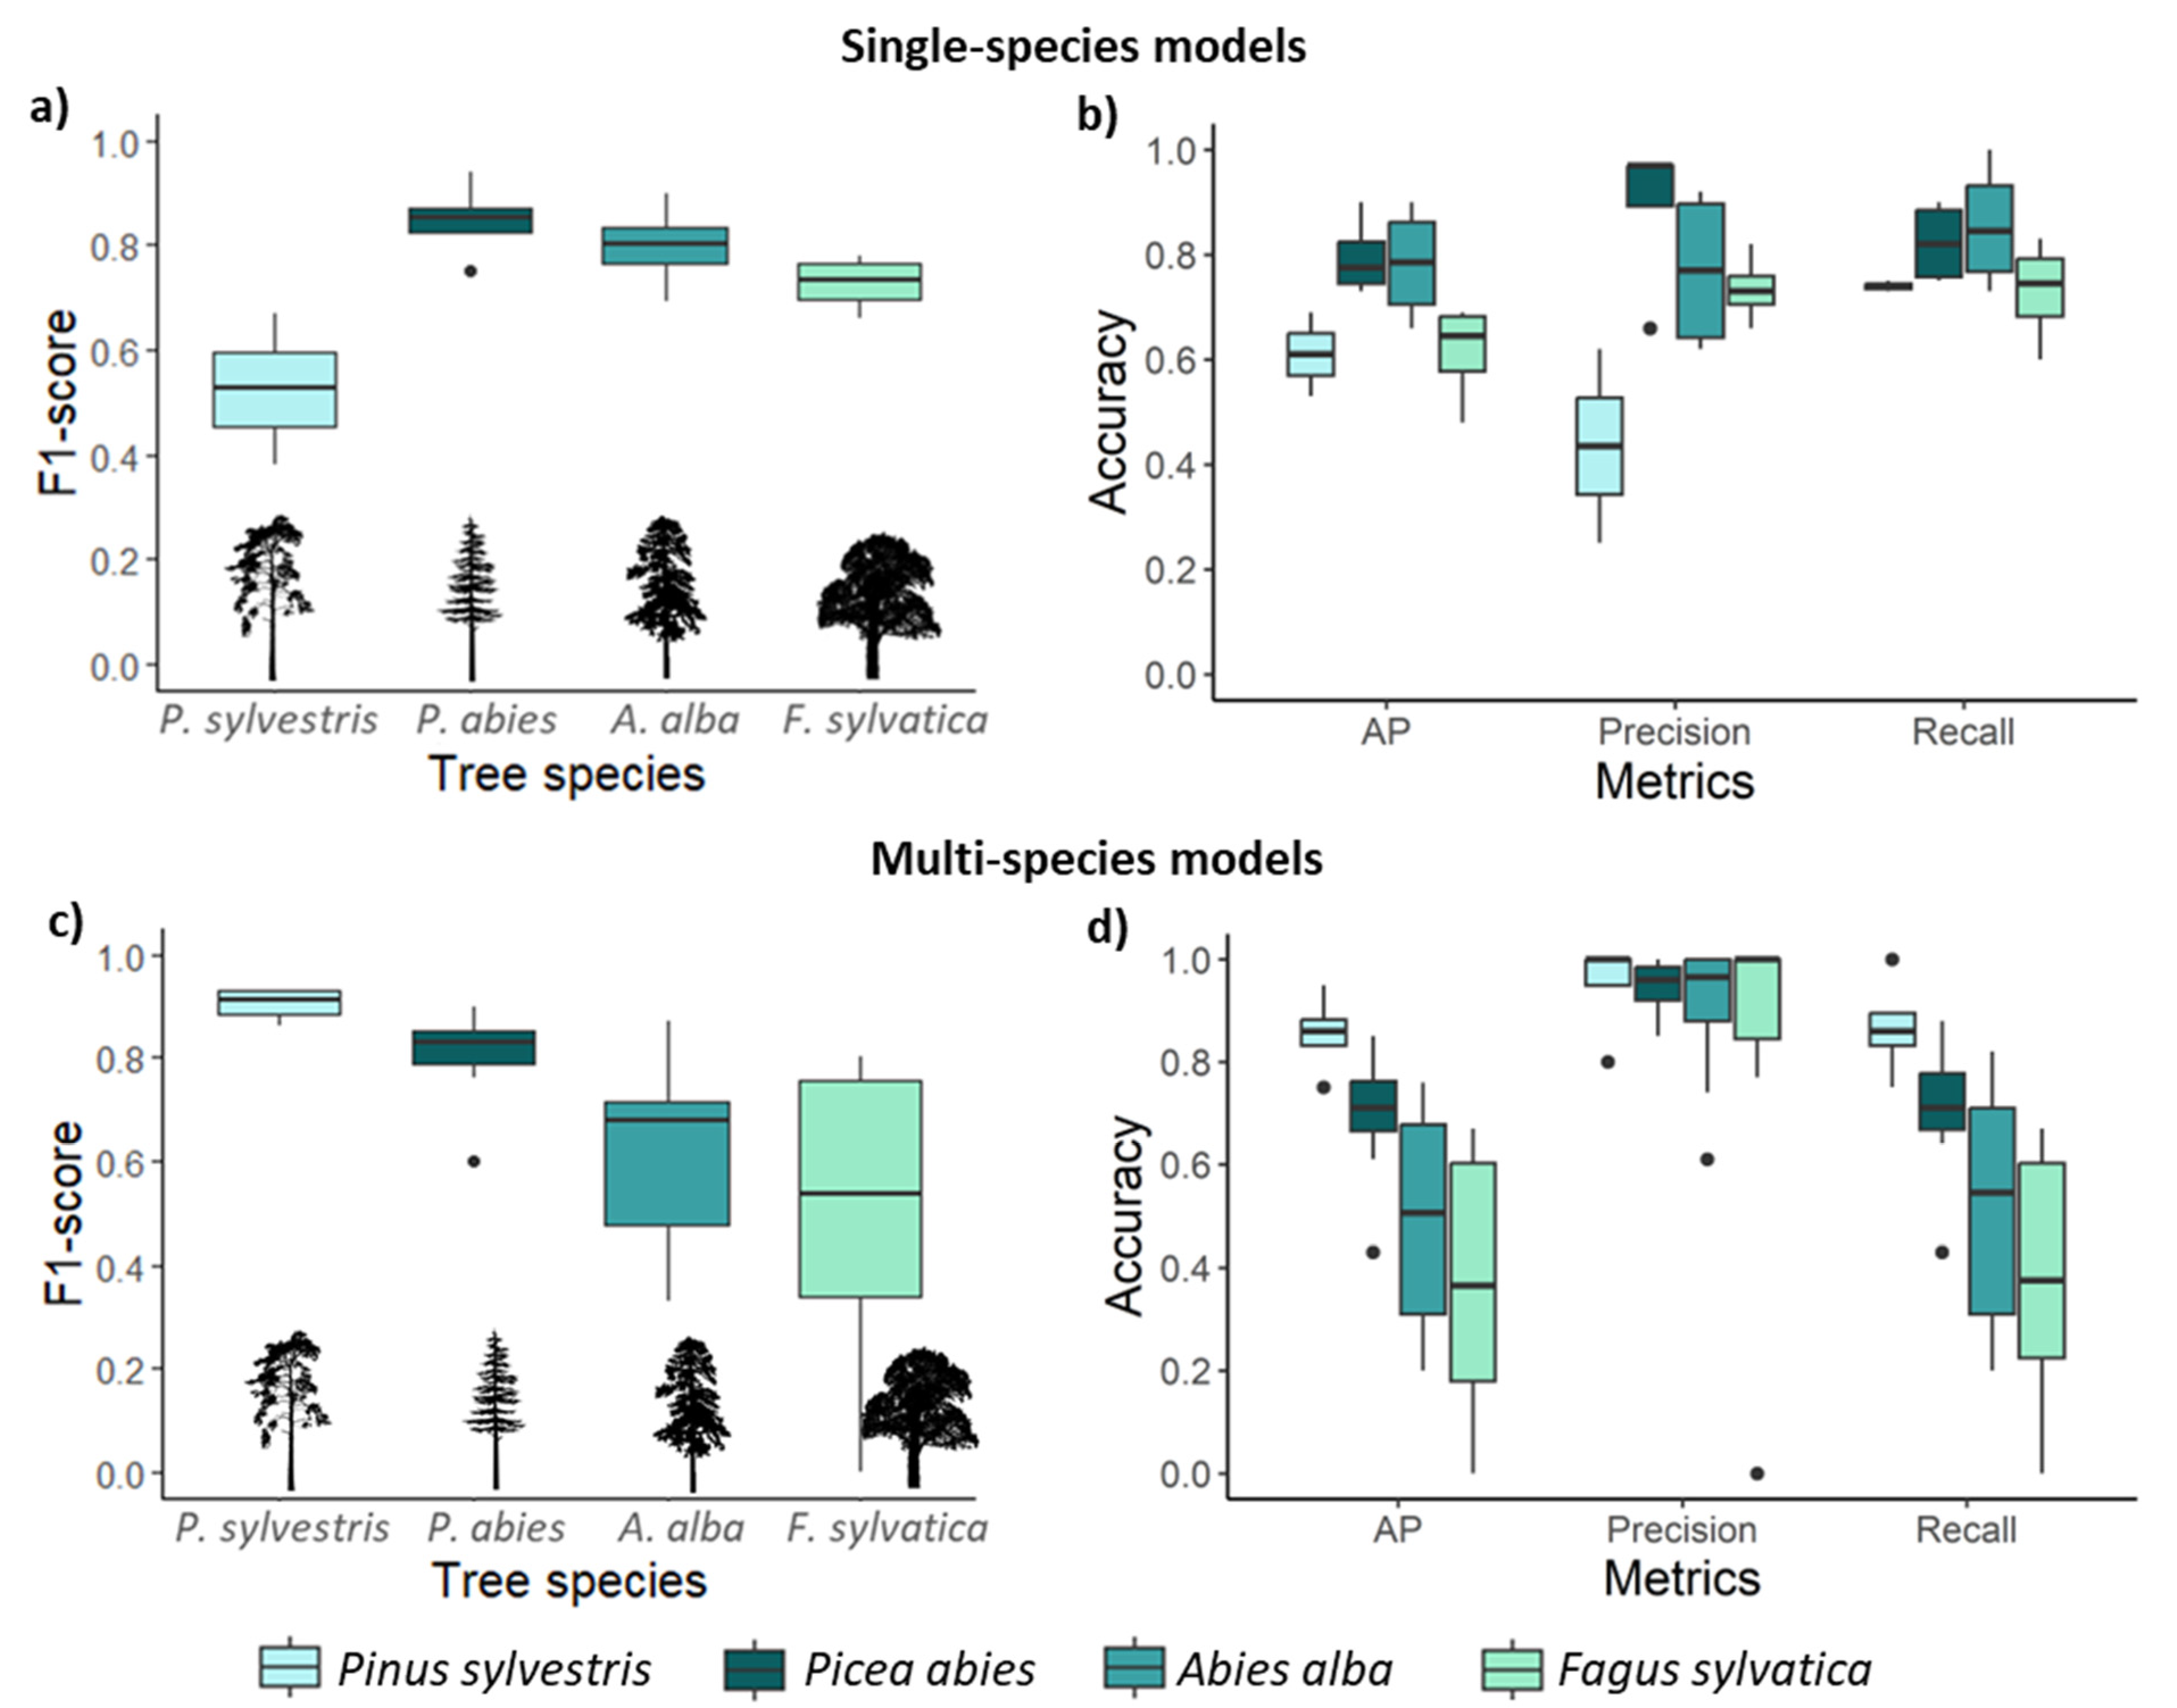
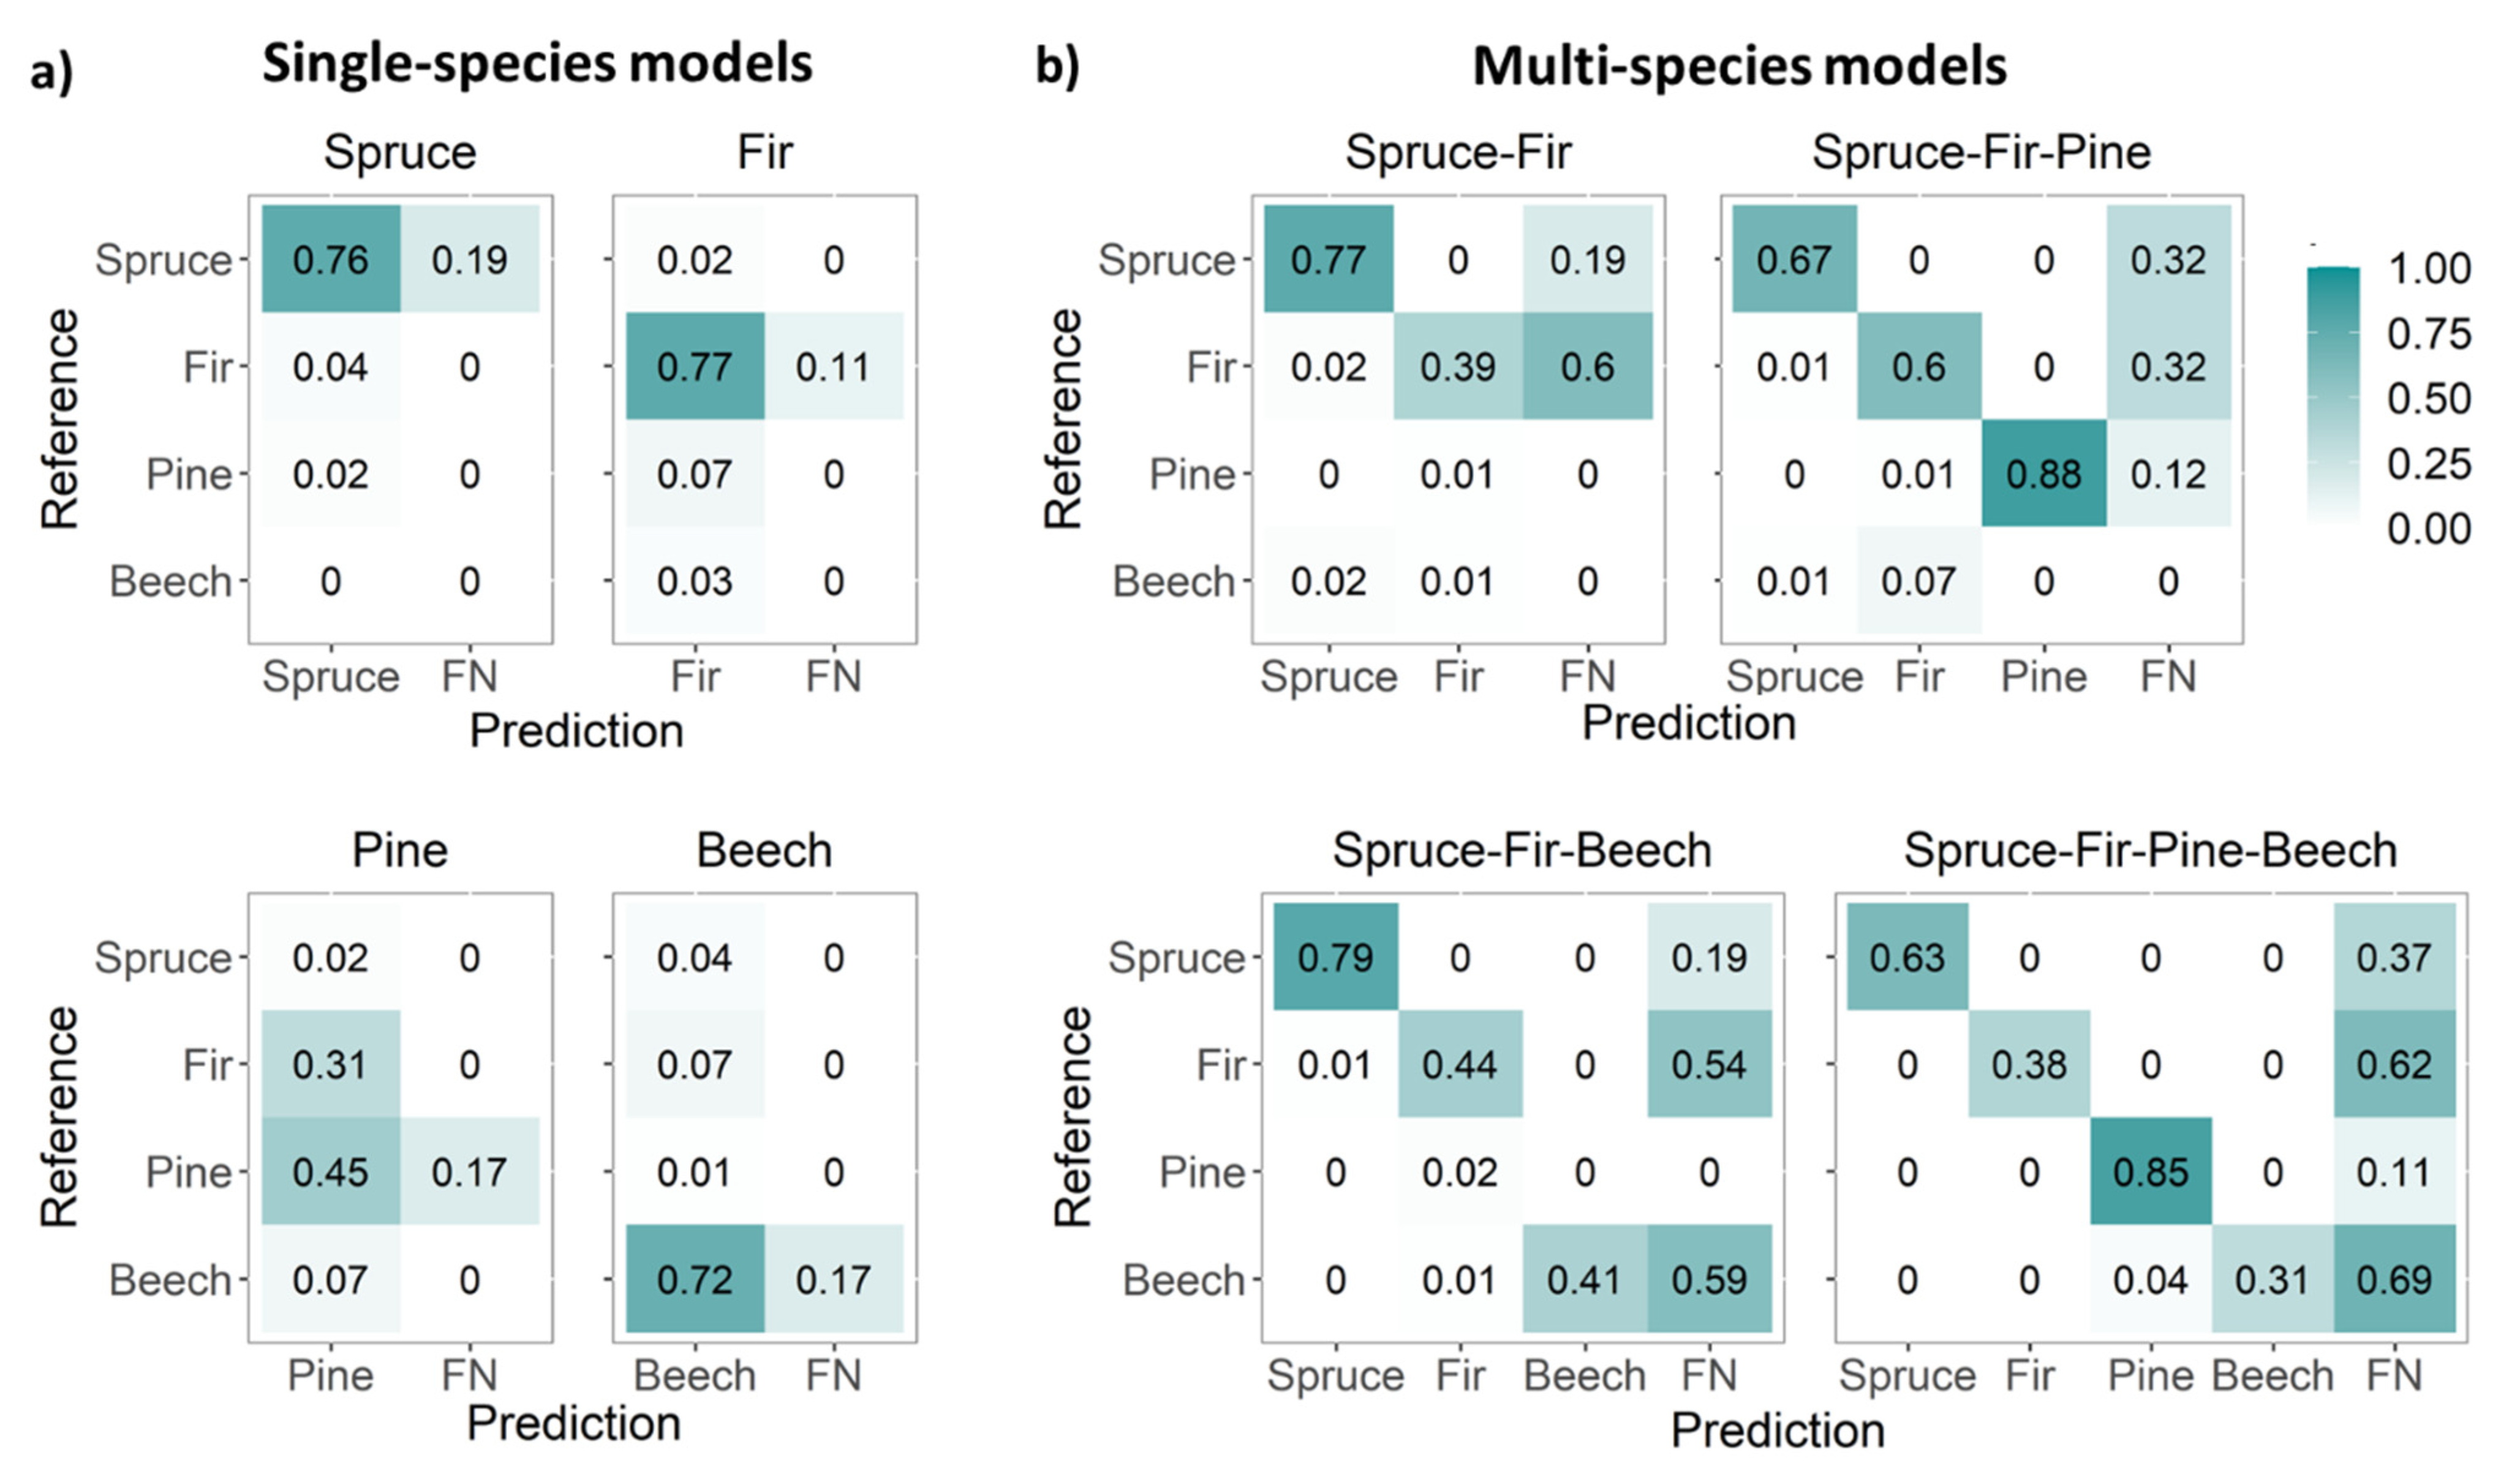
3.1. CNN Performance for Single-Species Detection Models

Faster R-CNN models trained on non-augmented single-species data achieved a mean F1 of 0.76. Picea abies was the best-detected species, followed by A. alba, F. sylvatica, and finally Pinus sylvestris (Table 2 and Figure 3a,b). Single-species detection models generally exhibited greater variability and lower precision than multi-species detection models (Figure 3b,d). Hence, Pinus sylvestris was detected better in the multi-species models than in the single-species models. Picea abies and F. sylvatica were the least and most misidentified (FP) species, respectively (Table 2). Picea abies and A. alba had similar AP values, but 4% of Picea abies trees were misidentified as A. alba while only 2% of A. alba were misidentified as Picea abies (Figure 4a). Moreover, 7% of A. alba trees were misidentified as Pinus sylvestris (Figure 4a). Further, 7% of F. sylvatica trees were misidentified as A. alba, whereas 31% of Pinus sylvestris trees were misidentified as A. alba (Figure 4a).

3.2. CNs Performance for Multi-Species Detection Models

The performance of the multi-species CNN models was dependent on the combination of tree species and site conditions. The models detecting coniferous species performed better than those including the deciduous species F. sylvatica (Table 3). Among the four multi-species models, the one detecting all three conifers (spruce-fir-pine model) had the highest average F1 (0.81). Pinus sylvestris was the best-detected species (F1 = 0.92), followed by Picea abies (F1 = 0.79; Figure 3c). The detection of A. alba and F. sylvatica varied depending on the species combination and site conditions. The low detection accuracy was primarily due to low recall (correctly detected trees), i.e., the models had a high number of unidentified trees (FN) (Table 3). Multi-species models had a higher precision than recall for all species (Figure 3d).
The confusion matrix (Figure 4a,b) shows the correctly detected species (TP), misidentified species (FP), and not detected trees (FN) for both the single and multi-species detection models. Even though the multi-species models did not detect more trees (FN), misidentification (FP) decreased as the number of species used to train the model increased (Table 3 and Figure 4b). For instance, in the spruce-fir-pine-beech model, only 4% of F. sylvatica trees were misidentified as Pinus sylvestris (Figure 4b). As a result, while training a model with several species took longer (≥6 h) than training with a single species (30 min), the number of false positives was considerably lower in the multi-species models (Table 3). Further, compared with single-species models, multi-species models had improved precision but decreased recall. Figure 5a,b illustrates the data input (aerial RGB images and the buffers for the ground data) and the detection of conifers (i) and coniferous and deciduous trees (ii). The detection performance for all four species (spruce-fir-pine-beech model) was site-specific (Figure 6a,b).

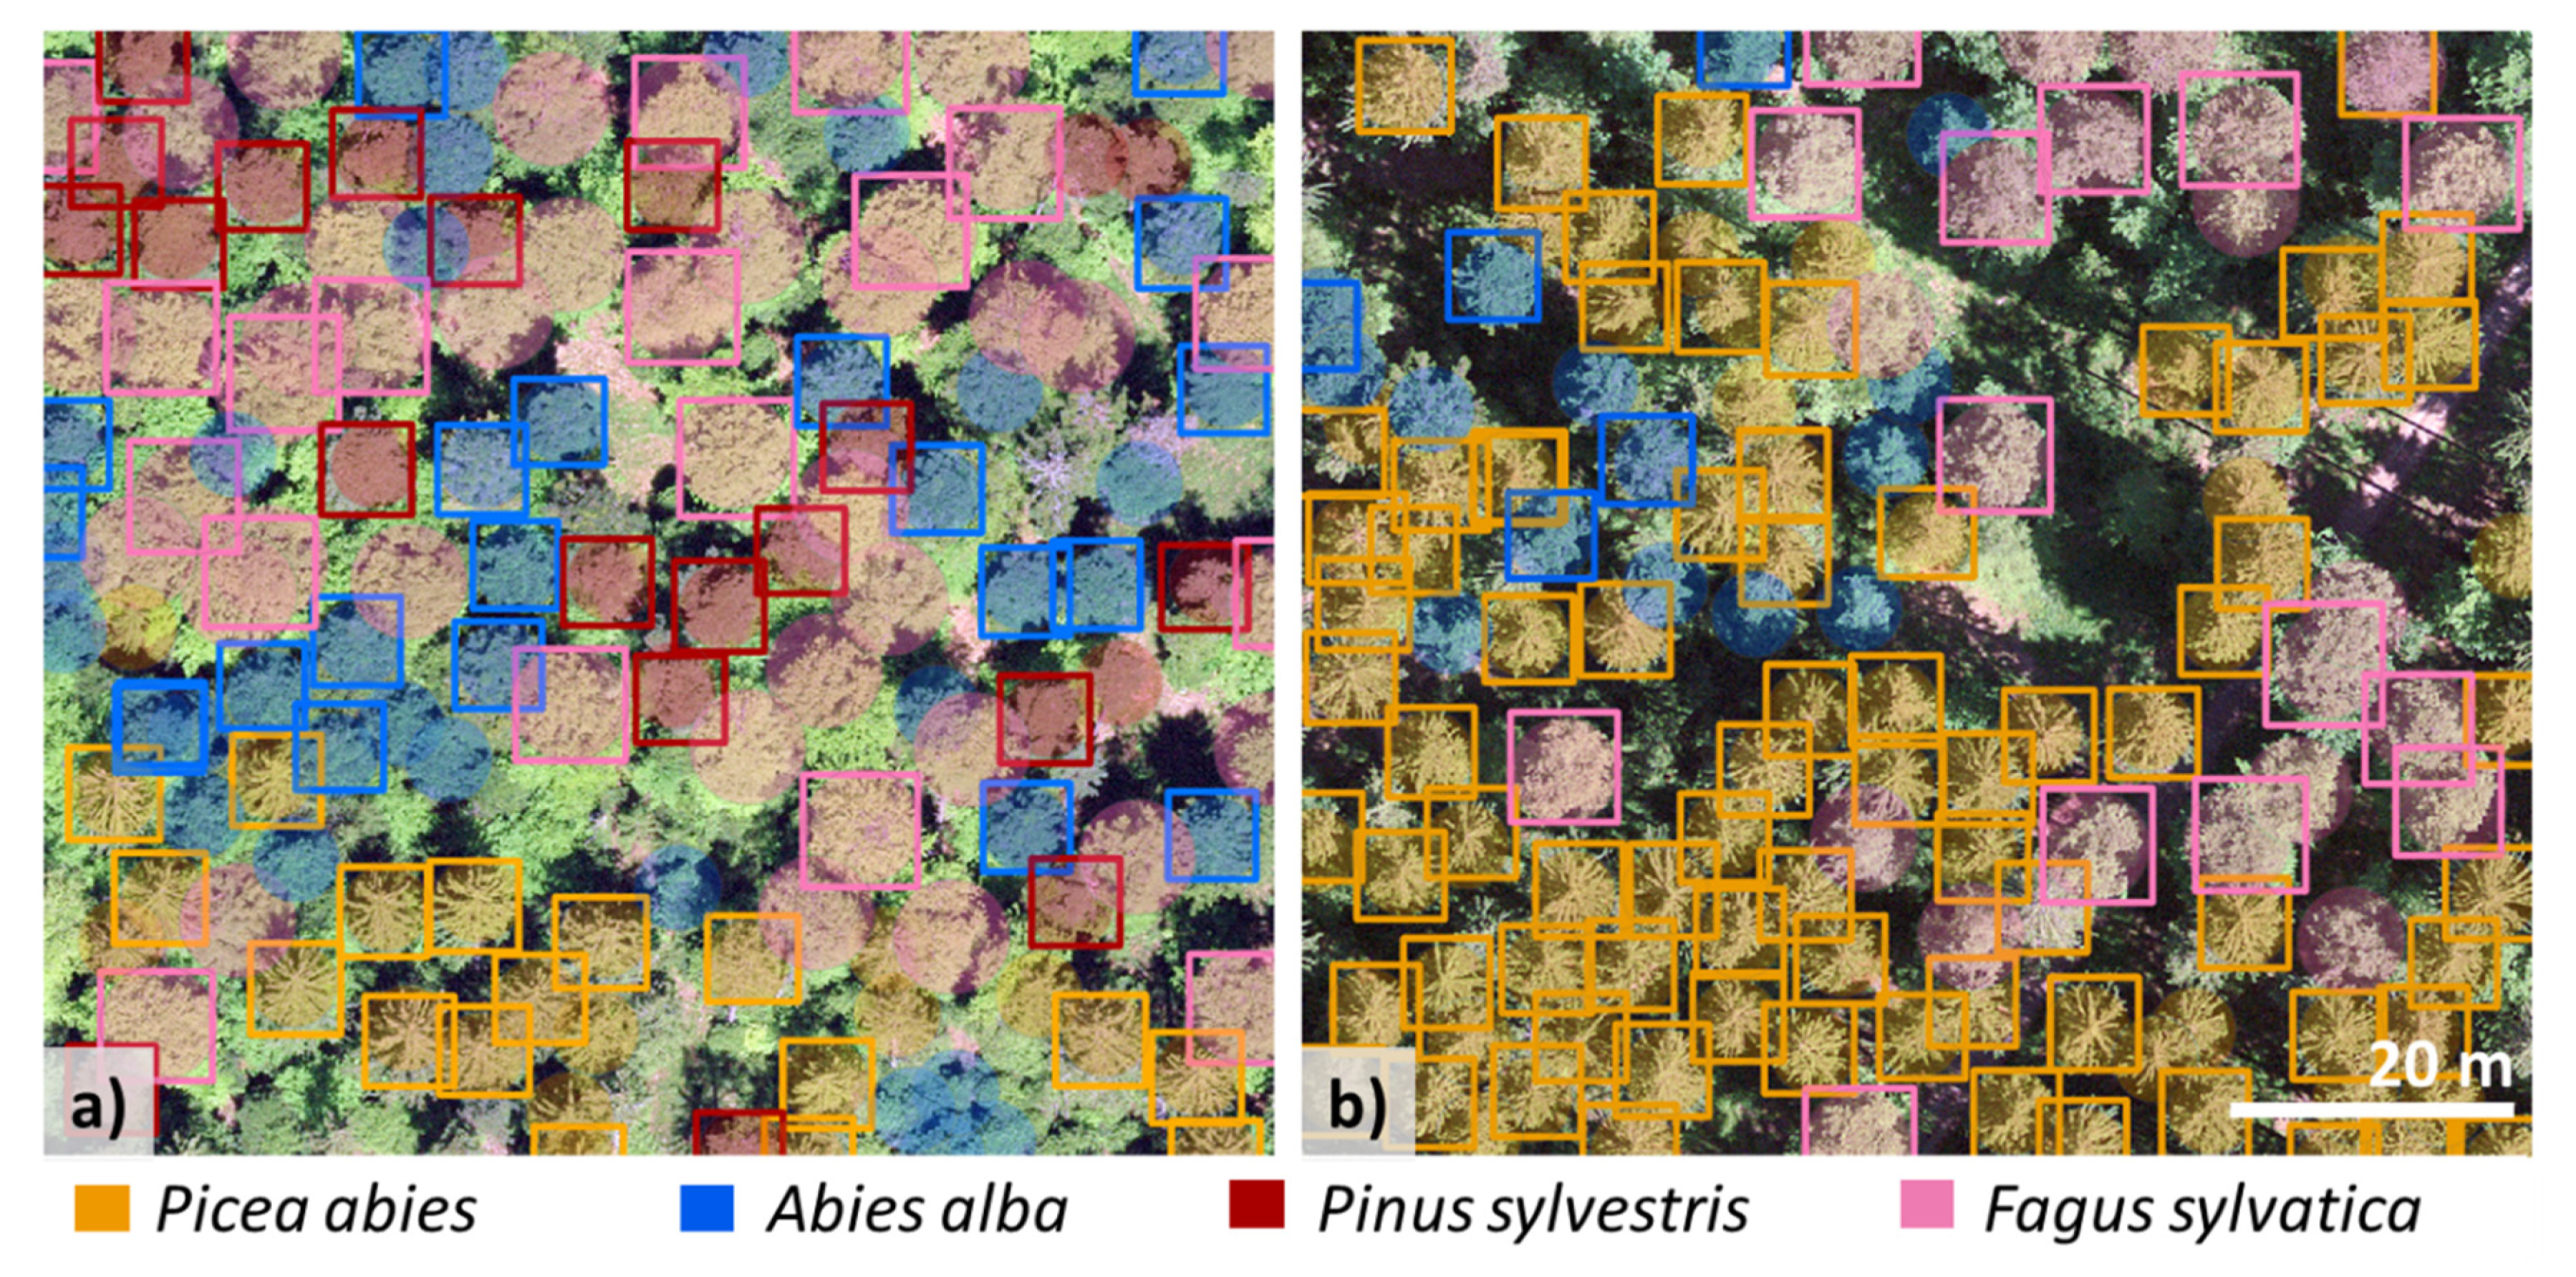
3.3. Effect of Training Data Augmentation and Forest Stand Conditions on Model Performance

For single-species CNN models, data augmentation did not conclusively result in higher F1 scores across all species. The effect of data augmentation was more pronounced for multi-species models than for single-species models. Augmented multi-species models performed better than non-augmented ones for certain species (Table 4).
The influence of tree density and illumination conditions on detection performance was tested for Picea abies. Compared with sites with optimal illumination (average F1 = 0.85, Table 2), the detection performance was slightly lower for heavily shaded sites located on a north-facing slope of ~35° (average F1 = 0.80). The object detection model performed better in mature forest stands with homogeneous density than in stands with heterogeneous density, with a difference in F1 of 0.14. Specifically, younger tree groups were less detected. For example, in a heterogeneous stand (1 ha) with trees of different ages and densities, only three individuals were detected from 25 trees growing in an ~30 × 30 m patch within the test site. As a result, detection accuracy decreased slightly for stands with higher tree density.

4. Discussion

4.1. Significance of the Study

In this study, we demonstrated that it is possible to automatically identify and geolocate four important tree species in heterogeneous temperate forests using a DL object detection approach with a CNN architecture and open-source aerial RGB imagery. The trained Faster R-CNN model applied in this study was both accurate and computationally efficient in identifying and geolocating Picea abies, A. alba, Pinus sylvestris, and F. sylvatica. While labeling the tree species and training the models were time-intensive steps, subsequent model applications could easily build upon the models and the dataset of >10,000 annotated individual trees presented here. Our work represents a first step towards the development of a large tree species database and a deep-learning-based automatic framework for the identification of individual tree species from aerial RGB imagery.

4.2. Performance of CNNs in Detecting Individual Tree Species with Single-Species Models

We found that Picea abies was detected best with the lowest inter-site variability. The overall high Picea abies detection is likely due to its unique radial crown branching pattern [54]. The detection performance of the single-species detection models (Table 2) was similar to that achieved with more common methods that do not offer the same level of information. For example, Schiefer et al. [18] reported a mean F1 score of 0.93 for Picea abies. Further, in our single-species models, the slightly lower F1 scores for Abies alba and F. sylvatica (Table 2) are in accordance with values based on the SDD approach [21], where an F1 score of 0.78 was reported for detecting these species in a wooden pasture based on aerial RGB imagery. The detection of Pinus sylvestris had the lowest F1 score in our single-species detection models, and A. alba was often falsely identified as Pinus sylvestris. Meanwhile, Picea abies was the best-identified species, and only a few trees were misidentified as A. alba. Species misidentification was also observed in a study where a Random Forest classification model was used [55]. In our Faster R-CNN approach, the low detection and high misidentification of Pinus sylvestris in single-species models was most likely the result of the small number of training samples provided.

4.3. Performance of CNNs in Detecting Multiple Tree Species in Multi-Species Models

The multi-species detection models achieved an average accuracy similar to single-species models (F1 scores of 0.73 and 0.74, respectively), but despite the small amount of training data, Pinus sylvestris was the best identified of the four species (Table 2). Fricker et al. [56] likewise found that their segmentation approach based on aerial RGB imagery performed best for the Pinus species compared with other tree species. When considered in combination with other species, the spectral characteristics of Pinus sylvestris trees seem to be advantageous for species identification. As in the single-species models, Picea abies was well detected in multi-species models, while A. alba was the third-best detected species. Schiefer et al. [18] similarly reported a lower A. alba classification compared with Picea abies based on a semantic segmentation approach (U-net). This could indicate the lower suitability of the spectral and structural characteristics of A. alba for CNN applications. A drawback of multi-species models is the slight decrease in recall that can occur compared with single-species models. However, the multi-species CNN models applied here consistently resulted in high precision and low misidentification. High precision was especially prevalent when the model was trained with more tree species.
The multi-species detection approach requires more training time than single-species models, but the advantage is a reduction in the amount of training data required per species and fewer false species detections. In this work, we used an extensive training dataset and developed a model that could be further trained with more data and applied to other regions. In comparison to the tree detection model (recall of 0.69 and precision of 0.61) proposed by Weinstein et al. [20], our CNN models had significantly higher recall and precision values. Thus, these CNN models not only provide better tree detection in general but are also capable of identifying up to four tree species in a natural temperate forest setting. Given that the CNN object detection approach is highly applicable to other regions where the same species occur, it has the potential to become a universal model [25]. Therefore, there is currently intensive research on tree identification using object detection [21,57].

4.4. Model Generalization

The validation of the DL object using the test dataset showed a high generalization capability for the identification and geolocation of the four tree species in heterogeneous forests (Figure 3) and uniformly distributed species-specific performance across all site conditions, species combinations, and years. Similarly, Weinstein et al. [25] reported that RetinaNet object detection with a ResNet-50 backbone has a high generalization capability when detecting individual trees in four different forest types. The data used in our study were collected across different forest types (deciduous, coniferous, and mixed), forest management regimes, areas (nine cantons), terrain conditions (slope and elevation), and growth stages. The aerial RGB orthophotos were acquired over 5 years during the growing season and covered a wide range of illumination conditions. Thus, we conclude that the high generalization capabilities of the CNNs, as indicated by the F1 and the AP values evenly distributed across all sites, are the result of the aerial RGB imagery variations in brightness, contrast, and shadow, due to the different times of day and year when the images were taken and the different site conditions.
The developed CNN models were able to correctly identify many individual trees (TP). Nevertheless, our models were not able to identify all individual trees, specifically, the FN increased with the number of species included in the model (Figure 4). In this case, additional training data, especially phenological information, and further data augmentation could help. Further, to make CNN models and their decision-making process more interpretable, further studies should focus on the explainability of CNN models. As previously demonstrated, species have structural traits which can aid in detection [19].
Heterogeneous training data (e.g., growth stage, forest structure, illumination, season, and year) are highly relevant for improving the accuracy and generalization of CNN models [18,25]. Natesan et al. [58] showed that training CNNs with samples from different years increases classification accuracy by 30%. This can ensure that the CNN models learn the characteristics of tree species that are representative of different site conditions and growth stages. Forest stand conditions, such as foliage density, crown size, and illumination conditions, also contribute to the success of tree species identification [37,59]. Lopatin et al. [2] reported that shadows significantly lowered the prediction accuracies of a maximum-entropy classifier modeling the occurrence of invasive woody species from unmanned aerial vehicle (UAV) imagery. Our results support the large influence of forest stand structure (crown size and tree density) on tree detection, whereas illumination conditions played a less important role in our case. Thus, our findings indicate that low-cost or open-source aerial RGB data can provide a reliable basis for object detection models to identify individual tree species at larger spatial scales.

4.5. Reference Data and Application

In our study, reference data were based on information from forest inventories (i.e., tree stem coordinates, tree height, dbh, and tree species). In addition, the database was inspected visually to ensure the spatially explicit association with the target variable (i.e., tree canopy) on the aerial RGB imagery. Visual interpretation is time-consuming and can lead to misinterpretation; however, given the large amounts of data required for CNNs and the need to obtain highly accurate data, using data from forest inventories and conducting visual inspection seems to be the most efficient and accurate method for collecting reference data. In heterogeneous forests, tree canopies are often clustered, vary in size, and are obscured by the canopies of other tree species, making detection difficult. As a result, the ground-truth data available for this study were of great importance for annotating the trees in training images; the model’s performance decreases when annotations are missing [60]. To avoid missing annotations during object detection, in our study, a smaller image chip (256 × 256 pixels) was used that contained fewer trees. Labels may have been missing, however, especially for smaller objects, and the time lag between the ground-truth and remote sensing data may have affected the performance of the models [60]. To ensure the efficient development of CNN models for the automatic identification of tree species in different forest ecosystems, a tree species database should be considered a priority in the future [61,62].
To improve the current models, further ground-truth data, as well as data augmentation, could be used. In our study, data augmentation required a long computation time, but it resulted in species- and site-specific performance improvements. Similarly, a slight improvement in the robustness of the detector to varying conditions has been reported in other studies [14,63]. Therefore, we believe that the added benefit of data augmentation for tree species detection should be explored further, and additional augmentation methods, such as brightness and contrast variations, should be considered. Moreover, phenology has been reported to be a useful trait for species discrimination [37]. Given the unavailability of the acquisition date for the aerial RGB images in the present study, it was not possible to specifically assess the influence of phenology. Overall, our DL object detection models could be trained further with more RGB data at a different resolution and with phenological information, and they could be applied to other regions. In Switzerland, for example, MeteoSwiss has begun to deploy a national network of geolocated ground-based 360° cameras (e.g., Roundshot Livecams [64]) for assessing phenology, which could be used as additional phenological training datasets.
Our results are essential for decision-making in forestry, ecology, biodiversity monitoring, and conservation. Specifically, they provide data on individual tree species geolocation and counts, which can support the development of species distribution models that rely on species occurrence data for calibration [65,66]. In addition, further applications of these models could include the detection of tree vitality [7,40,67,68] and tree dynamics at the treeline [69,70], as well as the monitoring of pathogens, to generate accurate priority maps for preventive management actions.

5. Conclusions

In this study, we evaluated the potential of Faster R-CNN for highly automated tree-crown detection and tree species identification in heterogeneous forests based on publicly available high-resolution aerial RGB imagery. Our models performed well in identifying the four major tree species Picea abies, A. alba, Pinus sylvestris, and F. sylvatica. Further, training the Faster R-CNN model for multi-species identification decreased species misidentification and yielded improved results for species detection, particularly for underrepresented species. Our CNN models could therefore support an automatic tree inventory of the upper layer of heterogeneous forests, including tree species identity, count, and geolocation, using only low-cost or open-source aerial RGB imagery. In addition, our models could complement traditional field-based tree inventories in heterogeneous forests, thereby reducing the need for intensive field surveys.
This highly automatic and accessible approach for streamlining four-tree species identification and geolocation can be universally applied where overhead aerial RGB imagery is available. The tree species database created here (of >10,000 annotated individual trees) is available online and could be used for further model development. Given the growing interest in forest resilience and maintenance of forest ecosystem services in a rapidly changing climate, the CNN object detection models presented here could be useful to support the above goals. Moreover, with further improvements and the addition of more tree species, these models could become a promising tool for universal tree species identification in heterogeneous forests.

Author Contributions

M.B.: conceptualization, analysis, writing—original draft; L.H.: data curation, analysis, writing—review and editing; N.R.: writing—review and editing; A.G.: writing—review and editing; V.C.G.: supervision. All authors have read and agreed to the published version of the manuscript.

Funding

This research did not receive any specific grant from funding agencies in the public, commercial, or not-for-profit sectors.

Data Availability Statement

The RGB orthophotos are open source (see Methods). The CNN model weights and training data are available online at: https://doi.org/10.5281/zenodo.7528566.

Acknowledgments

We thank Melissa Dawes for help editing the manuscript and Christoph Fischer from the Swiss Federal Institute for Forest, Snow and Landscape Research (WSL), and the Swiss Long-term Forest Ecosystem Research program LWF (www.lwf.ch), which is part of the UNECE Co-operative Programme on Assessment and Monitoring of Air Pollution Effects on Forests (ICP Forests, www.icp-forests.net) for providing the ground-truth datasets which laid the foundation for this work. Additionally, we acknowledge Raffael Bienz for providing the Arborizer data, which further enriched the ground-truth dataset.

Conflicts of Interest

The authors declare that they have no known competing financial interests or personal relationships that could have appeared to influence the work reported in this paper.

References

  1. FAO; UNEP. The State of the World’s Forests 2020: Forests, Biodiversity and People, The State of the World’s Forests (SOFO); FAO: Rome, Italy; UNEP: Rome, Italy, 2020; ISBN 978-92-5-132419-6. [Google Scholar]
  2. Lopatin, J.; Dolos, K.; Kattenborn, T.; Fassnacht, F. How canopy shadow affects invasive plant species classification in high spatial resolution remote sensing. Remote Sens. Ecol. Conserv. 2019, 5, 302–317. [Google Scholar] [CrossRef]
  3. Shang, X.; Chisholm, L.A. Classification of Australian Native Forest Species Using Hyperspectral Remote Sensing and Machine-Learning Classification Algorithms. IEEE J. Sel. Top. Appl. Earth Obs. Remote. Sens. 2013, 7, 2481–2489. [Google Scholar] [CrossRef]
  4. Neuner, S.; Albrecht, A.; Cullmann, D.; Engels, F.; Griess, V.C.; Hahn, W.A.; Hanewinkel, M.; Härtl, F.; Kölling, C.; Staupendahl, K.; et al. Survival of Norway spruce remains higher in mixed stands under a dryer and warmer climate. Glob. Chang. Biol. 2015, 21, 935–946. [Google Scholar] [CrossRef] [PubMed] [Green Version]
  5. Härtl, F.H.; Barka, I.; Hahn, W.A.; Hlásny, T.; Irauschek, F.; Knoke, T.; Lexer, M.J.; Griess, V. Multifunctionality in European mountain forests—An optimization under changing climatic conditions. Can. J. For. Res. 2016, 46, 163–171. [Google Scholar] [CrossRef] [Green Version]
  6. Sylvain, J.-D.; Drolet, G.; Brown, N. Mapping dead forest cover using a deep convolutional neural network and digital aerial photography. ISPRS J. Photogramm. Remote Sens. 2019, 156, 14–26. [Google Scholar] [CrossRef]
  7. Șandric, I.; Irimia, R.; Petropoulos, G.P.; Anand, A.; Srivastava, P.K.; Pleșoianu, A.; Faraslis, I.; Stateras, D.; Kalivas, D. Tree’s detection & health’s assessment from ultra-high resolution UAV imagery and deep learning. Geocarto. Int. 2022, 37, 10459–10479. [Google Scholar] [CrossRef]
  8. de Lima, R.A.F.; Phillips, O.L.; Duque, A.; Tello, J.S.; Davies, S.J.; de Oliveira, A.A.; Muller, S.; Honorio Coronado, E.N.H.; Vilanova, E.; Cuni-Sanchez, A.; et al. Making forest data fair and open. Nat. Ecol. Evol. 2022, 6, 656–658. [Google Scholar] [CrossRef]
  9. Lechner, A.M.; Foody, G.M.; Boyd, D.S. Applications in Remote Sensing to Forest Ecology and Management. One Earth 2020, 2, 405–412. [Google Scholar] [CrossRef]
  10. Achim, A.; Moreau, G.; Coops, N.C.; Axelson, J.N.; Barrette, J.; Bédard, S.; E Byrne, K.; Caspersen, J.; Dick, A.R.; D’Orangeville, L.; et al. The changing culture of silviculture. For. Int. J. For. Res. 2021, 95, 143–152. [Google Scholar] [CrossRef]
  11. Cavender-Bares, J.; Schneider, F.D.; Santos, M.J.; Armstrong, A.; Carnaval, A.; Dahlin, K.M.; Fatoyinbo, L.; Hurtt, G.C.; Schimel, D.; Townsend, P.A.; et al. Integrating remote sensing with ecology and evolution to advance biodiversity conservation. Nat. Ecol. Evol. 2022, 6, 506–519. [Google Scholar] [CrossRef]
  12. Waser, L.T.; Rüetschi, M.; Psomas, A.; Small, D.; Rehush, N. Mapping dominant leaf type based on combined Sentinel-1/-2 data–Challenges for mountainous countries. ISPRS J. Photogramm. Remote. Sens. 2021, 180, 209–226. [Google Scholar] [CrossRef]
  13. Brodrick, P.G.; Davies, A.B.; Asner, G.P. Uncovering Ecological Patterns with Convolutional Neural Networks. Trends Ecol. Evol. 2019, 34, 734–745. [Google Scholar] [CrossRef] [PubMed]
  14. Kattenborn, T.; Leitloff, J.; Schiefer, F.; Hinz, S. Review on Convolutional Neural Networks (CNN) in vegetation remote sensing. ISPRS J. Photogramm. Remote Sens. 2021, 173, 24–49. [Google Scholar] [CrossRef]
  15. Hoeser, T.; Kuenzer, C. Object Detection and Image Segmentation with Deep Learning on Earth Observation Data: A Review-Part I: Evolution and Recent Trends. Remote Sens. 2020, 12, 1667. [Google Scholar] [CrossRef]
  16. Katal, N.; Rzanny, M.; Mäder, P.; Wäldchen, J. Deep Learning in Plant Phenological Research: A Systematic Literature Review. Front. Plant Sci. 2022, 13, 805738. [Google Scholar] [CrossRef] [PubMed]
  17. Kattenborn, T.; Eichel, J.; Fassnacht, F.E. Convolutional Neural Networks enable efficient, accurate and fine-grained segmentation of plant species and communities from high-resolution UAV imagery. Sci. Rep. 2019, 9, 17656. [Google Scholar] [CrossRef] [Green Version]
  18. Schiefer, F.; Kattenborn, T.; Frick, A.; Frey, J.; Schall, P.; Koch, B.; Schmidtlein, S. Mapping forest tree species in high resolution UAV-based RGB-imagery by means of convolutional neural networks. ISPRS J. Photogramm. Remote Sens. 2020, 170, 205–215. [Google Scholar] [CrossRef]
  19. Onishi, M.; Ise, T. Explainable identification and mapping of trees using UAV RGB image and deep learning. Sci. Rep. 2021, 11, 903. [Google Scholar] [CrossRef]
  20. Weinstein, B.G.; Marconi, S.; Bohlman, S.; Zare, A.; White, E. Individual Tree-Crown Detection in RGB Imagery Using Semi-Supervised Deep Learning Neural Networks. Remote Sens. 2019, 11, 1309. [Google Scholar] [CrossRef] [Green Version]
  21. Pleșoianu, A.-I.; Stupariu, M.-S.; Șandric, I.; Pătru-Stupariu, I.; Drăguț, L. Individual Tree-Crown Detection and Species Classification in Very High-Resolution Remote Sensing Imagery Using a Deep Learning Ensemble Model. Remote Sens. 2020, 12, 2426. [Google Scholar] [CrossRef]
  22. Chadwick, A.J.; Goodbody, T.R.H.; Coops, N.C.; Hervieux, A.; Bater, C.W.; Martens, L.A.; White, B.; Röeser, D. Automatic Delineation and Height Measurement of Regenerating Conifer Crowns under Leaf-Off Conditions Using UAV Imagery. Remote Sens. 2020, 12, 4104. [Google Scholar] [CrossRef]
  23. Lumnitz, S.; Devisscher, T.; Mayaud, J.R.; Radic, V.; Coops, N.C.; Griess, V.C. Mapping trees along urban street networks with deep learning and street-level imagery. ISPRS J. Photogramm. Remote Sens. 2021, 175, 144–157. [Google Scholar] [CrossRef]
  24. Yan, S.; Jing, L.; Wang, H. A New Individual Tree Species Recognition Method Based on a Convolutional Neural Network and High-Spatial Resolution Remote Sensing Imagery. Remote Sens. 2021, 13, 479. [Google Scholar] [CrossRef]
  25. Weinstein, B.G.; Marconi, S.; Bohlman, S.A.; Zare, A.; White, E.P. Cross-site learning in deep learning RGB tree crown detection. Ecol. Inform. 2020, 56, 101061. [Google Scholar] [CrossRef]
  26. Lin, T.-Y.; Goyal, P.; Girshick, R.; He, K.; Dollár, P. Focal Loss for Dense Object Detection. In Proceedings of the 2017 IEEE International Conference on Computer Vision (ICCV), Venice, Italy, 22–29 October 2017; pp. 2999–3007. [Google Scholar]
  27. Redmon, J.; Divvala, S.; Girshick, R.; Farhadi, A. You Only Look Once: Unified, Real-Time Object Detection. In Proceedings of the IEEE Conference on Computer Vision and Pattern Recognition, Las Vegas, NV, USA, 26 June–1 July 2016. [Google Scholar]
  28. Liu, W.; Anguelov, D.; Erhan, D.; Szegedy, C.; Reed, S.; Fu, C.-Y.; Berg, A.C. SSD: Single Shot Multibox Detector. In Proceedings of the Computer Vision–ECCV 2016: 14th European Conference, Amsterdam, NY, USA, 11–14 October 2016; Volume 9905, pp. 21–37. [Google Scholar]
  29. Ren, S.; He, K.; Girshick, R.; Sun, J. Faster R-CNN: Towards real-time object detection with region proposal networks. IEEE Trans. Pattern Anal. Mach. Intell. 2017, 39, 1137–1149. [Google Scholar] [CrossRef] [Green Version]
  30. Dos Santos, A.A.; Marcato Junior, J.; Araújo, M.S.; Di Martini, D.R.; Tetila, E.C.; Siqueira, H.L.; Aoki, C.; Eltner, A.; Matsubara, E.T.; Pistori, H.; et al. Assessment of CNN-Based Methods for Individual Tree Detection on Images Captured by RGB Cameras Attached to UAVs. Sensors 2019, 19, 3595. [Google Scholar] [CrossRef] [Green Version]
  31. Parvathi, S.; Selvi, S.T. Detection of maturity stages of coconuts in complex background using Faster R-CNN model. Biosyst. Eng. 2021, 202, 119–132. [Google Scholar] [CrossRef]
  32. Osco, L.P.; Arruda, M.D.S.D.; Marcato Junior, J.; da Silva, N.B.; Ramos, A.P.M.; Moryia, A.S.; Imai, N.N.; Pereira, D.R.; Creste, J.E.; Matsubara, E.; et al. A convolutional neural network approach for counting and geolocating citrus-trees in UAV multispectral imagery. ISPRS J. Photogramm. Remote Sens. 2020, 160, 97–106. [Google Scholar] [CrossRef]
  33. Li, Y.; Tang, B.; Li, J.; Sun, W.; Lin, Z.; Luo, Q. Research on Common Tree Species Recognition by Faster R-CNN Based on Whole Tree Image. In Proceedings of the 2021 IEEE 6th International Conference on Signal and Image Processing (ICSIP), Nanjing, China, 9–11 July 2021; pp. 28–32. [Google Scholar]
  34. Zamboni, P.; Junior, J.; Silva, J.; Miyoshi, G.; Matsubara, E.; Nogueira, K.; Gonçalves, W. Benchmarking Anchor-Based and Anchor-Free State-of-the-Art Deep Learning Methods for Individual Tree Detection in RGB High-Resolution Images. Remote Sens. 2021, 13, 2482. [Google Scholar] [CrossRef]
  35. Zhang, C.; Atkinson, P.M.; George, C.; Wen, Z.; Diazgranados, M.; Gerard, F. Identifying and mapping individual plants in a highly diverse high-elevation ecosystem using UAV imagery and deep learning. ISPRS J. Photogramm. Remote Sens. 2020, 169, 280–291. [Google Scholar] [CrossRef]
  36. Zhang, C.; Zhou, J.; Wang, H.; Tan, T.; Cui, M.; Huang, Z.; Wang, P.; Zhang, L. Multi-Species Individual Tree Segmentation and Identification Based on Improved Mask R-CNN and UAV Imagery in Mixed Forests. Remote Sens. 2022, 14, 874. [Google Scholar] [CrossRef]
  37. Fassnacht, F.E.; Latifi, H.; Stereńczak, K.; Modzelewska, A.; Lefsky, M.; Waser, L.T.; Straub, C.; Ghosh, A. Review of studies on tree species classification from remotely sensed data. Remote Sens. Environ. 2016, 186, 64–87. [Google Scholar] [CrossRef]
  38. Jaskierniak, D.; Lucieer, A.; Kuczera, G.; Turner, D.; Lane, P.; Benyon, R.; Haydon, S. Individual tree detection and crown delineation from Unmanned Aircraft System (UAS) LiDAR in structurally complex mixed species eucalypt forests. ISPRS J. Photogramm. Remote Sens. 2020, 171, 171–187. [Google Scholar] [CrossRef]
  39. La Rosa, L.E.C.; Sothe, C.; Feitosa, R.Q.; de Almeida, C.M.; Schimalski, M.B.; Oliveira, D.A.B. Multi-task fully convolutional network for tree species mapping in dense forests using small training hyperspectral data. ISPRS J. Photogramm. Remote Sens. 2021, 179, 35–49. [Google Scholar] [CrossRef]
  40. Ecke, S.; Dempewolf, J.; Frey, J.; Schwaller, A.; Endres, E.; Klemmt, H.-J.; Tiede, D.; Seifert, T. UAV-Based Forest Health Monitoring: A Systematic Review. Remote Sens. 2022, 14, 3205. [Google Scholar] [CrossRef]
  41. Swisstopo SwissBOUNDARIES3D. Available online: https://www.swisstopo.admin.ch/en/geodata/landscape/boundaries3d.html (accessed on 22 February 2022).
  42. Beck, H.E.; Zimmermann, N.E.; McVicar, T.R.; Vergopolan, N.; Berg, A.; Wood, E.F. Present and future Köppen-Geiger climate classification maps at 1-km resolution. Sci. Data 2018, 5, 180214. [Google Scholar] [CrossRef] [Green Version]
  43. Rigling, A.; Schaffer, H.P. Forest Report Condition and Use of Swiss Forests; Federal Office for the Environment FOEN; Swiss Federal Institute for Forest; Snow and Landscape Reseach WSL: Bern, Birmensdorf, 2015; p. 145. [Google Scholar]
  44. Swisstopo SWISSIMAGE10cm. Available online: https://www.swisstopo.admin.ch/de/geodata/images/ortho/swissimage10.html (accessed on 7 April 2022).
  45. Lin, T.-Y.; Maire, M.; Belongie, S.; Hays, J.; Perona, P.; Ramanan, D.; Dollár, P.; Zitnick, C.L. Microsoft COCO: Common Objects in Context. In Computer Vision, Proceedings of the ECCV 2014, Zurich, Switzerland, 6–12 September 2014; Fleet, D., Pajdla, T., Schiele, B., Tuytelaars, T., Eds.; Springer International Publishing: Cham, Switzerland, 2014; pp. 740–755. [Google Scholar]
  46. Geiger, A.; Lenz, P.; Urtasun, R. Are We Ready for Autonomous Driving? The KITTI Vision Benchmark Suite. In Proceedings of the 2012 IEEE Conference on Computer Vision and Pattern Recognition, Providence, RI, USA, 16–21 June 2012; pp. 3354–3361. [Google Scholar]
  47. Kuznetsova, A.; Rom, H.; Alldrin, N.; Uijlings, J.; Krasin, I.; Pont-Tuset, J.; Kamali, S.; Popov, S.; Malloci, M.; Kolesnikov, A.; et al. The Open Images Dataset V. Int. J. Comput. Vis. 2020, 128, 1956–1981. [Google Scholar] [CrossRef] [Green Version]
  48. Bienz, R. Tree Species Segmentation and Classification Algorithm for SwissimageRS 2018 (Swisstopo) 2021. Available online: https://github.com/RaffiBienz/arborizer (accessed on 18 February 2021).
  49. LWF Long-Term Forest Ecosystem Research (LWF)-WSL. Available online: https://www.wsl.ch/en/about-wsl/programmes-and-initiatives/long-term-forest-ecosystem-research-lwf.html (accessed on 3 February 2022).
  50. WSL Swiss National Forest Inventory (NFI), Data of Survey 2009/2017. 11–15 2021-Nataliia Rehush-DL1342 Swiss Federal Institute for Forest, Snow and Landscape Research WSL, Birmensdorf. Available online: https://lfi.ch/index-en.php (accessed on 5 September 2022).
  51. Correia, D.L.P.; Bouachir, W.; Gervais, D.; Pureswaran, D.; Kneeshaw, D.D.; De Grandpre, L. Leveraging Artificial Intelligence for Large-Scale Plant Phenology Studies from Noisy Time-Lapse Images. IEEE Access 2020, 8, 13151–13160. [Google Scholar] [CrossRef]
  52. Puliti, S.; Astrup, R. Automatic detection of snow breakage at single tree level using YOLOv5 applied to UAV imagery. Int. J. Appl. Earth Obs. Geoinf. 2022, 112, 102946. [Google Scholar] [CrossRef]
  53. Choi, K.; Lim, W.; Chang, B.; Jeong, J.; Kim, I.; Park, C.-R.; Ko, D.W. An automatic approach for tree species detection and profile estimation of urban street trees using deep learning and Google street view images. ISPRS J. Photogramm. Remote. Sens. 2022, 190, 165–180. [Google Scholar] [CrossRef]
  54. Brandtberg, T. Towards structure-based classification of tree crowns in high spatial resolution aerial images. Scand. J. For. Res. 1997, 12, 89–96. [Google Scholar] [CrossRef]
  55. Immitzer, M.; Vuolo, F.; Atzberger, C. First Experience with Sentinel-2 Data for Crop and Tree Species Classifications in Central Europe. Remote Sens. 2016, 8, 166. [Google Scholar] [CrossRef]
  56. Fricker, G.A.; Ventura, J.D.; Wolf, J.A.; North, M.P.; Davis, F.W.; Franklin, J. A Convolutional Neural Network Classifier Identifies Tree Species in Mixed-Conifer Forest from Hyperspectral Imagery. Remote Sens. 2019, 11, 2326. [Google Scholar] [CrossRef] [Green Version]
  57. Weinstein, B.G.; Marconi, S.; A Bohlman, S.; Zare, A.; Singh, A.; Graves, S.J.; White, E.P. A Remote Sensing Derived Data Set of 100 Million Individual Tree Crowns for the National Ecological Observatory Network. eLife 2021, 10, e62922. [Google Scholar] [CrossRef] [PubMed]
  58. Natesan, S.; Armenakis, C.; Vepakomma, U. Resnet-based tree species classification using uav images. ISPRS-Int. Arch. Photogramm. Remote. Sens. Spat. Inf. Sci. 2019, XLII-2/W13, 475–481. [Google Scholar] [CrossRef] [Green Version]
  59. Korpela, I.; Mehtätalo, L.; Markelin, L.; Seppänen, A.; Kangas, A. Tree species identification in aerial image data using directional reflectance signatures. Silva Fenn. 2014, 48, 1087. [Google Scholar] [CrossRef] [Green Version]
  60. Xu, M.; Bai, Y.; Ghanem, B. Missing Labels in Object Detection. CVPR Workshops 2019, 3, 5. [Google Scholar]
  61. Lines, E.R.; Allen, M.; Cabo, C.; Calders, K.; Debus, A.; Grieve, S.W.D.; Miltiadou, M.; Noach, A.; Owen, H.J.F.; Puliti, S. AI applications in forest monitoring need remote sensing benchmark datasets. arXiv 2022, arXiv:2212.09937. [Google Scholar] [CrossRef]
  62. Ahlswede, S.; Schulz, C.; Gava, C.; Helber, P.; Bischke, B.; Förster, M.; Arias, F.; Hees, J.; Demir, B.; Kleinschmit, B. TreeSatAI Benchmark Archive: A multi-sensor, multi-label dataset for tree species classification in remote sensing. Earth Syst. Sci. Data 2023, 15, 1–22. [Google Scholar] [CrossRef]
  63. Deng, Z.; Sun, H.; Zhou, S.; Zhao, J.; Lei, L.; Zou, H. Multi-scale object detection in remote sensing imagery with convolutional neural networks. ISPRS J. Photogramm. Remote. Sens. 2018, 145, 3–22. [Google Scholar] [CrossRef]
  64. Roundshot 360 Degree Webcam in Verschiedenen Anwendungen (360 Degree Webcam in Various Applications). Available online: https://www.roundshot.com/xml_1/internet/en/application/d170/f172.cfm (accessed on 5 September 2022).
  65. Pearse, G.D.; Tan, A.Y.S.; Watt, M.S.; Franz, M.O.; Dash, J.P. Detecting and mapping tree seedlings in UAV imagery using convolutional neural networks and field-verified data. ISPRS J. Photogramm. Remote. Sens. 2020, 168, 156–169. [Google Scholar] [CrossRef]
  66. Randin, C.F.; Ashcroft, M.B.; Bolliger, J.; Cavender-Bares, J.; Coops, N.C.; Dullinger, S.; Dirnböck, T.; Eckert, S.; Ellis, E.; Fernández, N.; et al. Monitoring biodiversity in the Anthropocene using remote sensing in species distribution models. Remote Sens. Environ. 2020, 239, 111626. [Google Scholar] [CrossRef]
  67. Beloiu, M.; Stahlmann, R.; Beierkuhnlein, C. Drought impacts in forest canopy and deciduous tree saplings in Central European forests. For. Ecol. Manag. 2022, 509, 120075. [Google Scholar] [CrossRef]
  68. Kälin, U.; Lang, N.; Hug, C.; Gessler, A.; Wegner, J.D. Defoliation estimation of forest trees from ground-level images. Remote Sens. Environ. 2019, 223, 143–153. [Google Scholar] [CrossRef]
  69. Beloiu, M.; Poursanidis, D.; Hoffmann, S.; Chrysoulakis, N.; Beierkuhnlein, C. Using High Resolution Aerial Imagery and Deep Learning to Detect Tree Spatio-Temporal Dynamics at the Treeline. In Proceedings of the EGU General Assembly Conference Abstracts, Virtually, 19–30 April 2021; p. EGU21-14548. [Google Scholar] [CrossRef]
  70. Beloiu, M.; Poursanidis, D.; Tsakirakis, A.; Chrysoulakis, N.; Hoffmann, S.; Lymberakis, P.; Barnias, A.; Kienle, D.; Beierkuhnlein, C. No treeline shift despite climate change over the last 70 years. For. Ecosyst. 2022, 9, 100002. [Google Scholar] [CrossRef]
Figure 1. Map of the study area (light green color) and aerial RGB imagery of four of the 1-ha test sites (14) and the four tree species (ad).
Remotesensing 15 01463 g001
Figure 2. Workflow of the Convolutional Neural Network (CNN) object detection approach for automatic tree species identification and geolocation using aerial RGB imagery. Spruce = Picea abies, fir = Abies alba, pine = Pinus sylvestris, and beech = Fagus sylvatica. The light green shaded boxes represent the models developed for single-tree-species and multi-tree-species detection.
Remotesensing 15 01463 g002
Figure 3. Average detection accuracy grouped by species. (a) F1 score for each species and (b) accuracy metrics based on single-species models; (c) F1 score for multi-species detection and (d) accuracy metrics across all tree species, test sites, and multi-species models. AP = average precision.
Remotesensing 15 01463 g003
Figure 4. Confusion matrices for (a) single-species detection models and (b) multi-species detection models. Reference data are the true species, FN = false negative. The values are normalized based on the percentage of the total value of each class. Spruce = Picea abies, fir = Abies alba, pine = Pinus sylvestris, and beech = Fagus sylvatica.
Remotesensing 15 01463 g004
Figure 5. Detection of the trained Convolutional Neural Network (CNN) on test sites. (a) Aerial RGB imagery, (b) manually identified tree species, (c) CNN object detection, showing 40 × 60 m of the test sites for illustrative purposes.
Remotesensing 15 01463 g005
Figure 6. Multi-species detection model for the two (1-ha) example test sites. (a) Test site 2, F1 score 0.74 and (b) test site 3, F1 score 0.78. Bounding boxes = detected trees, filled circles = ground-truth data.
Remotesensing 15 01463 g006
Table 1. The analyzed tree species and the corresponding training, validation, and test data.
Scientific NameCommon NameTrainingValidationTestTotal
Picea abiesNorway spruce31133464973956
Abies albaSilver fir21372381282503
Pinus sylvestrisScots pine5396026625
Fagus sylvaticaEuropean beech37634181724353
Total 9552106282311,437
Table 2. Single-species model (non-augmented data) detection accuracy for an intersection over union (IoU) threshold of 0.5. AP = average precision, TP = true positive, FP = false positive, FN = false negative. Detected sp. = detected species, spruce = Picea abies, fir = Abies alba, pine = Pinus sylvestris, and beech = Fagus sylvatica.
ModelDetected sp.PrecisionRecallF1 ScoreAPTPFPFN
SpruceSpruce0.930.800.860.781891548
FirFir0.810.860.840.781102518
PinePine0.500.730.590.5719197
BeechBeech0.770.740.750.641263846
Table 3. Accuracy assessment of Faster R-CNN for multi-species detection across test sites and species. AP = average precision, TP = true positive, FP = false positive, FN = false negative, and Detected sp. = detected species. Spruce = Picea abies, fir = Abies alba, pine = Pinus sylvestris, and beech = Fagus sylvatica.
ModelDetected sp.PrecisionRecallF1 ScoreAPTPFPFN
Spruce-firSpruce0.910.790.850.771881849
Fir0.940.380.540.3749379
Spruce-fir-pineSpruce0.960.680.790.66160677
Fir0.830.630.720.58811747
Pine1.000.850.920.852204
Spruce-fir-beechSpruce0.940.800.860.781891248
Fir0.950.440.600.4256372
Beech0.970.400.560.39662105
Spruce-fir-pine-beechSpruce0.990.630.770.63150187
Fir1.000.380.550.3848080
Pine0.960.880.920.882313
Beech0.930.300.460.29524121
Table 4. Average F1 score for multi-species detection across test sites for an intersection over union (IoU) threshold of 0.5. Non-aug = non-augmented and aug = augmented training data. Spruce = Picea abies, fir = Abies alba, pine = Pinus sylvestris, and beech = Fagus sylvatica.
ModelSpruce-FirSpruce-Fir-PineSpruce-Fir-BeechSpruce-Fir-Pine-Beech
Non-AugAugNon-AugAugNon-AugAugNon-AugAug
All species0.700.810.810.690.680.710.670.73
Spruce0.850.870.790.670.860.860.770.85
Fir0.540.740.720.650.600.750.550.80
Pine--0.920.84--0.920.39
Beech----0.550.370.460.49
Disclaimer/Publisher’s Note: The statements, opinions and data contained in all publications are solely those of the individual author(s) and contributor(s) and not of MDPI and/or the editor(s). MDPI and/or the editor(s) disclaim responsibility for any injury to people or property resulting from any ideas, methods, instructions or products referred to in the content.

