Article

Evaluating Characteristics of an Active Coastal Spreading Area Combining Geophysical Data with Satellite, Aerial, and Unmanned Aerial Vehicles Images

1
Department of Geosciences, University of Malta, MSD2080 Msida, Malta
2
Research & Planning Unit, Ministry for Public Works and Planning, Project House, Triq Francesco Buonamici, FRN1700 Floriana, Malta
3
Dipartimento di Scienze della Terra e Centro di Ricerca per i Rischi Geologici CERI, University of Rome “La Sapienza”, 000100 Rome, Italy
4
Department of Communications & Computer Engineering, Faculty of Information and Communication Technology, University of Malta, MSD2080 Msida, Malta
*
Author to whom correspondence should be addressed.
Remote Sens. 2023, 15(5), 1465; https://doi.org/10.3390/rs15051465
Submission received: 4 January 2023 / Revised: 24 February 2023 / Accepted: 3 March 2023 / Published: 6 March 2023

Abstract

:
The northern region of the Maltese archipelago is experiencing lateral spreading landslide processes. This region is characterized by cliffs with a hard coralline limestone outcropping layer sitting on a thick layer of clay. Such a geological configuration causes coastal instability that results in lateral spreading which predispose to rockfalls and topplings all over the cliff slopes. The aim of this research was to develop a methodology for evaluating cliff erosion/retreat using the integration of geomatics and geophysical techniques. Starting from a 3D digital model of the Selmun promontory, generated by unmanned aerial vehicle (UAV) photogrammetry, it was possible to map the fractures and conduct geophysical measurements such as electrical resistivity tomography and ground penetrating radar for the identification and mapping of vertical fractures affecting the hard coralline limestone plateau, and to create a 3D geological model of the study area. In addition to this, high-accuracy orthophotos from UAV that were captured between 1957 and 2021 were georeferenced into a GIS and compared to aerial and satellite images. The movement and evolution of boulders and cracks in rocks were then vectorized to highlight, track and quantify the phenomenon through time. The results were used to derive a qualitative assessment of the coastal variations in the geometric properties of the exposed discontinuity surfaces to evaluate the volumes and the stop points of the observed rockfalls. The outcomes of this research were finally imported in a GIS which offers an easy approach for the collection and processing of coastal monitoring data. In principle, such a system could help local authorities to address social, economic and environmental issues of pressing importance as well as facilitate effective planning in view of a risk mitigation strategy.

1. Introduction

During the last few years, in-depth studies on the impact of coastal erosion have been closely linked to those determined by the scenarios hypothesised for climate change which predict an extremity of natural events and a rise in sea level. These elements can work in ‘synergy’ with erosion caused by anthropogenic causes. The coastal area is an economic resource as it represents the area with the highest density of settlements and human activities. The Maltese coast is a natural tourist destination that attracts many tourists to the islands and this leads to intense urbanisation in these areas. Since the 1970s, in Malta, there has been an increase in coastal urban settlements. This has increased the importance of the tourism sector, which has become a pillar of the Maltese economy. It is essential to balance the promotion of tourism activities while at the same time safeguard the cultural, historical and naturalistic heritage of the Maltese archipelago. To remedy this, a set of multidisciplinary activities need to be undertaken. These activities in the fields of engineering, geology, history and archaeology harmonise with each other to obtain techniques and procedures that help to achieve a balance between cultural and natural heritage [1,2]. Overall, the vulnerable assets in coastal areas are represented by protected areas or areas of high naturalistic value, infrastructures (often strategic land-based ones such as roads or industrial settlements, or those deployed in the marine environment such as fish farms which are often located in transition environments whose particular characteristics can be put at risk by coastal erosion), urban settlements, sites of cultural interest and economic activities related to tourism. The geological context, the coastal configuration and the exposure to weathering phenomena are important components in the behaviour of the erosional processes. Landslides affecting the high coasts present a significant geohazard and are generally classified into a range of landslide mechanisms [3], including planar and wedge rock sliding, rock toppling, lateral spreading, roto-translational sliding and debris sliding. The overlapping of stiff rocks and ductile clays is the common cause of several of these types of mechanisms [4], as a consequence of the different rheological behaviours, as well as of the mechanical properties responsible for differentiated erosional effects. In particular, rockfalls are fast-moving landslides which occur if a rock block originally projecting from a vertical rock face follows a free-fall path and then, bounces and rolls once impacted at the base of the rock wall itself. These phenomena commonly occur due to the action of recurrent thermal stressors over a period of time as well as due to ongoing deformations triggered by intense rainfalls, severe windstorms or middle-to-high magnitude earthquakes. In order to assess the danger due to these landslide processes, and to prevent any human and economic losses, it is essential to understand the trigger mechanisms. Therefore, it is crucial to study these gravity-induced instabilities in areas increasingly exposed to heavy rainfall due to climate change and subject to seismic hazards such as the central Mediterranean [5]. One of the main consequences due to the combined action of degradation and weathering along the sea cliffs resulting in a damaging which includes rock jointing and fragmentation, driving towards the block detachment from the cliff and causing the rock mass to lose its integrity while falling from a steep slope and breaks up into smaller pieces [6]; that is, a limited number of blocks with volumes up to a few hundred thousand cubic metres move downstream with little mutual interaction [7]. Rockfalls from cliffs are generally unpredictable and threaten human lives, infrastructures and properties, because of the potential damages that might be caused. Further studies related to the assessment and mapping of landslide hazards as well as their vulnerability to seismic shaking were carried out [8,9,10,11,12]. To investigate slow-moving coastal landslide, in the last decade, long-term GPS observations were carried out over a 4.5 year period along the north-western coast of Malta to identify the displacement of blocks [13]. More recently, other results deriving from advanced synthetic aperture radar (SAR) interferometric analysis made possible the. measurement of the speed (ranging from 1 to 7 mm/year) and the trend of the deformations over a period of about 20 years [14]. In this work, an area on the northeast coast of Malta was studied with a multidisciplinary methodology to examine a total period of 64 years during which several collapses occurred. Here, the first attempt to combine a variety of geomatic and geophysical data to investigate cliff failures is presented.

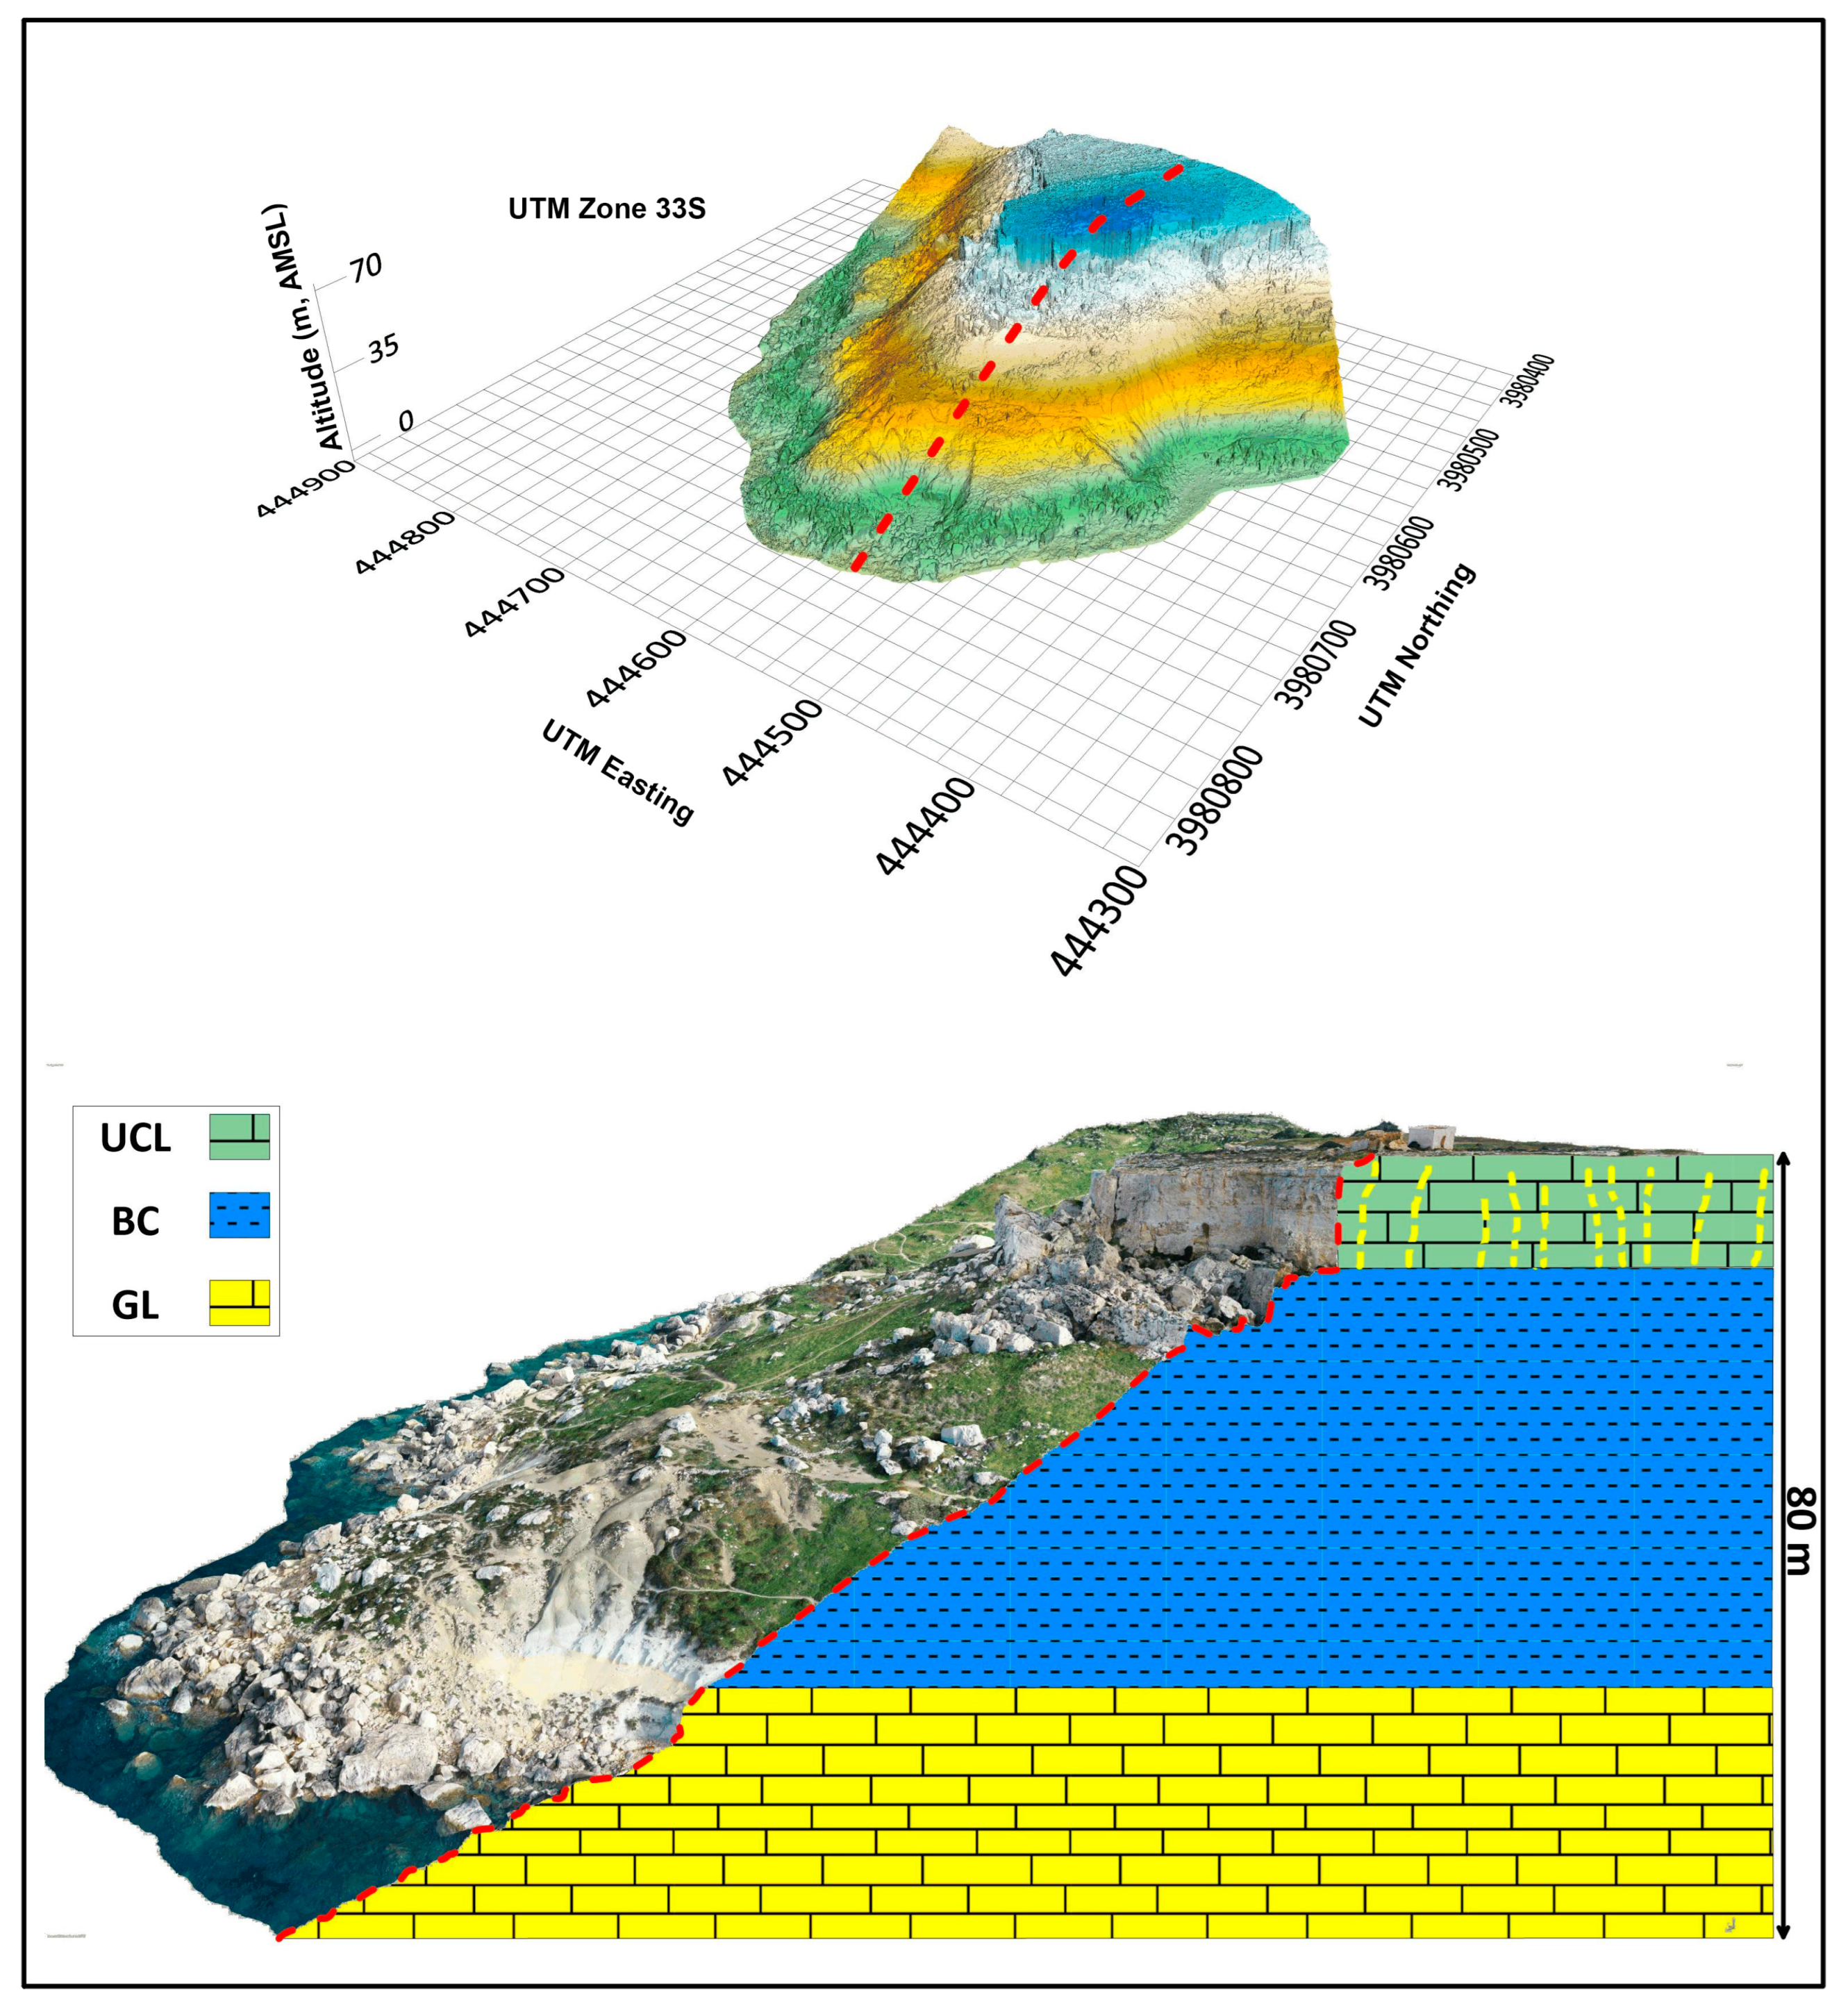
2. Location and Geological Setting of the Selmun Promontory

The Maltese archipelago is situated in the Central Mediterranean and it is composed of three main islands (Malta, Gozo and Comino). The islands are characterized by an Oligocene–Miocene stratigraphic sequence of five main geological marine sedimentary formations consisting of limestones, marls and clays [15,16,17,18,19,20]. From the base to the top, the geological stratigraphy includes: lower coralline limestone (LCL) formation, which is a grey limestone with remains of coralline algae of Chattian age (Oligocene); globigerina limestone (GL) formation, which is a fine-grained yellowish limestone with a high foraminifera content of Aquitanian–Langhian age (Lower Miocene); blue clay (BC) formation, which is a soft pelagic blue or greenish grey marl and limey clay of Serravallian age (Middle Miocene); greensand formation, which is a glauconitic limestone that is 1 m thick (Miocene); and upper coral limestone (UCL) formation, that is a light grey limestone and calcarenite with remains of coralline algae of Tortonian–Messinian age (Upper Miocene). Based on its geological setting, the island of Malta can be divided into two main sectors: the south-eastern part of the island, where only the two oldest geological formations are present and the landscapes are relatively flat, and the north-western part of the island, where the full sedimentary sequence is generally conserved and the UCL and the BC mainly outcrop [20]. Due to the outcropping geological formations, unstable cliff slopes typically form the edges of a summit UCL plateau overtopping gentle slopes of the BC (between 30° and 45°) form the typical landscapes of the north-western part of the island of Malta [3,4,13].
The Selmun Promontory, on which the Għajn Ħadid tower is located, is in the north-eastern part of the island of Malta and deserves to be studied for its importance as cultural and environmental heritage. The geological succession of this promontory is composed of 25 m of the UCL, 45 m of the BC, and the GL at the base (Figure 1A,B); all the formations have horizontal or slightly NE-dipping (<5°) strata [20,21]. The UCL forms the plateau of the promontory bordered by vertical cliff slopes (Figure 1C). The BC–GL contact is at sea level and this determines a gentle slope of BC up to the overlying plateau. In correspondence with the gentle slope, both the BC and the GL rarely outcrop because a significant slope debris deposit resulting from the UCL plateau evolution generally covers them [21]. The debris deposit accumulated along the slope is produced by the ongoing geomorphological evolution of the promontory due to the superimposition of a stiff rock (UCL) on a ductile clay (BC) leading to a large phenomenon of lateral spreading [22]: the horizontal deformation affecting BC, having a visco-plastic behaviour, fractures the elasto-plastic overlying UCL plateau, from whose edge unstable rock blocks detach by typical gravity-induced landslide processes, i.e., planar and wedge sliding, toppling, falls [23]. These landslides in the Selmun Promontory, as well as the significant UCL clastic debris which covers the BC and GL outcrops, is mainly evidenced by a complex network of gravity-induced discontinuity on the top.

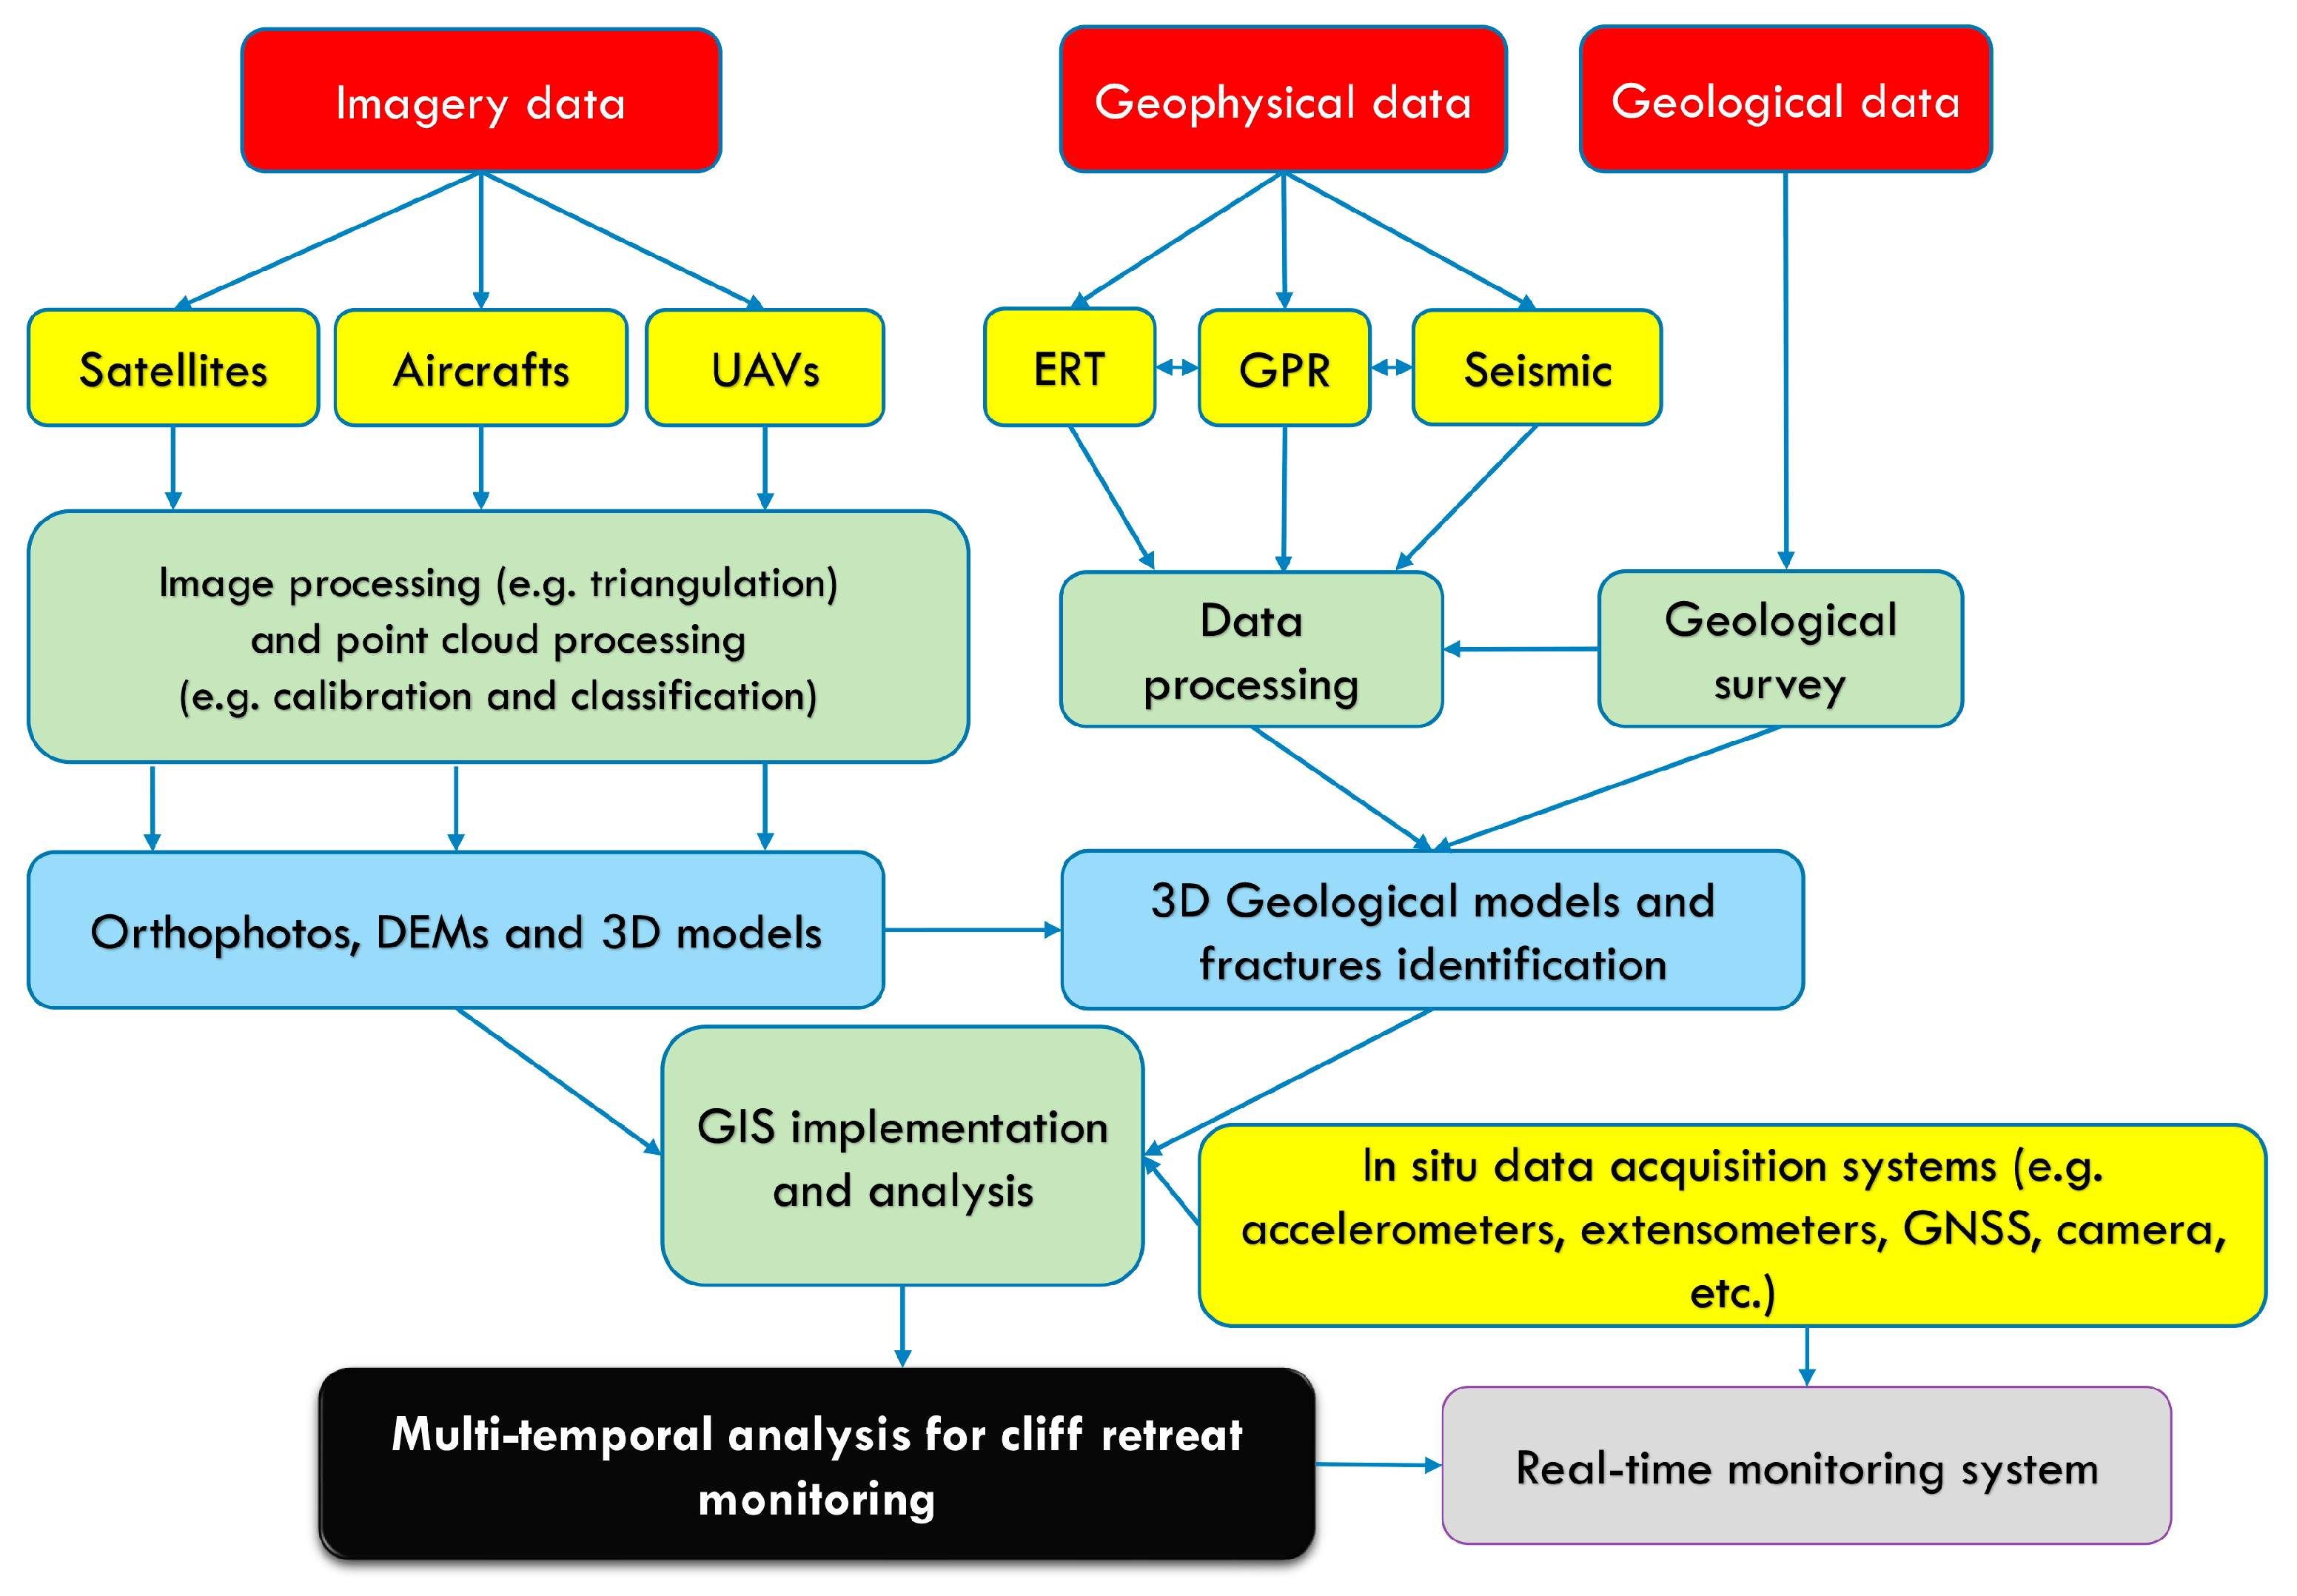
3. Materials and Methods

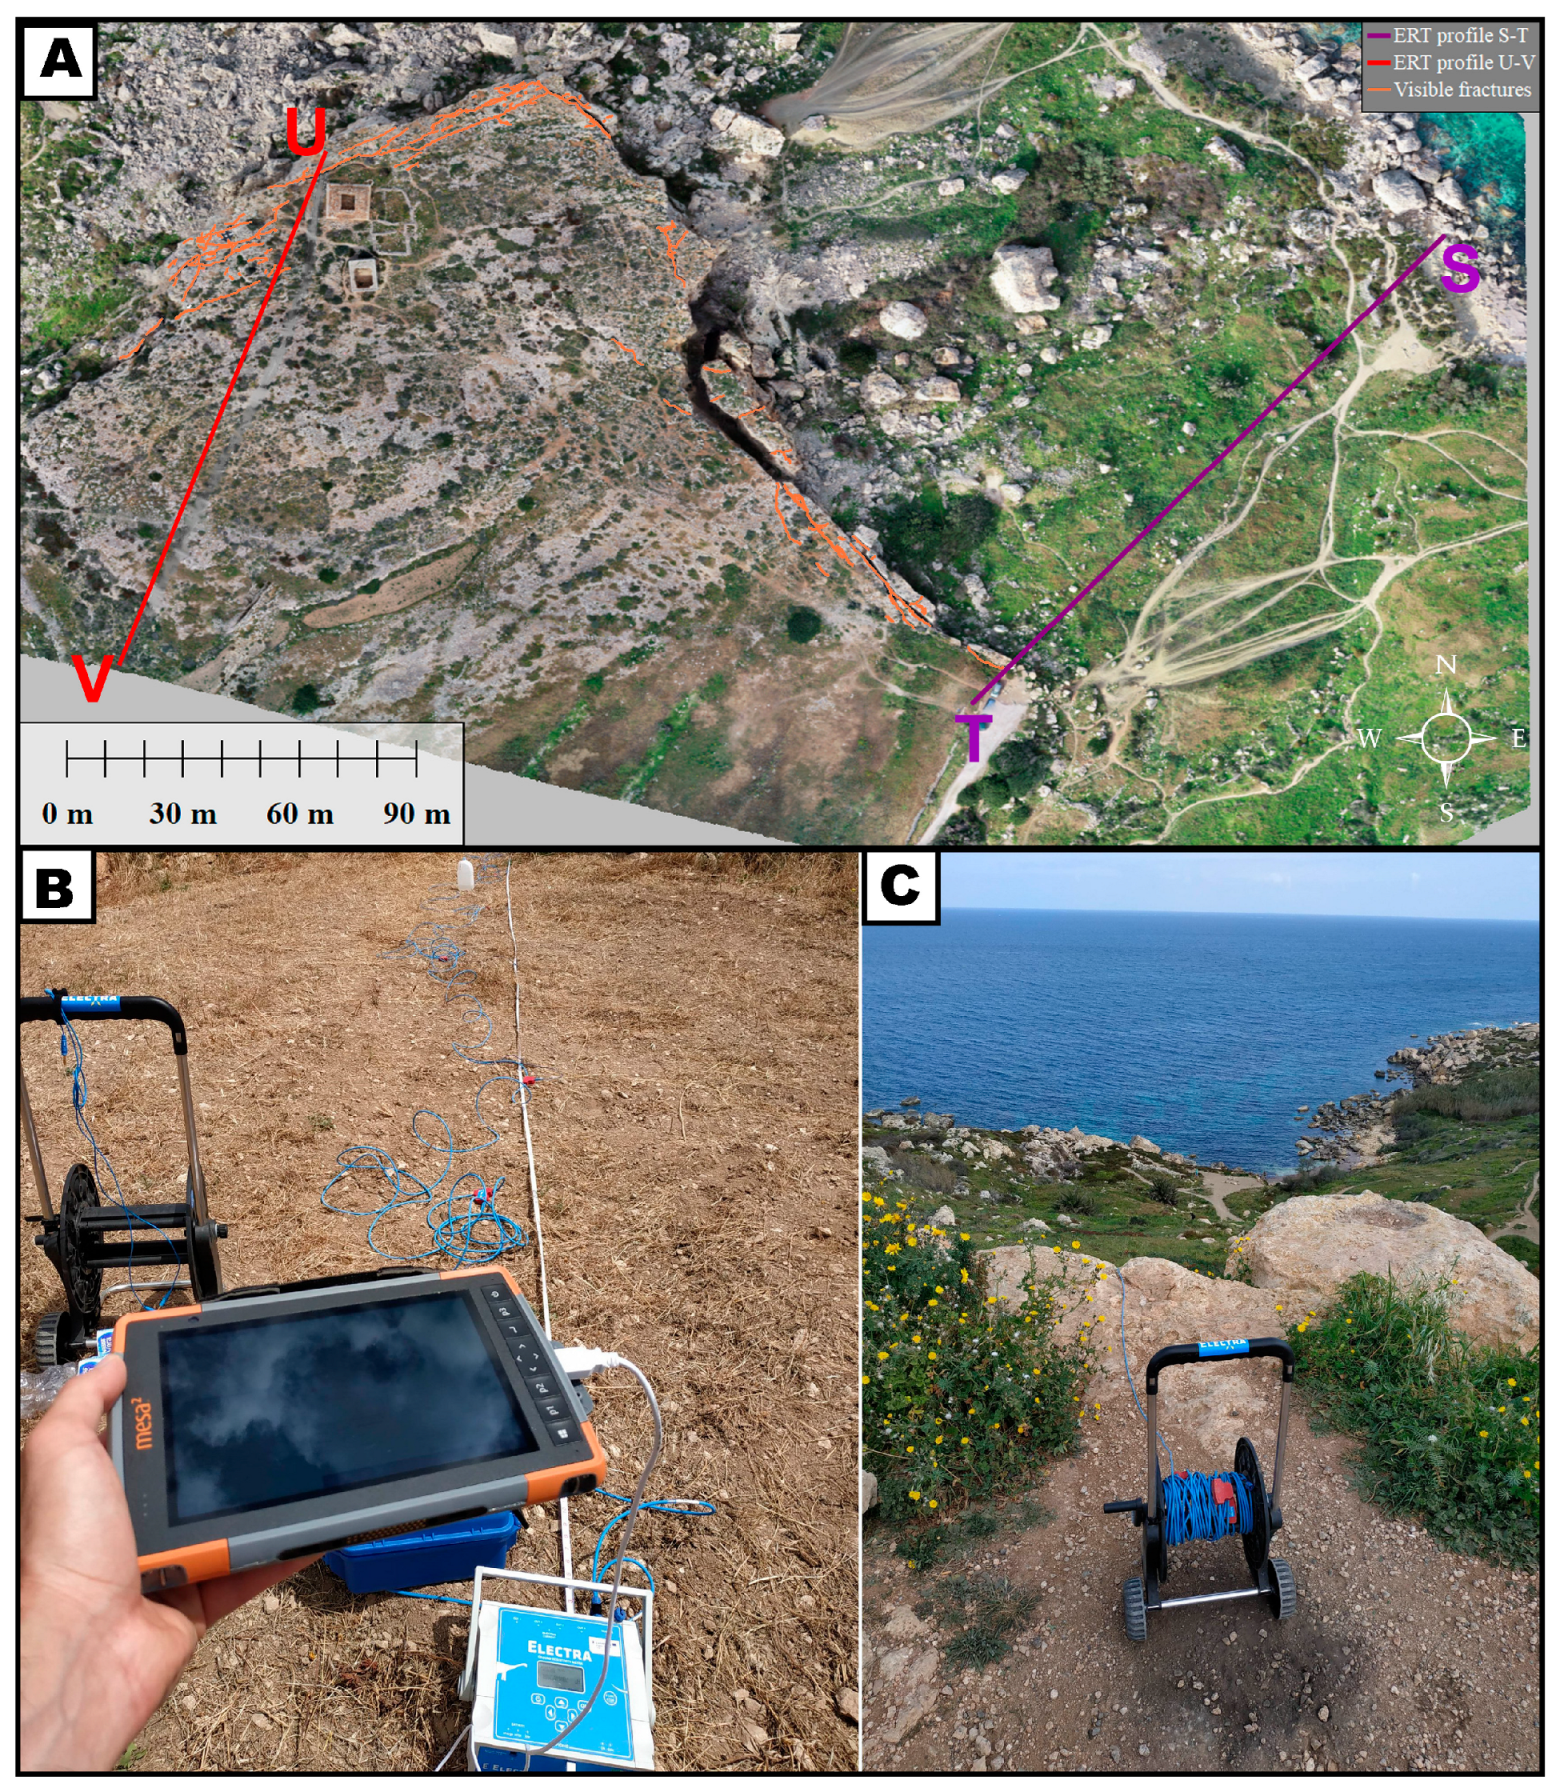
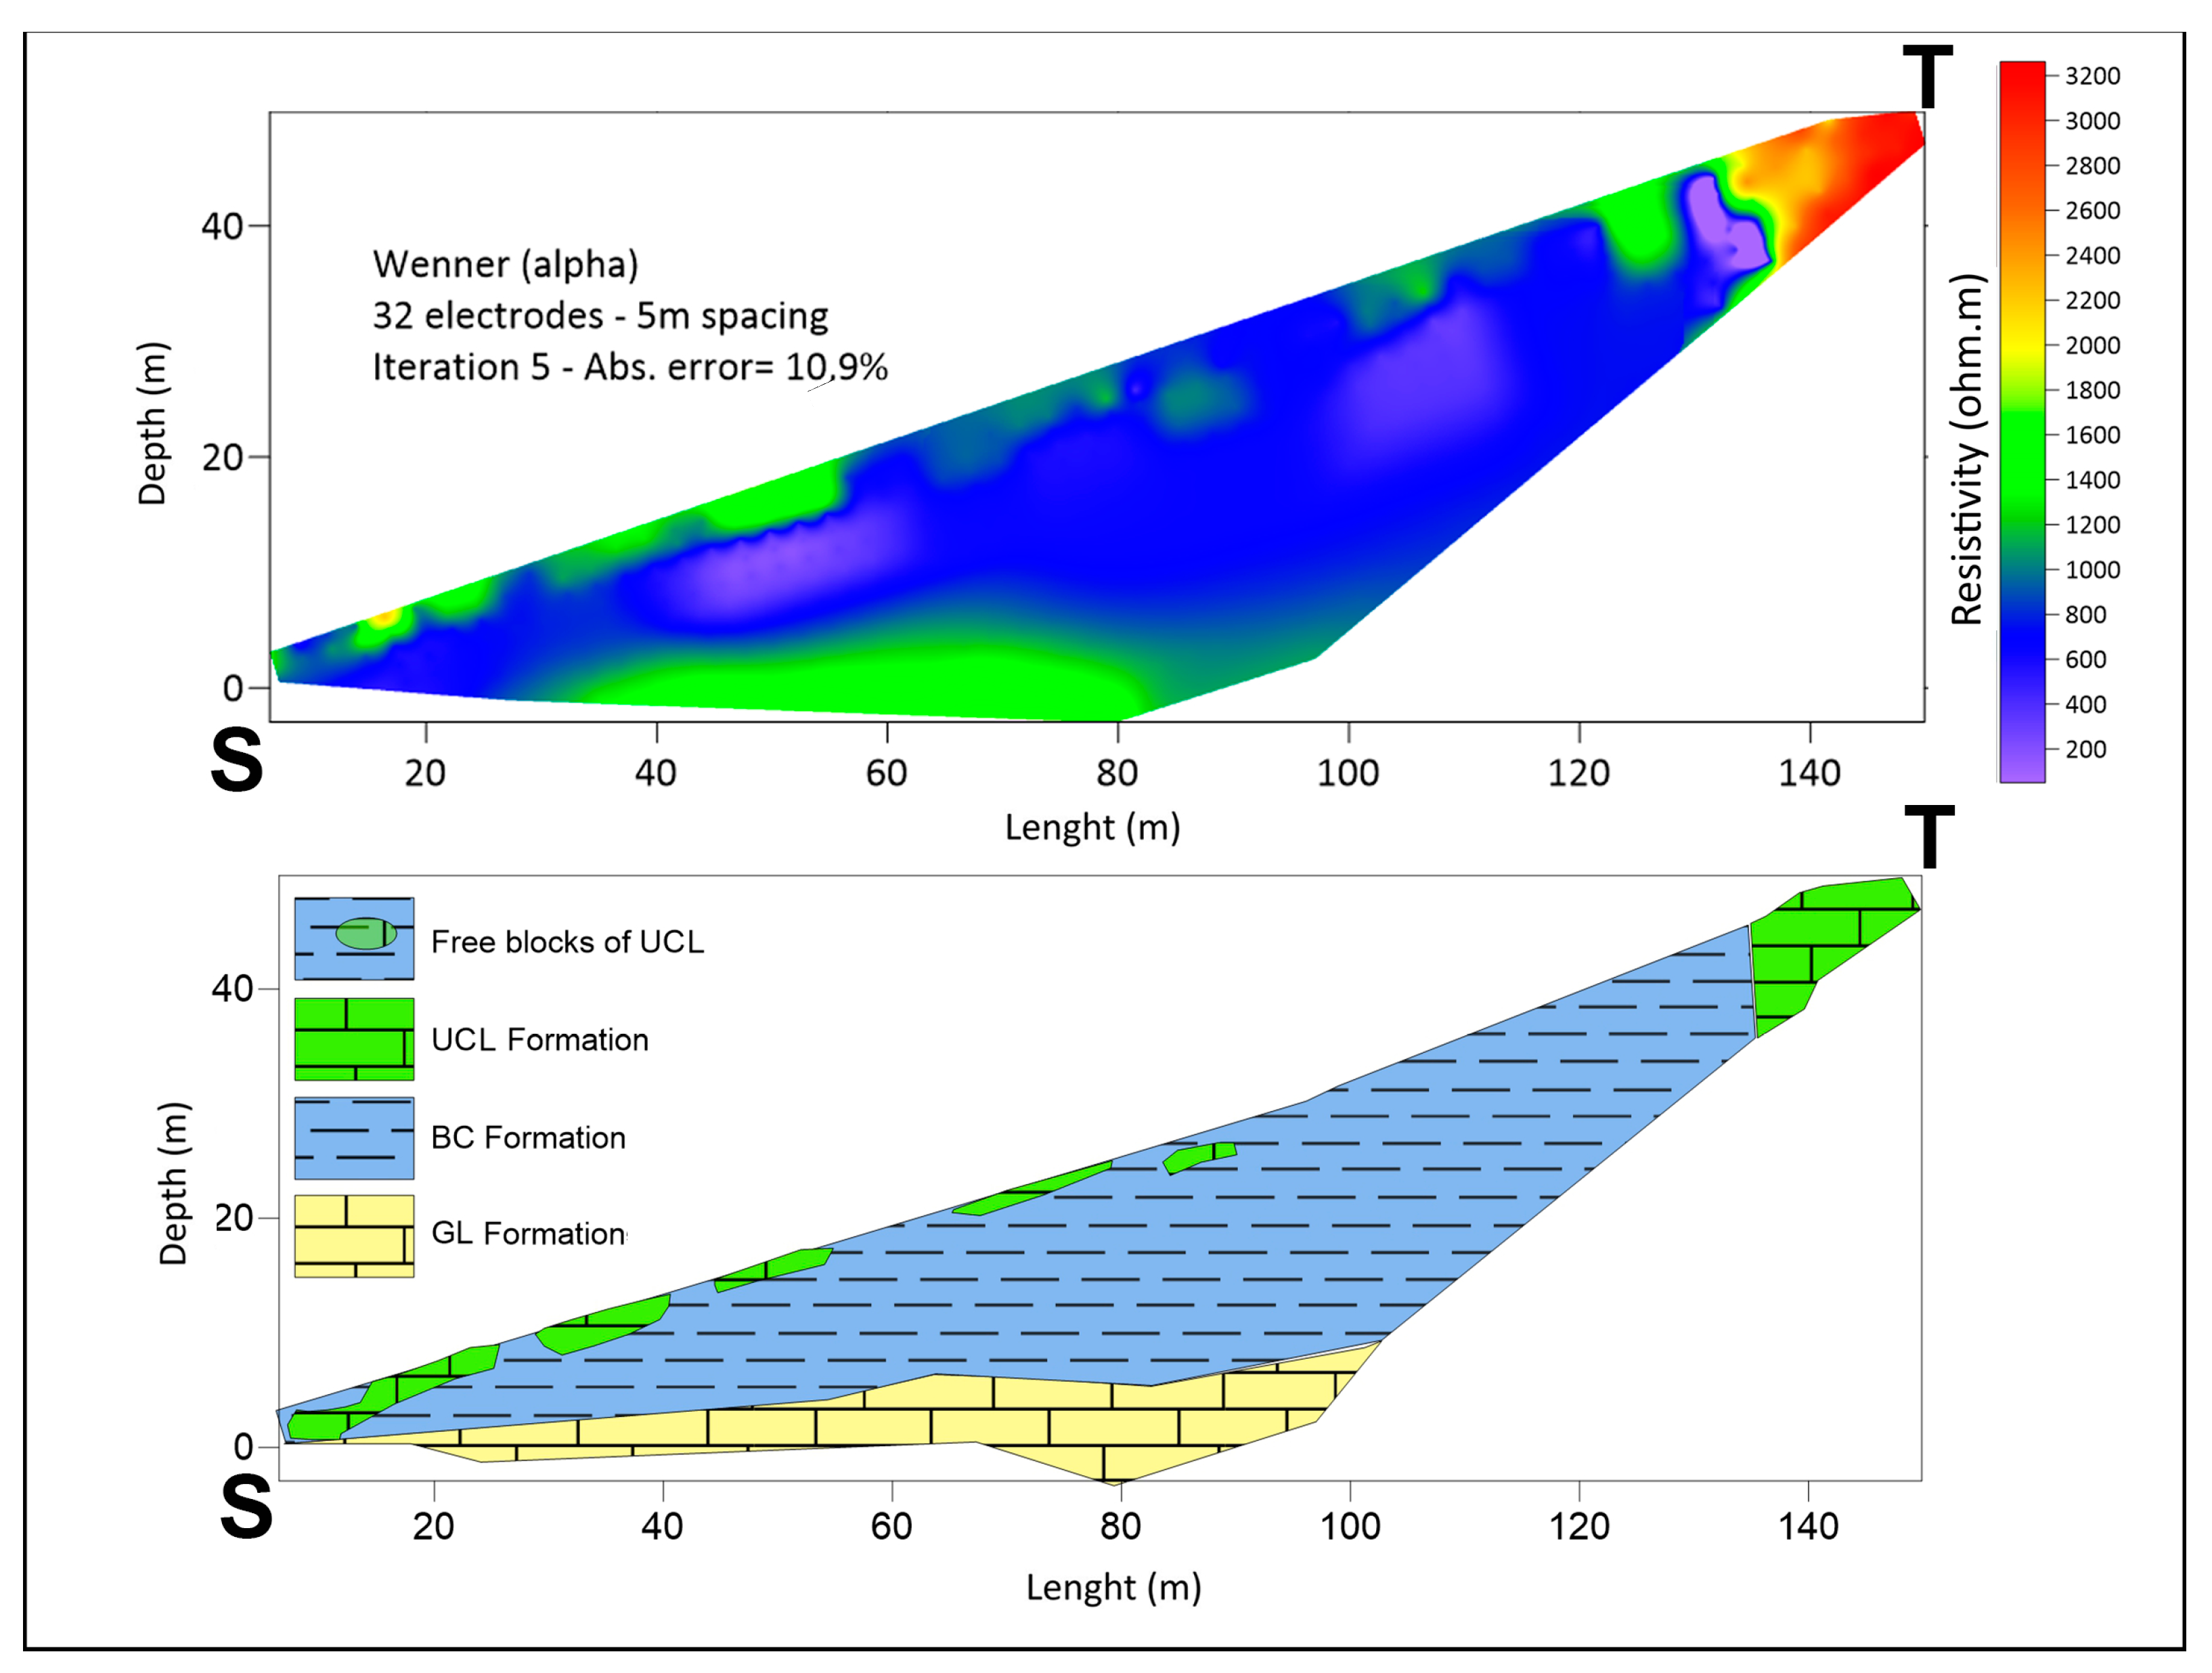
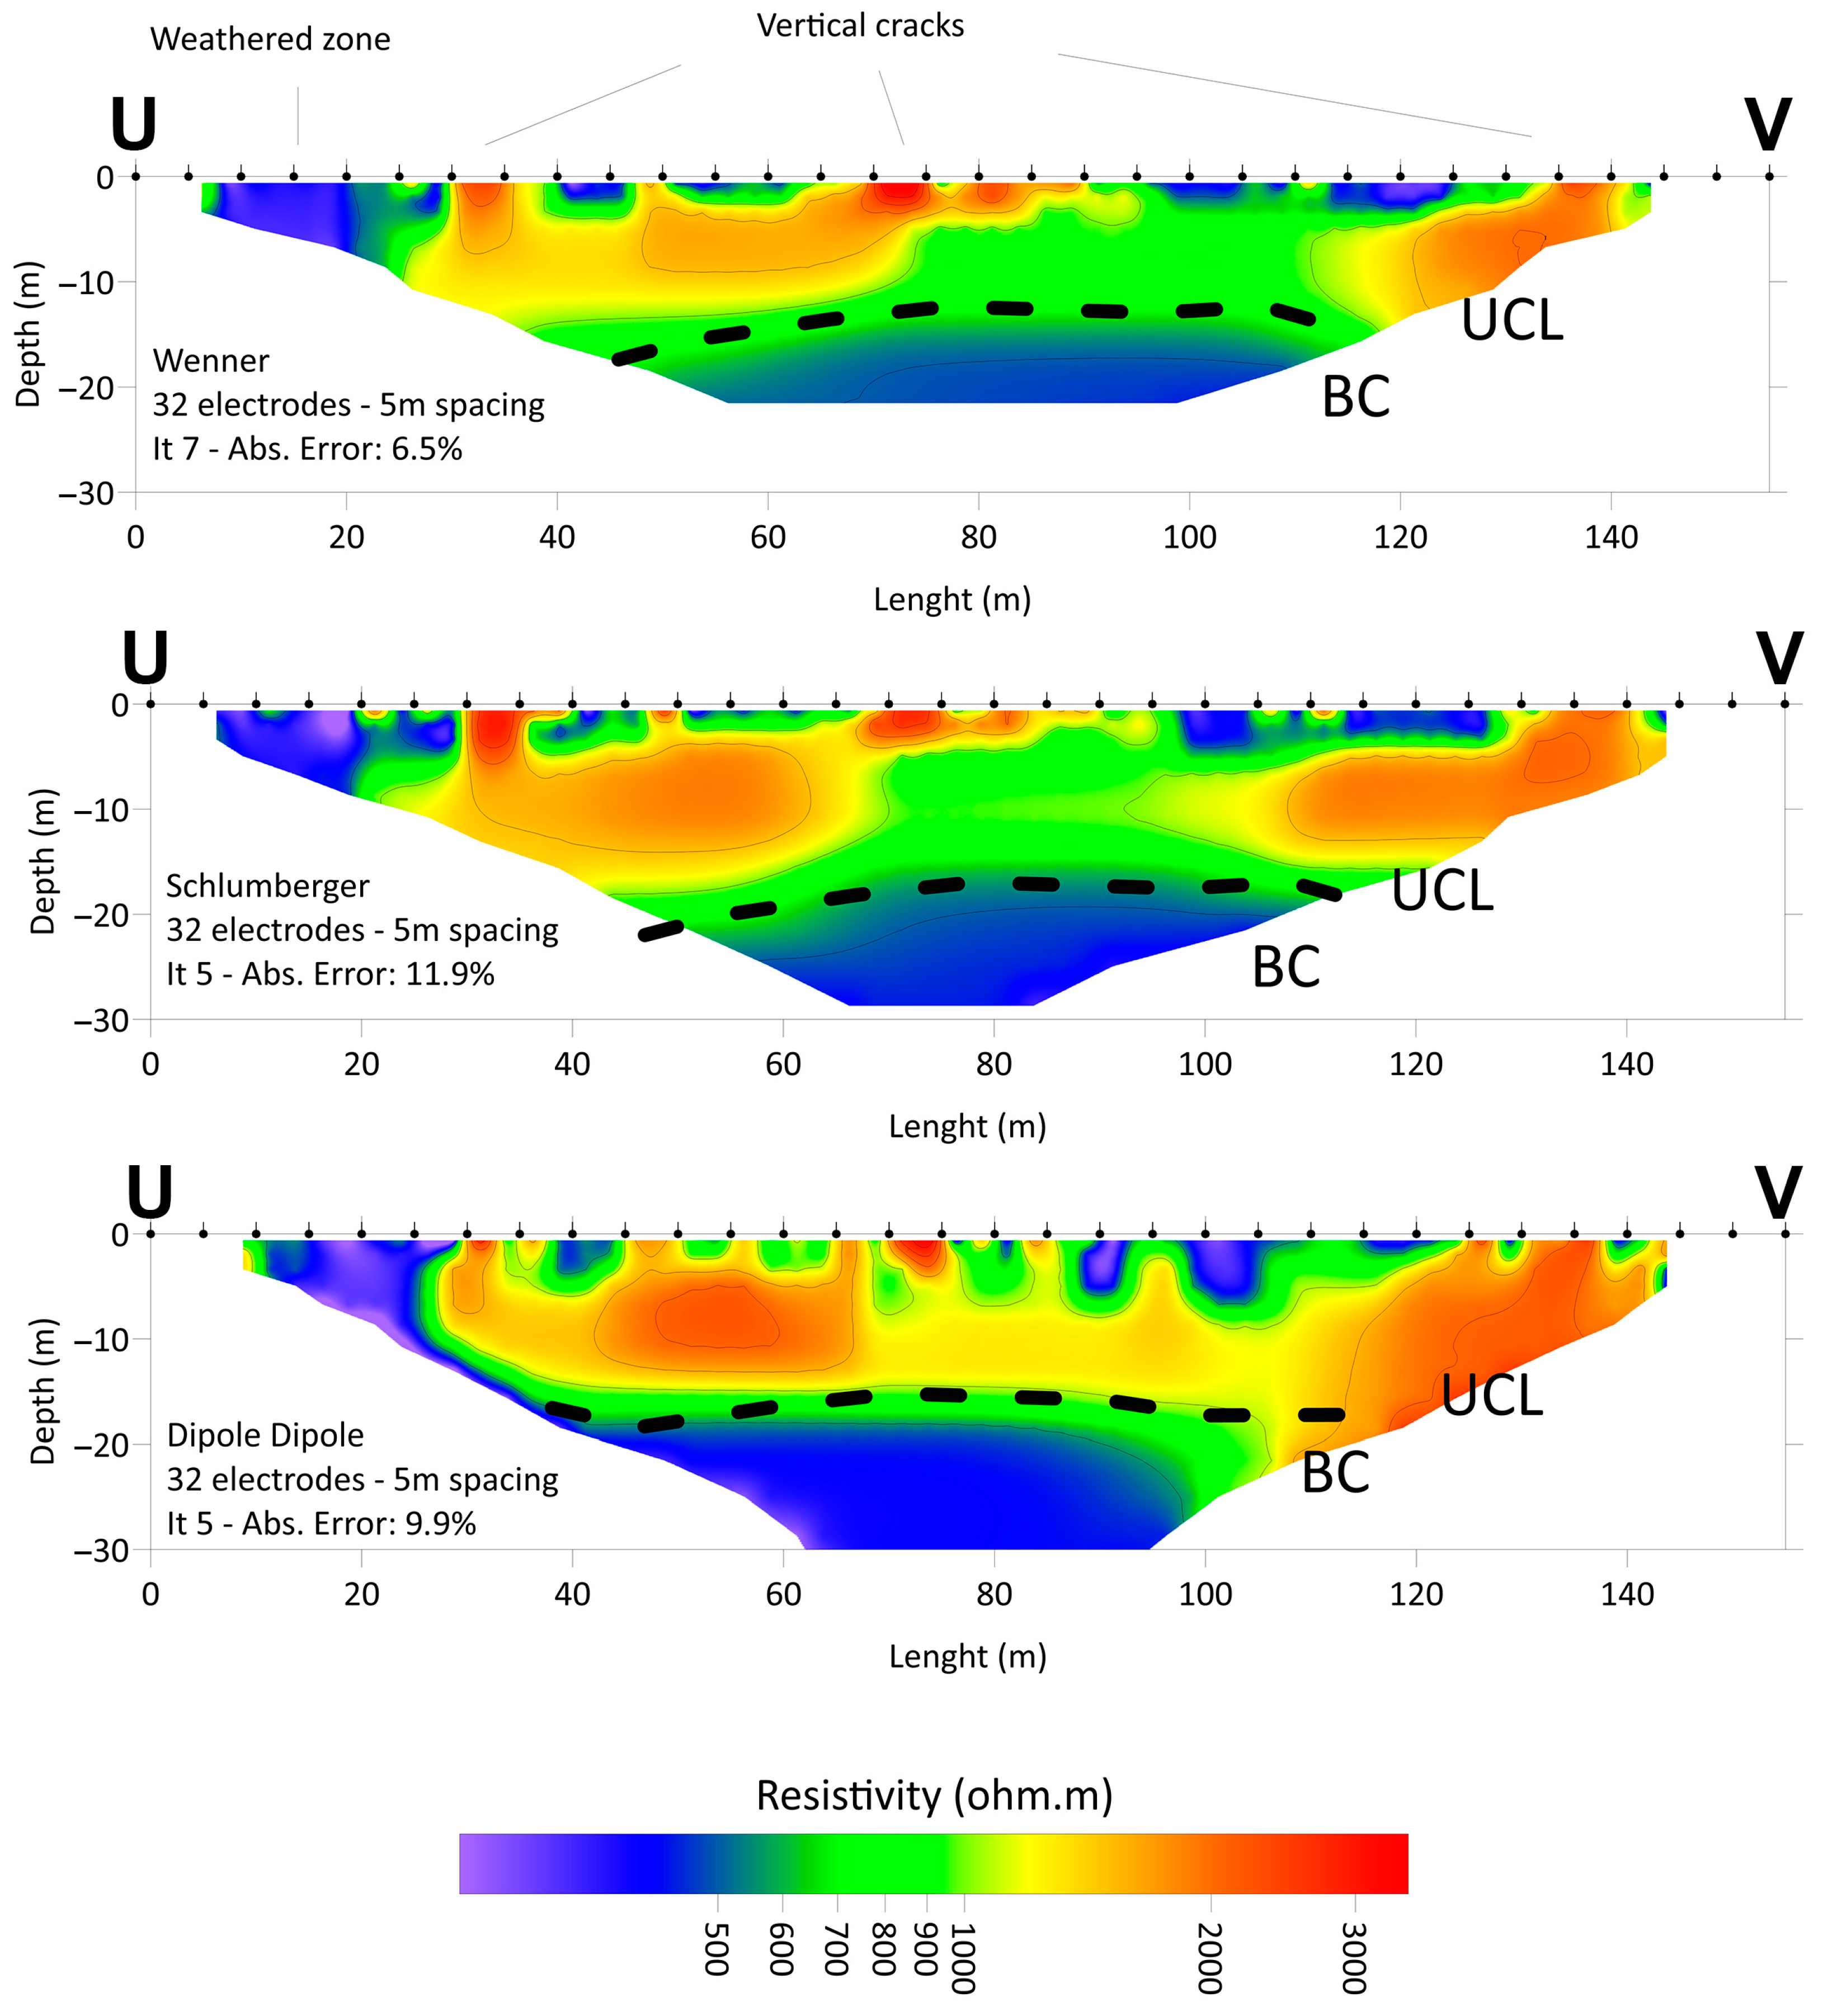
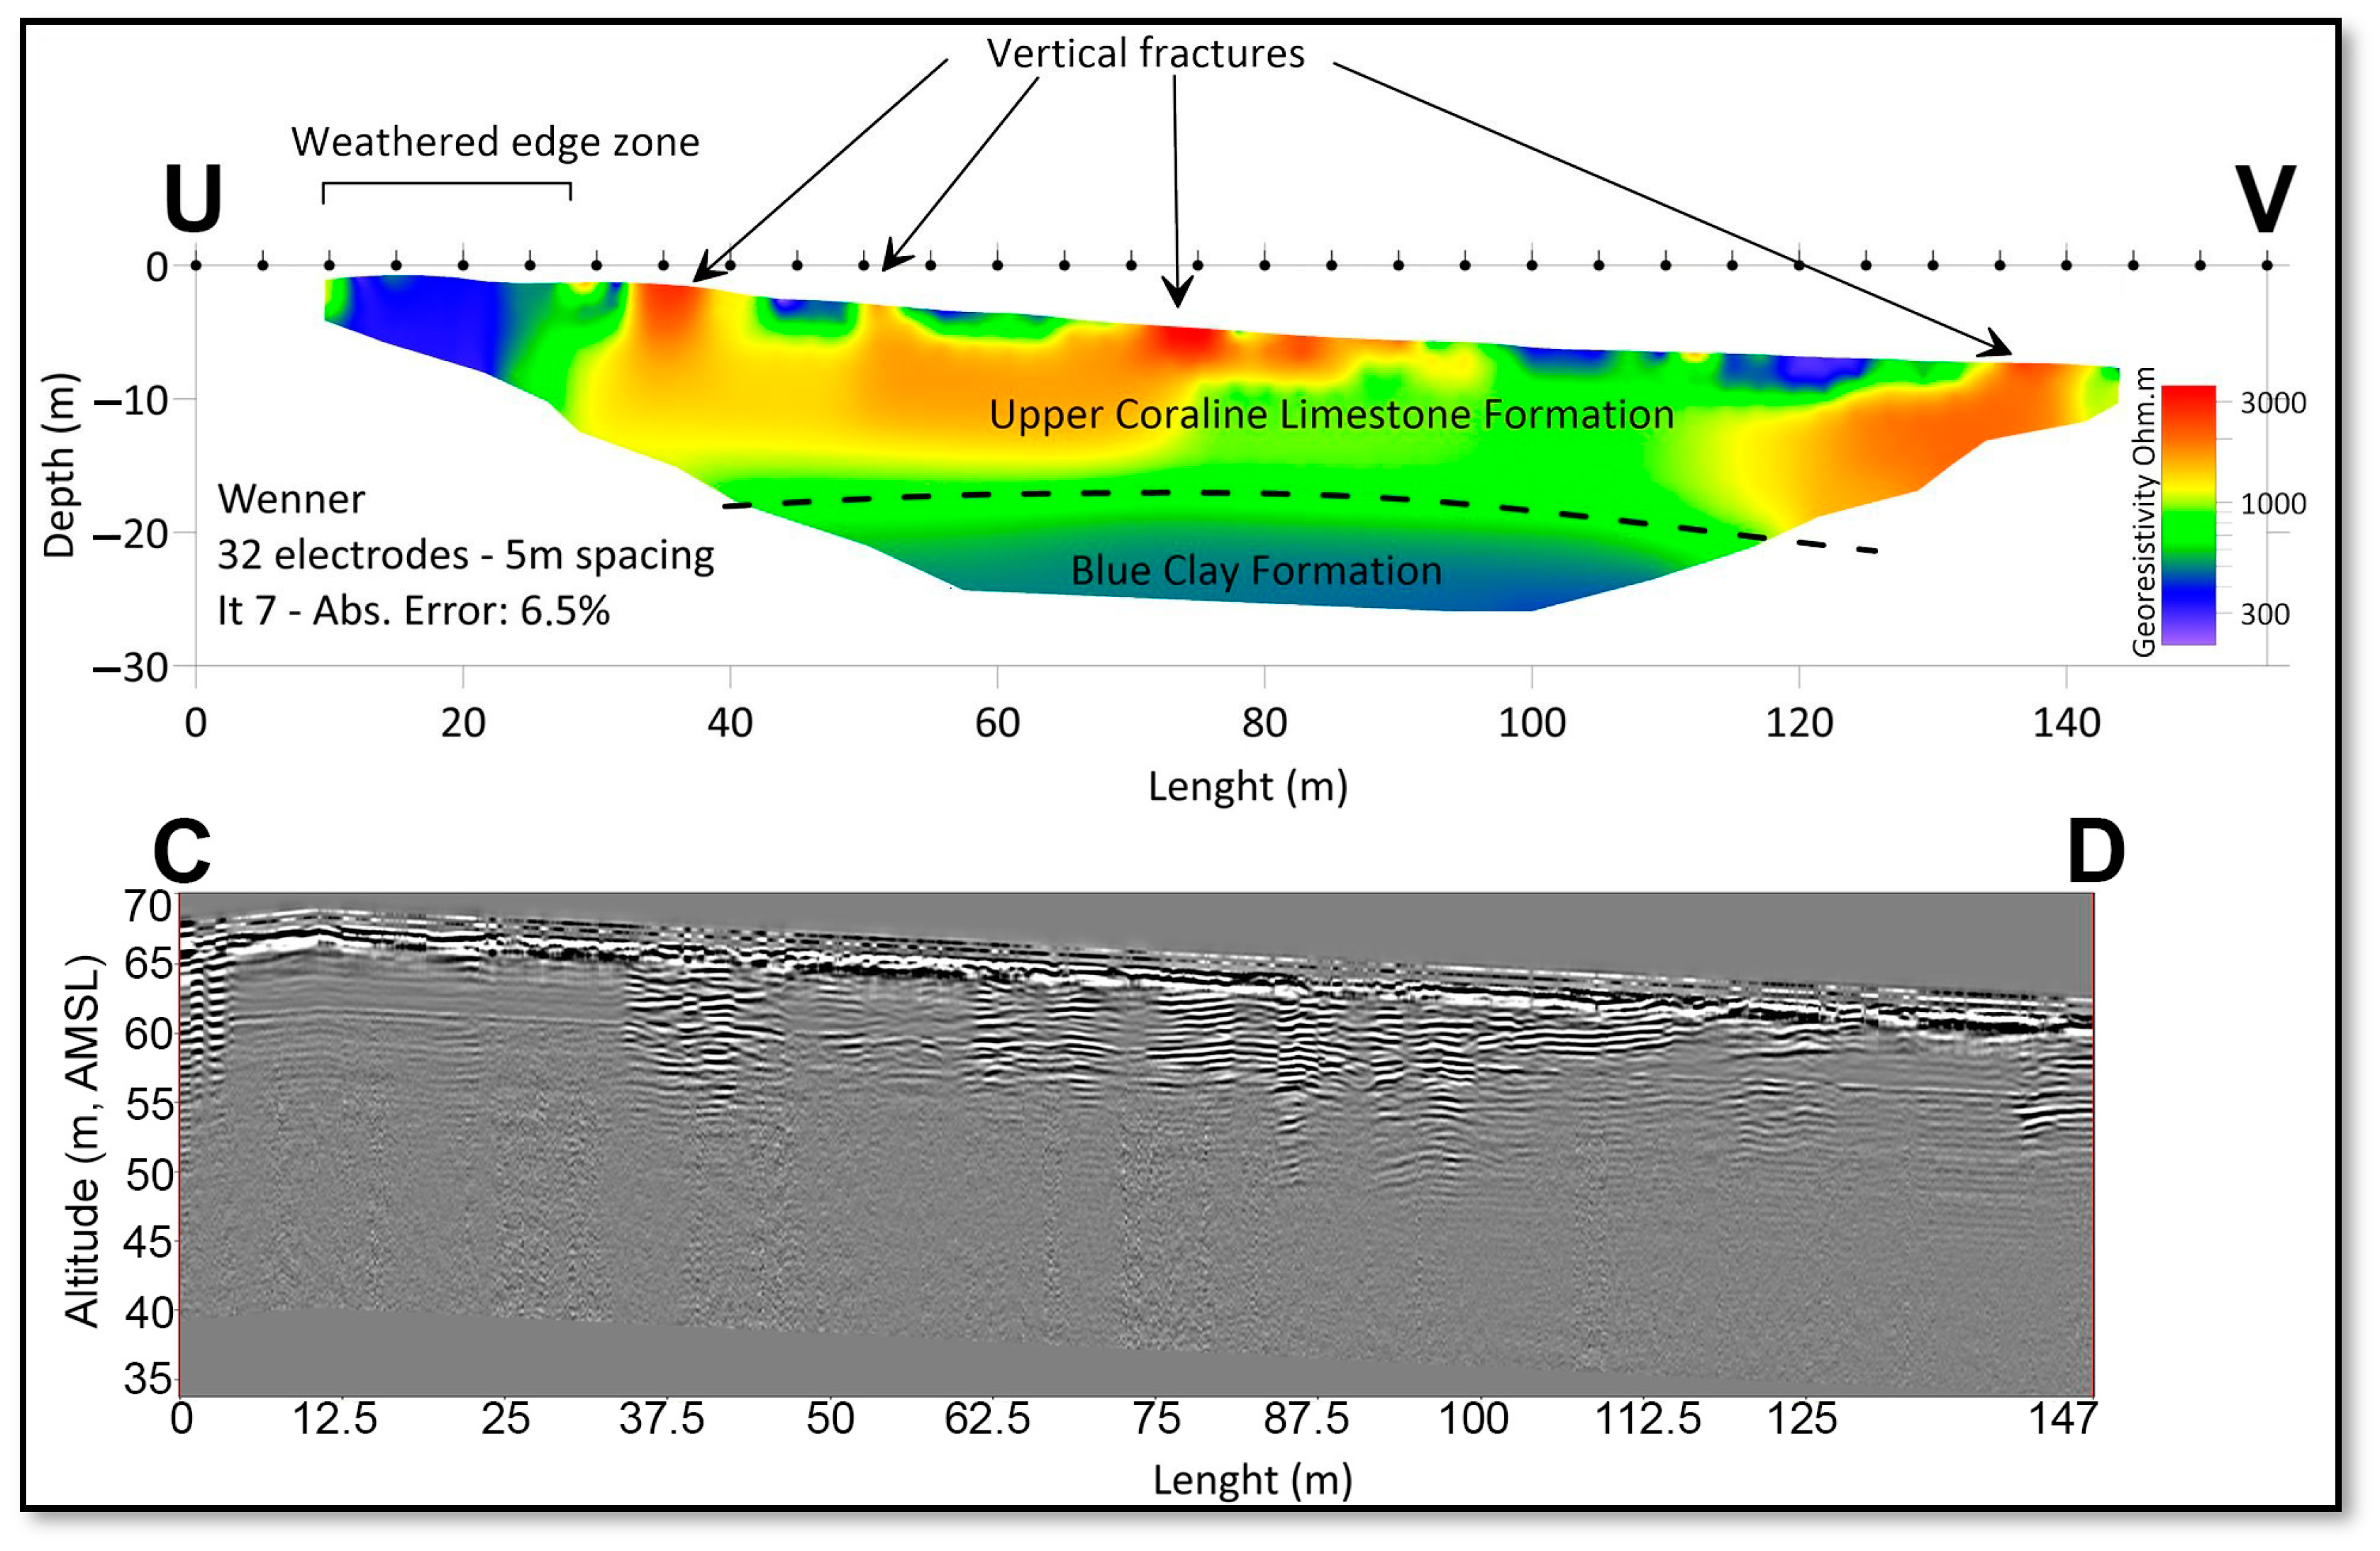
3.1. Electrical Resistivity Tomography (ERT) Investigations

In order to identify main geological subsurface potential thickness variations at the Selmun promontory, different electrical resistivity tomography (ERT) campaigns were carried out. This active geophysical method allows the measurement of both lateral and vertical variation in ground resistivity. The measure of resistivity of the ground is affected by several factors such as rock composition, pore spaces, water content, joints, fracture openings or even temperature [24]. The method involves sending electrical current by using a pair of current electrodes and measuring the potential difference by using a pair of potential electrodes. The point of the measurement is determined by the electrode geometrical configuration. With this technique, it is possible to create different types of electrode configurations. The most common ones are the Wenner, the Dipole–Dipole and the Schlumberger devices. By using electrodes with different spacing and/or position, a pseudosection of apparent resistivities is surveyed. This method is essentially limited by two factors: (a) the penetration depends on the distance between the length of the array; therefore, it might be strongly conditioned by the length of the cables, the power of the battery and the conformation of the investigated terrain; and (b) the confidence is higher near the electrodes and decreases rapidly with the distance from them. For this study, a multichannel digital georesistivimeter Electra model manufactured by Moho Srl was used. The ERTs were carried out in two different sectors, on the slope of the promontory (S-T profile) almost from sea level to the plateau, and on the plateau (U-V profile) (Figure 2). In both cases, a configuration of 32 electrodes spaced every five metres was used. The total length of each array was 155 m.
To determine the quality of the coupling between the electrodes and the substrate, impedance measurements were performed on each profile. This measurement was performed between pairs of electrodes. High local values indicated a weak coupling of either one or both electrodes. In cases where the impedance values indicated a poor coupling, this was improved using a salt and water solution. At times, the electrodes were also replaced. Correctly coupled electrodes resulted in a resistance of a few hundred to a few thousand Ω. When the values exceeded a few tens of kΩ, electrode-soil contact was verified. Impedance values measured in the blue clay formation were found to be below 100 Ω, while those measured between electrodes arranged in the UCL were a few kΩ. These differences were to be expected due to the higher resistivity of the limestones compared to the clays. Along each profile, three different configurations were acquired: Wenner alpha, Wenner–Schlumberger and Dipole–Dipole. Due to the different relative positions of the current and potential electrodes in the different arrays, each array is more or less sensitive to the different geometries of the geoelectrical discontinuities in the subsurface. Since the apparent resistivity values rho (ρ) of the materials were calculated using geometrical factors of the array, it was important to perform a correction of the geometrical factors when the topography was not flat. This was necessary to recalculate the interelectrode distance. Although the U-V profile was carried out on terrain without major topographic changes, the S-T profile was performed on a steep slope with a topographic break. Therefore, this correction was essential. For this, the position of the electrodes was measured using high-precision differential GNSS equipment. The acquired data were exported and pre-processed using Prosys III software (IRIS Instruments). In the case of profile S-T, topographic information was added and apparent resistivity values were recalculated. The resistivity calculated in the field corresponded to the apparent resistivity of the ground and not to the real resistivity because the subsoil was composed of different materials and the electric field introduced into the ground affected several layers simultaneously. In such cases, the measured resistivity corresponded to an intermediate value of all of them. An inversion algorithm was required to convert the pseudo section of apparent resistivity. This was derived using the field data into a 2-D model of real resistivity. The inversion of the apparent resistivity data was performed with the Res2DInv software [25,26], which applies an inversion algorithm based on the least squares method to produce a 2D resistivity model [27].

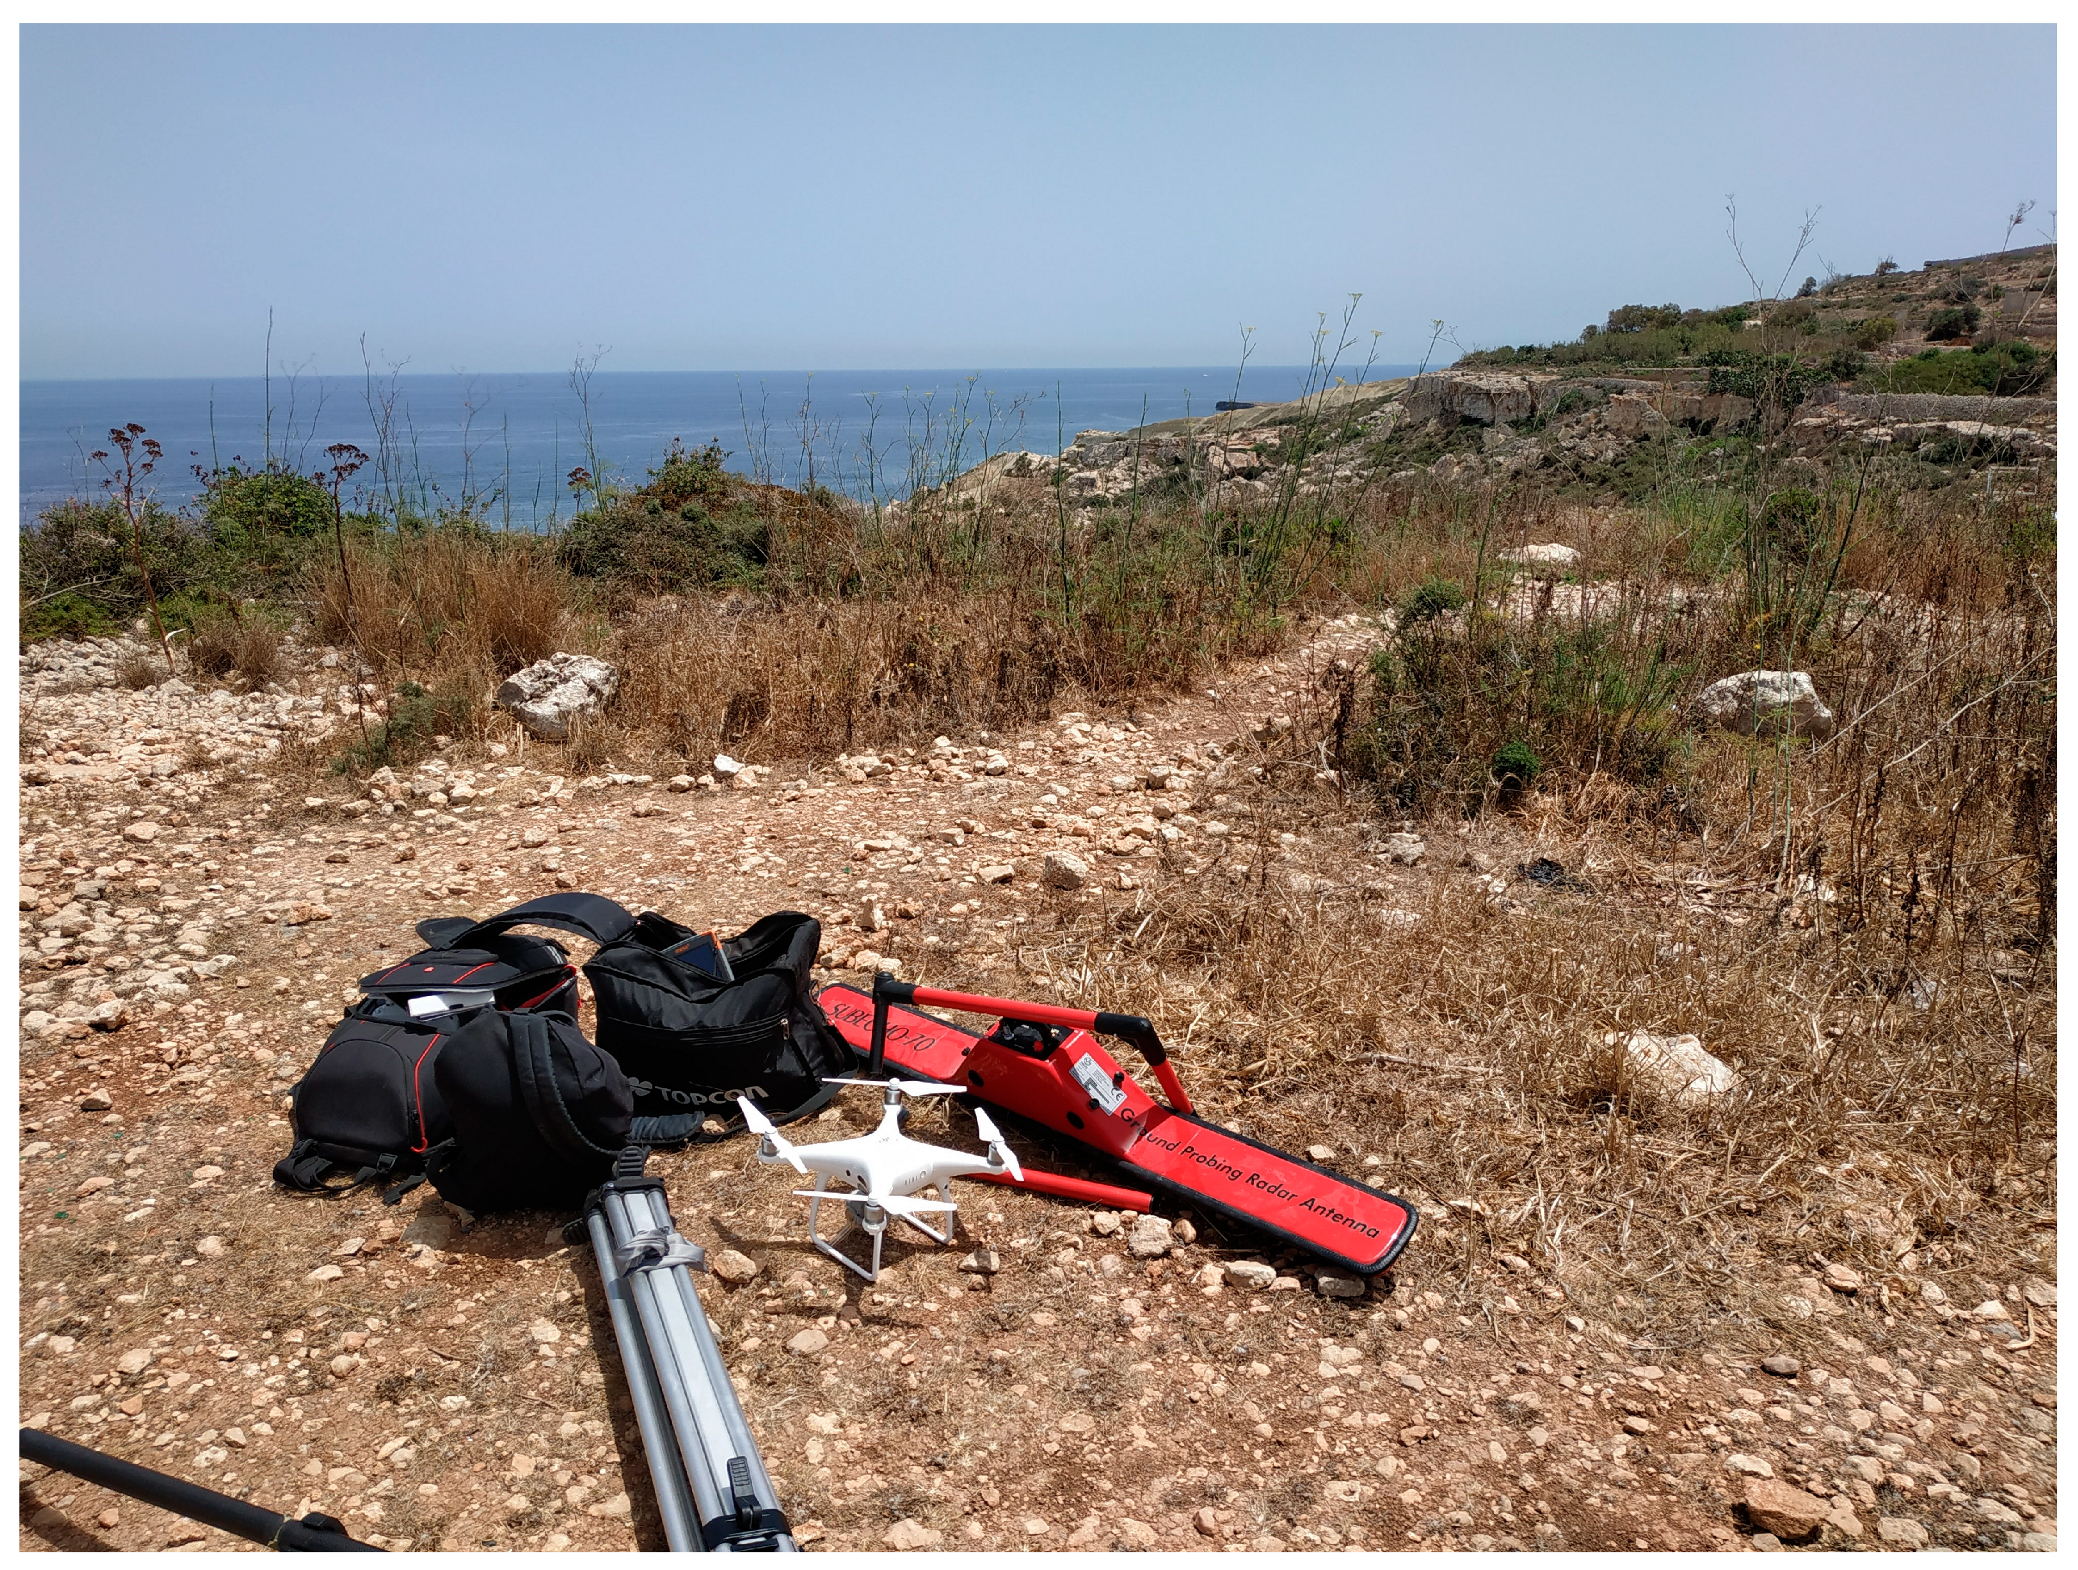
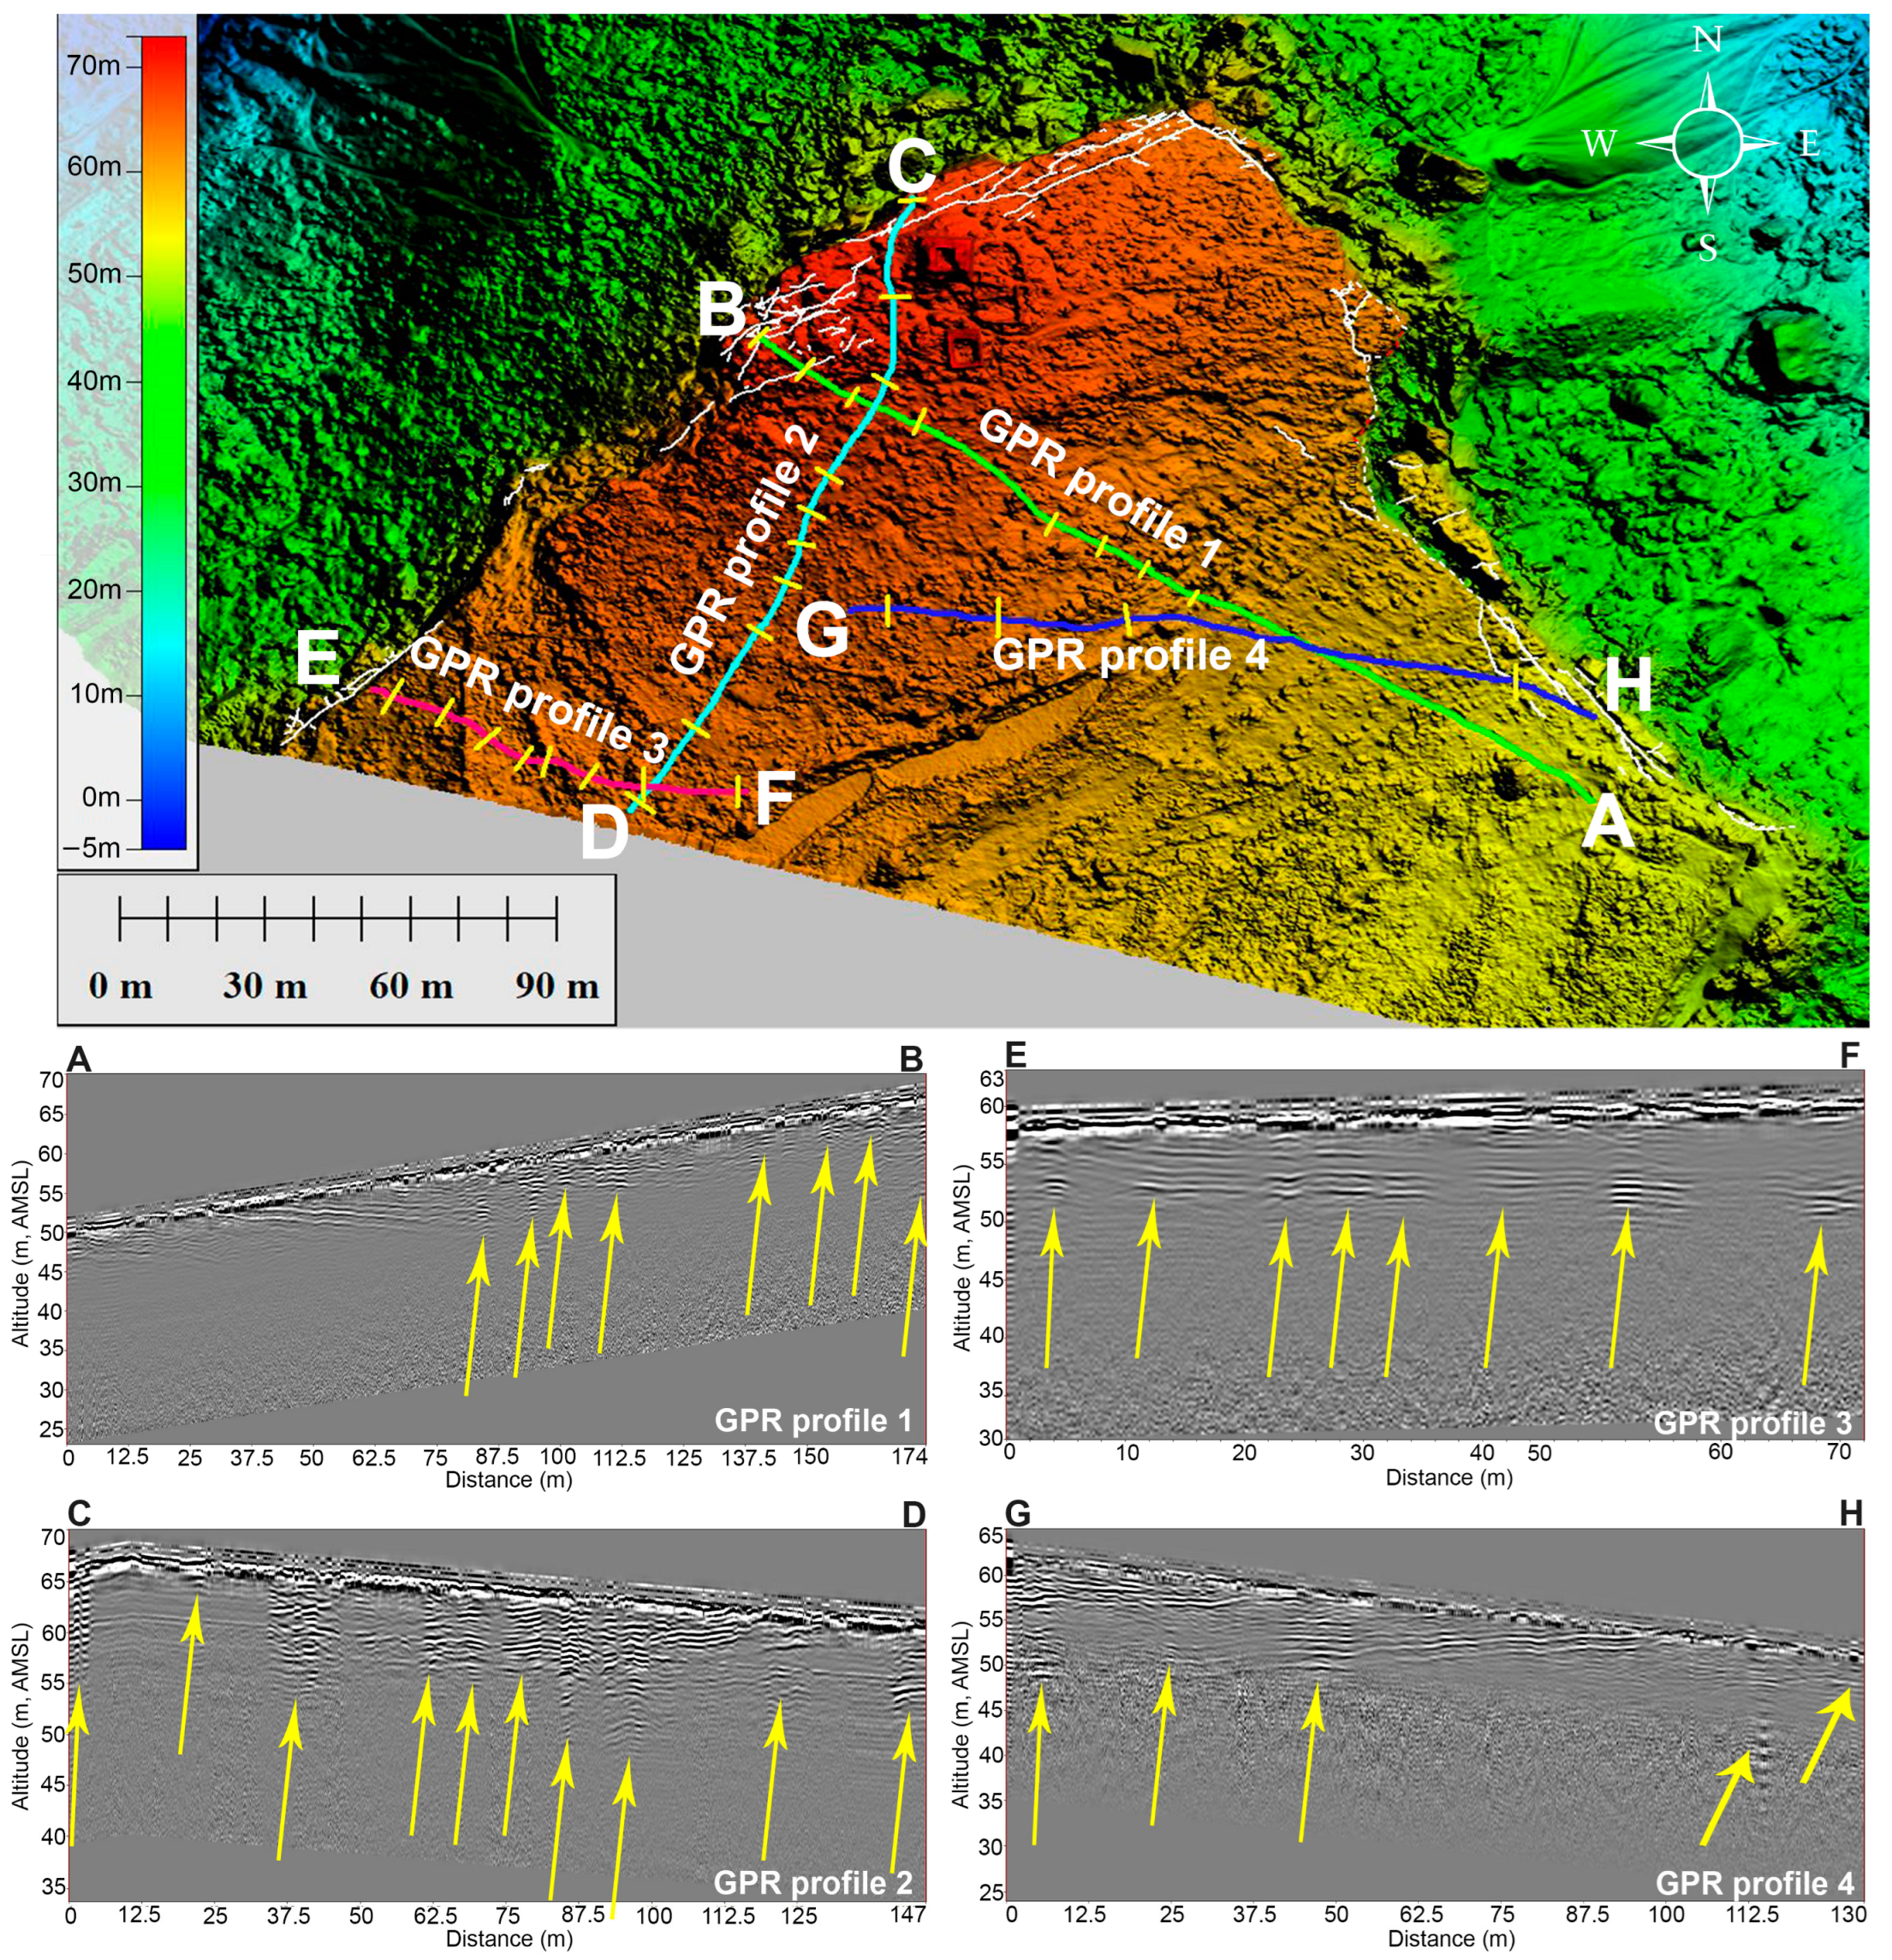
3.2. Ground Penetrating Radar (GPR) Investigations

Ground penetrating radar (GPR) uses high-frequency electromagnetic waves to obtain high-resolution images of shallow geologic structures, such as faults and fractures [28]. The adoption of indirect geophysical prospecting methods, such as GPR, ensures repeatability and velocity of acquisition compared to drilling prospecting techniques, as shown in several types of research [29,30,31]. The uses of GPR in the geological engineering field demonstrated how useful this technology is for a variety of technical and environmental issues. In particular, GPR was used for internal rock structures analysis [32], stability assessment of sea natural arches [33], faults and fractures detection [34,35], quarry characterisation [36,37], tunnel-stability assessment [38] and to locate and identify solid waste disposal deposits [39]. In this study, the focus was placed on the use of GPR in the high-resolution characterisation of bedrock cracks in order to investigate the presence of vertical fractures underneath the Selmun UCL plateau with additional measurements independent of the ERT. The GPR system used for data acquisitions was the air-coupled Cobra Plug-In™ SUBECHO model (RadarTeam AB, Boden, Sweden), with a central frequency of 70 MHz (Figure 3). During the acquisition, the GPR system was connected to a topographic GNSS receiver allowing the positioning correction through the differential method [40]. Using the GIS containing all the information collected on the Selmun promontory, four paths were identified to be surveyed with the georadar. The first profile followed the path detected with the ERT array in order to compare the results obtained. The other three profiles followed a trend perpendicular to the first, with the aim of intercepting possible fractures within the plateau. Data were acquired with a sampling interval of 3.125 ns and 512 samples per trace over a time window of 600 ns, which corresponded to an approximate depth of 30 m in limestone with electromagnetic wave propagation velocities of 0.1 m/ns [28]. In addition, due to the altitude differences in the surveyed area, it was necessary to perform topographic corrections to the acquired B-scans. The georadar acquisition was performed in manual mode, as the antenna was transported manually along the four selected paths and with a height above the ground level of about 5 cm. The acquisition was performed with the antenna oriented parallel to the direction of travel, at an average walking speed of about 1 m/s.
Data were processed using the commercial software Prism2® (RadarTeam, v2.7) and the data processing included a series of filters. The zero point is a point where the time counting of the reflected signal starts [41]. According to [42,43], the zero time must be placed at the early wavelet. In this case, the time depth was corrected with a value of −18 ns. In order to eliminate background interference, or the direct signal from the transmitter antenna, as well as to lessen the severity of ringing and horizontal banding artefacts over the whole transmission, a background removal function was applied [44].
During propagation in the subsurface, electromagnetic waves are characterised by a faster amplitude decay of the signal with depth [45]. The gain function is a digital amplification of the traces that allows the signal with the depth to be increased in order to highlight any deep anomalies. The Ormsby filter is a band-pass filter that includes the high-pass and low-pass filters and is a crucial filtering step in the processing of GPR data. Ground waves and other environmental noise sources can be eliminated using high-pass filter, which applies a cut-off to low-frequency components across the entire frequency spectrum of a single trace. On the other hand, the high-frequency elements of each trace’s frequency spectrum that are typically caused by additional electromagnetic interferences are blocked off by the low-pass filter [44,45]. In this study, the data depth was calculated using the hyperbola fitting method [46], obtaining a propagation velocity for electromagnetic waves of about 0.106 m/ns and a corresponding permittivity value of 8, which is plausible considering the mean value of the limestone dielectric constant [47]. After that, topographic data acquired through the use of a differential GNSS were applied to the B-Scans to correct the altitude in the profiles and to recreate a GPR profile as closely as possible to the local terrain.

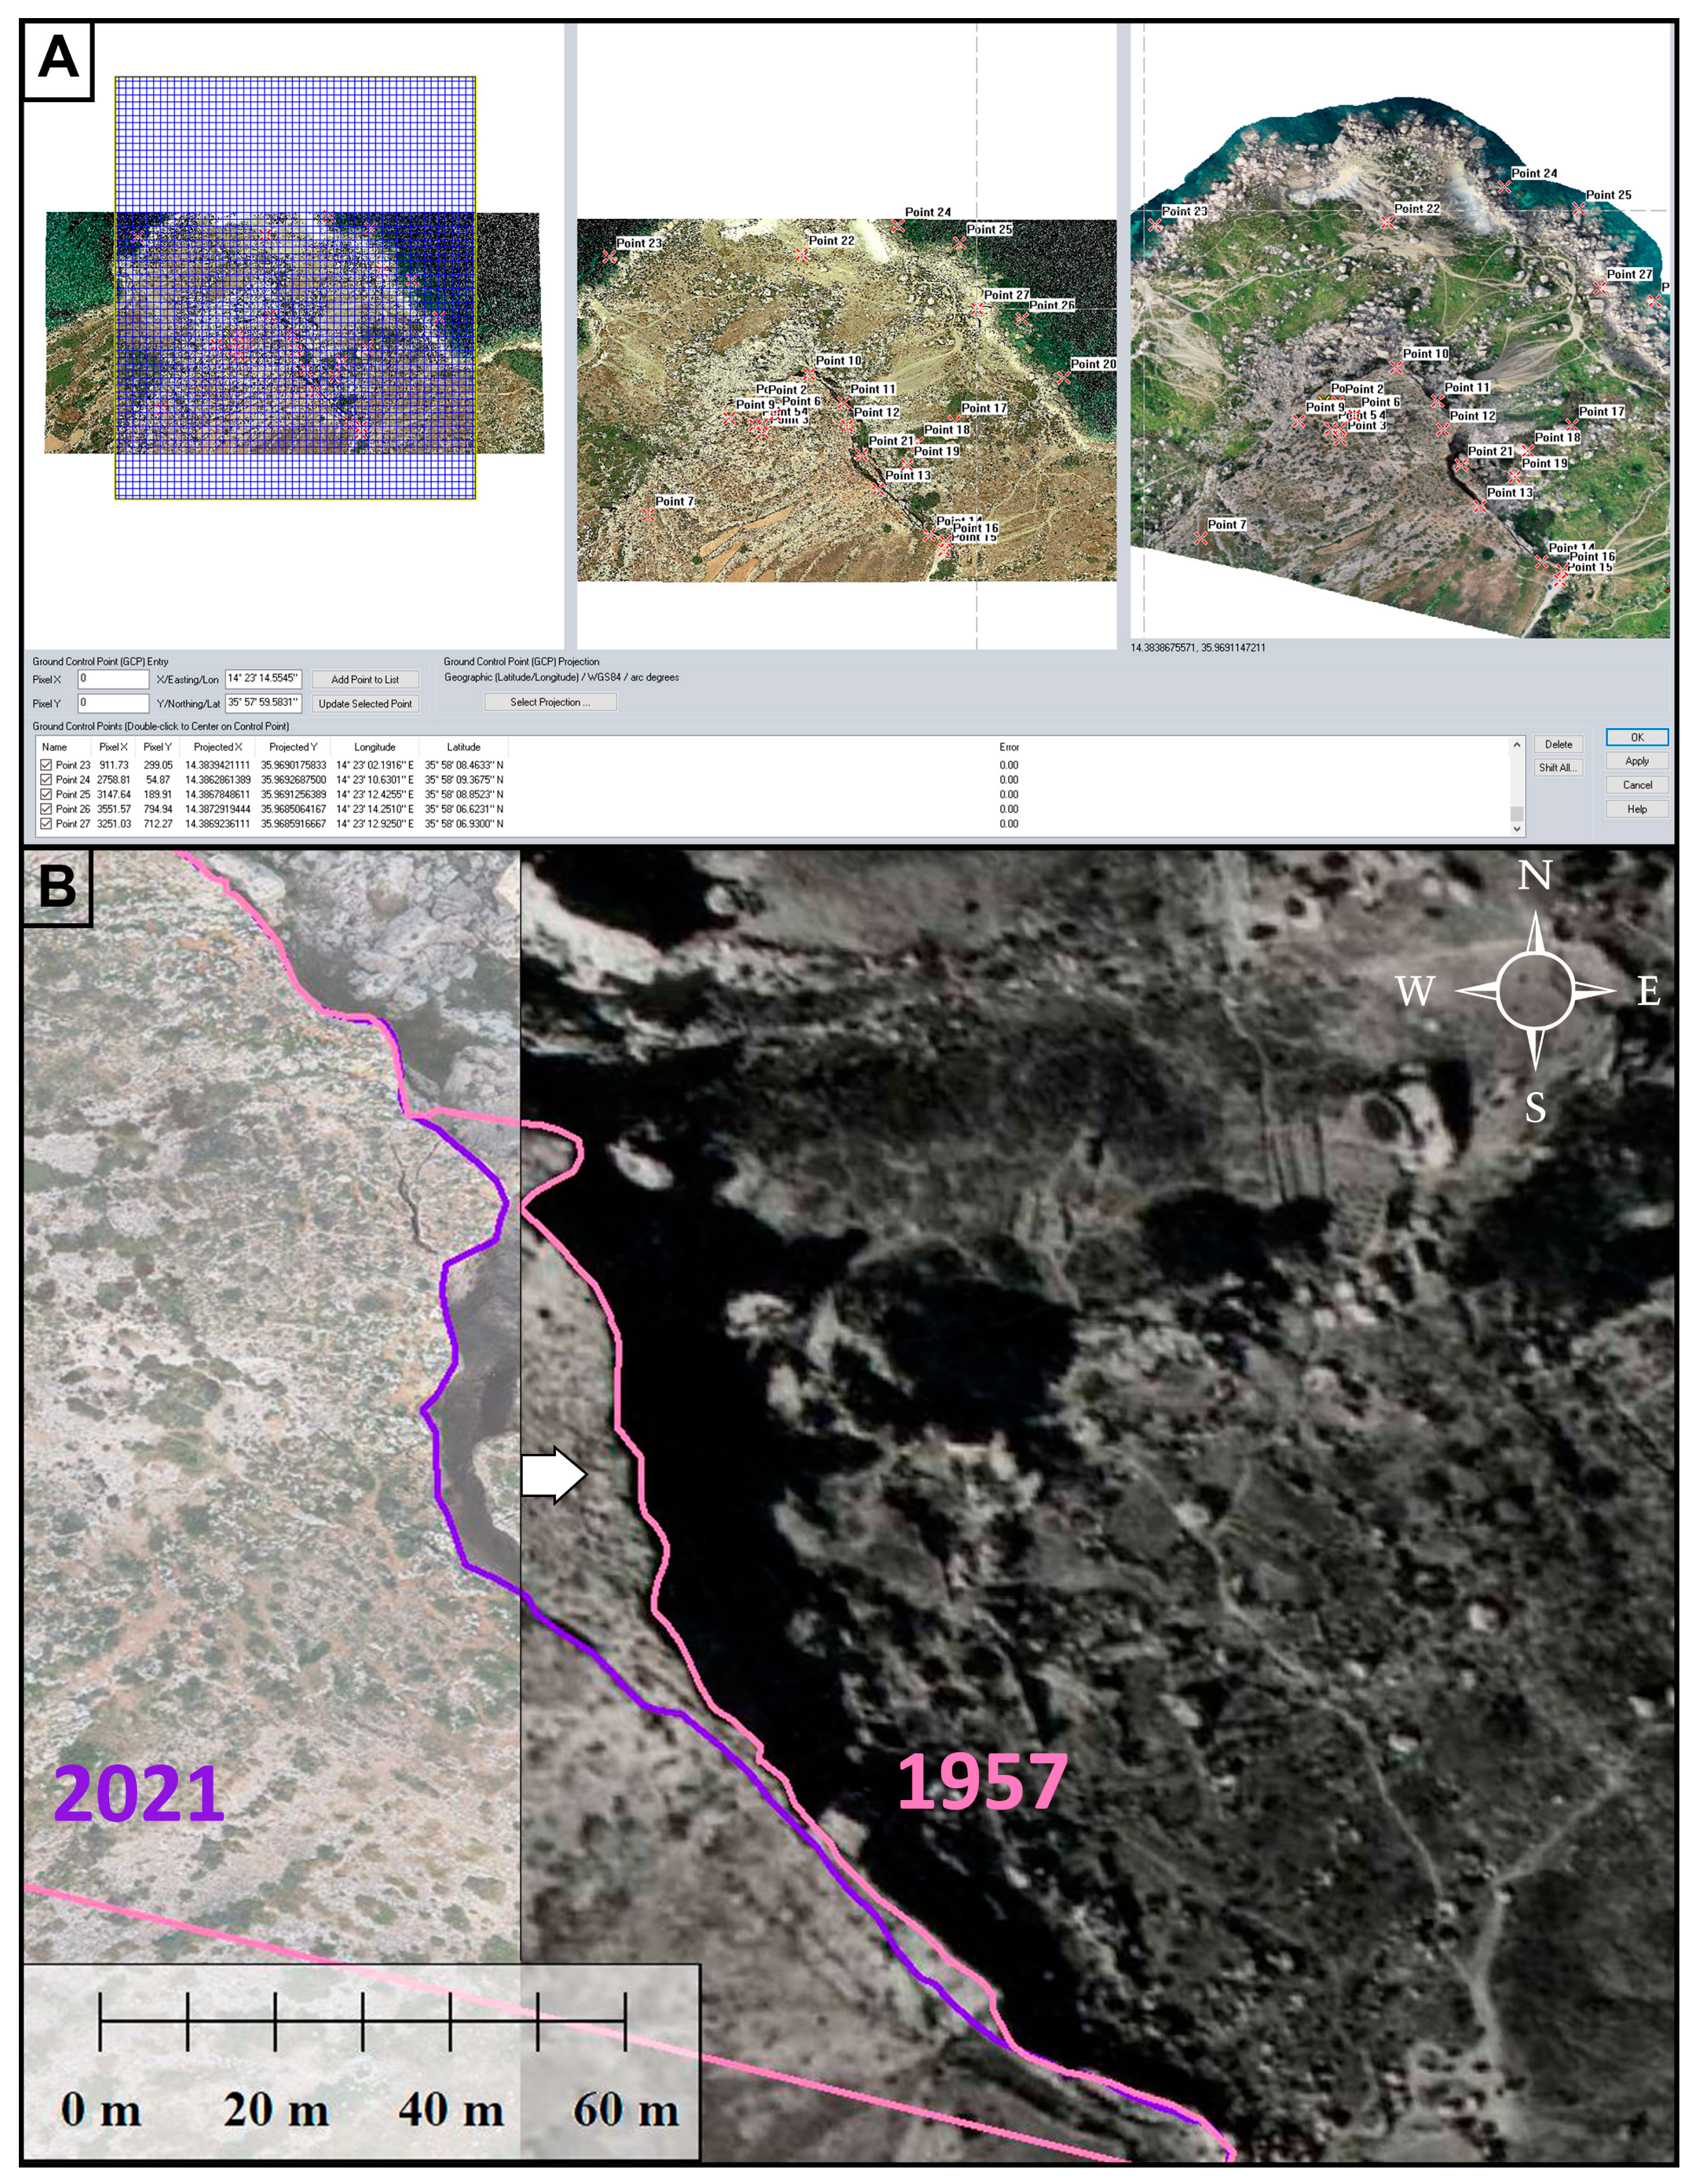
3.3. Time-Lapse Imagery Analysis in GIS for the Identification of Blocks Movement

The geophysical investigation highlights the current state of erosion of the Selmun cliff: gravitational processes of various types (lateral spread, topple and fall) affect the different portions of the slope depending on the nature of the rocks involved and the variable geometry of the slope. The set of these processes determines the progressive retreat of the cliff, in particular with detachments of isolated blocks or collapses of limited portions of rock starting from the top cliff edge constituted by the upper coralline limestone. The 3D digital model of Selmun promontory was used to map and measure important features such as fractures, joints and large boulders. In addition to this, accurate orthomosaics were rendered and compared with aerial and satellite images captured between 1957 and 2021. All this information was combined into a common GIS database. In this study, a temporal reconstruction of the detachments was produced and the trajectories followed by the blocks of UCL that detached from the Selmun cliff were reconstructed. This study focused on the east side of the Selmun promontory, as it is the most active side, from the point of view of the collapses, in the last sixty-four years. Historical aerial images were acquired starting from 1957 and subsequently integrated into a GIS together with satellite images starting from 2009 and UAV images from 2018 and 2021 (Table 1).
The UAV orthomosaic reconstructed by photogrammetric processing [1] was used as a reference image for the geographical correction of aerial and satellite images. The image alignment tool called ‘rectify imagery’ in Global Mapper® GIS software [48] was used for the assignment of the geographical position and the scale of the non-georeferenced images. Georeferencing was carried out through the use of Ground Control Points (GCPs) that were entered manually (Figure 4A). This is frequently applied when working with paper maps that have been scanned and other non-geotagged images. Once the images were georeferenced, it was possible to qualitatively verify the level of overlap with the reference orthomosaic of 2021 (Figure 4B). Finally, polygons of a different colour for each year, corresponding to the edge of the promontory cliff and to the detached blocks along the slope, were traced within the GIS for each georeferenced image.

4. Results

4.1. Geophysics Investigations Results

The main results obtained by deploying two ERT arrays (S-T and U-V) in the area on Selmun promontory (Malta) are presented. The interpretation of both sections is supported by geological observations in the field and from the 3D model. In particular, from the ST profile, it was identified the contact between BC and GL. Given the high accuracy of vertical resolution that the Wenner configuration provides, the latter was considered the most suitable data to confirm the stratigraphic limits and thicknesses involved in the S-T profile (Figure 5). Furthermore, the two-dimensional resistivity model was corrected by using data taken with a differential GNSS system. The highest resistivity values (about 150 Ωm) were observed at around 50 m above sea level. This can be attributed to the formation of the UCL. Conversely, the portion described in blue (resistivity values of about 5 to 10 Ωm) corresponded to the BC. The contact between BC and GL was also evident in the bottom part of the profile. This interpretation may present higher uncertainty due to its lateral position in the resistivity model. However, it was also supported by extrapolation of this contact from surrounding outcrops using the 3D digital model.
The U-V ERT profile was acquired above the plateau formed by UCL with Wenner, Schlumberger and Dipole–Dipole configurations (Figure 6). Results that were obtained from the three arrays were consistent and showed comparable models. Overall, a medium to high resistivity layer (values between 500 up and 3000 Ωm) was found to be present in the first 18 m to 20 m of the profile (approximately). A second layer appeared from the 18 m to 20 m below the ground level till the bottom of the profile. The first georesistivity layer can be interpreted to be UCL while the second can be considered as being BC. The UCL also presented inhomogeneities that can be attributed to vertical cracks or fractures. Such local high resistivity values can be attributed to weathered areas in areas close to the cliff (with values below 500 Ω consistent with the profile S-T), or to change in sedimentological facies with different composition or texture. The geometry of the promontory and the possibility to access all its faces using the 3D digital model confirmed that the UCL-BC boundary derived from the resistivity model was within the expected depth range.
The GPR surveyed area on top of the Selmun’s plateau was characterized by a topographic difference in altitude of about 20 m from northwest to southeast, which was corrected with GNSS data. All profiles were interpreted in order to identify potential anomalies associated with the presence of vertical discontinuities. The results of the four GPR profiles show different anomalies due to the cracks in the UCL. The four georadar profiles were overlaid on the DEM in the GIS project, in which the vertical fractures hypothesised by the interpretation of the georadar anomalies were traced (Figure 7). Some inconsistencies were noted along the edges of the cliff of the Selmun promontory and the detected GPR anomalies corresponded to the visible fractures on the surface that were mapped by the UAV-generated orthomosaic. The maximum depth reached by the electromagnetic waves was about 20 m and corresponded to the stratigraphic contact between UCL and BC.
The joint persistence of the visible fractures was also analysed by measuring the size or extent of each joint inside a plane. This significantly affects the characteristics of fragmentation during the lateral diffusion and block sliding processes that cause the outer portion of the limestone plateau to detach and fall [49]. The mapped joints were identified as a complex network of discontinuity. According to the ISRM Commission that is presented as Figure 8 [50], joints with very low and low persistence values are in the minority (14% both), since the largest percentage of joints measured have medium (47%), very-high (25%) and high (14%) persistence.

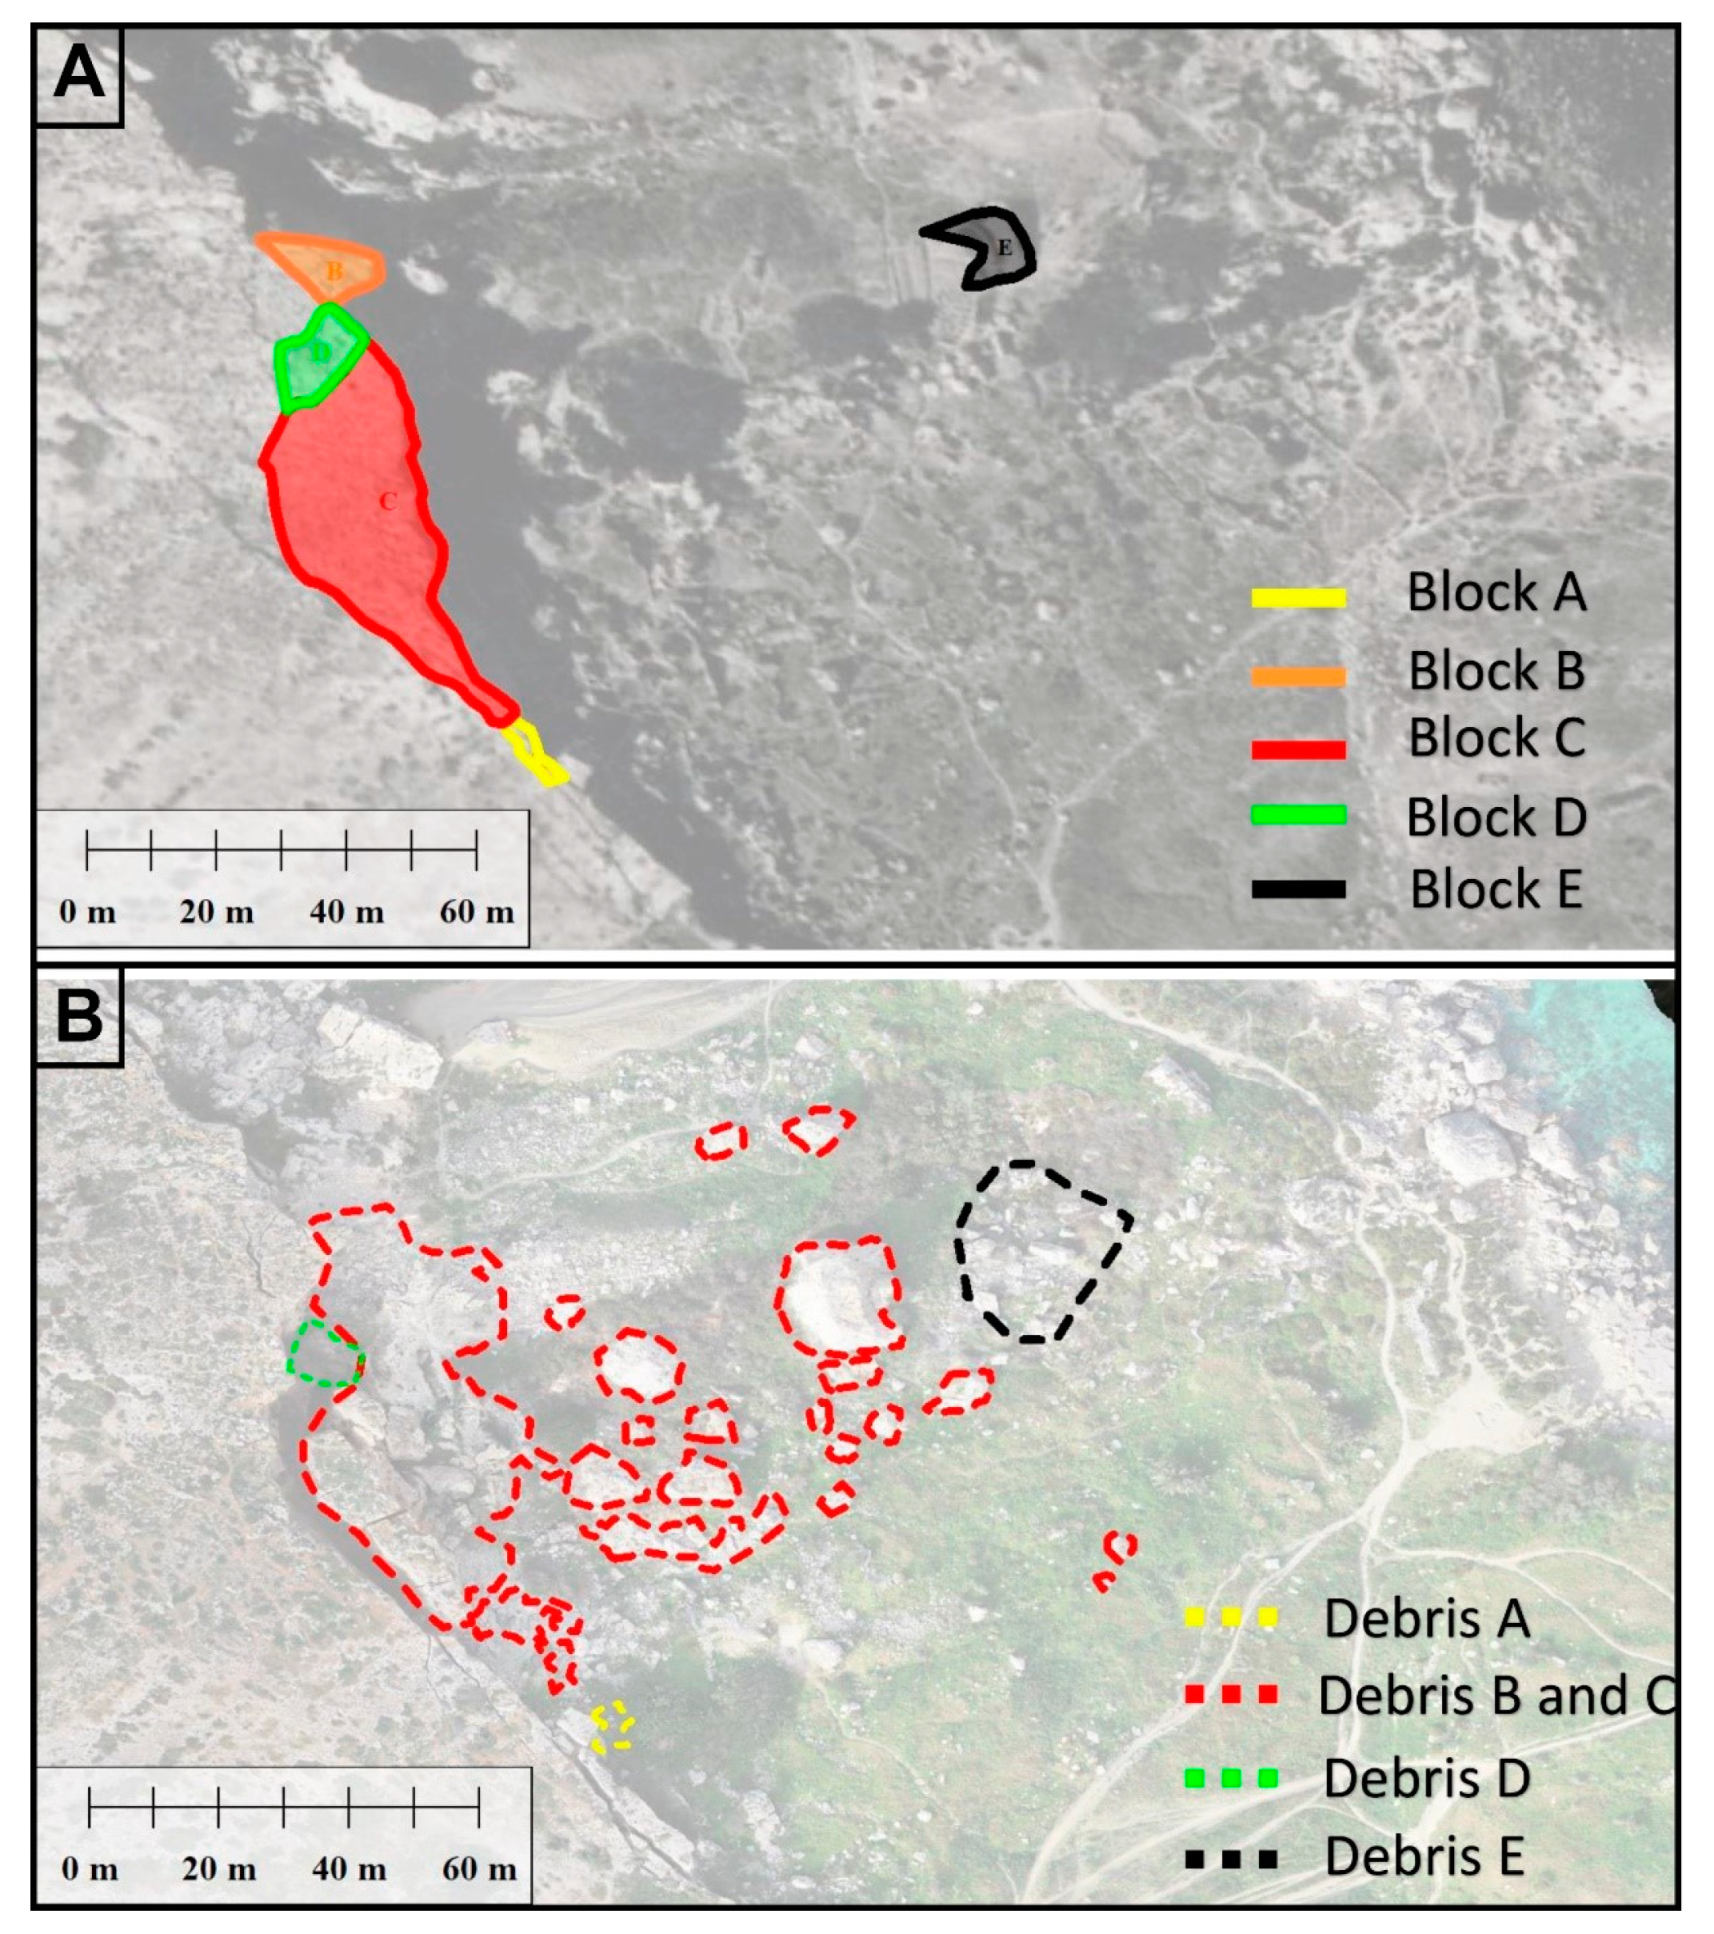
4.2. Multi-Temporal Data Analysis Results

The results of the qualitative multi-temporal analysis in GIS are presented in Figure 9A, which highlights the blocks that detached in the time interval of 1957 to 2021, and in Figure 9B, which maps the diffusion along the slope of the blocks that collapsed. In addition, the area of the polygons representing the active blocks in the last sixty-four years was also measured.
The data suggested that the collapse of block ‘A’ (20,726 sq m) occurred between 1957 and 1967, while the propagation of a fracture separating blocks ‘B’ and ‘C’ from the cliff took place between 1978 and 1988. The image captured in 1988 was of a lower resolution than the others used in this study. However, it still allowed for information on the widening of the fracture that separated block ‘C’ from the cliff to be extracted. Between 1988 and 1998, blocks ‘B’ (84,695 sq m) and ‘C’ (708 sq m) completely detached from the cliff and were distributed along the blue clay slope. Finally, between 1998 and 2008, block ‘D’ (92,519 sq m) collapsed. One can note that block ‘E’, that can be seen along the slope in the first image of 1957, maintained its position and morphology until 1988. Photos captured after this date show the block shattered. This might suggest that block ‘E’ was shattered on impact with boulders ‘B’ and/or ‘C’ that detached between 1988 and 1998. A summary of the temporal reconstruction of these events is presented in Table 2.
It should also be noted that due to the limited number of aerial images available, the time intervals in which the collapses occurred can be confined to the minimum range of ten years. Nowadays, such a limitation is no longer present due to modern technologies such as aerial drones and the availability of high-resolution satellite images on a daily basis with global coverage.

5. Discussion

The results of the ERT investigation allowed for the definition of the stratigraphic boundaries of the subsurface in 2D profiles. The differences in resistivity values of limestone formations (i.e., GL and UCL) with clay formations (BC) were found to be contrasting. Therefore, this approach can be used to identify the stratigraphic boundaries in similar geological settings. Resistivity values within the UCL showed a relatively high variation that can be attributed to original rock characteristics or later alterations, such as fracturing or weathering. The detected inhomogeneities, such as the fractures in the UCL, should be treated cautiously. The GPR data provided a better resolution and allowed for the identification of features within the UCL. The comparison of the C-D GPR B-Scan with the topographically corrected U-V electrical resistivity tomography profile, that was acquired along the same line, allowed for the differences in the considered cases to be highlighted (Figure 10).
From the obtained results, it is evident that GPR offered a higher resolution for the identification of fractures in rocks. The higher resolution data allows a starting point for the hypothesis of bottom-up vertical fracture propagation in gravity-induced lateral propagation processes, as demonstrated by [51,52,53,54]. Moreover, in this case, the GPR methodology was also more cost effective. Since the data did not require model inversion and interpretation, the results were more reliable. Moreover, data acquisition was easier and less time consuming. This is a big advantage over ERT. In this case, four GPR profiles with GNSS positioning data were acquired in about 20 min by a single operator. An ERT profile with 32 electrodes required about three hours for the installation/removal of electrodes and data acquisition in the different configurations and involved the participation of a team of three operators.
ERT offers greater penetration into the different geological strata. In fact, with the ERT method, it was possible to penetrate beyond the UCL-BC interface and the penetration depth was limited by the length of the array. However, it should be noted that the inversion process required some uncertainties that are difficult to quantify, especially in the deeper sectors of the tomography. This is because the sensitivity usually decreased with distance from the electrodes. To reduce these uncertainties, other sources of information, such as direct observations where possible, or the use of independent geophysical methods, should be considered. In comparison, GPR electromagnetic waves penetrated up to the UCL-BC interface and were unable to penetrate the BC, probably due to the high conductivity of the clays. In general, both techniques are complementary and it is preferable to use them together to better narrow down the results. In addition, for the interpretation of the results of these techniques, it is essential to know the local geology.
Through the integration of the results obtained during the geophysical surveys with the geological data collected from the UAV-photogrammetry, a 3D geological model of the Selmun promontory could be digitally reconstructed (Figure 11).
The time-lapse imagery analysis methodology that was carried out in this study can be integrated with other techniques that were already applied to the northwest of the Maltese archipelago. For example, the satellite SAR interferometry method [13], and the monitoring of the movement of the blocks through the installation of GNSS sensors [14], are very complementary and can be easily integrated. The main advantage of such a methodology over satellite data is mainly the high spatial resolution of the acquired data via UAVs, which makes it possible to observe and monitor landslide phenomena on a sub-centimetre scale with greater economic and logistical accessibility. This is of a much higher quality than those that can be obtained by methods such as terrestrial laser scanning (TLS) and terrestrial SAR. Furthermore, the multidisciplinary nature of the method elaborated in this research required the development of an open GIS platform that is able to easily integrate other techniques and measurements that will be made in the future. This will improve the degree of accuracy of the results together with the growing technological evolution of the sensors that were used in this study. Possible future work in this study site includes the installation of topographic nails in the areas of the promontory delimited by superficial and buried fractures that may result in further movement, as well as other nails in the areas identified as stable. This will allow the movements of the unstable blocks to be monitored at the millimetre scale. The same topographic nails can also be used as fixed ground control points for the construction of future 3D models by photogrammetry, thus reducing intrinsic errors due to GNSS measurements.
A limitation found in this study was related to the low quality and resolution of some of the historical aerial images. Although it was possible to make a relative historical record of the movement of the largest blocks to investigate small movements, other image-enhancing techniques should be explored. This is not necessary in the case of orthoimages obtained with UAVs, where the resolution and quality of the images allow a wide range of observations.
Another limitation that was found was related to the time of when historical images in Malta were captured. The temporal gap of some surveys was up to 11 years. Technological progress allowed us to bridge this gap due to the low costs of using UAVs. More frequent aerial surveys may be useful in areas characterised by a different geology than the Selmun site, such as the globigerina limestone cliffs in southern Malta, where is quite common to have detachment and rock failures from the cliffs.

6. Conclusions

Even though literature about the challenges involved in monitoring the Maltese coastal environment exist [55,56,57,58,59], a holistic approach is still lacking and deserves more attention. The aim of this research was to develop an integrated method which combined geophysics and geomatics techniques to monitor and study slow-moving landslides that affect Selmun Promontory. The area surveyed in this work was the Selmun promontory located in the northeast of Malta. The site was chosen due to the high rate of erosive processes affecting the cliffs and also because the erosion process is similar to those occurring along the rest of the northern Maltese coast and sections of the coastline in Gozo. In addition, the lack of anthropization did not influence and compromise the observation of these erosive phenomena over a period of 64 years. This allowed data to be more easily collected and was not influenced by human activities. A series of geospatial datasets captured by satellite, UAV, as well as in situ measurements, were integrated into a geographic information system. The photogrammetric drone survey carried out by [1], combined with the high accuracy of the ground control points measured by differential GNSS, allowed the exporting of accurate output, such as 3D model, orthomosaic and DEM, that were fundamental for the planning of the geophysical measurements. In the GIS environment, all the fractures visible from the orthomosaic were mapped and measured by [1], while the thicknesses of the UCL and BC were measured in this study using the 3D model. The geophysical survey, that was carried out in the Selmun area, consisted of two ERT profiles and four low-frequency ground penetrating radar profiles which allowed to measure the thicknesses of the UCL and the BC and then, validate the measurements estimated from the analysis of the 3D model. From these geophysical investigations, possible fractures were identified that propagate from the UCL–BC contact upwards and, therefore, not visible from the surface. In addition, other geomatic investigations were carried out using the UAV-derived orthomosaic as a reference for georeferencing historical aerial photos and integrated into the GIS database together with satellite images for a total temporal coverage of 64 years. This multi-temporal analysis made it possible to reconstruct the historical profile of the cliff and date the various collapses that occurred, estimating the volumes of rock involved. The results obtained from the geophysical methods are useful for indirectly mapping and monitoring the evolution of fractures over time and, therefore, allow for a broader view of the dynamics of the erosive processes affecting the high coasts. The approach used in this study can be summarised in the schematic sketch of Figure 12. In particular, the approach proposed in this study together with in situ measurements (e.g., use of seismic sensors, tiltmeters) can be coupled in order to implement a real-time monitoring system, which can aim in alerting authorities in case of imminent potential collapses.
In fact, monitoring of unstable cliff areas could provide an important contribution to hazard and risk assessment, and a vital tool for coastal zone management and civil protection. The great advantage of the approach presented in this paper is given by the possibility of integrating into a GIS environment the output obtained from geomatics and geophysical investigations [60] to obtain results that can have enormous relevance for the design of rockfall mitigation measures. This, in principle, can represent a critical point for the Civil Protection authorities and decision makers, and also because routes for emergency responders or rescue teams could be completely blocked and in this type of site, are not easily accessible. For example, this kind of study can also help in planning potential procedures of intervention taking into account that the site, in certain instances, could be reached only by sea vessels and/or using helicopters. Overall, the designed GIS platform (duly extended and implemented along the Maltese coasts) could allow authorities to better address social, economic and environmental issues which are of pressing importance in our modern and growing society.

Author Contributions

Conceptualization, E.C. and S.D.; methodology, E.C. and L.G.; software, E.C.; validation, E.C., L.G. and S.D.; formal analysis, E.C., L.G. and S.D.; investigation, E.C., L.G., S.D., D.P. and G.V.; resources, S.D. and E.C.; data curation, E.C. and L.G.; writing—original draft preparation, E.C., L.G. and D.P.; writing—review and editing, E.C., L.G., S.D., A.G., R.I., S.M., D.P., P.I. and G.V.; visualization, E.C., L.G. and S.D.; supervision, E.C., S.D., S.M. and G.V.; project administration, E.C. and S.D.; funding acquisition, S.D., G.V. and S.M. All authors have read and agreed to the published version of the manuscript.

Funding

This work was partially supported by the project Satellite Investigation to study POcket BEach Dynamics (SIPOBED, SRF-2021-2S1, PI: Sebastiano D’Amico), by Coastal Satellite Assisted Governance (tools, technique, models) for Erosion” project (Coastal SAGE, grant agreement number SRF-2020-1S1; PI: Gianluca Valentino) and by the University of Rome “Sapienza” (2016—PI: Salvatore Martino) “Cliff slope failures in the coastal morpho-dynamics: from back to forward-analysis of processes through monitoring and multi-modelling approaches” project.

Data Availability Statement

The 3D digital model of Selmun promontory is available at this link https://portal.opentopography.org/dataspace/dataset?opentopoID=OTDS.112021.32633.1 (accessed on 30 December 2022). GIS dataset and ancillary data can be provided upon request.

Acknowledgments

The authors would like to thank Pauline Galea (Geosciences Department, University of Malta), George Buhagiar, Christopher Gauci and Daniel Fenech (Research & Planning Unit, Ministry for Public Works and Planning) for their valuable suggestions to improve the overall quality of this manuscript. The authors also want to thank the Planning Authority for providing the historical aerial images.

Conflicts of Interest

The authors declare no conflict of interest.

References

  1. Colica, E.; D’Amico, S.; Iannucci, R.; Martino, S.; Gauci, A.; Galone, L.; Galea, P.; Paciello, A. Using unmanned aerial vehicle photogrammetry for digital geological surveys: Case study of Selmun promontory, northern of Malta. Environ. Earth Sci. 2021, 80, 1–14. [Google Scholar] [CrossRef]
  2. Magri, O.; Mantovani, M.; Pasuto, A.; Soldati, M. Geomorphological investigation and monitoring of lateral spreading along the north-west coast of Malta. Geogr. Fis. E Din. Quat. 2008, 31, 171–180. [Google Scholar]
  3. Cruden, D.M.; Varnes, D.J. Landslide types and processes. In Landslides, Investigation and Mitigation; Turner, A.K., Schuster, R.L., Eds.; National Academy Press: Washington, DC, USA, 1996; pp. 36–75. [Google Scholar]
  4. Gigli, G.; Frodella, W.; Mugnai, F.; Tapete, D.; Cigna, F.; Fanti, R.; Intrieri, E.; Lombardi, L. Instability mechanisms affecting cultural heritage sites in the Maltese Archipelago. Nat. Hazards Earth Syst. Sci. 2012, 12, 1883–1903. [Google Scholar] [CrossRef] [Green Version]
  5. D’Amico, S.; Lombardo, G.; Panzera, F. Seismicity of the Mediterranean Region and mitigation of earthquake losses. Phys. Chem. Earth 2013, 63, 1–2. [Google Scholar] [CrossRef]
  6. Corominas, J.; Mavrouli, O.; Ruiz-Carulla, R. Rockfall occurrence and fragmentation. In Workshop on World Landslide Forum; Springer: Cham, Switzerland, 2017; pp. 75–97. [Google Scholar]
  7. Ruiz-Carulla, R.; Corominas, J.; Mavrouli, O. A Fractal Fragmentation Model for Rockfalls. Landslides 2017, 14, 875–889. [Google Scholar] [CrossRef]
  8. Jongmans, D.; Garambois, S. Geophysical investigation of landslides: A review. Bull. De La Société Géologique De Fr. 2007, 178, 101–112. [Google Scholar] [CrossRef] [Green Version]
  9. Vessia, G.; Parise, M.; Tromba, G. A strategy to address the task of seismic micro-zoning in landslide-prone areas. Adv. Geosci. 2013, 35, 23–35. [Google Scholar] [CrossRef] [Green Version]
  10. Günther, A.; Reichenbach, P.; Malet, J.P.; Van Den Eeckhaut, M.; Hervás, J.; Dashwood, C.; Guzzetti, F. Tier-based approaches for landslide susceptibility assessment in Europe. Landslides 2013, 10, 529–546. [Google Scholar] [CrossRef] [Green Version]
  11. Van Westen, C.J.; Castellanos, E.; Kuriakose, S.L. Spatial data for landslide susceptibility, hazard, and vulnerability assessment: An overview. Eng. Geol. 2008, 102, 112–131. [Google Scholar] [CrossRef]
  12. Guzzetti, F.; Carrara, A.; Cardinali, M.; Reichenbach, P. Landslide hazard evaluation: A review of current techniques and their application in a multi-scale study, Central Italy. Geomorphology 1999, 31, 181–216. [Google Scholar] [CrossRef]
  13. Mantovani, M.; Devoto, S.; Forte, E.; Mocnik, A.; Pasuto, A.; Piacentini, D.; Soldati, M. A multidisciplinary approach for rock spreading and block sliding investigation in the north-western coast of Malta. Landslides 2013, 10, 611–622. [Google Scholar] [CrossRef]
  14. Mantovani, M.; Devoto, S.; Piacentini, D.; Prampolini, M.; Soldati, M.; Pasuto, A. Advanced SAR interferometric analysis to support geomorphological interpretation of slow-moving coastal landslides (Malta, Mediterranean Sea). Remote Sens. 2016, 8, 443. [Google Scholar] [CrossRef] [Green Version]
  15. Hyde, H.P.T. Geology of the Maltese Islands; Lux Press: Montreal, QC, Canada, 1955. [Google Scholar]
  16. Pedley, H.M.; House, M.R.; Waugh, B. The geology of Malta and Gozo. Proc. Geol. Assoc. 1976, 87, 325–341. [Google Scholar] [CrossRef]
  17. Pedley, H.M.; House, M.R.; Waugh, B. The geology of the Pelagian block: The Maltese Islands. In The Ocean Basins and Margins; Springer: Boston, MA, USA, 1978; pp. 417–433. [Google Scholar]
  18. Pedley, M. The Calabrian stage, Pleistocene highstand in Malta: A new marker for unravelling the late Neogene and quaternary history of the islands. J. Geol. Soc. 2011, 168, 913–926. [Google Scholar] [CrossRef]
  19. Scerri, S. Sedimentary evolution and resultant geological landscapes. In Landscapes and Landforms of the Maltese Islands; Gauci, R., Schembri, J.A., Eds.; Springer: Cham, Switzerland, 2019; pp. 31–47. [Google Scholar]
  20. Continental Shelf Department Malta, Geological Map of the Maltese Islands (1:10,000). 2022. Available online: https://experience.arcgis.com/experience/04736039724248fb8dc52615f1528e2e/page/Page/ (accessed on 30 December 2022).
  21. Iannucci, R.; Martino, S.; Paciello, A.; D’Amico, S.; Galea, P. Engineering geological zonation of a complex landslide system through seismic ambient noise measurements at the Selmun Promontory (Malta). Geophys. J. Int. 2018, 213, 1146–1161. [Google Scholar] [CrossRef]
  22. Iannucci, R.; Martino, S.; Paciello, A.; D’Amico, S.; Galea, P. Investigation of cliff instability at Għajn Ħadid Tower (Selmun Promontory, Malta) by integrated passive seismic techniques. J. Seismol. 2020, 24, 897–916. [Google Scholar] [CrossRef]
  23. Goudie, A. Encyclopedia of Geomorphology; Routledge: London, UK, 2004. [Google Scholar]
  24. Hoek, E.; Bray, J.D. Rock Slope Engineering; CRC Press: Boca Raton, FL, USA, 1981. [Google Scholar]
  25. Loke, M.H. Rapid 2-D Resistivity & IP Inversion Using the Least-Squares Method: Wenner (α, β, γ), Dipole–Dipole, Inline Pole-Pole, Pole-Dipole, Equatorial Dipole-Dipole, Offset pole-dipole, Wenner-Schlumberger, Gradient and Non-Conventional Arrays. On Land, Aquatic and Cross-Borehole Surveys. 2015. Available online: http://web.gps.caltech.edu/classes/ge111/Docs/Res2dinv_Guide.Pdf (accessed on 30 December 2022).
  26. Loke, M.H. General Public License, RES2DINVx64 Ver. 4,8.10 Date 2-5-2018, Copyright (2018) M.H.Loke. 2018. Available online: https://www.geotomosoft.com/downloads.php (accessed on 18 September 2022).
  27. Loke, M.H.; Barker, R.D. Rapid least-squares inversion of apparent resistivity pseudosections by a quasi-Newton method1. Geophys. Prospect. 1996, 44, 131–152. [Google Scholar] [CrossRef]
  28. Davis, J.L.; Annan, A.P. Ground-penetrating radar for high-resolution mapping of soil and rock stratigraphy 1. Geophys. Prospect. 1989, 37, 531–551. [Google Scholar] [CrossRef]
  29. Caselle, C.; Bonetto, S.; Comina, C.; Stocco, S. GPR surveys for the prevention of karst risk in underground gypsum quarries. Tunn. Undergr. Space Technol. 2020, 95, 103137. [Google Scholar] [CrossRef]
  30. Colica, E.; Antonazzo, A.; Auriemma, R.; Coluccia, L.; Catapano, I.; Ludeno, G.; D’Amico, S.; Persico, R. GPR investigation at the archaeological site of Le Cesine, Lecce, Italy. Information 2021, 12, 412. [Google Scholar] [CrossRef]
  31. Persico, R.; D’Amico, S.; Matera, L.; Colica, E.; De Giorgio, C.; Alescio, A.; Sammut, C.; Galea, P. GPR Investigations at St John’s Co-Cathedral in Valletta; 17(3-GPR in Civil and Environmental Engineering: Recent Methodological Advances). Near Surf. Geophys. 2019, 17, 213–229. [Google Scholar]
  32. Shukla, S.B.; Chowksey, V.M.; Prizomwala, S.P.; Ukey, V.M.; Bhatt, N.P.; Maurya, D.M. Internal sedimentary architecture and coastal dynamics as revealed by ground penetrating radar, Kachchh coast, western India. Acta Geophys. 2013, 61, 1196–1210. [Google Scholar] [CrossRef]
  33. Leucci, G.; Persico, R.; De Giorgi, L.; Lazzari, M.; Colica, E.; Martino, S.; Iannucci, R.; Galone, L.; D’Amico, S. Stability Assessment and Geomorphological Evolution of Sea Natural Arches by Geophysical Measurement: The Case Study of Wied Il-Mielah Window (Gozo, Malta). Sustainability 2021, 13, 12538. [Google Scholar] [CrossRef]
  34. Ercoli, M.; Pauselli, C.; Frigeri, A.; Forte, E.; Federico, C. “Geophysical paleoseismology” through high resolution GPR data: A case of shallow faulting imaging in Central Italy. J. Appl. Geophys. 2013, 90, 27–40. [Google Scholar] [CrossRef]
  35. Grandjean, G.; Gourry, J.C. GPR data processing for 3D fracture mapping in a marble quarry (Thassos, Greece). J. Appl. Geophys. 1996, 36, 19–30. [Google Scholar] [CrossRef]
  36. Saponaro, A.; Dipierro, G.; Cannella, E.; Panarese, A.; Galiano, A.M.; Massaro, A. A UAV-GPR Fusion Approach for the Characterization of a Quarry Excavation Area in Falconara Albanese, Southern Italy. Drones 2021, 5, 40. [Google Scholar] [CrossRef]
  37. Zanzi, L.; Hojat, A.; Ranjbar, H.; Karimi-Nasab, S.; Azadi, A.; Arosio, D. GPR measurements to detect major discontinuities at Cheshmeh-Shirdoosh limestone quarry, Iran. Bull. Eng. Geol. Environ. 2019, 78, 743–752. [Google Scholar] [CrossRef]
  38. Cardarelli, E.; Marrone, C.; Orlando, L. Evaluation of tunnel stability using integrated geophysical methods. J. Appl. Geophys. 2003, 52, 93–102. [Google Scholar] [CrossRef]
  39. Orlando, L.; Marchesi, E. Georadar as a tool to identify and characterise solid waste dump deposits. J. Appl. Geophys. 2001, 48, 163–174. [Google Scholar] [CrossRef]
  40. Schönemann, E.; Becker, M.; Springer, T. A new approach for GNSS analysis in a multi-GNSS and multi-signal environment. J. Geod. Sci. 2011, 1, 204–214. [Google Scholar] [CrossRef] [Green Version]
  41. Yelf, R. Where is true time zero? In Proceedings of the Tenth International Conference on Grounds Penetrating Radar, Delft, The Netherlands, 21–24 June 2004; GPR 2004. IEEE: Piscataway, NJ, USA, 2014; Volume 1, pp. 279–282. [Google Scholar]
  42. Soldovieri, F.; Prisco, G.; Persico, R. Application of microwave tomography in hydrogeophysics: Some examples. Vadose Zone J. 2008, 7, 160–170. [Google Scholar] [CrossRef]
  43. Steinbeck, L.; Mester, A.; Zimmermann, E.; Klotzsche, A.; van Waasen, S. In situ time-zero correction for a ground penetrating radar monitoring system with 3000 antennas. Meas. Sci. Technol. 2022, 33, 075904. [Google Scholar] [CrossRef]
  44. Pipan, M.; Baradello, L.; Forte, E.; Prizzon, A. GPR study of bedding planes, fractures, and cavities in limestone. In Proceedings of the Eighth International Conference on Ground Penetrating Radar, SPIE, Gold Coast, Australia, 23–26 May 2000; Volume 4084, pp. 682–687. [Google Scholar]
  45. Bianchini Ciampoli, L.; Tosti, F.; Economou, N.; Benedetto, F. Signal processing of GPR data for road surveys. Geosciences 2019, 9, 96. [Google Scholar] [CrossRef] [Green Version]
  46. Persico, R. Introduction to Ground Penetrating Radar: Inverse Scattering and Data Processing; John Wiley & Sons: Hoboken, NJ, USA, 2014. [Google Scholar]
  47. Martinez, A.; Byrnes, A.P. Modeling dielectric-constant values of geologic materials: An aid to ground-penetrating radar data collection and interpretation. Curr. Res. Earth Sci. 2001, 1–16. [Google Scholar] [CrossRef]
  48. Global Mapper®, Blue Marble Geographics. 2022. Available online: https://www.bluemarblegeo.com/global-mapper/ (accessed on 18 September 2022).
  49. Devoto, S.; Macovaz, V.; Mantovani, M.; Soldati, M.; Furlani, S. Advantages of using UAV digital photogrammetry in the study of slow-moving coastal landslides. Remote Sens. 2020, 12, 3566. [Google Scholar] [CrossRef]
  50. ISRM. International society for rock mechanics commission on standardization of laboratory and field tests: Suggested methods for the quantitative description of discontinuities in rock masses. Int. J. Rock Mech. Min. Sci. Geomech. Abstr. 1978, 15, 319–368. [Google Scholar] [CrossRef]
  51. Bozzano, F.; Bretschneider, A.; Martino, S. Stress–strain history from the geological evolution of the Orvieto and Radicofani cliff slopes (Italy). Landslides 2008, 5, 351–366. [Google Scholar] [CrossRef]
  52. Bozzano, F.; Martino, S.; Prestininzi, A. Ruolo dell’assetto geologico sulle condizioni di stabilità della collina di Gerace (Reggio Calabria, Italia). Ital. J. Geosci. 2010, 129, 280–296. [Google Scholar]
  53. Bozzano, F.; Bretschneider, A.; Esposito, C.; Martino, S.; Prestininzi, A.; Mugnozza, G.S. Lateral spreading processes in mountain ranges: Insights from an analogue modelling experiment. Tectonophysics 2013, 605, 88–95. [Google Scholar] [CrossRef]
  54. Alfaro, P.; Delgado, J.; Esposito, C.; Tortosa, F.G.; Marmoni, G.M.; Martino, S. Time-dependent modelling of a mountain front retreat due to a fold-to-fault controlled lateral spreading. Tectonophysics 2019, 773, 228233. [Google Scholar] [CrossRef]
  55. Farrugia, D.; Galea, P.; D’Amico, S.; Paolucci, E. Sensitivity of ground motion parameters to local shear-wave velocity models: The case of buried low-velocity layers. Soil Dyn. Earthq. Eng. 2017, 100, 196–205. [Google Scholar] [CrossRef]
  56. Iannucci, R.; Martino, S.; Paciello, A.; D’Amico, S. Rock mass characterization coupled with seismic noise measurements to analyze the unstable cliff slope of the Selmun promontory (Malta). In ISRM European Rock Mechanics Symposium-EUROCK 2017; OnePetro: Ostrava, Czech Republic, 20–22 June 2017. [Google Scholar]
  57. Panzera, F.; D’Amico, S.; Lotteri, A.; Galea, P.; Lombardo, G. Seismic site response of unstable steep slope using noise measurements: The case study of Xemxija Bay area, Malta. Nat. Hazards Earth Syst. Sci. 2012, 12, 3421–3431. [Google Scholar] [CrossRef] [Green Version]
  58. Devoto, S.; Hastewell, L.J.; Prampolini, M.; Furlani, S. Dataset of Gravity-Induced Landforms and Sinkholes of the Northeast Coast of Malta (Central Mediterranean Sea). Data 2021, 6, 81. [Google Scholar] [CrossRef]
  59. Soldati, M.; Devoto, S.; Prampolini, M.; Pasuto, A. The spectacular landslide-controlled landscape of the northwestern coast of Malta. In Landscapes and Landforms of the Maltese Islands; Springer: Cham, Switzerland, 2019; pp. 167–178. [Google Scholar]
  60. D’Amico, S.; Galone, L.; Colica, E.; Gauci, A.; Valentino, G.; Piroddi, L.; Iregbeyen, P. Investigating Pocket beach dynamics in Malta: The SIPOBED project. In Proceedings of the 2022 IEEE International Workshop on Metrology for the Sea, Milazzo, Italy, 3–5 October 2022. [Google Scholar] [CrossRef]
Figure 1. (A) Location of the Maltese islands in the Mediterranean Sea and the geomorphological map of the Selmun promontory (Malta) in GIS platform (scale 1:2500) [1]; (B) legend with the sedimentary sequence in the study area; (C) drone photographs showing the Upper Coralline Limestone cliff and its opened joints.
Remotesensing 15 01465 g001
Figure 2. (A) Orthomosaic of the study area with the ERT surveys localization carried out on the Selmun promontory. The fractures visible from the surface are highlighted in orange. (B,C) Photos of ERT fieldwork.
Remotesensing 15 01465 g002
Figure 3. Photo acquired during the georadar survey. The photo shows the tripod and rod of the Differential GNSS, the Phantom 4 Pro UAV used for photogrammetric survey and the Cobra Subecho-70 georadar.
Remotesensing 15 01465 g003
Figure 4. (A) Screenshot of the georeferencing menu in the Global mapper software during the insertion of markers. (B) Comparison between the 1957 aerial orthophoto and the 2021 UAV-based orthomosaic using the GIS “image swipe” tool. The two pink and purple polygons, respectively, indicate the cliff’s profile in the Selmun promontory’s northeast area (Malta) in 1957 and 2021.
Remotesensing 15 01465 g004
Figure 5. ERT array (S-T) on the slope of Selmun promontory (Malta) and its geological interpretation.
Remotesensing 15 01465 g005
Figure 6. ERT array on the plateau of Selmun promontory (Malta).
Remotesensing 15 01465 g006
Figure 7. On the top part of this figure, the GIS project with the DEM overlayed by the georeferenced paths of the four GPR profiles is visible. The white polylines superimposed on the DEM are the visible fractures from the surface, while the yellow lines represent the georadar anomalies interpreted as vertical fractures. The second half of this figure shows the processed B-scans of the four GPR profiles (A-B, C-D, E-F and G-H) and the yellow arrows indicate the vertical fractures.
Remotesensing 15 01465 g007
Figure 8. Percentage of main joint systems recognized in GIS with the classification of joint persistence [50].
Remotesensing 15 01465 g008
Figure 9. Results obtained with the multitemporal analysis. (A) Aerial photo from 1957 in which the blocks that will move in the next sixty-four years were mapped. (B) Orthomosaic obtained from UAVs [1] in which the areas covered by the debris of the blocks that detached between 1957 and 2021 are mapped. Block ‘E’ lay on the slope in 1957 and that was shattered by the probable impact of rolling boulders from blocks ‘B’ and ‘C’ between 1988 and 1998.
Remotesensing 15 01465 g009
Figure 10. Comparison between ERT (U-V) and GPR (C-D) profiles acquired along the same line on the Selmun plateau (Malta). The black dashed line indicates the stratigraphic contact between upper coralline and blue clay.
Remotesensing 15 01465 g010
Figure 11. At the top, there is a three-dimensional view of the DEM of the Selmun promontory (Malta) with the red-dotted line indicating the line followed to section the 3D model (uncertainties evaluated by [1]). Below, in the sectioned profile of the three-dimensional model, the sketch of the local geology reconstructed from the geophysical surveys of ERT and GPR was inserted. The yellow dashed lines on the UCL layer are a sketch (not to scale) of the anomalies detected with the two geophysical techniques.
Remotesensing 15 01465 g011
Figure 12. Schematic sketch for early warning system for cliff failure.
Remotesensing 15 01465 g012
Table 1. Summary table with image information used in this study.
DateSourceSpecs
1957Analogue aerial photo Lens 6″ 4200 feet
Scale 1:8000
1967Analogue aerial photo Lens 6″ Scale 1:4000
1978Analogue aerial photo Lens 152.95 mm Scale 1:10,000
1988Analogue aerial photoLens 153.23 mm
Scale 1:6000
1998Analogue aerial photoLens 303.98 mm
Scale 1:10,000
2008Analogue aerial photoLens 303.55 m
Scale 1:4000
2009Satellite image Maps data: Google, Image © 2022 Maxar TechnologiesN/A
2013Satellite image Maps data: Google, Image © 2022 CNES/AirbusN/A
2017Satellite image Maps data: Google, Image © 2022 Maxar TechnologiesN/A
2018UAV OrthomosaicCamera sensor: 1″ CMOS Effective pixels: 20 M. Lens: FOV 84° 8.8 mm/24 mm (35 mm format equivalent) f/2.8–f/11 auto focus at 1 m–∞
2021UAV OrthomosaicCamera sensor: 1″ CMOS Effective pixels: 20 M. Lens: FOV 84° 8.8 mm/24 mm (35 mm format equivalent) f/2.8–f/11 auto focus at 1 m–∞
Table 2. Summary of the multitemporal analysis. E* is the boulder on the slope that fell apart between 1988 and 1998.
Time-LapseCollapsed BlockArea in Square MetresHeight in Metres
Measured in the 3D Model
Estimated Volume in Cubic Metres (Area × Height)Polygon Colour
1957–1967A215105Yellow
1988–1998B–C85–70810–13850–9204Orange–Red
1998–2008D93121116Green
1988–1998E*77N/AN/ABlack
Disclaimer/Publisher’s Note: The statements, opinions and data contained in all publications are solely those of the individual author(s) and contributor(s) and not of MDPI and/or the editor(s). MDPI and/or the editor(s) disclaim responsibility for any injury to people or property resulting from any ideas, methods, instructions or products referred to in the content.

