

BIM–GIS Integrated Utilization in Urban Disaster Management: The Contributions, Challenges, and Future Directions

Abstract
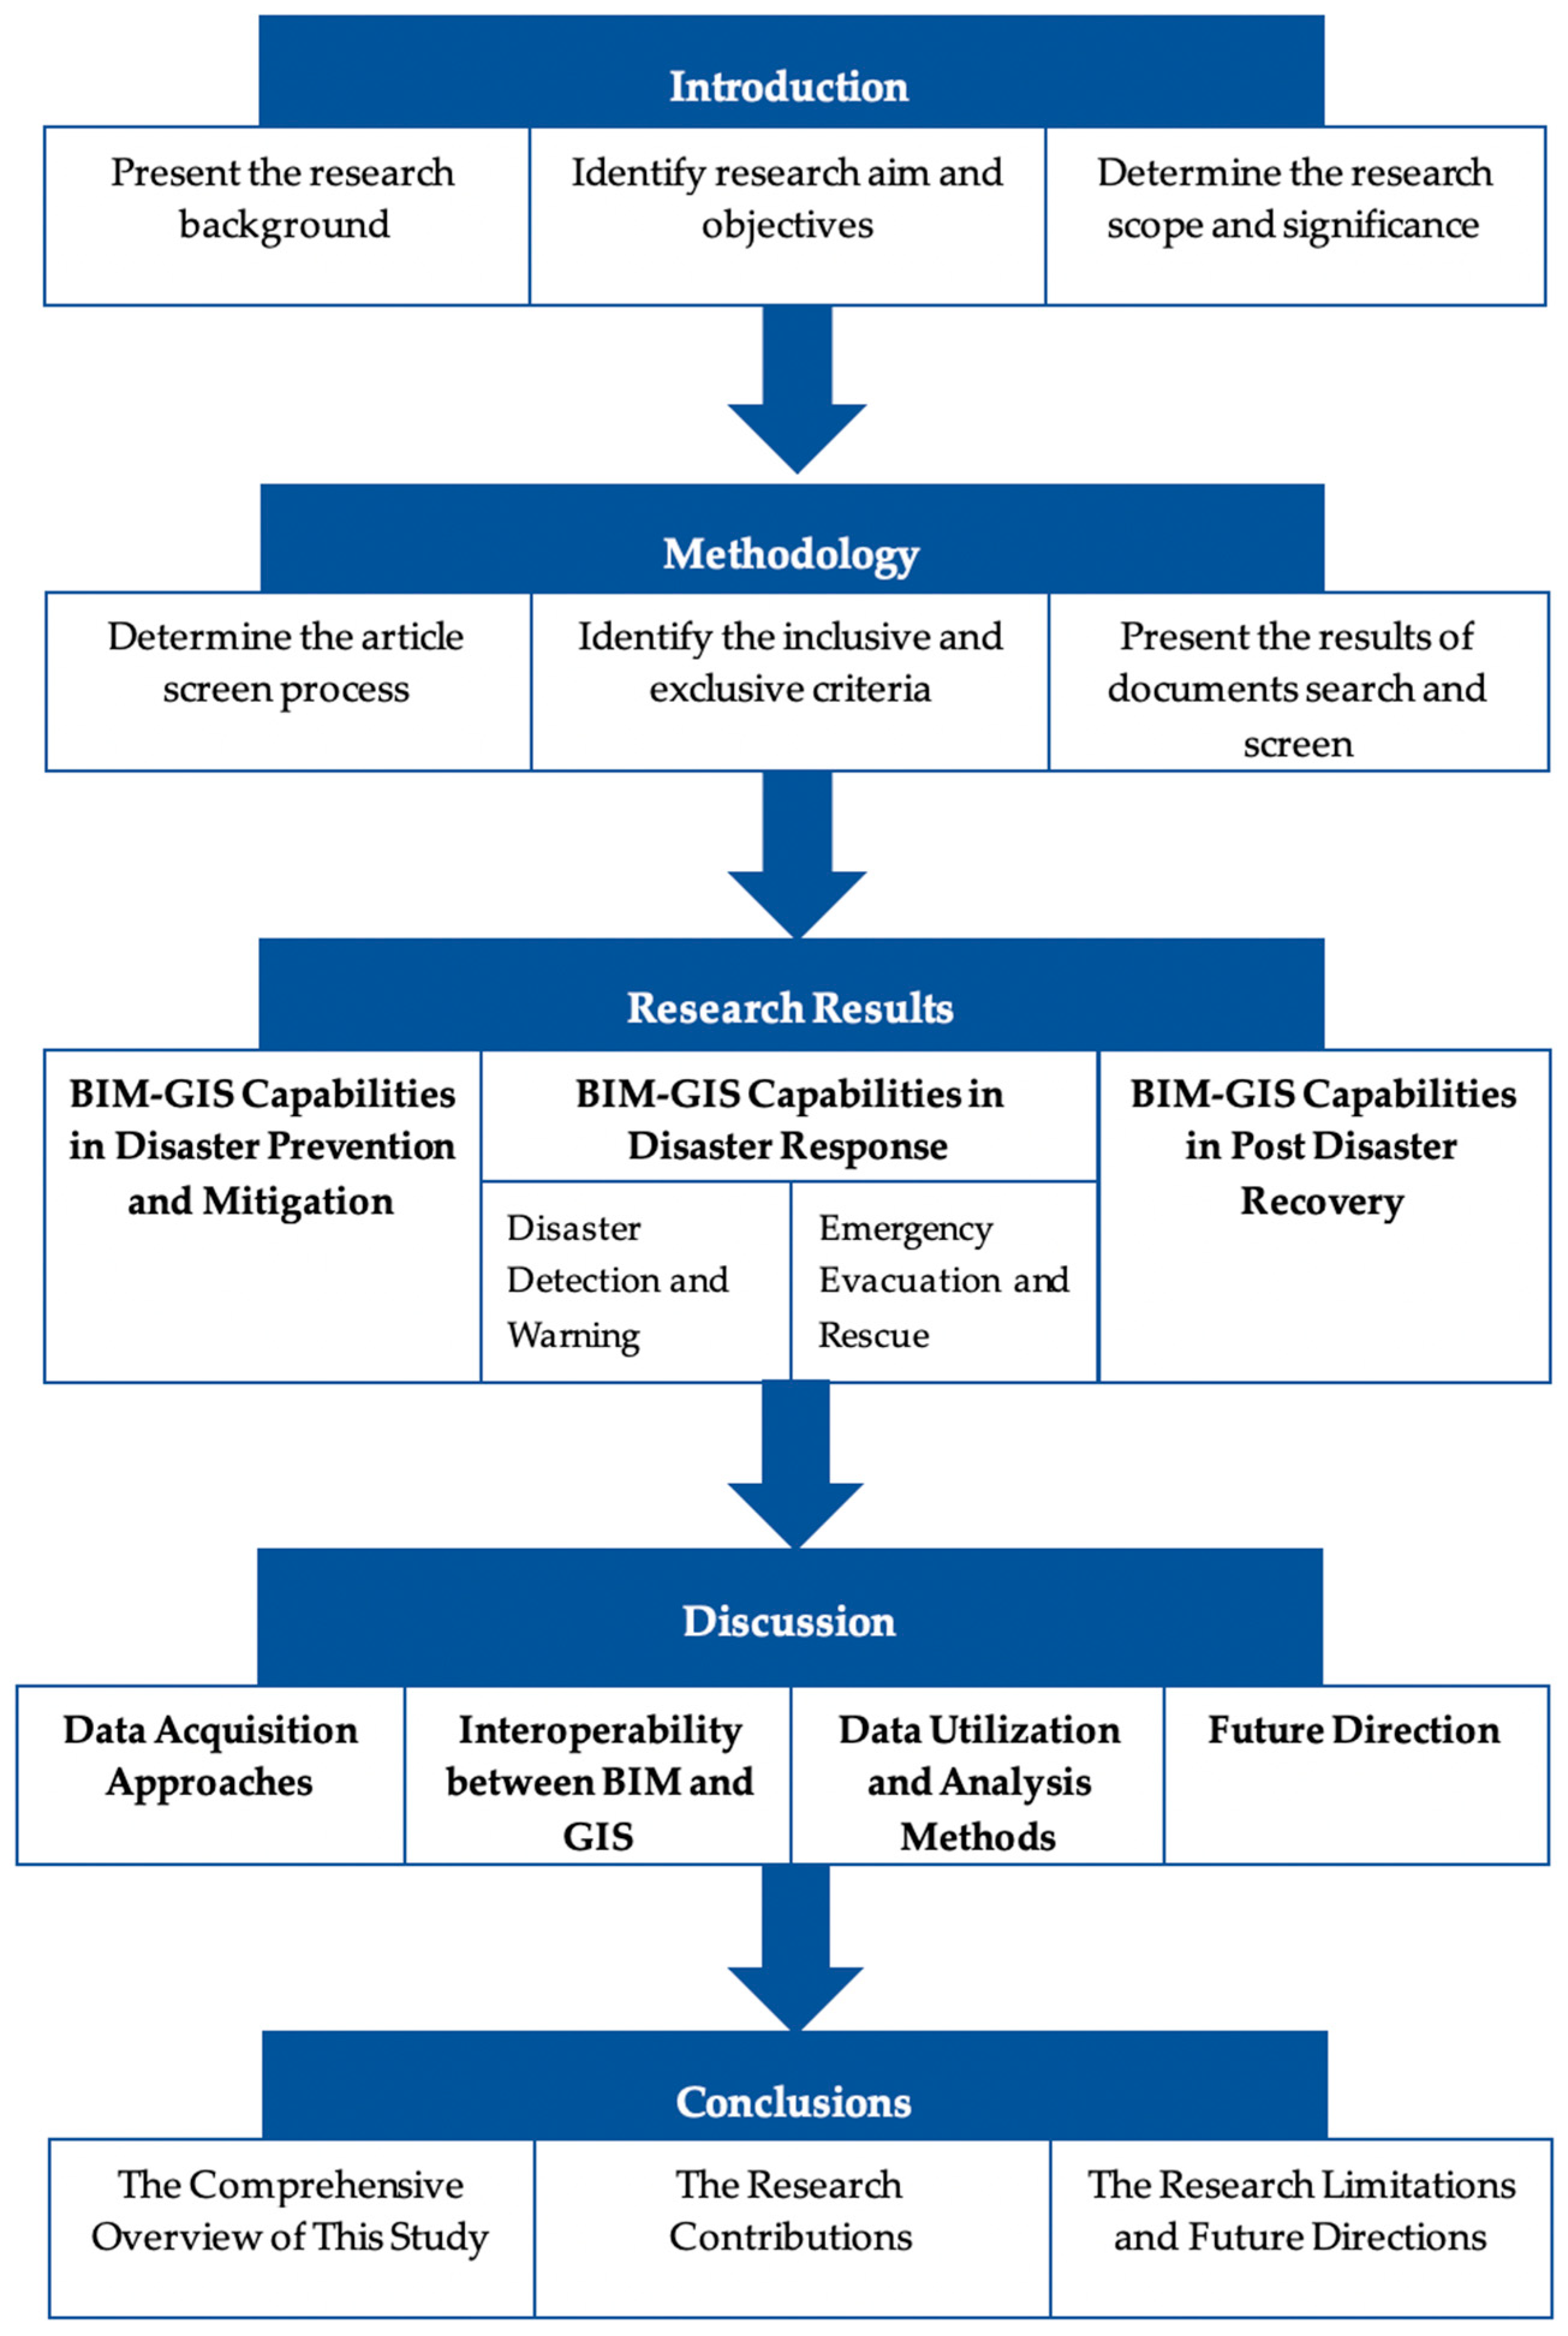
:1. Introduction
- Identify the capabilities of BIM–GIS integration in urban disaster management.
- Discuss and analyze the data acquisition method, interoperability, and data process and utilization methods of BIM–GIS integration in urban disaster management.
- Discuss and summarize the advantages and challenges of BIM–GIS integrated utilization in urban disaster management.
- Identify the future directions of BIM–GIS integrated utilization in urban disaster management.
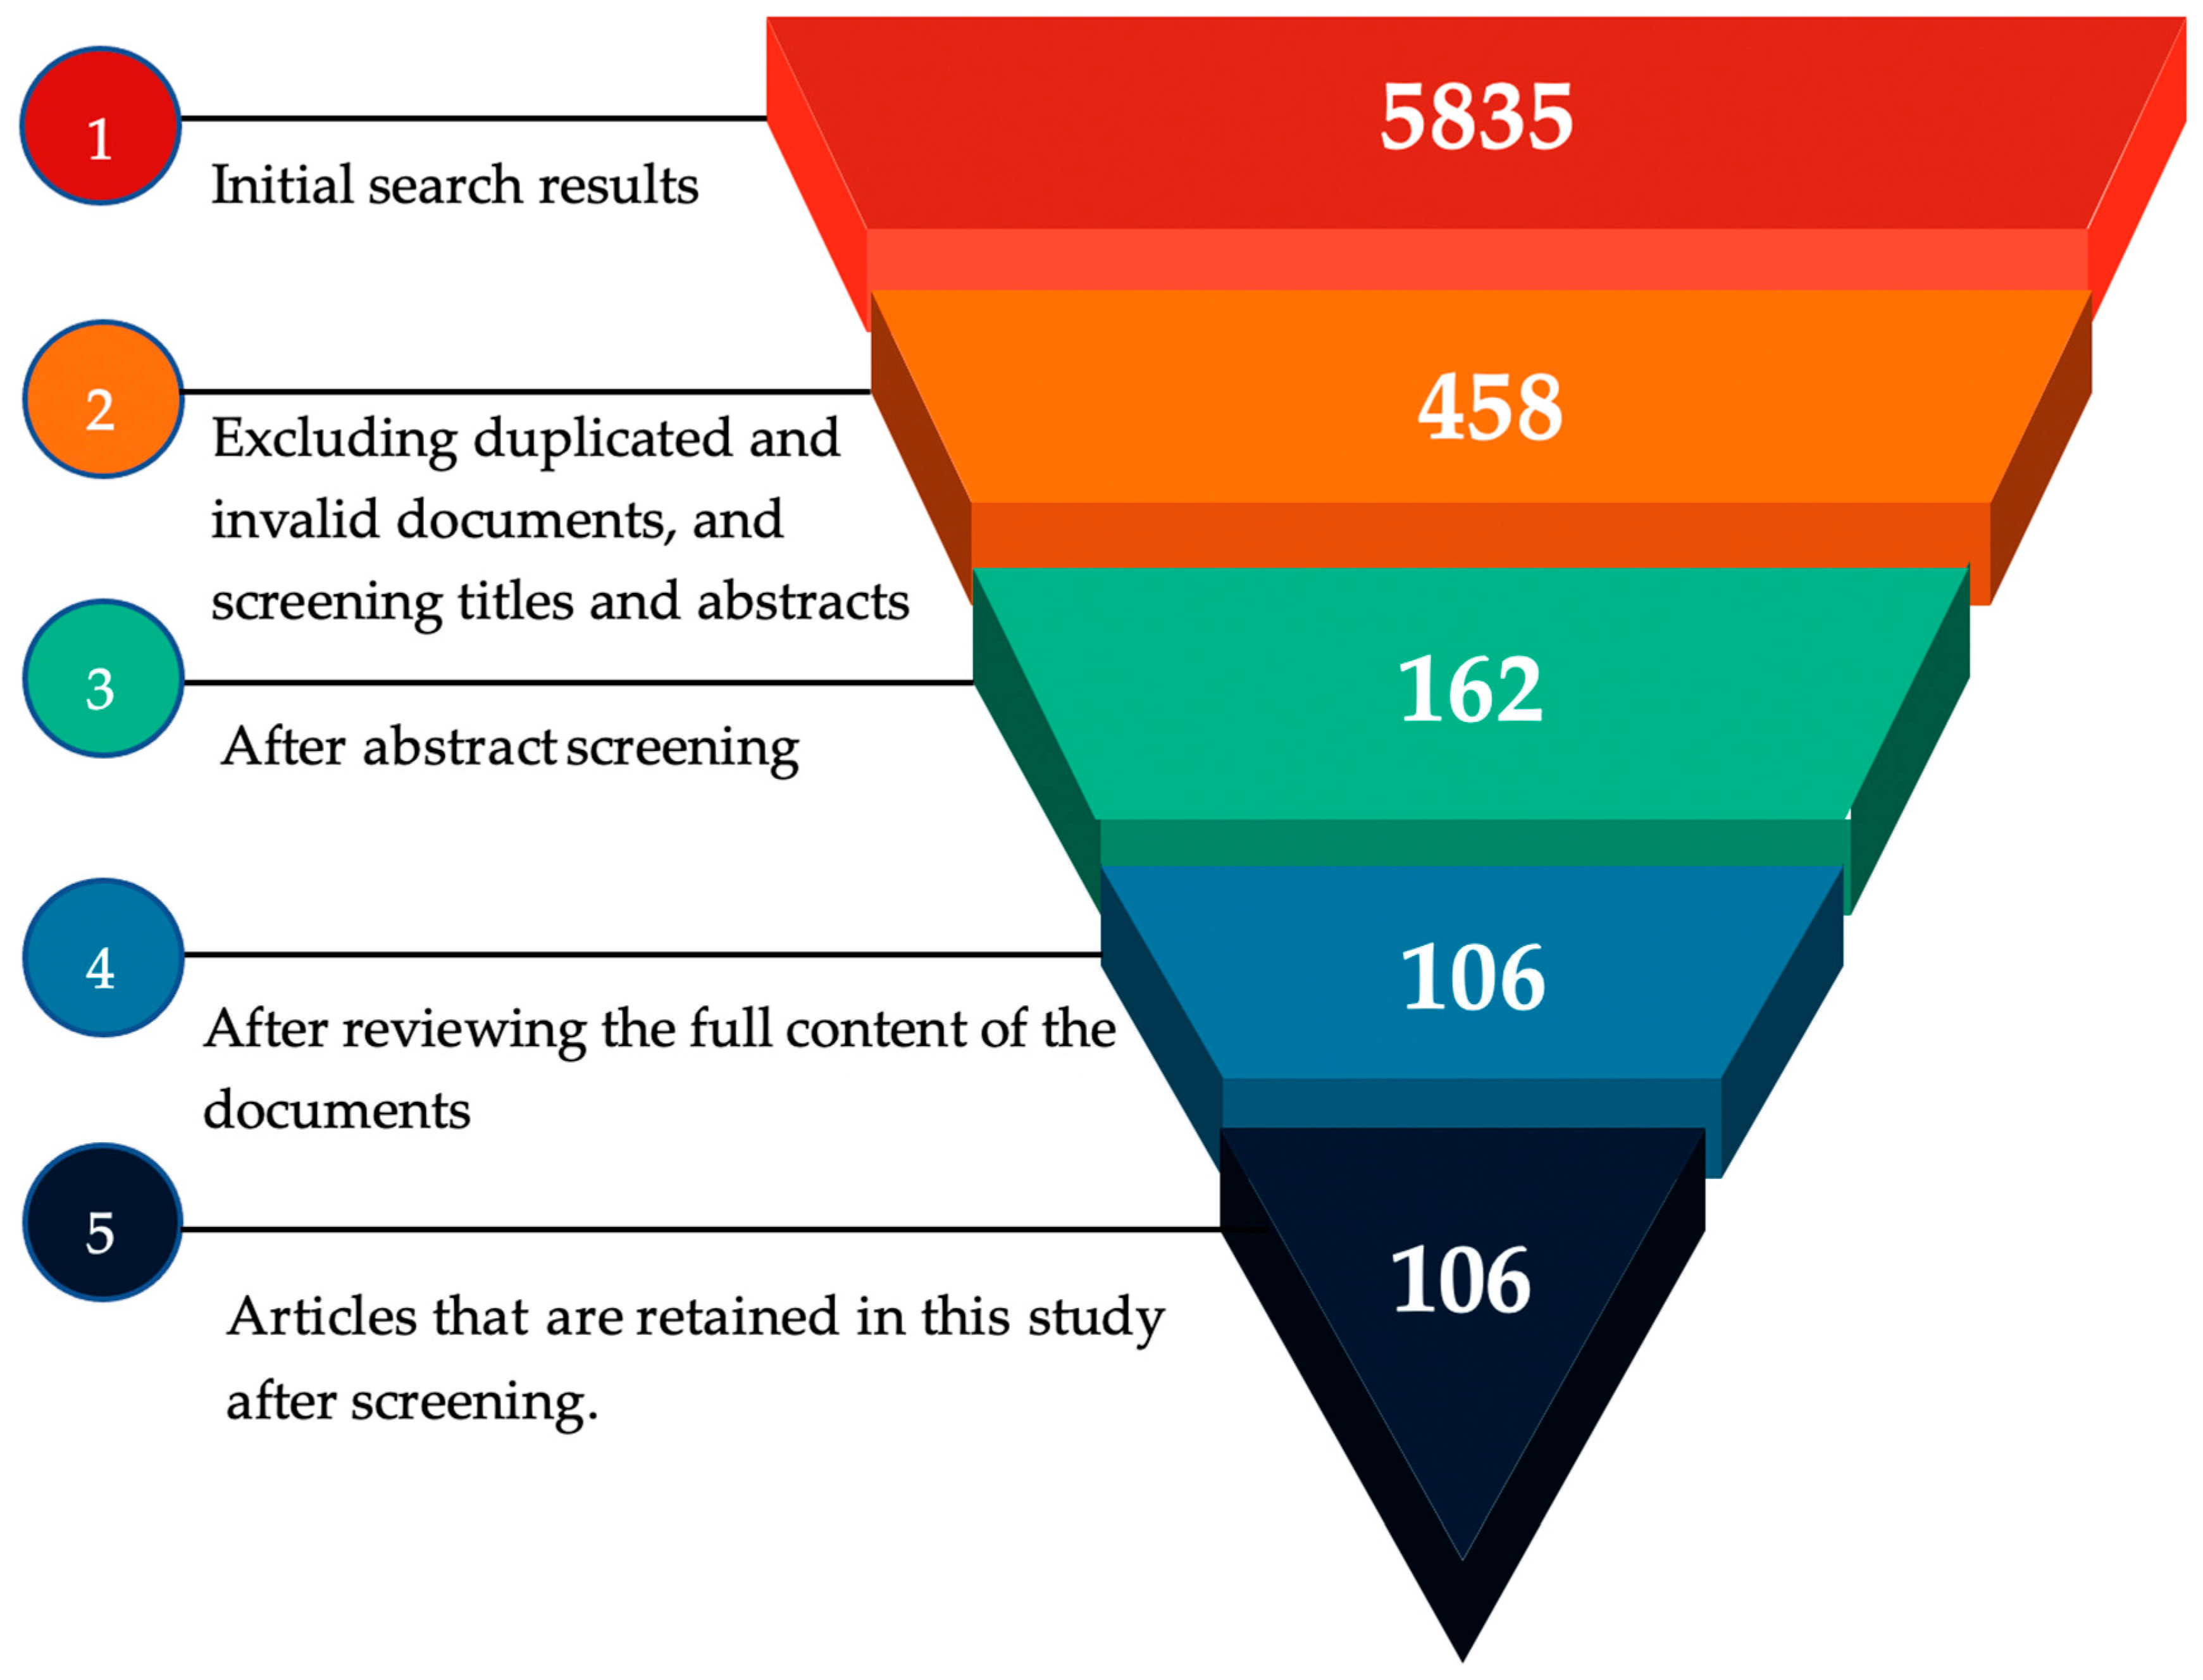
2. Methodology
3. Results
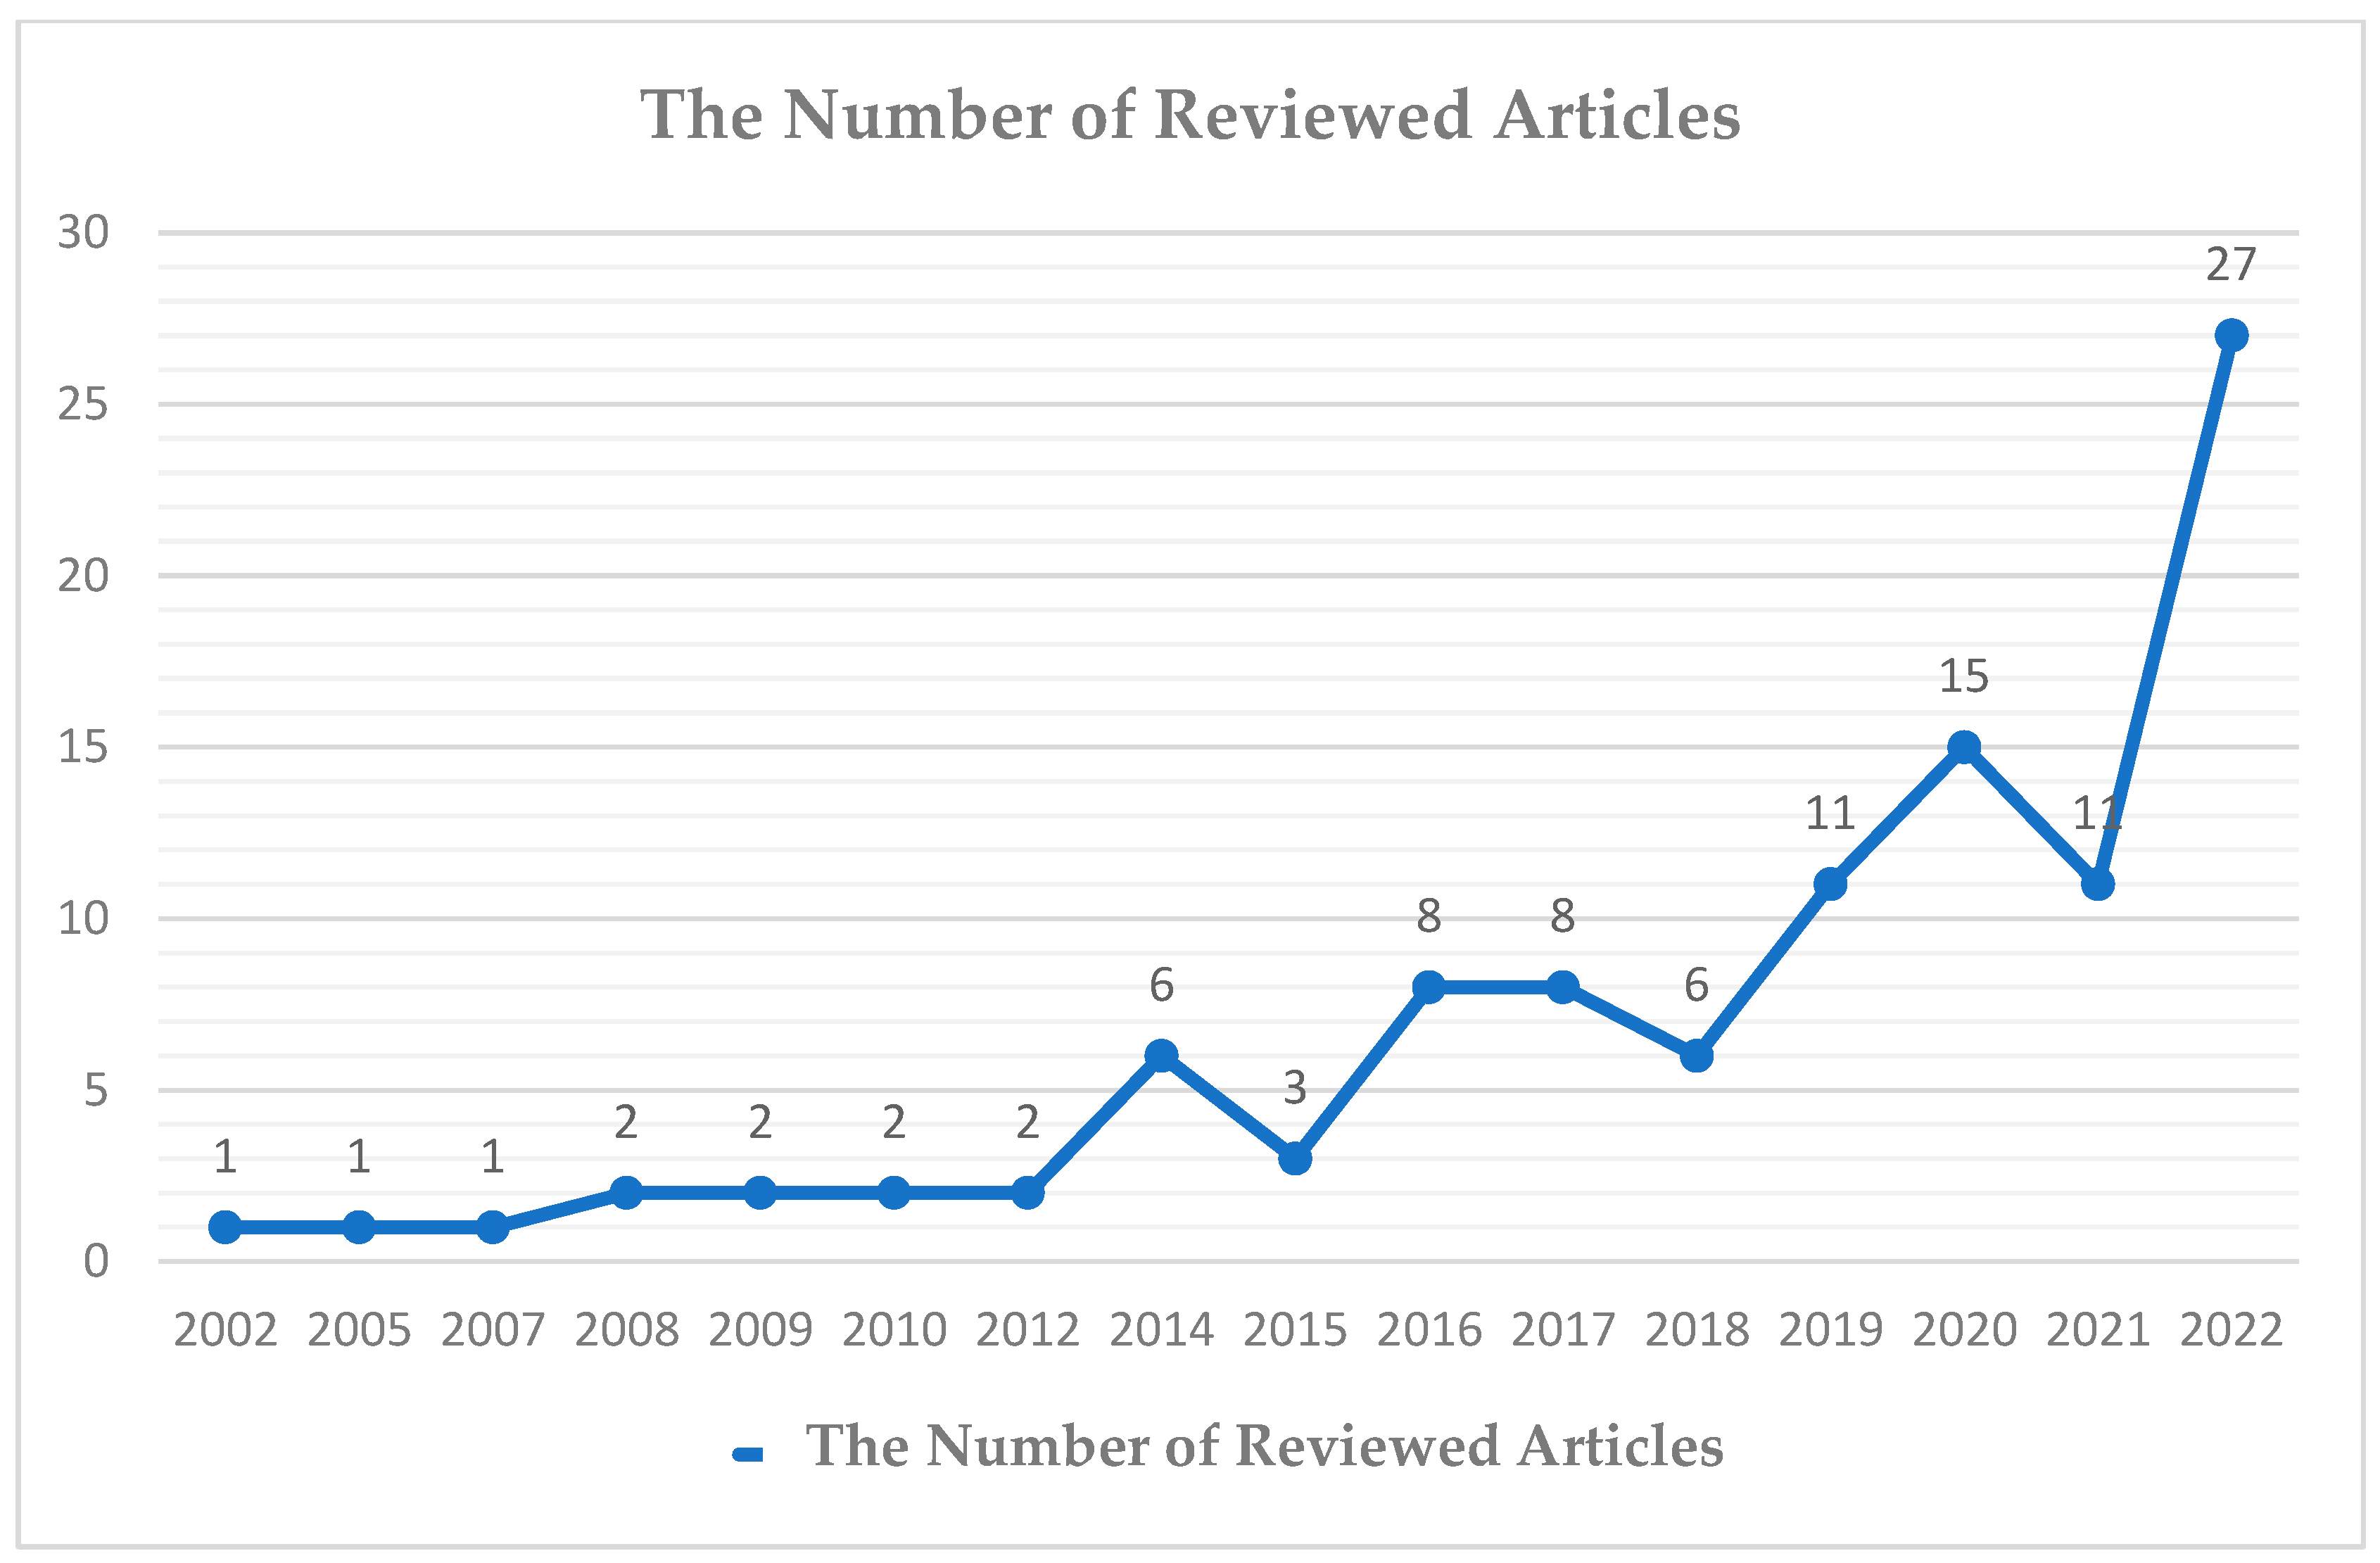
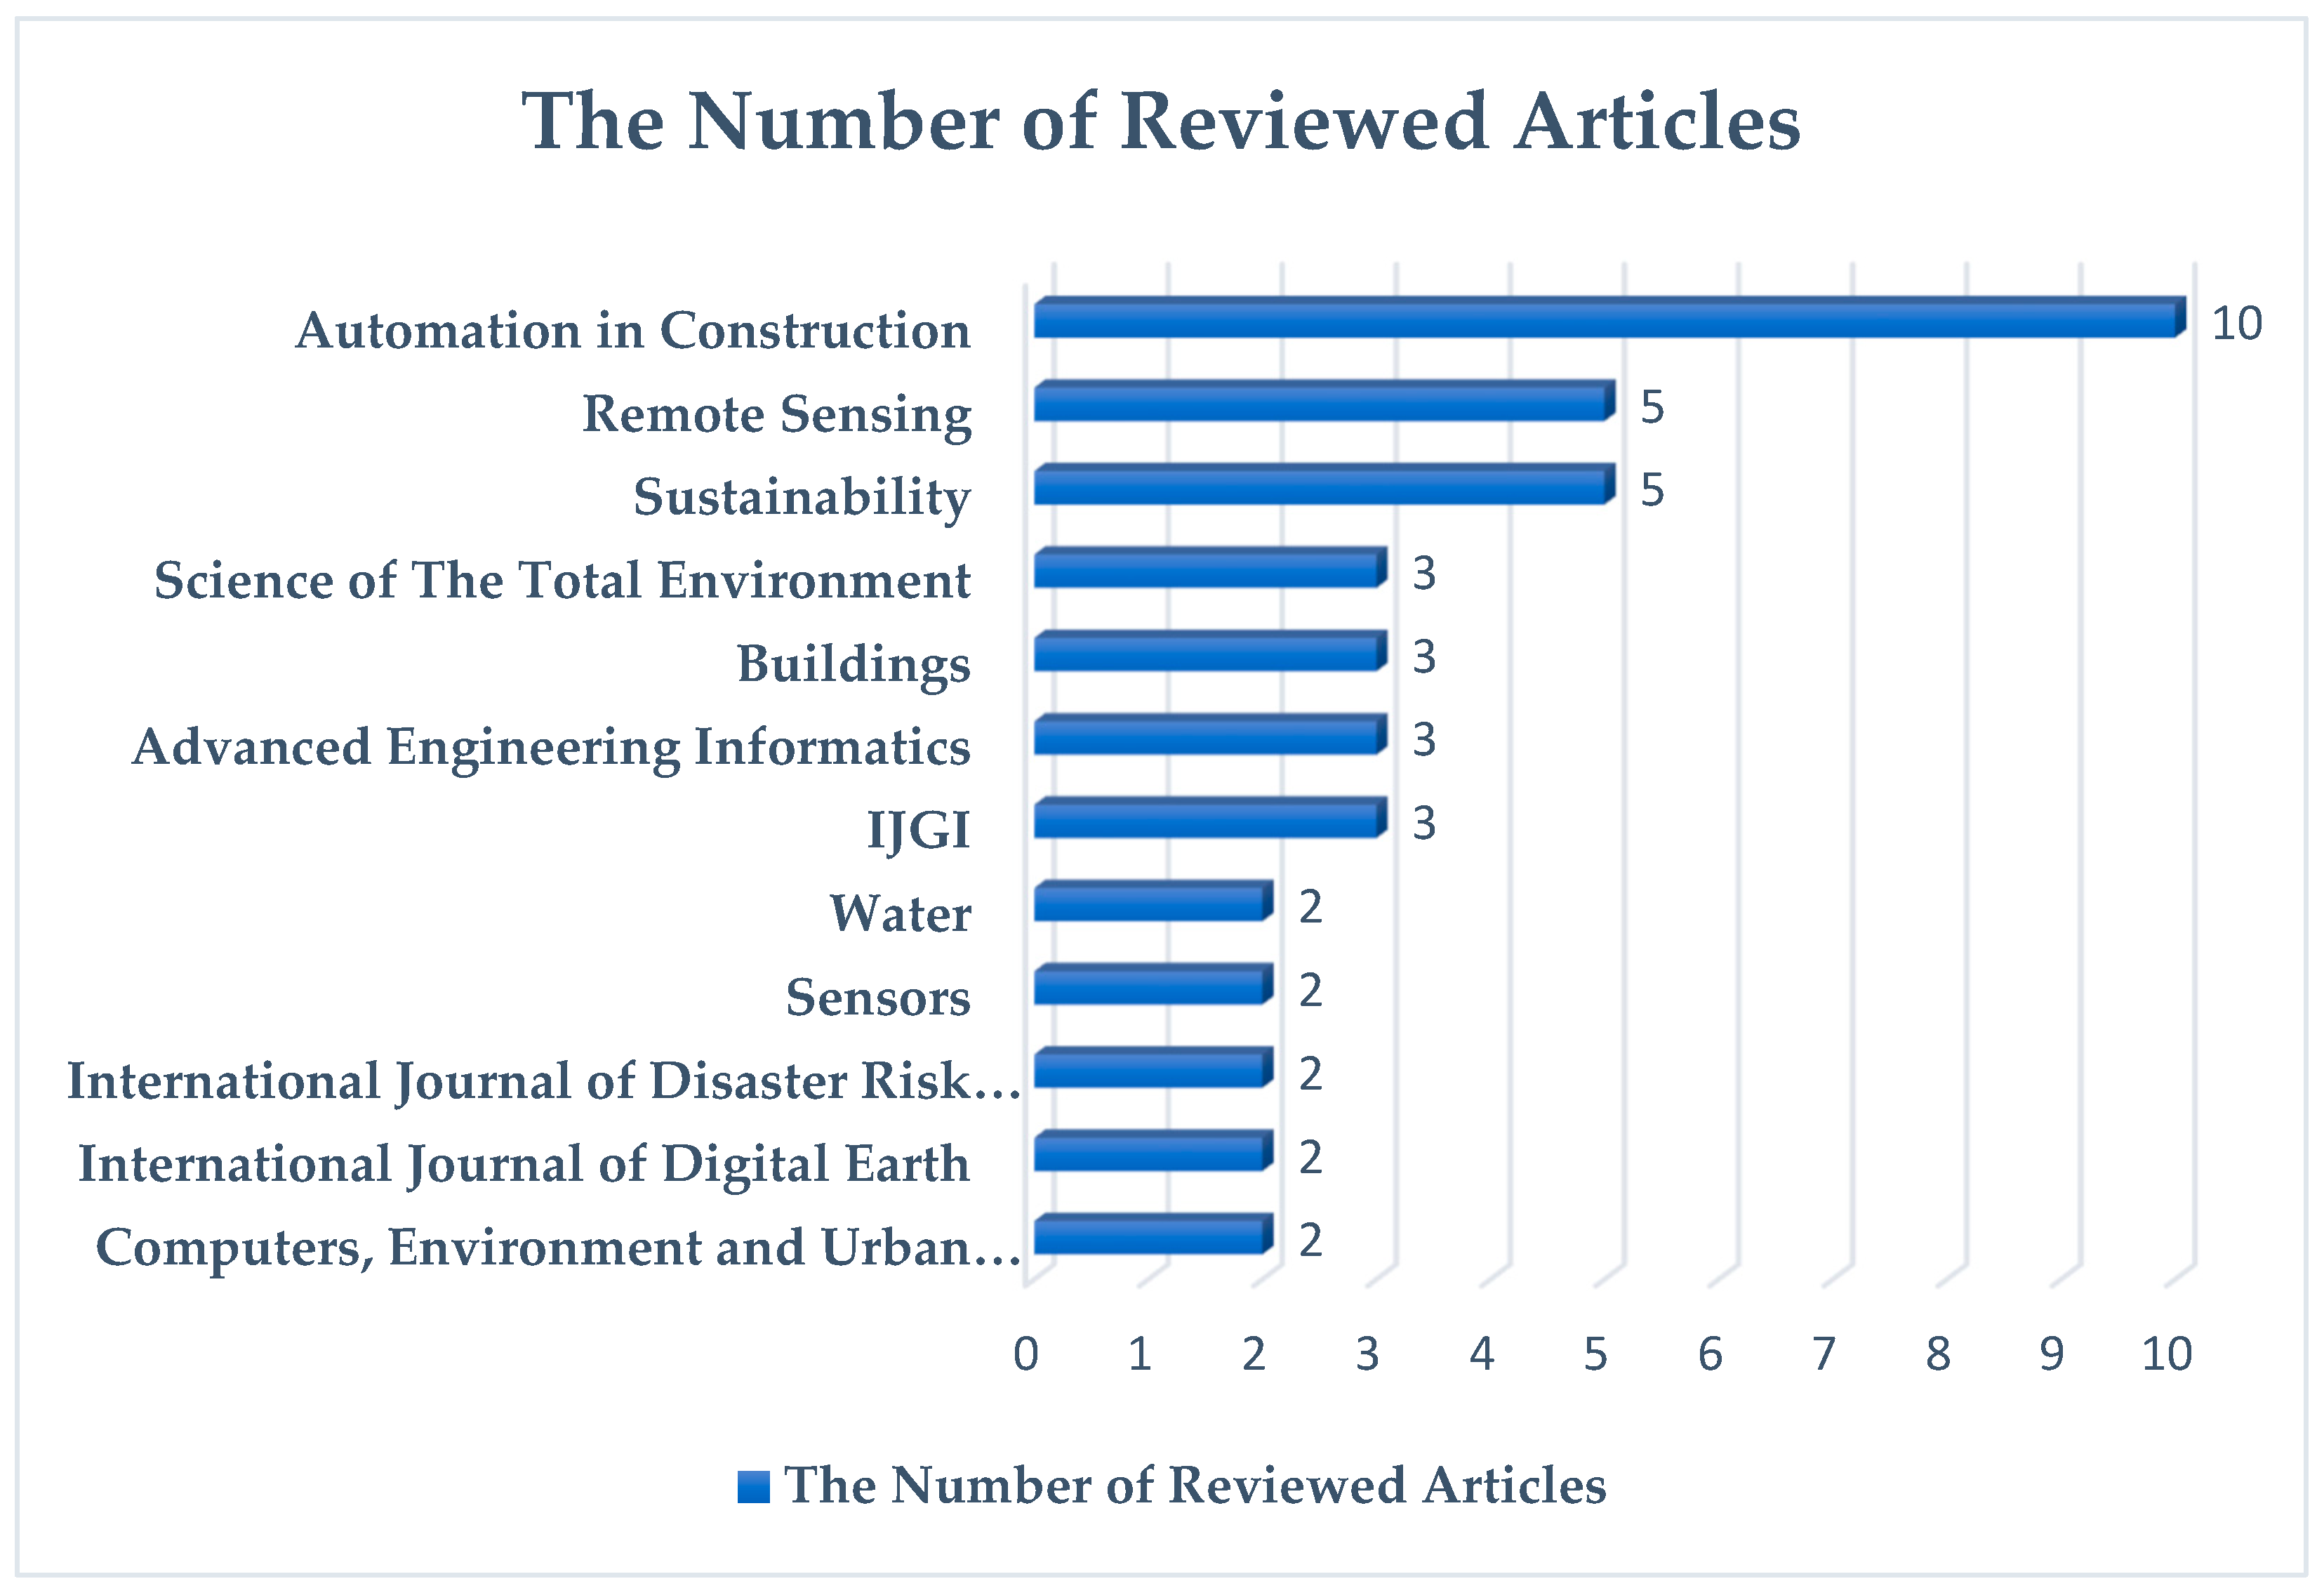
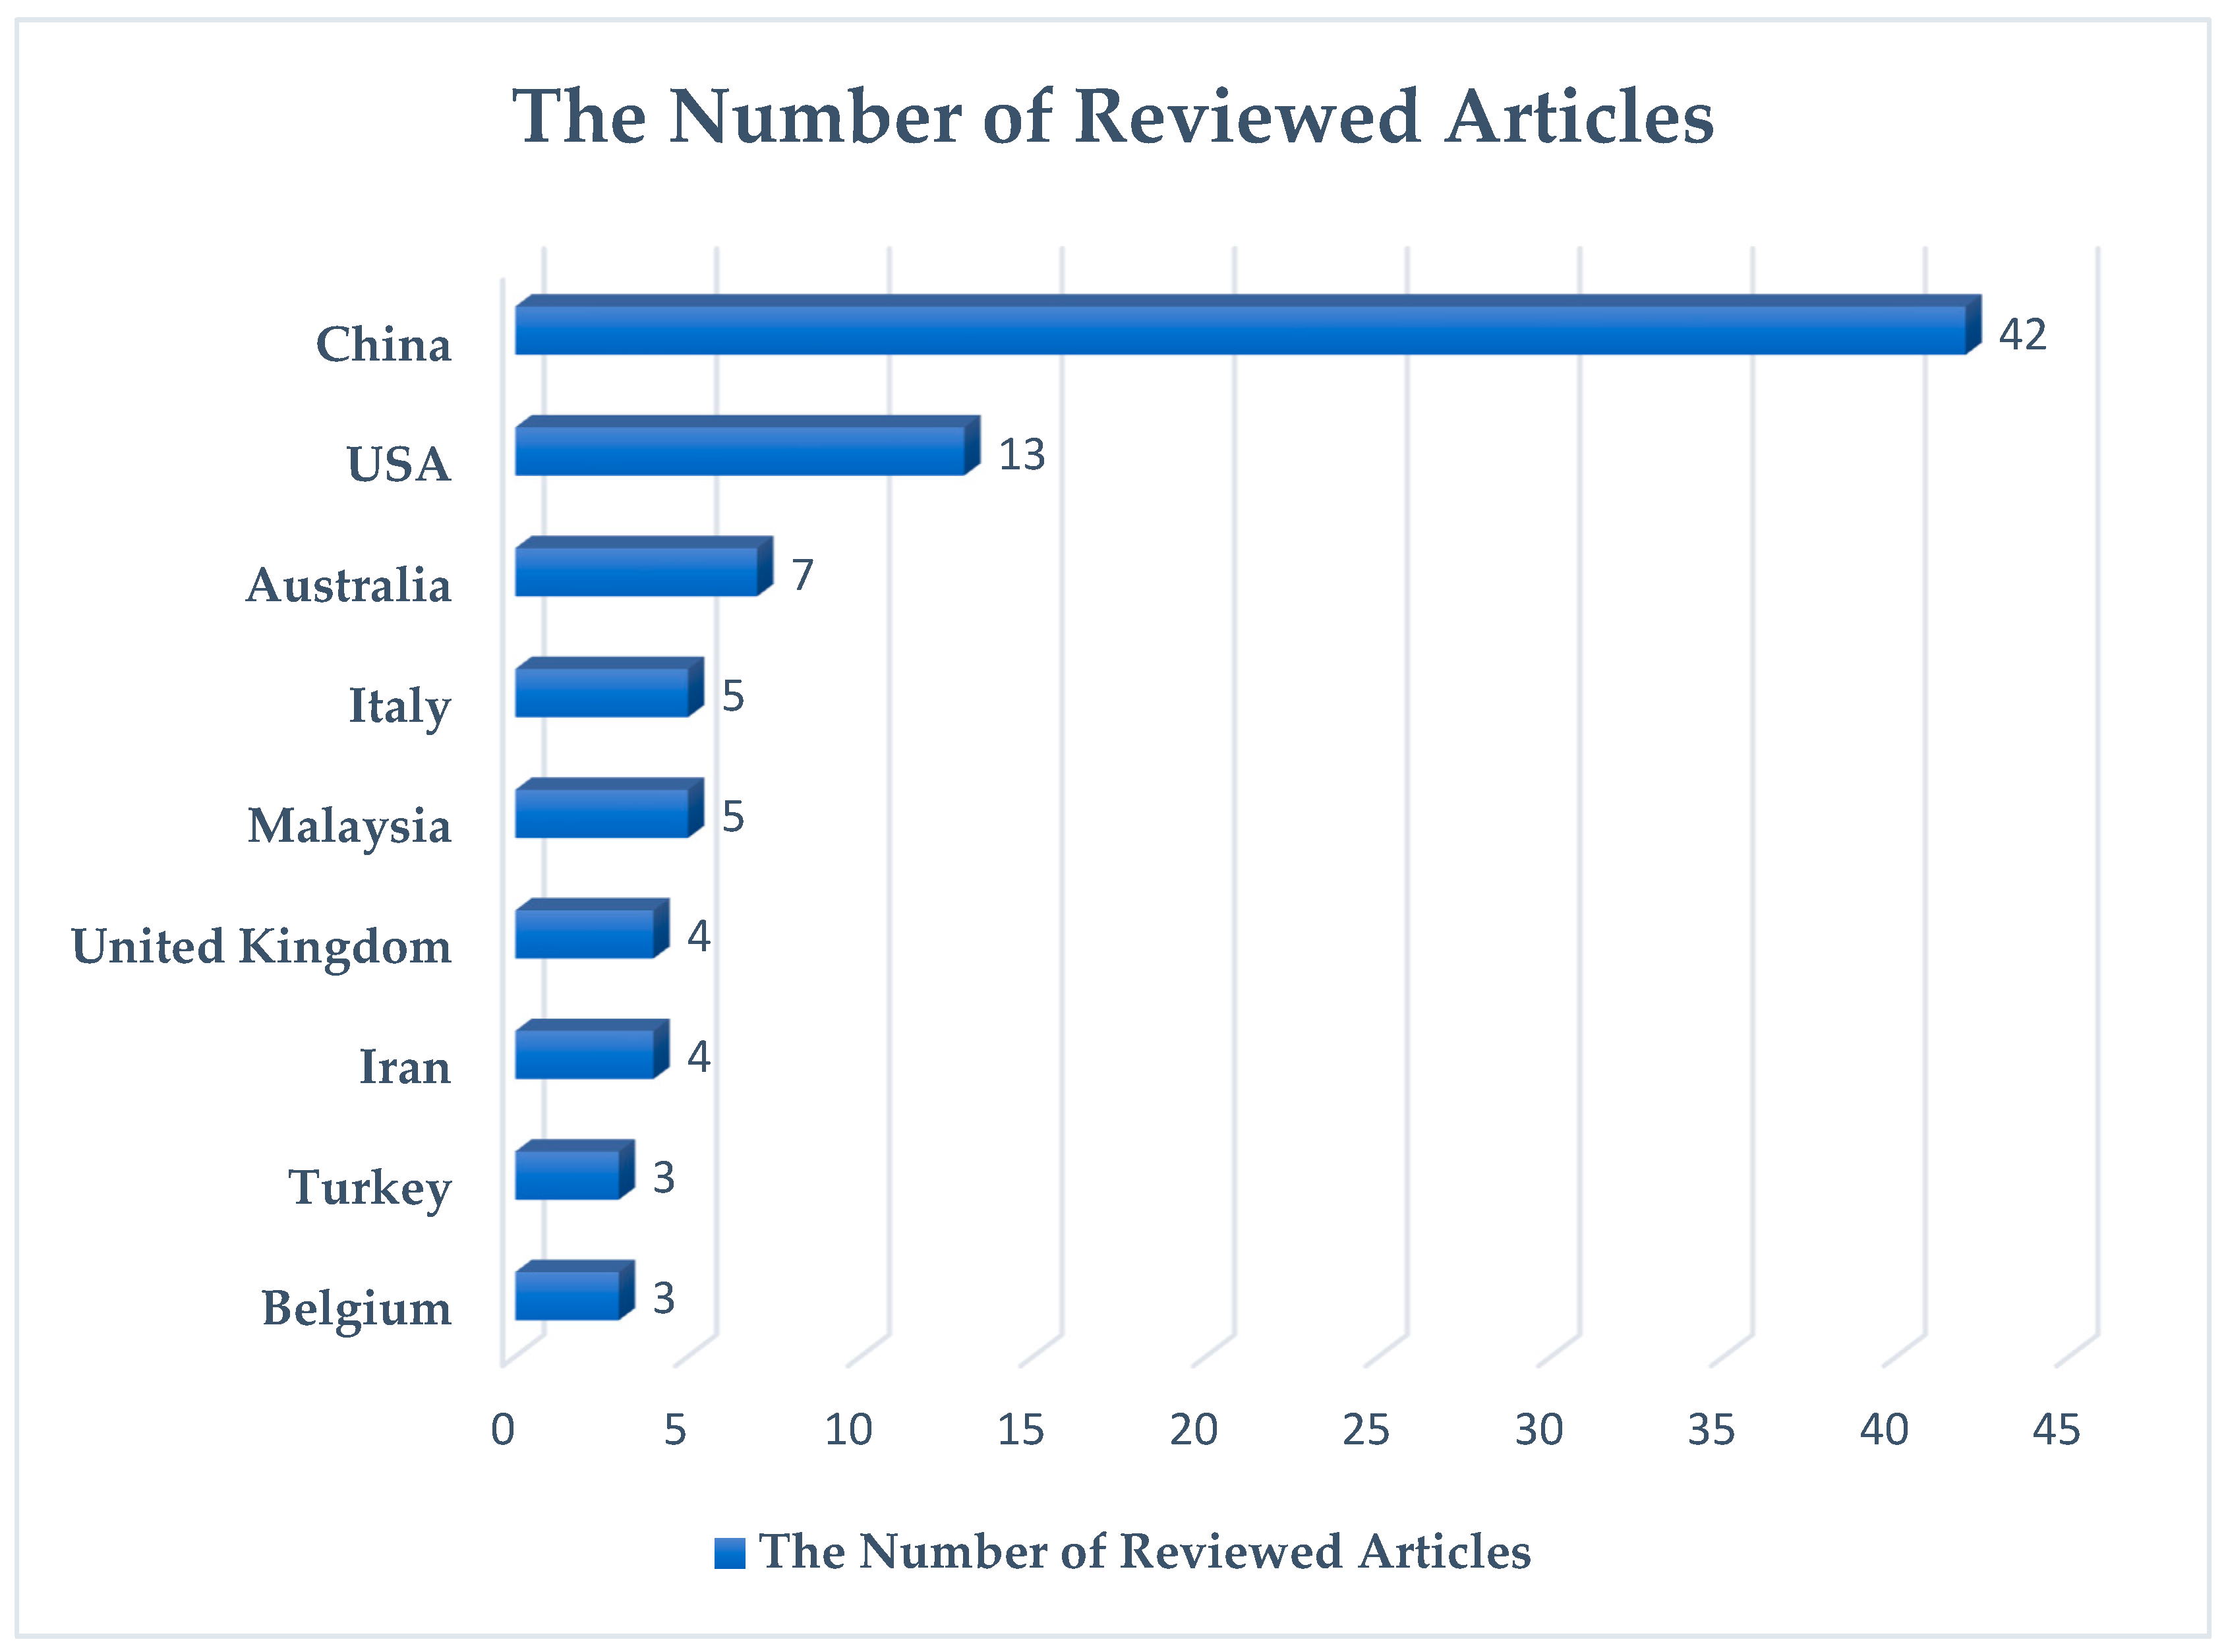
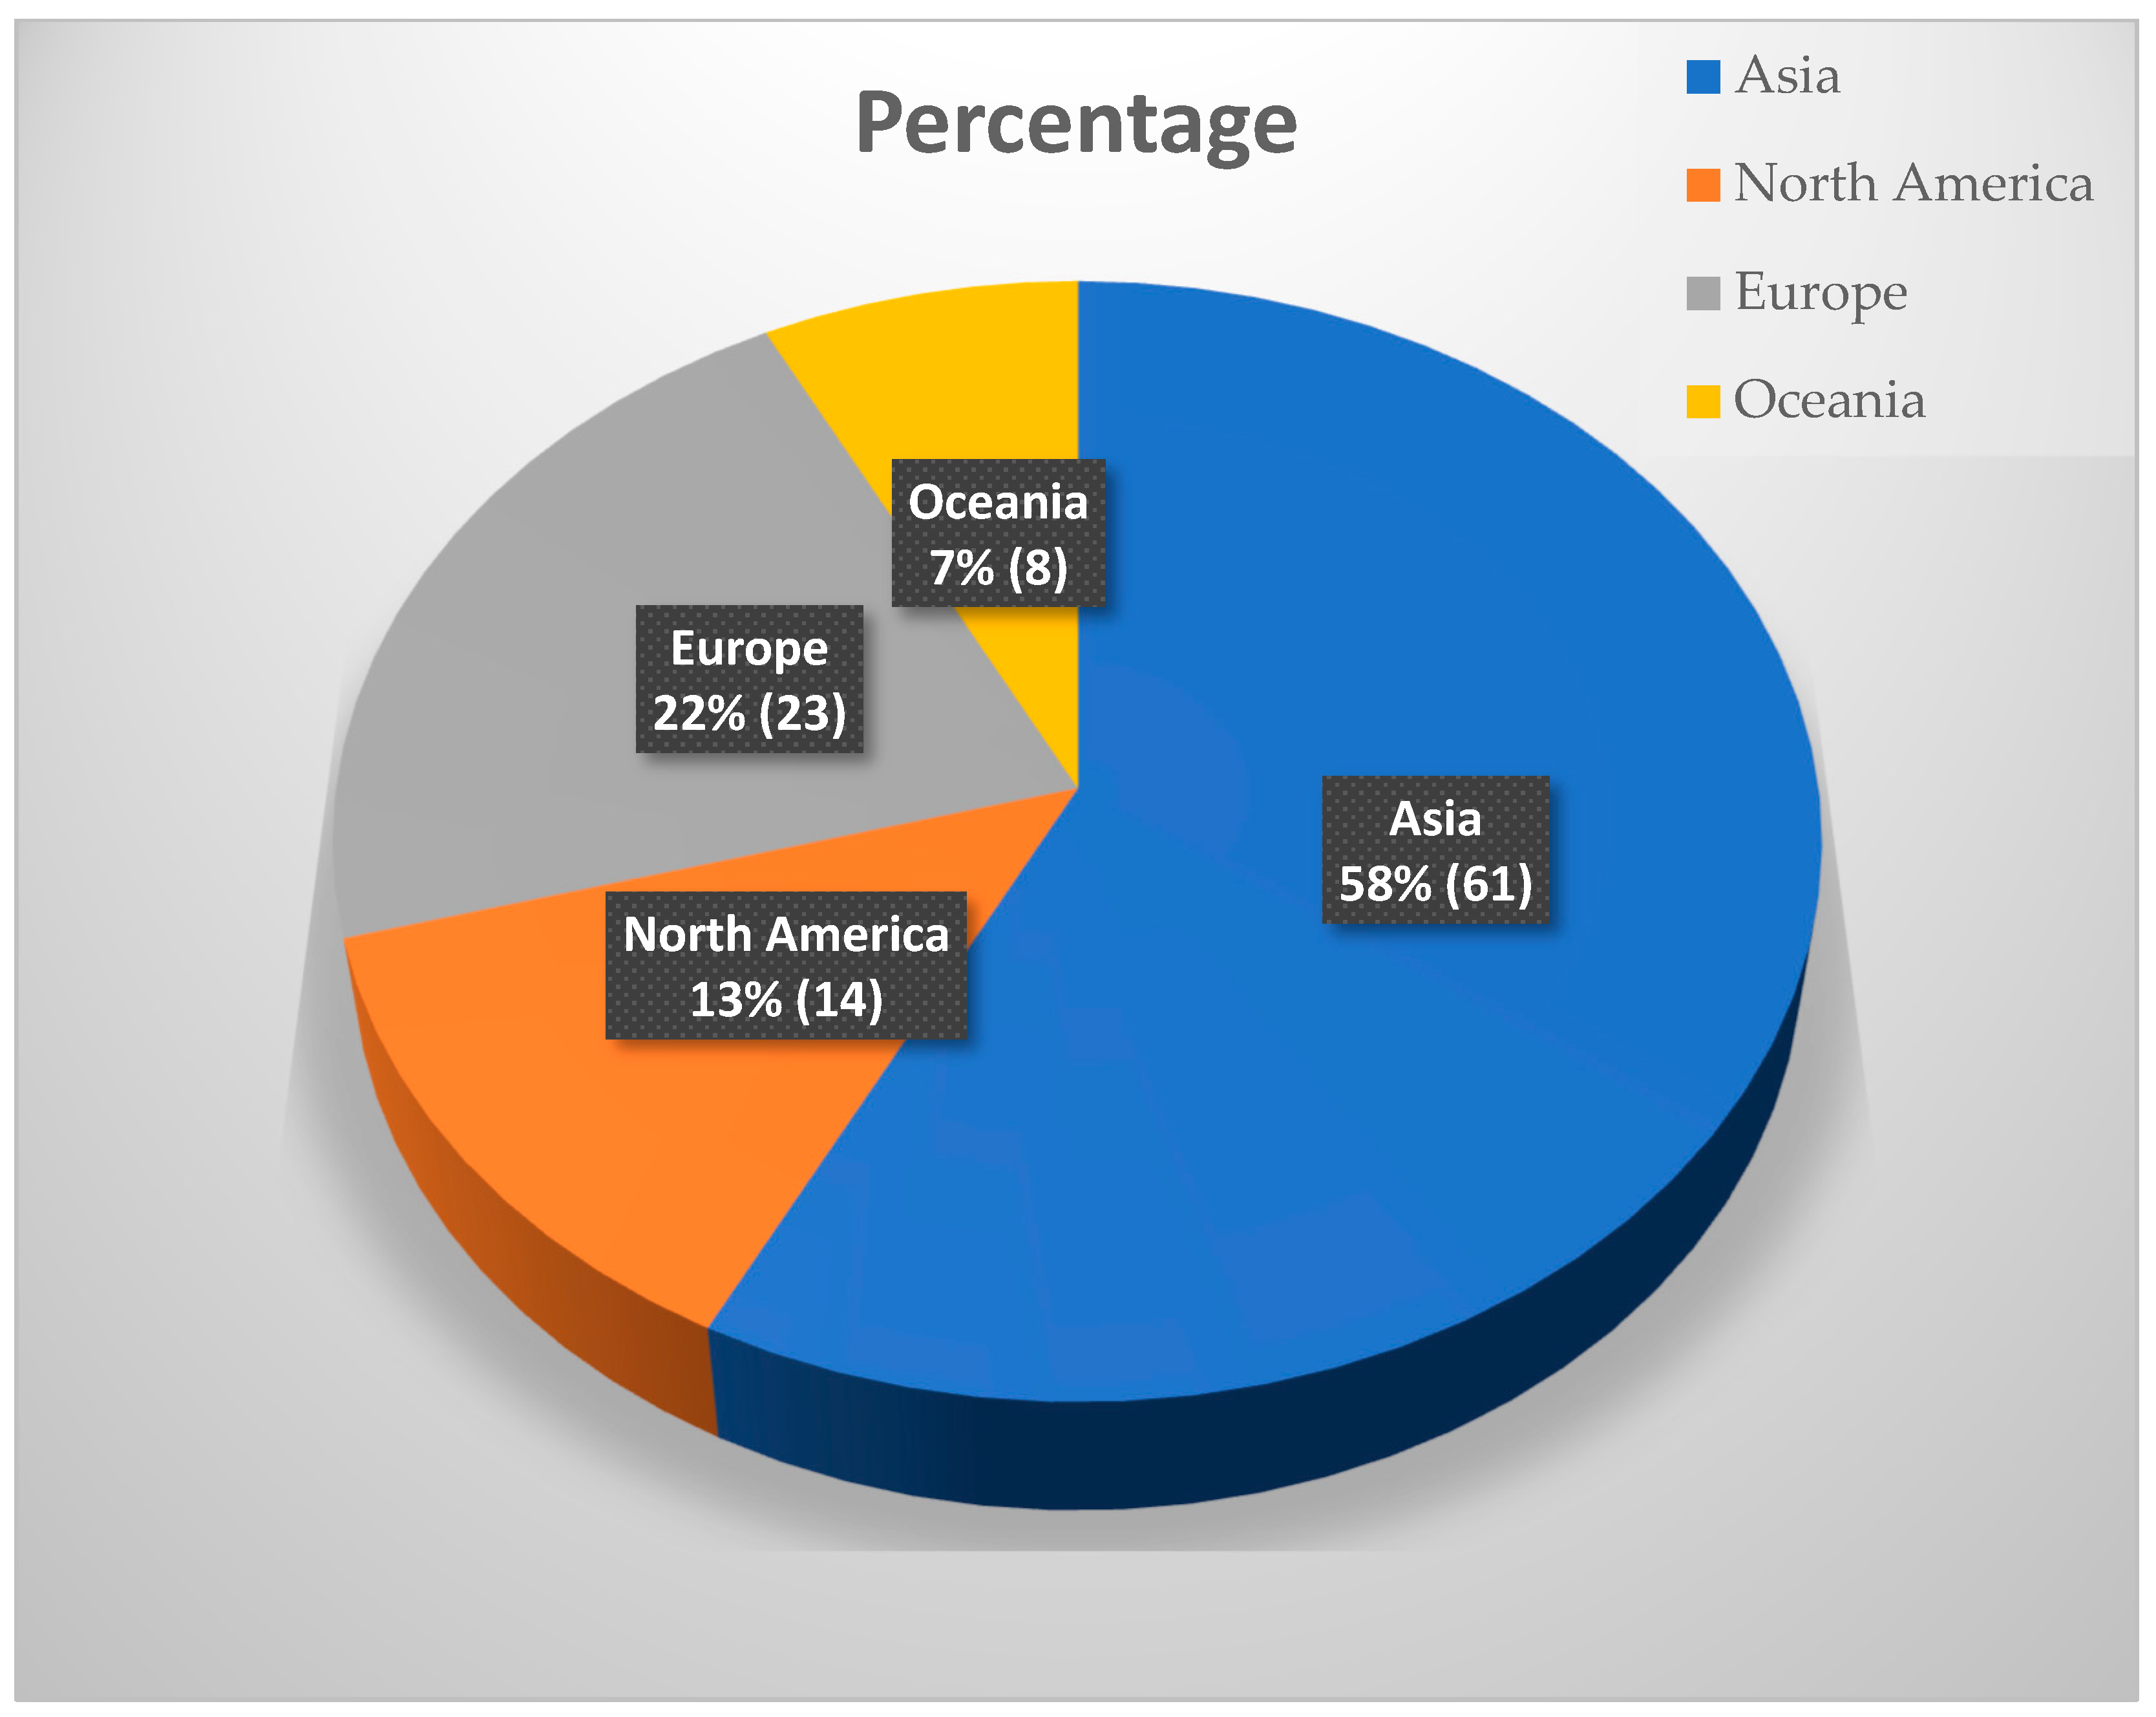
3.1. Descriptive Analysis
3.2. Results Analysis
3.2.1. Disaster Prevention and Mitigation
3.2.2. Disaster Response
- Disaster Detection and Warning
- 2.
- Emergency Evacuation and Rescue
3.2.3. Post-Disaster Recovery
4. Discussion
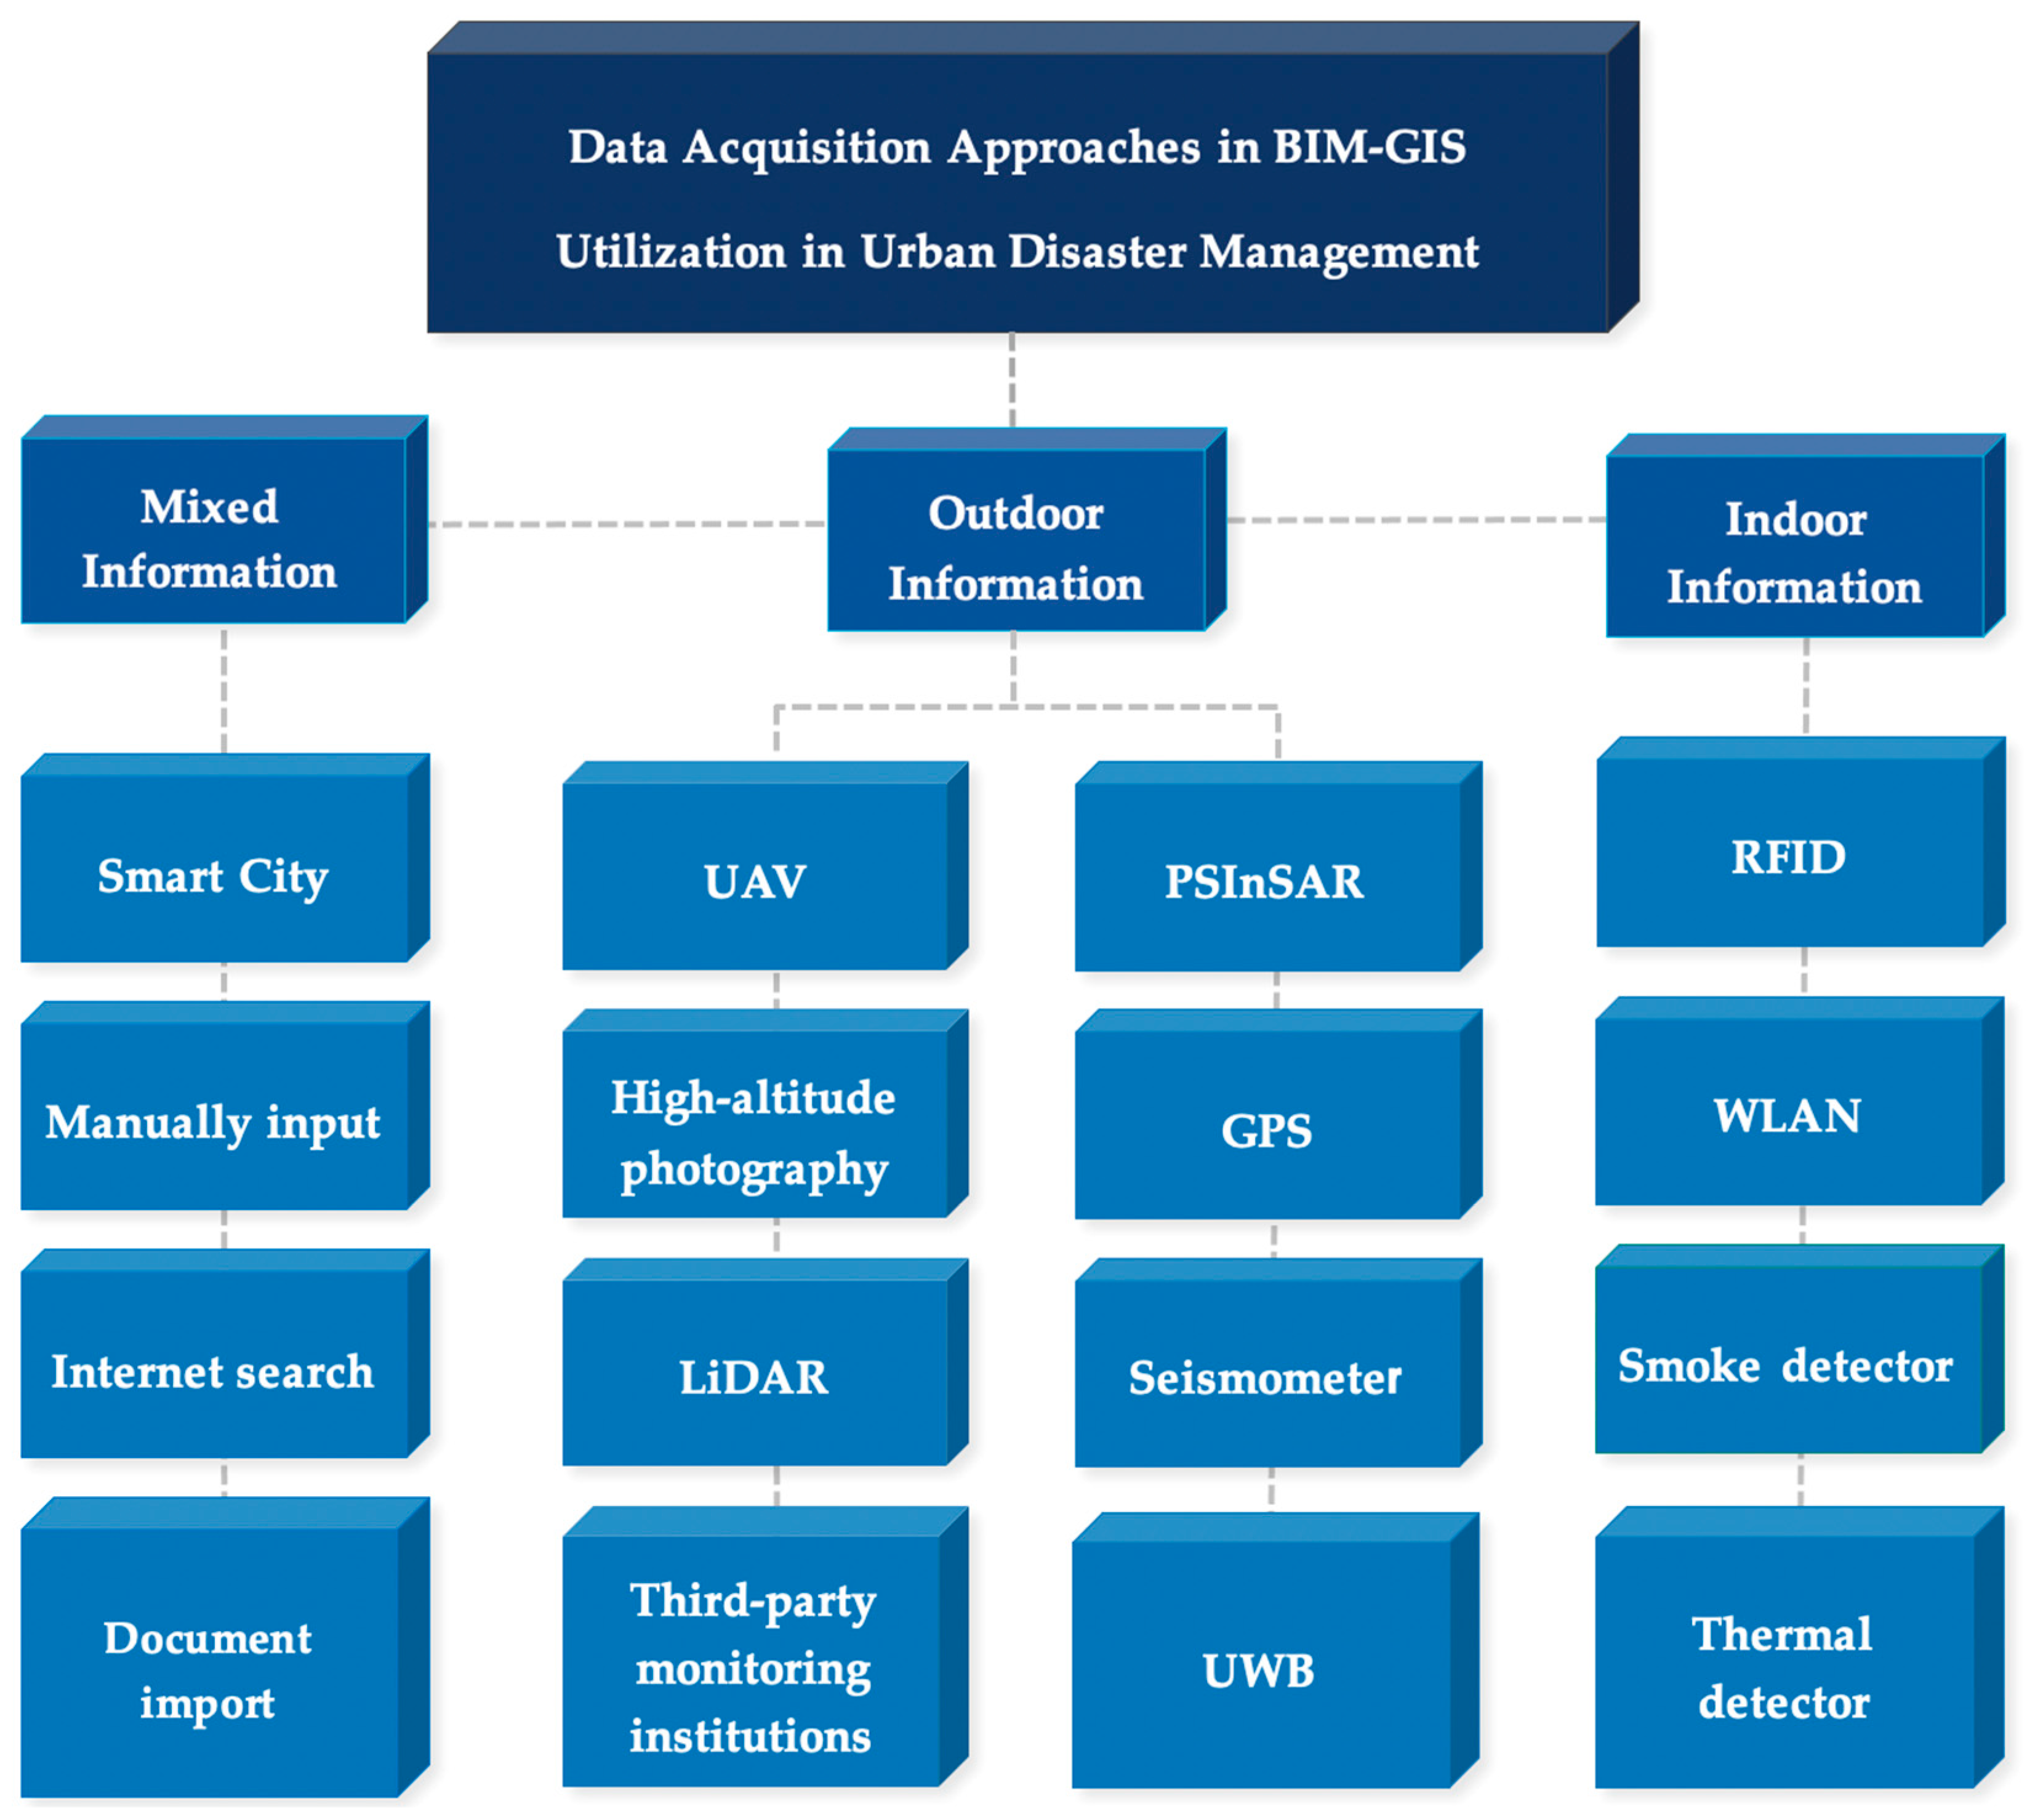
4.1. Data Acquisition
4.2. The Interoperability between BIM and GIS
- Ontological modeling (interoperability through semantic transformation formulas or frameworks that are based on ontology models)
- Web service-based interoperability framework (access to information using the internet or local area network)
- Data mapping (converting BIM models to other formats)
- Expansion based on current data exchange models
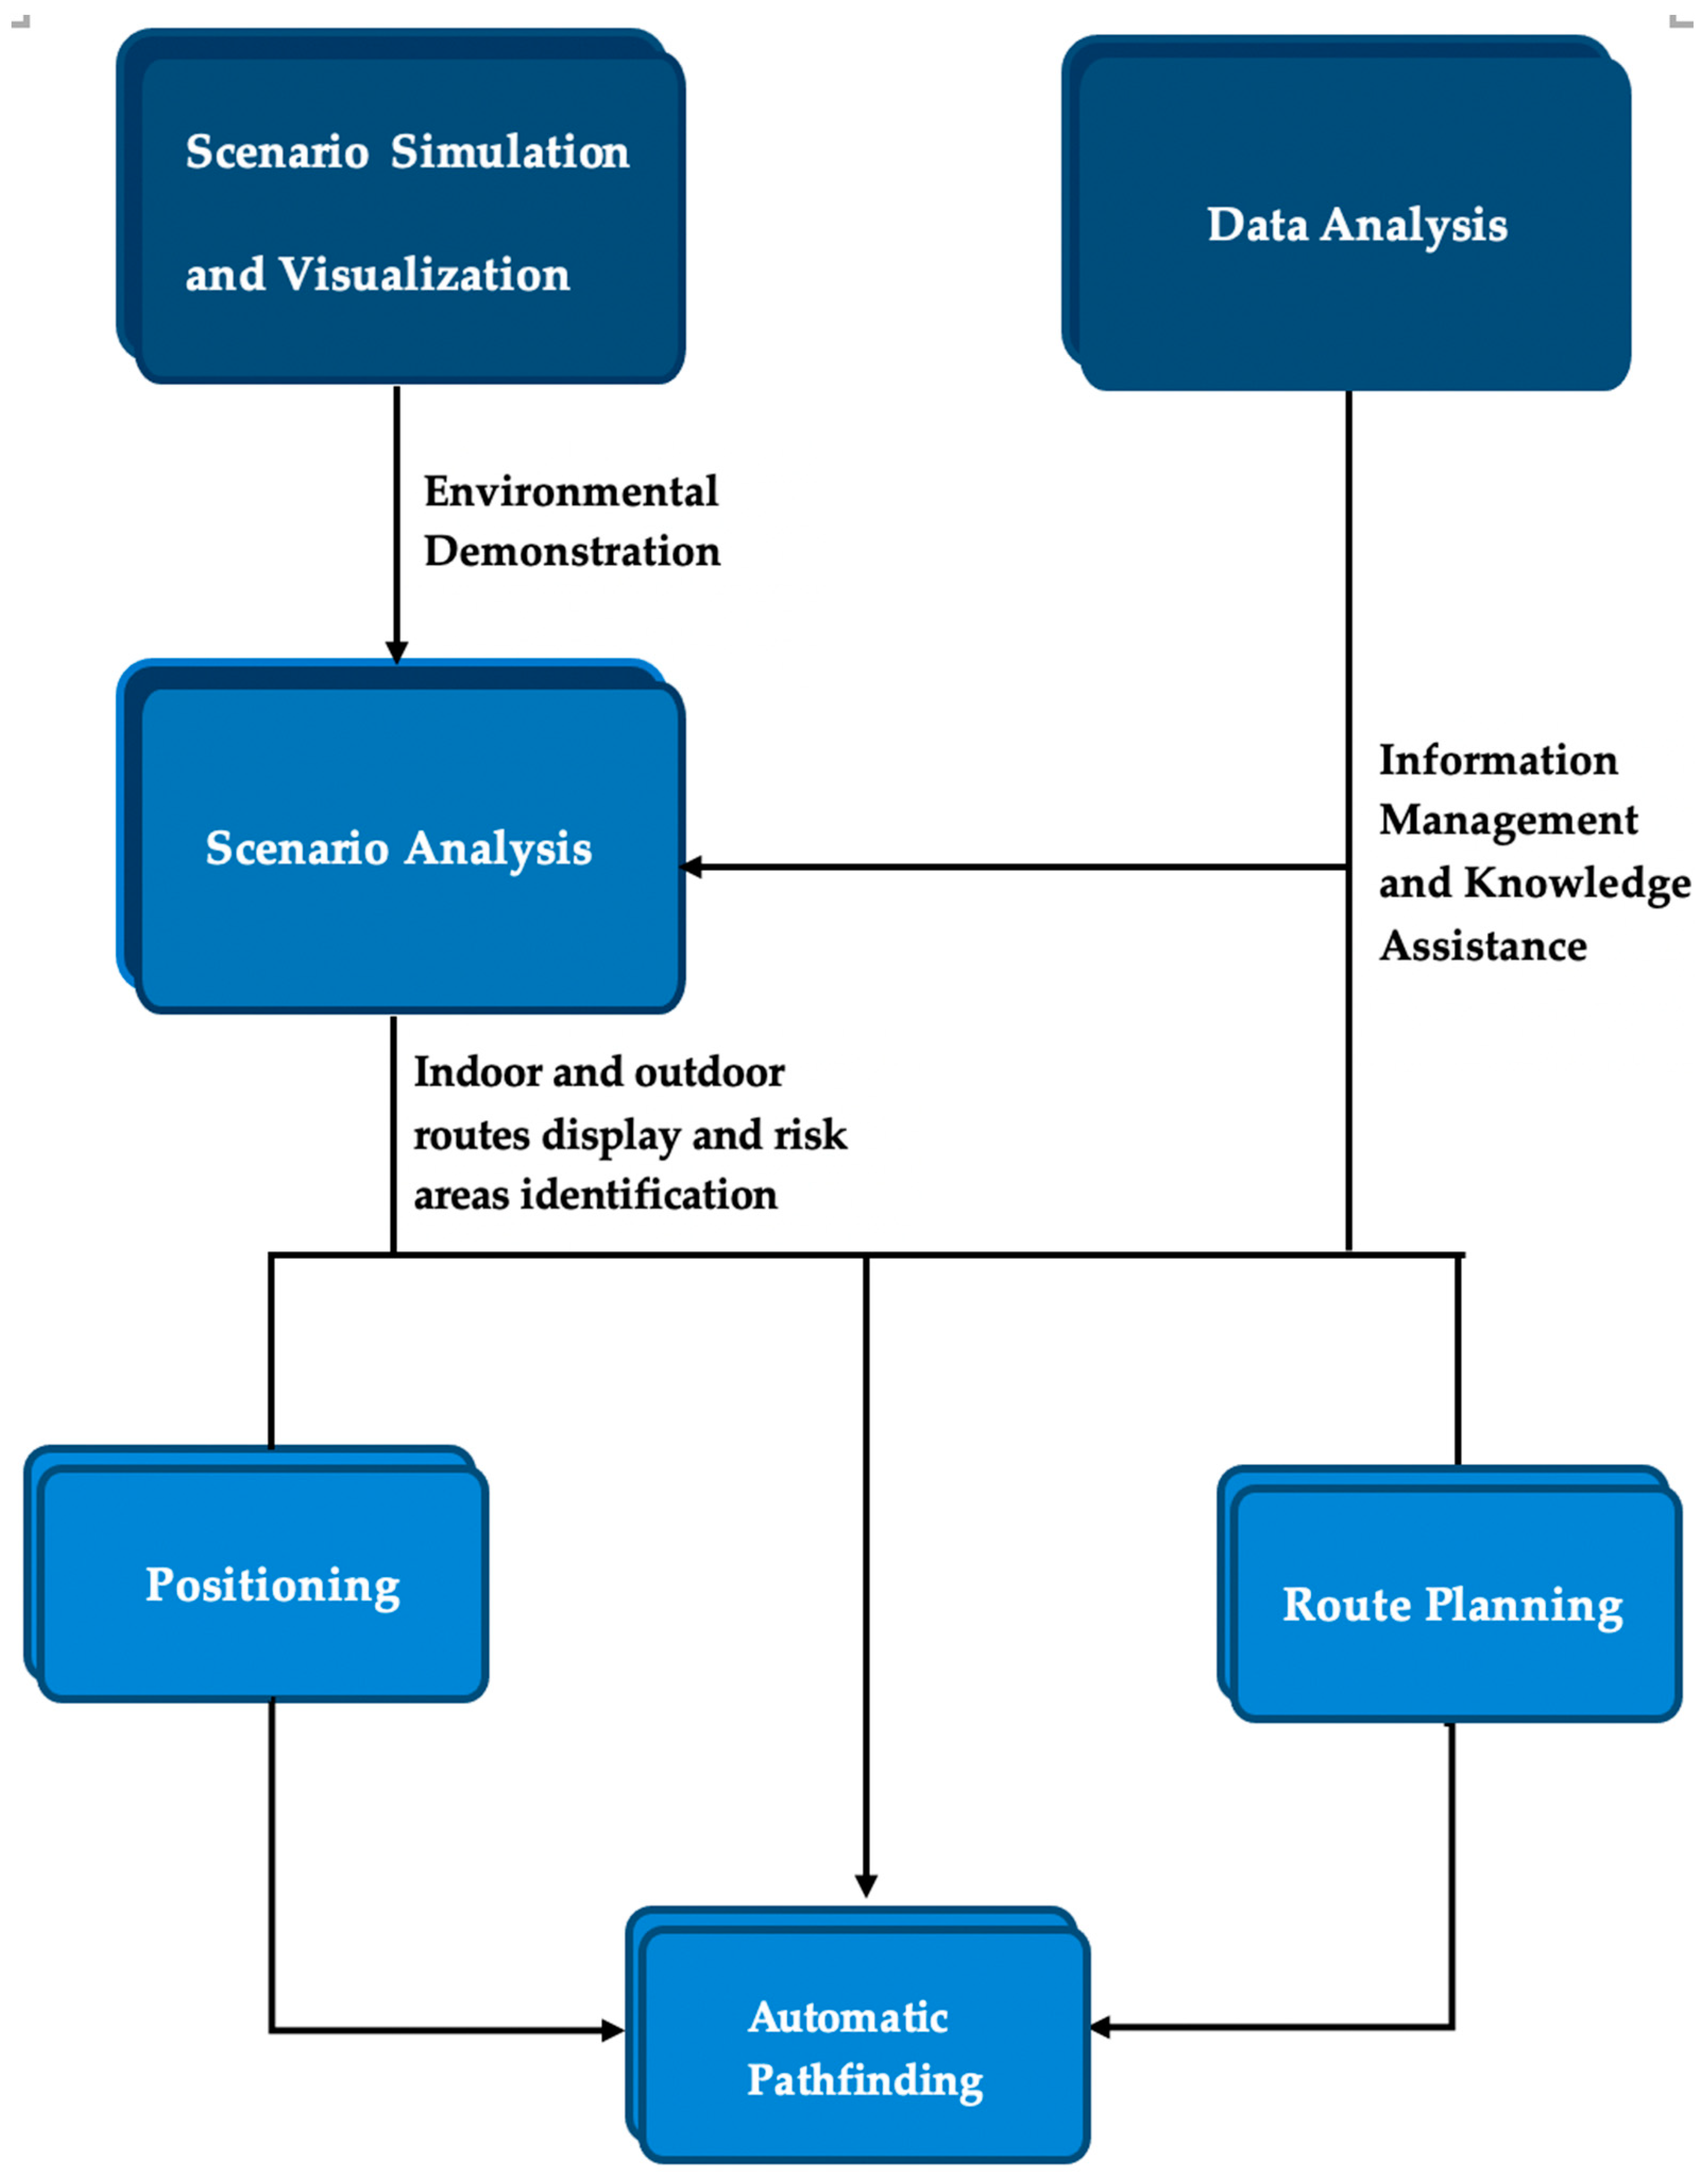
4.3. Data Utilization and Analysis
4.4. Future Directions
5. Conclusions
- The interoperability issue between BIM and GIS is the primary challenge of BIM–GIS utilization in urban disaster management. Although some articles aiming to solve interoperability issues are reviewed and discussed in this study, it is still necessary for other researchers to perform relevant studies to eliminate the interoperability deficiencies.
- Third-party devices, software, and institutions are important data acquisition approaches in the utilization of BIM–GIS integration in urban disaster management. Due to space limitations, this study does not review all the devices, plug-ins, and institutions that can provide the required data for BIM–GIS utilization in the urban disaster management phase. It is recommended that other scholars develop further studies to supplement the omissions.
- Constrained by space limitations, most of the reviewed articles are mainly concentrated on BIM–GIS-based urban disaster management in floods, fires, landslides, and earthquakes. However, the articles about other disasters (such as snowstorms and hailstones) are rarely reviewed in this study. Other researchers can develop relevant articles to fill this gap.
Author Contributions
Funding
Data Availability Statement
Acknowledgments
Conflicts of Interest
References
- United Nations Office for Disaster Risk Reduction. Global Assessment Report on Disaster Risk Reduction 2021; United Nations Office for Disaster Risk Reduction: Geneva, Switzerland, 2021. [Google Scholar]
- Cui, B.; Wen, X.; Zhang, D. The Application of Intelligent Emergency Response System for Urban Underground Space Disasters Based on 3D GIS, BIM and Internet of Things. In Proceedings of the 2019 International Conference on Artificial Intelligence and Computer Science, Wuhan, China, 12–13 July 2019; ACM: Wuhan, China, 2019; pp. 745–749. [Google Scholar]
- Nawari, N.; Ravindran, S. Blockchain and Building Information Modeling (BIM): Review and Applications in Post-Disaster Recovery. Buildings 2019, 9, 149. [Google Scholar] [CrossRef] [Green Version]
- Sani, M.J.; Abdul Rahman, A. GIS and BIM integration at data level: A review. Int. Arch. Photogramm. Remote Sens. Spat. Inf. Sci. 2018, 42, 299–306. [Google Scholar] [CrossRef] [Green Version]
- Yang, Y.; Ng, S.T.; Dao, J.; Zhou, S.; Xu, F.J.; Xu, X.; Zhou, Z. BIM-GIS-DCEs enabled vulnerability assessment of interdependent infrastructures—A case of stormwater drainage-building-road transport Nexus in urban flooding. Autom. Constr. 2021, 125, 103626. [Google Scholar] [CrossRef]
- Zhu, J.; Wu, P. BIM/GIS data integration from the perspective of information flow. Autom. Constr. 2022, 136, 104166. [Google Scholar] [CrossRef]
- ISO 19650-1:2018; Organization and Digitization of Information about Buildings and Civil Engineering Works, Including Building Information Modelling (BIM)—Information Management Using Building Information Modelling. British Standards Institution: London, UK, 2018.
- Cao, Y.; Kamaruzzaman, S.N.; Aziz, N.M. Building Information Modeling (BIM) Capabilities in the Operation and Maintenance Phase of Green Buildings: A Systematic Review. Buildings 2022, 12, 830. [Google Scholar] [CrossRef]
- Cao, Y.; Kamaruzzaman, S.N.; Aziz, N.M. Green Building Construction: A Systematic Review of BIM Utilization. Buildings 2022, 12, 1205. [Google Scholar] [CrossRef]
- Ghaffarianhoseini, A.; Tookey, J.; Ghaffarianhoseini, A.; Naismith, N.; Azhar, S.; Efimova, O.; Raahemifar, K. Building Information Modelling (BIM) uptake: Clear benefits, understanding its implementation, risks and challenges. Renew. Sustain. Energy Rev. 2017, 75, 1046–1053. [Google Scholar] [CrossRef]
- Lu, Y.; Wu, Z.; Chang, R.; Li, Y. Building Information Modeling (BIM) for green buildings: A critical review and future directions. Autom. Constr. 2017, 83, 134–148. [Google Scholar] [CrossRef]
- Rowland, A.; Folmer, E.; Beek, W. Towards Self-Service GIS—Combining the Best of the Semantic Web and Web GIS. IJGI 2020, 9, 753. [Google Scholar] [CrossRef]
- Wang, F. Why public health needs GIS: A methodological overview. Ann. GIS 2020, 26, 1–12. [Google Scholar] [CrossRef] [PubMed] [Green Version]
- Ali, E. Geographic Information System (GIS): Definition, Development, Applications & Components. Dep. Geogr. Ananda Chandra Coll. India 2020. Available online: https://www.researchgate.net/publication/340182760_Geographic_Information_System_GIS_Definition_Development_Applications_Components#:~:text=A%20Geographic%20Information%20System%20(GIS,location%20on%20the%20earth's%20surface (accessed on 2 October 2022).
- Tian, B. GIS Technology Applications in Environmental and Earth Sciences, 1st ed.; CRC Press: Boca Raton, FL, USA, 2016; ISBN 978-1-4987-7605-9. [Google Scholar]
- Bai, H.; Li, Z.; Guo, H.; Chen, H.; Luo, P. Urban Green Space Planning Based on Remote Sensing and Geographic Information Systems. Remote Sens. 2022, 14, 4213. [Google Scholar] [CrossRef]
- Amirebrahimi, S.; Rajabifard, A.; Mendis, P.; Ngo, T. A framework for a microscale flood damage assessment and visualization for a building using BIM–GIS integration. Int. J. Digit. Earth 2016, 9, 363–386. [Google Scholar] [CrossRef]
- Amirebrahimi, S.; Rajabifard, A.; Mendis, P.; Ngo, T. A BIM-GIS integration method in support of the assessment and 3D visualisation of flood damage to a building. J. Spat. Sci. 2016, 61, 317–350. [Google Scholar] [CrossRef]
- Khanmohammadi, S.; Arashpour, M.; Bai, Y. Applications of building information modeling (BIM) in disaster resilience: Present status and future trends. In Proceedings of the 37th International Symposium on Automation and Robotics in Construction, Kitakyushu, Japan, 27–28 October 2020; IAARC Publications, 2020; Volume 37, pp. 1380–1387. [Google Scholar]
- Rong, Y.; Zhang, T.; Zheng, Y.; Hu, C.; Peng, L.; Feng, P. Three-dimensional urban flood inundation simulation based on digital aerial photogrammetry. J. Hydrol. 2020, 584, 124308. [Google Scholar] [CrossRef]
- Bansal, V.K. Integrated Framework of BIM and GIS Applications to Support Building Lifecycle: A Move toward nD Modeling. J. Archit. Eng. 2021, 27, 05021009. [Google Scholar] [CrossRef]
- Aromataris, E.; Pearson, A. The Systematic Review: An Overview. Am. J. Nurs. 2014, 114, 53–58. [Google Scholar] [CrossRef] [PubMed] [Green Version]
- Gopalakrishnan, S.; Ganeshkumar, P. Systematic reviews and meta-analysis: Understanding the best evidence in primary healthcare. J. Fam. Med. Prim. Care 2013, 2, 9–14. [Google Scholar] [CrossRef]
- Munn, Z.; Peters, M.D.; Stern, C.; Tufanaru, C.; McArthur, A.; Aromataris, E. Systematic review or scoping review? Guidance for authors when choosing between a systematic or scoping review approach. BMC Med. Res. Methodol. 2018, 18, 143. [Google Scholar] [CrossRef]
- Munn, Z.; Stern, C.; Aromataris, E.; Lockwood, C.; Jordan, Z. What kind of systematic review should I conduct? A proposed typology and guidance for systematic reviewers in the medical and health sciences. BMC Med. Res. Methodol. 2018, 18, 5. [Google Scholar] [CrossRef] [Green Version]
- Denyer, D.; Tranfield, D. Producing a Systematic Review. In The Sage Handbook of Organizational Research Methods; Sage Publications Ltd.: Thousand Oaks, CA, USA, 2009; pp. 671–689. ISBN 978-1-4129-3118-2. [Google Scholar]
- Pearson, A. Balancing the evidence: Incorporating the synthesis of qualitative data into systematic reviews. JBI Rep. 2004, 2, 45–64. [Google Scholar] [CrossRef]
- Page, M.J.; McKenzie, J.E.; Bossuyt, P.M.; Boutron, I.; Hoffmann, T.C.; Mulrow, C.D.; Shamseer, L.; Tetzlaff, J.M.; Akl, E.A.; Brennan, S.E.; et al. The PRISMA 2020 statement: An updated guideline for reporting systematic reviews. Syst. Rev. 2021, 10, 89. [Google Scholar] [CrossRef] [PubMed]
- Rethlefsen, M.L.; Page, M.J. PRISMA 2020 and PRISMA-S: Common questions on tracking records and the flow diagram. Jmla 2021, 110, 253. [Google Scholar] [CrossRef]
- Cao, Y.; Xu, C.; Kamaruzzaman, S.N.; Aziz, N.M. A Systematic Review of Green Building Development in China: Advantages, Challenges and Future Directions. Sustainability 2022, 14, 12293. [Google Scholar] [CrossRef]
- Regona, M.; Yigitcanlar, T.; Xia, B.; Li, R.Y.M. Opportunities and Adoption Challenges of AI in the Construction Industry: A PRISMA Review. JOItmC 2022, 8, 45. [Google Scholar] [CrossRef]
- Yigitcanlar, T.; Desouza, K.C.; Butler, L.; Roozkhosh, F. Contributions and Risks of Artificial Intelligence (AI) in Building Smarter Cities: Insights from a Systematic Review of the Literature. Energies 2020, 13, 1473. [Google Scholar] [CrossRef] [Green Version]
- Lyu, H.-M.; Shen, S.-L.; Zhou, A.; Yang, J. Perspectives for flood risk assessment and management for mega-city metro system. Tunn. Undergr. Space Technol. 2019, 84, 31–44. [Google Scholar] [CrossRef]
- Shi, J.; Liu, P. An Agent-Based Evacuation Model to Support Fire Safety Design Based on an Integrated 3D GIS and BIM Platform. In Computing in Civil and Building Engineering (2014); American Society of Civil Engineers: Orlando, FL, USA, 2014; pp. 1893–1900. [Google Scholar]
- Luo, P.; Zheng, Y.; Wang, Y.; Zhang, S.; Yu, W.; Zhu, X.; Huo, A.; Wang, Z.; He, B.; Nover, D. Comparative Assessment of Sponge City Constructing in Public Awareness, Xi’an, China. Sustainability 2022, 14, 11653. [Google Scholar] [CrossRef]
- Luo, P.; Luo, M.; Li, F.; Qi, X.; Huo, A.; Wang, Z.; He, B.; Takara, K.; Nover, D.; Wang, Y. Urban flood numerical simulation: Research, methods and future perspectives. Environ. Model. Softw. 2022, 156, 105478. [Google Scholar] [CrossRef]
- Luo, P.; Liu, L.; Wang, S.; Ren, B.; He, B.; Nover, D. Influence assessment of new Inner Tube Porous Brick with absorbent concrete on urban floods control. Case Stud. Constr. Mater. 2022, 17, e01236. [Google Scholar] [CrossRef]
- Zhu, W.; Zha, X.; Luo, P.; Wang, S.; Cao, Z.; Lyu, J.; Zhou, M.; He, B.; Nover, D. A quantitative analysis of research trends in flood hazard assessment. Stoch. Env. Res. Risk Assess. 2022, 37, 413–428. [Google Scholar] [CrossRef]
- Cao, Z.; Wang, S.; Luo, P.; Xie, D.; Zhu, W. Watershed Ecohydrological Processes in a Changing Environment: Opportunities and Challenges. Water 2022, 14, 1502. [Google Scholar] [CrossRef]
- Luo, P.; Xu, C.; Kang, S.; Huo, A.; Lyu, J.; Zhou, M.; Nover, D. Heavy metals in water and surface sediments of the Fenghe River Basin, China: Assessment and source analysis. Water Sci. Technol. 2021, 84, 3072–3090. [Google Scholar] [CrossRef] [PubMed]
- Luo, P.; Mu, Y.; Wang, S.; Zhu, W.; Mishra, B.K.; Huo, A.; Zhou, M.; Lyu, J.; Hu, M.; Duan, W.; et al. Exploring sustainable solutions for the water environment in Chinese and Southeast Asian cities. Ambio 2022, 51, 1199–1218. [Google Scholar] [CrossRef]
- Wang, Z.; Luo, P.; Zha, X.; Xu, C.; Kang, S.; Zhou, M.; Nover, D.; Wang, Y. Overview assessment of risk evaluation and treatment technologies for heavy metal pollution of water and soil. J. Clean. Prod. 2022, 379, 134043. [Google Scholar] [CrossRef]
- Bottaccioli, L.; Aliberti, A.; Ugliotti, F.; Patti, E.; Osello, A.; Macii, E.; Acquaviva, A. Building Energy Modelling and Monitoring by Integration of IoT Devices and Building Information Models. In Proceedings of the 2017 IEEE 41st Annual Computer Software and Applications Conference (COMPSAC), Turin, Italy, 4–8 July 2017; IEEE: Turin, Italy, 2017; pp. 914–922. [Google Scholar]
- Quinay, P.E.B.; Soliman, J.M.M.; Fader, A.R.F. Development of Simulation-Based Approach Using Frame Models Generated From GIS Features and BIM Data for Application to City Seismic Response Analysis of Low- to Mid-Rise RC Structures in Metro Manila. J. Earthq. Tsunami 2020, 14, 2050021. [Google Scholar] [CrossRef]
- Lu, X.; Gu, D.; Xu, Z.; Xiong, C.; Tian, Y. CIM-Powered Multi-Hazard Simulation Framework Covering both Individual Buildings and Urban Areas. Sustainability 2020, 12, 5059. [Google Scholar] [CrossRef]
- Nofal, O.M.; van de Lind, J.W.; Zakzouk, A. BIM-GIS integration approach for high-fidelity wind hazard modeling at the community-level. Front. Built Environ. 2022, 8, 915209. [Google Scholar] [CrossRef]
- Duan, W.; Zou, S.; Christidis, N.; Schaller, N.; Chen, Y.; Sahu, N.; Li, Z.; Fang, G.; Zhou, B. Changes in temporal inequality of precipitation extremes over China due to anthropogenic forcings. Npj Clim. Atmos. Sci. 2022, 5, 33. [Google Scholar] [CrossRef]
- Wang, S.; Cao, Z.; Luo, P.; Zhu, W. Spatiotemporal Variations and Climatological Trends in Precipitation Indices in Shaanxi Province, China. Atmosphere 2022, 13, 744. [Google Scholar] [CrossRef]
- Wang, S.; Luo, P.; Xu, C.; Zhu, W.; Cao, Z.; Ly, S. Reconstruction of Historical Land Use and Urban Flood Simulation in Xi’an, Shannxi, China. Remote Sens. 2022, 14, 6067. [Google Scholar] [CrossRef]
- Zhu, Y.; Luo, P.; Zhang, S.; Sun, B. Spatiotemporal Analysis of Hydrological Variations and Their Impacts on Vegetation in Semiarid Areas from Multiple Satellite Data. Remote Sens. 2020, 12, 4177. [Google Scholar] [CrossRef]
- Zhu, W.; Wang, S.; Luo, P.; Zha, X.; Cao, Z.; Lyu, J.; Zhou, M.; He, B.; Nover, D. A Quantitative Analysis of the Influence of Temperature Change on the Extreme Precipitation. Atmosphere 2022, 13, 612. [Google Scholar] [CrossRef]
- Cao, Z.; Zhu, W.; Luo, P.; Wang, S.; Tang, Z.; Zhang, Y.; Guo, B. Spatially Non-Stationary Relationships between Changing Environment and Water Yield Services in Watersheds of China’s Climate Transition Zones. Remote Sens. 2022, 14, 5078. [Google Scholar] [CrossRef]
- Deng, H.; Pepin, N.C.; Chen, Y.; Guo, B.; Zhang, S.; Zhang, Y.; Chen, X.; Gao, L.; Meibing, L.; Ying, C. Dynamics of Diurnal Precipitation Differences and Their Spatial Variations in China. J. Appl. Meteorol. Climatol. 2022, 61, 1015–1027. [Google Scholar] [CrossRef]
- Qin, J.; Duan, W.; Chen, Y.; Dukhovny, V.A.; Sorokin, D.; Li, Y.; Wang, X. Comprehensive evaluation and sustainable development of water–energy–food–ecology systems in Central Asia. Renew. Sustain. Energy Rev. 2022, 157, 112061. [Google Scholar] [CrossRef]
- Duan, W.; Zou, S.; Chen, Y.; Nover, D.; Fang, G.; Wang, Y. Sustainable water management for cross-border resources: The Balkhash Lake Basin of Central Asia, 1931–2015. J. Clean. Prod. 2020, 263, 121614. [Google Scholar] [CrossRef]
- Hu, Y.; Duan, W.; Chen, Y.; Zou, S.; Kayumba, P.M.; Qin, J. Exploring the changes and driving forces of water footprint in Central Asia: A global trade assessment. J. Clean. Prod. 2022, 375, 134062. [Google Scholar] [CrossRef]
- Black, A.R.; Burns, J.C. Re-assessing the flood risk in Scotland. Sci. Total Environ. 2002, 294, 169–184. [Google Scholar] [CrossRef]
- Hu, P.; Zhang, Q.; Xu, C.-Y.; Sun, S.; Fang, J. Spatiotemporal patterns and driving factors of flood disaster in China. Acta Geogr. Sin. 2021, 76, 1148. [Google Scholar] [CrossRef]
- Cao, Y.; Huang, L.; Aziz, N.M.; Kamaruzzaman, S.N. Building Information Modelling (BIM) Capabilities in the Design and Planning of Rural Settlements in China: A Systematic Review. Land 2022, 11, 1861. [Google Scholar] [CrossRef]
- Chen, L.-C.; Wu, C.-H.; Shen, T.-S.; Chou, C.-C. The application of geometric network models and building information models in geospatial environments for fire-fighting simulations. Comput. Environ. Urban Syst. 2014, 45, 1–12. [Google Scholar] [CrossRef]
- Au, E.H.; Lee, J.J. Virtual reality in education: A tool for learning in the experience age. IJIIE 2017, 4, 215. [Google Scholar] [CrossRef]
- Kanak, A.; Arif, I.; Kumas, O.; Ergun, S. Extending BIM to Urban Semantic Context for Data-driven Crisis Preparedness. In Proceedings of the 2020 IEEE International Conference on Systems, Man, and Cybernetics (SMC), Toronto, ON, Canada, 11–14 October 2020; IEEE: Toronto, ON, Canada, 2020; pp. 3813–3818. [Google Scholar]
- Xu, Z.; Zhang, L.; Li, H.; Lin, Y.-H.; Yin, S. Combining IFC and 3D tiles to create 3D visualization for building information modeling. Autom. Constr. 2020, 109, 102995. [Google Scholar] [CrossRef]
- Zhang, Y.; Li, J. Application of BIM and GIS in Emergency Management of Smart Cities. In Proceedings of the 2021 3rd International Symposium on Smart and Healthy Cities (ISHC), Toronto, ON, Canada, 28–29 December 2021; IEEE: Toronto, ON, Canada, 2021; pp. 1–5. [Google Scholar]
- Peng, S.; Su, G.; Chen, J.; Du, P. Design of an IoT-BIM-GIS Based Risk Management System for Hospital Basic Operation. In Proceedings of the 2017 IEEE Symposium on Service-Oriented System Engineering (SOSE), San Francisco, CA, USA, 6–9 April 2017; IEEE: San Francisco, CA, USA, 2017; pp. 69–74. [Google Scholar]
- Ma, Z.; Ren, Y. Integrated Application of BIM and GIS: An Overview. Procedia Eng. 2017, 196, 1072–1079. [Google Scholar] [CrossRef]
- Tang, L.; Chen, C.; Li, H.; Mak, D.Y.Y. Developing a BIM GIS–Integrated Method for Urban Underground Piping Management in China: A Case Study. J. Constr. Eng. Manag. 2022, 148, 05022004. [Google Scholar] [CrossRef]
- Liu, R.; Issa, R.R.A. 3D Visualization of Sub-Surface Pipelines in Connection with the Building Utilities: Integrating GIS and BIM for Facility Management. In Computing in Civil Engineering (2012); American Society of Civil Engineers: Clearwater Beach, FL, USA, 2012; pp. 341–348. [Google Scholar]
- Karan, E.P.; Irizarry, J.; Haymaker, J. BIM and GIS Integration and Interoperability Based on Semantic Web Technology. J. Comput. Civ. Eng. 2016, 30, 04015043. [Google Scholar] [CrossRef]
- Dost, P.; Breuer, D.; Krajinski, P.; Sourkounis, C. Multi-Purpose Communication Protocol for Wired and Wireless Sensor Networks with Actuators. In Proceedings of the 2019 IEEE International Conference on Industrial Technology (ICIT), Melbourne, Australia, 13–15 February 2019; IEEE: Melbourne, Australia, February 2019; pp. 1371–1376. [Google Scholar]
- Lei, Y.; Rao, Y.; Wu, J.; Lin, C.-H. BIM based cyber-physical systems for intelligent disaster prevention. J. Ind. Inf. Integr. 2020, 20, 100171. [Google Scholar] [CrossRef]
- Asadzadeh, A.; Arashpour, M.; Li, H.; Ngo, T.; Bab-Hadiashar, A.; Rashidi, A. Sensor-based safety management. Autom. Constr. 2020, 113, 103128. [Google Scholar] [CrossRef]
- Kong, L.; Yang, Q.; Zhou, Q.; Xing, J.; Sun, X.; Zou, R. Embedding knowledge into BIM: A case study of extending BIM with firefighting plans. J. Build. Eng. 2022, 49, 103999. [Google Scholar] [CrossRef]
- Tseng, P.-Y.; Lin, J.J.; Chan, Y.-C.; Chen, A.Y. Real-time indoor localization with visual SLAM for in-building emergency response. Autom. Constr. 2022, 140, 104319. [Google Scholar] [CrossRef]
- Valero, E.; Adán, A. Integration of RFID with other technologies in construction. Measurement 2016, 94, 614–620. [Google Scholar] [CrossRef]
- Kwan, M.-P.; Lee, J. Emergency response after 9/11: The potential of real-time 3D GIS for quick emergency response in micro-spatial environments. Comput. Environ. Urban Syst. 2005, 29, 93–113. [Google Scholar] [CrossRef]
- Song, Y.; Wang, X.; Tan, Y.; Wu, P.; Sutrisna, M.; Cheng, J.; Hampson, K. Trends and Opportunities of BIM-GIS Integration in the Architecture, Engineering and Construction Industry: A Review from a Spatio-Temporal Statistical Perspective. IJGI 2017, 6, 397. [Google Scholar] [CrossRef] [Green Version]
- Wang, Y.; Wang, Z.; Ma, T.; Li, G.; Tie, H. Research on the Realization Path of Railway Intelligent Construction Based on System Engineering. Sustainability 2022, 14, 6945. [Google Scholar] [CrossRef]
- Zhao, L.; Mbachu, J.; Liu, Z. Developing an Integrated BIM+GIS Web-Based Platform for a Mega Construction Project. KSCE J. Civ. Eng. 2022, 26, 1505–1521. [Google Scholar] [CrossRef]
- Hussain, Y.; Schlögel, R.; Innocenti, A.; Hamza, O.; Iannucci, R.; Martino, S.; Havenith, H.-B. Review on the Geophysical and UAV-Based Methods Applied to Landslides. Remote Sens. 2022, 14, 4564. [Google Scholar] [CrossRef]
- Agliata, R.; Bortone, A.; Mollo, L. The impact of the aggregation formula on indicator-based method for the assessment of building susceptibility to hydro-meteorological hazards. Int. J. Disaster Risk Reduct. 2022, 72, 102850. [Google Scholar] [CrossRef]
- Pazzi, V.; Tanteri, L.; Bicocchi, G.; D’Ambrosio, M.; Caselli, A.; Fanti, R. H/V measurements as an effective tool for the reliable detection of landslide slip surfaces: Case studies of Castagnola (La Spezia, Italy) and Roccalbegna (Grosseto, Italy). Phys. Chem. Earth Parts A/B/C 2017, 98, 136–153. [Google Scholar] [CrossRef] [Green Version]
- Wang, H.; Zhao, J. The Research in Digital Slope Information Technology: Evidences from Coastal Region of China. J. Coast. Res. 2020, 103, 798–801. [Google Scholar] [CrossRef]
- Nappo, N.; Mavrouli, O.; Nex, F.; van Westen, C.; Gambillara, R.; Michetti, A.M. Use of UAV-based photogrammetry products for semi-automatic detection and classification of asphalt road damage in landslide-affected areas. Eng. Geol. 2021, 294, 106363. [Google Scholar] [CrossRef]
- Skuodis, Š.; Daugevičius, M.; Medzvieckas, J.; Šneideris, A.; Jokūbaitis, A.; Rastenis, J.; Valivonis, J. Gediminas Hill Slopes Behavior in 3D Finite Element Model. Buildings 2022, 12, 1113. [Google Scholar] [CrossRef]
- Li, N.; Becerik-Gerber, B.; Krishnamachari, B.; Soibelman, L. A BIM centered indoor localization algorithm to support building fire emergency response operations. Autom. Constr. 2014, 42, 78–89. [Google Scholar] [CrossRef]
- Arabameri, A.; Chandra Pal, S.; Rezaie, F.; Chakrabortty, R.; Saha, A.; Blaschke, T.; Di Napoli, M.; Ghorbanzadeh, O.; Thi Ngo, P.T. Decision tree based ensemble machine learning approaches for landslide susceptibility mapping. Geocarto Int. 2022, 37, 4594–4627. [Google Scholar] [CrossRef]
- Hakim, W.L.; Rezaie, F.; Nur, A.S.; Panahi, M.; Khosravi, K.; Lee, C.-W.; Lee, S. Convolutional neural network (CNN) with metaheuristic optimization algorithms for landslide susceptibility mapping in Icheon, South Korea. J. Environ. Manag. 2022, 305, 114367. [Google Scholar] [CrossRef]
- Ado, M.; Amitab, K.; Maji, A.K.; Jasińska, E.; Gono, R.; Leonowicz, Z.; Jasiński, M. Landslide Susceptibility Mapping Using Machine Learning: A Literature Survey. Remote Sens. 2022, 14, 3029. [Google Scholar] [CrossRef]
- Al-Najjar, H.A.H.; Pradhan, B.; Kalantar, B.; Sameen, M.I.; Santosh, M.; Alamri, A. Landslide Susceptibility Modeling: An Integrated Novel Method Based on Machine Learning Feature Transformation. Remote Sens. 2021, 13, 3281. [Google Scholar] [CrossRef]
- Liang, Z.; Liu, W.; Peng, W.; Chen, L.; Wang, C. Improved Shallow Landslide Susceptibility Prediction Based on Statistics and Ensemble Learning. Sustainability 2022, 14, 6110. [Google Scholar] [CrossRef]
- Bertello, L.; Berti, M.; Castellaro, S.; Squarzoni, G. Dynamics of an Active Earthflow Inferred From Surface Wave Monitoring. JGR Earth Surf. 2018, 123, 1811–1834. [Google Scholar] [CrossRef]
- Lévy, C.; Baillet, L.; Jongmans, D.; Mourot, P.; Hantz, D. Dynamic response of the Chamousset rock column (Western Alps, France). J. Geophys. Res. 2010, 115, F04043. [Google Scholar] [CrossRef]
- Zou, L.; Gui, W. Simulation and prediction of geologic hazards and the impacts on homestay buildings in scenery spots through BIM. PLoS ONE 2020, 15, e0238864. [Google Scholar] [CrossRef] [PubMed]
- Liu, D.; He, L.; Wu, Q.; Gao, Y.; Liu, B.; Liu, S.; Luo, H. Construction and application of the 3D geo-hazard monitoring and early warning platform. Open Geosci. 2021, 13, 1040–1052. [Google Scholar] [CrossRef]
- Czikhardt, R.; Papco, J.; Bakon, M.; Liscak, P.; Ondrejka, P.; Zlocha, M. Ground Stability Monitoring of Undermined and Landslide Prone Areas by Means of Sentinel-1 Multi-Temporal InSAR, Case Study from Slovakia. Geosciences 2017, 7, 87. [Google Scholar] [CrossRef] [Green Version]
- Kothyari, G.C.; Malik, K.; Dumka, R.K.; Naik, S.P.; Biswas, R.; Taloor, A.K.; Luirei, K.; Joshi, N.; Kandregula, R.S. Identification of active deformation zone associated with the 28th April 2021 Assam earthquake (Mw 6.4) using the PSInSAR time series. J. Appl. Geophys. 2022, 206, 104811. [Google Scholar] [CrossRef]
- Liu, J.; Mason, P.J.; Bryant, E.C. Regional assessment of geohazard recovery eight years after the Mw7.9 Wenchuan earthquake: A remote-sensing investigation of the Beichuan region. Int. J. Remote Sens. 2018, 39, 1671–1695. [Google Scholar] [CrossRef] [Green Version]
- Zha, X.; Luo, P.; Zhu, W.; Wang, S.; Lyu, J.; Zhou, M.; Huo, A.; Wang, Z. A bibliometric analysis of the research on Sponge City: Current situation and future development direction. Ecohydrology 2021, 14, e2328. [Google Scholar] [CrossRef]
- Duan, W.; Maskey, S.; Chaffe, P.L.B.; Luo, P.; He, B.; Wu, Y.; Hou, J. Recent Advancement in Remote Sensing Technology for Hydrology Analysis and Water Resources Management. Remote Sens. 2021, 13, 1097. [Google Scholar] [CrossRef]
- Xiao, Y.; Yi, S.; Tang, Z. Integrated flood hazard assessment based on spatial ordered weighted averaging method considering spatial heterogeneity of risk preference. Sci. Total Environ. 2017, 599, 1034–1046. [Google Scholar] [CrossRef]
- Aoki, Y.; Yoshizawa, A.; Taminato, T. Anti-inundation Measures for Underground Stations of Tokyo Metro. Procedia Eng. 2016, 165, 2–10. [Google Scholar] [CrossRef]
- Hashimoto, H.; Park, K. Two-dimensional urban flood simulation: Fukuoka flood disaster in 1999. In Flood Recovery, Innovation and Response; WIT Press: London, UK, 2008; Volume 1, pp. 59–67. [Google Scholar]
- Lyu, H.-M.; Wang, G.-F.; Shen, J.; Lu, L.-H.; Wang, G.-Q. Analysis and GIS Mapping of Flooding Hazards on 10 May 2016, Guangzhou, China. Water 2016, 8, 447. [Google Scholar] [CrossRef] [Green Version]
- Lyu, H.-M.; Sun, W.-J.; Shen, S.-L.; Arulrajah, A. Flood risk assessment in metro systems of mega-cities using a GIS-based modeling approach. Sci. Total Environ. 2018, 626, 1012–1025. [Google Scholar] [CrossRef]
- Du, H.; Du, J.; Huang, S. GIS, GPS, and BIM-Based Risk Control of Subway Station Construction. In ICTE 2015; American Society of Civil Engineers: Dailan, China, 2015; pp. 1478–1485. [Google Scholar]
- Nikvar Hassani, A.; Farhadian, H.; Katibeh, H. A comparative study on evaluation of steady-state groundwater inflow into a circular shallow tunnel. Tunn. Undergr. Space Technol. 2018, 73, 15–25. [Google Scholar] [CrossRef]
- Elkhrachy, I. Assessment and Management Flash Flood in Najran Wady Using GIS and Remote Sensing. J. Indian Soc. Remote Sens. 2018, 46, 297–308. [Google Scholar] [CrossRef]
- Lochhead, I.; Hedley, N. Mixed reality emergency management: Bringing virtual evacuation simulations into real-world built environments. Int. J. Digit. Earth 2019, 12, 190–208. [Google Scholar] [CrossRef]
- Neuville, R.; Pouliot, J.; Billen, R. Identification of the Best 3D Viewpoint within the BIM Model: Application to Visual Tasks Related to Facility Management. Buildings 2019, 9, 167. [Google Scholar] [CrossRef] [Green Version]
- Riaz, Z.; Arslan, M.; Kiani, A.K.; Azhar, S. CoSMoS: A BIM and wireless sensor based integrated solution for worker safety in confined spaces. Autom. Constr. 2014, 45, 96–106. [Google Scholar] [CrossRef]
- Sun, Q.; Turkan, Y. A BIM-based simulation framework for fire safety management and investigation of the critical factors affecting human evacuation performance. Adv. Eng. Inform. 2020, 44, 101093. [Google Scholar] [CrossRef]
- Van Herbruggen, B.; Fontaine, J.; Poorter, E.D. Anchor Pair Selection for Error Correction in Time Difference of Arrival (TDoA) Ultra Wideband (UWB) Positioning Systems. In Proceedings of the 2021 International Conference on Indoor Positioning and Indoor Navigation (IPIN), Lloret de Mar, Spain, 29 November–2 December 2021; IEEE: Lloret de Mar, Spain, 2021; pp. 1–8. [Google Scholar]
- Akcan, H.; Evrendilek, C. GPS-free directional localization via dual wireless radios. Comput. Commun. 2012, 35, 1151–1163. [Google Scholar] [CrossRef] [Green Version]
- Chandra-Sekaran, A.-K.; Weisser, P.; Muller-Glaser, K.D.; Kunze, C. A Comparison of Bayesian Filter Based Approaches for Patient Localization during Emergency Response to Crisis. In Proceedings of the 2009 Third International Conference on Sensor Technologies and Applications, Athens, Greece, 18–23 June 2009; IEEE: Athens, Greece, 2009; pp. 636–642. [Google Scholar]
- Kaya, A.O.; Greenstein, L.; Chizhik, D.; Valenzuela, R.; Moayeri, N. Emitter Localization and Visualization (ELVIS): A Backward Ray Tracing Algorithm for Locating Emitters. In Proceedings of the 2007 41st Annual Conference on Information Sciences and Systems, Baltimore, MD, USA, 14–16 March 2007; IEEE: Baltimore, MD, USA, 2007; pp. 376–381. [Google Scholar]
- Khoury, H.M.; Kamat, V.R. Evaluation of position tracking technologies for user localization in indoor construction environments. Autom. Constr. 2009, 18, 444–457. [Google Scholar] [CrossRef]
- Ruppel, U.; Marcus Stubbe, K.; Zwinger, U. Indoor Navigation Integration Platform for firefighting purposes. In Proceedings of the 2010 International Conference on Indoor Positioning and Indoor Navigation, Zurich, Switzerland, 15–17 September 2010; IEEE: Zurich, Switzerland, 2010; pp. 1–6. [Google Scholar]
- Huang, J.; Luo, H.; Shao, W.; Zhao, F.; Yan, S. Accurate and Robust Floor Positioning in Complex Indoor Environments. Sensors 2020, 20, 2698. [Google Scholar] [CrossRef] [PubMed]
- Chakravarty, A.K. Humanitarian relief chain: Rapid response under uncertainty. Int. J. Prod. Econ. 2014, 151, 146–157. [Google Scholar] [CrossRef]
- Atyabi, S.; Kiavarz Moghaddam, M.; Rajabifard, A. Optimization of Emergency Evacuation in Fire Building by Integrated Bim and Gis. Int. Arch. Photogramm. Remote Sens. Spatial Inf. Sci. 2019, 42, 131–139. [Google Scholar] [CrossRef] [Green Version]
- Symanski, E.; An Han, H.; Han, I.; McDaniel, M.; Whitworth, K.W.; McCurdy, S.; Perkison, W.B.; Rammah, A.; Lewis, P.G.T.; Delclos, G.L.; et al. Responding to Natural and Industrial Disasters: Partnerships and Lessons Learned. Disaster Med. Public Health Prep. 2022, 16, 885–888. [Google Scholar] [CrossRef] [PubMed]
- Deng, H.; Ou, Z.; Zhang, G.; Deng, Y.; Tian, M. BIM and Computer Vision-Based Framework for Fire Emergency Evacuation Considering Local Safety Performance. Sensors 2021, 21, 3851. [Google Scholar] [CrossRef]
- Liu, X.; Wang, X.; Wright, G.; Cheng, J.; Li, X.; Liu, R. A State-Of-The-Art Review on the Integration of Building Information Modeling (BIM) and Geographic Information System (GIS). IJGI 2017, 6, 53. [Google Scholar] [CrossRef] [Green Version]
- Tashakkori, H.; Rajabifard, A.; Kalantari, M. A new 3D indoor/outdoor spatial model for indoor emergency response facilitation. Build. Environ. 2015, 89, 170–182. [Google Scholar] [CrossRef]
- D’Amico, F.; Calvi, A.; Schiattarella, E.; Prete, M.D.; Veraldi, V. BIM And GIS Data Integration: A Novel Approach Of Technical/Environmental Decision-Making Process In Transport Infrastructure Design. Transp. Res. Procedia 2020, 45, 803–810. [Google Scholar] [CrossRef]
- Zhu, J.; Wu, P. Towards Effective BIM/GIS Data Integration for Smart City by Integrating Computer Graphics Technique. Remote Sens. 2021, 13, 1889. [Google Scholar] [CrossRef]
- Liu, L.; Li, B.; Zlatanova, S.; Liu, H. The path from bim to a 3d indoor framework—A requirement analysis. Int. Arch. Photogramm. Remote Sens. Spat. Inf. Sci. 2018, 42, 373–378. [Google Scholar] [CrossRef] [Green Version]
- Rahman, S.S.A.; Maulud, K.A. Approaching BIM-GIS integration for 3D evacuation planning requirement using multipatch geometry data format. In IOP Conference Series: Earth and Environmental Science; IOP Publishing: Bristol, UK, 2019; Volume 385, p. 012033. [Google Scholar]
- Teo, T.-A.; Cho, K.-H. BIM-oriented indoor network model for indoor and outdoor combined route planning. Adv. Eng. Inform. 2016, 30, 268–282. [Google Scholar] [CrossRef]
- Xu, M.; Hijazi, I.; Mebarki, A.; Meouche, R.E.; Abune’meh, M. Indoor guided evacuation: TIN for graph generation and crowd evacuation. Geomat. Nat. Hazards Risk 2016, 7, 47–56. [Google Scholar] [CrossRef] [Green Version]
- Xia, H.; Liu, Z.; Efremochkina, M.; Liu, X.; Lin, C. Study on city digital twin technologies for sustainable smart city design: A review and bibliometric analysis of geographic information system and building information modeling integration. Sustain. Cities Soc. 2022, 84, 104009. [Google Scholar] [CrossRef]
- Li, Y.; Chen, M.; Dou, Z.; Zheng, X.; Cheng, Y.; Mebarki, A. A review of cellular automata models for crowd evacuation. Phys. A Stat. Mech. Its Appl. 2019, 526, 120752. [Google Scholar] [CrossRef]
- Nguyen, V.-Q.; Vu, H.-T.; Nguyen, V.-H.; Kim, K. A Smart Evacuation Guidance System for Large Buildings. Electronics 2022, 11, 2938. [Google Scholar] [CrossRef]
- Isikdag, U.; Underwood, J.; Aouad, G. An investigation into the applicability of building information models in geospatial environment in support of site selection and fire response management processes. Adv. Eng. Inform. 2008, 22, 504–519. [Google Scholar] [CrossRef]
- Mignard, C.; Nicolle, C. Merging BIM and GIS using ontologies application to urban facility management in ACTIVe3D. Comput. Ind. 2014, 65, 1276–1290. [Google Scholar] [CrossRef]
- Baarimah, A.O.; Alaloul, W.S.; Liew, M.S.; Kartika, W.; Al-Sharafi, M.A.; Musarat, M.A.; Alawag, A.M.; Qureshi, A.H. A Bibliometric Analysis and Review of Building Information Modelling for Post-Disaster Reconstruction. Sustainability 2021, 14, 393. [Google Scholar] [CrossRef]
- Xu, Z.; Zhang, H.; Lu, X.; Xu, Y.; Zhang, Z.; Li, Y. A prediction method of building seismic loss based on BIM and FEMA P-58. Autom. Constr. 2019, 102, 245–257. [Google Scholar] [CrossRef]
- Rad, M.A.H.; Jalaei, F.; Golpour, A.; Varzande, S.S.H.; Guest, G. BIM-based approach to conduct Life Cycle Cost Analysis of resilient buildings at the conceptual stage. Autom. Constr. 2021, 123, 103480. [Google Scholar] [CrossRef]
- Ramírez Eudave, R.; Ferreira, T.M. On the suitability of a unified GIS-BIM-HBIM framework for cataloguing and assessing vulnerability in Historic Urban Landscapes: A critical review. Int. J. Geogr. Inf. Sci. 2021, 35, 2047–2077. [Google Scholar] [CrossRef]
- Zou, Y.; Gonzalez, V.; Lim, J.; Amor, R.; Guo, B.; Babaeian Jelodar, M. Systematic Framework for Postearthquake Bridge Inspection through Uav and 3d Bim Reconstruction; CIB World Building Congress: Hong Kong, China, 2019; pp. 17–21. [Google Scholar]
- Messaoudi, M.; Nawari, N.O. BIM-based Virtual Permitting Framework (VPF) for post-disaster recovery and rebuilding in the state of Florida. Int. J. Disaster Risk Reduct. 2020, 42, 101349. [Google Scholar] [CrossRef]
- Assem, A.; Abdelmohsen, S.; Ezzeldin, M. Smart management of the reconstruction process of post-conflict cities. ARCH 2019, 14, 325–343. [Google Scholar] [CrossRef]
- Barazzetti, L.; Previtali, M.; Scaioni, M. Roads Detection and Parametrization in Integrated BIM-GIS Using LiDAR. Infrastructures 2020, 5, 55. [Google Scholar] [CrossRef]
- Wang, C.; Liu, X.; Zhang, K. Research on 4D Simulation Technology of Reconstruction Engineering Construction Organization Based on BIM. IOP Conf. Ser. Earth Environ. Sci. 2020, 568, 012016. [Google Scholar] [CrossRef]
- Baik, A.; Yaagoubi, R.; Boehm, J. Integration of Jeddah Historical BIM and 3D GIS for Documentation and Restoration of Historical Monument; International Society for Photogrammetry and Remote Sensing (ISPRS): Hannover, Germany, 2015. [Google Scholar]
- Loli, M.; Manousakis, J.; Mitoulis, S.; Zekkos, D. UAV-enabled flood damage assessment and recovery monitoring of bridges following Medicane Ianos. In Bridge Safety, Maintenance, Management, Life-Cycle, Resilience and Sustainability; CRC Press: Boca Raton, FL, USA, 2022; pp. 828–836. [Google Scholar]
- Bemis, S.P.; Micklethwaite, S.; Turner, D.; James, M.R.; Akciz, S.; Thiele, S.T.; Bangash, H.A. Ground-based and UAV-Based photogrammetry: A multi-scale, high-resolution mapping tool for structural geology and paleoseismology. J. Struct. Geol. 2014, 69, 163–178. [Google Scholar] [CrossRef]
- Kurdel, P.; Sedláčková, A.N.; Labun, J. UAV flight safety close to the mountain massif. Transp. Res. Procedia 2019, 43, 319–327. [Google Scholar] [CrossRef]
- Silvagni, M.; Tonoli, A.; Zenerino, E.; Chiaberge, M. Multipurpose UAV for search and rescue operations in mountain avalanche events. Geomat. Nat. Hazards Risk 2017, 8, 18–33. [Google Scholar] [CrossRef] [Green Version]
- Li, B.; Hou, J.; Li, D.; Yang, D.; Han, H.; Bi, X.; Wang, X.; Hinkelmann, R.; Xia, J. Application of LiDAR UAV for High-Resolution Flood Modelling. Water Resour. Manag. 2021, 35, 1433–1447. [Google Scholar] [CrossRef]
- Ecke, S.; Dempewolf, J.; Frey, J.; Schwaller, A.; Endres, E.; Klemmt, H.-J.; Tiede, D.; Seifert, T. UAV-Based Forest Health Monitoring: A Systematic Review. Remote Sens. 2022, 14, 3205. [Google Scholar] [CrossRef]
- Mohan, M.; Richardson, G.; Gopan, G.; Aghai, M.M.; Bajaj, S.; Galgamuwa, G.A.P.; Vastaranta, M.; Arachchige, P.S.P.; Amorós, L.; Corte, A.P.D.; et al. UAV-Supported Forest Regeneration: Current Trends, Challenges and Implications. Remote Sens. 2021, 13, 2596. [Google Scholar] [CrossRef]
- Wahyudi, A.H.; Muzayadah, N.L.; Ruhiyat, A.; Setyadewi, I.T.; Sumarna, E.; Dewi, A.K.; Nirmala, G.S.; Tuah Ramadhan, J.H.; Munir, A. Performance Analysis of PLA-Based EMI Shield Material for MALE UAV Application. In Proceedings of the 2021 Asia-Pacific International Symposium on Electromagnetic Compatibility (APEMC), Nusa Dua-Bali, Indonesia, 27–30 September 2021; IEEE: Nusa Dua-Bali, Indonesia, 2021; pp. 1–4. [Google Scholar]
- Singhal, G.; Bansod, B.; Mathew, L. Unmanned Aerial Vehicle Classification, Applications and Challenges: A Review. Engineering 2018. Available online: https://europepmc.org/article/PPR/PPR63927 (accessed on 25 October 2022).
- Crosetto, M.; Monserrat, O.; Cuevas-González, M.; Devanthéry, N.; Crippa, B. Persistent Scatterer Interferometry: A review. ISPRS J. Photogramm. Remote Sens. 2016, 115, 78–89. [Google Scholar] [CrossRef] [Green Version]
- Lohman, R.B.; Simons, M. Locations of selected small earthquakes in the Zagros mountains: SMALL ZAGROS EARTHQUAKES. Geochem. Geophys. Geosyst. 2005, 6, 1–10. [Google Scholar] [CrossRef]
- Arain, Q.A.; Memon, H.; Memon, I.; Memon, M.H.; Shaikh, R.A.; Mangi, F.A. Intelligent travel information platform based on location base services to predict user travel behavior from user-generated GPS traces. Int. J. Comput. Appl. 2017, 39, 155–168. [Google Scholar] [CrossRef]
- Zhou, J.; Shi, J. RFID localization algorithms and applications—A review. J. Intell. Manuf. 2009, 20, 695–707. [Google Scholar] [CrossRef]
- Andrade, C.B.; Hoefel, R.P.F. IEEE 802.11 WLANs: A comparison on indoor coverage models. In Proceedings of the CCECE 2010, Calgary, AB, Canada, 2–5 May 2010; IEEE: Calgary, AB, Canada, 2010; pp. 1–6. [Google Scholar]
- Landaluce, H.; Arjona, L.; Perallos, A.; Falcone, F.; Angulo, I.; Muralter, F. A Review of IoT Sensing Applications and Challenges Using RFID and Wireless Sensor Networks. Sensors 2020, 20, 2495. [Google Scholar] [CrossRef] [PubMed]
- Basiri, A.; Lohan, E.S.; Moore, T.; Winstanley, A.; Peltola, P.; Hill, C.; Amirian, P.; Figueiredo e Silva, P. Indoor location based services challenges, requirements and usability of current solutions. Comput. Sci. Rev. 2017, 24, 1–12. [Google Scholar] [CrossRef] [Green Version]
- Wang, H. Sensing Information Modelling for Smart City. In Proceedings of the 2015 IEEE International Conference on Smart City/SocialCom/SustainCom (SmartCity), Chengdu, China, 19–21 December 2015; IEEE: Chengdu, China, 2015; pp. 40–45. [Google Scholar]
- Long, Y.; Zhang, Y.; Zhang, E.; Chen, Y. Present Situation and Future Development Trend of China’s Smart City. Contemp. Archit. 2020, 1, 18–22. [Google Scholar]
- Hashemi-Beni, L.; Jones, J.; Thompson, G.; Johnson, C.; Gebrehiwot, A. Challenges and Opportunities for UAV-Based Digital Elevation Model Generation for Flood-Risk Management: A Case of Princeville, North Carolina. Sensors 2018, 18, 3843. [Google Scholar] [CrossRef] [Green Version]
- Niknam, M.; Karshenas, S. Sustainable Design of Buildings using Semantic BIM and Semantic Web Services. Procedia Eng. 2015, 118, 909–917. [Google Scholar] [CrossRef] [Green Version]
- Wang, H.; Meng, X. BIM-Supported Knowledge Management: Potentials and Expectations. J. Manag. Eng. 2021, 37, 04021032. [Google Scholar] [CrossRef]
- Wang, H.; Pan, Y.; Luo, X. Integration of BIM and GIS in sustainable built environment: A review and bibliometric analysis. Autom. Constr. 2019, 103, 41–52. [Google Scholar] [CrossRef]
- Kang, T. Development of a Conceptual Mapping Standard to Link Building and Geospatial Information. IJGI 2018, 7, 162. [Google Scholar] [CrossRef] [Green Version]
- Karan, E.P.; Irizarry, J. Extending BIM interoperability to preconstruction operations using geospatial analyses and semantic web services. Autom. Constr. 2015, 53, 1–12. [Google Scholar] [CrossRef]
- Hor, A.-H.; Jadidi, A.; Sohn, G. BIM-GIS integrated geospatial information model using semantic web and RDF graphs. ISPRS Ann. Photogramm. Remote Sens. Spat. Inf. Sci. 2016, 3, 73–79. [Google Scholar] [CrossRef] [Green Version]
- Nour, M. Manipulating IFC sub-models in collaborative teamwork environments. In Proceedings of the 24th CIB W-78 Conference on Information Technology in Construction, Maribor, Slovenia, 27–29 June 2007; pp. 26–29. [Google Scholar]
- Zhu, J.; Wang, X.; Wang, P.; Wu, Z.; Kim, M.J. Integration of BIM and GIS: Geometry from IFC to shapefile using open-source technology. Autom. Constr. 2019, 102, 105–119. [Google Scholar] [CrossRef]
- Zhu, J.; Wang, X.; Chen, M.; Wu, P.; Kim, M.J. Integration of BIM and GIS: IFC geometry transformation to shapefile using enhanced open-source approach. Autom. Constr. 2019, 106, 102859. [Google Scholar] [CrossRef]
- Demir Altıntaş, Y.; Ilal, M.E. Loose coupling of GIS and BIM data models for automated compliance checking against zoning codes. Autom. Constr. 2021, 128, 103743. [Google Scholar] [CrossRef]
- Hamledari, H.; Davari, S.; Azar, E.R.; McCabe, B.; Flager, F.; Fischer, M. UAV-enabled site-to-BIM automation: Aerial robotic-and computer vision-based development of as-built/as-is BIMs and quality control. In Proceedings of the Construction Research Congress, New Orleans, LA, USA, 2–4 April 2018; pp. 336–346. [Google Scholar]
- Arroyo Ohori, K.; Diakité, A.; Krijnen, T.; Ledoux, H.; Stoter, J. Processing BIM and GIS Models in Practice: Experiences and Recommendations from a GeoBIM Project in The Netherlands. IJGI 2018, 7, 311. [Google Scholar] [CrossRef] [Green Version]
- Lv, Z.; Yin, T.; Zhang, X.; Song, H.; Chen, G. Virtual Reality Smart City Based on WebVRGIS. IEEE Internet Things J. 2016, 3, 1015–1024. [Google Scholar] [CrossRef]
- Carneiro, J.; Rossetti, R.J.F.; Silva, D.C.; Oliveira, E.C. BIM, GIS, IoT, and AR/VR Integration for Smart Maintenance and Management of Road Networks: A Review. In Proceedings of the 2018 IEEE International Smart Cities Conference (ISC2), Kansas City, MO, USA, 16–19 September 2018; IEEE: Kansas City, MO, USA, 2018; pp. 1–7. [Google Scholar]
- Wu, C.; Zarrinmehr, S.; Asl, M.R.; Clayton, M.J. An automated framework creating parametric BIM from GIS data to support design decisions. In Proceedings of the Symposium on Simulation for Architecture and Urban Design, Atlanta, GA, USA, 7–9 April 2019; pp. 1–7. [Google Scholar]
- Shkundalov, D.; Vilutienė, T. Bibliometric analysis of Building Information Modeling, Geographic Information Systems and Web environment integration. Autom. Constr. 2021, 128, 103757. [Google Scholar] [CrossRef]
- Guyo, E.; Hartmann, T.; Ungureanu, L. Interoperability between BIM and GIS through Open Data Standards: An Overview of Current Literature. In Proceedings of the 9th Linked Data in Architecture and Construction Workshop—LDAC2021, Luxembourg, 11–13 October 2021; pp. 115–126. [Google Scholar]
- Pauwels, P.; Zhang, S.; Lee, Y.-C. Semantic web technologies in AEC industry: A literature overview. Autom. Constr. 2017, 73, 145–165. [Google Scholar] [CrossRef]
- Adibfar, A.; Costin, A.; Issa, R.R.A. Design Copyright in Architecture, Engineering, and Construction Industry: Review of History, Pitfalls, and Lessons Learned. J. Leg. Aff. Disput. Resolut. Eng. Constr. 2020, 12, 04520032. [Google Scholar] [CrossRef]
- Baharom, M.H.; Abdullah Habib, S.N.H.; Ismail, S. Building Information Modelling (BIM): Contractual Issues of Intellectual Property Rights (IPR) in Construction Projects. Int. J. Sustain. Constr. Eng. Technol. 2021, 12, 170–178. [Google Scholar] [CrossRef]


| Primary Criteria | Secondary Criteria | ||
|---|---|---|---|
| Inclusionary | Exclusionary | Inclusionary | Exclusionary |
| Journal articles, reviews, and conference papers that can be searched in the databases of WoS or Scopus | Duplicated papers | The papers that can assist the authors in obtaining urban disaster-related knowledge and disaster management approaches | Articles that are not helpful in achieving the following objectives: 1. Obtain urban disaster-related knowledge and disaster management approaches. 2. Identify the capabilities of BIM–GIS integration in urban disaster management. 3. Discuss and analyze the data acquisition method, interoperability, and data process and utilization methods of BIM–GIS integration in urban disaster management. 4. Discuss and summarize the advantages, challenges, and future directions of BIM–GIS integrated utilization in urban disaster management. |
| Invalid articles (articles that cannot provide the online version of the full-text content) | The documents that can assist the authors in identifying the BIM–GIS capabilities in urban disaster management | ||
| The documents that can assist the authors in discussing and analyzing the data acquisition method, interoperability, and data process and utilization methods of the BIM–GIS integration in urban disaster management | |||
| The documents that can assist the authors in discussing and summarizing the advantages, challenges, and future directions of BIM–GIS integrated utilization in urban disaster management | |||
| Search Engine | Search String | Results |
|---|---|---|
| WoS | TS = ((“Building Information Modeling” OR “Geographic Information System“ OR “BIM–GIS”) AND (“disaster” OR “hazard” OR “flood” OR “fire” OR “landslide” OR “earthquake” OR “storm” OR “hurricane” OR “evacuation” OR “rescue” OR “escape”) AND (“prevention” OR “mitigation” OR “response” OR “recovery” OR “rescue” OR “escape” OR “evacuation”)) | 1260 |
| Document Types: Articles or Proceeding Papers or Review Articles | 1258 | |
| Scopus | TITLE-ABS-KEY ((“Building Information Modeling” OR “Geographic Information System“ OR “BIM–GIS”) AND (“disaster” OR “hazard” OR “flood” OR “fire” OR “landslide” OR “earthquake” OR “storm” OR “hurricane” OR “evacuation” OR “rescue” OR “escape”) AND (“prevention” OR “mitigation” OR “response” OR “recovery” OR “rescue” OR “escape” OR “evacuation”)) | 4779 |
| AND (LIMIT-TO (DOCTYPE, “ar”) OR LIMIT-TO (DOCTYPE, “cp”) OR LIMIT-TO (DOCTYPE, “re”) | 4577 | |
| Sum of the papers = 5835 | ||
| Conduct a full-text review of the remaining articles in this study. |
| Identify the capabilities of BIM–GIS integration that can be utilized in urban disaster management. |
| Organize the similar capabilities of BIM–GIS integration together. |
| Develop the classification based on the methods of BIM–GIS capabilities in exerting their effectiveness in urban disaster management. |
| Check for consistency by referring to other studies. |
| Verify the developed classifications in this study. |
| Scenario Simulation and Visualization | Scenario Analysis | Positioning | Route Planning and Automatic Pathfinding | Data Analysis | |
|---|---|---|---|---|---|
| Flood | [2,17,18,20,33,64,102,103,104,109,110,145] | [2,5,17,18,20,33,101,102,104,108] | [133] | [5,17,18,59,81,101,103,105,107,108,140] | |
| Landslide | [2,83,84,85,95,109,110,145] | [2,83,84,85,88,90,91,95,96] | [59,81,82,83,87,88,89,90,91,92,93,94,95,96] | ||
| Fire | [2,34,45,60,62,68,109,110,112,125,135,145] | [2,34,45,65,67,125,129,135] | [60,64,74,75,112,114,115,116,117,118,119,131] | [60,64,112,118,119,121,125,129,130,131,133,134] | [45,59,62,67,73,94,111,125,135,140] |
| Earthquake | [2,45,62,64,67,68,95,98,109,110,138,141,145] | [2,44,45,67,95,97,98] | [8,64,74,114,115,117,131] | [131,133] | [44,45,59,62,67,81,82,94,95,98,138,139,140,141] |
Disclaimer/Publisher’s Note: The statements, opinions and data contained in all publications are solely those of the individual author(s) and contributor(s) and not of MDPI and/or the editor(s). MDPI and/or the editor(s) disclaim responsibility for any injury to people or property resulting from any ideas, methods, instructions or products referred to in the content. |
© 2023 by the authors. Licensee MDPI, Basel, Switzerland. This article is an open access article distributed under the terms and conditions of the Creative Commons Attribution (CC BY) license (https://creativecommons.org/licenses/by/4.0/).
Share and Cite
Cao, Y.; Xu, C.; Aziz, N.M.; Kamaruzzaman, S.N. BIM–GIS Integrated Utilization in Urban Disaster Management: The Contributions, Challenges, and Future Directions. Remote Sens. 2023, 15, 1331. https://doi.org/10.3390/rs15051331
Cao Y, Xu C, Aziz NM, Kamaruzzaman SN. BIM–GIS Integrated Utilization in Urban Disaster Management: The Contributions, Challenges, and Future Directions. Remote Sensing. 2023; 15(5):1331. https://doi.org/10.3390/rs15051331
Chicago/Turabian StyleCao, Yu, Cong Xu, Nur Mardhiyah Aziz, and Syahrul Nizam Kamaruzzaman. 2023. "BIM–GIS Integrated Utilization in Urban Disaster Management: The Contributions, Challenges, and Future Directions" Remote Sensing 15, no. 5: 1331. https://doi.org/10.3390/rs15051331