
Dynamic Data Augmentation Based on Imitating Real Scene for Lane Line Detection
 , ,
, ,
Abstract
:1. Introduction
1.1. Related Works
1.1.1. Lane Line Detection
1.1.2. Data Augmentation
1.1.3. Data Augmentation for the Lane Line Detection
1.2. Paper Contribution
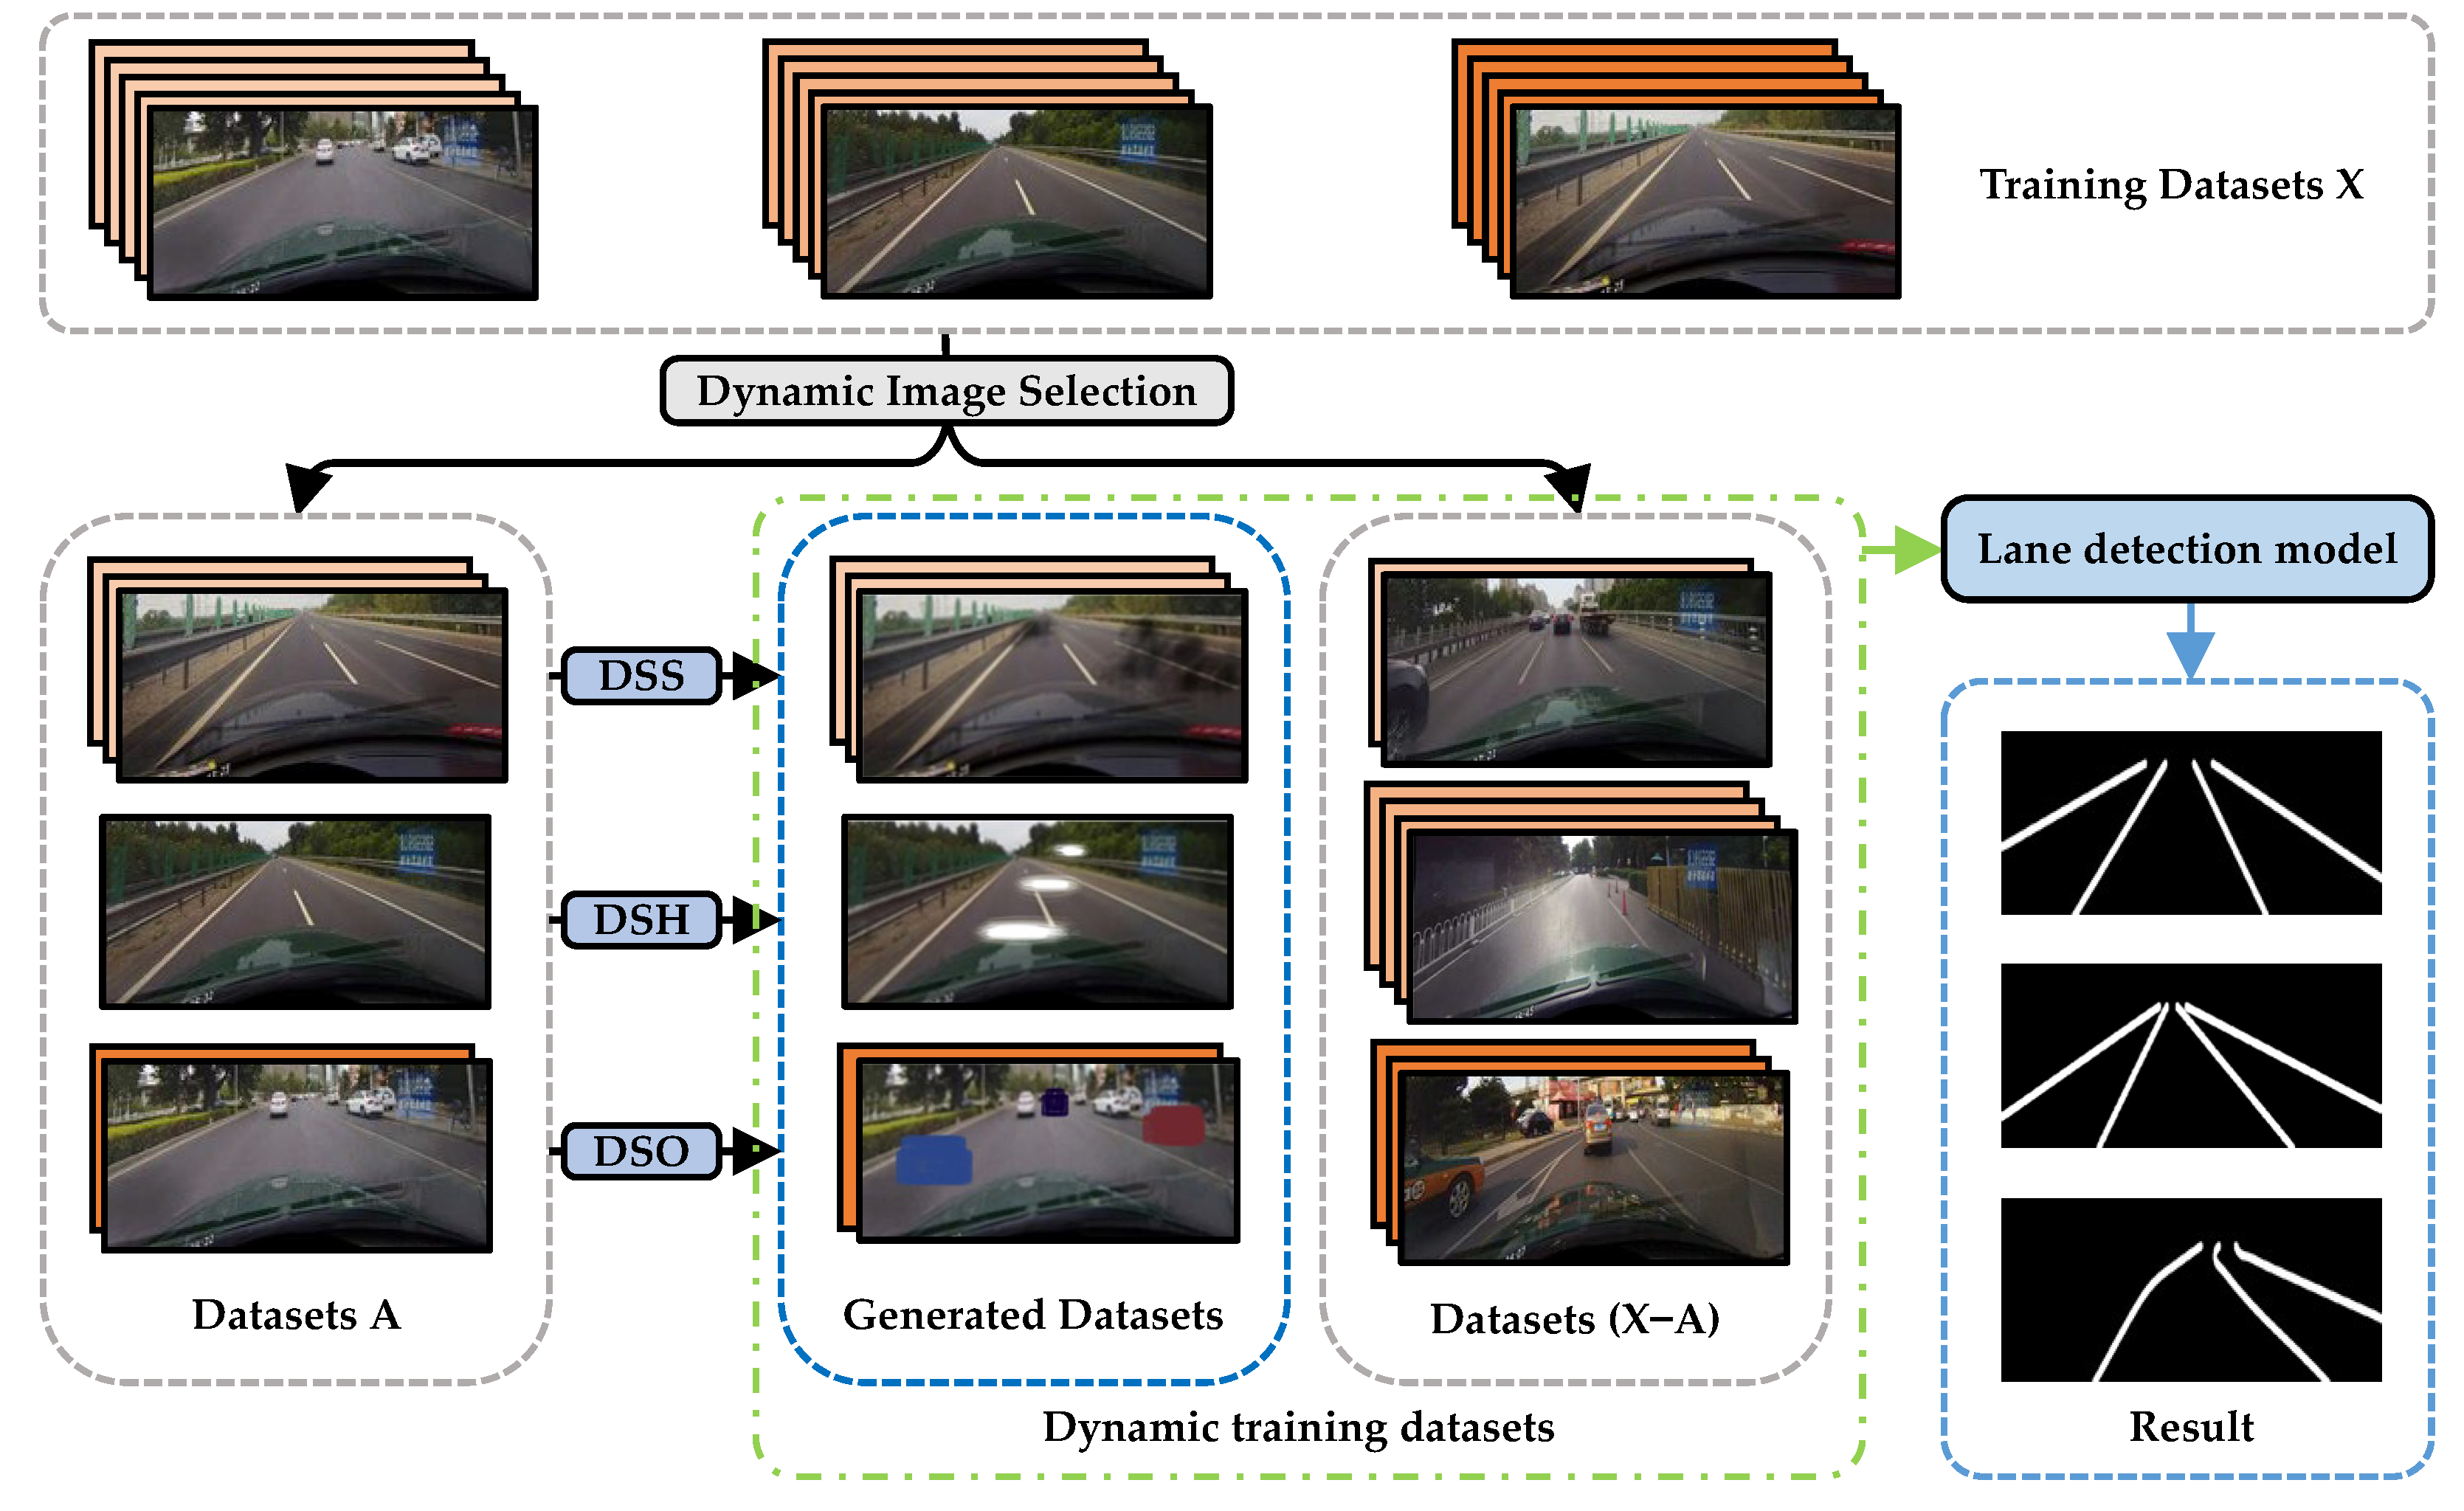
- A dynamic data augmentation framework based on imitating real scene is proposed. The framework can be integrated with a variety of training-based models without changing the learning strategy, any additional parameter learning or memory consumption, and is a lightweight and plug-and-play framework. It complements existing data augmentation methods for lane line detection.
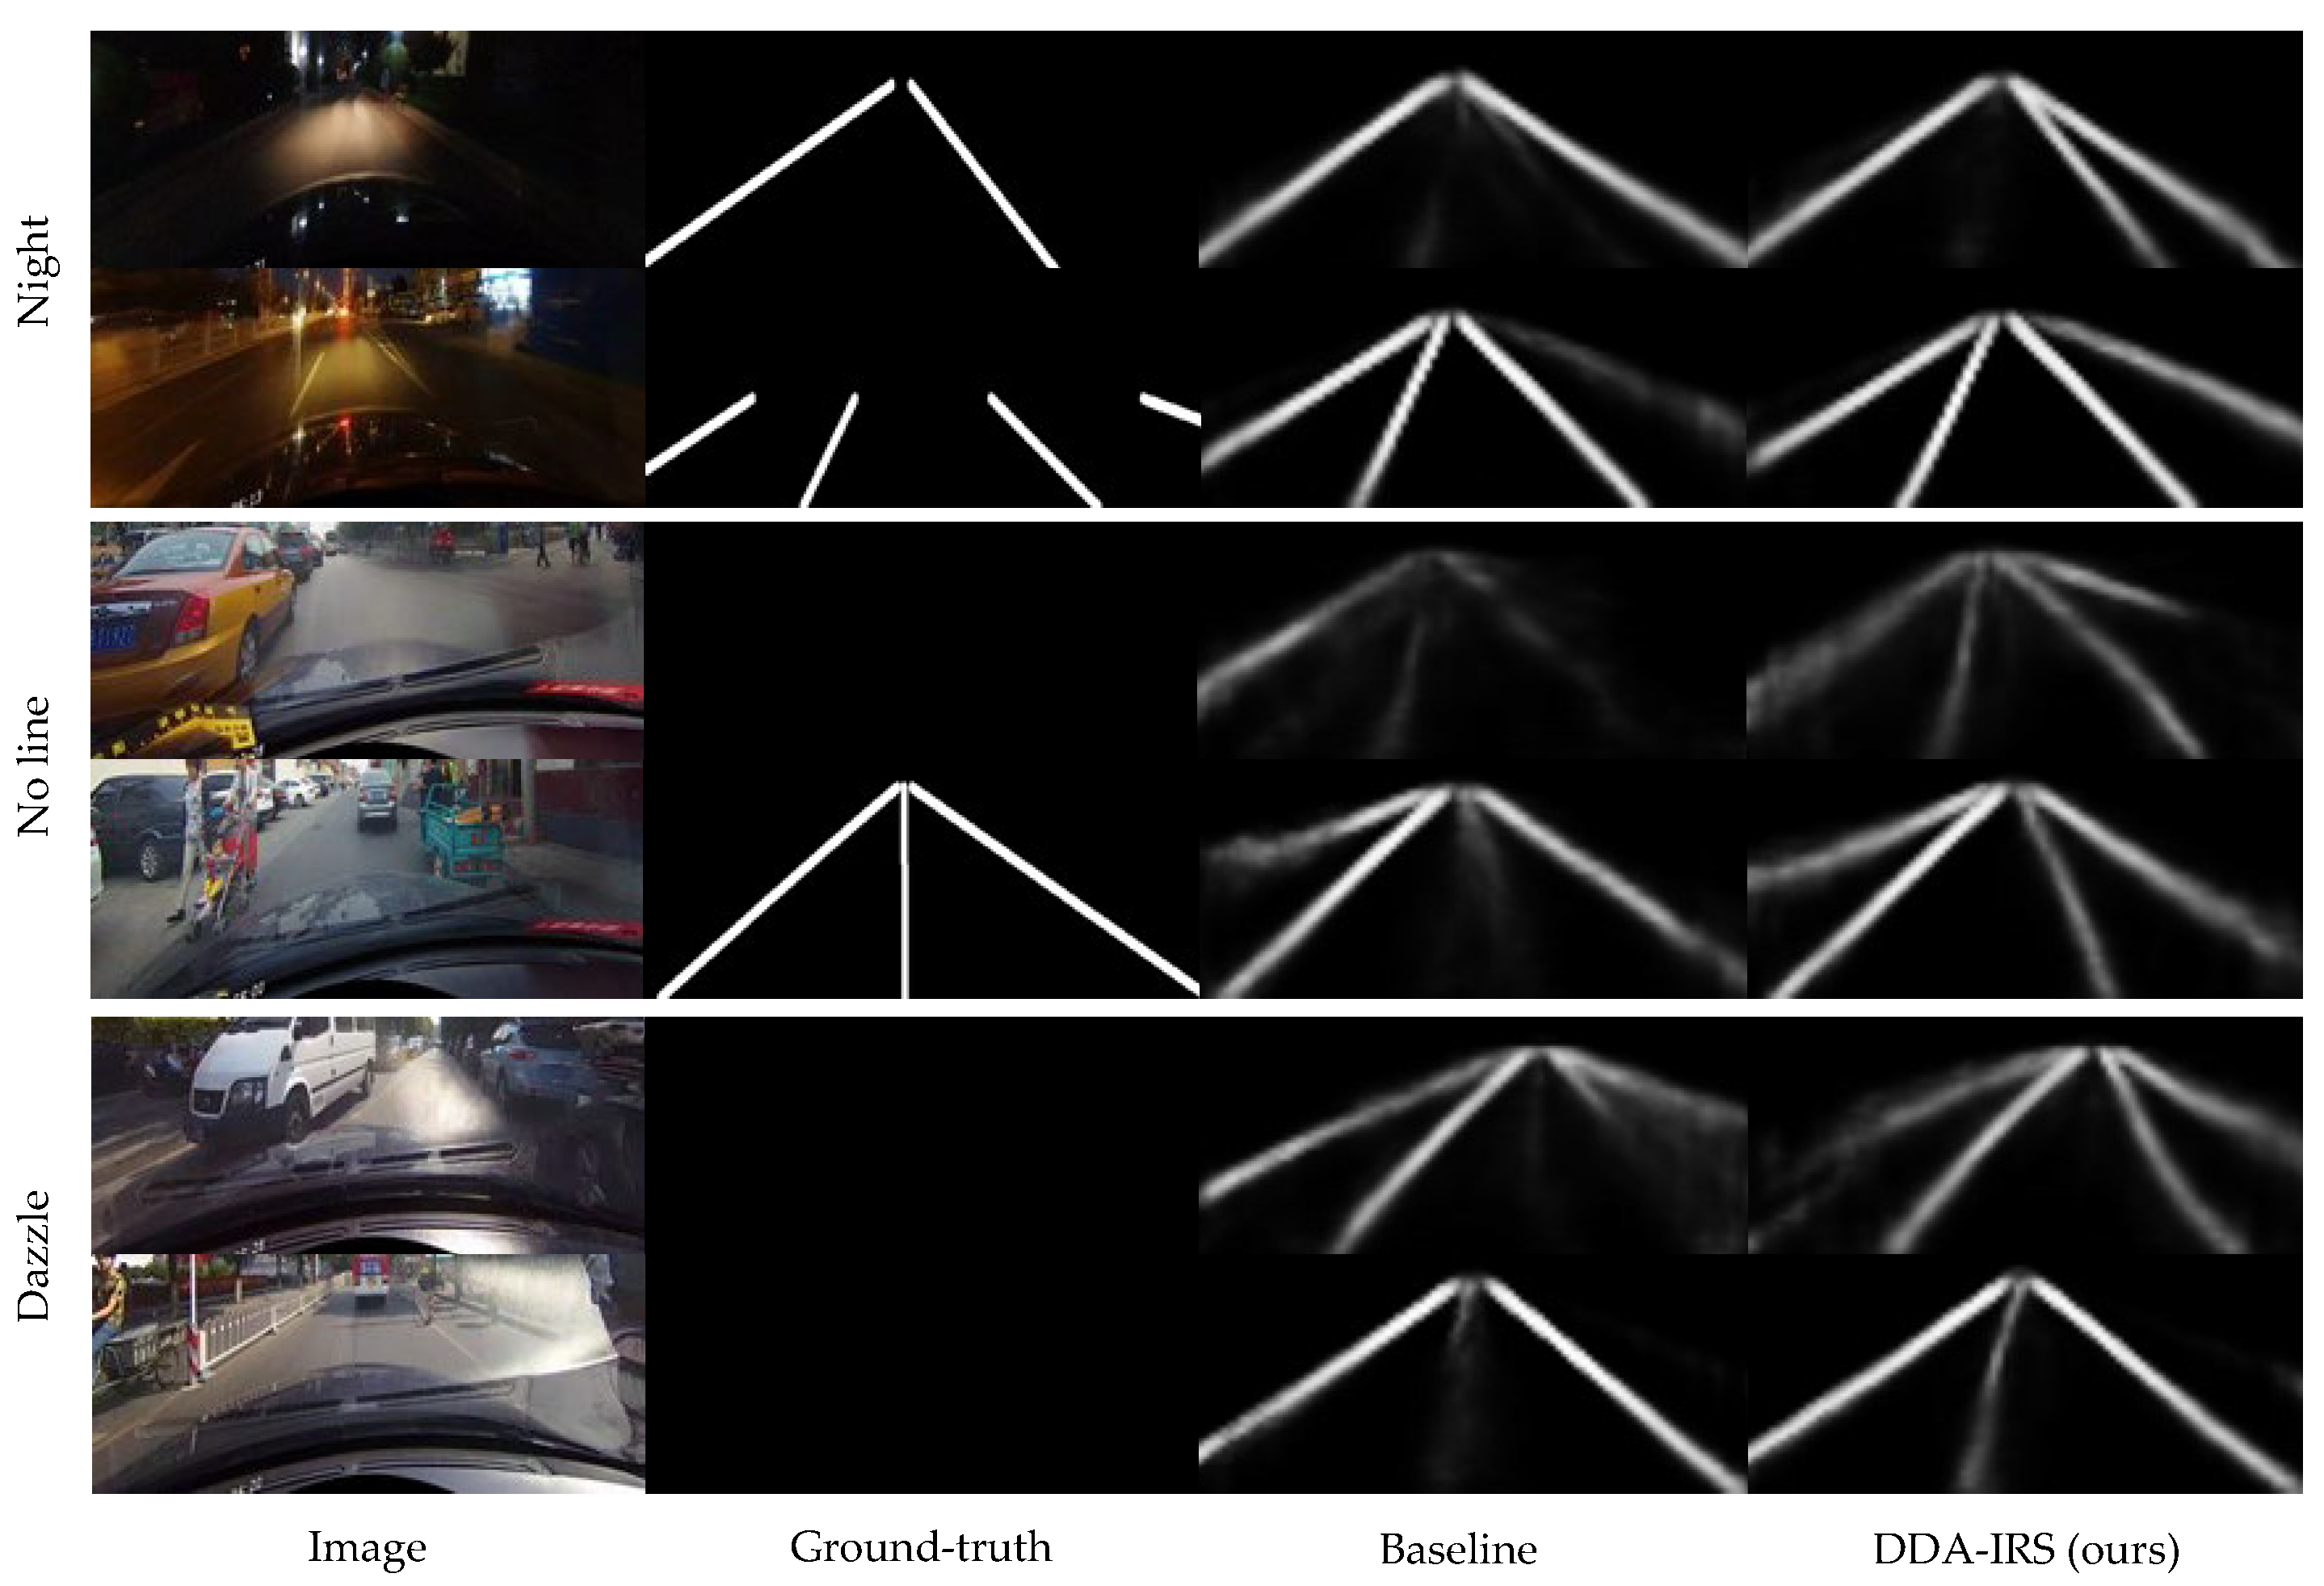
- Three dynamic data augmentation strategies that simulate different realistic scenes are contained in the framework. Different simulation styles are added to the dynamically selected training dataset in different ways to simulate the three scenes of crowded, shadow and dazzle. Experiment results show that our strategies can improve the robustness of the lane line detection model to detect partially obscured samples. For example, the lane lines in the long distance are effectively extended in the test results.
2. Methods
2.1. DDA-IRS-DSS
| Algorithm 1: Dynamic Simulation of Road Shadows Procedure |
| Input: Input image ;
Image size and ; Area of image ; Simulating road shadows probability ; Simulating road shadows area ratio range and ; Number of vertices . Output: Simulated image . Initialization: .
|
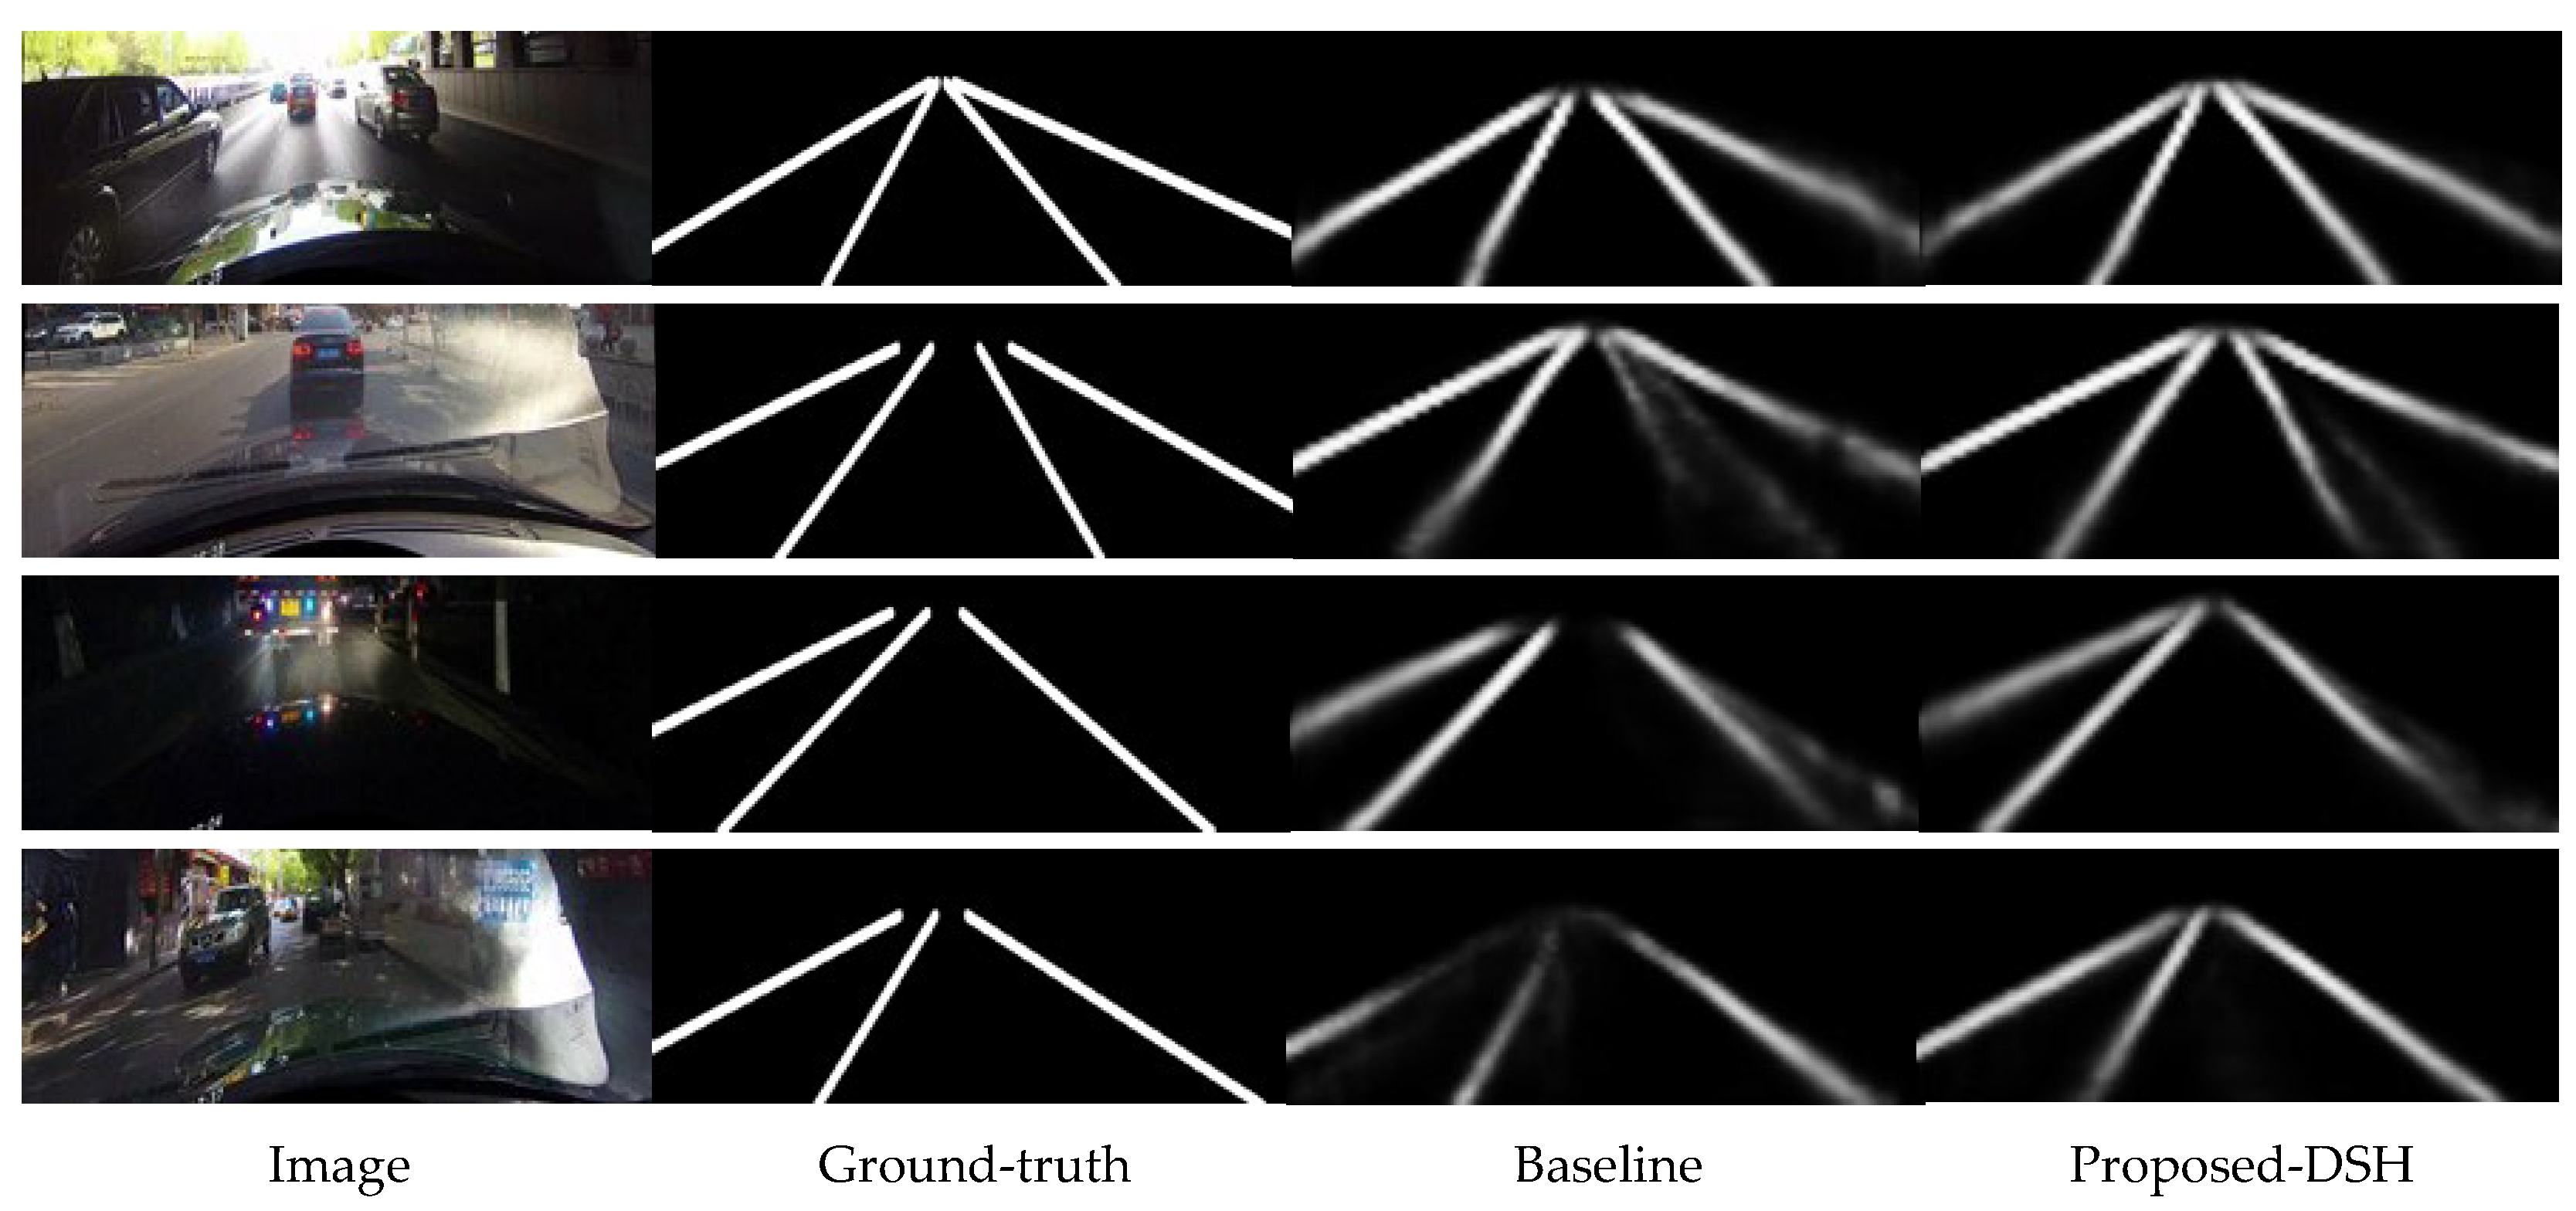
2.2. DDA-IRS-DSH
| Algorithm 2: Dynamic Simulation of Highlights Procedure |
| Input: Input image ;
Image size and ; Simulating highlights probability ; Output: Simulated image . Initialization: .
|
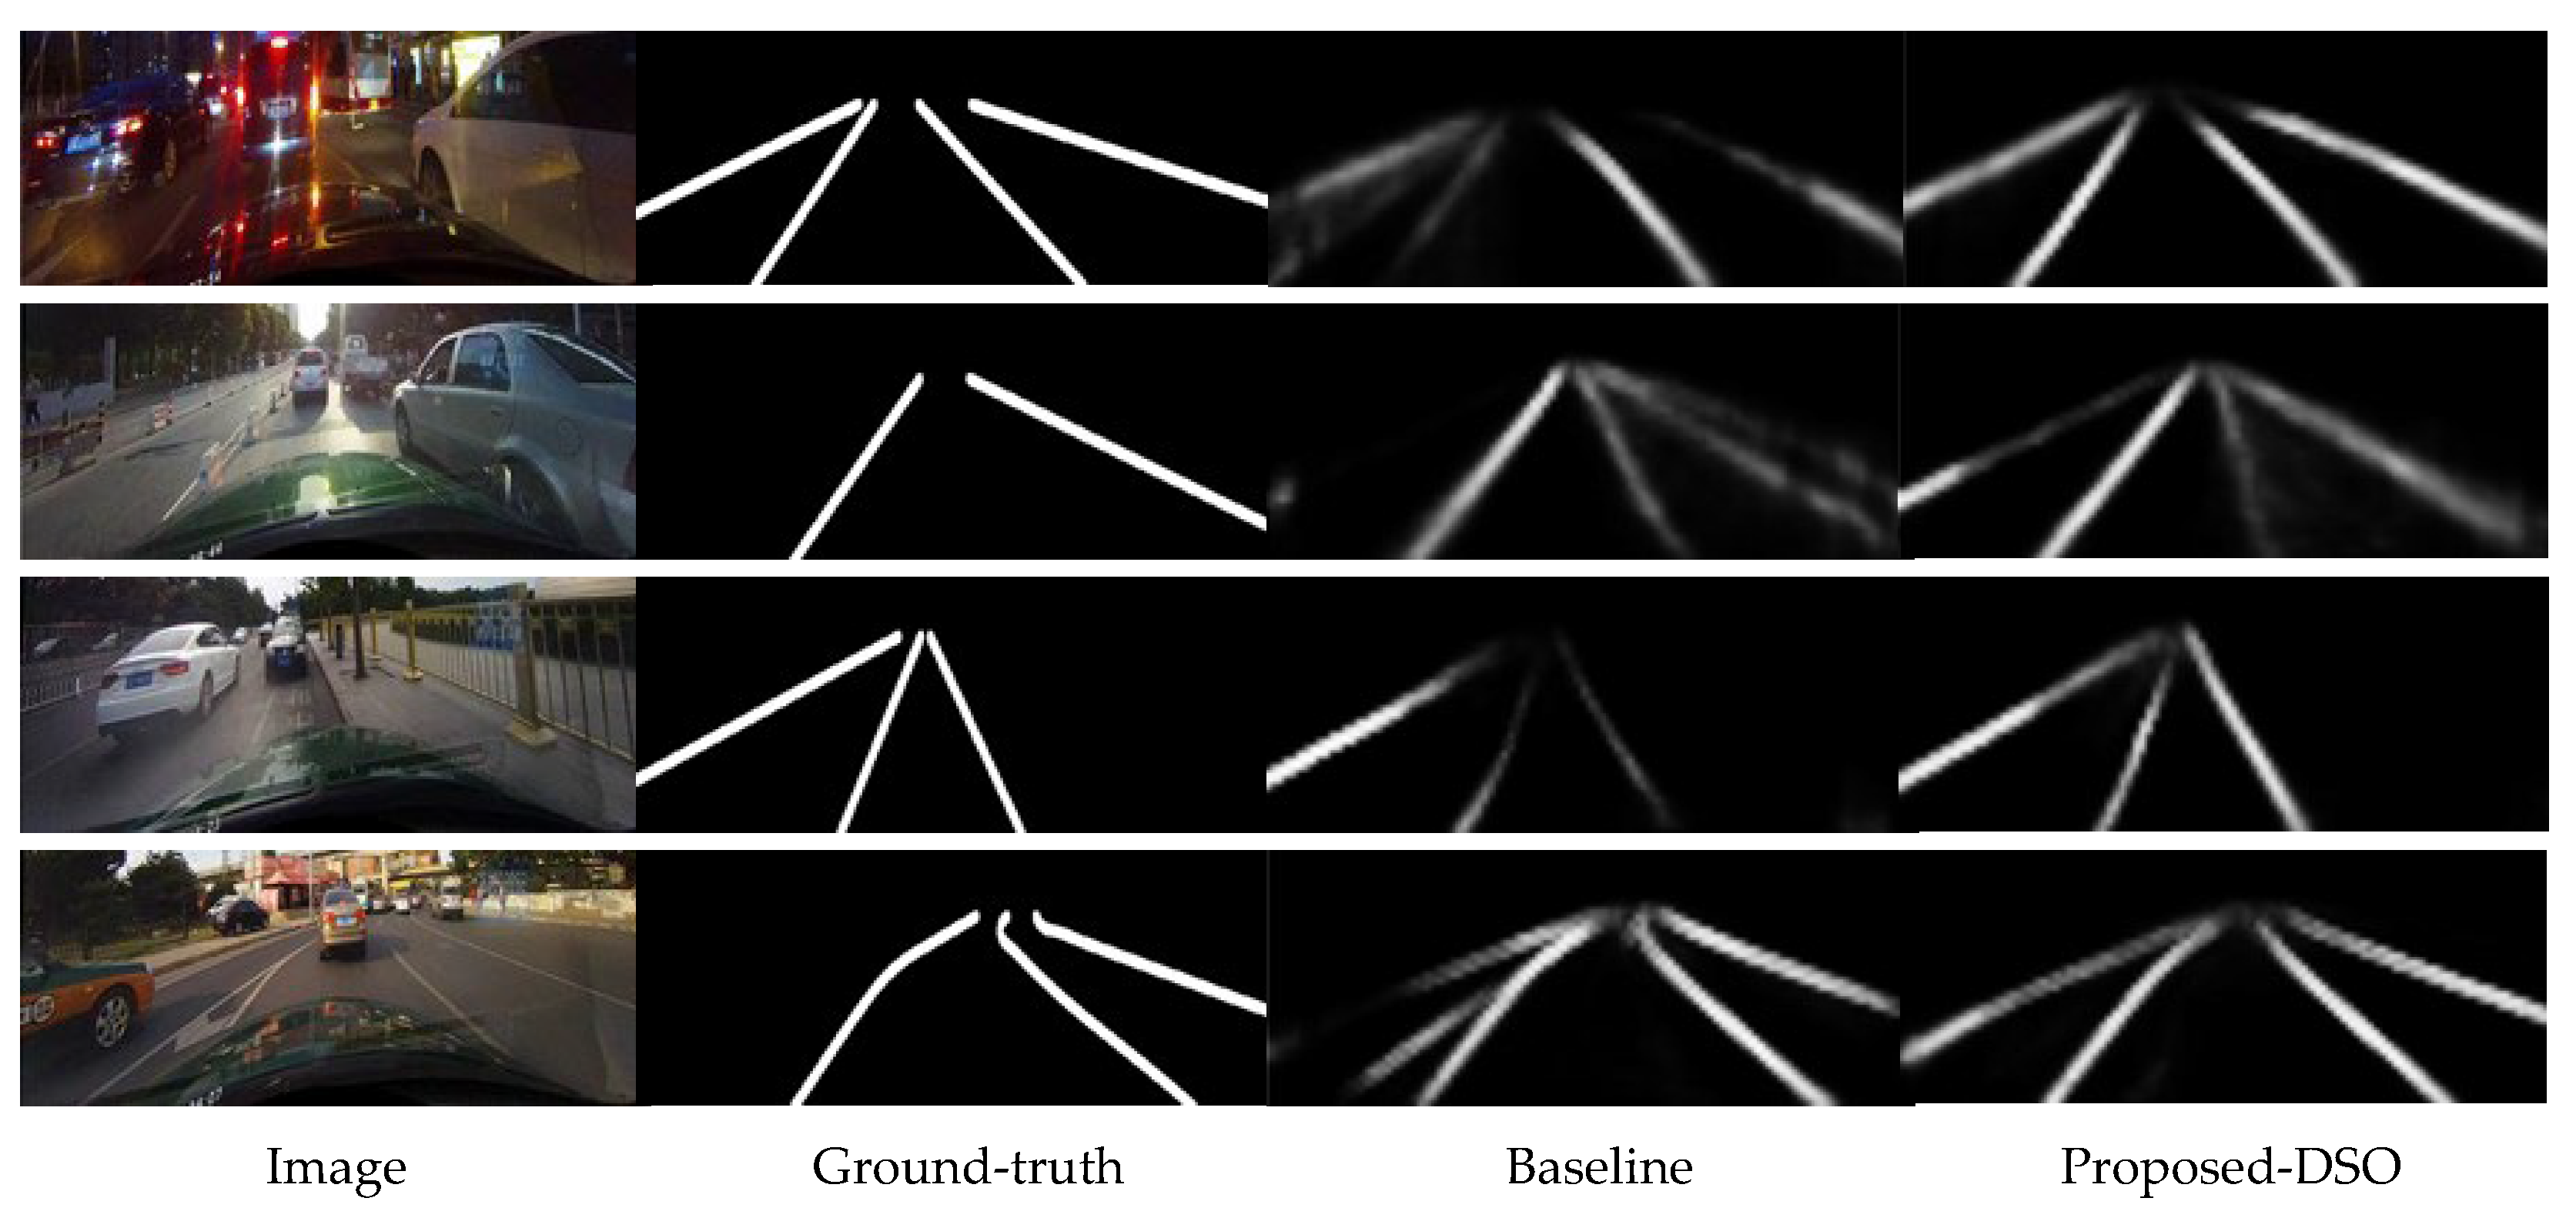
2.3. DDA-IRS-DSO
| Algorithm 3: Dynamic Simulation of Road Vehicles Procedure |
| Input: Input image ;
Image size and ; Area of image ; Simulating road vehicles probability ; Simulating road vehicles area ratio range and ; Simulating road vehicles aspect ratio range and . Output: Simulated image . Initialization: .
|
3. Experimental Results
3.1. Datasets
3.2. Evaluation Metrics
3.3. Experimental Settings
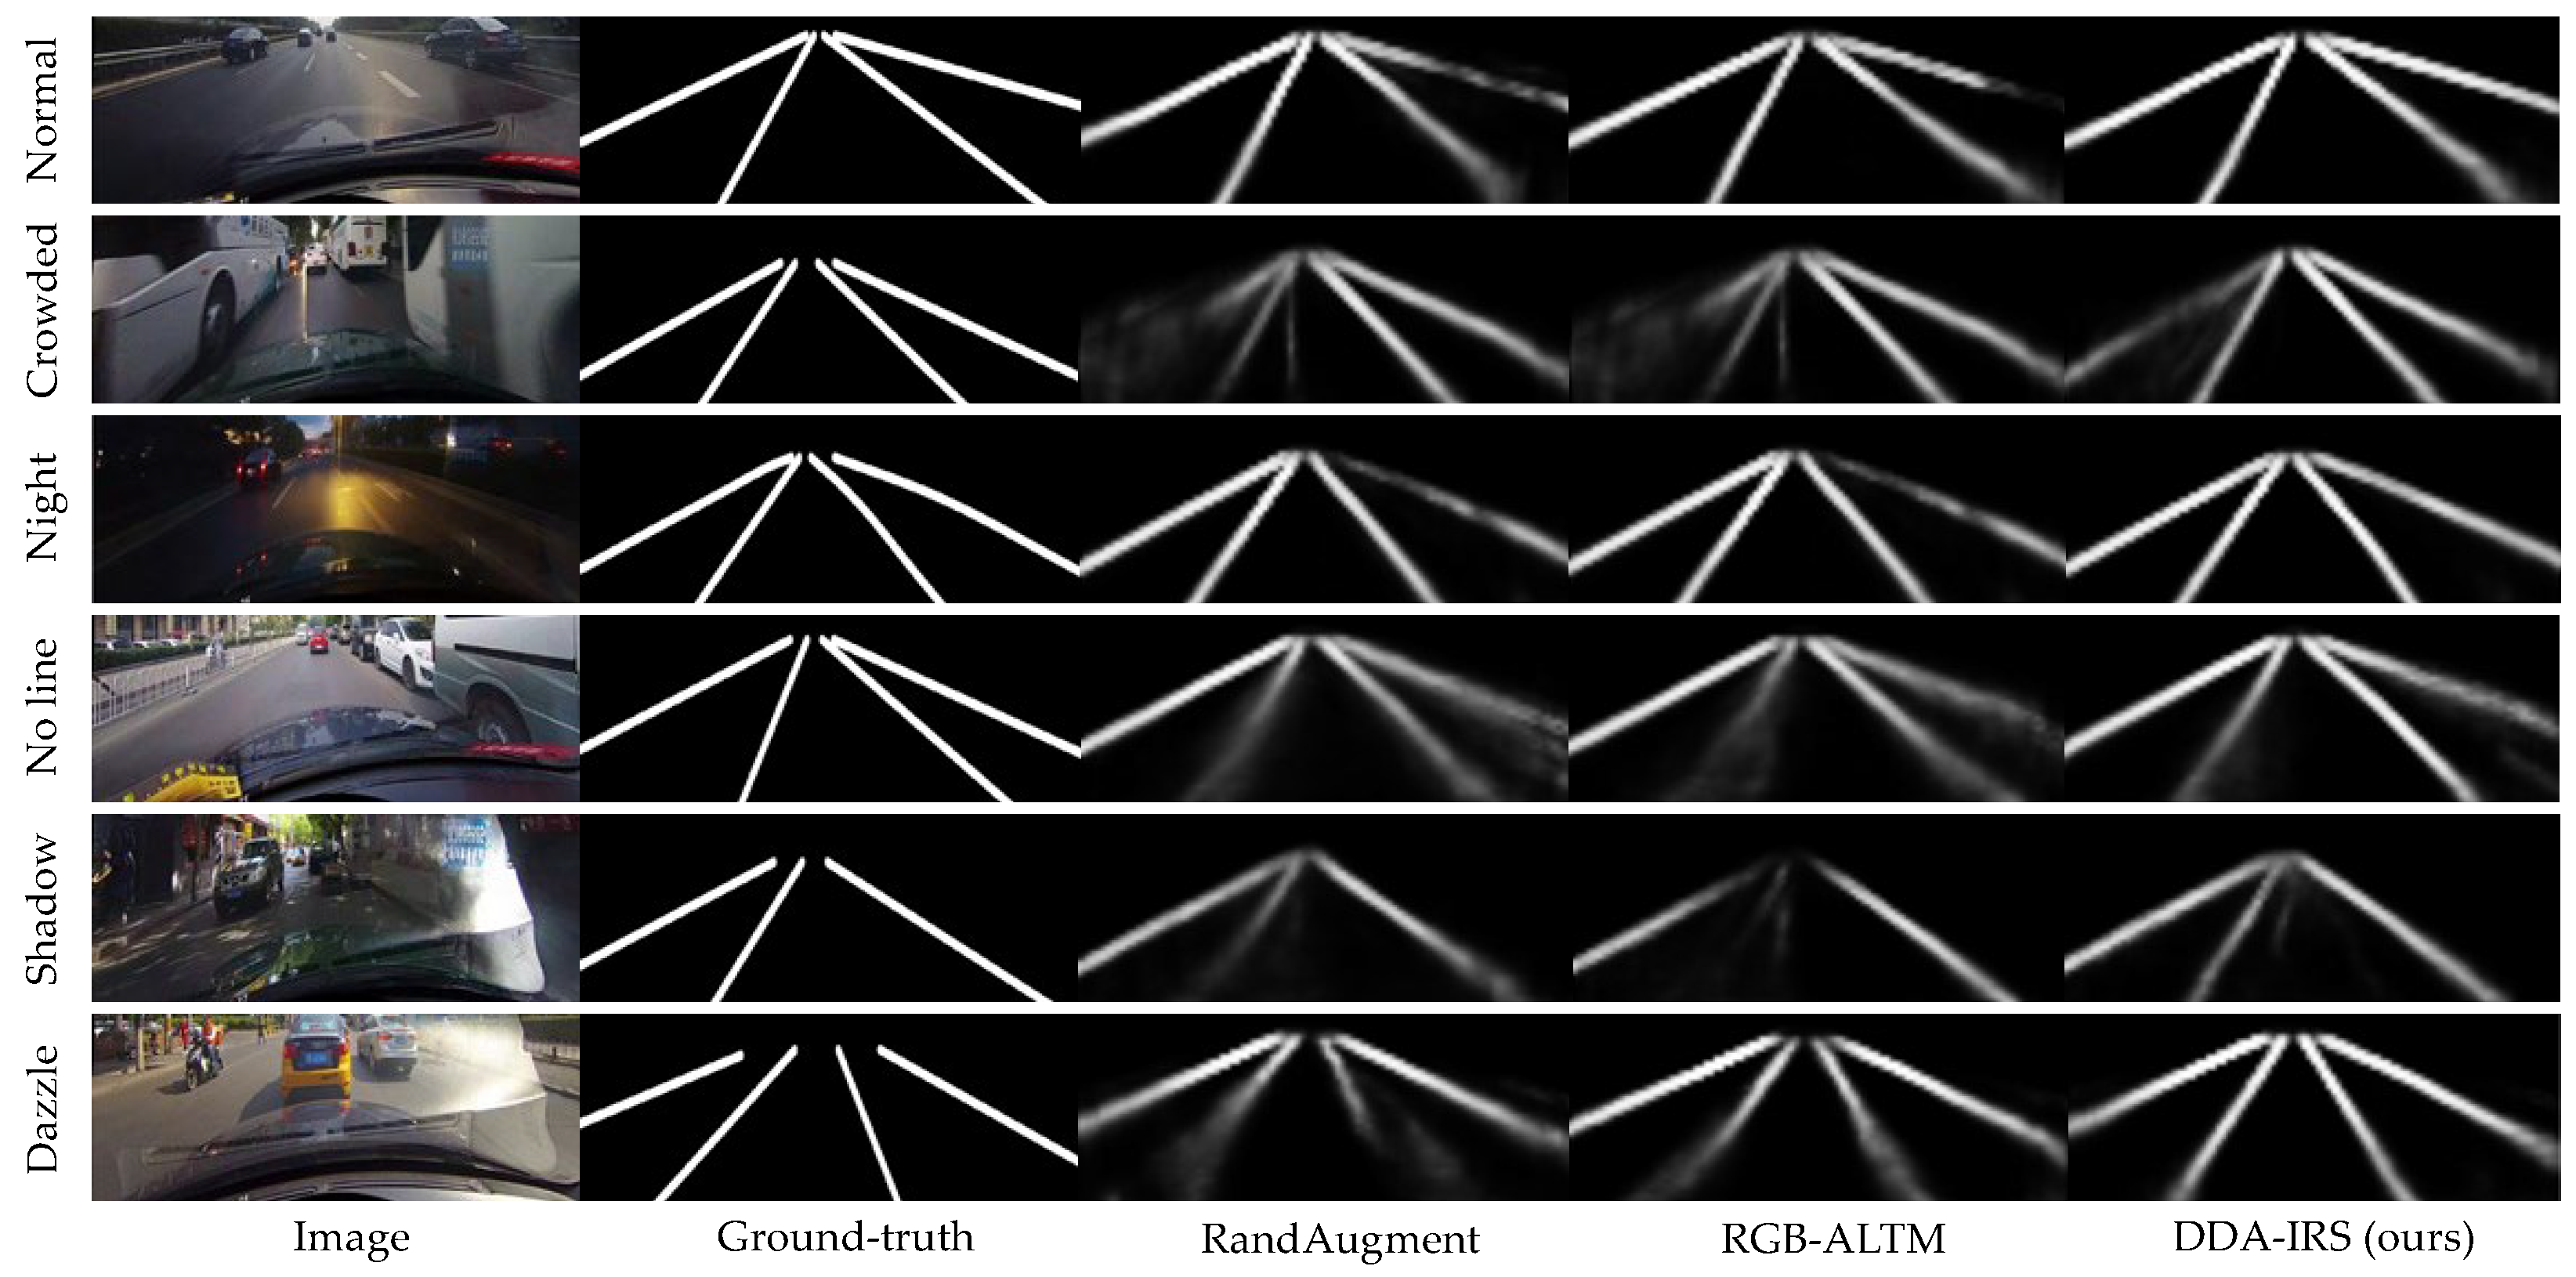
3.4. Comparative Assessment

| Category | Normal | Crowded | Night | No Line | Shadow | Arrow | Dazzle | Curve | Crossroad | Total |
|---|---|---|---|---|---|---|---|---|---|---|
| SCNN [9] | 90.6 | 69.7 | 66.1 | 43.4 | 66.9 | 84.1 | 58.5 | 65.7 | 1990 | 71.6 |
| SAD [10] | 90.7 | 70.0 | 66.3 | 43.5 | 67.0 | 84.4 | 59.9 | 65.7 | 2052 | 71.8 |
| Curve-Nas [54] | 90.7 | 72.3 | 68.9 | 49.4 | 70.1 | 85.8 | 67.7 | 68.4 | 1746 | 74.8 |
| LaneATT ^ [14] | 91.1 | 73.0 | 69.0 | 48.4 | 70.9 | 85.5 | 65.7 | 63.4 | 1170 | 75.1 |
| UFast ^ [15] | 87.7 | 66.0 | 62.1 | 40.2 | 62.8 | 81.0 | 58.4 | 57.9 | 1743 | 68.4 |
| Baseline ^ [21] | 91.1 | 74.7 | 69.5 | 50.9 | 71.8 | 87.3 | 69.8 | 60.8 | 1568 | 76.0 |
| DDA-IRS (ours) ^ | 91.5 | 74.8 | 69.4 | 49.5 | 73.4 | 87.7 | 69.8 | 62.2 | 1350 | 76.5 |
| Category | Normal | Crowded | Night | No Line | Shadow | Arrow | Dazzle | Curve | Crossroad | Total |
|---|---|---|---|---|---|---|---|---|---|---|
| Baseline [21] | 91.1 | 74.7 | 69.5 | 50.9 | 71.8 | 87.3 | 69.8 | 60.8 | 1568 | 76.0 |
| RandAugment [53] | 91.1 | 74.0 | 69.4 | 50.5 | 69.5 | 87.3 | 68.7 | 61.4 | 1404 | 75.8 |
| RGB-ALTM [51] | 91.3 | 74.0 | 70.1 | 50.9 | 71.5 | 87.7 | 68.6 | 59.7 | 1468 | 75.9 |
| DDA-IRS (ours) | 91.5 | 74.8 | 69.4 | 49.5 | 73.4 | 87.7 | 69.8 | 62.2 | 1350 | 76.5 |
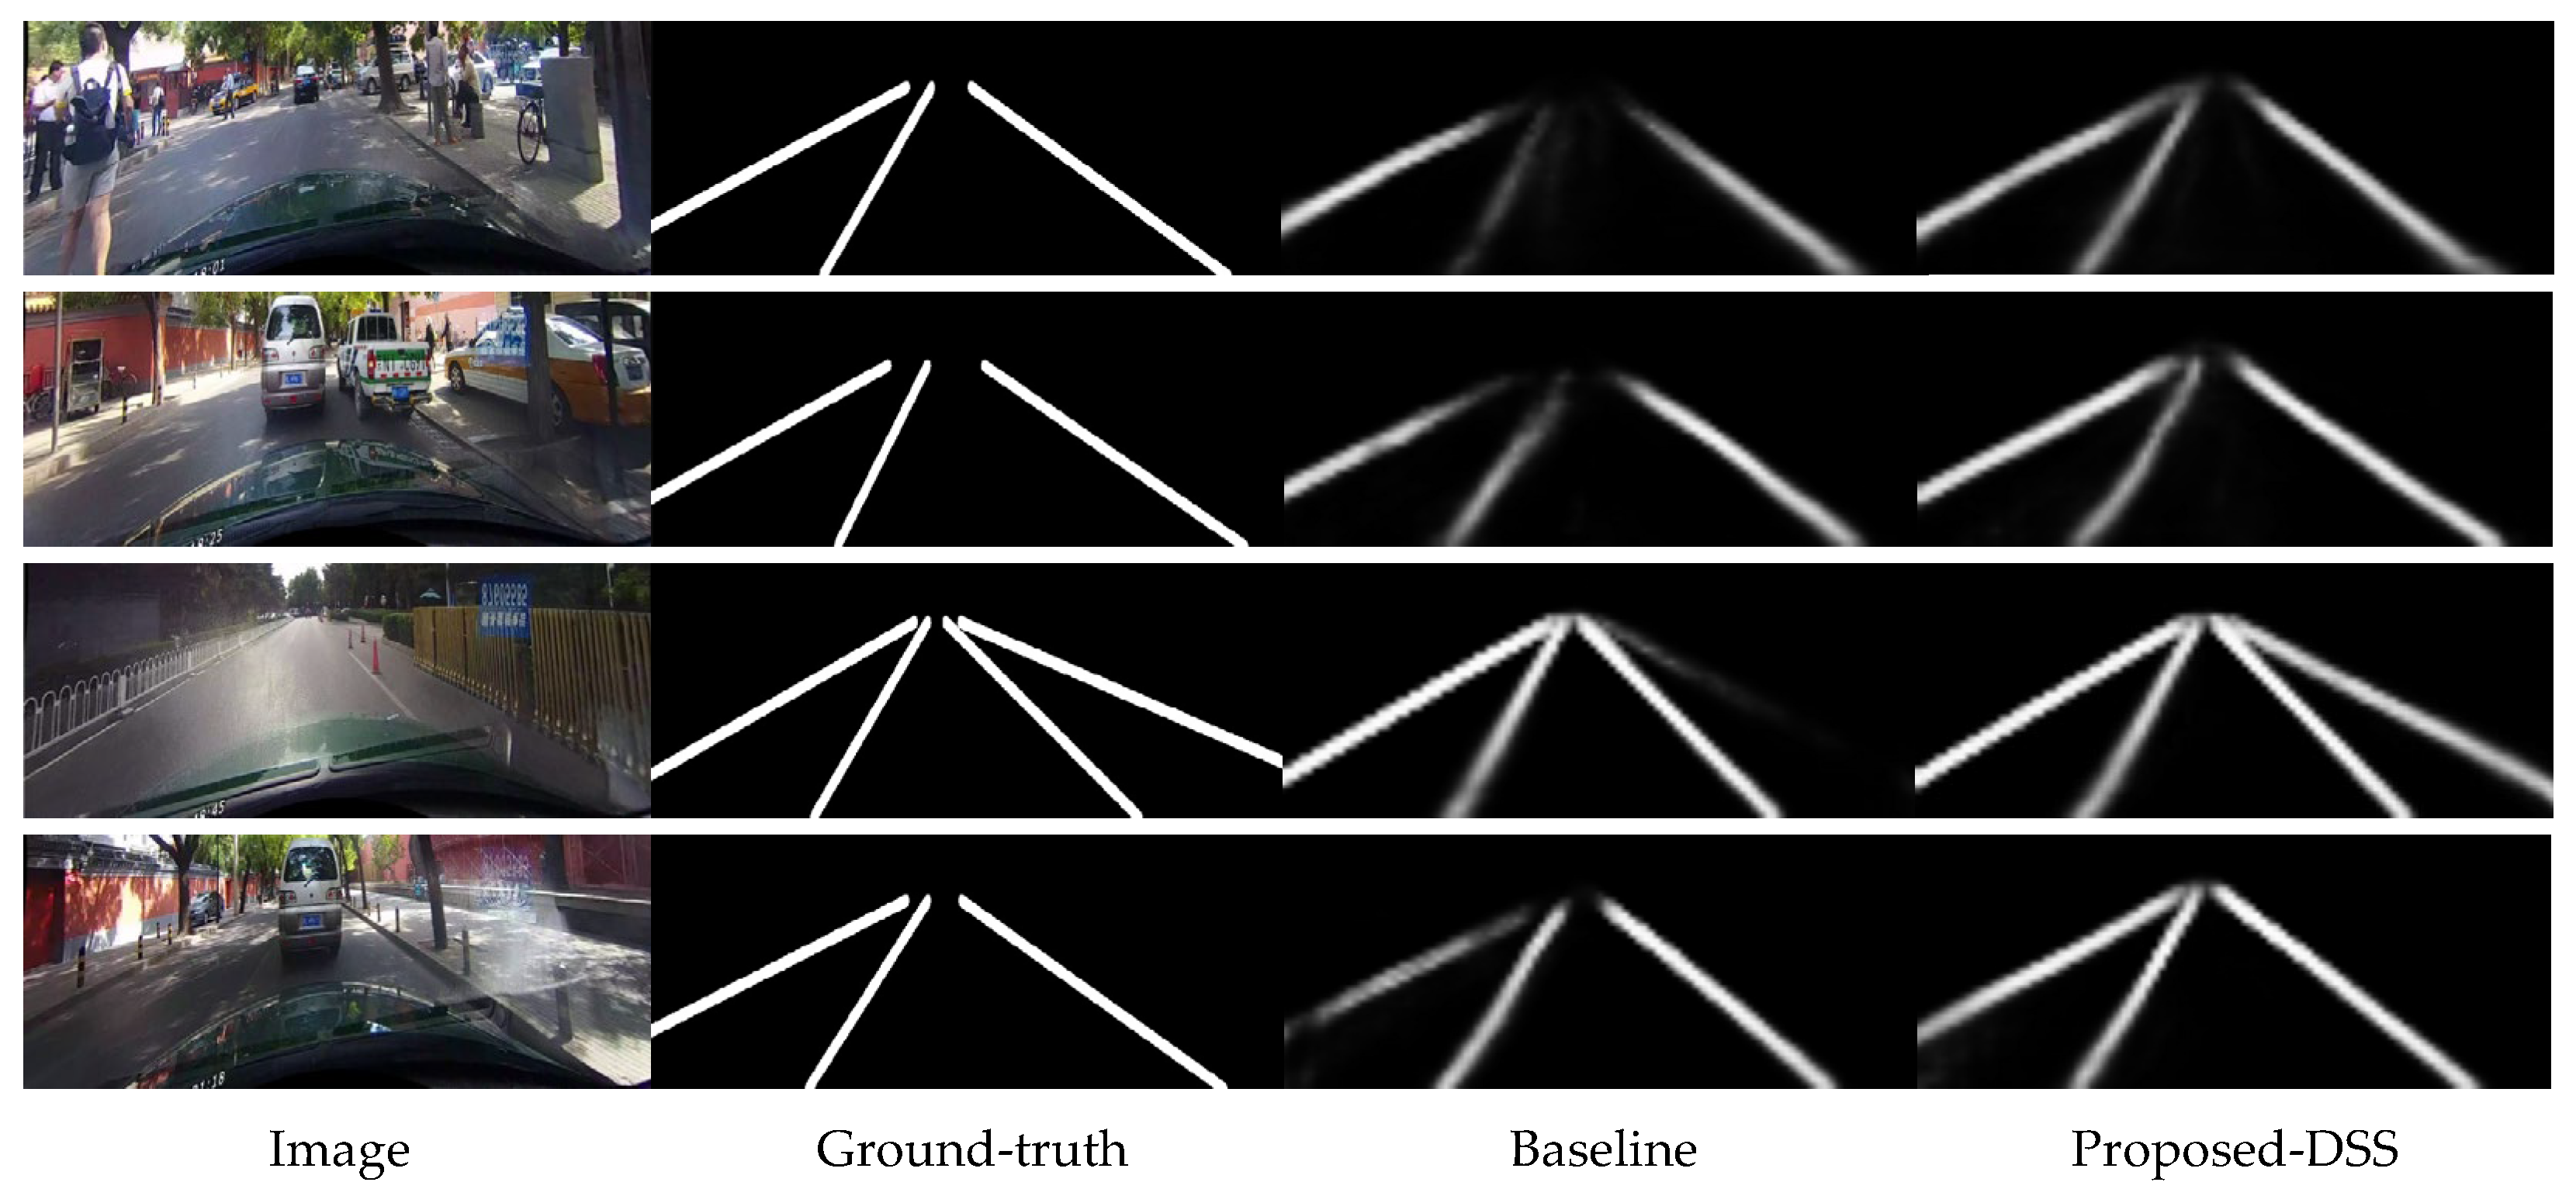
3.5. Ablation Studies
4. Discussion
5. Conclusions
Author Contributions
Funding
Data Availability Statement
Conflicts of Interest
References
- Son, M.; Chang, H.S. Lane line map estimation for visual alignment. In Proceedings of the 2020 IEEE International Conference on Artificial Intelligence and Virtual Reality (AIVR), Utrecht, The Netherlands, 14–18 December 2020; pp. 200–204. [Google Scholar]
- Zhou, H.; Sun, M.; Ren, X.; Wang, X. Visible-Thermal image object detection via the combination of illumination conditions and temperature information. Remote Sens. 2021, 13, 3656. [Google Scholar] [CrossRef]
- Buslaev, A.; Iglovikov, V.I.; Khvedchenya, E.; Parinov, A.; Druzhinin, M.; Kalinin, A.A. Albumentations: Fast and flexible image augmentations. Information 2020, 11, 125. [Google Scholar] [CrossRef] [Green Version]
- Ratner, A.J.; Ehrenberg, H.R.; Hussain, Z.; Dunnmon, J.; Re, C. Learning to Compose Domain-Specific Transformations for Data Augmentation. In Proceedings of the 31st Annual Conference on Neural Information Processing Systems (NIPS), Long Beach, CA, USA, 4–9 December 2017; pp. 3236–3246. [Google Scholar]
- Cubuk, E.D.; Zoph, B.; Mané, D.; Vasudevan, V.; Le, Q.V. AutoAugment: Learning augmentation strategies from data. In Proceedings of the 2019 IEEE/CVF Conference on Computer Vision and Pattern Recognition (CVPR), Long Beach, CA, USA, 15–20 June 2019; pp. 113–123. [Google Scholar]
- Lemley, J.; Bazrafkan, S.; Corcoran, P. Smart augmentation learning an optimal data augmentation strategy. IEEE Access. 2017, 5, 5858–5869. [Google Scholar] [CrossRef]
- Yu, B.; Jain, A.K. Lane boundary detection using a multiresolution hough transform. In Proceedings of the International Conference on Image Processing (ICIP), Santa Barbara, CA, USA, 26–29 October 1997; pp. 748–751. [Google Scholar]
- Sun, T.-Y.; Tsai, S.-J.; Chan, V. HSI color model based lane-marking detection. In Proceedings of the IEEE Intelligent Transportation Systems Conference, Toronto, ON, Canada, 17–20 September 2006; pp. 1168–1172. [Google Scholar]
- Pan, X.G.; Shi, J.P.; Luo, P.; Wang, X.G.; Tang, X.O. Spatial as deep: Spatial CNN for traffic scene understanding. In Proceedings of the 32nd AAAI Conference on Artificial Intelligence/30th Innovative Applications of Artificial Intelligence Conference/8th AAAI Symposium on Educational Advances in Artificial Intelligence, New Orleans, LA, USA, 2–7 February 2018; pp. 7276–7283. [Google Scholar]
- Hou, Y.; Ma, Z.; Liu, C.; Loy, C.-C. Learning lightweight lane detection CNNs by self attention distillation. In Proceedings of the IEEE/CVF International Conference on Computer Vision (ICCV), Seoul, Republic of Korea, 27 October–2 November 2019; pp. 1013–1021. [Google Scholar]
- Hou, Y.; Ma, Z.; Liu, C.; Hui, T.-W.; Loy, C.C. Inter-region affinity distillation for road marking segmentation. In Proceedings of the IEEE/CVF Conference on Computer Vision and Pattern Recognition (CVPR), Seattle, WA, USA, 13–19 June 2020; pp. 12486–12495. [Google Scholar]
- Zheng, T.; Fang, H.; Zhang, Y.; Tang, W.J.; Yang, Z.; Liu, H.F.; Cai, D. RESA: Recurrent feature-shift aggregator for lane detection. In Proceedings of the 35th AAAI Conference on Artificial Intelligence/33rd Conference on Innovative Applications of Artificial Intelligence/11th Symposium on Educational Advances in Artificial Intelligence, ELECTR Network, Virtual, 2–9 February 2021; pp. 3547–3554. [Google Scholar]
- Li, X.; Li, J.; Hu, X.-L.; Yang, J. Line-CNN: End-to-end traffic line detection with line proposal unit. IEEE Trans. Intell. Transp. Syst. 2019, 21, 248–258. [Google Scholar] [CrossRef]
- Tabelini, L.; Berriel, R.; Paixão, T.M.; Badue, C.; De Souza, A.F.; Oliveira-Santos, T. Keep your eyes on the lane: Real-time attention-guided lane detection. In Proceedings of the 2021 IEEE/CVF Conference on Computer Vision and Pattern Recognition (CVPR), Nashville, TN, USA, 20–25 June 2021; pp. 294–302. [Google Scholar]
- Qin, Z.-Q.; Wang, H.Y.; Li, X. Ultra fast structure-aware deep lane detection. In European Conference on Computer Vision; Springer: Cham, Switzerland, 2020; pp. 276–291. [Google Scholar]
- Liu, L.Z.; Chen, X.H.; Zhu, S.Y.; Tan, P. CondLaneNet: A top-to-down lane detection framework based on conditional convolution. In Proceedings of the 18th IEEE/CVF International Conference on Computer Vision (ICCV), ELECTR Network, Montreal, BC, Canada, 11–17 October 2021; pp. 3753–3762. [Google Scholar]
- Wang, B.; Wang, Z.; Zhang, Y. Polynomial regression network for variable-number lane detection. In Proceedings of the European Conference on Computer Vision, Glasgow, UK, 23–28 August 2020; pp. 719–734. [Google Scholar]
- Tabelini, L.; Berriel, R.; Paixao, T.-M.; Badue, C.; De Souza, A.-F.; Oliveira-Santos, T. Polylanenet: Lane estimation via deep polynomial regression. In Proceedings of the 25th International Conference on Pattern Recognition (ICPR), ELECTR Network, Milan, Italy, 10–15 January 2021; pp. 6150–6156. [Google Scholar]
- Liu, R.J.; Yuan, Z.J.; Liu, T.; Xiong, Z.L. End-to-end lane shape prediction with transformer. In Proceedings of the IEEE Winter Conference on Applications of Computer Vision (WACV), ELECTR Network, Virtual, 5–9 January 2021; pp. 3693–3701. [Google Scholar]
- Feng, Z.Y.; Guo, S.H.; Tan, X.; Xu, K.; Wang, M.; Ma, L.Z. Rethinking efficient lane detection via curve modeling. In Proceedings of the 2022 IEEE/CVF Conference on Computer Vision and Pattern Recognition (CVPR), New Orleans, LA, USA, 18–24 June 2022; pp. 17041–17049. [Google Scholar]
- Jin, D.; Park, W.; Jeong, S.-G.; Kwon, H.; Kim, C.-S. Eigenlanes: Data-Driven Lane Descriptors for Structurally Diverse Lanes. In Proceedings of the 2022 IEEE/CVF Conference on Computer Vision and Pattern Recognition (CVPR), New Orleans, LA, USA, 18–24 June 2022; pp. 17142–17150. [Google Scholar]
- Garcia-Garcia, A.; Orts-Escolano, S.; Oprea, S.; Villena-Martinez, V.; Martinez-Gonzalez, P.; Garcia-Rodriguez, J. A survey on deep learning techniques for image and video semantic segmentation. Appl. Soft Comput. 2018, 70, 41–65. [Google Scholar] [CrossRef]
- Hinton, G.E.; Salakhutdinov, R.R. Reducing the dimensionality of data with neural networks. Science 2006, 313, 504–507. [Google Scholar] [CrossRef] [PubMed] [Green Version]
- Yu, X.R.; Wu, X.M.; Luo, C.B.; Ren, P. Deep learning in remote sensing scene classification: A data augmentation enhanced convolutional neural network framework. GIScience Remote Sens. 2017, 54, 741–758. [Google Scholar] [CrossRef] [Green Version]
- Parihar, A.S.; Verma, O.P.; Khanna, C. Fuzzy-Contextual Contrast Enhancement. IEEE Trans. Image Process. 2017, 26, 1810–1819. [Google Scholar] [CrossRef] [PubMed]
- He, K.; Zhang, X.; Ren, S.; Sun, J. Deep residual learning for image recognition. In Proceedings of the 2016 IEEE Conference on Computer Vision and Pattern Recognition (CVPR), Seattle, WA, USA, 27–30 June 2015; pp. 770–778. [Google Scholar]
- Zhong, Z.; Zheng, L.; Kang, G.; Li, S.; Yang, Y. Random erasing data augmentation. In Proceedings of the 34th AAAI Conference on Artificial Intelligence/32nd Innovative Applications of Artificial Intelligence Conference/10th AAAI Symposium on Educational Advances in Artificial Intelligence, New York, NY, USA, 7–12 February 2020; pp. 13001–13008. [Google Scholar]
- DeVries, T.; Taylor, G.-W. An empirical evaluation of deep learning on highway driving. arXiv 2017, arXiv:1708.04552. [Google Scholar]
- Huang, S.P.; Zhong, Z.Y.; Jin, L.W.; Zhang, S.Y.; Wang, H.B. Dropregion training of inception font network for high-performance Chinese font recognition. Pattern Recognit. 2018, 77, 395–411. [Google Scholar] [CrossRef] [Green Version]
- Berthelot, D.; Carlini, N.; Goodfellow, I.; Oliver, A.; Papernot, N.; Raffel, C. MixMatch: A holistic approach to semi-supervised learning. In Proceedings of the Annual Conference on Neural Information Processing Systems, Vancouver, BC, Canada, 8–14 December 2019; pp. 5050–5060. [Google Scholar]
- Wong, S.C.; Gatt, A.; Stamatescu, V.; McDonnell, M.D. Understanding data augmentation for classification: When to warp? In Proceedings of the 2016 International Conference on Digital Image Computing: Techniques and Applications (DICTA), Gold Coast, QLD, Australia, 30 November–2 December 2016; pp. 1–6. [Google Scholar]
- Tokozume, Y.; Ushiku, Y.; Harada, T. Between-class learning for image classification. In Proceedings of the 2018 IEEE/CVF Conference on Computer Vision and Pattern Recognition (CVPR), Salt Lake City, UT, USA, 18–22 June 2018; pp. 5486–5494. [Google Scholar]
- Arazo, E.; Ortego, D.; Albert, P.; O’Connor, N.E.; McGuinness, K. Unsupervised label noise modeling and loss correction. In Proceedings of the 36th International Conference on Machine Learning (ICML), Long Beach, CA, USA, 9–15 June 2019. [Google Scholar]
- Zhang, H.Y.; Cisse, M.; Dauphin, Y.N.; Lopez-Paz, D. mixup: Beyond empirical risk minimization. In Proceedings of the 6th International Conference on Learning Representations, Vancouver, BC, Canada, 30 April–3 May 2018; pp. 1–13. [Google Scholar]
- Guo, H.Y.; Mao, Y.Y.; Zhang, R.C. Mixup as locally linear out-of-manifold regularization. In Proceedings of the 33rd AAAI Conference on Artificial Intelligence/31st Innovative Applications of Artificial Intelligence Conference/9th AAAI Symposium on Educational Advances in Artificial Intelligence, Honolulu, HI, USA, 27 January–1 February 2019; pp. 3714–3722. [Google Scholar]
- Summers, C.; Dinneen, M.J. Improved mixed-example data augmentation. In Proceedings of the 2019 IEEE Winter Conference on Applications of Computer Vision (WACV), Waikoloa Village, HI, USA, 7–11 January 2019; pp. 1262–1270. [Google Scholar]
- Oki, H.; Kurita, T. Mixup of feature maps in a hidden layer for training of convolutional neural network. In Proceedings of the 25th International Conference on Neural Information Processing (ICONIP), Siem Reap, Cambodia, 13–16 December 2018; pp. 635–644. [Google Scholar]
- Verma, V.; Lamb, A.; Beckham, C.; Najafi, A.; Mitliagkas, I.; Lopez-Paz, D.; Bengio, Y. Manifold mixup: Better representations by interpolating hidden states. In Proceedings of the 36th International Conference on Machine Learning (ICML), Long Beach, CA, USA, 9–15 June 2019. [Google Scholar]
- Takahashi, R.; Matsubara, T.; Uehara, K. Data augmentation using random image cropping and patching for deep CNNs. IEEE Trans. Circuits Syst. Video Technol. 2019, 30, 2917–2931. [Google Scholar] [CrossRef] [Green Version]
- Yun, S.; Han, D.; Joon Oh, S.; Chun, S.; Choe, J.; Yoo, Y. CutMix: Regularization strategy to train strong classifiers with localizable features. In Proceedings of the 2019 IEEE/CVF International Conference on Computer Vision (ICCV), Seoul, Republic of Korea, 27 October–2 November 2019; pp. 6022–6031. [Google Scholar]
- Dwibedi, D.; Misra, I.; Hebert, M. Cut, Paste and Learn: Surprisingly easy synthesis for instance detection. In Proceedings of the 2017 IEEE International Conference on Computer Vision (ICCV), Venice, Italy, 22–29 October 2017; pp. 1301–1310. [Google Scholar]
- Devries, T.; Taylor, G.W. Dataset augmentation in feature space. In Proceedings of the 5th International Conference on Learning Representations, Toulon, France, 24–26 April 2017. [Google Scholar]
- Liu, X.F.; Zou, Y.; Kong, L.S.; Diao, Z.H.; Yan, J.L.; Wang, J.; Li, S.T.; Jia, P.; You, J.N. Data augmentation via latent space interpolation for image classification. In Proceedings of the 24th International Conference on Pattern Recognition (ICPR), Beijing, China, 20–24 August 2018; pp. 728–733. [Google Scholar]
- Han, D.; Liu, Q.; Fan, W. A new image classification method using CNN transfer learning and web data augmentation. Expert Syst. Appl. 2018, 95, 43–56. [Google Scholar] [CrossRef]
- Liang, X.D.; Hu, Z.T.; Zhang, H.; Gan, C.; Xing, E.P. Recurrent topic-transition GAN for visual paragraph generation. In Proceedings of the 2017 IEEE International Conference on Computer Vision (ICCV), Venice, Italy, 22–29 October 2017; pp. 3382–3391. [Google Scholar]
- Goodfellow, I.J.; Pouget-Abadie, J.; Mirza, M.; Xu, B.; Warde-Farley, D.; Ozair, S.; Courville, A.; Bengio, Y. Generative adversarial nets. In Proceedings of the 27th International Conference on Neural Information Processing Systems, Montreal, QC, Canada, 8–13 December 2014; pp. 2672–2680. [Google Scholar]
- Odena, A.; Olah, C.; Shlens, J. Conditional image synthesis with auxiliary classifier GANs. In Proceedings of the 34th International Conference on Machine Learning, Sydney, Australia, 6–11 August 2017; pp. 2642–2651. [Google Scholar]
- Huang, L.; Lin, K.C.-J.; Tseng, Y.C. Resolving Intra-Class Imbalance for GAN-Based Image Augmentation. In Proceedings of the 2019 IEEE International Conference on Multimedia and Expo (ICME), Shanghai, China, 8–12 July 2019; pp. 970–975. [Google Scholar]
- Singh, A.; Dutta, D.; Saha, A. MIGAN: Malware image synthesis using GANs. In Proceedings of the 33rd AAAI Conference on Artificial Intelligence/31st Innovative Applications of Artificial Intelligence Conference/9th AAAI Symposium on Educational Advances in Artificial Intelligence, Honolulu, HI, USA, 27 January–1 February 2019; pp. 10033–10034. [Google Scholar]
- Tran, T.; Pham, T.; Carneiro, G.; Palmer, L.; Reid, I. A Bayesian data augmentation approach for learning deep models. In Proceedings of the 31st International Conference on Neural Information Processing Systems (NIPS), Long Beach, CA, USA, 4–9 December 2017; pp. 2797–2806. [Google Scholar]
- Gu, D.-Y.; Wang, N.; Li, W.-C.; Chen, L. Method of lane line detection in low illumination environment based on model fusion. J. Northeast. Univ. Nat. Sci. 2021, 42, 305–309. [Google Scholar]
- Zheng, H.; Cheng, S.; Wang, W.; Zhang, M. A lane line detection method based on residual structure. J. Zhejiang Univ. Technol. 2022, 50, 365–371. [Google Scholar]
- Liu, Q.; Wu, C.; Qiao, D. Application of data augmentation in lane line detection. In Proceedings of the 2020 5th International Conference on Computing, Communication and Security (ICCCS), Patna, India, 14–16 October 2020; pp. 1–5. [Google Scholar]
- Xu, H.; Wang, S.; Cai, X.; Zhang, W.; Liang, X.; Li, Z. CurveLane-NAS: Unifying lane-sensitive architecture search and adaptive point blending. In Proceedings of the European Conference on Computer Vision (ECCV), Glasgow, UK, 23–28 August 2020; pp. 689–704. [Google Scholar]


| Category | Normal | Crowded | Night | No Line | Shadow | Arrow | Dazzle | Curve | Crossroad | Total |
|---|---|---|---|---|---|---|---|---|---|---|
| Baseline [21] | 91.1 | 74.7 | 69.5 | 50.9 | 71.8 | 87.3 | 69.8 | 60.8 | 1568 | 76.0 |
| Proposed-DSS | 91.6 | 74.3 | 70.5 | 50.3 | 71.9 | 87.3 | 69.4 | 62.1 | 1291 | 76.3 |
| Proposed-DSH | 91.3 | 74.4 | 71.0 | 50.4 | 70.1 | 87.3 | 70.0 | 63.7 | 1526 | 76.2 |
| Proposed-DSO | 91.3 | 73.8 | 70.0 | 50.6 | 72.4 | 87.0 | 69.6 | 60.2 | 1263 | 76.1 |
Disclaimer/Publisher’s Note: The statements, opinions and data contained in all publications are solely those of the individual author(s) and contributor(s) and not of MDPI and/or the editor(s). MDPI and/or the editor(s) disclaim responsibility for any injury to people or property resulting from any ideas, methods, instructions or products referred to in the content. |
© 2023 by the authors. Licensee MDPI, Basel, Switzerland. This article is an open access article distributed under the terms and conditions of the Creative Commons Attribution (CC BY) license (https://creativecommons.org/licenses/by/4.0/).
Share and Cite
Wang, Q.; Wang, L.; Chi, Y.; Shen, T.; Song, J.; Gao, J.; Shen, S. Dynamic Data Augmentation Based on Imitating Real Scene for Lane Line Detection. Remote Sens. 2023, 15, 1212. https://doi.org/10.3390/rs15051212
Wang Q, Wang L, Chi Y, Shen T, Song J, Gao J, Shen S. Dynamic Data Augmentation Based on Imitating Real Scene for Lane Line Detection. Remote Sensing. 2023; 15(5):1212. https://doi.org/10.3390/rs15051212
Chicago/Turabian StyleWang, Qingwang, Lu Wang, Yongke Chi, Tao Shen, Jian Song, Ju Gao, and Shiquan Shen. 2023. "Dynamic Data Augmentation Based on Imitating Real Scene for Lane Line Detection" Remote Sensing 15, no. 5: 1212. https://doi.org/10.3390/rs15051212