Article

An Underwater Side-Scan Sonar Transfer Recognition Method Based on Crossed Point-to-Point Second-Order Self-Attention Mechanism

1
National Key Laboratory of Underwater Acoustic Technology, Harbin Engineering University, Harbin 150001, China
2
Key Laboratory of Marine Information Acquisition and Security (Harbin Engineering University), Ministry of Industry and Information Technology, Harbin 150001, China
3
College of Underwater Acoustic Engineering, Harbin Engineering University, Harbin 150001, China
4
South China Sea Marine Survey Center, Ministry of Natural Resources, Guangzhou 510300, China
5
Key Laboratory of Marine Environmental Survey Technology and Application, Ministry of Natural Resources, Guangzhou 510300, China
6
Institute for Advanced Study, University of Electronic Science and Technology of China, UESTC, Shenzhen 518000, China
*
Author to whom correspondence should be addressed.
Remote Sens. 2023, 15(18), 4517; https://doi.org/10.3390/rs15184517
Submission received: 14 July 2023 / Revised: 10 September 2023 / Accepted: 10 September 2023 / Published: 14 September 2023

Abstract

:
Recognizing targets through side-scan sonar (SSS) data by deep learning-based techniques has been particularly challenging. The primary challenge stems from the difficulty and time consumption associated with underwater acoustic data acquisition, which demands systematic explorations to obtain sufficient training samples for accurate deep learning-based models. Moreover, if the sample size of the available data is small, the design of effective target recognition models becomes complex. These challenges have posed significant obstacles to developing accurate SSS-based target recognition methods via deep learning models. However, utilizing multi-modal datasets to enhance the recognition performance of sonar images through knowledge transfer in deep networks appears promising. Owing to the unique statistical properties of various modal images, transitioning between different modalities can significantly increase the complexity of network training. This issue remains unresolved, directly impacting the target transfer recognition performance. To enhance the precision of categorizing underwater sonar images when faced with a limited number of mode types and data samples, this study introduces a crossed point-to-point second-order self-attention (PPCSSA) method based on double-mode sample transfer recognition. In the PPCSSA method, first-order importance features are derived by extracting key horizontal and longitudinal point-to-point features. Based on these features, the self-supervised attention strategy effectively removes redundant features, securing the second-order significant features of SSS images. This strategy introduces a potent low-mode-type small-sample learning method for transfer learning. Classification experiment results indicate that the proposed method excels in extracting key features with minimal training complexity. Moreover, experimental outcomes underscore that the proposed technique enhances recognition stability and accuracy, achieving a remarkable overall accuracy rate of 99.28%. Finally, the proposed method maintains high recognition accuracy even in noisy environments.

1. Introduction

With the increasing scarcity of land resources and rapid development of the global economy, science, and technology, global attention has turned toward the ocean as a valuable source of different resources, including energy and minerals. This has attracted extensive global research efforts in marine science. Moreover, the ongoing enhancement of military power has motivated countries to explore more deeply into marine research and resource development. The application of imaging sonars in the marine industry has witnessed significant progress due to recent technological advancements. Its applications span a wide range of areas, including scientific research, resource exploration, monitoring of the marine environment [1], underwater archaeology [2], submarine pipeline detection, and other fields [3], underscoring its pivotal role in societal development. As a crucial sensor in remote sensing, side-scan sonar (SSS) provides rich visual information and data related to topography, landforms, and underwater targets in the observed area. This information is vital for military operations and marine resource exploration. Consequently, accurate identification of underwater targets has become a focal point of research in recent years.
Numerous studies have addressed automatic target recognition (ATR) in sonar images [4]. Sonar images can be affected by various types of noise, including Gaussian noise, which causes random variation in pixel intensity; impulse noise, leading to sudden spikes or drops in pixel intensity; and speckle noise, which results in a grainy appearance due to interference patterns. These noises can arise from the complex underwater environment and strong sound wave reverberations from the seabed [5,6]. However, noise can obscure target details, reduce image contrast, and blur outlines, making SSS target recognition a challenge. This distinction sets sonar images apart from optical images [7,8]. Consequently, identification of targets in sonar images obtained in challenging environments remains a longstanding task.
Recently, deep learning (DL) applications for detection and recognition of targets in remote sensing have been extensively researched. Given its high accuracy, robustness, and multi-task performance, DL has become the primary method for ATR in SSS images [9,10,11]. Compared to traditional techniques such as k-nearest neighbor [12], support vector machine [13], and Markov random field [14], convolutional neural networks (CNNs) can extract deeper features from SSS images during training, enhancing SSS target recognition [15,16,17,18,19,20]. To extract more advanced target features, Simonyan and Zisserman, Krizhevsky et al., and He Kaiming introduced algorithms utilizing CNNs, such as VGG [21], AlexNet [22], ResNet [23], and DenseNet [24], respectively. The main advantage of employing CNNs in these algorithms is their enhanced ability to discern intricate target details, resulting in more accurate classifications and predictions. Subsequently, the number of network layers in ResNet and DenseNet was expanded to 152 and 161, producing the ResNet-152 and DenseNet-161 models, respectively [25,26]. The network parameters were reduced to further optimize the process of extraction of detailed and global context information from images.
Yu and Koltun [27], Chen et al. [28], Zhao Hengshuang [29], and Dai Jifeng [30] introduced dilated convolution technology and related techniques based on CNNs for image segmentation. Adjustment of the field of view of each layer without altering the number of network layers can significantly enhance object detection performance. Recent research has highlighted the superiority of deep CNN models in image detection and recognition tasks. However, data acquisition challenges and limited training samples hinder the application of DL models to SSS image target recognition.
This study employs a transfer learning (TL) approach to test SSS images to address this issue. By first pre-training the backbone network on a large-scale dataset (e.g., the ImageNet dataset [31]) and then fine-tuning the header network on a specific dataset (e.g., the SSS dataset [32]), the TL method leverages feature representations from large datasets. This strategy improves target recognition performance on the SSS dataset.
The primary findings and contributions of this article include:
  • In order to address the challenge of a limited target dataset, which results in poor generalization performance of the CNN model, a TL-based strategy is employed. In this strategy, the backbone network is trained on the ImageNet dataset, while the head network is trained on the SSS dataset.
  • In the traditional self-supervised  Q K V  model, each line of the image is represented as a feature vector, from which the attention factor is derived through  Q K T  and then connected with V. This method captures the key features of each line of the image but fails to discern the key features of each column. The image scale is  d × d , and the computational complexity of the traditional model is  O ( 2 d 3 ) . This study introduces an attentional approach that does not use the standard self-supervised  Q K V  model. This research proposes a point-by-point self-supervised attention (PPSA) model, including three variable interactions: query, key, and value represented by Q, K, and V, respectively. The key and value are derived by linear connection layer parameters and bias parameters based on the original image data. Therefore, the query and the Q and K calculation results are combined through element-by-element multiplication. This attention method preserves the attentional correlation between points at any given spatial location, and its calculation complexity is  O ( 2 d 2 ) .
  • This study proposes a multi-channel horizontal and vertical cross-attention model built on the PPSA model. Based on the difference between the horizontal and the vertical directions of the SSS image, the attention features of the two directions are extracted separately, thereby capturing the key features from every image direction. Based on particular image characteristics as two-dimensional (2D) data, for each channel, the PPSA model is applied in the horizontal and vertical directions of an image to obtain a point-by-point self-supervised horizontal attention (PPSHA) model and a point-by-point self-supervised vertical attention (PPSVA) model, respectively. The second-order attention features of an image are acquired through the point-to-point multiplication  Q K V  model. Compared to the PPSA model, the second-order attention feature can better extract the key features of SSS images. The technique to capture these key features enhances significant features and suppresses redundant ones. This not only refines the key features within the images but also indirectly improves target recognition ability.
The remainder of this paper is organized as follows. Section 2 provides an overview of the related study. Section 3 presents a method based on a point-to-point self-supervised attention model from a theoretical standpoint. A derivative model, employing PPSHA in the horizontal direction and PPSVA in the vertical direction, is proposed for SSS image target recognition. Furthermore, from a feature description perspective, the second-order attention feature description of an image is derived by using the  Q K V  attention strategy. Section 4 presents the comparative analysis of the proposed point-to-point crossover second-order self-supervised attention (PPCSSA) method with traditional DL-based algorithms. The recognition performance of the proposed method is also quantitatively evaluated and compared with TL recognition methods that utilize various backbone networks. This analysis offers a comprehensive evaluation of the efficacy of the PPCSSA method. Ablation experiments and anti-noise experiments are also conducted. Finally, the proposed methods are discussed, and the primary findings of this study are summarized.

2. Related Work

Ye et al. [15] studied underwater target recognition from SSS images by utilizing VGG-11 and ResNet-18 models. They discovered that fine-tuning a fully-connected layer using the TL approach could effectively enhance the recognition rate when data samples were limited. This finding underscores the potential significance of TL in transferring recognition of SSS targets. Chandrashekar et al. [33] employed the sample TL (STL) strategy, originally developed for optical images, to accurately classify underwater sediments in SSS images. Yu et al. [34,35] harnessed TL to devise a target detection method, incorporating two loss functions, namely, position and target recognition errors in the head network. This method calibrated the target position while concurrently recognizing the target. Yulin et al. assessed the strengths of the YOLO algorithm and DarkNet-53 network structure, proposing a detection method for shipwreck targets based on the TL model [36]. Notably, this method outperforms the YOLO and R-CNN algorithms; therefore, its calibration accuracy during target location calibration is influenced by the size of the prior feature anchor box, limiting its efficacy in detecting multi-size targets. Fuchs et al. [37] and Zhang et al. [38] applied TL techniques to forward-looking sonar (FLS), illustrating that TL could effectively address the challenges posed by limited sample data in the DL approach. Ge et al. [39] embarked on a study to bolster the generalization capability of the VGG-19 model. They employed semi-synthetic data and various modal data types to fine-tune the model parameters. Consequently, they enhanced the model performance in image classification and recognition tasks. The use of semi-synthetic data facilitated the generation of more varied and intricate datasets, thus aiding in refining the capacity of the model to generalize unfamiliar data. Furthermore, integration of different modalities endowed the model with a broader grasp of the input data, thus enhancing its accuracy and robustness. However, when using semi-synthetic data, it is essential to undergo an optical image segmentation process, which entails embedding an object into an SSS image. It is crucial to recognize that, while the background of a composite image might embody the traits of an SSS image, the target usually does not. Moreover, disparities between composite and SSS image samples directly influence the target recognition outcome. Cheng et al. [40] enhanced the noise resistance and recognition precision of the VGG-19 network by training its middle layer with synthetic aperture radar (SAR) data. Wang et al. [41] employed ResNet-152 as the foundational network for target transfer recognition and introduced the location attention mechanism considering channel factors and the channel attention mechanism considering location factors. The two key feature extraction methods effectively improved the target migration recognition accuracy rate, achieving 97.18% and 97.69%, respectively.
Although using TL can help generic DL-based object recognition models achieve accuracies of 92.51% [15] and 97.76% [16] on small-scale SSS datasets, few studies have addressed the following challenges:
Challenge 1: A sample transfer identification method employs multiple modal data sources to train a transfer identification network in stages, which enhances the recognition performance of small sample SSS targets. However, a vast amount of modal data is essential to bolster the generalization capability of the network, thus escalating training costs. Therefore, reducing the training burden emerges as a pressing issue.
Challenge 2: The TL process in various deep network layers utilizes different modal data. Specifically, the network backbone is trained using a large volume of sample data, while only a limited set of sample data is employed for the network head. Owing to these modal data discrepancies, the parameter learning of the network head is influenced by the backbone performance, which is trained with extensive sample data. Moreover, utilization of a target domain transfer recognition method incorporating a primary header network does not adequately perform feature extraction in the target domain, directly impacting the final recognition outcome.
In order to address the first challenge, this research employs only the parameters of a backbone network trained on an optical dataset as the structural parameters for the proposed network, excluding other modal data from training the additional network layers. This method alleviates the computational demands of the network training process involving multiple modal datasets. The study introduces a header network structure embedded with a self-attention model to address the second challenge. This structure facilitates deeper re-extraction of features initially obtained by the pre-trained backbone network. The designed header network is equipped to extract the features of SSS images, and the most significant features embodying SSS characteristics are obtained by using the self-attention strategy, which enhances the network proficiency in recognizing SSS targets.
Advantages and disadvantages of this method and the traditional TL method:
The proposed method uses the same sample transfer strategy as the traditional TL method to train network parameters and divides the network into a backbone network and a head network. The backbone can be trained with large amounts of light data. The model can have a universal feature extraction ability for images, and sonar image data can be used for head network training. The feature extraction capability of the model for specific sonar images is improved. In the training process, sonar images are used only to train the head network, which has fewer parameters. This solves the problem that the network parameters to be trained are too numerous and the training samples are too few. However, in the process of transfer training, due to the obvious distribution difference between optical and sonar images, the traditional TL method uses the backbone network trained by optical data to directly extract sonar image features, and the extracted features consist of important features and minor features. Owing to the redundancy between the important features and minor features, the problem of negative transfer in the process of network transfer identification is encountered, and the effect of target identification is not good. In this study, a two-order point-to-point cross-importance feature extraction model is added between the backbone network and the head network. This model can enhance the global key features, suppress the redundant features, reduce the distribution difference between multi-source data in sample transfer recognition, and improve the target recognition effect. The comparative analysis is presented in Table 1.

3. Materials and Methods

3.1. Optical and SSS Image Data Fusion Target Transfer Recognition Network

This study introduces an optical and SSS image fusion transfer recognition method based on a PPCSSA model. This method includes optical and SSS image sample fusion transfer recognition and a PPCSSA model. Figure 1 illustrates the general framework of the suggested model. A network model trained on the ImageNet dataset establishes the backbone network, while the head network attention and fully-connected layers are trained using the SSS data. During the training of the attention layer, each channel feature of the output feature of the backbone network is derived from the horizontal and vertical attention features with the PPSHA and PPSVA, respectively. Subsequently, the second-order self-supervised significance feature of the SSS data is extracted from the channel, horizontal, and vertical features. The cross-entropy loss function is calculated once the output feature vectors and classification attributes are obtained from the fully-connected layer. The training objective of the model is performed by optimizing the parameter values of the head network through iterative gradient optimization.

3.2. Optical and SSS Image Sample Fusion Transfer Strategy

The issues associated with Challenge 1 increase the complexity of the network architecture and the number of network parameters, which necessitates a significant number of training samples for effective parameter optimization and overfitting prevention. However, the SSS dataset employed in this research contains fewer than one one-thousandth of the 1,000,000 training samples of the ImageNet dataset, rendering it insufficient for comprehensive model training from the outset. Relying solely on this dataset for network training will likely lead to suboptimal results.
Considering the complexity of the network structure, this research utilizes the renowned VGG deep network and employs the VGG-19 network with a smaller parameter magnitude as the backbone network model. Figure 2 displays the VGG-19 network structure, and Table 2 presents specific parameter settings. The model is initially trained on a vast optical image dataset, enabling it to effectively classify over 1000 prevalent object categories.
Subsequently, the backbone network (VGG-Encoder  x ( x = 1 , 2 , 3 ) ) in the VGG-19 network structure is frozen (parameters are not trained), and an underwater SSS image trains the head network (VGG-Encoder x ( x = 4 , 5 ) ) in the network to achieve SSS image target recognition.
The object to be identified herein is the SSS image object, because the SSS image is measured one-by-one by using the towfish according to the measurement line and then spliced. As a result, the horizontal direction of the image is distorted due to the change of the towfish’s attitude and to the vertical direction of the image changes due to the change in the measurement distance. These features are unique to SSS images. According to the characteristics of sonar images, first, key features are extracted from SSS images in the horizontal direction and the vertical direction, respectively. The extraction of key features in the horizontal direction can suppress the influence of image distortion, and the extraction of key features in the vertical direction can suppress the influence of the intensity change of the image. Then, the horizontal and vertical features are connected with the original feature map by the point multiplication method of the scale phase feature map, and critically important features are further obtained, which can highlight the importance features and suppress the interference and redundancy features. Finally, based on this, the target recognition performance is improved.
Considering the characteristics of an image as 2D data, it is segmented into horizontal and vertical directions. Two attention methods, the PPSHA and PPSVA, are proposed. The PPSHA model extracts horizontal attention features by correlating each row of the feature graph point-by-point, capturing the key features of each row. Conversely, the PPSVA model derives longitudinal attention features by correlating each column of the feature graph point-by-point, capturing the key features of each column. Both models utilize three feature variables from three transformation layers and compute the feature dot product for each row or column of the feature variable. Full consideration of horizontal and vertical features enhances the key feature extraction performance of the feature map. Building on the PPSHA and PPSVA models, the PPCSSA model is introduced. The PPCSSA model combines the dot products of the PPSHA and PPSVA features, and a linear transformation of a feature graph for each channel captures more crucial channel features. Finally, the PPCSSA features of each channel are consolidated along the channel direction to capture the second-order attention features of the channel.

3.3. PPSHA Model

A horizontal point-by-point attention model is defined, where each row of the feature graph is transformed into three new feature graphs by using three linear transformation matrices. Moreover, each line of the three feature graphs is determined utilizing the dot product method to achieve horizontal direction attention feature extraction. It is assumed that  X M × M  is an input image, and the PPSHA model processes all rows of an image  X M × M  in three linear transformation layers to obtain three horizontal feature maps, which are represented by  Q H = X W H Q K H = X W H K , and  V H = X W H V , where  W H K M × L W H Q M × L , and  W H V M × L . Therefore, the correlation operations are conducted by using Equations (1) and (2) to obtain the output feature map of the PPSHA model:
Q H = Q H ( 1 ) Q H ( 2 ) Q H ( M ) K H = K H ( 1 ) K H ( 2 ) K H ( M ) V H = V H ( 1 ) V H ( 2 ) V H ( M ) ,
Y = Y 1 Y 2 Y M Y M × L ; Y t = σ ( Q H ( t ) ) t = 1 M exp ( K H ( t ) + ω t , t ) V H ( t ) t = 1 M exp ( K H ( t ) + ω t , t ) ,
where ⊙ is the element-wise product,  σ  is the nonlinear function sigmoid, and  ω M × M  is the inter-row bias parameter.
Equation (2) is illustrated graphically in Figure 3.
Figure 3 illustrates that, for each row position t, the PPSHA model calculates the weighted average of a row  V H , and the result is combined with  Q H ( t )  through element-wise multiplication. The weight is determined using the  K H  value and a set of pair-wise row position deviation parameters. The PPSHA model can aid in deriving the salient features of the elements in each image row.

3.4. PPSVA Model

Similar to the PPSHA model, a vertically-oriented point-by-point attention model called PPSVA is developed. In this model, each column of the feature graph is converted into three new feature graphs by using three linear transformation matrices. Moreover, each column of the three feature graphs is determined via the dot product method to achieve vertical attention feature extraction. In the PPSVA model,  X M × M  is an input image, and this model processes all image columns  X M × M  in three linear transformation layers to produce three vertical feature maps denoted by  Q V = W V Q X K V = W V K X , and  V V = W V V X , where  W V K L × M W V Q L × M , and  W V V L × M . Therefore, the correlation operation is conducted to yield the output vertical feature map as follows:
Q V = Q V ( 1 ) , Q V ( 2 ) , , Q V ( M ) , K V = K V ( 1 ) , K V ( 2 ) , , K V ( M ) , V V = V V ( 1 ) , V V ( 2 ) , , V V ( M ) ,
Y ˜ = Y 1 ˜ , Y 2 ˜ , Y M ˜ Y ˜ L × M ; Y ˜ t = σ ( Q V ( t ) ) t = 1 M exp ( K V ( t ) + ω ˜ t , t ) V V ( t ) t = 1 M exp ( K V ( t ) + ω ˜ t , t ) ,
where ⊙ is the element-wise product,  σ  is the nonlinear function sigmoid, and  ω ˜ M × M  is the inter-column bias parameter.
Equation (4) is graphically illustrated in Figure 4.
Figure 4 demonstrates that, for each column’s position t, the PPSVA model calculates the weighted average of a column  V V , and the result is combined with  Q V ( t )  through element-wise multiplication. The weight is determined using the  K V  value and a set of pair-wise column position deviation parameters. This attention model can extract the salient features of the elements in each column in the image.

3.5. Channel-to-Channel Second-Order Crossed Self-Attention Model

Based on the PPSHA and PPSVA models, this study introduces a second-order attention model to enhance the performance of the attention model and maximize the salient features. This model is applied to each channel of the image features so that every channel can extract the salient features. Furthermore, a second-order attention feature map from each channel is merged in the channel direction. Consequently, the second-order crossed-attention feature maps from multiple channels can be acquired.
The structure of the proposed channel-to-channel second-order crossover self-attention model is illustrated in Figure 5, and the associated calculation equations are provided in Equations (5)–(7).
Y = P P S H A ( X ) , Y M × L
Y ˜ = P P S V A ( X ) , Y ˜ L × M
X ˜ = Y ( Y ˜ ) T ( X W ) , W N × L , X ˜ M × L
Figure 1 reveals that the structure of the proposed optical and SSS data fusion target transfer recognition network employs an objective function defined by Equation (8), rooted in cross-entropy loss, for each training link. The network undergoes sequential training from shallow layers to deep ones, leading to an improvement in the network’s abilities to extract target features and to significantly resist the noise, thus enhancing the recognition performance of the network.
L = 1 S i L i = 1 S i c C y i c log ( p i c )
In Equation (8), C is the number of categories (i.e., plane, ship, and others), S is the number of data samples, and  y i c  is a sign function that can have a value of zero or one. In other words, if the true class of a sample i is equal to c, then  y i c = 1 ; otherwise,  y i c = 0 p i c  is the probability that the predicted sample i belongs to category c.

4. Experimental Results

This section presents the results of tests performed on the algorithm technique for recognizing transfer in underwater SSS by using the crossed PPCSSA model. The experiments were conducted on a computer system using the Microsoft Windows 10 operating system with 64 GB memory and an NVIDIA GTX TITAN-XP GPU. The network architecture was developed using Python version 3.6.8. The reliability and efficacy of the proposed method were assessed through comparative analysis and experiments. The recognition accuracy improvement of the proposed method was evaluated by comparing it with various conventional DL-based recognition techniques. Moreover, the effectiveness of the self-attention TL algorithm in target recognition was examined by contrasting it with related TL algorithms.

4.1. Experimental Settings

Application dataset
The experiments utilized an image dataset comprising target data captured by imaging sonar. This dataset was collected during the Underwater Acoustic Engineering Research Project at Harbin Engineering University, spanning scientific research from 2016 to 2022. It encompassed three image target types: planes, ships, and other targets. The dataset contained 66 images of planes, 484 images of ships, and 578 images of other targets (https://pan.baidu.com/s/1KSEKt-7ozV3ljtdLn048sA?pwd=cy4l (accessed on 1 September 2023)). Figure 6 presents several examples from the dataset, highlighting the notable noise interference present in the images. Consequently, accurate identification of the depicted image targets posed a significant challenge.
Experimental data preprocessing
All dataset images were resized to 224 × 224 pixels to maintain consistency in network input image sizes. Given the limited number of sample data, dividing the data into training, verification, and test sets was expected to leave an insufficient amount for training. Therefore, the evaluation approach used only training and test sets. For each image type, 70% of the data were randomly selected for model training, with the remaining 30% being allocated for model testing. Table 3 presents the data distribution for each target category.
In order to mitigate the effects of random model parameter initialization and data sampling on recognition performance, multiple experiments were conducted using the average values of the results to evaluate the effectiveness of the model. As indicated, the dataset contained imbalanced data, with 66 images of planes compared to 578 images in other categories. This imbalance can introduce a bias toward categories with more samples, decreasing recognition rates for underrepresented categories. Furthermore, the total of 1128 samples in the dataset increased the overfitting risk for classifiers. The study employed standard data augmentation techniques, such as rotation, flipping, and cropping, to preprocess the data to counter these challenges. These methods encompassed various cropping types, equal height or width stretching, contrast adjustment, clockwise rotation (with angles ranging from 45° to 315°), and horizontal flipping. The results of these transformations are depicted in Figure 7.

4.2. Evaluation Metric

Accuracy served as the primary metric for evaluating the performance of the proposed model. In this research, the VGG-19 network functioned as the trained network. Optical images trained the backbone network, while SSS images trained the head network within the proposed structure. Based on prior findings, the training process used a batch size of 30 and an initial learning rate of 0.001. Cross-validation was executed 10 times to enhance model validation. The primary evaluation criterion was the average overall accuracy (OA), representing the percentage of accurately classified positive instances among all instances, thus indicating the comprehensive classification ability of the model. The OA value was determined as follows:
O A = i c N i i N ,
where  N i i  is the number of test samples that belong to class i but are classified as class i in the classification process; c is the number of classes of data samples; and N is the total sample number of test samples.

4.3. Performance Analysis

The performance of the proposed method was assessed by analyzing the OA index on the test set and comparing it to several state-of-the-art (SOTA) methods.
(1)
Comparison with traditional deep models
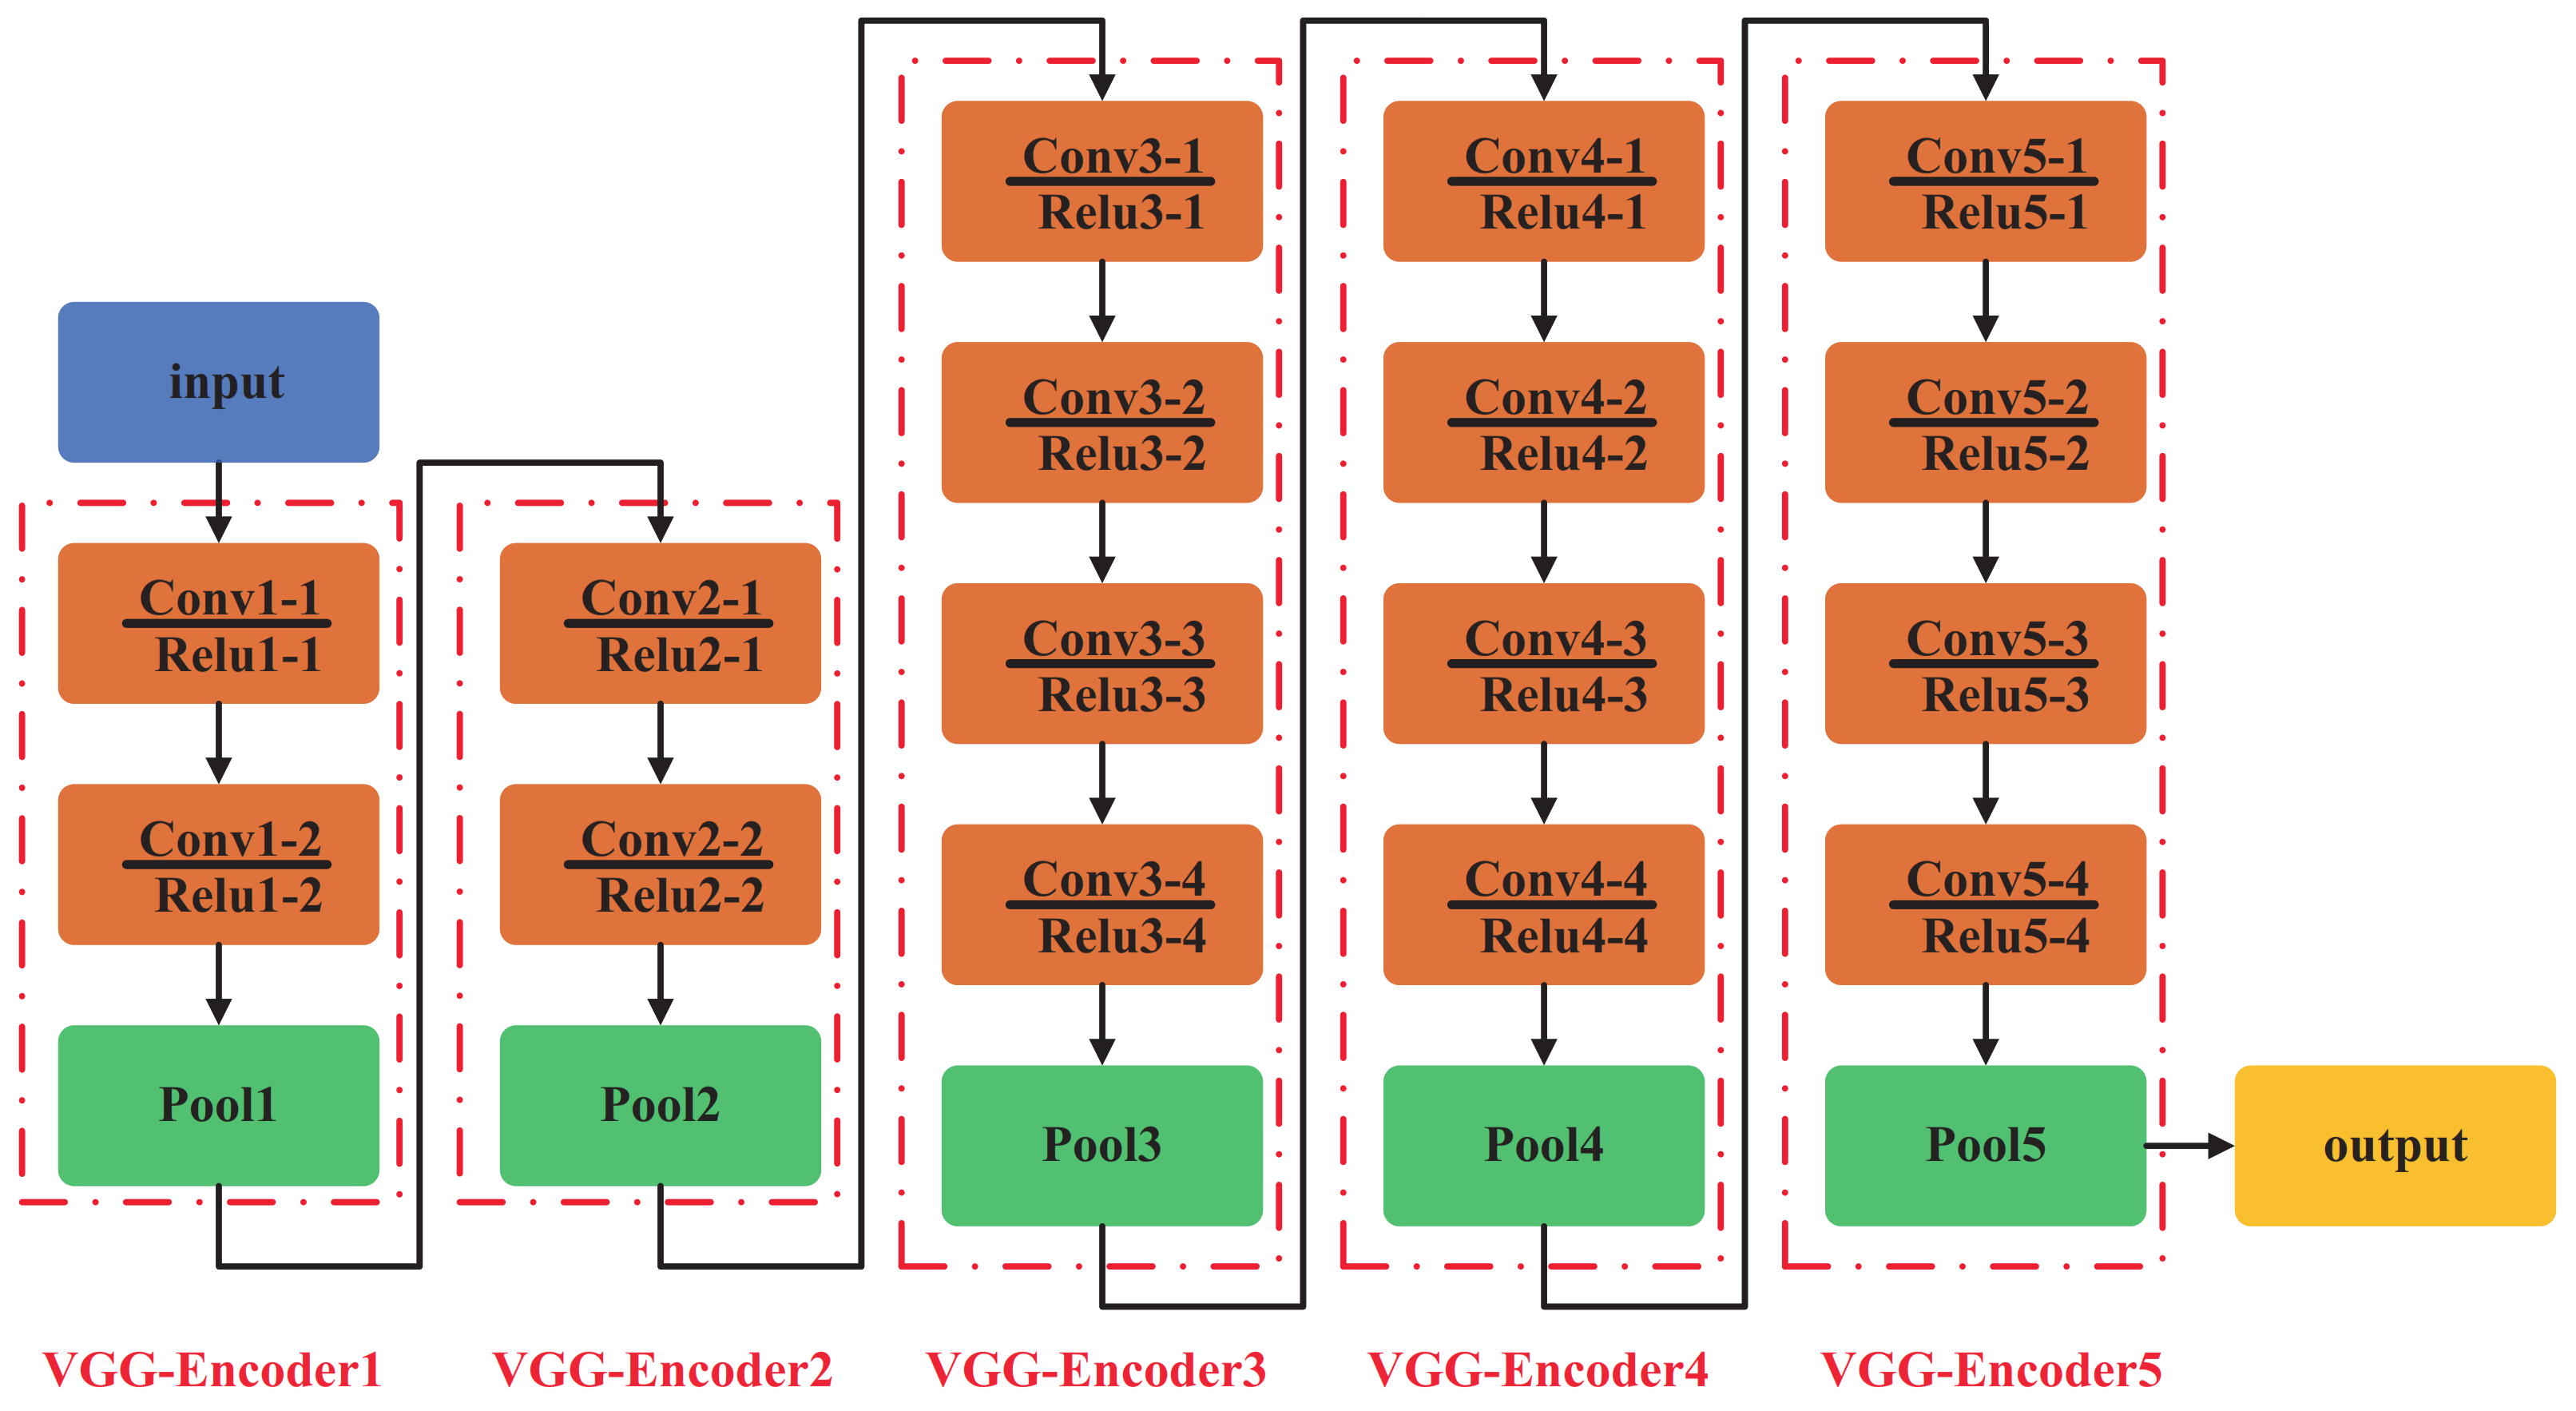
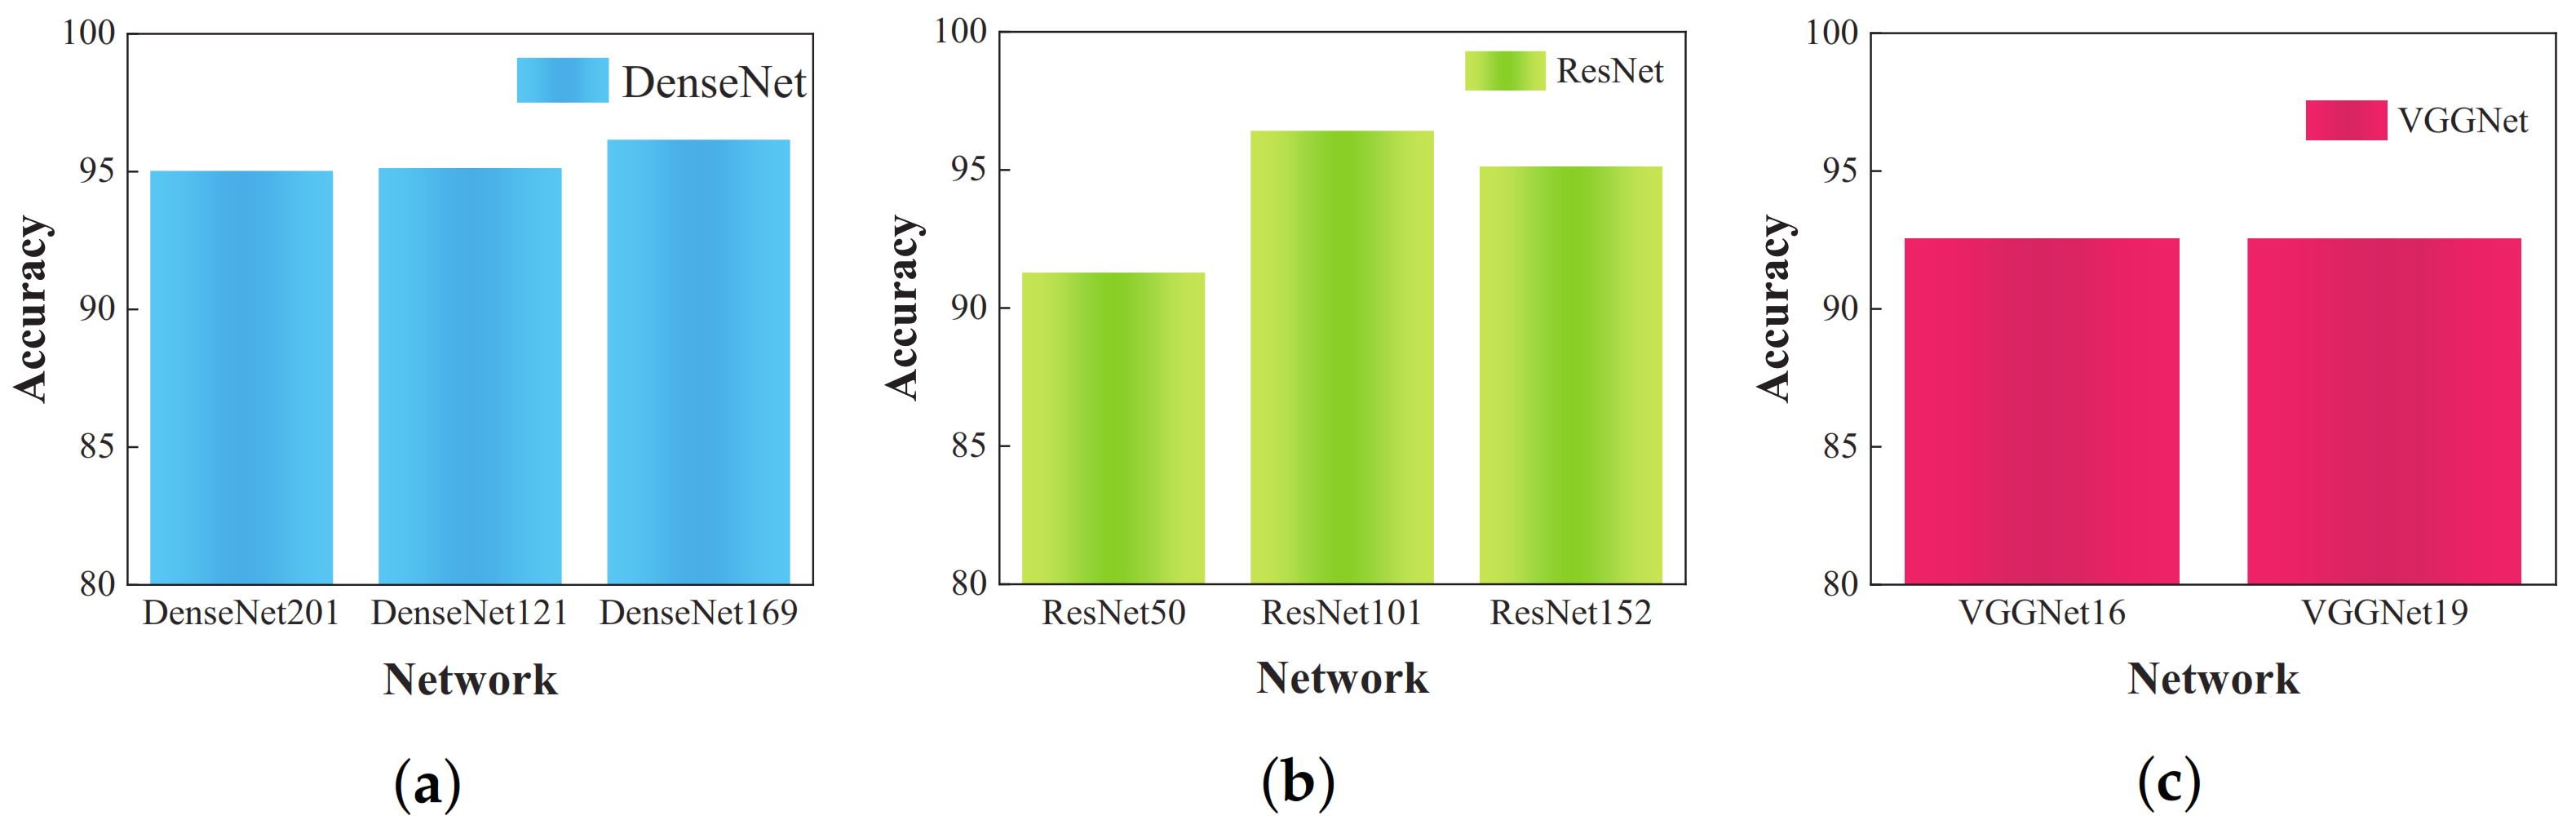
DenseNet (201, 121, 169), ResNet (50, 101, 152), and VGGNet (16, 19) are among the most frequently employed network architectures for object recognition in recent research. Therefore, in this study, the above-mentioned methods were selected for comparative analysis. All these models utilized a standard open network structure. In order to maintain recognition accuracy, input images were consistently resized to 224 × 244 pixels, ensuring alignment between learning rate and batch size. Figure 8 displays the experimental outcomes.
Table 4 reveals that, while the VGG-16 and VGG-19 models exhibit simpler architectures, their recognition performance, with an accuracy of 92.56%, does not meet the set standards. In contrast, the DenseNet (201, 121, 169) models represent DenseNet architectures with 201, 121, and 169 layers, respectively. Their recognition accuracies are comparable, with DenseNet-169 achieving the highest accuracy of 96.15% and DenseNet-201 registering 95.02%. The recognition accuracy of the ResNet model varies based on its layer count, with the ResNet-50 model achieving 91.28% and the ResNet-101 model peaking at 96.41%. Analysis of the recognition results from these models reveals that DenseNet and ResNet outperform VGGNet. This superior performance is attributed to the more intricate connections between convolutional layers in DenseNet and ResNet compared to those in VGGNet. Thus, utilization of the less complex VGG-19 model can enhance the recognition abilities of the algorithm.
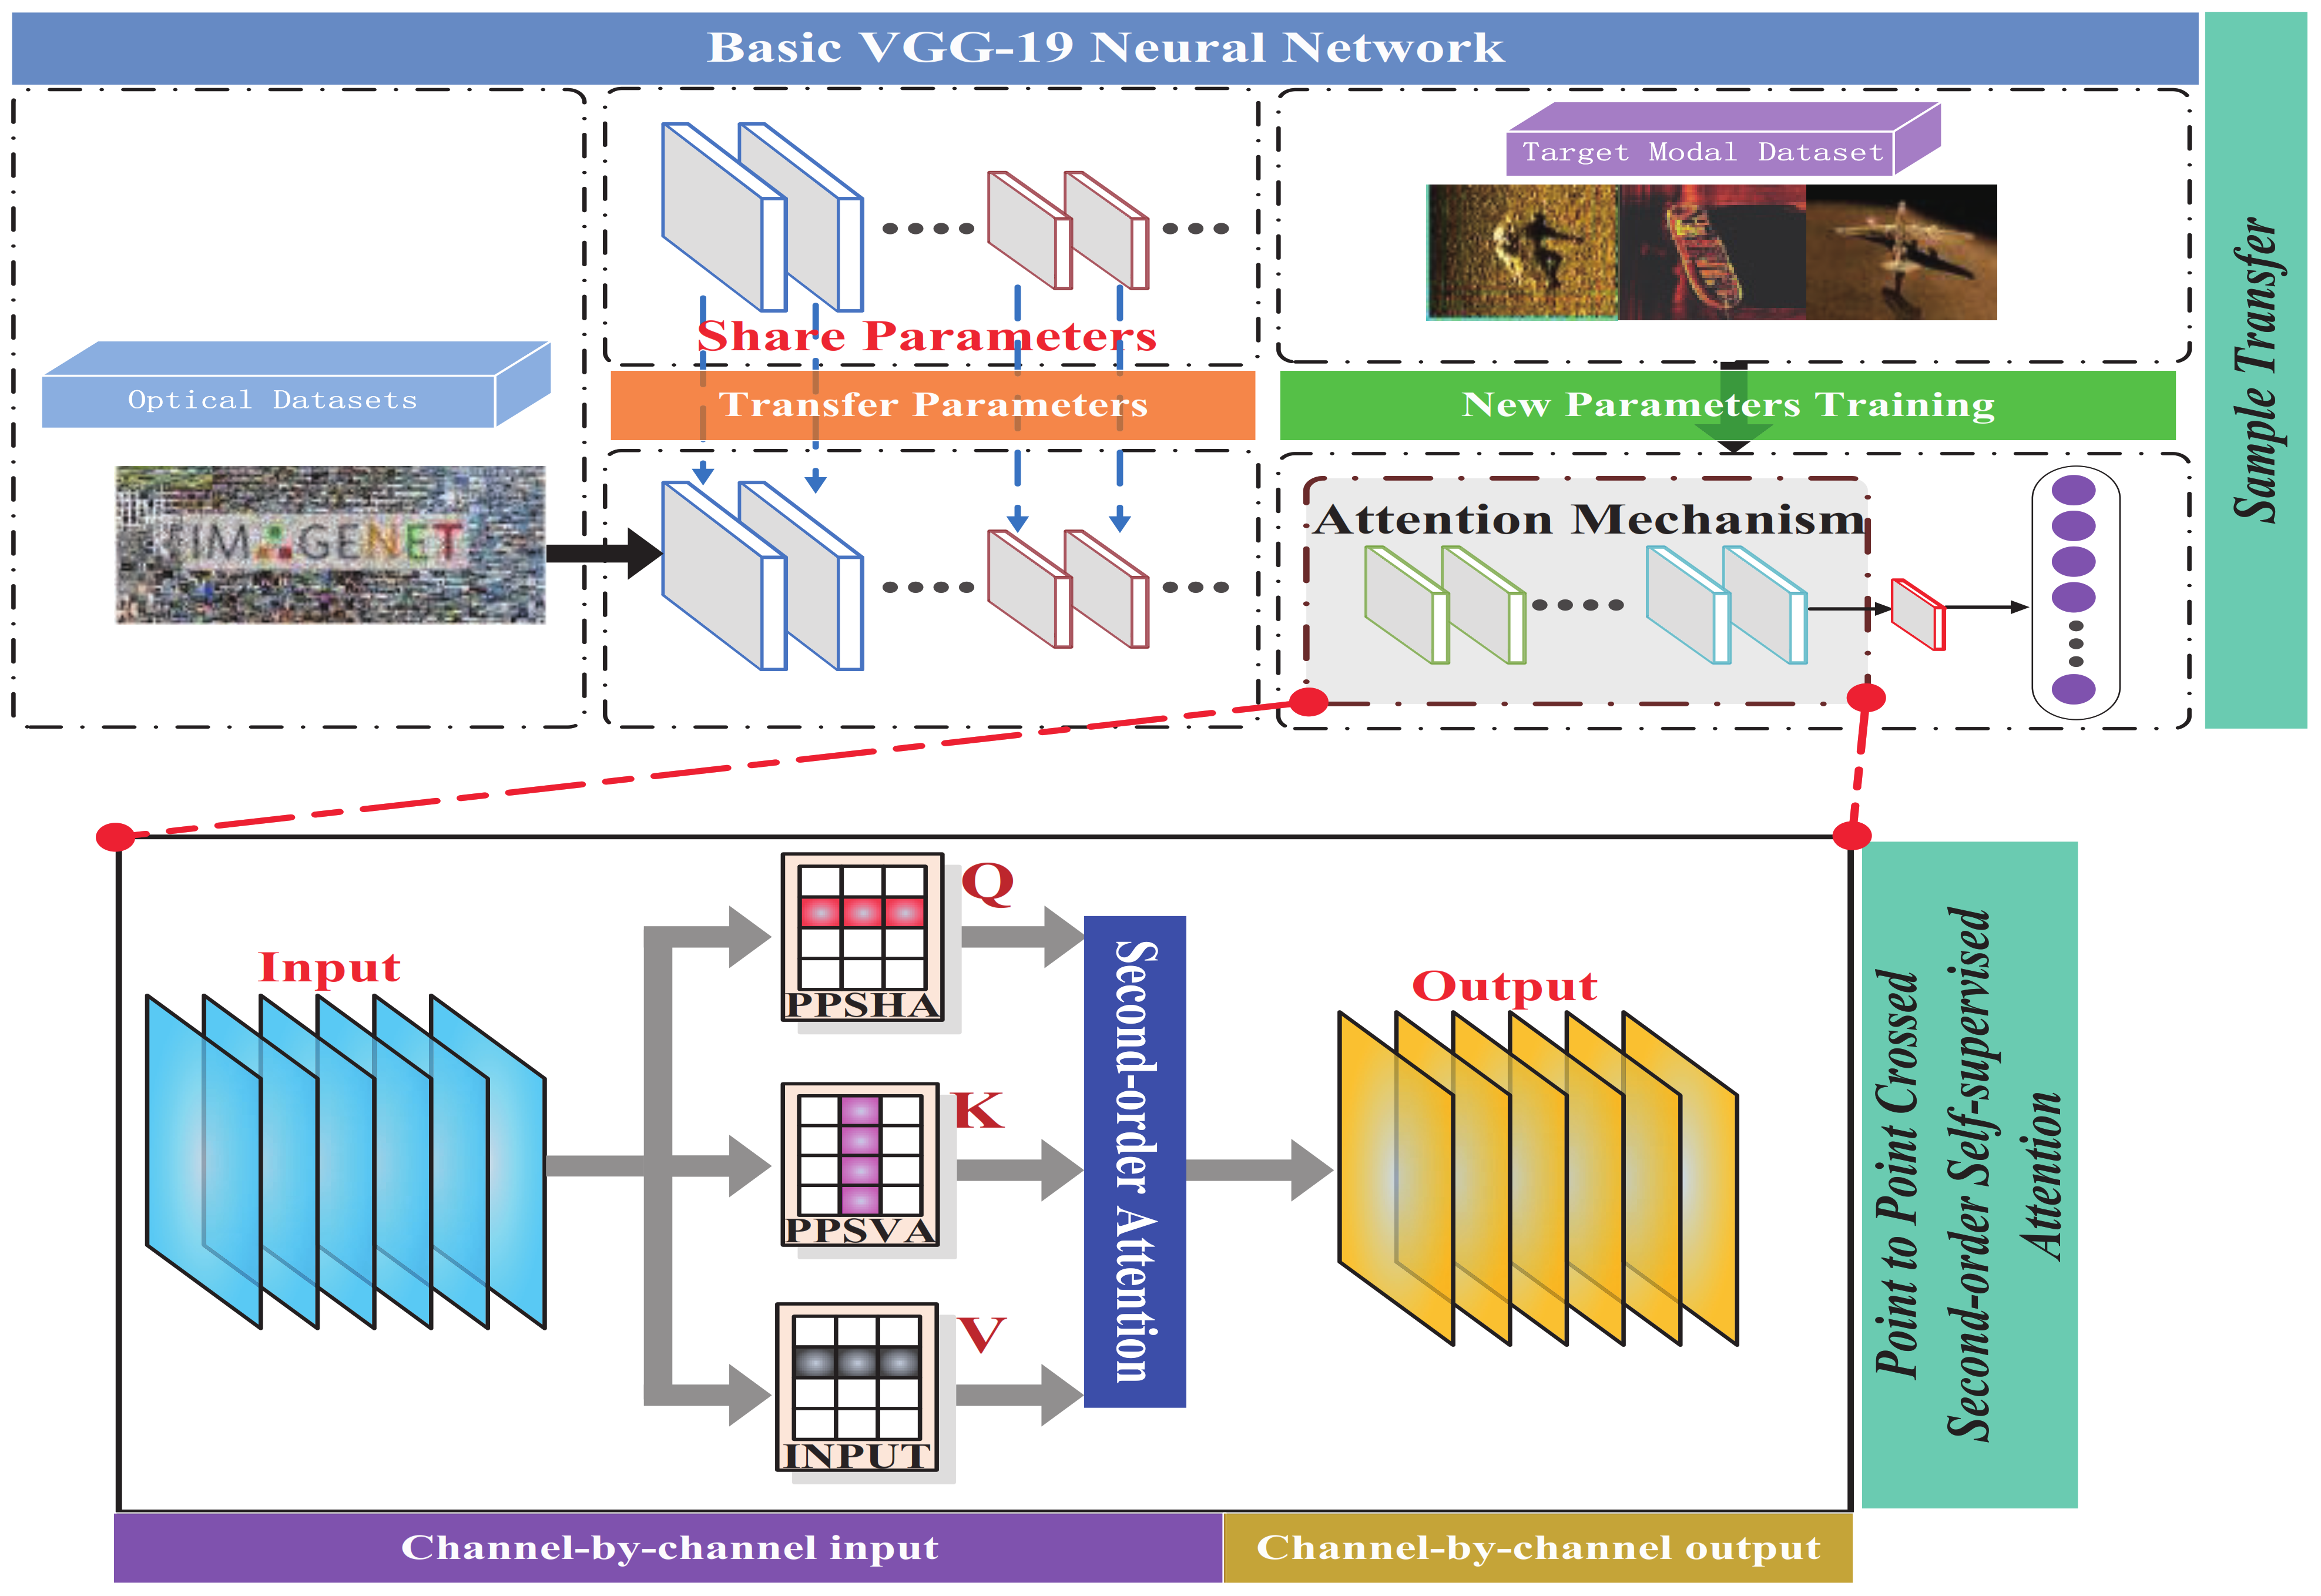
In the process of target recognition training in deep networks, the number of network parameters is relatively large, and a large number of data samples is required for good training of network parameters. If the data sample size is insufficient, the “overfitting” problem with a large training recognition rate and a low test recognition rate is expected to occur in the process of network training. Sonar image corresponds to a typical small data sample. Therefore, sonar images also offer the drawback that a deep network is not effective in target recognition. In this study, the network parameters requiring sonar image training are reduced by the transfer recognition strategy. Simultaneously, the importance features of images are extracted by the PPCSSA mechanism, and the target is accurately identified under the support of the importance features. 
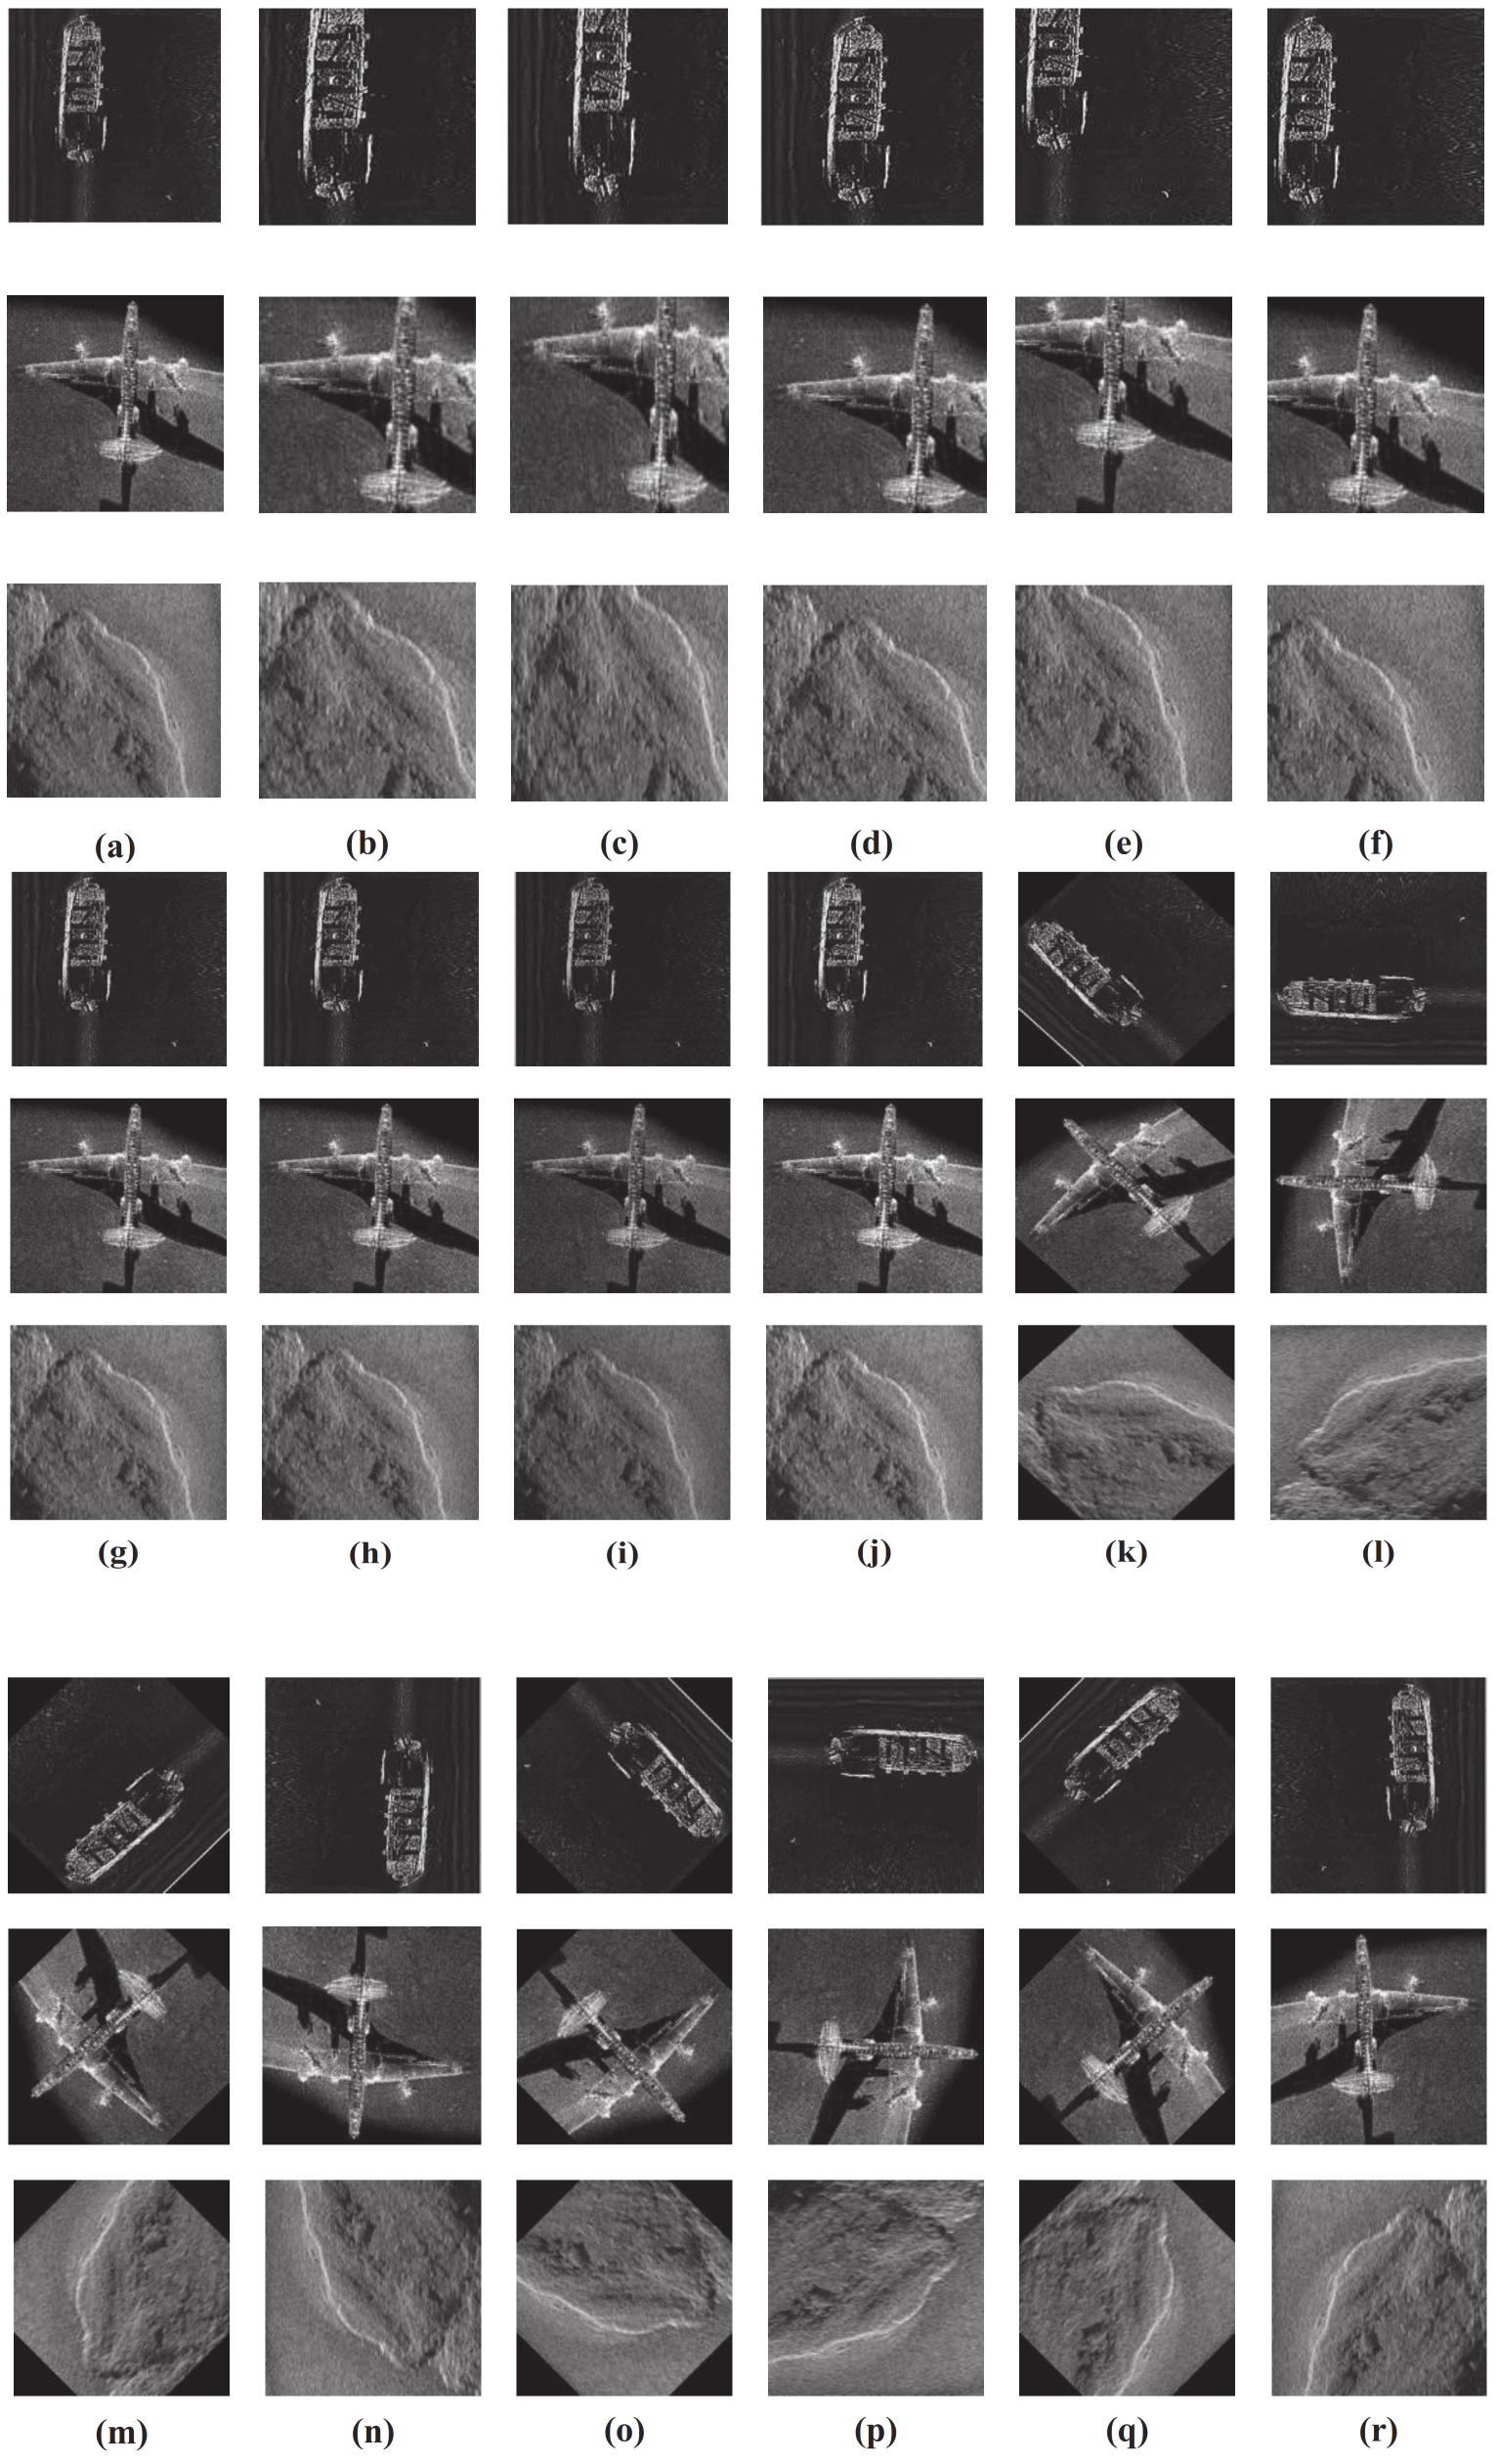
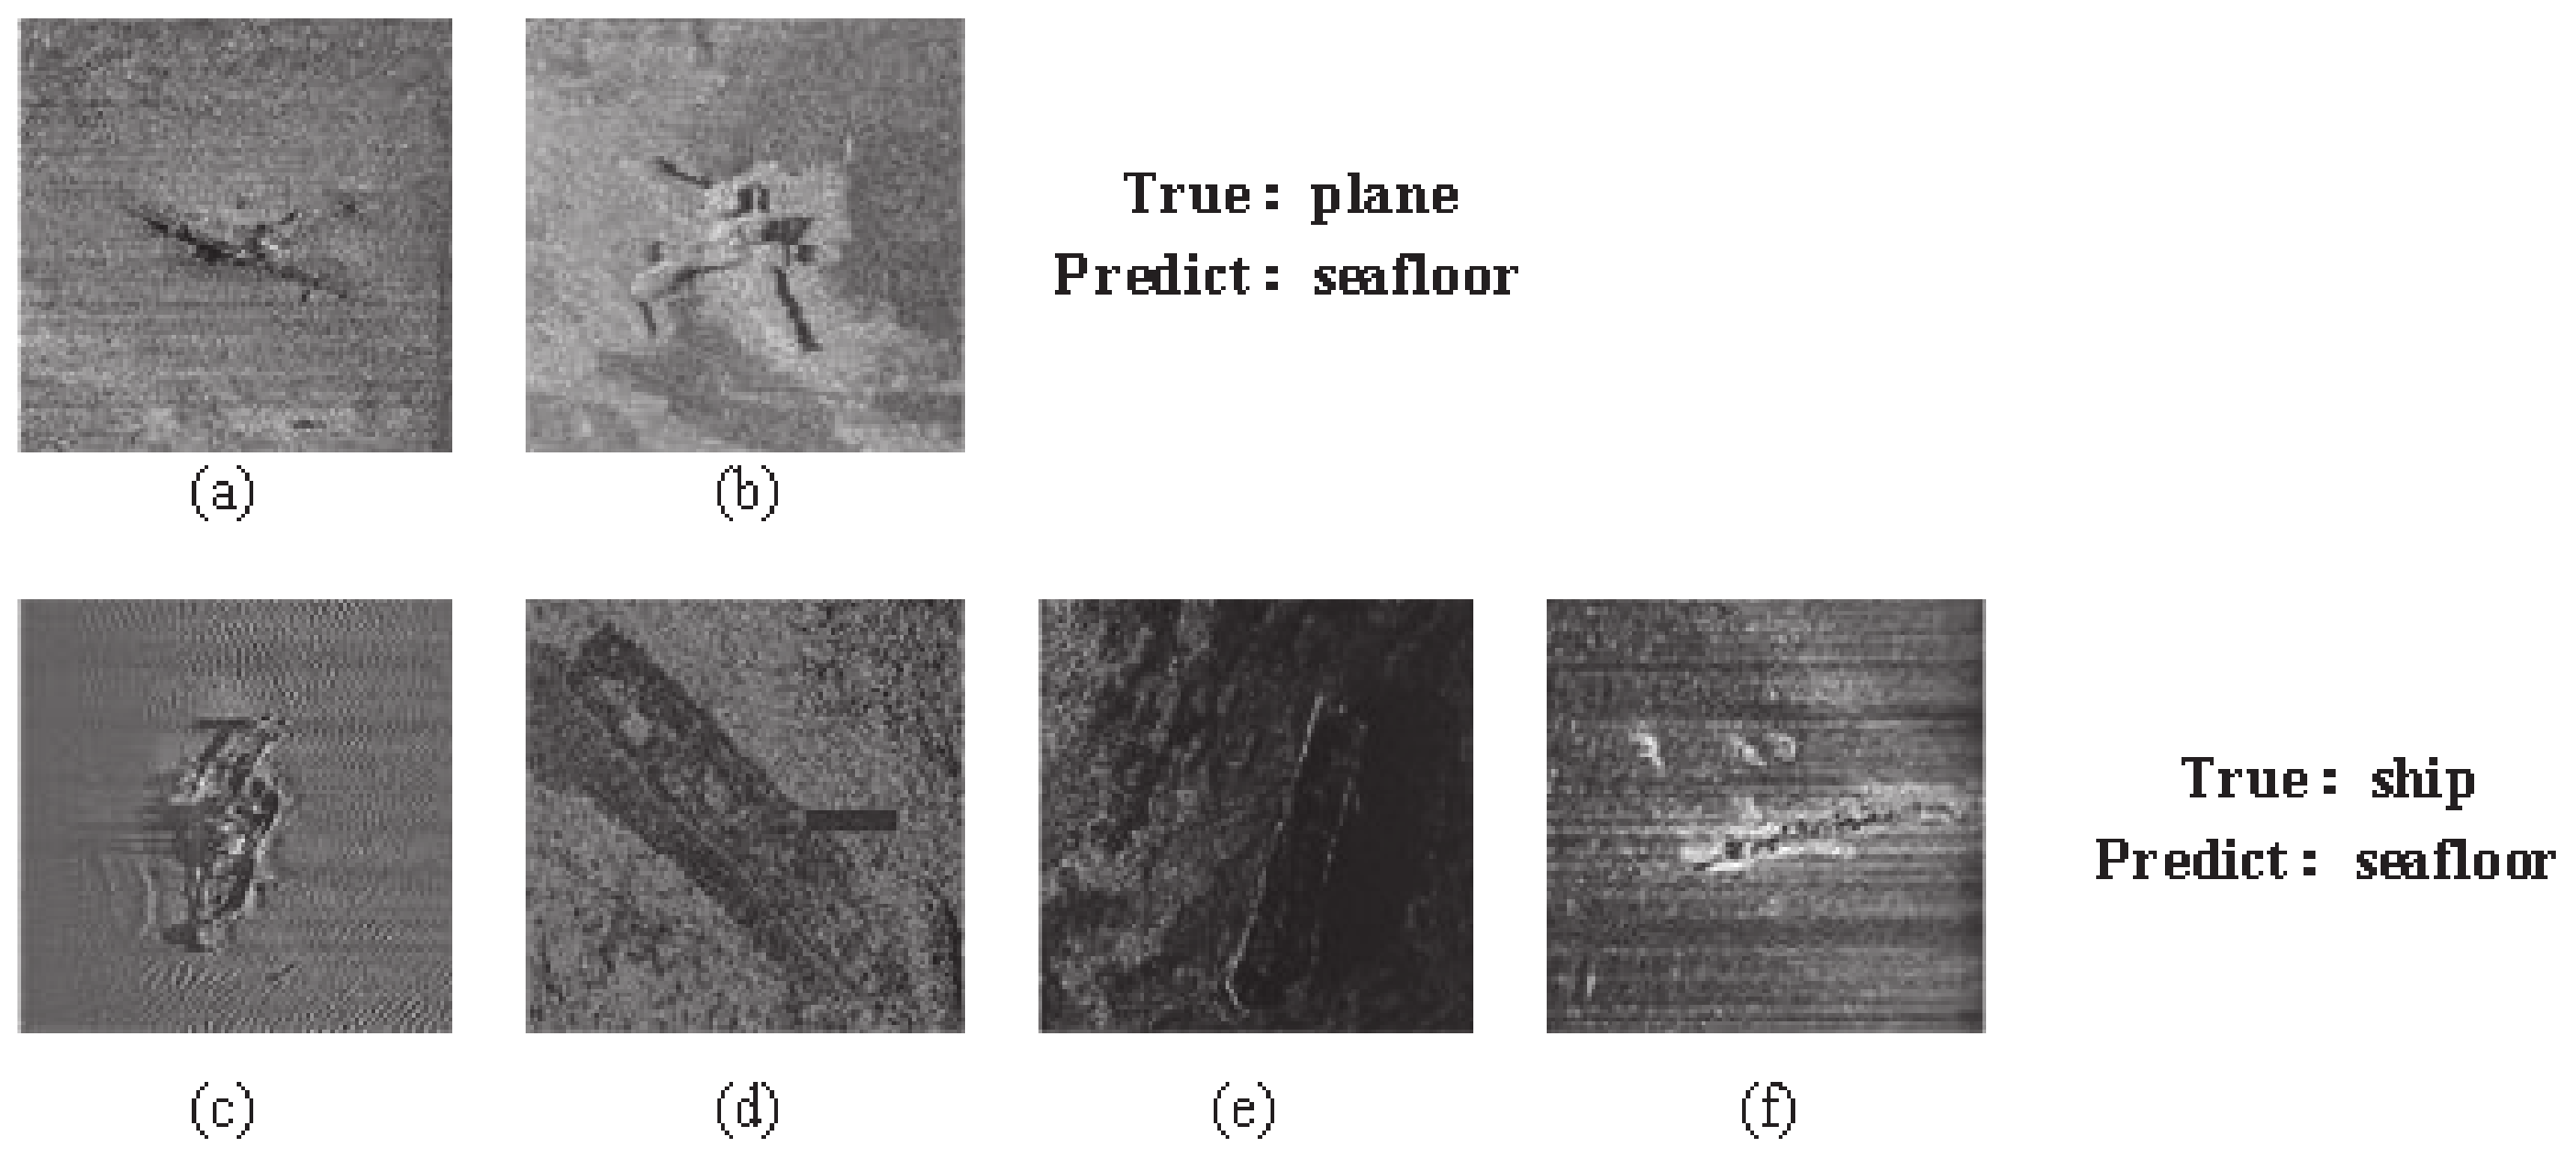
Figure 9 illustrates that, due to the large noise of underwater images, the classical deep network used for optical target recognition causes serious interference in the process of image feature extraction, in particular, for target images with small scale, low contrast, and fuzzy nature. Figure 9a,b show the crashed aircraft; however, Figure 9a presents the small scale, and Figure 9b shows the problem of ambiguity, so the classical depth recognition method can easily misidentify the target as the seabed. Figure 9c–f show a shipwreck. Nonetheless, Figure 9c is ambiguous, Figure 9d,e have the problem of low contrast, Figure 9f faces the problem of a small scale, and the classical depth recognition method can easily misidentify the target as the seabed. In this study, the key features identified in the image are extracted in the process of feature extraction to reduce the noise interference, with the objective of improving the recognition accuracy of the target.
(2)
SSS image classification results for different backbone networks
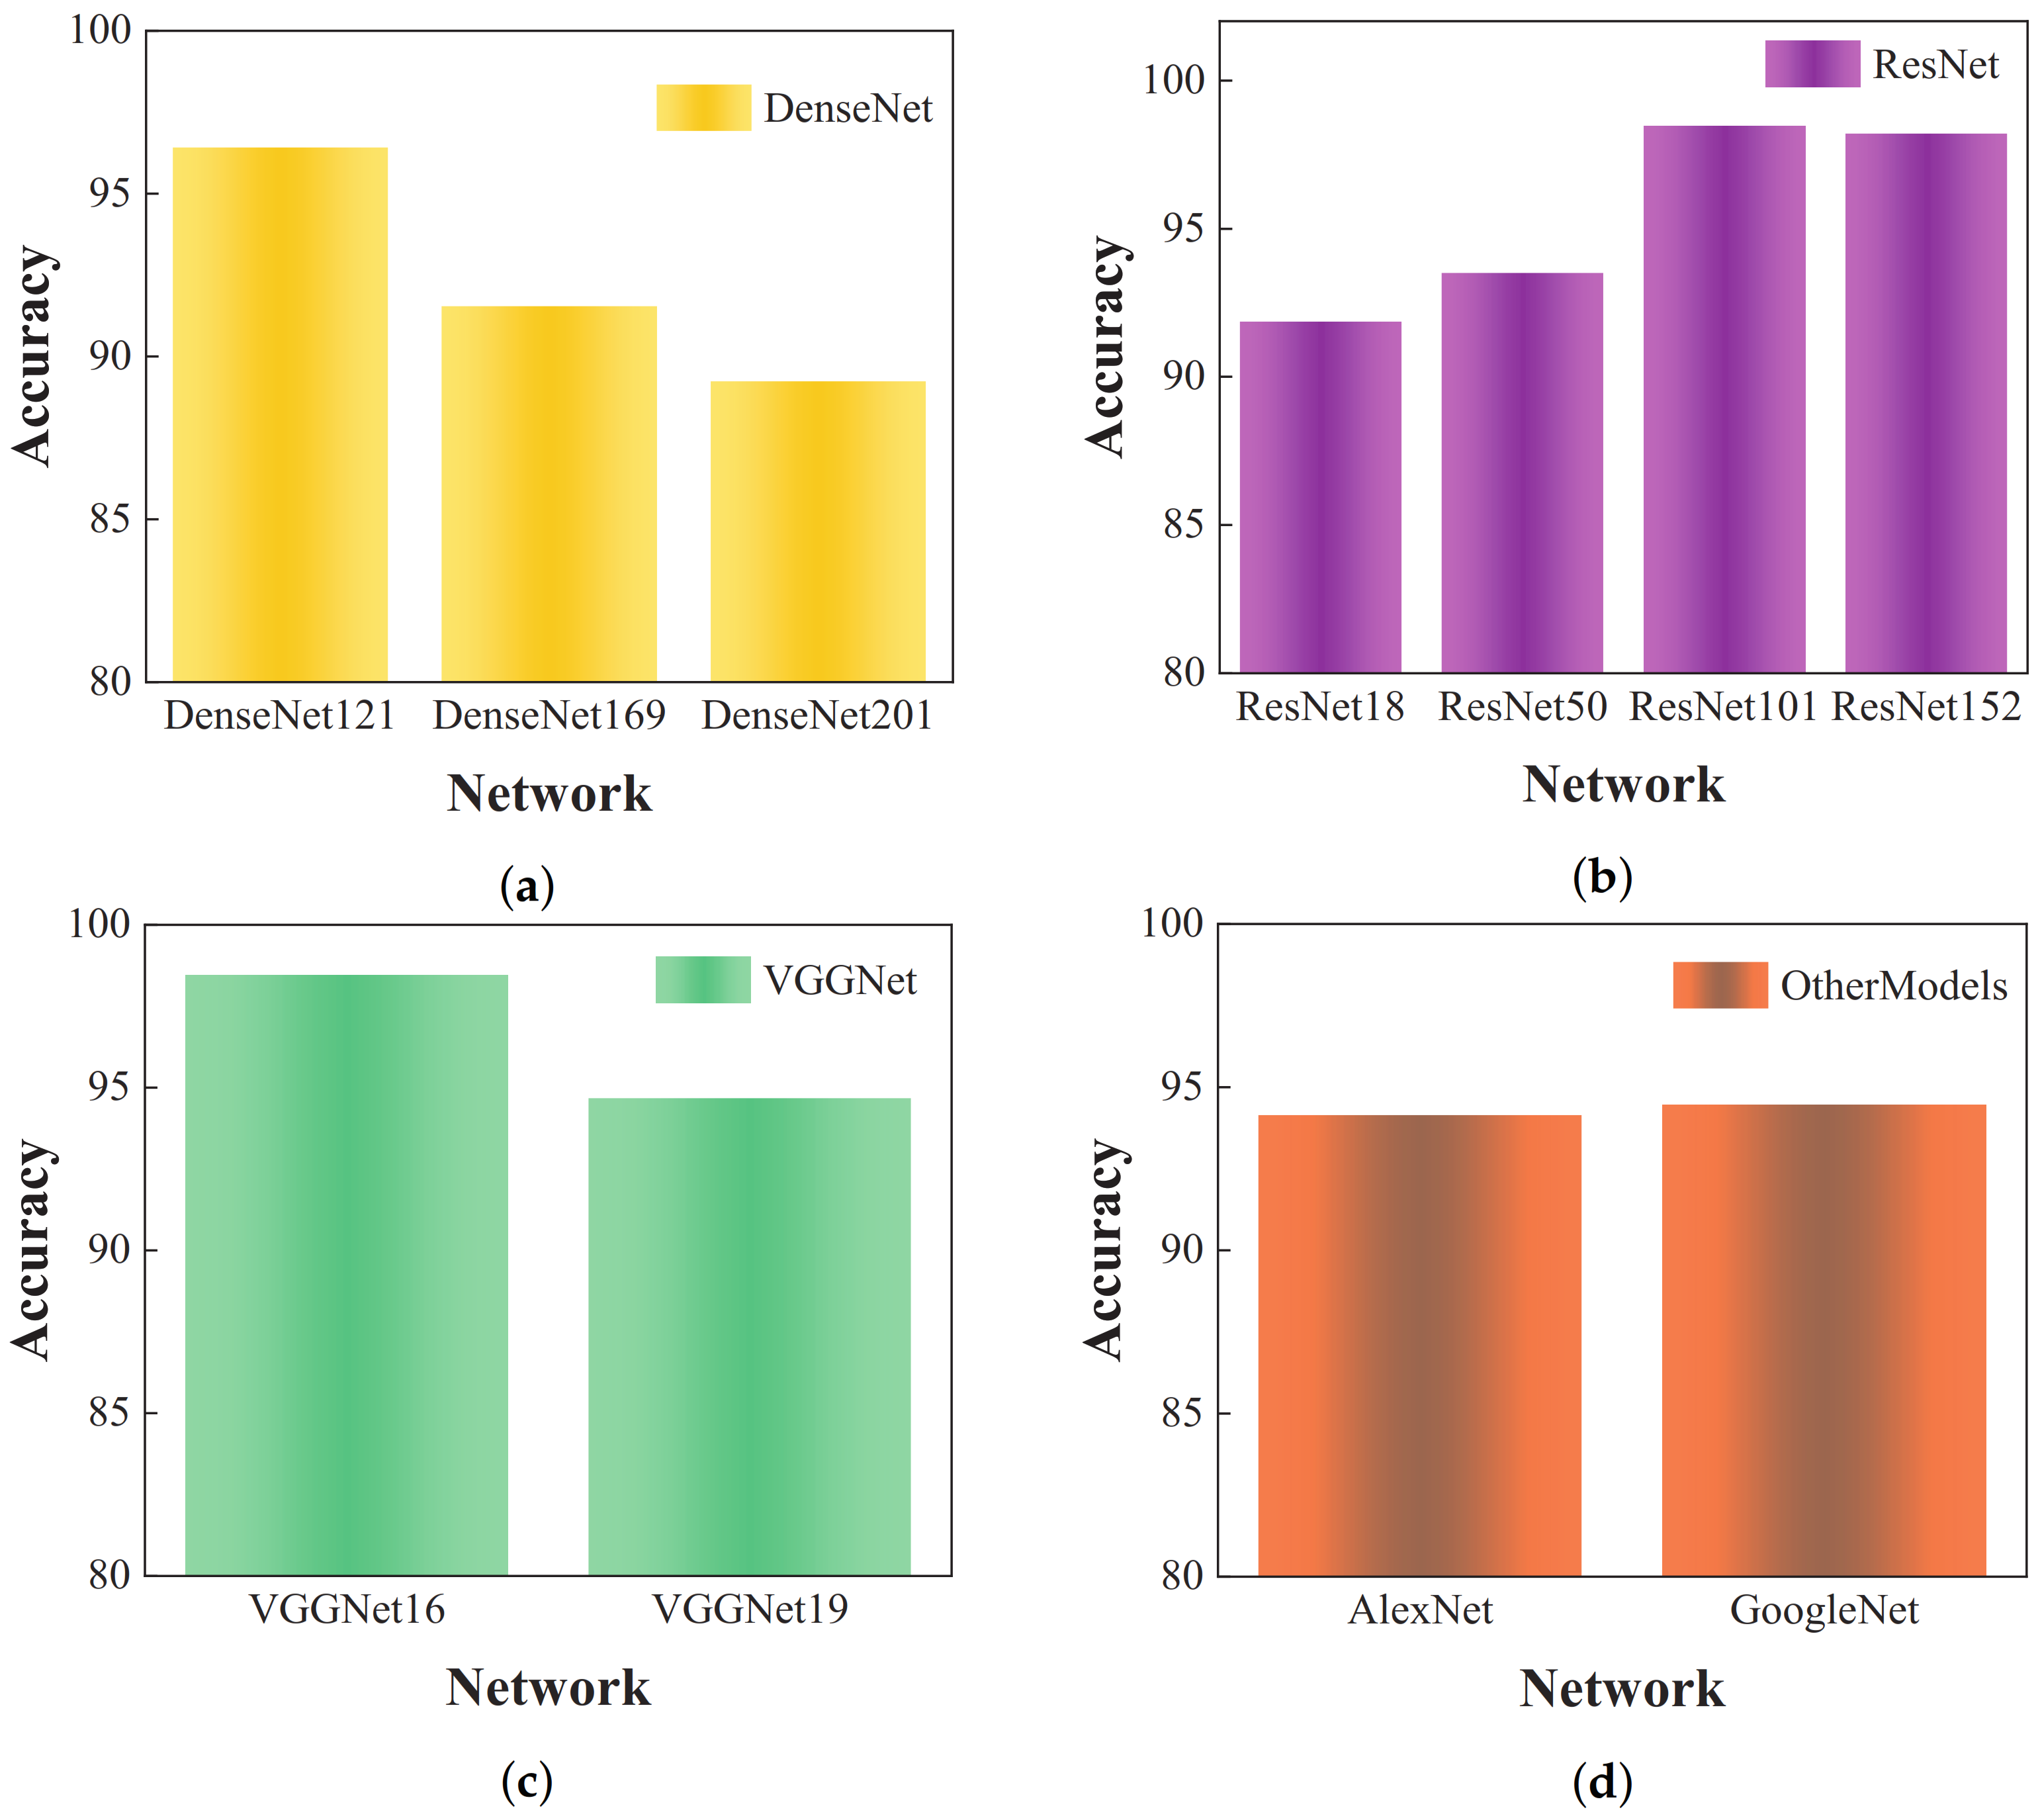
In this study, the most widely used models in the field of transfer recognition were adopted as backbone network models to analyze the transfer performance of the proposed transfer identification method. Specifically, the DenseNet, ResNet, VGGNet, AlexNet, and GoogleNet models were employed. The backbone network was trained on the ImageNet optical dataset, while the head network was trained on the SSS data. The sample transfer strategy was used for the transfer identification of SSS targets. The recognition accuracy results are presented in Figure 10 and Table 5.
Figure 10 and Table 5 present the recognition accuracy values of the ResNet-18, ResNet-50, ResNet-152, and ResNet-101 models as 91.86%, 93.50%, 98.21%, and 98.46%, respectively, with the ResNet-101 model demonstrating optimal recognition. Recognition accuracy results for the DenseNet models, including DenseNet-121, DenseNet-169, and DenseNet-201, are 96.41%, 91.54%, and 89.23%, respectively. Thus, the recognition rate appears to decrease with the addition of network layers. Notably, more layers indicate that more detailed information can be extracted; therefore, the distinct feature data distributions between the optical and SSS data indicate that the backbone network trained on optical data is used directly for feature extraction. This information regarding extracted features includes both target feature information and noise feature information, with the latter potentially affecting the recognition performance of the head network, leading to a sharp decrease in recognition accuracy. Among the VGGNet models, VGG-19 demonstrates a lower recognition accuracy. Both the AlexNet and GoogleNet models achieve a recognition accuracy of above 94%. The proposed method trained the head network by using the SSS data, which were then applied for transfer recognition and incorporated into the PPCSSA model to capture the essential low-redundancy image features.
Compared to the other models, the proposed method exhibits superior recognition accuracy, achieving 99.28%, which is 4.61% higher than that of the VGG-19 model. This highlights that the proposed method enhances the recognition performance, notably improving upon the VGG-19 transfer recognition method that utilizes the same backbone model.
(3)
SSS image classification results for different methods
Subsequently, this method was compared to several advanced sample transfer recognition methods, such as the shallow CNN network, the semi-synthetic transfer recognition method, the regularization transfer recognition method, and the self-supervised training recognition method, all tested on the same SSS dataset. Table 6 presents the comparison results.
The proposed method was compared with several common SSS identification methods. Table 6 presents that, by increasing the complexity of the model structure, the recognition accuracy of the method proposed in the literature studies [16,17,18] was improved. The recognition accuracy rate increased from 83.19% to 94.46% and 94.67%, indicating that deepening the network layers or using a more complex network structure was conducive to improving the recognition performance. Moreover, compared with the results of these studies [16,18], under the condition of complex network structure, the recognition accuracy improves from 94.46% to 94.67%, and the accuracy increases by 0.21%. Thus, the sample transfer recognition method can improve the performance of small sample target recognition. Moreover, based on the recognition results of methods proposed in literature studies [15,16], by employing semi-synthetic data, the sample transfer identification method could successfully address the problem of inadequate recognition accuracy caused by the limited number of data samples. This led to a remarkable improvement of 3% in recognition accuracy, from 94.67% to 97.76%. Furthermore, Huo et al. [16] reported that, under the condition of VGG-19 as the backbone network, semi-synthetic data were used for sample transfer recognition, and the recognition accuracy exhibited a significant change, from 94.67% to 97.76%, corresponding to an increase of 3.09%. In the process of network parameter transfer recognition by using semi-synthetic data, the distribution difference between synthetic data and SSS data is smaller than that between optical data and SSS data, which reduces the possibility of negative transfer in the process of network parameter training. Therefore, reduction in the distribution difference between different modal data can improve the accuracy of TL target recognition. The SPDRDL and FL-DARTS methods proposed by Gerg and Monga [19] and Zhang et al. [
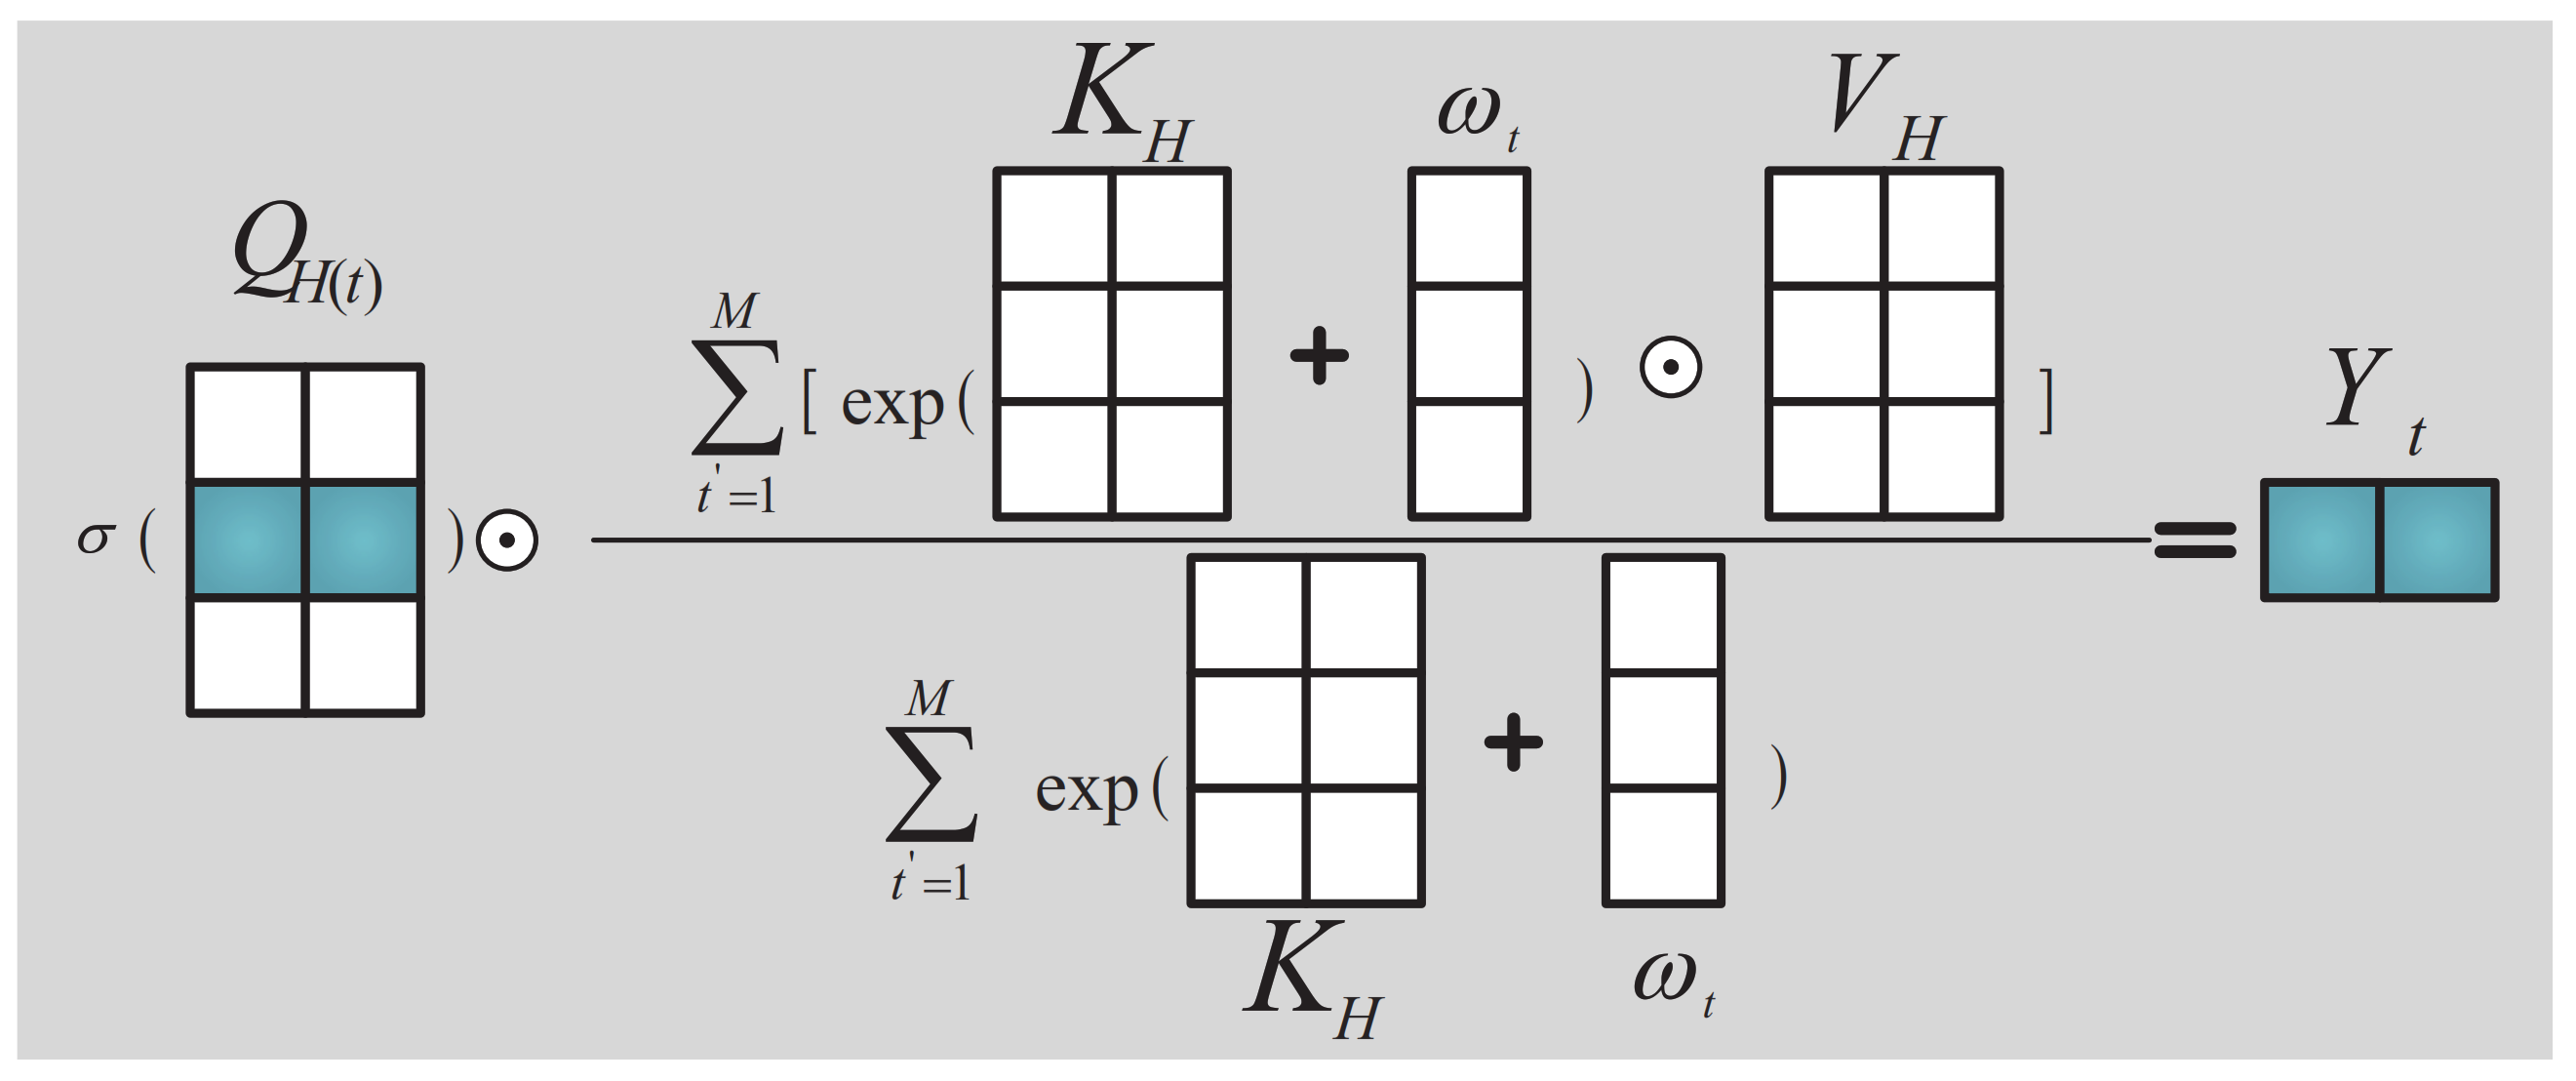
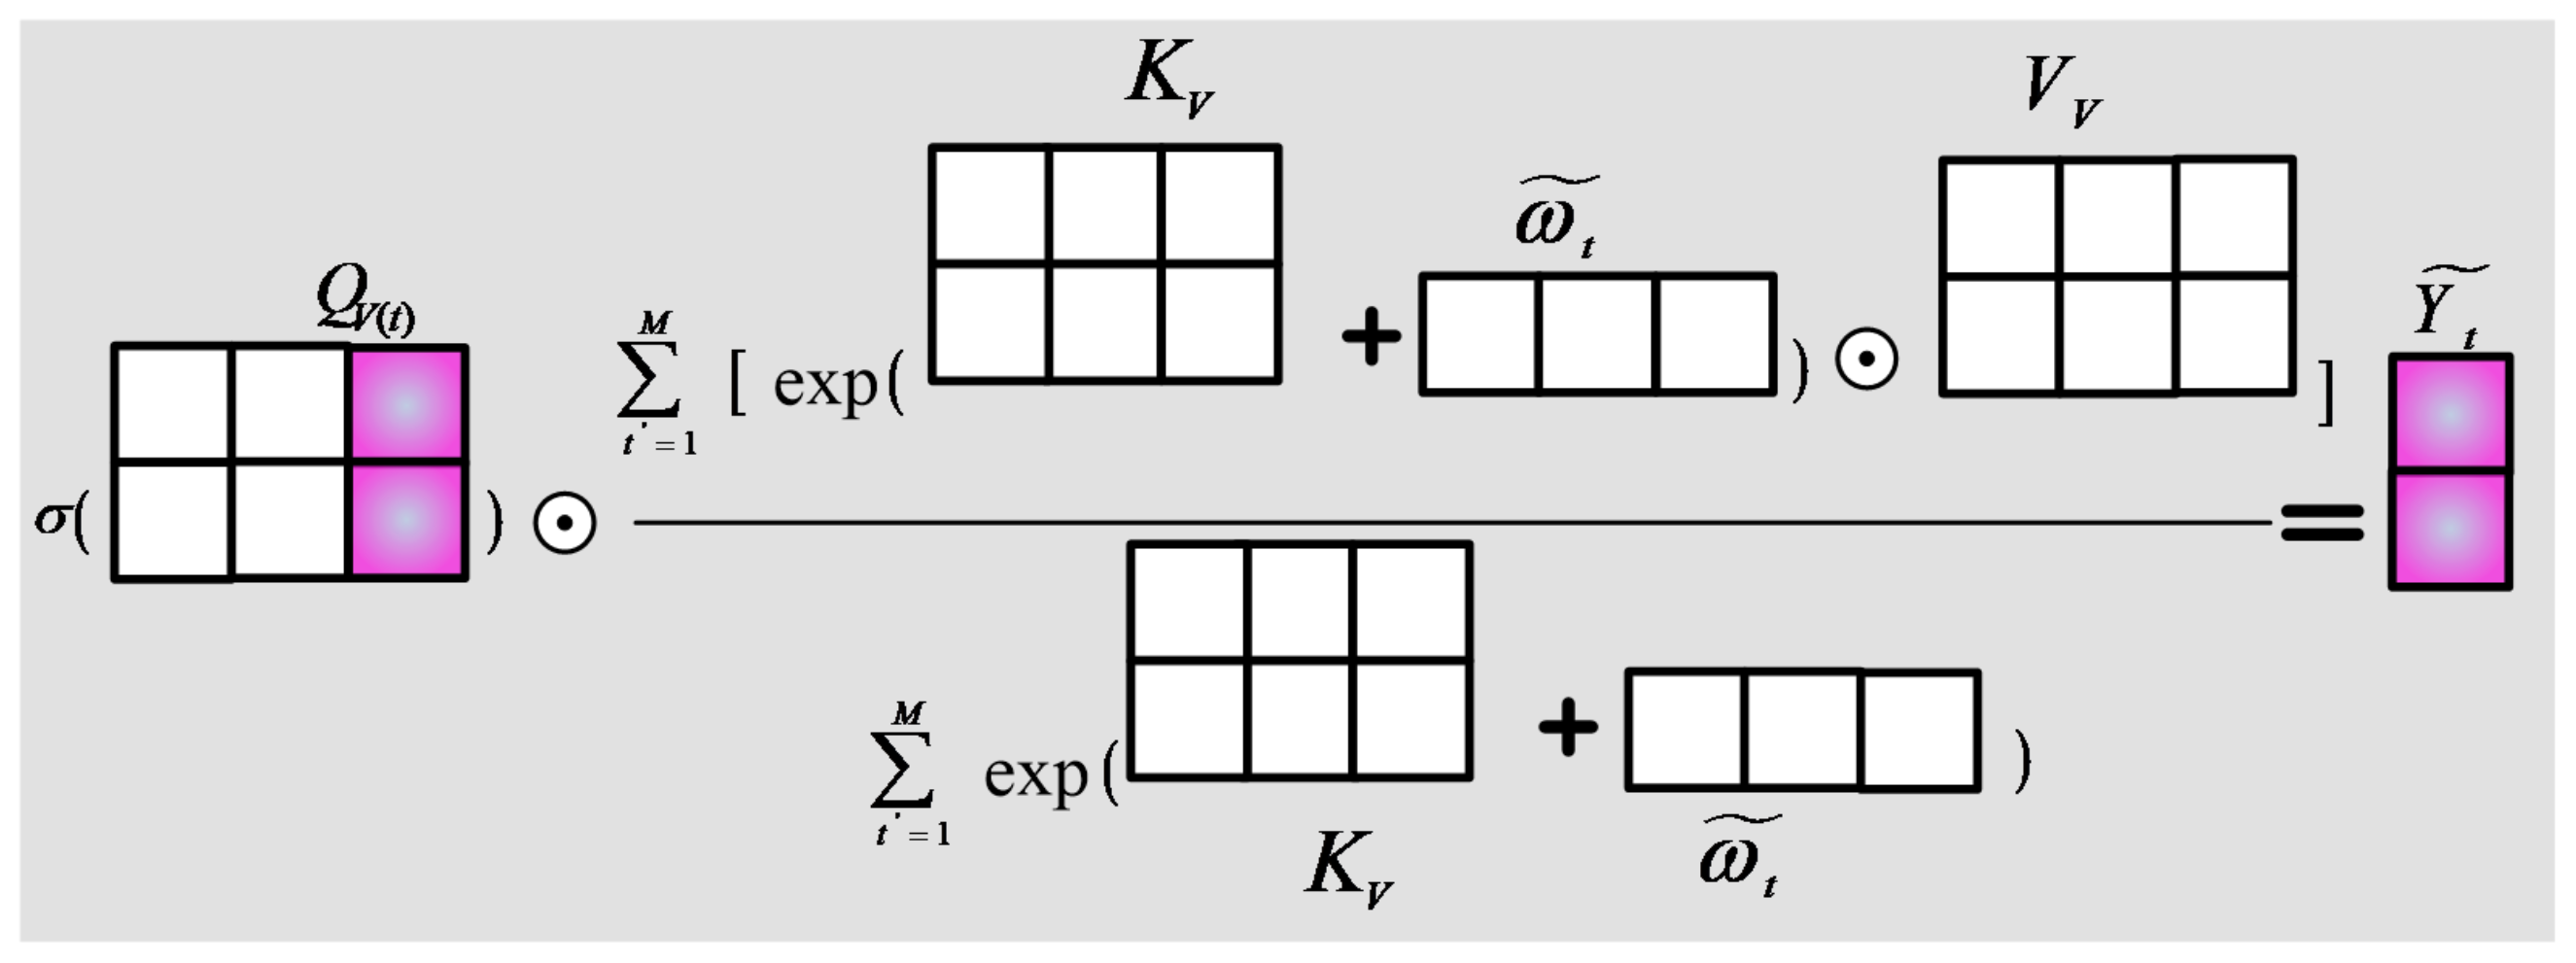
20] used self-supervision and empirical regularization knowledge to reduce the distribution differences among different modal data and to improve the accuracy of target recognition to 96.38% and 99.07%, respectively. However, the network structure used in these two methods faced data noise and other interference in the process of feature extraction, which made the recognition effect of the algorithm less suitable compared with that of the proposed method. The results of comparative analysis show that the proposed method uses only optical and SSS image data for model parameter training, which reduces the computational complexity of the multi-modal sample transfer recognition method and solves the problem of small sample target recognition based on the deep network mechanism. Furthermore, the proposed method starts from the key feature extraction and considers that the image dataset is 2D in nature. First, the image is divided into horizontal and vertical directions, and the main features of each row and column in the image can be obtained by the location importance feature extraction method, while the redundant features in each row and column of the image can be eliminated. Then, through the self-supervised second-order key feature extraction method, each row and column of key features in the image are connected with the original features by dot product, and the key features are further enhanced by the multiplicity correlation enhancement method, which considers the interference features and global redundancy features caused by large differences in data distribution during sample transfer. The negative transfer phenomenon in the sample transfer is reduced, and the accuracy of SSS target recognition is improved. Experimental results show that the performance of this method is superior to that of other methods.
(4)
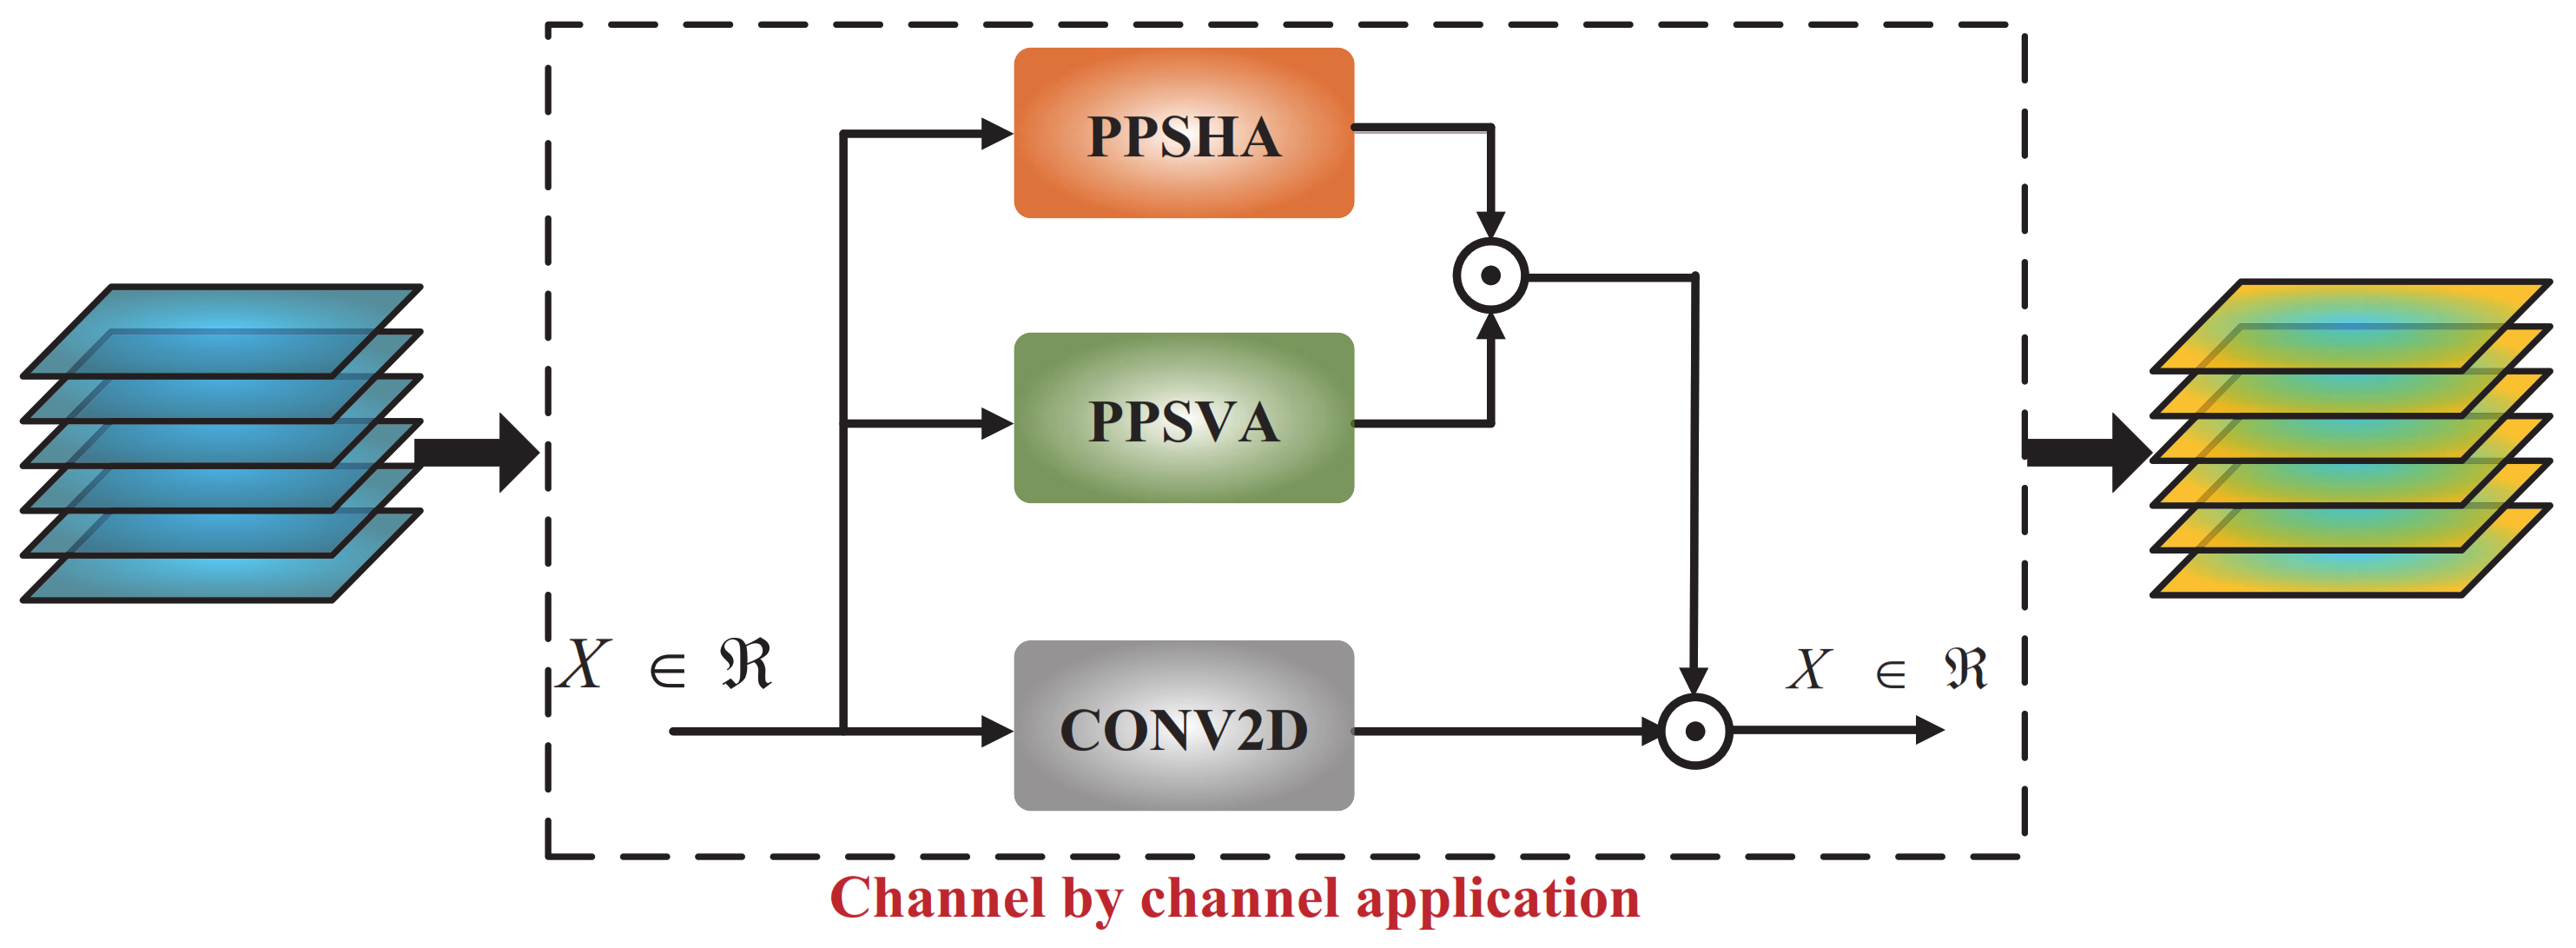
Ablation experiments on PPSHA, PPSVA, and PPCSSA
Furthermore, to validate the efficacy of the PPCSSA model, in this study, several attention mechanism-based ablation experiments were conducted. These experiments focused on three methods, the PPSHA, the PPSVA, and the PPCSSA, all utilizing the VGG-19 model as their backbone network. Table 7 provides the results from these ablation experiments.
Table 6 shows that the OA values for the PPSHA and PPSVA models are 98.51% and 98.01%, respectively. The PPCSSA model achieves an OA value of 99.28%, enhancing its recognition accuracy by 0.77% and 1.27% compared to the PPSHA and PPSVA models. Therefore, the PPCSSA model holds the potential for augmenting recognition performance.
(5)
Comparison of different attention mechanisms in transfer recognition
Under identical conditions using the SSS dataset, this study analyzes the performance of the point-to-point crossover second-order attention mechanism in detail and compares it with the other representative attention mechanism methods. These attention mechanisms include location attention, channel attention, and location channel fusion attention mechanisms. The comparison results are presented in Table 8.
Table 8 presents the comparative experimental results, revealing that the point-to-point crossover second-order attention mechanism proposed in this study offers distinct performance advantages on the SSS datasets. Compared to the location attention mechanism, the point-to-point crossover second-order attention mechanism more precisely captures the essential feature information of the target object by the second-order key feature extraction method. This enhances the key features, suppresses redundant and interference features, and thus improves the target recognition accuracy. The recognition accuracy rate is 2.1% above 97.18%. Compared to the channel attention mechanism, the point-to-point crossover second-order attention mechanism can extract key features in each channel layer through the second-order key feature extraction approach, thus reducing the interference between channel layers and thereby increasing the target recognition accuracy by 1.59% over 97.69%. The point-to-point crossover second-order attention mechanism derives higher-order key features utilizing the second-order key feature extraction and channel-by-channel analysis methods. Compared to the rigid fusion of the two attention mechanisms, the location and channel features can fully emerge while mitigating the interference feature effects. The recognition performance is improved compared to the integrated attention mechanism, leading to an improvement in accuracy from 98.72% to 99.28%. Therefore, the proposed method excels in extracting key features and exhibits superior recognition performance.
(6)
Comparison of methods with different backbones in SSS noisy image classification
The primary distinction between the SSS data and optical images stems from the low signal-to-noise ratio in underwater images due to intricate underwater conditions. Moreover, underwater noise interference directly impacts the performance of the recognition network. Thus, Gaussian, speckle, multiplicative, and Poisson noise were added to the original SSS images. These types of noise epitomize typical interference in underwater images, effectively emulating a high-noise environment. In order to evaluate and compare the efficacy of various models, in this study, the VGGNet, ResNet, and DenseNet network architectures were selected, which are well-recognized and widely utilized in contemporary research, as the backbone networks for the comparative experiment. The numerical results are listed in Table 9.
Table 9 shows that the proposed method registers a recognition accuracy of 98.16%. DenseNet recorded the lowest recognition accuracy of 91.63% among all models, while VGGNet showcased the highest accuracy at 95.5%. The recognition accuracy of the proposed method exceeded those of VGGNet, ResNet, and DenseNet by 2.66%, 5.48%, and 6.53%, respectively. Therefore, the proposed method demonstrates commendable recognition capabilities even amidst significant noise interference.
(7)
Target recognition performance analysis of forward-looking sonar images
FLS, synthetic aperture sonar (SAS), and side-scan sonar data differ significantly in imaging mechanism, resolution performance, detection range, and application scenarios compared to other common marine sonar equipment. The FLS determines the location and shape of underwater targets by measuring the travel time and intensity of sound waves and echoes. The sound wave is reflected, scattered, and refracted when it encounters an underwater target or terrain. The echo signal of the FLS can be reconstructed in the underwater image through signal processing and algorithms. The resolution of an FLS image is affected by acoustic frequency, beam width, signal processing method, etc. It is suitable for underwater navigation and for avoiding obstacles [3,38,42,43]. SAS receives and synthesizes the amplitude and phase information of a series of echo signals through a receiver traveling a relatively short distance and generates high-resolution images with an increase in the imaging aperture, making it suitable for remote detection tasks [44,45,46,47]. The SSS transmits an acoustic signal to the seafloor, measures and records the echo data, calculates the received echo signal amplitude, and creates a bilateral coverage image centered on the seafloor. SSS images rely primarily on the amplitude difference of the echo signal to determine the characteristics of the external environment, which is appropriate for the close-range detection task. Accordingly, FLS, SSS, and SAS perform image processing differently. The SSS image processing is relatively simple; however, the resolution is low, making it suitable for locating and detecting short-distance seabed targets. SAS is well-suited for remote target detection and high-precision imaging due to its complex image processing and high resolution.
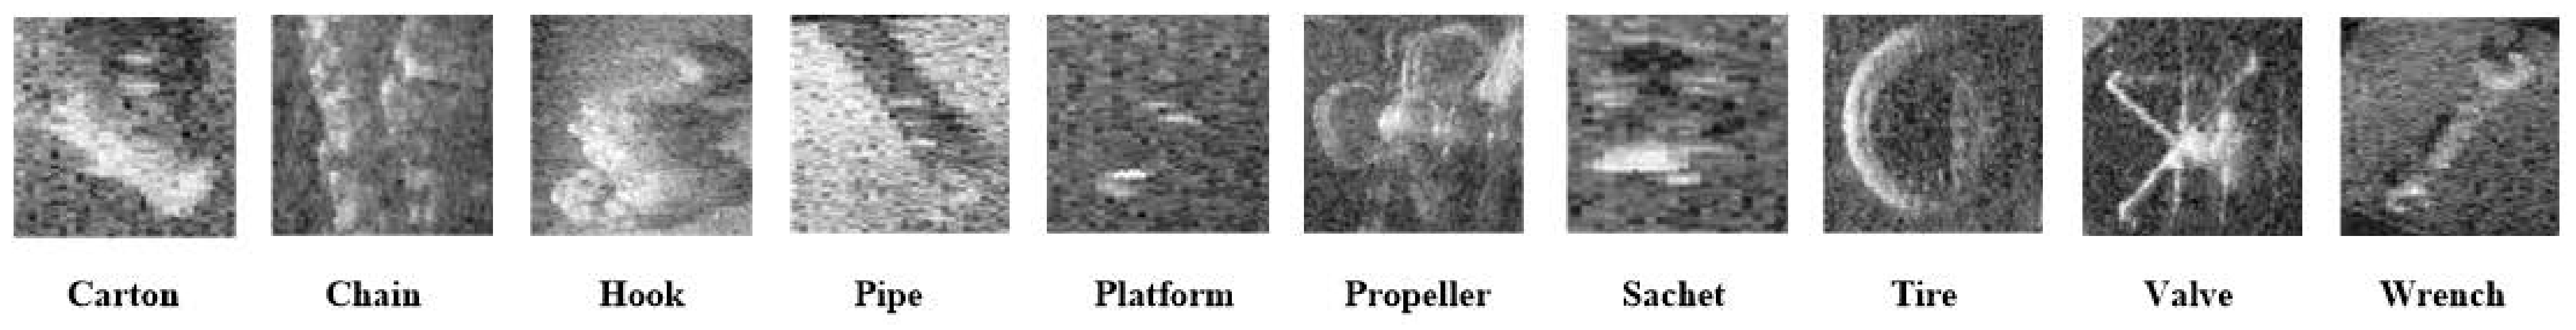
In order to verify the efficacy of the proposed method for target recognition of additional categories and generalization of recognition performance across multiple sonar datasets, the FLS dataset was selected to validate the proposed method. FLS datasets include image data acquired by forward sonar equipment for detecting and imaging target objects. The dataset contains multiple sonar images from various scenes, encompassing the shape, size, and physical property parameters of different targets, and can comprehensively evaluate the performance of the proposed approach. This study uses FLS datasets for training and testing and divides the dataset into training and test sets. The training set is utilized to train the model during the training stage, and then the model’s recognition accuracy performance index is evaluated on the test set by using the trained model. The FLS dataset contains 3192 samples representing 10 distinct target categories. The training set includes 2231 samples, while the test set contains 961 samples. Figure 11 depicts a data sample graph to facilitate a more intuitive presentation of the FLS dataset sample information. Moreover, Table 10 shows the identification outcomes for 10 categories of FLS dataset objects.
Table 10 shows that the recognition rates of DenseNet-201, DenseNet-121, and DenseNet-169 are 89.07%, 88.87%, and 89.91%, respectively, slightly higher than those obtained with the ResNet series algorithms. DenseNet and ResNet algorithms exhibit recognition rates above 88%. Among the reference algorithms, VGG-16 achieves the highest OA = 90.63%, and VGG-19 performs the lowest, with OA = 85.22%. However, from an image quality perspective, the signal-to-noise ratio of FLS images is low, and noise interference is substantial, resulting in a downward trend in the overall effect of target recognition. The intersection point-to-point key feature extraction method adopted in this approach can extract the most critical features in the target image via two key feature extraction methods, improving the robustness of the recognition impact. The proposed method outperforms all comparison algorithms with an OA = 97.80%, demonstrating its good FLS target recognition behavior.
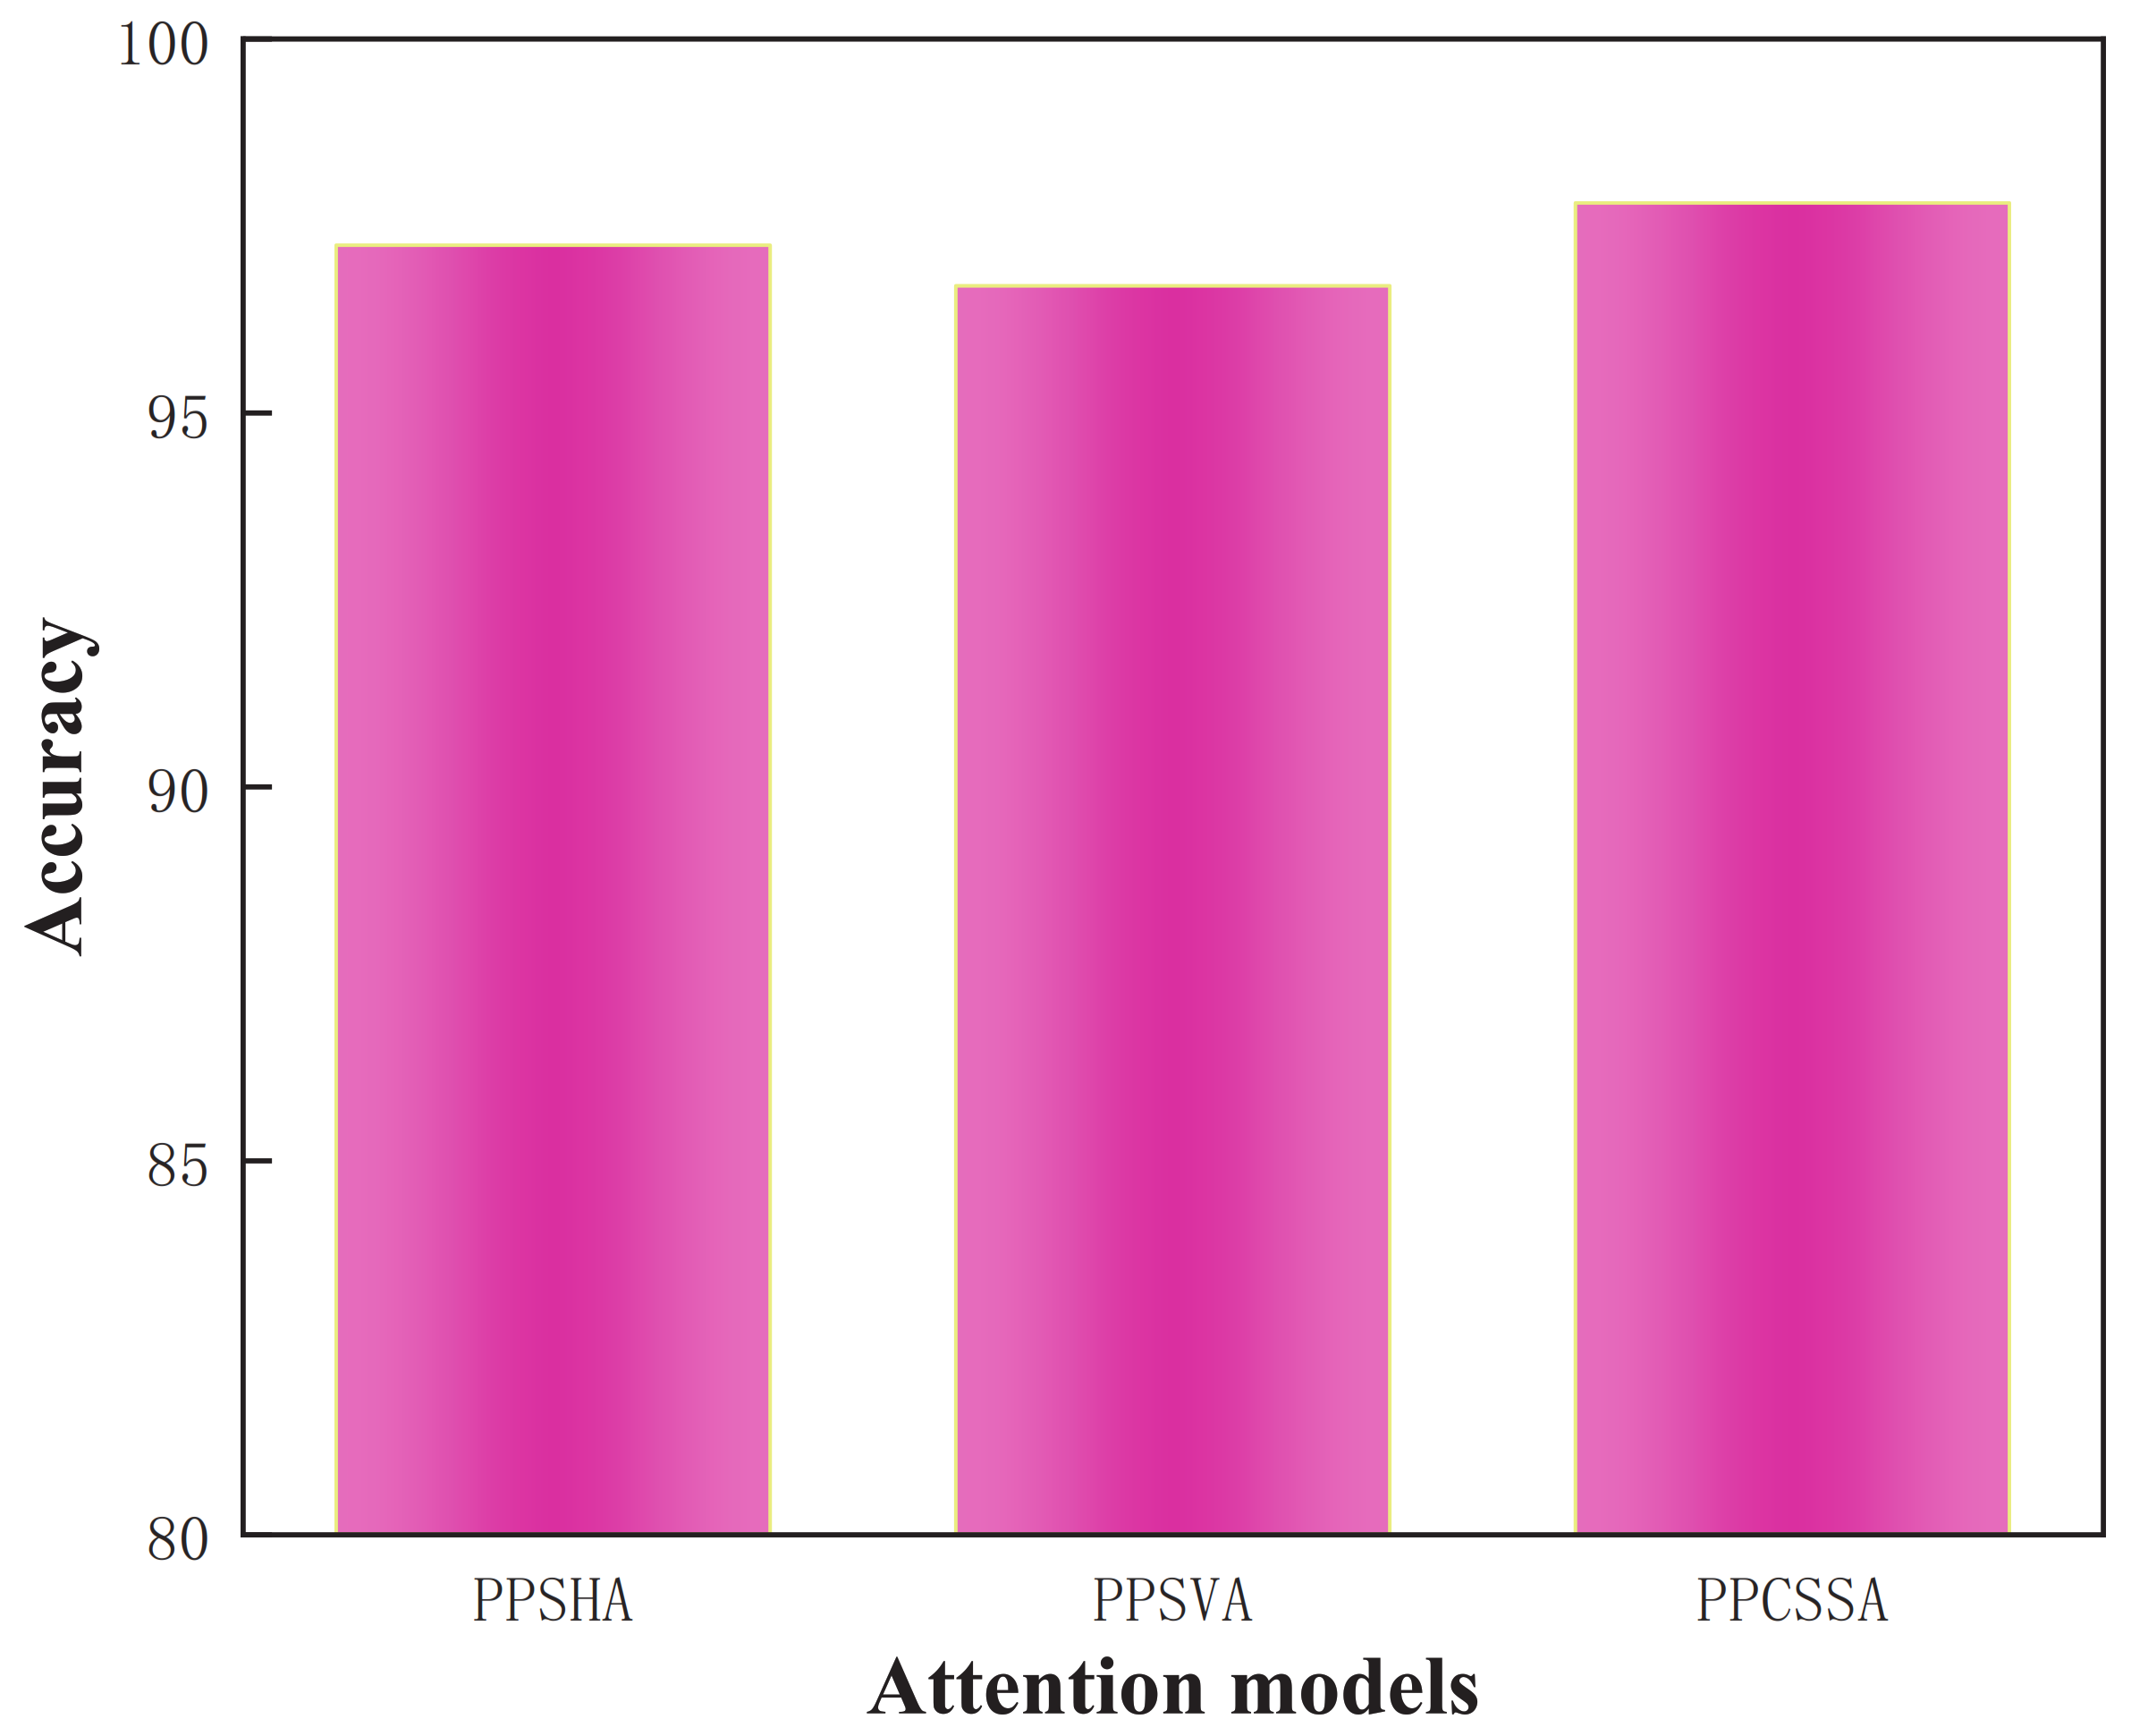
In order to further analyze the recognition performance of the proposed network model on the FLS dataset, the network model was decomposed into three important feature extraction models (PPSHA, PPSVA, and PPCSSA). Next, the advantages of the proposed model in FLS target recognition were analyzed through ablation experiments on the three models. The experimental results are presented in Table 11 and Figure 12.
Table 11 and Figure 12 show that, with the VGG-19 network as the backbone network, only the key features in the horizontal direction of the image were extracted, the recognition accuracy was found to be 97.24%, and the key features in the vertical direction were extracted with the recognition accuracy of 96.70%. The second-order key feature extraction method with point-to-point crossover was adopted, and the recognition accuracy was 97.80%. This shows that this method can extract the key features in all directions, reduce the influence of interference features, and exhibit the best recognition effect.

5. Discussion

In order to address the issue of inadequate training data in DL-based object recognition techniques, this study introduces a multi-modal data transfer strategy. Given the mode data type constraints, this study also develops an SSS target recognition approach utilizing the PPCSSA model. This attention model can extract pivotal features of SSS targets, thereby enhancing the SSS target recognition ability.
In summary, the proposed method offers several significant advantages and contributions compared to existing methods, as outlined below:
  • The introduced SSS target transfer identification approach, grounded in the PPCSSA model, demonstrates superior performance for small sample datasets, which are challenging to obtain. Moreover, it addresses the issue of insufficient modal sample data found in current multi-modal sample data transfer strategies.
  • This study employs the point-to-point attention model and introduces the crossed self-supervised attention technique. The suggested approach can extract critical features from target-domain data through data sample transfer, offering a novel solution and research pathway for underwater target transfer recognition.
  • Incorporation of the second-order attention model in the proposed technique results in improved extraction of essential features, decreases feature redundancy for recognition, and strengthens the robustness and anti-interference abilities of the features.
  • The method used in this study exhibits a certain universality and can improve all the image data; nonetheless, the degree of effect of improvement is different. In the imaging process of the SSS image, the complete image of the target is obtained by splicing the track of the measurement line of the carrier. In this process, the fuzzy interference in the horizontal direction is relatively large. Moreover, the remote sound intensity of the SSS beam attenuates due to the increase in sound propagation distance, resulting in a decrease in the contrast in the vertical direction of the image. In this study, the key features extracted from the horizontal direction can extract the useful information in the horizontal direction under the condition of horizontal fuzzy interference. By contrast, the key features extracted from the vertical direction can extract the useful information in the vertical direction under the condition of contrast reduction. The self-supervised second-order feature extraction method can consider the key features of both sides at the same time, and based on this, can improve the recognition performance of SSS image objects.
However, the proposed approach offers certain limitations. Although the method yielded promising experimental results, the data category count was limited. Consequently, the target recognition effectiveness could wane with the increase in the number of sample categories. Therefore, designing a deep network model that can remove redundant features while retaining crucial ones is imperative for enhancing the discriminative power of image features.
Furthermore, the datasets employed in this research were exclusively supervised training sets, with target images in the dataset directly correlating with their respective classes. For a weakly supervised training set, given that the target pertains to an indistinct category, the recognition performance of the proposed method can decline. Thus, design of a semi-supervised homogeneous target clustering recognition network becomes essential to bolstering target recognition outcomes.

6. Conclusions

In order to tackle the challenges of insufficient sample data and suboptimal network training prevalent in existing SSS underwater image target identification methods, this research introduces a multi-modal sample transfer method. Moreover, a point-to-point second-order crossover attention model is presented to alleviate the difficulties of crucial feature extraction from small sample SSS images due to constrained modal data types. This model discerns salient horizontal and vertical feature maps of images by extracting notable features from rows and columns of each image. Subsequently, the crucial second-order crossover-attention features are derived from the original image, which aid in leveraging horizontal and vertical cross-feature maps to ascertain the features, thereby achieving robustness and minimal redundancy and enhancing target recognition. Experimental findings underscore the precise identification prowess of the proposed technique in distinguishing underwater shipwrecks, aircraft debris, and seafloor terrain. The insight garnered from this research can furnish theoretical backing for developing more precise underwater target identification methods. Nevertheless, refinement of the diversity of SSS target data and enhancement in the quality of SSS images through techniques such as image denoising, resolution enhancement, and image deblurring can further amplify the target recognition efficiency of the proposed method.

Author Contributions

Conceptualization, J.W. (Jian Wang) and H.L.; methodology, J.W. (Jian Wang) and J.W. (Jing Wang); software, J.W. (Jian Wang); validation, J.W. (Jian Wang) and H.L.; formal analysis, J.W. (Jian Wang) and C.D.; investigation, J.W. (Jian Wang) and T.X.; resources, H.L.; data curation, B.Z.; writing—original draft preparation, J.W. (Jian Wang); writing—review and editing, J.W. (Jian Wang) and H.L.; visualization, J.W. (Jian Wang); supervision, C.D. and H.L.; project administration, J.W. (Jing Wang) and H.L.; funding acquisition, H.L. All authors have read and agreed to the published version of the manuscript.

Funding

This research was funded by the National Natural Science Foundation of China under grant nos. U190620140 and 2021YFC3101803; in part by the Natural Science Foundation of Heilongjiang Province, under grant no. ZD2020D001; and in part by the key areas of research and development plan key projects of Guangdong Province under grant no. 2020B1111010002.

Acknowledgments

We would like to thank Guanying Huo, L-3 Klein Associates, EdgeTech, Lcocean, Hydro-tech Marine, and Tritech for their great support in providing the valuable real side-scan sonar images.

Conflicts of Interest

The authors declare no conflict of interest.

References

  1. Xu, G.; Shi, Y.; Sun, X.; Shen, W. Internet of things in marine environment monitoring: A review. Sensors 2019, 19, 1711. [Google Scholar] [CrossRef] [PubMed]
  2. Jin, L.; Liang, H.; Yang, C. Accurate underwater ATR in forward-looking sonar imagery using deep convolutional neural networks. IEEE Access 2019, 7, 125522–125531. [Google Scholar] [CrossRef]
  3. Zhang, Y.; Zhang, H.; Liu, J.; Zhang, S.; Liu, Z.; Lyu, E.; Chen, W. Submarine pipeline tracking technology based on AUVs with forward looking sonar. Appl. Ocean. Res. 2022, 122, 103128. [Google Scholar] [CrossRef]
  4. Bhanu, B. Automatic target recognition: State of the art survey. IEEE Trans. Aerosp. Electron. Syst. 1986, AES-22, 364–379. [Google Scholar] [CrossRef]
  5. Chaillan, F.; Fraschini, C.; Courmontagne, P. Speckle noise reduction in SAS imagery. Signal Process. 2007, 87, 762–781. [Google Scholar] [CrossRef]
  6. Kazimierski, W.; Zaniewicz, G. Determination of process noise for underwater target tracking with forward looking sonar. Remote Sens. 2021, 13, 1014. [Google Scholar] [CrossRef]
  7. Pinto, M.A. Split-beam range-gated Doppler velocity sonar for operations at high altitude above the seabed. In Proceedings of the OCEANS 2018 MTS/IEEE Charleston, Charleston, SC, USA, 22–25 October 2018; pp. 1–6. [Google Scholar]
  8. Pinto, M.A.; Verrier, L. Interferometric Doppler Velocity Sonar for Low Bias Long Range Estimation of Speed Over Seabed. IEEE J. Ocean. Eng. 2022, 47, 767–779. [Google Scholar] [CrossRef]
  9. Topple, J.M.; Fawcett, J.A. MiNet: Efficient deep learning automatic target recognition for small autonomous vehicles. IEEE Geosci. Remote Sens. Lett. 2020, 18, 1014–1018. [Google Scholar] [CrossRef]
  10. Lin, Z.; Ji, K.; Leng, X.; Kuang, G. Squeeze and excitation rank faster R-CNN for ship detection in SAR images. IEEE Geosci. Remote Sens. Lett. 2018, 16, 751–755. [Google Scholar] [CrossRef]
  11. Zhang, T.; Zhang, X.; Shi, J.; Wei, S. High-speed ship detection in SAR images by improved yolov3. In Proceedings of the 2019 IEEE 16th International Computer Conference on Wavelet Active Media Technology and Information Processing, Chengdu, China, 13–15 December 2019; pp. 149–152. [Google Scholar]
  12. Dobeck, G.J.; Hyland, J.C.; Smedley, L. Automated detection and classification of sea mines in sonar imagery. In Proceedings of the Detection and Remediation Technologies for Mines and Minelike Targets II, Orlando, FL, USA, 21–24 April 1997; SPIE: Bellingham, WA, USA, 1997; Volume 3079, pp. 90–110. [Google Scholar]
  13. Wan, S.; Yeh, M.L.; Ma, H.L. An innovative intelligent system with integrated CNN and SVM: Considering various crops through hyperspectral image data. ISPRS Int. J. Geo-Inf. 2021, 10, 242. [Google Scholar] [CrossRef]
  14. Çelebi, A.T.; Güllü, M.K.; Ertürk, S. Mine detection in side scan sonar images using Markov Random Fields with brightness compensation. In Proceedings of the 2011 IEEE 19th Signal Processing and Communications Applications Conference (SIU), Antalya, Turkey, 20–22 April 2011; pp. 916–919. [Google Scholar]
  15. Ye, X.; Li, C.; Zhang, S.; Yang, P.; Li, X. Research on side-scan sonar image target classification method based on transfer learning. In Proceedings of the OCEANS 2018 MTS/IEEE Charleston, Charleston, SC, USA, 22–25 October 2018; pp. 1–6. [Google Scholar]
  16. Huo, G.; Wu, Z.; Li, J. Underwater object classification in sidescan sonar images using deep transfer learning and semisynthetic training data. IEEE Access 2020, 8, 47407–47418. [Google Scholar] [CrossRef]
  17. Luo, X.; Qin, X.; Wu, Z.; Yang, F.; Wang, M.; Shang, J. Sediment classification of small-size seabed acoustic images using convolutional neural networks. IEEE Access 2019, 7, 98331–98339. [Google Scholar] [CrossRef]
  18. Qin, X.; Luo, X.; Wu, Z.; Shang, J. Optimizing the sediment classification of small side-scan sonar images based on deep learning. IEEE Access 2021, 9, 29416–29428. [Google Scholar] [CrossRef]
  19. Gerg, I.D.; Monga, V. Structural prior driven regularized deep learning for sonar image classification. IEEE Trans. Geosci. Remote Sens. 2021, 60, 1–16. [Google Scholar] [CrossRef]
  20. Zhang, P.; Tang, J.; Zhong, H.; Ning, M.; Liu, D.; Wu, K. Self-trained target detection of radar and sonar images using automatic deep learning. IEEE Trans. Geosci. Remote Sens. 2021, 60, 1–14. [Google Scholar] [CrossRef]
  21. Simonyan, K.; Zisserman, A. Very deep convolutional networks for large-scale image recognition. arXiv 2014, arXiv:1409.1556. [Google Scholar]
  22. Krizhevsky, A.; Sutskever, I.; Hinton, G.E. Imagenet classification with deep convolutional neural networks. Commun. ACM 2017, 60, 84–90. [Google Scholar] [CrossRef]
  23. He, K.; Zhang, X.; Ren, S.; Sun, J. Deep residual learning for image recognition. In Proceedings of the IEEE Conference on Computer Vision and Pattern Recognition, Las Vegas, NV, USA, 26 June 26–1 July 2016; pp. 770–778. [Google Scholar]
  24. Xu, S.; Qiu, X.; Wang, C.; Zhong, L.; Yuan, X. Desnet: Deep residual networks for Descalloping of ScanSar images. In Proceedings of the IGARSS 2018—2018 IEEE International Geoscience and Remote Sensing Symposium, Valencia, Spain, 22–27 July 2018; pp. 8929–8932. [Google Scholar]
  25. Wu, Z.; Shen, C.; Van Den Hengel, A. Wider or deeper: Revisiting the resnet model for visual recognition. Pattern Recognit. 2019, 90, 119–133. [Google Scholar] [CrossRef]
  26. Qiu, C.; Zhou, W. A survey of recent advances in CNN-based fine-grained visual categorization. In Proceedings of the 2020 IEEE 20th International Conference on Communication Technology (ICCT), Nanning, China, 28–31 October 2020; pp. 1377–1384. [Google Scholar]
  27. Yu, F.; Koltun, V. Multi-scale context aggregation by dilated convolutions. arXiv 2015, arXiv:1511.07122. [Google Scholar]
  28. Chen, L.C.; Papandreou, G.; Kokkinos, I.; Murphy, K.; Yuille, A.L. Deeplab: Semantic image segmentation with deep convolutional nets, atrous convolution, and fully connected crfs. IEEE Trans. Pattern Anal. Mach. Intell. 2017, 40, 834–848. [Google Scholar] [CrossRef]
  29. Zhao, H.; Shi, J.; Qi, X.; Wang, X.; Jia, J. Pyramid scene parsing network. In Proceedings of the IEEE Conference on Computer Vision and Pattern Recognition, Honolulu, HI, USA, 21–26 July 2017; pp. 2881–2890. [Google Scholar]
  30. Dai, J.; Qi, H.; Xiong, Y.; Li, Y.; Zhang, G.; Hu, H.; Wei, Y. Deformable convolutional networks. In Proceedings of the IEEE International Conference on Computer Vision, Venice, Italy, 22–29 October 2017; pp. 764–773. [Google Scholar]
  31. Deng, J.; Dong, W.; Socher, R.; Li, L.J.; Li, K.; Fei-Fei, L. Imagenet: A large-scale hierarchical image database. In Proceedings of the 2009 IEEE Conference on Computer Vision and Pattern Recognition, Miami, FL, USA, 20–25 June 2009; pp. 248–255. [Google Scholar]
  32. He, K.; Girshick, R.; Dollár, P. Rethinking imagenet pre-training. In Proceedings of the IEEE/CVF International Conference on Computer Vision, Seoul, Republic of Korea, 27 October–2 November 2019; pp. 4918–4927. [Google Scholar]
  33. Chandrashekar, G.; Raaza, A.; Rajendran, V.; Ravikumar, D. Side scan sonar image augmentation for sediment classification using deep learning based transfer learning approach. Mater. Today Proc. 2023, 80, 3263–3273. [Google Scholar] [CrossRef]
  34. Ji-yang, Y.; Dan, H.; Lu-yuan, W.; Xin, L.; Wen-juan, L. On-board ship targets detection method based on multi-scale salience enhancement for remote sensing image. In Proceedings of the 2016 IEEE 13th International Conference on Signal Processing (ICSP), Chengdu, China, 6–10 November 2016; pp. 217–221. [Google Scholar]
  35. Ren, S.; He, K.; Girshick, R.; Sun, J. Faster r-cnn: Towards real-time object detection with region proposal networks. In Proceedings of the Advances in Neural Information Processing Systems 28 (NIPS 2015), Montreal, QC, USA, 7–12 December 2015. [Google Scholar]
  36. Yulin, T.; Jin, S.; Bian, G.; Zhang, Y. Shipwreck target recognition in side-scan sonar images by improved YOLOv3 model based on transfer learning. IEEE Access 2020, 8, 173450–173460. [Google Scholar] [CrossRef]
  37. Fuchs, L.R.; Gällström, A.; Folkesson, J. Object recognition in forward looking sonar images using transfer learning. In Proceedings of the 2018 IEEE/OES Autonomous Underwater Vehicle Workshop (AUV), Porto, Portugal, 6–9 November 2018; pp. 1–6. [Google Scholar]
  38. Zhang, H.; Tian, M.; Shao, G.; Cheng, J.; Liu, J. Target detection of forward-looking sonar image based on improved yolov5. IEEE Access 2022, 10, 18023–18034. [Google Scholar] [CrossRef]
  39. Ge, Q.; Ruan, F.; Qiao, B.; Zhang, Q.; Zuo, X.; Dang, L. Side-scan sonar image classification based on style transfer and pre-trained convolutional neural networks. Electronics 2021, 10, 1823. [Google Scholar] [CrossRef]
  40. Cheng, Z.; Huo, G.; Li, H. A multi-domain collaborative transfer learning method with multi-scale repeated attention mechanism for underwater side-scan sonar image classification. Remote Sens. 2022, 14, 355. [Google Scholar] [CrossRef]
  41. Wang, J.; Li, H.; Huo, G.; Li, C.; Wei, Y. Multi-Mode Channel Position Attention Fusion Side-Scan Sonar Transfer Recognition. Electronics 2023, 12, 791. [Google Scholar] [CrossRef]
  42. Zhou, T.; Si, J.; Wang, L.; Xu, C.; Yu, X. Automatic detection of underwater small targets using forward-looking sonar images. IEEE Trans. Geosci. Remote Sens. 2022, 60, 1–12. [Google Scholar] [CrossRef]
  43. Fan, Z.; Xia, W.; Liu, X.; Li, H. Detection and segmentation of underwater objects from forward-looking sonar based on a modified Mask RCNN. Signal Image Video Process. 2021, 15, 1135–1143. [Google Scholar] [CrossRef]
  44. Nadimi, N.; Javidan, R.; Layeghi, K. Efficient detection of underwater natural gas pipeline leak based on synthetic aperture sonar (SAS) systems. J. Mar. Sci. Eng. 2021, 9, 1273. [Google Scholar] [CrossRef]
  45. Thomas, B.; Hunter, A. Coherence-induced bias reduction in synthetic aperture sonar along-track micronavigation. IEEE J. Ocean. Eng. 2021, 47, 162–178. [Google Scholar] [CrossRef]
  46. Zhang, X.; Yang, P.; Zhou, M. Multireceiver SAS imagery with generalized PCA. IEEE Geosci. Remote Sens. Lett. 2023, 20, 1502205. [Google Scholar] [CrossRef]
  47. Huang, P.; Yang, P. Synthetic aperture imagery for high-resolution imaging sonar. Front. Mar. Sci. 2022, 9, 1049761. [Google Scholar] [CrossRef]
Figure 1. Structure of the proposed optical and SSS data fusion target transfer recognition network.
Remotesensing 15 04517 g001
Figure 2. The VGG-19 network structure.
Remotesensing 15 04517 g002
Figure 3. An illustration of the PPSHA model defined by Equation (2), where  M = 3  and  L = 2 .
Remotesensing 15 04517 g003
Figure 4. An illustration of the PPSVA model defined by using Equation (4), where  M = 3  and  L = 2 .
Remotesensing 15 04517 g004
Figure 5. The structure of the proposed channel-by-channel second-order crossover self-attention model.
Remotesensing 15 04517 g005
Figure 6. Samples of images in the dataset obtained with SSS.
Remotesensing 15 04517 g006
Figure 7. The image transformation results: (a) the original image; (b) center cropping; (c) bottom left cropping; (d) top left cropping; (e) bottom right cropping; (f) top right cropping; (g) equal height stretching; (h) equal width stretching; (i) contrast transformation (gamma = 0.87); (j) contrast transformation (gamma = 1.07); (k) clockwise rotation by 45°; (l) clockwise rotation by 90°; (m) clockwise rotation by 135°; (n) clockwise rotation by 180°; (o) clockwise rotation by 225°; (p) clockwise rotation by 270°; (q) clockwise rotation by 315°; (r) left and right flipping.
Remotesensing 15 04517 g007
Figure 8. The SSS target recognition results of traditional deep models: (a) DenseNet series models; (b) ResNet series models; (c) VGGNet series models.
Remotesensing 15 04517 g008
Figure 9. (a) small scale crashed aircraft (b) ambiguity crashed aircraft (c) ambiguous shipwreck (d) low contrast shipwreck (e) low contrast shipwreck (f) small scale shipwreck. Example of misrecognition of classic deep learning object recognition.
Remotesensing 15 04517 g009
Figure 10. The SSS target recognition results of the TL-based deep models: (a) DenseNet models; (b) ResNet models; (c) VGGNet models; (d) AlexNet and GoogleNet models.
Remotesensing 15 04517 g010
Figure 11. Forward-looking sonar dataset sample diagram.
Remotesensing 15 04517 g011
Figure 12. Comparison results of ablation experiments performed using FLS datasets.
Remotesensing 15 04517 g012
Table 1. The advantages and disadvantages of traditional TL and this method.
MethodsAdvantagesDisadvantages
Traditional TLThe model structure is simple, and the algorithm is easy to implement.Cross-point-to-point self-supervised key feature extraction technology enhances key features and suppresses redundant features.
Present MethodCross-point-to-point self-supervised key feature extraction technology enhances key features and suppresses redundant features.The model structure is complex, and the algorithm is difficult to implement.
Table 2. The VGG-19 network parameter settings.
Layer NameOutput SizeVGG-19
conv1_ x ( x = 1 , 2 ) 112 × 1123 × 3, 64
max pool
conv2_ x ( x = 1 , 2 ) 56 × 563 × 3, 128
max pool
conv3_ x ( x = 1 , 2 , 3 , 4 ) 28 × 283 × 3, 256
max pool
conv4_ x ( x = 1 , 2 , 3 , 4 ) 14 × 143 × 3, 512
max pool
conv5_ x ( x = 1 , 2 , 3 , 4 ) 7 × 73 × 3, 512
max pool
output4096-d7 × 7, 4096
4096-d1 × 1, 4096
1000-d1 × 1, 1000
1000-dSoftmax
Table 3. Specific data allocation for each target category.
CategoryPlaneShipOther Target Types
Number of Images
Total66484578
Dataset division: training set 70% and test set 30%
Training46338404
Test20146174
Table 4. Comparison results of different DL models in the SSS image object recognition.
ModelOA (%)
DenseNet-20195.02
DenseNet-12195.13
DenseNet-16996.15
ResNet-5091.28
ResNet-10196.41
ResNet-15295.13
VGG-1692.56
VGG-1992.56
Note: The number next to the model name represents the number of layers in the corresponding network model.
Table 5. The SSS transfer recognition results for different backbone networks.
Backbone NetworkOA (%)
ResNet-1891.86
ResNet-5093.5
ResNet-15298.21
ResNet-10198.46
DenseNet-12196.41
DenseNet-16991.54
DenseNet-20189.23
VGG-1698.46
VGG-1994.67
AlexNet94.14
GoogleNet94.46
Proposed99.28
Table 6. The SSS image recognition results from different methods.
MethodOA (%)
Shallow CNN [17]83.19
GoogleNet [18]94.46
VGG-11 fine-tuning + semi-synthetic data [15]92.51
VGG-19 fine-tuning [16]94.67
VGG-19 fine-tuning + semi-synthetic data [16]97.76
SPDRDL [19]97.38
FL-DARTS [20]99.07
Proposed99.28
Table 7. The ablation experiments’ results for the PPSHA, PPSVA, and PPCSSA models.
AttentionPPSHAPPSVAPPCSSAOA (%)
Backbone
VGG-19 98.51
98.01
99.28
Table 8. Comparative experiments for different attention mechanisms.
Attention MethodsOA (%)
Channel Attention [41]97.69
Location Attention [41]97.18
Channel + Location Attention [41]98.72
Proposed Attention99.28
Table 9. Comparison results of the methods with different backbone networks in the SSS strong-noise image target recognition.
Backbone NetworkAccuracy (%)
VGG95.5
ResNet92.68
DenseNet91.63
Proposed98.16
Table 10. Comparison of different DL models for FLS image object recognition.
MethodsOA (%)
DenseNet-20189.07
DenseNet-12188.87
DenseNet-16989.91
ResNet-5089.49
ResNet-10188.14
ResNet-15288.03
VGG-1690.63
VGG-1985.22
Proposed97.80
Table 11. Results of ablation experiments performed by using the FLS dataset with the PPSHA, PPSVA, and PPCSSA models.
AttentionPPSHAPPSVAPPCSSAOA (%)
Backbone
VGG-19 97.24
96.70
97.80
Disclaimer/Publisher’s Note: The statements, opinions and data contained in all publications are solely those of the individual author(s) and contributor(s) and not of MDPI and/or the editor(s). MDPI and/or the editor(s) disclaim responsibility for any injury to people or property resulting from any ideas, methods, instructions or products referred to in the content.

