Technical Note

Landscape Ecological Risk Assessment and Analysis of Influencing Factors in Selenga River Basin

1
School of Civil Engineering, Lanzhou University of Technology, Lanzhou 730050, China
2
Emergency Mapping Engineering Research Center of Gansu, Lanzhou 730050, China
3
Cryosphere Research Station on the Qinghai-Tibet Plateau, State Key Laboratory of Cryospheric Science, Northwest Institute of Eco-Environment and Resources, Chinese Academy of Sciences, Lanzhou 730070, China
4
University of Chinese Academy of Sciences, Beijing 100049, China
*
Author to whom correspondence should be addressed.
Remote Sens. 2023, 15(17), 4262; https://doi.org/10.3390/rs15174262
Submission received: 1 July 2023 / Revised: 23 August 2023 / Accepted: 29 August 2023 / Published: 30 August 2023

Abstract

:
Land degradation under the influence of global warming and ecological environmental destruction due to poor land management is the main challenge facing the Mongolian Plateau, and its future ecological risk change trends and drivers are also unclear. Therefore, to address the context relevant to this challenge, planning based on measured information from land use patterns is required. Based on land use and land cover (LULC), this study evaluates the landscape ecological risk (LER) of the Selenga River Basin by calculating the landscape pattern index. The spatiotemporal pattern and influencing factors of landscape ecological risk in the Selenga River Basin from 1990 to 2040 were analyzed. According to the results of LULC analysis, forest and grassland were the primary land use types in the Selenga River Basin. The built area, forest, and cropland showed an increasing trend, while the grassland area showed a fluctuating decreasing trend. From 1990 to 2010, the comprehensive land use dynamic degree showed a trend of rising first and then falling, specifically from 0.13% in 1990 to 0.29% in 2010, and will drop to 0.06% by 2040, indicating that the range of land use change is becoming more and more stable. The landscape ecological risk assessment shows a distribution pattern of “low at the edge and high in the middle”. The landscape ecological risk index (LER) first increases and then decreases, with the peak value in 2010 (0.085). By calculating the spatial aggregation of LER and the partial correlation with climate, we found that the Moran’s I index showed an “anti-V”-shaped change trend from 1990 to 2040, and the average landscape ecological risk presents positive spatial correlation, primarily with high-value aggregation, and peaked in 2010. Precipitation had a negative correlation with landscape ecological risk controlling for temperature, while there was a positive relationship between temperature and landscape ecological risk under the influence of controlling precipitation. This study provides a scientific basis for LULC planning in the Selenga River Basin, and is of great significance for maintaining the ecological security of the Mongolian Plateau.

1. Introduction

Land is an important basic resource for human survival, and land cover change can directly reflect the degree of human activity or natural change [1,2]. The land ecosystem is the basis for achieving regional sustainable development goals and guaranteeing sustainable regional socioeconomic and agricultural development. In recent years, significant changes have occurred in the structure of global land cover, and various ecological and environmental issues have frequently occurred [3]. Land use change has proven to be a reliable perspective reflecting ecosystem change and can be used to assess ecological risk [4]. Therefore, based on regional land use changes, research on simulating future landscape ecological risks has become an academic focus.
In the past two decades, cellular automata models simulating future LULC have developed rapidly. At present, most studies on land use change simulation are based on the following two types of models. The first is the spatial causal model. Taking CLUE-S as an example, this model mainly explores the relationship between the influencing factors and land change, and then simulates future LULC. However, it cannot effectively reflect the underlying mechanisms of LULC and their influencing factors [5]. The other type of model is the discrete dynamic model, which contains a Markov model, FLUS model and cellular automata (CA). These models simulate complex land use changes by calculating the interaction between different patches, while the spatiotemporal dynamics are lacking and the spatial evolution of land use patches cannot be efficiently simulated [6,7]. Although most current studies focus on improving the pixel-by-pixel accuracy between simulation results and real LULC, they fail to take into account the spatial homogeneity of land type change [8]. Therefore, several efforts have been made to develop patch-based CAs that can simultaneously simulate land use changes in multiple adjacent homogeneous units. For example, the CA model is based on the convolutional neural network, and the vector data can simulate the actual ground objects as well as capture the fine-scale characteristics of the driving factors. However, its applicability in developing areas such as Mongolia is poor due to the lack of multi-temporal phase vector land use data [9]. The vector results may be reasonable only for some landscape indicators. The landscape-driven patch-based cellular automaton (LP-CA) model takes into account the spatial homogeneity of urban growth on a local scale, which can better describe the actual land use conversion process. However, the model has considerable errors in suburbs and other cities where there are few buildings and land use changes greatly affected by random factors [10]. In order to solve this problem, the patch-level land use simulation model (PLUS) came into being, which combines the advantages of TAS and PAS, and proposes a method that combines the cellular automata model with a plaque generation simulation strategy to simulate future LULC. This model can simulate future LULC at the patch level by mining the driving factors of multi-type land expansion [11]. Currently, PLUS models are mostly used to simulate the distribution of patch-level land use in future scenarios to estimate and integrate the value of ecological services [12].
Landscape ecological risk assessment is a method used to assess the possible adverse consequences of external disturbances on ecosystems and related components. It uses landscape pattern indices to link landscape structure with ecological processes and reflects ecological risks at the landscape level [13]. However, because the ecological benefits of different land use types differ, most scholars use ecological carrying capacity and ecological service value to evaluate them [14,15]. While both types of indicators are good at characterizing changes in risk, they do not fully assess the extent of ecological risk. In order to comprehensively reflect the landscape heterogeneity of landscape ecological risk and comprehensively reflect the impacts of human and natural factors on the ecological environment, the landscape ecological risk index (LER) is widely used [16]. It can not only emphasize the spatiotemporal heterogeneity of ecological risks and describe it quantitatively but can also evaluate and analyze the impacts of ecological risk on landscape composition and function [17]. The geographical units of landscape ecological risk assessment are primarily divided into two types, based on administrative region boundaries and natural landform boundaries [18,19]. Considering the administrative boundary as the analysis unit can be beneficial in terms of formulating corresponding risk management and control measures among different provinces, whereas considering the boundaries of natural landforms as the analysis unit can formulate risk management and control measures for different regions in line with their current situation. Currently, most local and international studies use the basin as a unit to conduct landscape ecological risk assessments and reflect ecological risk changes by calculating the LER [20]. Under the combined influence of global warming and human activities, desertification of the Mongolian Plateau is serious and vegetation has been severely degraded, which has severely threatened the ecological security of the Mongolian Plateau. As the most important region of the Mongolian Plateau, the Selenga River Basin is a typical arid/semi-arid area with a fragile ecological environment. Therefore, carrying out the landscape ecological risk assessment of the Selenga River Basin is of great significance for the ecological risk management of related arid and semi-arid areas. The result can provide a theoretical basis for dealing with uncertain and complex ecological problems in the future.
The research objectives include the following: (1) We will use the PLUS model to simulate the LULC in the Selenga River Basin in 2030 and 2040, and analyze the degree of land use dynamic change. (2) We will construct the landscape ecological risk assessment model of the Selenga River Basin and carry out ecological risk assessment to predict the spatio-temporal variation characteristics of the ecological risk of this basin in the next 20 years. (3) We will combine the semivariogram and spatial autocorrelation analysis methods to analyze the temporal and spatial variation characteristics of ecological risk in the Selenga River Basin from 1990 to 2040. In addition, we will also analyze the independent influences of temperature and precipitation on its ecological risk using partial correlation analysis. The goal of implementing the LER in this study is to provide recommendations for the management of associated ecological risks in the associated arid–semi-arid regions.

2. Materials and Methods
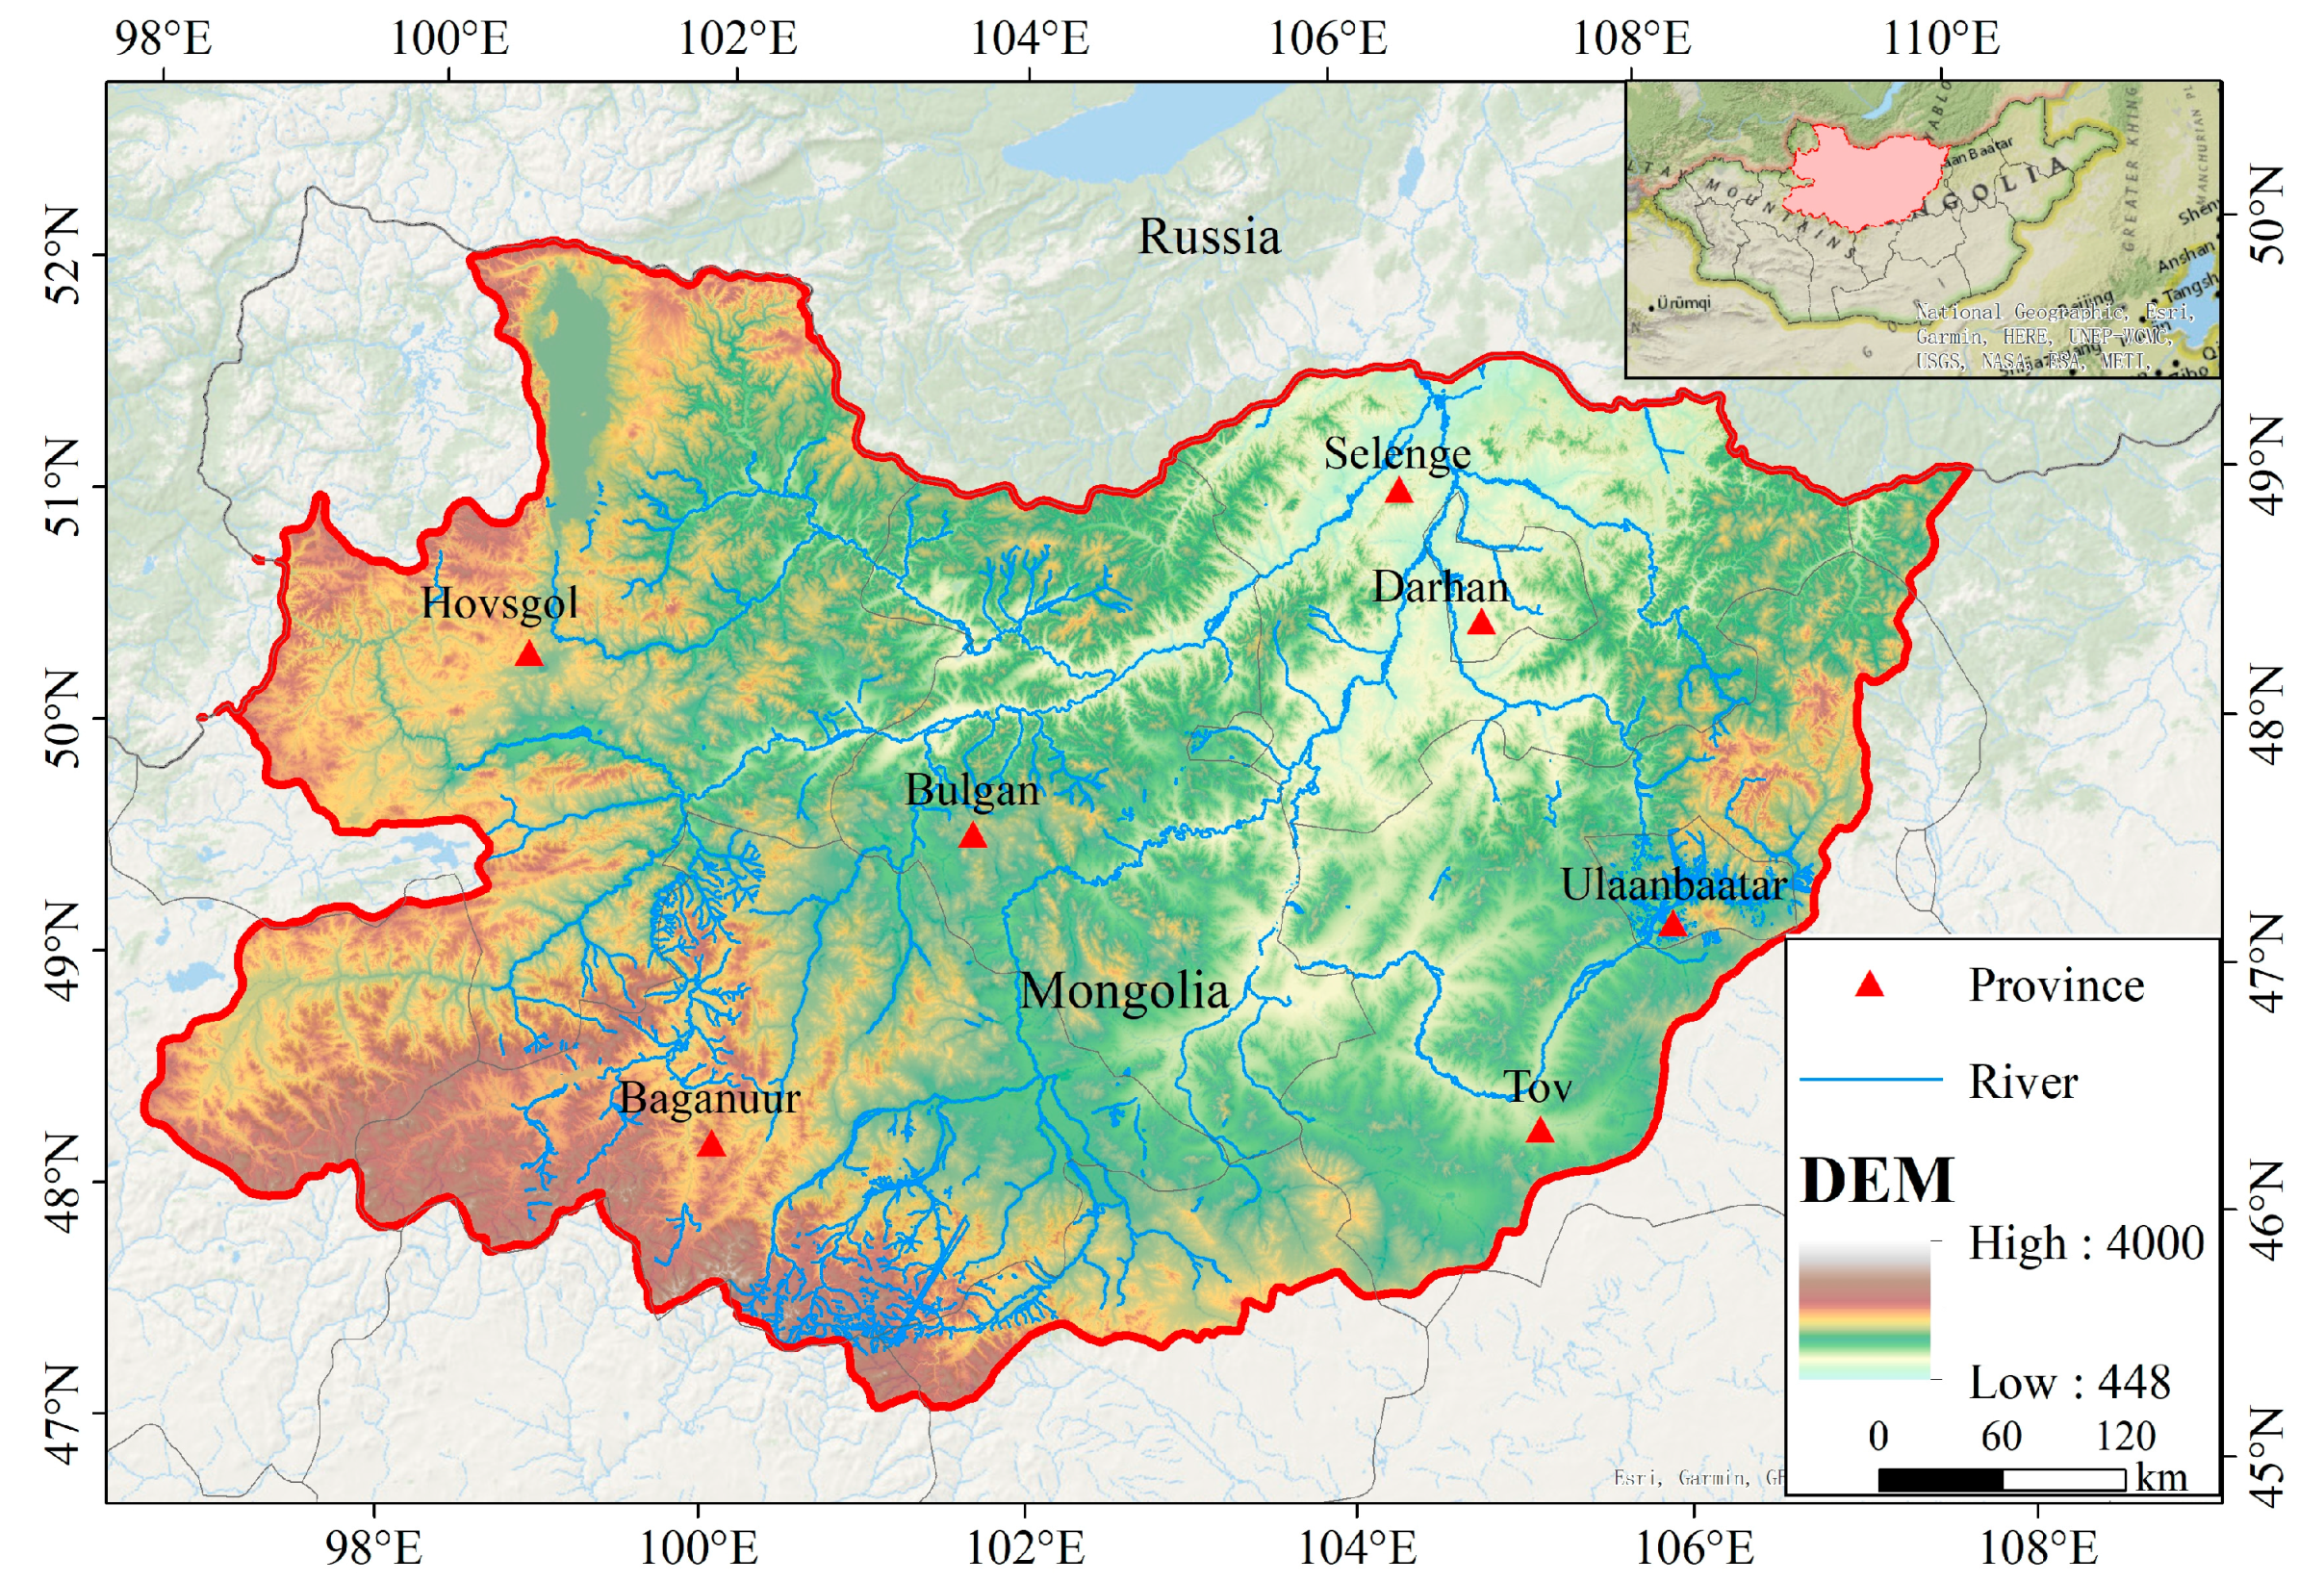
2.1. Study Area

The Selenga River Basin is located in the core of the Mongolian Plateau, and it is a crucial node of the China–Mongolia Economic Corridor and China–Mongolia cross-border high-speed railway, as well as a key area for future basin control and planning. In the Selenga River Basin, the mountains are mainly distributed in the west, with the Kent Mountains in the southeast, and most of the rest is valley plains, of which 67% of the basin area is in Mongolia [21] (Figure 1). Recently, the decline in the water levels of the Selenga and Lake Baikal has attracted widespread attention [22]. The Selenga River Basin has a typical continental climate with large temperature changes and an average annual rainfall of 250–450 mm [23]. The water system in the basin is developed and the rivers are dense, all of which belong to the Selenga River system and flow through a delta and finally into Lake Baikal, which is the channel for Mongolia to enter the Russian Asian Plain [22]. It is the most important agricultural and pastoral area of Mongolia [24], but its fragile ecological environment makes it vulnerable to damage.

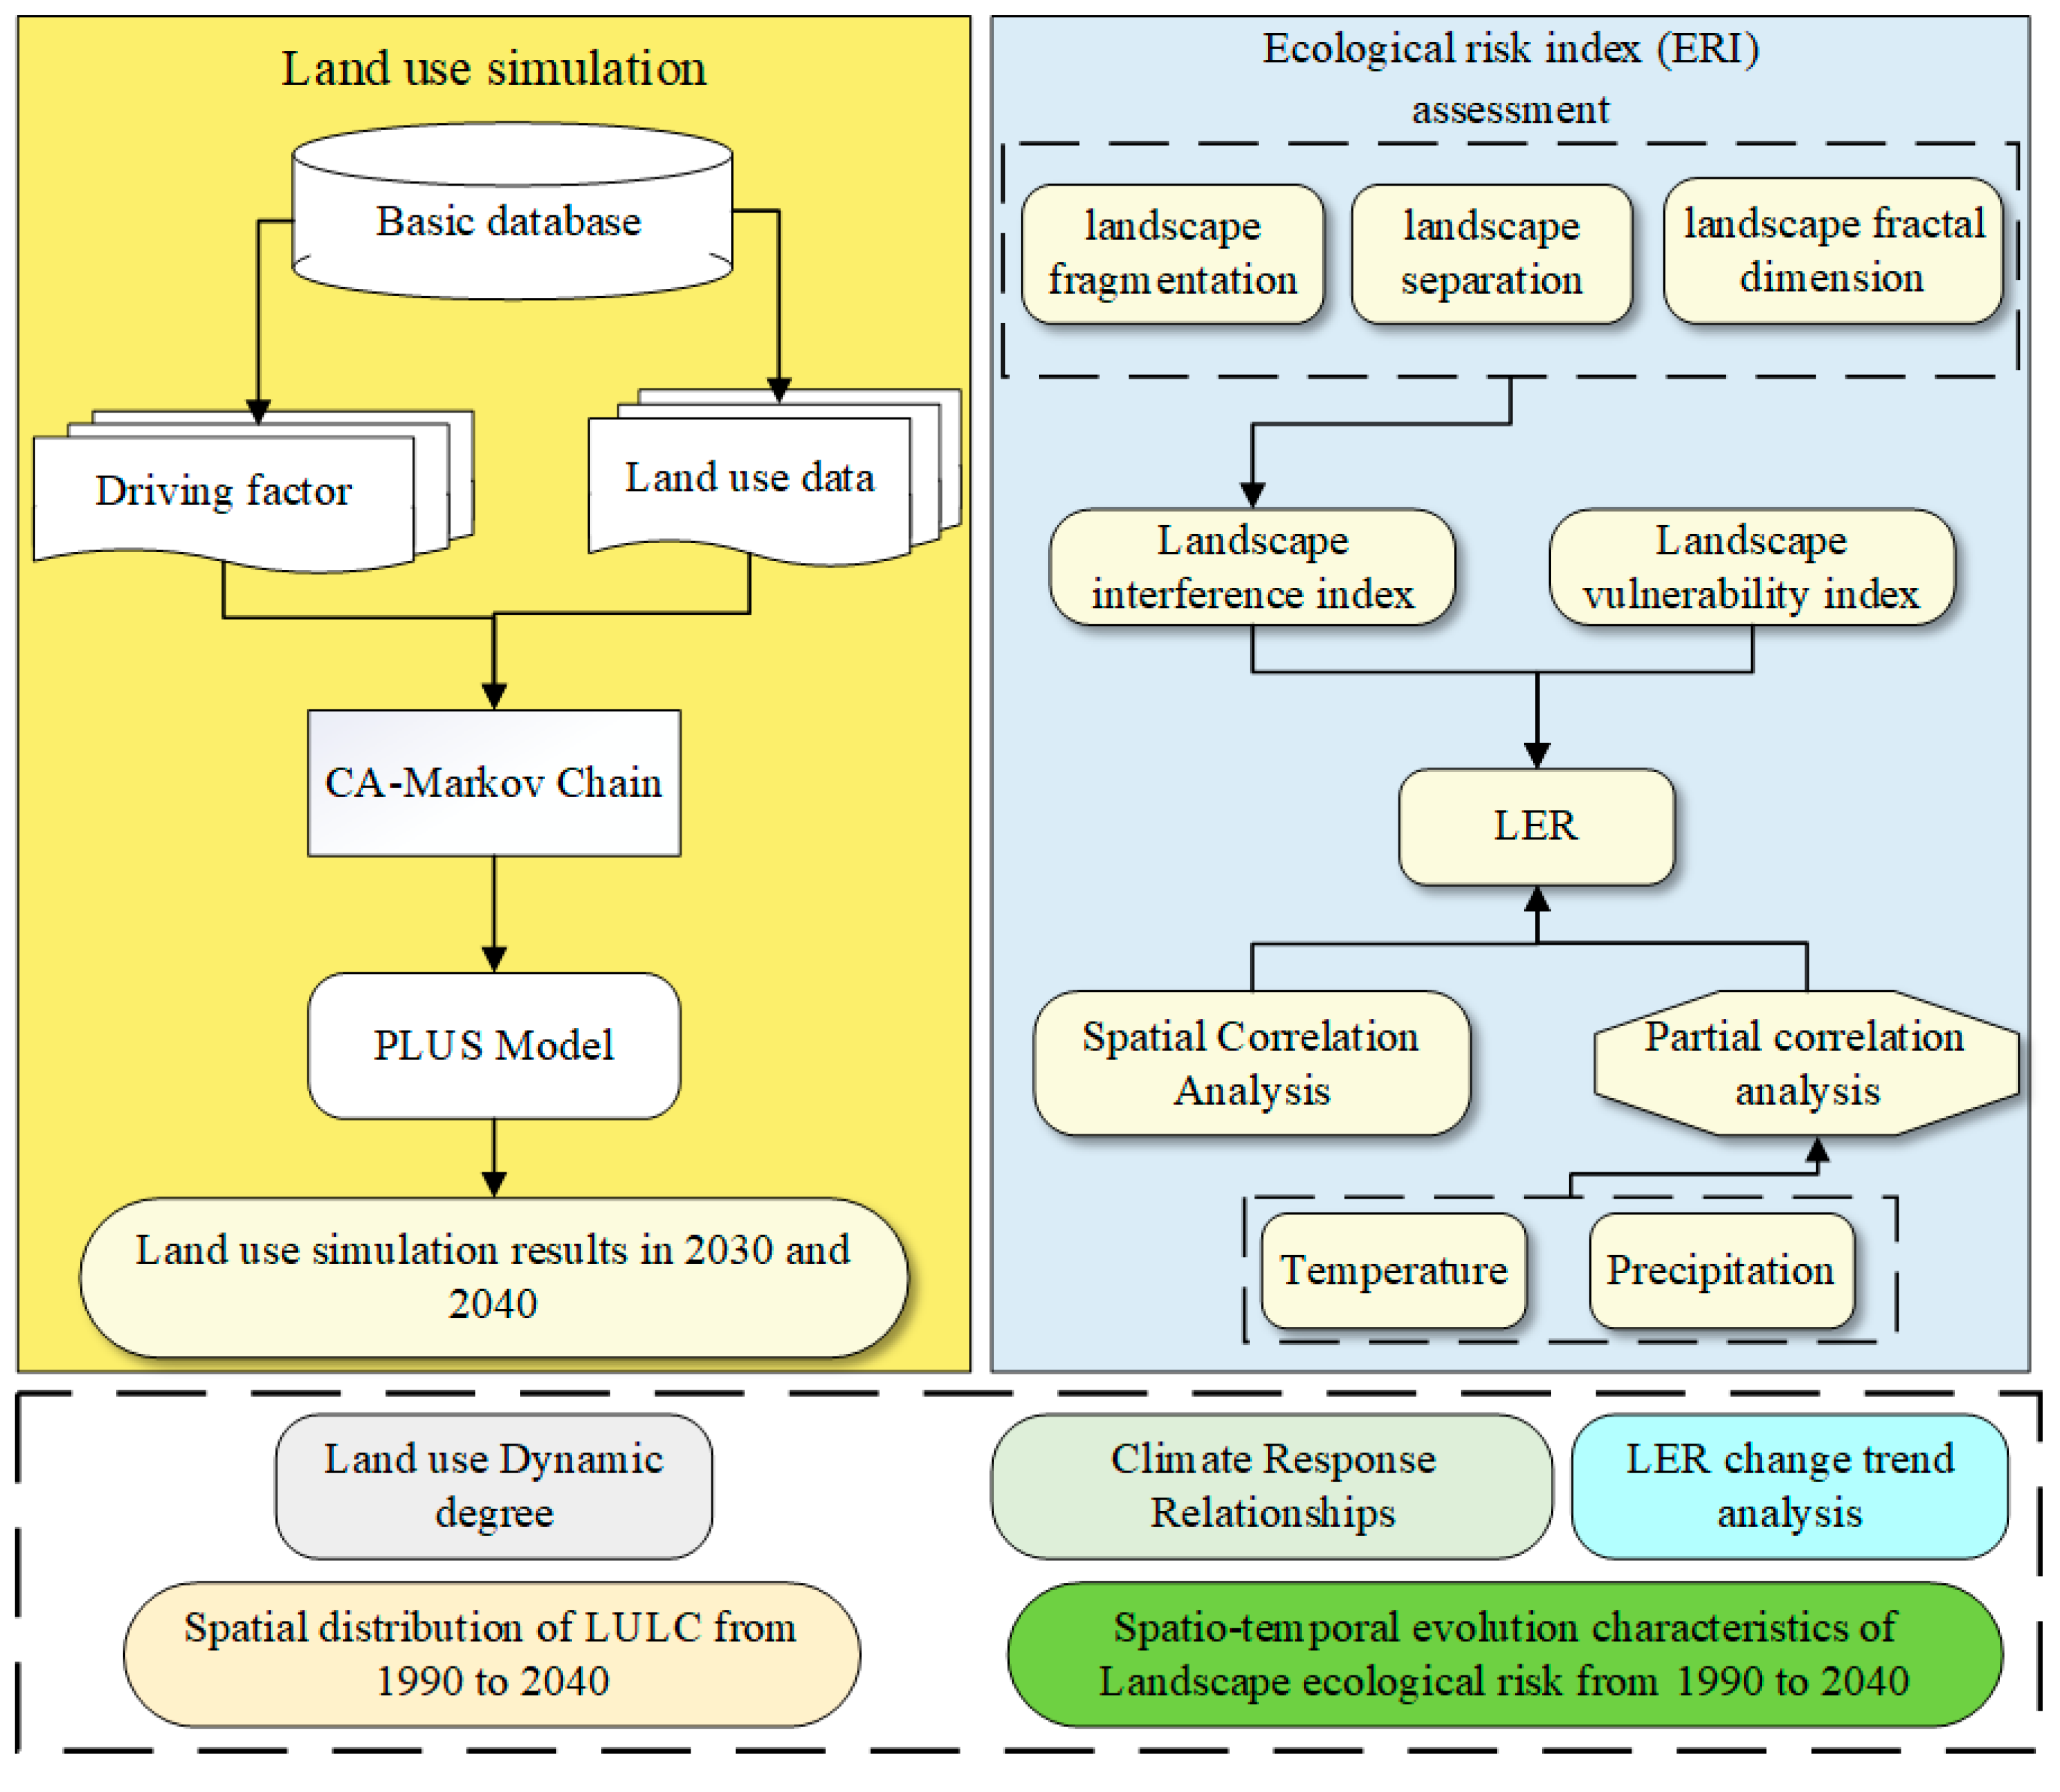
2.2. Data and Methods

To begin with, the driving factors were selected based on the current land use status of the Selenga River Basin, and then the PLUS model was used to simulate the land use changes in the Selenga River Basin for 2030 and 2040 and analyze the land use dynamic degree. Then, we constructed a landscape ecological risk index (LER) from the computed landscape pattern indices and analyzed the spatio-temporal variation trends of its ecological risk from 1990 to 2040 by combining spatial autocorrelation analysis and semivariogram methods. Finally, the impacts of temperature and precipitation on ecological risk were studied through partial correlation analysis. The technical roadmap is shown in Figure 2.

2.2.1. Land Use Data

In this study, a land use dataset of the Selenga River Basin with a resolution of 30 m was produced by our team based on Landsat·7·and Landsat·8 images [25], which meets the required accuracy for our research. Land use types included forest, grassland, built area, cropland, barren land and water.

2.2.2. PLUS Model

The PLUS model is a novel type of land use prediction model that can reveal the contribution of potential driving factors to land use change. It integrates two sub-models: the CA based on multiple random seeds (CARS) and the land expansion analysis strategy (LEAS) [2]. The mode of operation is as follows. First, extract the changes in land use types in two periods and analyze their direct relationship with the driving factors. Second, the growth probability of different land use types is calculated by the LEAS module, and the appropriate transition matrix and rule weight are set to simulate the future land use status [26]. The CARS cellular automaton model of the PLUS model has the characteristics of time consistency and allows new patches to grow spontaneously under the constraints of growth probability.
Commonly used driving factors in the PLUS model include natural environmental and human activity factors [18]. Considering the geographical and environmental characteristics of the Selenga River Basin, the vegetation index and climatic factors, such as NDVI, DEM, temperature, precipitation, etc., must be prioritized. The Selenga River Basin is sparsely populated but relatively well-traveled. The Euclidean distance tool in ArcGIS is used in this study to calculate dis_road and dis_railroad as the influencing factors of human activities. The data sources are shown in Table 1.

2.2.3. Accuracy Verification

At present, the kappa index is becoming less and less common in accuracy evaluation, and the use of kappa and OA indicators alone cannot show the classification accuracy very well. The FOM coefficient has good properties for evaluating the accuracy of the model; it is a measure of the efficiency, sensitivity or precision of a system. Larger FOM values indicate better simulation results and higher accuracy. Therefore, for the simulation results, this study uses the overall precision, kappa coefficient and FOM coefficient to calculate its p accuracy index.

2.2.4. Construction of the Landscape Ecological Risk Model

Referring to previous research results and combining the empirical link between land use landscape patterns and regional ecological risks in the Selenga River Basin [17], this study introduces the following landscape indices, namely the landscape fragmentation degree A i , fractal dimension B i and landscape separation index C i , which were selected to calculate the landscape interference index ( D i ). and landscape vulnerability index ( F i ). The formulae for the calculations are as follows:
D i = dA i + eB i + fC i
A i = n i M i
B i = M 2 M i n i M i
C i = 2 ln ( N i 4 ) ln   M i
where M is the total area, M i is the area of landscape i, n i is the number of patches, N i is the perimeter of the landscape type and d, e and f are the weights of the D i that satisfy (d + e + f = 1), referring to previous research [27]. The weights were assigned as 0.5, 0.3 and 0.2 for d, e and f, respectively.
After standardizing the land use types, this study referred to previous research and grades the six land use types according to their ability to resist external disturbance [28]: cropland was four, forest was two, built area was one, water was five, barren was six and grassland was three, and the landscape fragility index (Fi) was then calculated through normalization.
In order to reflect the changes in the ecological environment in the study area caused by potential ecological risks and losses [29], the landscape ecological loss degree (Ri) was calculated, and the formula is as follows:
R i   = D i   ×   F i
where Ri is the landscape ecological loss degree, D i is the landscape interference index and Fi is the landscape fragility index
In this study, combined with previous studies and the topographic features and environmental elements of the Selenga River Basin, a 15 km × 15 km grid (1525 grids in total) was determined as the risk assessment unit [18] and then the LER value of each risk unit was calculated [30]. Finally, the surface distribution of the risk value was obtained using the kriging method [31]. The formula used is as follows:
LER = i = 1 n M ki M k R i
where i is the ith landscape, Mki is the area of landscape i in the area k, Mk is the total area of k samples and n is the number of landscape types. According to the size of the LER value, the ecological risk of the Selenga River Basin is divided into the following five levels by using the natural break method and combining the characteristics of the ecological environment of Mongolia [32]: low ecological risk (LER ≤ 0.0503), relatively low ecological risk (0.0503 < LER ≤ 0.0748), medium ecological risk (0.0748 > LER ≤ 0.0902), relatively high ecological risk (0.0902 < LER ≤ 0.1016) and high ecological risk (LER > 0.1016).

2.2.5. Land Use Dynamics Degree

This study used a comprehensive/single-land-use dynamic degree to reflect the changing rate of different land use types in the study area [33]. Among them, the single-land-use dynamic degree (K) reflects the rate of change of a certain land use type within a specified time using the following formula:
K = LU a LU b LU a × 1 T × 100 %
The comprehensive land use dynamic degree (LC) describes the overall speed of land use change in the whole region, which can be used in the study of regional differences in land use dynamic change and can reflect the comprehensive change rate of different land use types within a specified period of time [34]. Its formula is the following:
LC = [ i = 1 n Δ LU i j 2 · i = 1 n Δ LU i ] ×   1 T × 100 %
where LU a and LU b are the areas of the land use type in the beginning year (a) and end year (b) of the study period, respectively, LU i is the area of type I, Δ LU i j is the area of type I transformed into another type, n is the number of types and T is the time interval of 10 years.

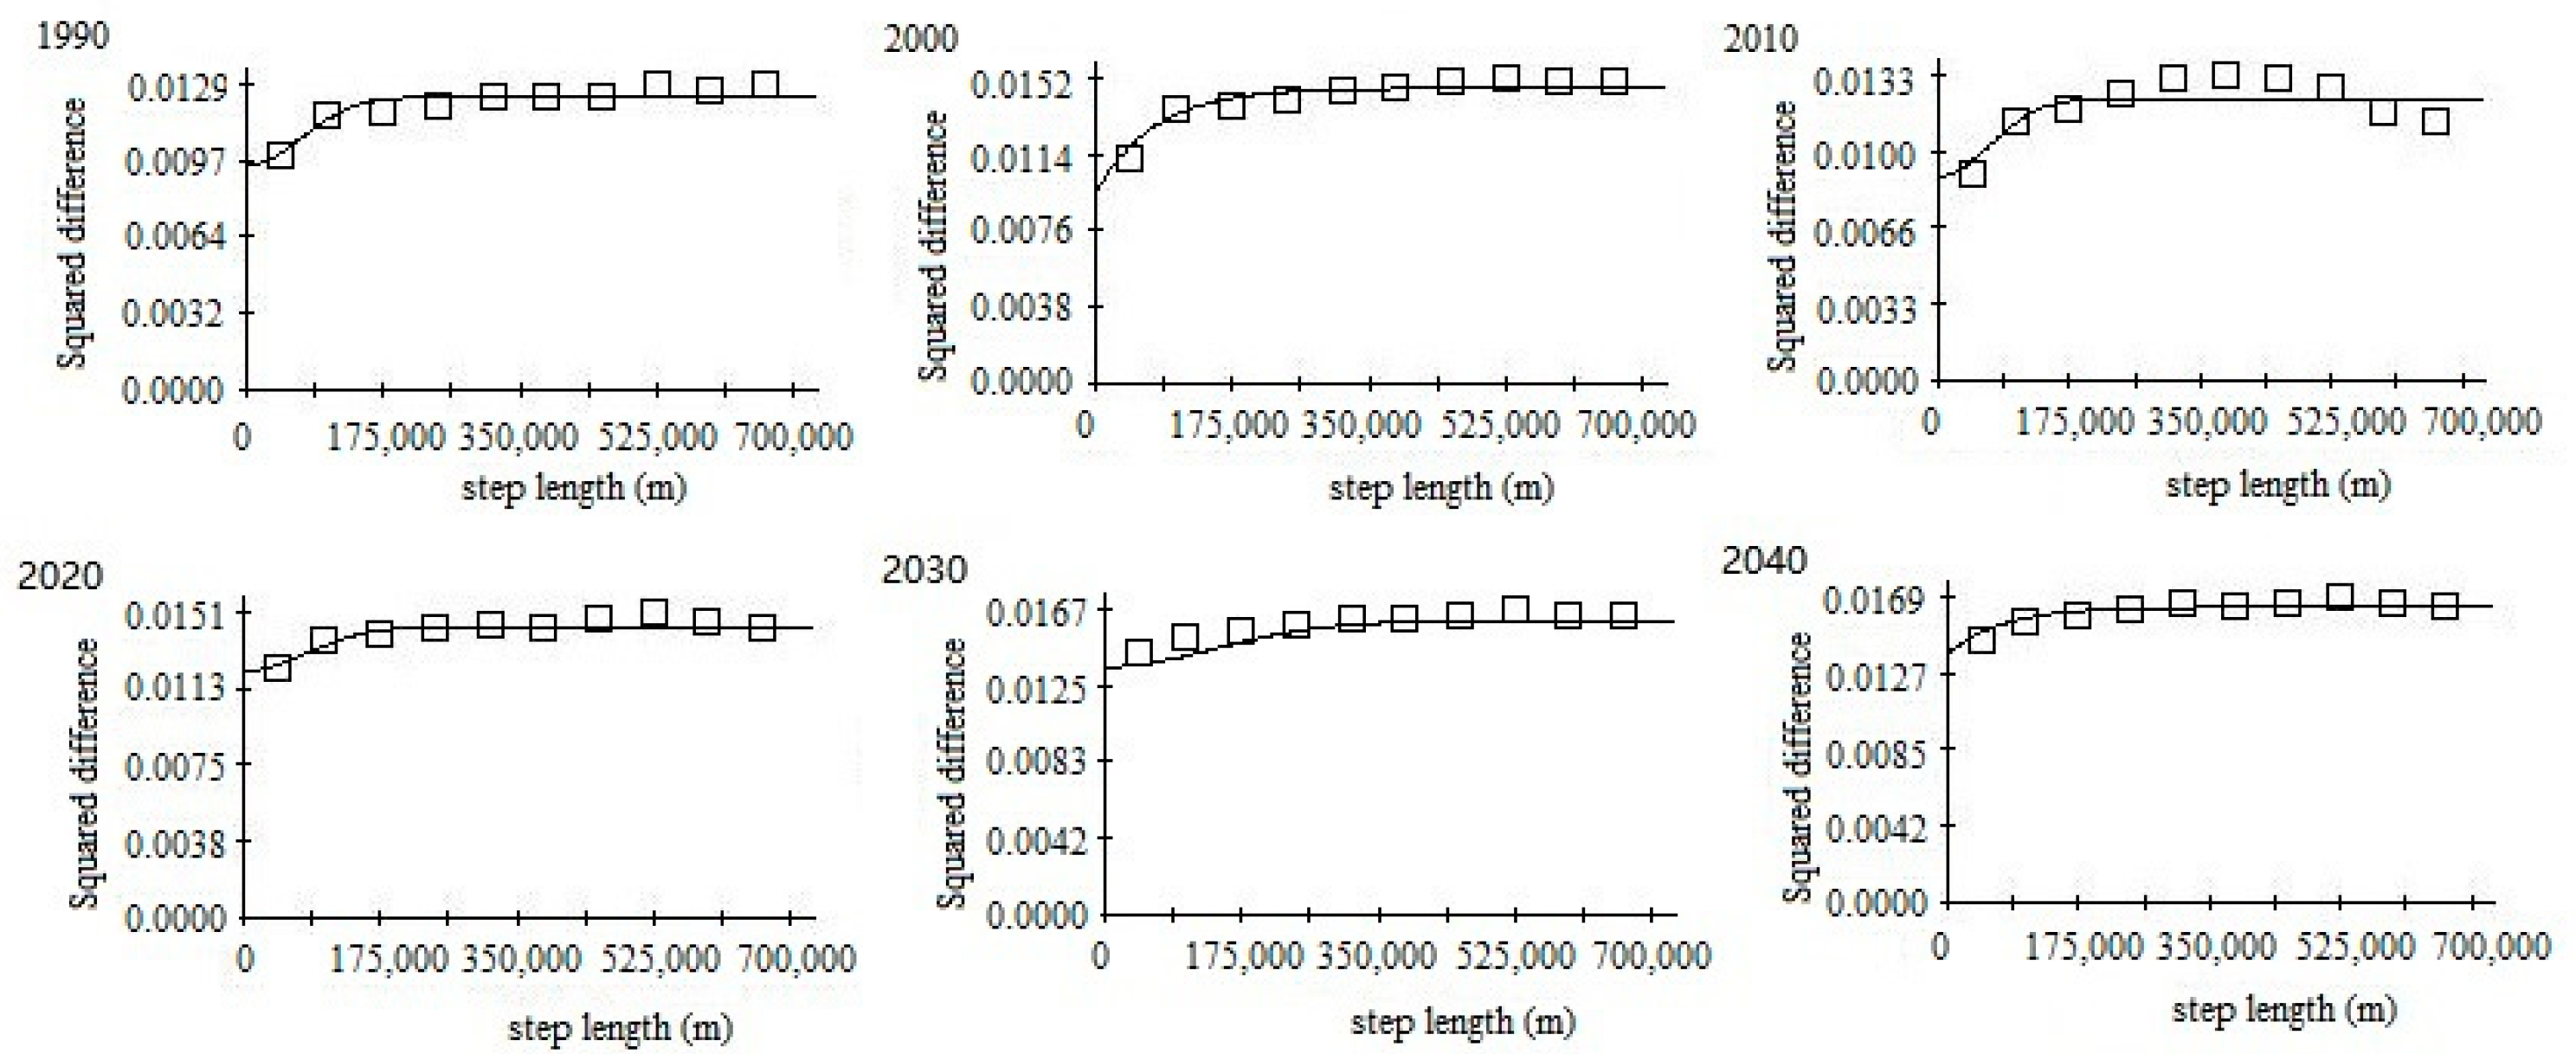
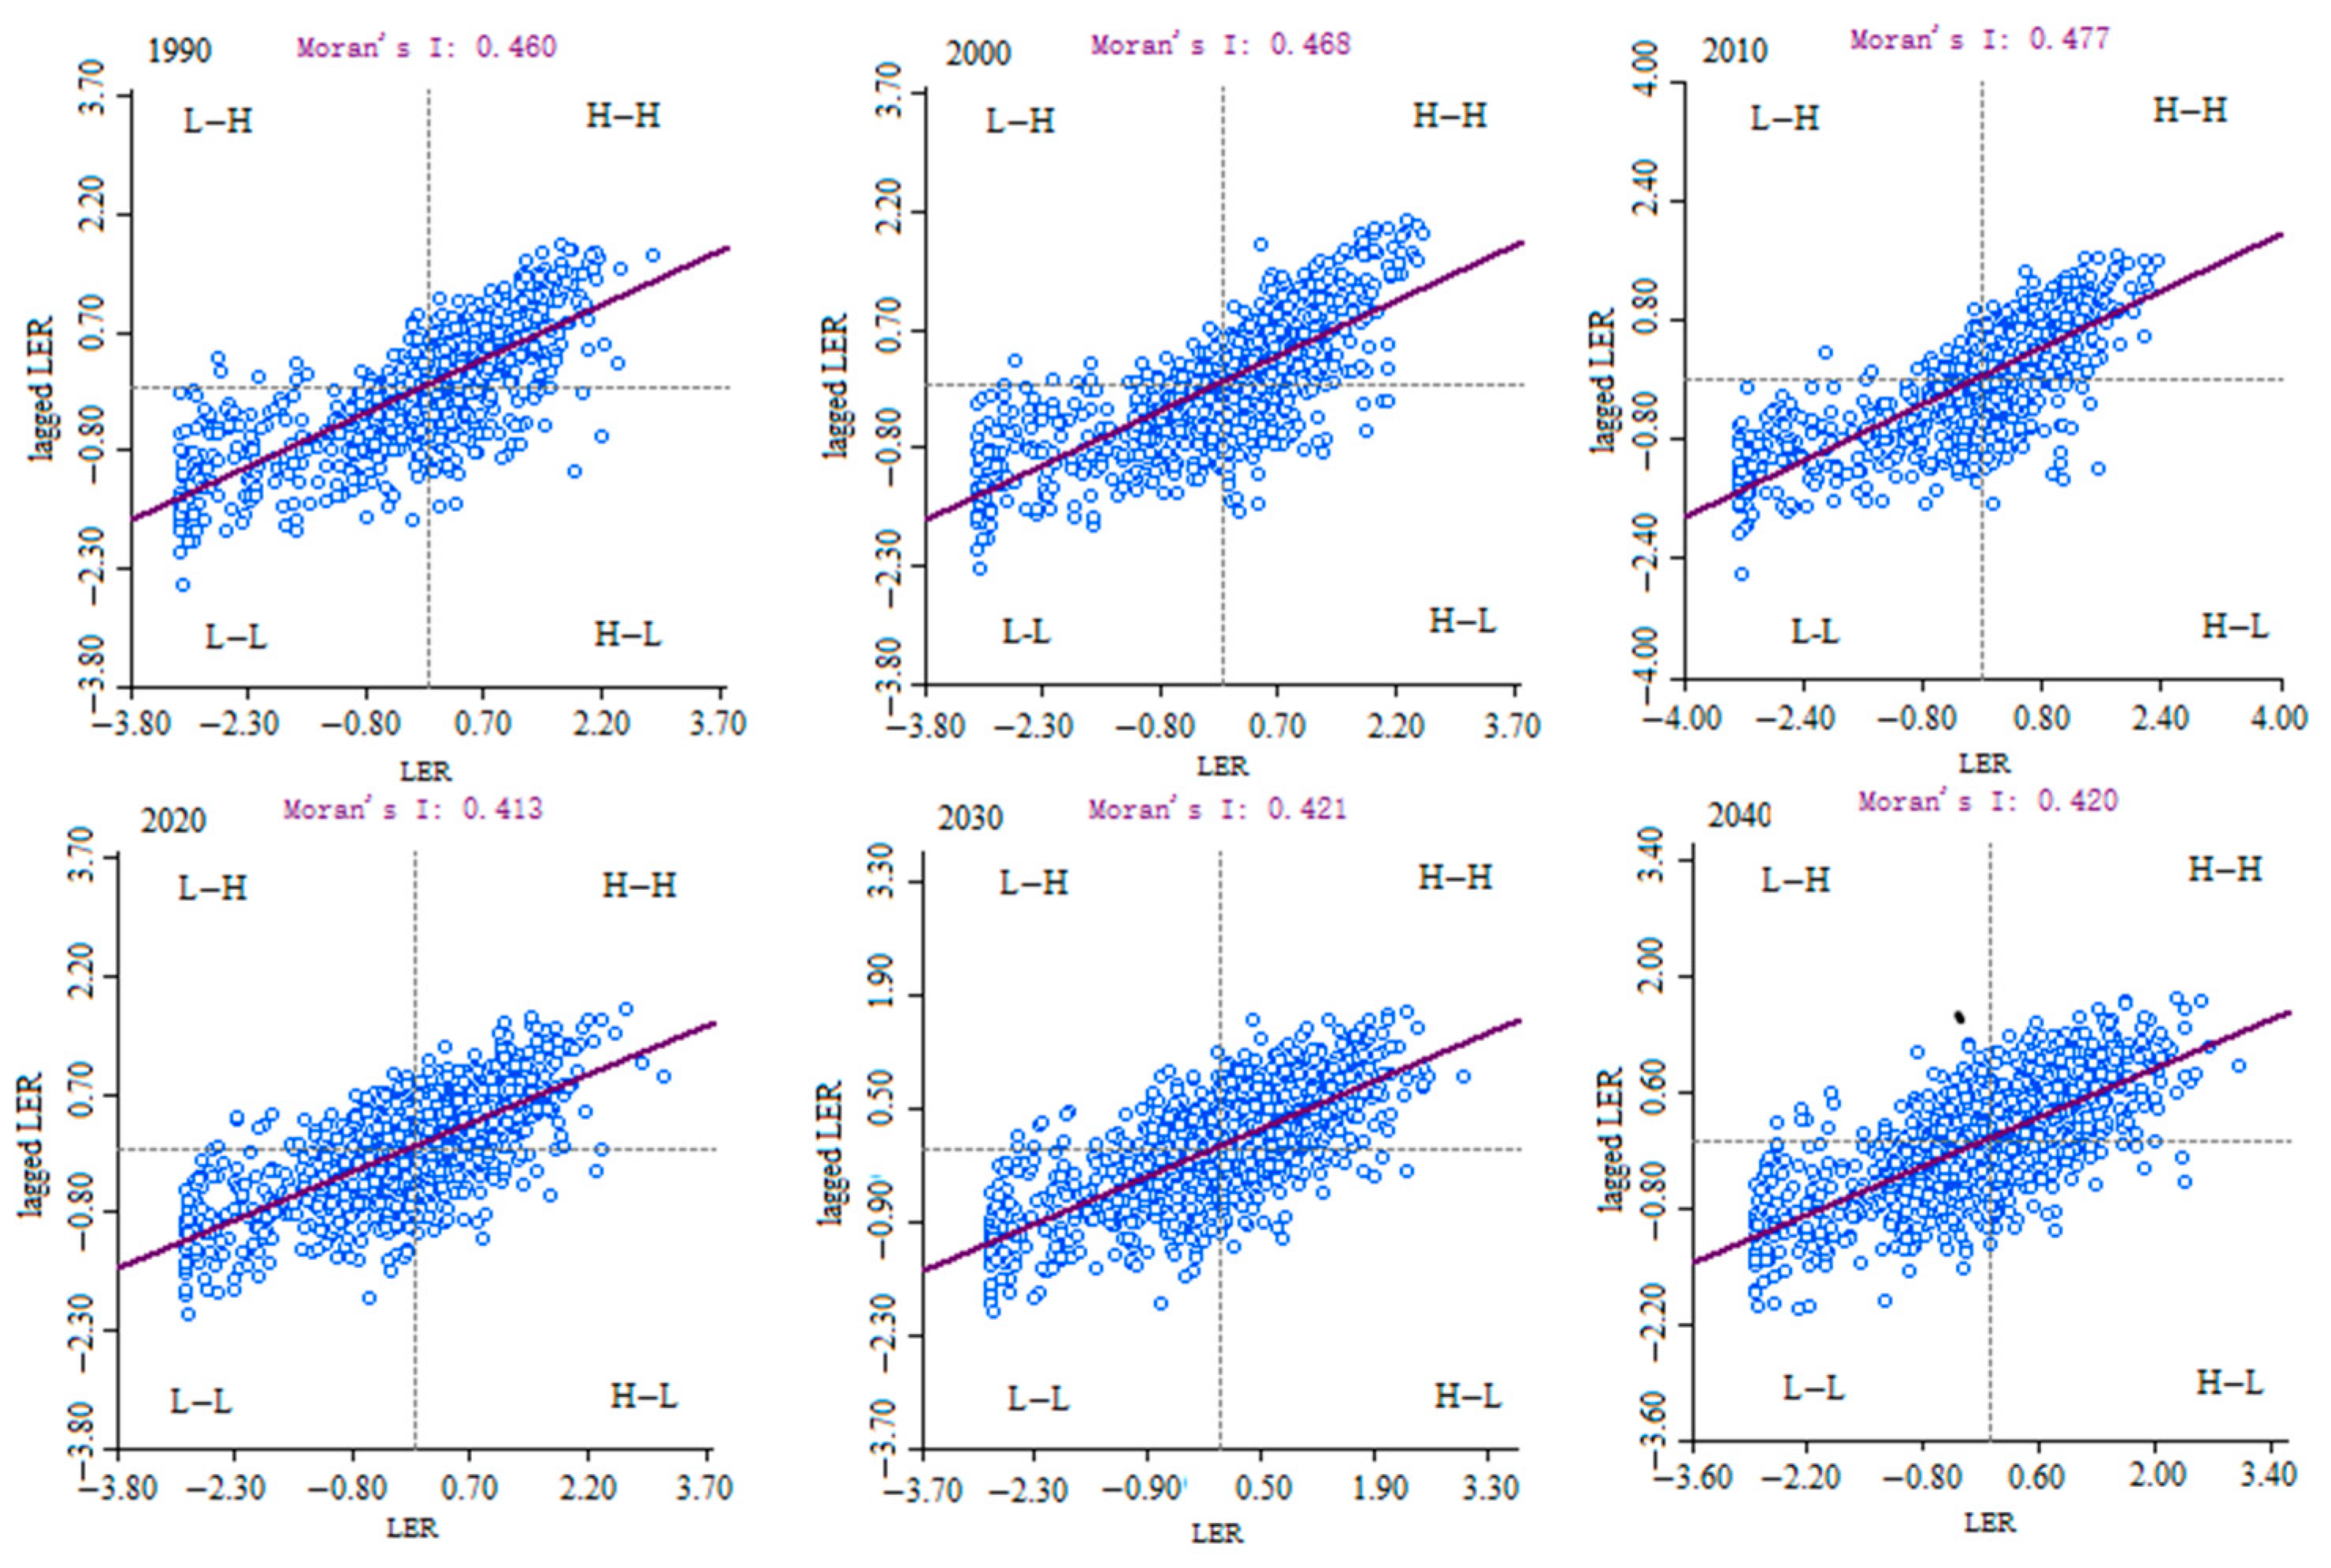
2.2.6. Spatial Correlation Analysis

In this study, the global Moran’s I was calculated to describe the spatial correlation characteristics of the landscape ecological risk space and to judge whether there is aggregation or anomaly in the space [35]. The formula used is as follows:
I = i = 1 n j = 1 n W i j ( x i x ¯ ) ( x j x ¯ ) S 2 i = 1 n j = 1 n W i j
where x i and x j are LER of reference cell i and adjacent cell j, respectively. n is the total number of grids.; ( x i x ¯ ) is the deviation between the measured value and the average value on the ith grid cell W i j is a standardized spatial weight matrix; S 2 is the mean square error.
To judge the specific location where aggregation occurs, the local Moran’s I index and LISA cluster map were used to visualize the differences between adjacent regions [36]. The formula used is as follows:
S 2 = 1 n i = 1 n ( x i x ) 2    
I l = x i x S 2 j = 1 n w i j ( x j x )
where j and i are grids j and i, w i j is the element value of the spatial weight matrix and x i and x j are the eigenvalues of grids i and j, respectively. x is the mean of the eigenvalues of all geographic units and n is the total number of grids. I > 0 means that the LER is clustered. I < 0 means that the LER is discrete; that is, high and low values are clustered together. I = 0 means that the spatial distribution of the ecological risk values is random. The local autocorrelation index, I l , is divided into four categories: low–low aggregation(L–L), low–high aggregation(L–H), high–high aggregation(H–H) and high–low aggregation(H–L).

2.2.7. Partial Correlation Analysis

Partial correlation analysis is the process of controlling other influencing factors and analyzing only the correlation between two variables [37]. Therefore, in order to better explore the relationship between climate and LER values, the partial correlation between LER values and climate factors at the pixel scale was calculated in this study. The formula is as follows:
r x y z = r x y r x z × r y z 1 r x y 2 × 1 r y z 2
where r x y z is the partial correlation coefficient between variables x and y when z is used as the control factor, r x y , r x z and r y z are the correlation coefficients between x and z, x and y, and y and z, respectively.

3. Results

3.1. Analysis of Land Use Change in the Selenga River Basin

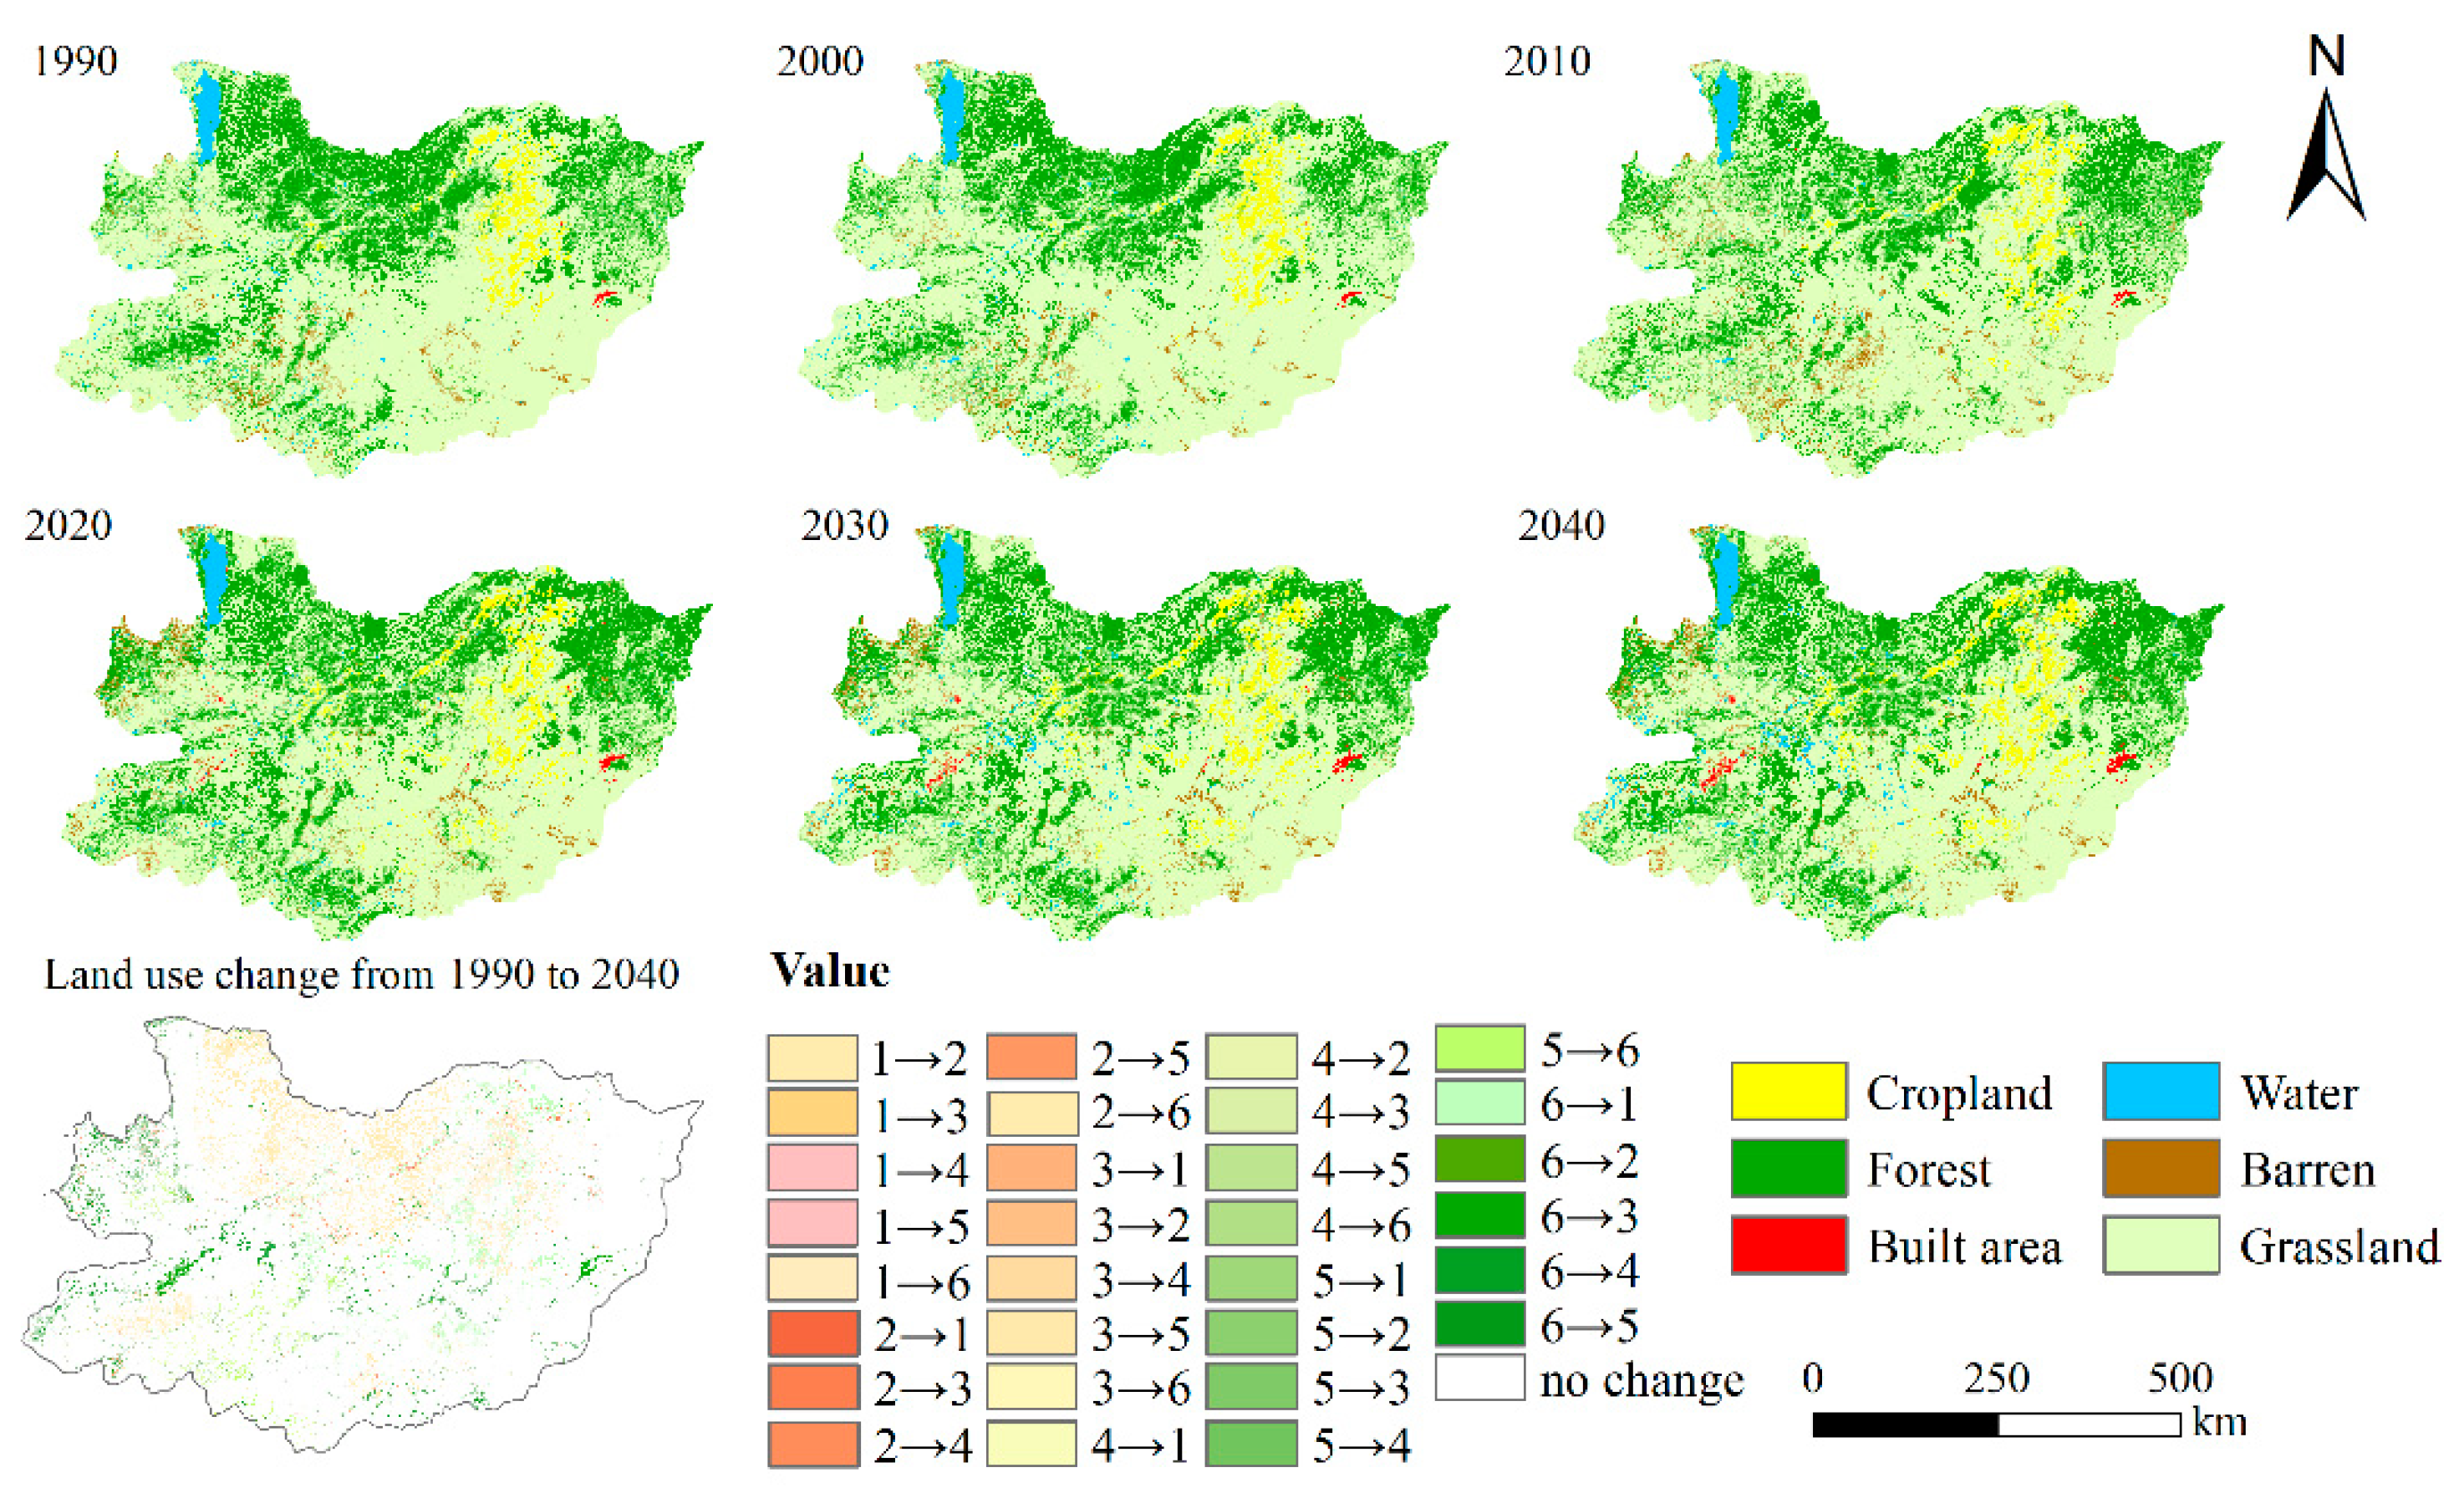
3.1.1. Spatial Change of Land Use

To test the reliability of the PLUS model, the land use data for 2010 were used to simulate the land use data for 2020, which were compared to the actual land use data for 2020 to verify the accuracy of the simulation results. Among them, the kappa was 0.84 and the overall accuracy was 0.81. According to the accuracy verification of the kappa index and the overall accuracy of the simulation results, it can be seen that the PLUS model can simulate the LULC in the Selenga River Basin well. The overall spatial accuracy is low due to the high degree of fragmentation of built-up areas and cropland. However, due to its small overall area, it will only slightly change the construction of the landscape ecological risk model. In addition, we also calculated the FOM coefficient to further verify the simulation results. The FOM index result was 0.186, which further proved the rationality of the PLUS model for LULC simulation in the Selenga River Basin.
Figure 3 and Table 2 show the spatial pattern characteristics and areas of land use types in different periods, respectively. Overall, the range of change in the built area is the highest, and the transfer between grassland and barren land is the most distinct. Specifically, the grassland is the most widely distributed in the Selenga River Basin, and the proportion has always remained above 60%. However, compared with 1990, the grassland area is expected to decrease by approximately 9% by 2040, and grassland degradation mainly occurs in the southwest of the Selenga River Basin. Forest land, as a crucial land use type in the Selenga River Basin, has continuously been a priority for protection, but in 2000, the area decreased. Overall, however, there is an increasing trend in forest area in the northern part of the basin. From 1990 to 2040, with the acceleration of the urbanization process, the built area is increasing steadily, from 212 km2 to 1396 km2. After 2010, the cropland area began to increase steadily. The overall trend of the water area was characterized by a decrease first. The barren land remained above 4000 km2, and the overall area tended to increase, and was concentrated in the southeastern and southwestern margins.

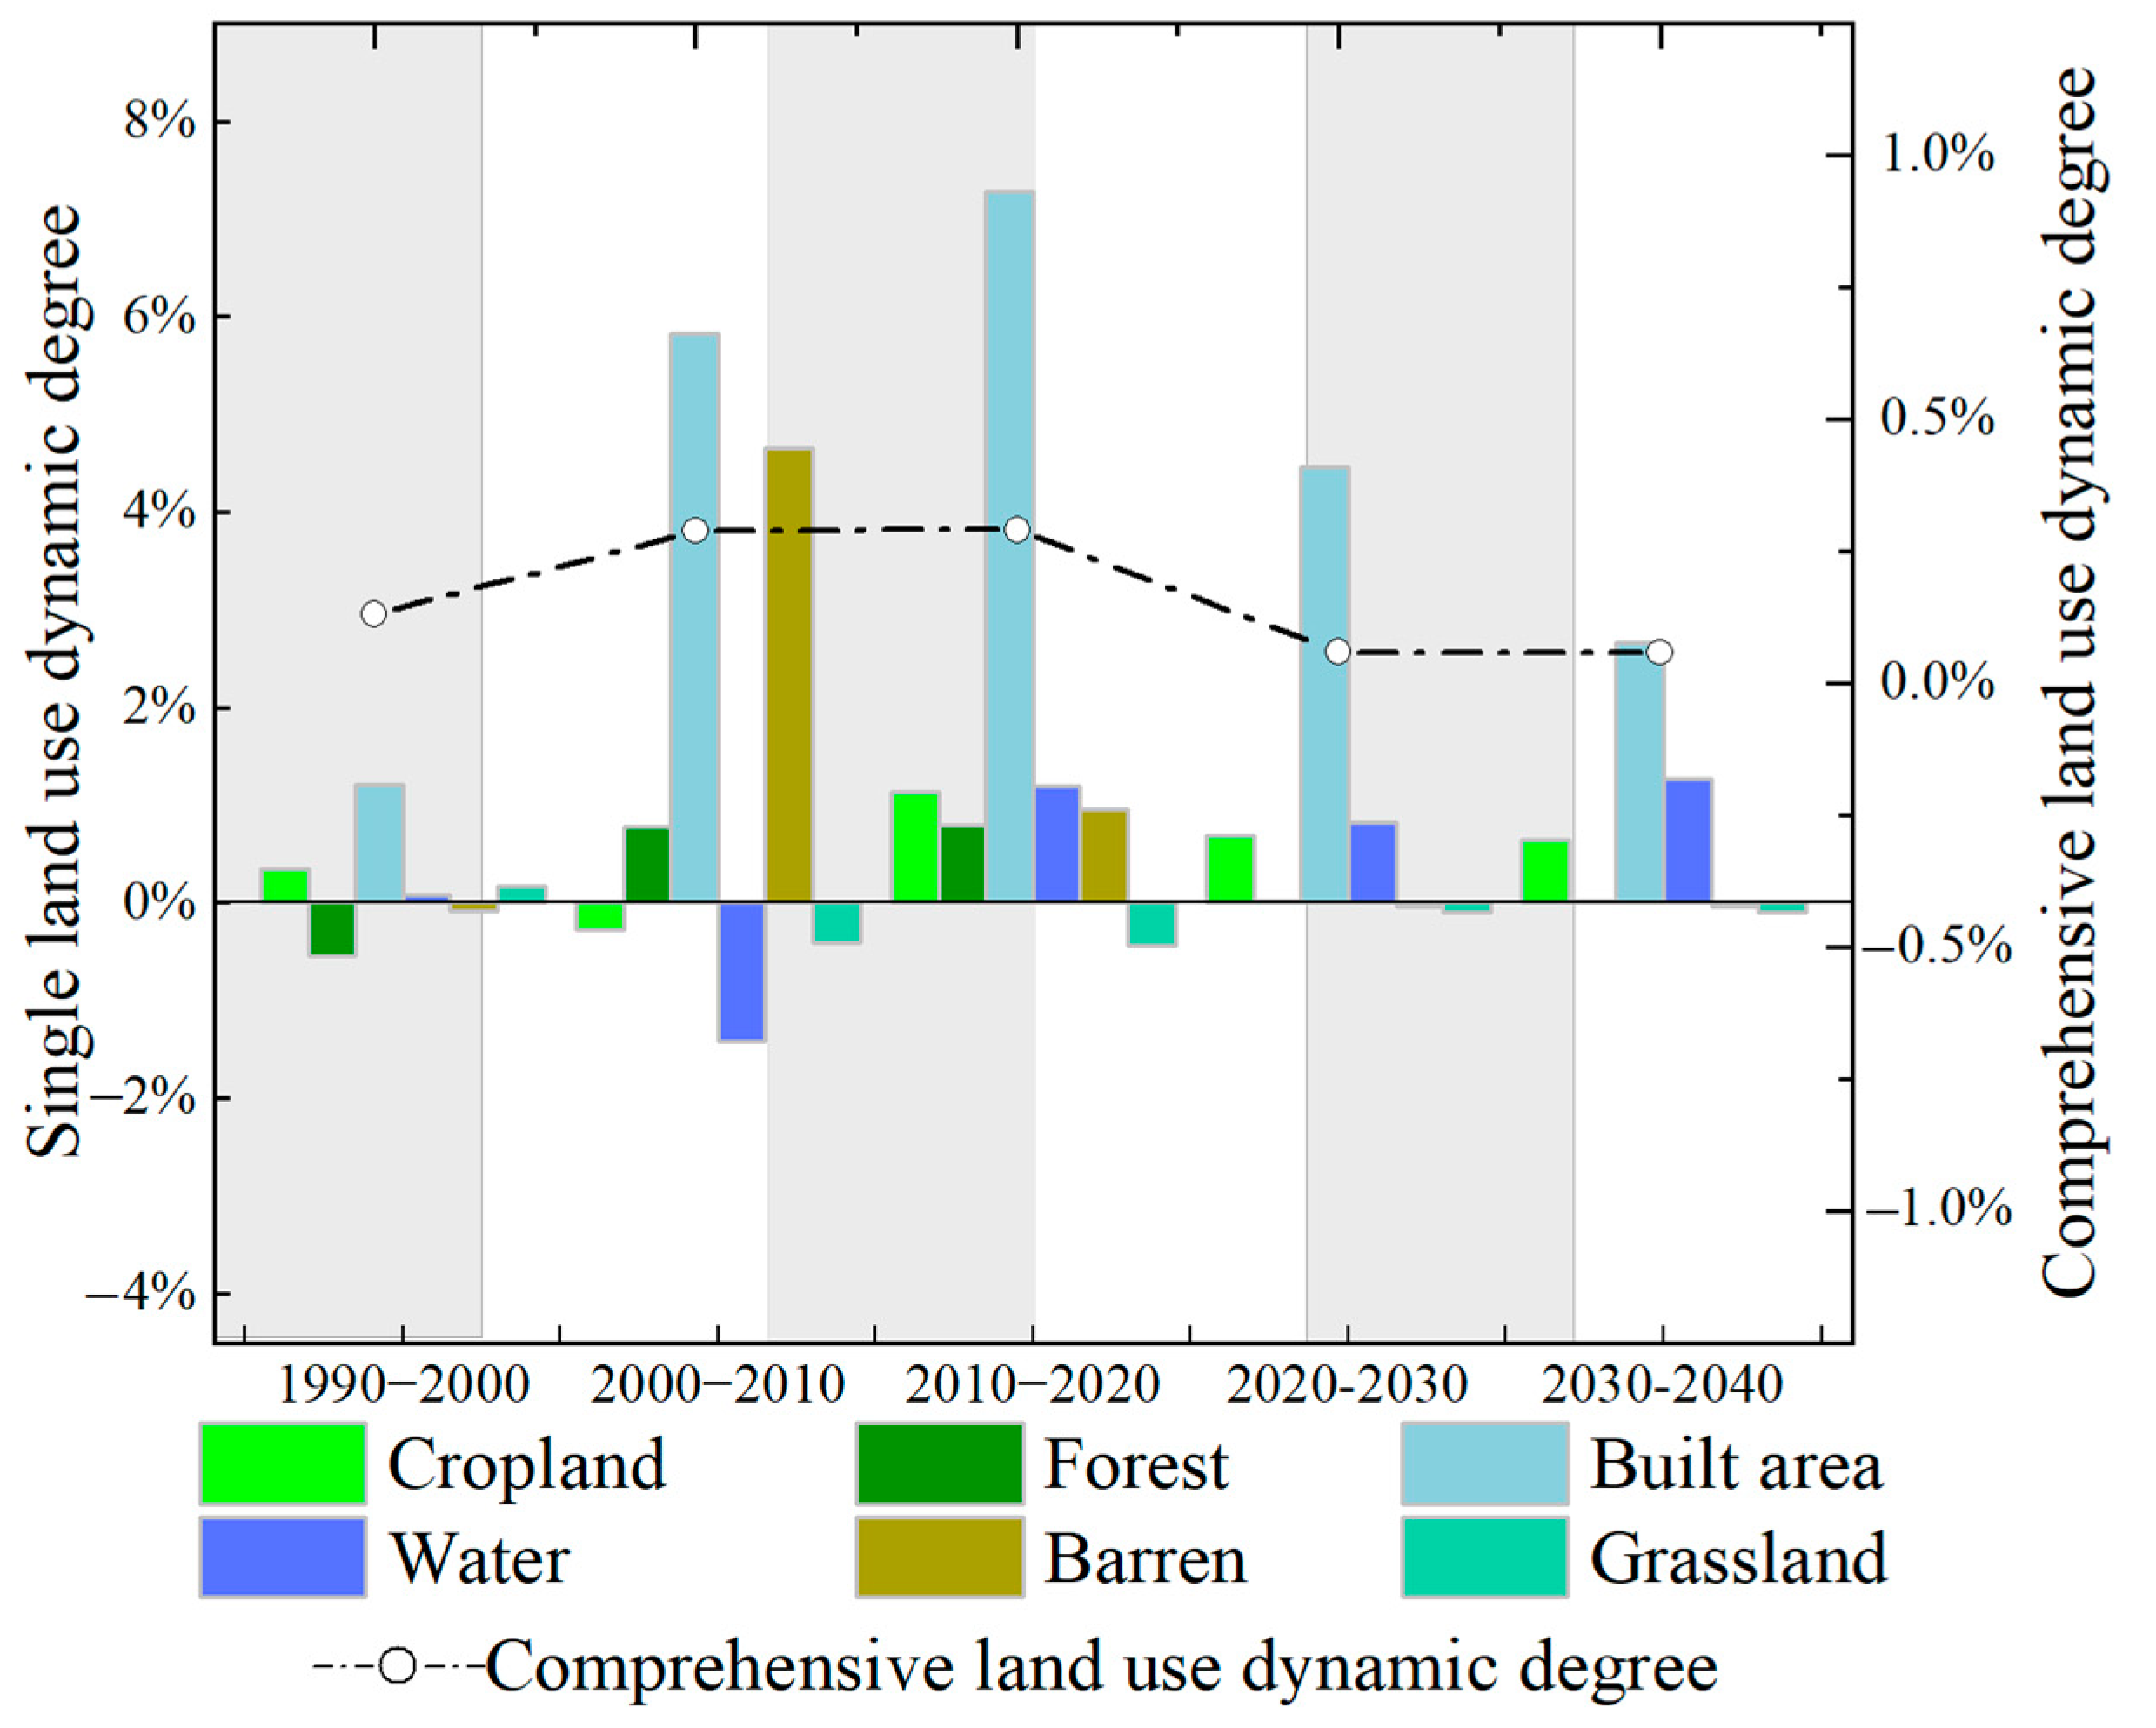
3.1.2. Temporal Change Characteristics of Land Use

In this study, the comprehensive and single-land-use dynamics degree were calculated at taxonomic scales to explain the degree of land use change (Figure 4). Overall, the comprehensive land use dynamics degree showed a downward trend. Between 1990 and 2010, a slight upward trend was noted (from 0.13% to 0.29%), which then began to decline in 2010 and will drop to 0.06% by 2040.
From the perspective of the single-land-use dynamic degree, grassland primarily showed negative growth, which was the largest during the period 2000–2010. From 1990 to 2000, the negative growth of the forest area changed most, with a dynamic degree of –0.53%, and it began to recover after 2010. The change trend of cropland area showed a decrease first and then an increase, with the largest increase of 1.14% in 2010. The water area changed the most between 2000 and 2010, showing a downward trend, and began showing positive growth after 2020. The change trend of the barren area first increased and then decreased, and the maximum rate of increase reached 4.66% during the period 2000–2010. Overall, the LC in Mongolia showed an upward trend from 1990 to 2000, was maintained at approximately 0.29% from 2000 to 2020, and has since remained at a low level.

3.2. Landscape Ecological Risk Assessment

3.2.1. Characteristics of Temporal Evolution of Landscape Ecological Risk

In this study, the GS+ 9.0 tool was used to fit the LER. In model selection, we fully accounted for model selection by calculating higher R2 and lower residual SS in the results. Ultimately, an exponential model was used for fitting in 2020 and 2040, and a Gaussian model was ideal for other years (Figure 5). The block base ratio indicates the degree of spatial variability; a high ratio indicates that the degree of spatial variability is caused more by random factors. The results (Table 3) show a moderate spatial correlation between 2000 and 2010, whereas the other years have a weak spatial correlation. The sill value continued to increase from 2010 to 2040, indicating an increase in the spatial distribution difference of the LER. The range reflects the change in the primary variation process of the LER; the higher the value, the stronger the uniformity of the LER in this period. The smaller the LER range, the weaker the uniformity of the LER in this period, and the more complex the overall distribution.

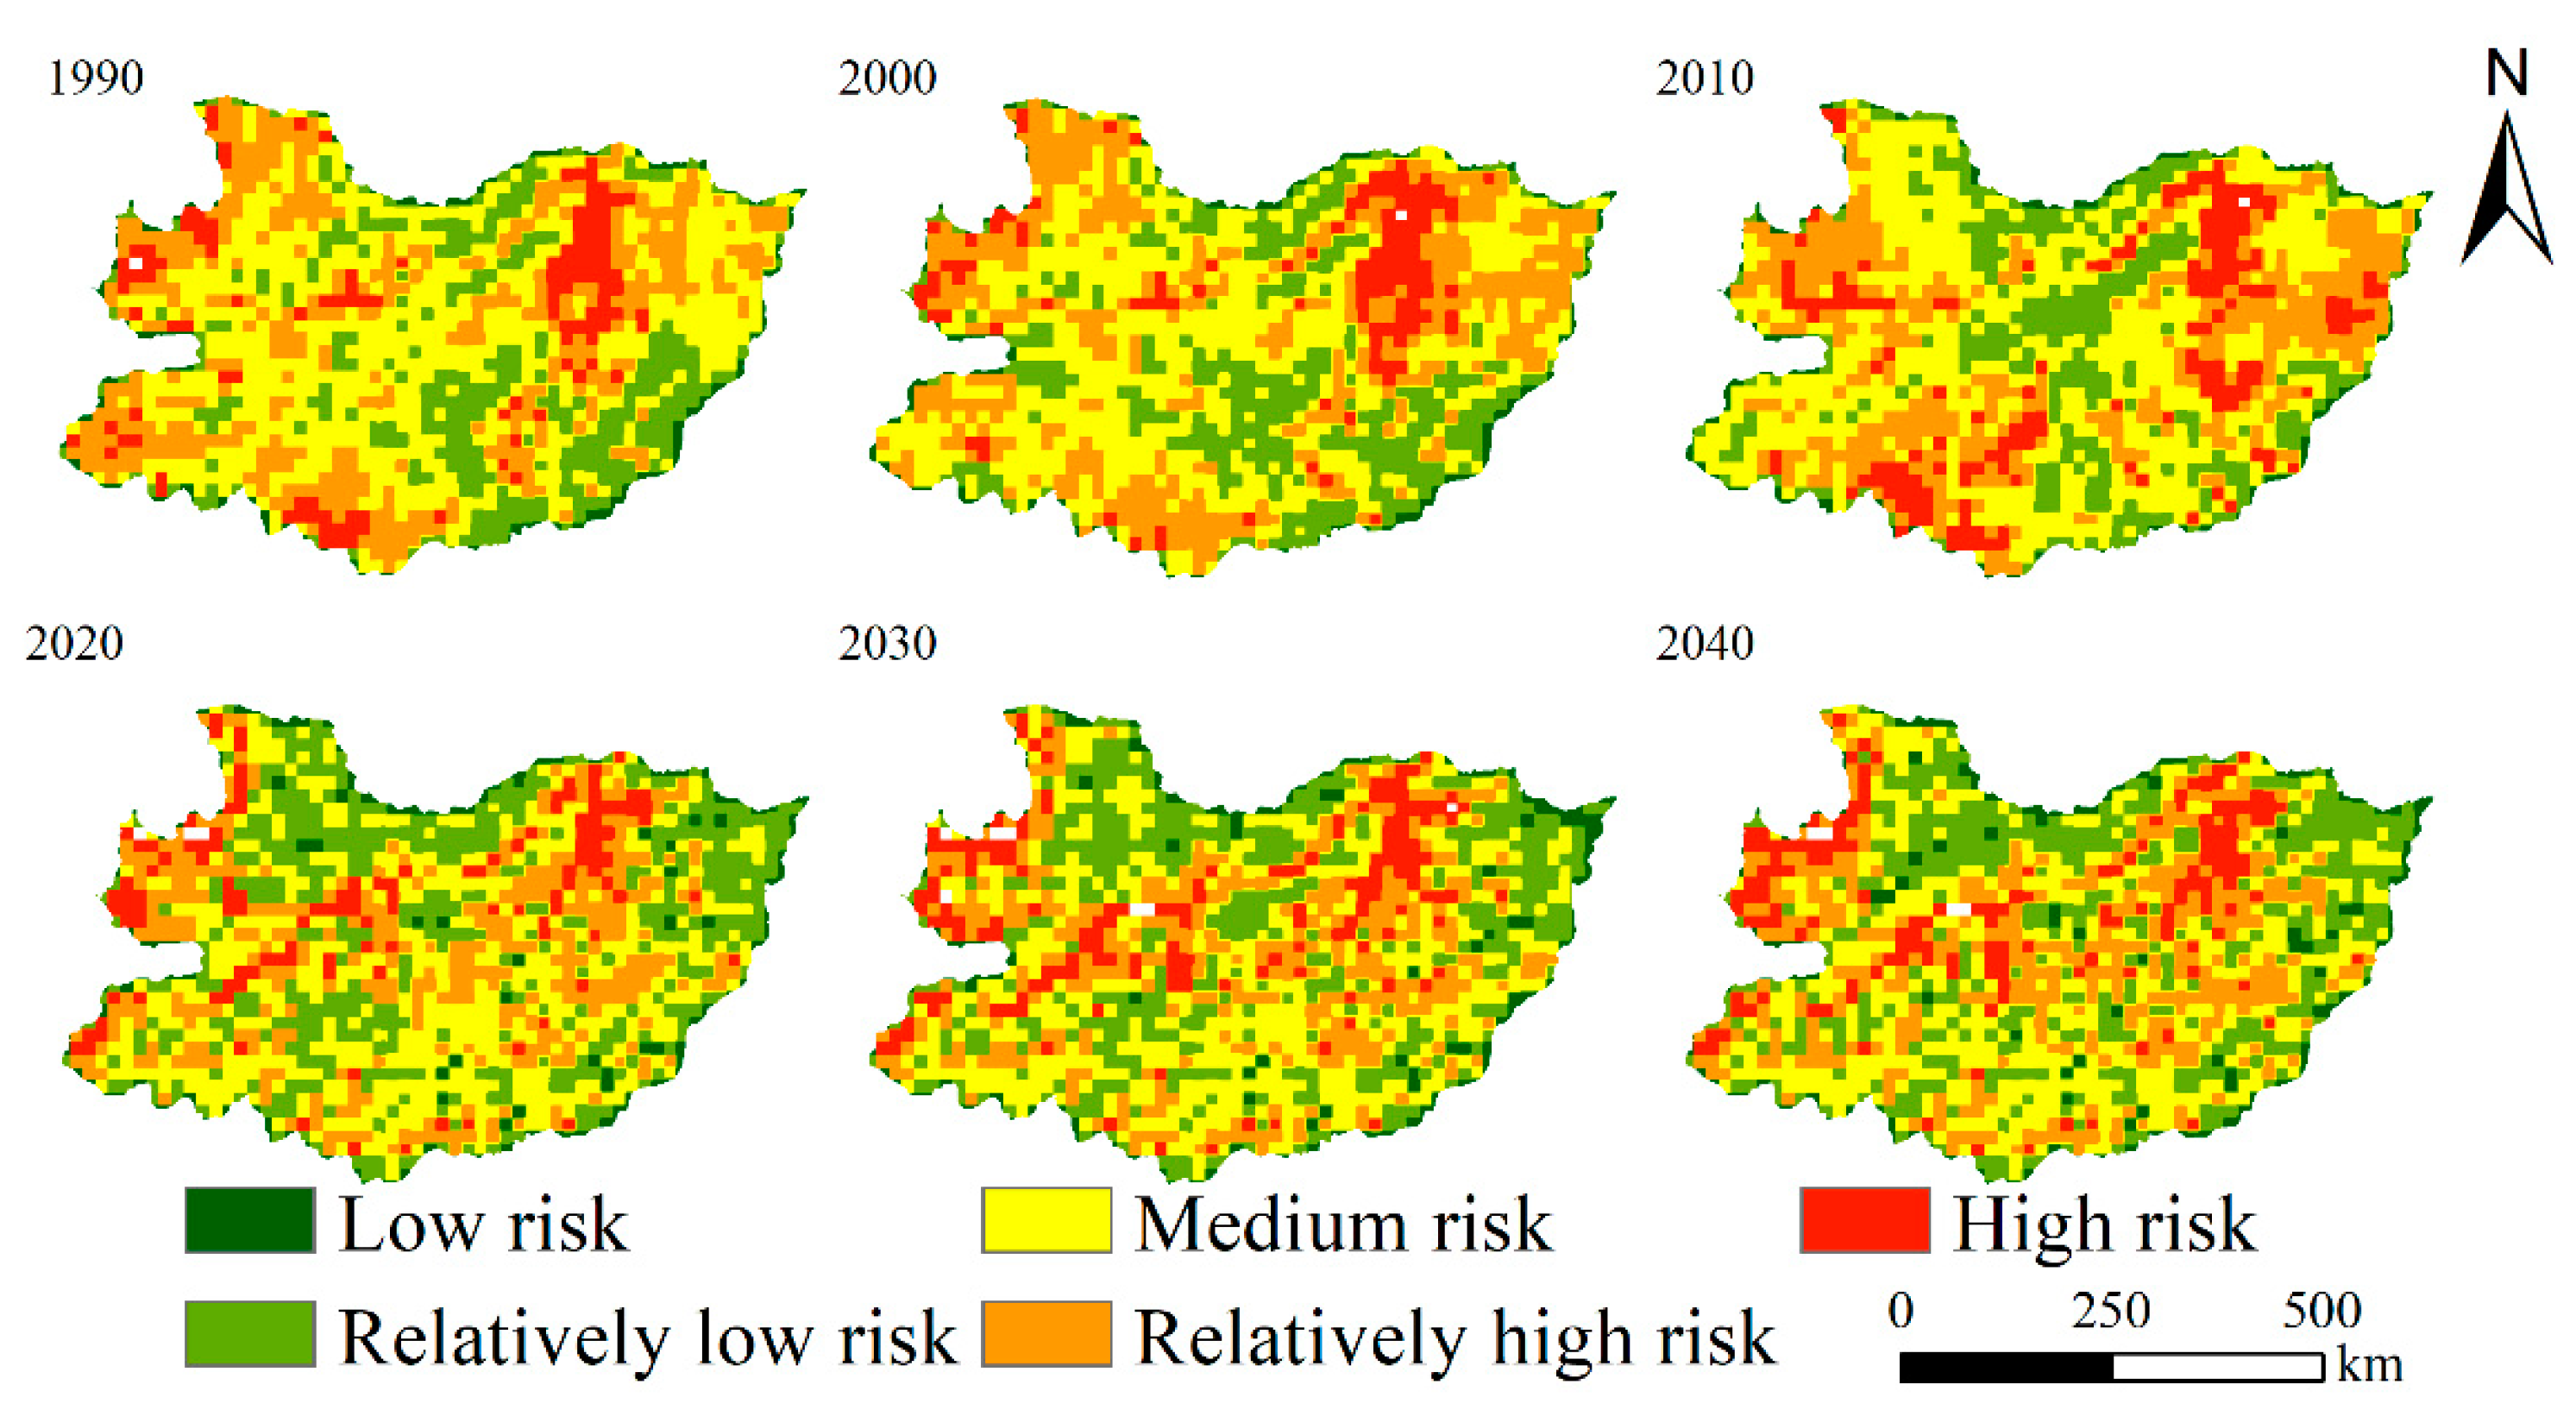
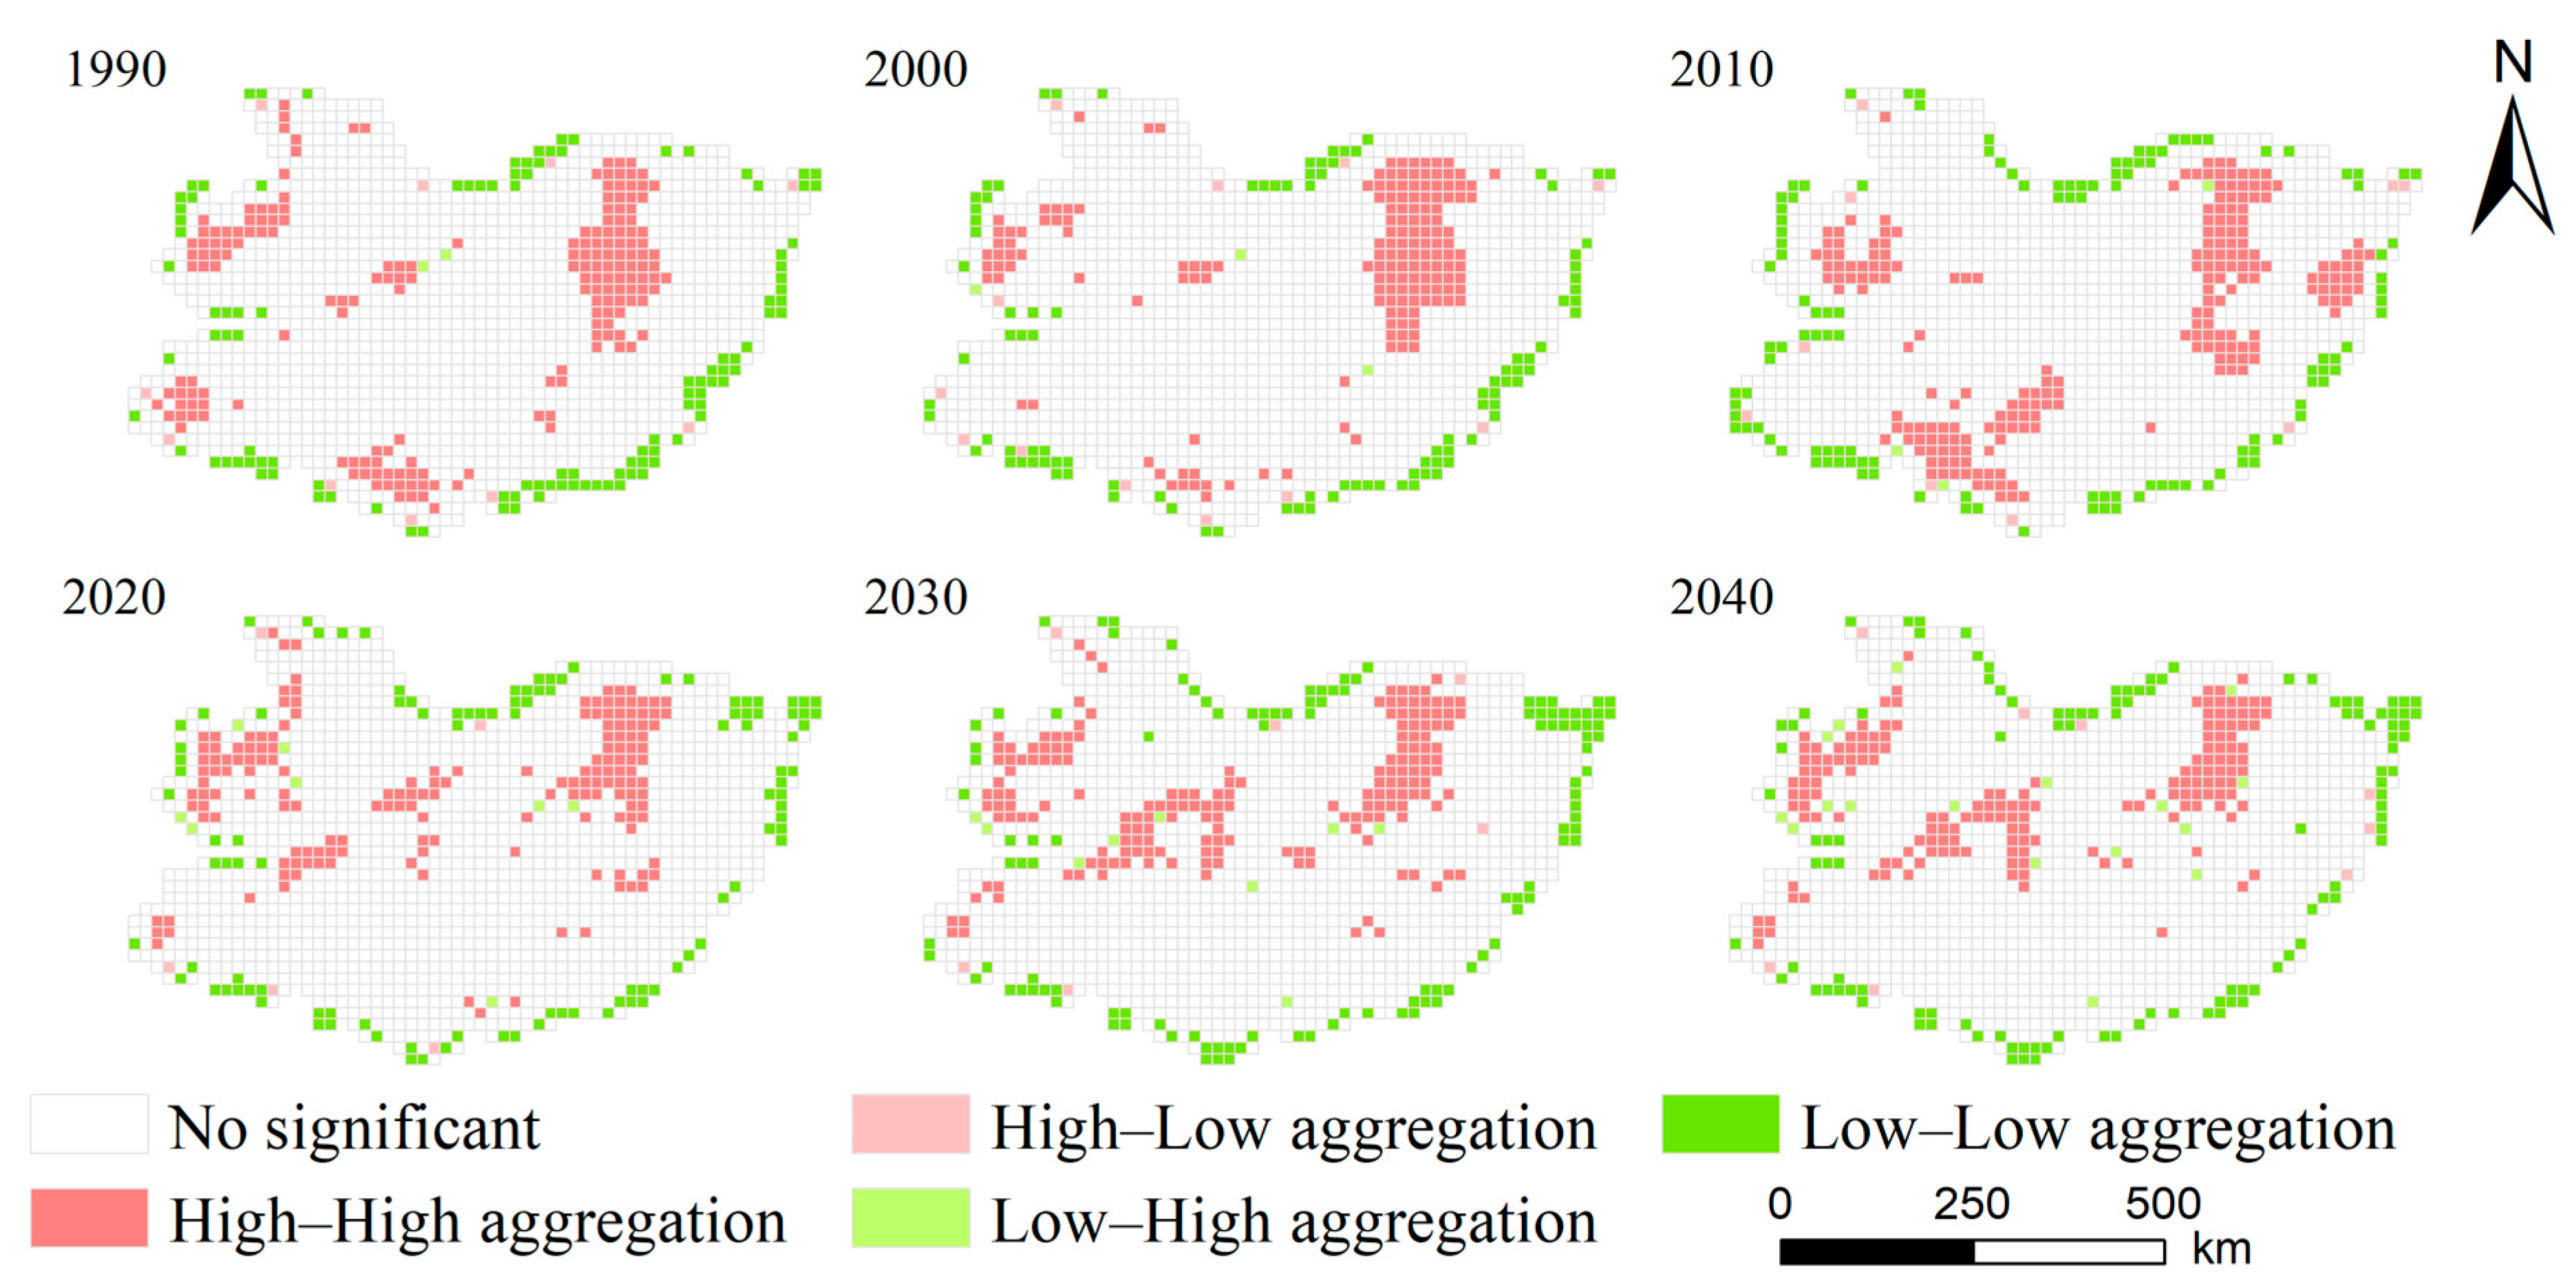
3.2.2. Analysis of Landscape Ecological Risk Spatial Evolution Characteristics

The changes of ecological risk grades in the Selenga River Basin from 1990 to 2040 were calculated in this study (Table 4). The results showed that the Selenga River Basin remains dominated by medium-risk areas and the relatively low-risk area is gradually increasing. It is worth mentioning that the average value of ecological risk in the Selenga River Basin showed a trend of rising first and then falling (from 8.05% to 7.90%). However, the maximum value of LER showed an increasing trend, and increased by 0.9% between 1990 and 2040, indicating that the overall resistance of the study area to external factors increased, but the local ecological risk also increased. The low-risk area is predicted to increase 1.96-fold by 2040 compared to 1990. From the perspective of ecological risk spatial pattern (Figure 6), the Selenga River Basin was generally in a medium ecological risk state in 1990, and the relatively low ecological risk area began to increase after 2020. Low and medium ecological risk areas are primarily concentrated in areas dominated by forest, which are less disturbed by human activities and have high resistance to risk; therefore, the LER is relatively low. The landscape ecological risk in the Central and Orkhon provinces improved, and the ecological risk in Khvvgul Province increased significantly.

3.3. Analysis of the Evolution Trend of Landscape Ecological Risk

The spatial autocorrelation of LER in the Selenga River Basin from 1990 to 2040 was analyzed by using GeoDa. After 999 permutation tests (p = 0.001), the Moran’s I index was calculated, and a LISA cluster map was drawn (Figure 7 and Figure 8). The global Moran’s I showed a trend of rising first and then falling. In 2010, Moran’s I reached a maximum of 0.477, indicating that the degree of spatial aggregation was the highest. The landscape ecological risk in the Selenga River Basin presents a spatial distribution pattern dominated by “H–H” and “L–L”, with less distribution of “H–L” and “L–H”. From the perspective of a time series, the spatial effect of the “cluster” aggregation of “L–L” and “H–H” is gradually enhanced, and the trend of random distribution is weakened.
The results of the LISA cluster map showed that the spatial differences of ecological risk were relatively large and the distribution law of “low at the edge and high in the middle” was present at the basin scale. Except for no significant units, “hot spot” regions (“H–H”) accounted for more than 10% and “cold spot” regions (“L–L”) accounted for over 6%. Therefore, the basin in its entirety was dominated by “hot spot” regions. Among them, the “cold spot” regions are mainly distributed around the basin, while the “hot spot” regions are mainly distributed in areas with large human activities such as Selenga Province and cropland, and the area of “hot spot” regions reached its largest (13.44%) in 2010. The results of landscape ecological risk distribution and LISA cluster diagram show that the high-risk and high-value aggregation areas have a high spatial consistency, which provides mutual confirmation for the risk results of this study. These high-risk areas should be the focus of future land planning, and it is recommended that ecological risk management and control be strengthened.

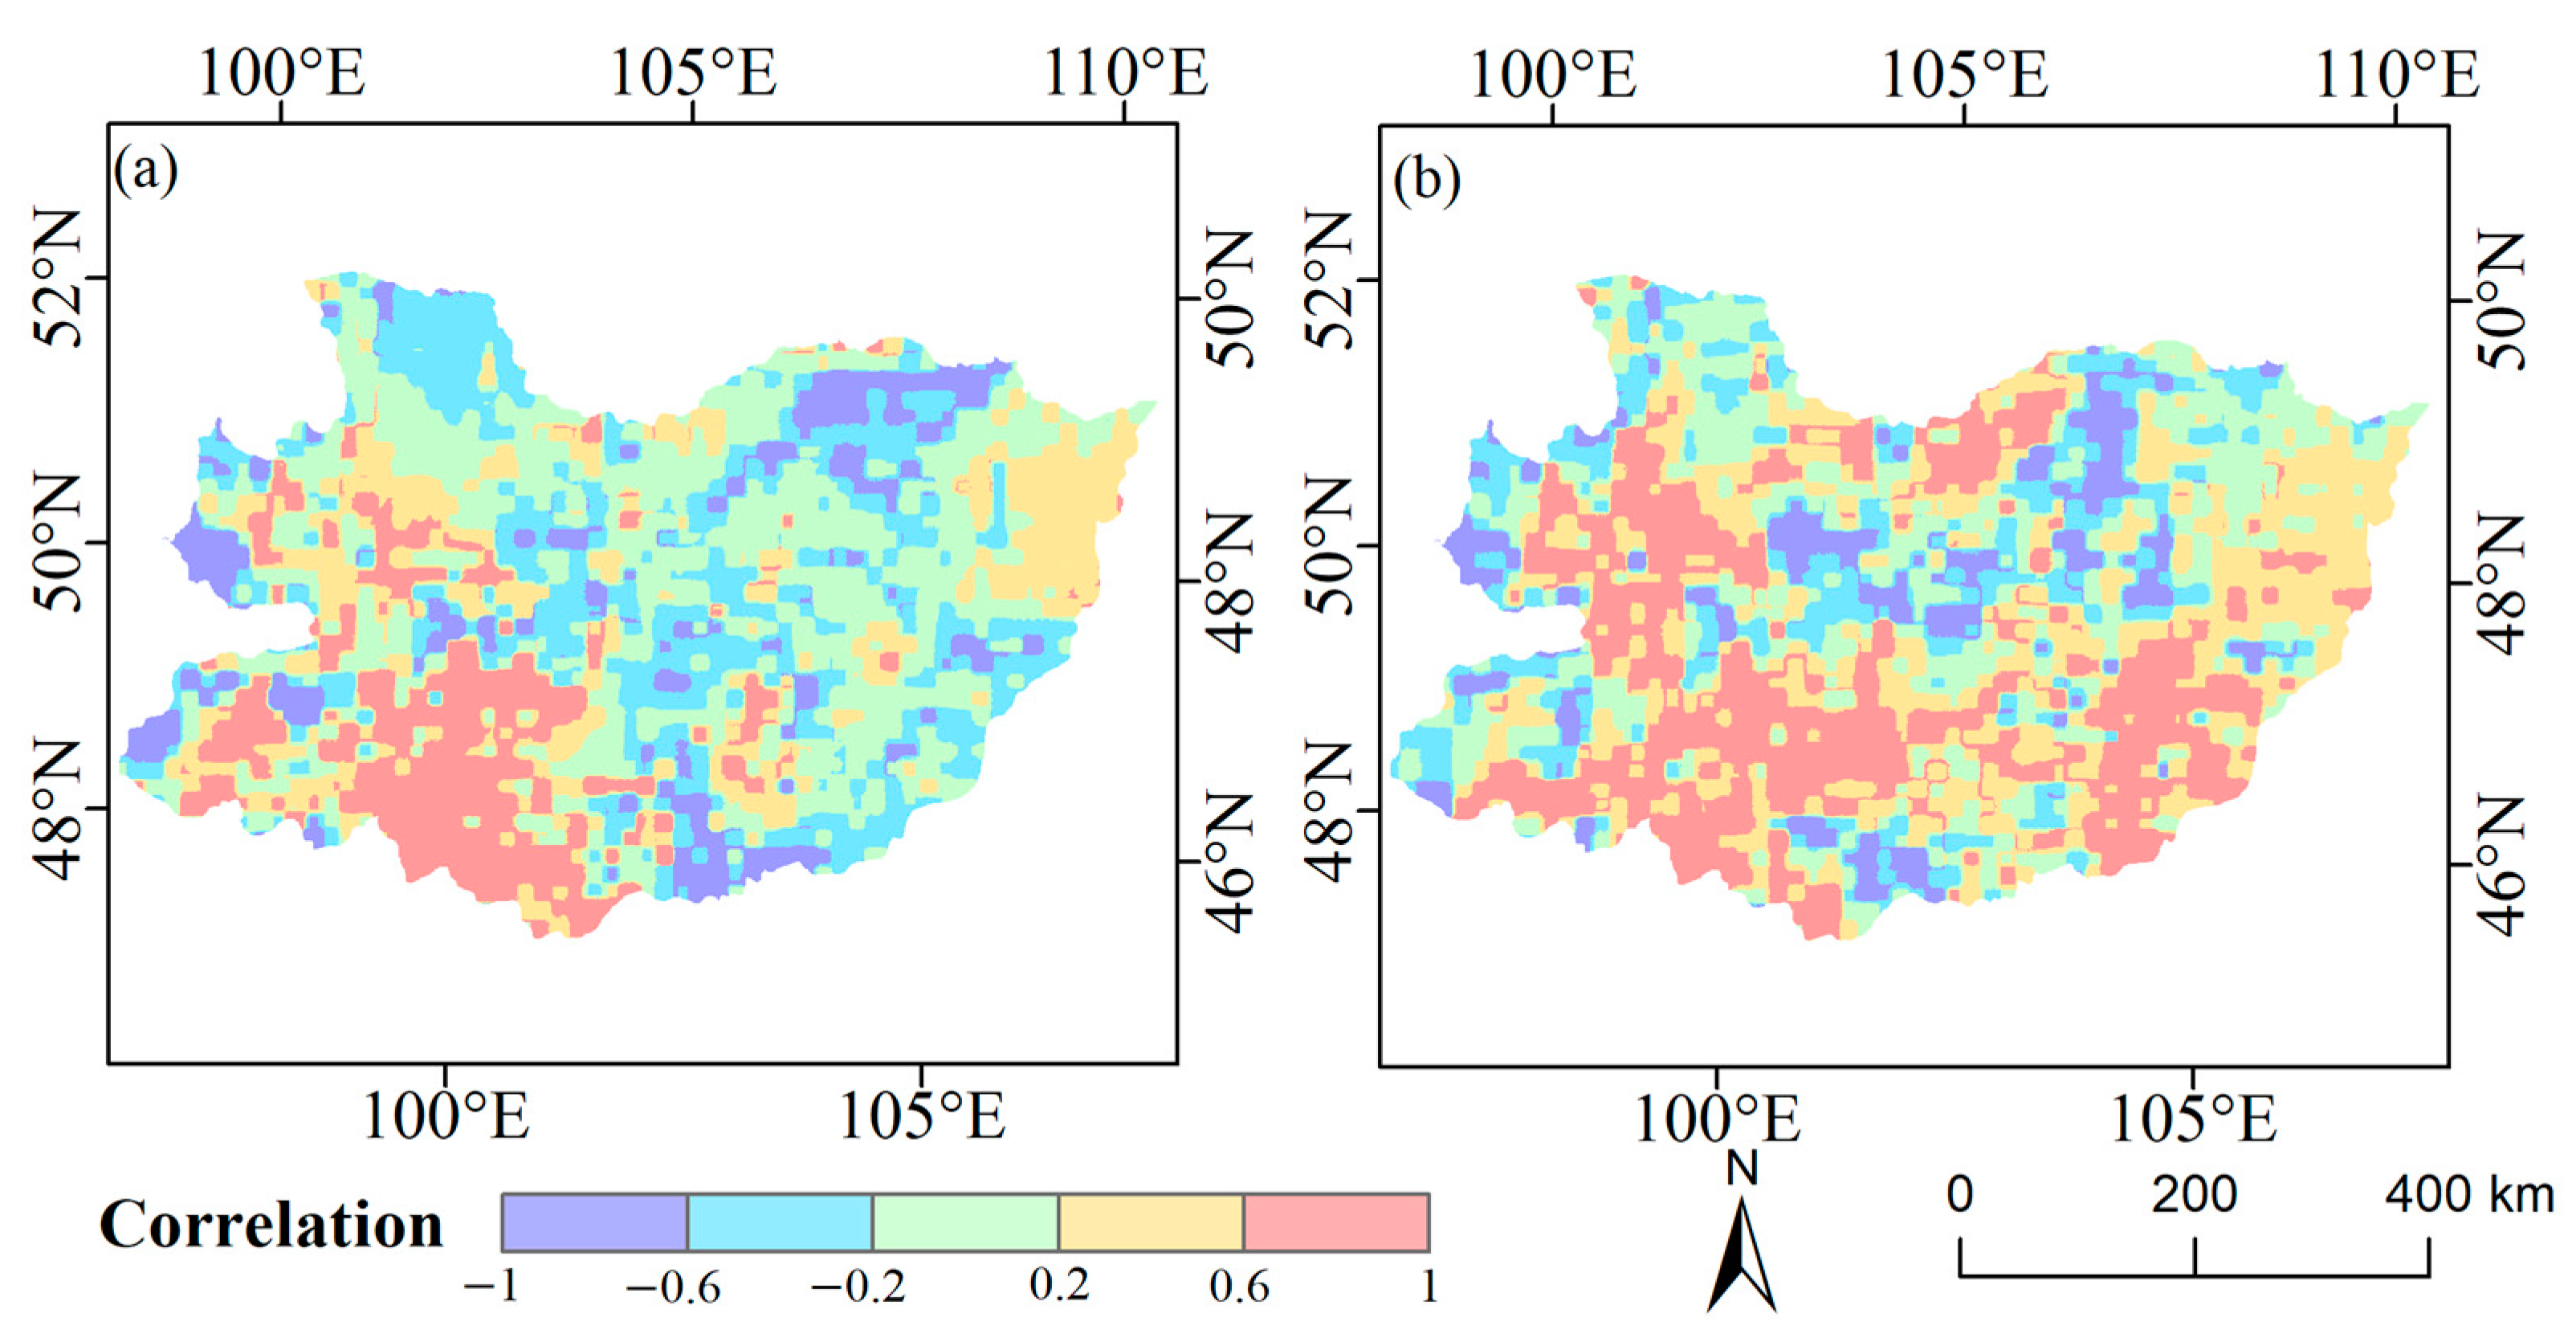
3.4. Analysis of Influencing Factors

The Selenga River Basin is sparsely populated, and its ecological environment is primarily affected by the climate. The partial correlation between LER and climatic factors was calculated considering the time-lagged effect of climate change on ecological risk. The results showed that precipitation was negatively correlated with the degree of risk in most regions, whereas temperature was primarily positively correlated (Figure 9), which may be limited by drought. As shown in Figure 9a, most land types in ecological risk areas that positively correlated with precipitation were areas where fragmented grasslands accumulated, which is inconsistent with the situation in other areas. As shown in Figure 9b, air temperature and LER negatively correlated in areas where forests and fragmented grasslands accumulated.
Under the condition of controlling the influence of temperature, the areas of negative correlation between precipitation and ecological risk were mostly concentrated in the eastern and northern areas of the Selenga River Basin. In contrast, a slightly stronger positive correlation was observed in the southwest region. Under the condition of controlling the influence of precipitation, the areas with a negative correlation between the LER and temperature were primarily distributed in the middle of the Selenga River Basin, and the positive correlated areas were primarily distributed in the southern and northern of the Selenga River Basin. While the landscape ecological risk status in the southwestern region shows a relatively high positive correlation with both precipitation and temperature, which is not only related to human activities but also to the most suitable range of temperature and precipitation; however, this remains unclear.

4. Discussion

4.1. Spatio-Temporal Changes in Land Use

Since 1990, land use change in the Mongolian part of the Selenga River Basin has been more dramatic than in the Russian part, and the frequent occurrence of desertification has caused great damage to the ecological environment, which is primarily related to the expansion of the mining industry, the development of agriculture and the drastic changes in the climate [38]. The barren land area is expected to gradually decrease in the future. The reduction in precipitation has a restrictive effect on croplands, but in the view of the emphasis placed by the local government on expanding cropland areas to increase food production [21], under the comprehensive effect of various factors, such as the natural environment and human activities, the area of cropland has expanded [39]. Since 2010, cropland dynamics have shown positive growth; however, the conversion of forest and natural grassland to pasture and cropland has negatively impacted hydrology and water quality [24,40]. The areas without desertification are mainly concentrated in the upper reaches of the Selenga River Basin, where the vegetation is dominated by forests. From 2015 to 2020, the ecological environment of the Selenga River Basin showed an improvement trend, and its land use type was primarily grassland, but its ecosystem was relatively fragile and extremely vulnerable to degradation due to climate and human activities [41]. The species richness and biomass of plants along the floodplain in the Selenga River Basin also have not fully recovered [42]. In general, the LULC of the Selenga River Basin changed greatly in 2010, and tended to be stable after 2020. This was related to the continuous increase in desertification caused by drought in Mongolia from 2005 to 2015, which led to the further transformation of low and moderate desertification land into high and severe desertification land [43].
The land use type in Selenga River Basin is primarily dominated by grasslands and forests and is also the primary distribution area of croplands in Mongolia [44,45]. Of these, grassland is the most widely distributed, forest is primarily distributed in the northern area of the basin, and croplands are primarily distributed in the central area of the basin. Since 2000, because of the impact of desertification, frequent transformations between grassland and bare land have occurred in the basin, and the original landscape pattern has changed significantly [46]. From 2000 to 2010, Mongolia suffered severe drought, the temperature increased significantly, and precipitation decreased significantly [43]. Dramatic changes in the climate during this period intensified the magnitude of land use changes, with a marked increase in the area of wasteland and the beginning of a decline in the area of grassland, causing serious damage to the ecological environment. Influenced by the Mongolian concept of “development first, governance later” and the four modernization policies, the population density of Ulaanbaatar, the capital of Mongolia, has also begun to steadily increase over the past 30 years [47]. Especially after 2010, urbanization began accelerating, and land for construction increased significantly [48]. This phenomenon is closely related to the establishment of a land privatization system certain anti-urbanization trends. [49]. From 2010 to 2020, climate change gradually slowed. Although the temperature remained relatively high, precipitation increased.

4.2. Landscape Ecological Risk Simulation and Analysis of Influencing Factors

4.2.1. Spatio-Temporal Distribution Characteristics of Ecological Risk

As the direct expression of ecosystem, landscapes have a close relationship with ecological risks [50]. From a spatial perspective, the distribution characteristics of the landscape ecological risk in the Selenga River Basin were “low at the edge and high in the middle”, primarily because the primary landscape types in the central part of the basin were cropland and fragmented grassland [51]. This is not only related to the difference in land use types, but also closely related to local policy management and climate change. Some studies indicate that shows that the cultivated land in the Selenga River Basin is the main agricultural area of Mongolia, which is mainly characterized by the asynchronous development of natural agricultural operations and the retention of traditional nomadic grazing techniques. In the development of the agricultural sector, the main goal is to introduce new varieties that are high-yielding, drought-tolerant, and early-maturing, and the focus of its development is still on animal husbandry, which is not ecologically friendly [52].
From an environmental perspective, both land types have a higher landscape vulnerability index, although the landscape disturbance index is lower, resulting in a relatively higher degree of ecological loss and a higher landscape ecological risk value. The land types in places with low ecological risk are mostly forest land, and low-value aggregation only occurs in the northernmost area; however, the growth status and artificial protection conditions are different in different periods, which also causes the low ecological risk area to change accordingly [53,54]. This study also supports the findings that recent rapid changes in land use on the Mongolian Plateau have led to ecological damage on the Mongolian Plateau [55].In terms of land use types, ecological environments are relatively fragile in areas with less vegetation and frequent desertification, and it is difficult to restore them in a short time. From the time perspective, the degree of transfer between different risk levels varies from year to year because the landscape ecological risk assessment model is established using the landscape indices, which is determined by changes in landscape types and their vulnerability combinations [56].
From 1990 to 2010, the LER in the Selenga River Basin increased steadily, and from 2010 to 2020, the overall situation improved, except for further aggravation in high-risk areas. From 2020 to 2040, the overall ecological environment of the Selenga River Basin shows a trend of improvement, but the governance of high-risk areas is still urgent. It is estimated that the increase in low-risk areas in 2040 will be approximately 1.96-fold that in 1990. This result focuses on the future trend of ecological risk levels in the Selenga River Basin and provides a preliminary discussion on the governance of the ecological environment.

4.2.2. Evaluation and Driving Factors of Ecological Risk Regionalization

The risk concentration of the basin was primarily in the “hot spot” regions, accounting for over 10%, among which the proportion reached its largest (13.44%) in 2010, which had a crucial relationship with the large-scale drought on the Mongolian Plateau caused by climate warming in 2010 [57]. The “cold spot” regions were primarily distributed in the surrounding areas of the basin. Therefore, being attentive to grasslands with medium coverage is necessary to avoid the fragmentation of grasslands and strengthen the protection of forest land to avoid downward trends in low-ecological-risk areas [58].
From 1990 to 2040, the difference in the spatial distribution of LER increases, indicating that the spatial difference between cold and hot spots in the Selenga River Basin will further increase. This is closely related to the local climate change and desertification phenomenon [59]. The land use type of the Selenga River Basin is dominated by prairie and desert grasslands, which are weak in terms of resisting external risks and are easily affected by the external environment, especially climate factors [21]. Therefore, changes in temperature and precipitation are crucial factors affecting the ecological environment of the Mongolian Plateau [60,61], and most studies have shown that climate instability change is the main cause of ecological problems such as desertification on the Mongolian Plateau [62]. From a spatial point of view, the Selenga River Basin has high temperature in the east and low temperature in the west, and high precipitation in the north and low precipitation in the south [57]. According to the results of partial correlation, the ecological risks are mostly at a low risk level in areas with high precipitation, while high temperature is likely to lead to an increase in ecological risks. Ecological risk is minimized when precipitation is high and temperature is low, and vice versa. Related research has shown that climate change is closely related to land use change. Therefore, it can be seen that climate change mainly affects the growth of vegetation, thereby further affecting the change of ecological risk [63]. However, the threshold of climate impact on ecological risk and land use is not clear yet. From a time perspective, relevant studies have shown that since 1940, the average annual temperature in Mongolia has risen by 2.3 °C, increasing at approximately 0.15–0.22 °C per decade and exceeding the global increase of 0.98 °C, which causes severe challenges for the ecological environment of the basin [23,64]. From 1990 to 2010, the average annual precipitation in the Selenga River Basin continued to decline and remained at a low level, negatively impacting the ecological environment. However, precipitation began to increase after 2010, which may be beneficial to vegetation growth and reduces the degree of desertification. Desertification and the level of ecological risk began to decline [65]. Drastic changes in temperature lead to a decrease in vegetation productivity, whereas an increase in precipitation is conducive to vegetation recovery and promotes the restoration of biodiversity [39]. Therefore, when the temperature and precipitation were within a particular range, the temperature and landscape ecological risk values were predominantly positively correlated, whereas precipitation was predominantly negatively correlated. That is, higher precipitation and lower temperatures result in lower ecological risks. However, ecological risks will still be further aggravated when extreme climate conditions occur [57]. There was a positive correlation between the ecological risk in the southwest of this basin and both temperature and precipitation, and the effects of factors other than human activity are still unknown. Overall, Climate change in Mongolia in recent years is beneficial to the reduction of landscape ecological risk [66]. In the context of the development of the “one belt and one road”, the Selenga River Basin, as a key area of the China–Mongolia–Russia Economic Corridor, may become the focus of future development [21]. The impact threshold of future climate on land use and ecological risk changes in arid areas is still unclear, which is also the focus of the next step of exploration.

4.3. Suggestions to Improve the Ecological Conditions of Selenga River Basin

With the development of animal husbandry and mineral resources in Mongolia, the ecological risk level of land use in the Selenga River Basin continues to rise, and the hotspots of LER are shifting to the western part of the river basin. Against the background that the overall ecological risk of the Selenga watershed is on the rise, the artificial landscape has gradually stabilized, but the ecological risk of the natural landscape has been increasing under the influence of human activities. Based on the research in this paper, some suggestions for the landscape ecological risk of the landscape in the Selenga River Basin were proposed.
(1) To maintain the sustainable development of forests and pay attention to the protection of grasslands with medium and high coverage. Forests and grasslands are the most important factors to maintain the stability of the ecological environment.
(2) To strengthen ecological restoration projects. Since 2002, the Mongolian government has cooperated with other countries and international organizations to implement a number of projects such as improving grassland management and preventing desertification.
(3) To establish and improve a sound ecological compensation mechanism. The Selenga River Basin is not only a key area for the development of agriculture and animal husbandry, but also has rich and diverse natural resources. In the past, people exploited resources in large quantities, seriously damaging the ecological environment, but prohibiting residents from acquiring resources arbitrarily would limit local development. Therefore, in order to meet the needs of long-term development, it is necessary to balance the relationship between economic development and ecological environment management with reference to the changing trend of landscape ecological risk. The experience of China’s Sehamba from desert to forest has great value for Mongolia.

4.4. Limitations and Prospects

With the diversification of assessment methods and data, we need more diverse assessment methods, and models are required to comprehensively consider the function and structure of the ecological environment of a basin and the influence of the external environment. This study was limited to relevant studies based on land use change and did not consider other ecological processes. The range of climatic conditions in which positive/negative correlations of the influencing factors appear has not been discussed. Considering the basin as a unit to conduct multi-scale and multi-process ecological simulations and exploring the threshold of influencing factors is the future direction of research for this study.

5. Conclusions

In this study, the PLUS model was used to simulate the spatial distribution of land use in 2030 and 2040, construct a watershed landscape ecological risk assessment model, and analyze the spatio-temporal patterns and influencing factors of ecological risk in the Selenga River Basin from 1990 to 2040. The following conclusions were obtained:
From the perspective of LULC, it can be seen that the landscape types of the Selenga River Basin are primarily forest and grassland. Among them, built area and forest land are increasing, water and cropland began increasing after 2010, and grassland area fluctuated and decreased. Among them, from 1990 to 2010, the comprehensive land use dynamic degree increased from 0.13% to 0.29%. It began to decline after 2010 and is expected to drop to 0.06% by 2040. Judging from the results of landscape ecological risk assessment, the landscape ecological risk of the Selenga River Basin showed a distribution pattern of “low at the edge and high in the middle”. From 2000 to 2040, the average LER showed a trend of increasing first and then decreasing and peaked (0.085) in 2010. The maximum value of the LER shows an increasing trend, with a total increase of 0.9% between 1990 and 2040. By calculating the spatial aggregation of LER, we found that the Selenga River Basin is dominated by “hot spot” regions. The area peaked in 2010, accounting for 13.44% of the total area. Subsequently, there was a trend of decreasing fluctuations, and the “cold spot” regions were primarily distributed around the basin. The LER showed a positive spatial correlation. In 2010, Moran’s I was 0.477, which was the highest degree of spatial aggregation. After 2010, the aggregation of the ecological risks began weakening. The results of the partial correlation analysis showed that under the condition of controlling the influence of temperature, the precipitation and level of landscape ecological risk were primarily negatively correlated and were primarily reflected in the eastern and northern areas of the basin. When controlling the influence of precipitation, the temperature was primarily positively correlated with the landscape ecological risk and was reflected in the south and north of the Selenga River Basin. The climate change in Mongolia in recent years is beneficial to the reduction of landscape ecological risk.
However, this study did not fully consider the function and structure of the ecological environment of the watershed and the effects of the external environment. Exploring thresholds for climate bars that affect the positive/negative correlations of factors is our next step we need to address.

Author Contributions

J.H. and Q.L. were responsible for the conceptualization, methodology, and writing of the original draft; Y.L. and X.W. were responsible for the methodology and data curation; Z.Z. and P.L. were responsible for data checking, review, and editing; X.W. and W.L. helped with the editing and are responsible for the funding acquisition. All authors have read and agreed to the published version of the manuscript.

Funding

This research is supported by the National Natural Science Foundation of China (32061143032, 41941015), the State Key Laboratory of Cryospheric Science (SKLCS-ZZ-2023), and the West Light Foundation of the Chinese Academy of Sciences and Educational the Technology Innovation Project of Gansu Province (2023CXZX-464).

Data Availability Statement

Not applicable.

Acknowledgments

We would like to thank the National Bureau of Statistics of Mongolia, NASA, USGS, and the CRU Organization for their data support. We would also like to thank all the staff members of the Google Earth Engine and Google Colaboratory. Special thanks also go to the reviewers and editors; your comments and suggestions have greatly improved the paper’s content.

Conflicts of Interest

The authors declare that they have no known competing financial interests or personal relationships that could have appeared to influence the work reported in this paper.

References

  1. Radnaeva, L.D.; Bazarzhapov, T.Z.; Shiretorova, V.G.; Zhigzhitzhapova, S.V.; Nikitina, E.P.; Dylenova, E.P.; Shirapova, G.S.; Budaeva, O.D.; Beshentsev, A.N.; Garmaev, E.Z.; et al. Ecological state of lake Gusinoe—A cooling pond of the Gusinoozersk GRES. Water 2022, 14, 4. [Google Scholar] [CrossRef]
  2. Gao, L.; Tao, F.; Liu, R.; Wang, Z.; Leng, H.; Zhou, T. Multi-scenario simulation and ecological risk analysis of land use based on the PLUS model: A case study of Nanjing. Sustain. Cities Soc. 2022, 85, 104055. [Google Scholar] [CrossRef]
  3. Winkler, K.; Fuchs, R.; Rounsevell, M.; Herold, M. Global land use changes are four times greater than previously estimated. Nat. Commun. 2021, 12, 2501. [Google Scholar] [CrossRef] [PubMed]
  4. Zhang, W.; Chang, W.J.; Zhu, Z.C.; Hui, Z. Landscape ecological risk assessment of Chinese coastal cities based on land use change. Appl. Geogr. 2020, 117, 102174. [Google Scholar] [CrossRef]
  5. Nasiakou, S.; Vrahnakis, M.; Chouvardas, D.; Mamanis, G.; Kleftoyanni, V. Land use changes for investments in Silvoarable agriculture projected by the CLUE-S Spatio-temporal model. Land 2022, 11, 598. [Google Scholar] [CrossRef]
  6. Li, X.; Li, W.; Gao, Y. Multi-Scenario Simulation of Green Space Landscape Pattern in Harbin City Based on FLUS Model. Int. J. Environ. Res. Public Health 2023, 20, 4286. [Google Scholar] [CrossRef]
  7. Ku, C.-A. Incorporating spatial regression model into cellular automata for simulating land use change. Appl. Geogr. 2016, 69, 1–9. [Google Scholar] [CrossRef]
  8. Pinto, N.; Antunes, A.P.; Roca, J. Applicability and calibration of an irregular cellular automata model for land use change. Comput. Environ. Urban Syst. 2017, 65, 93–102. [Google Scholar] [CrossRef]
  9. Zhai, Y.; Yao, Y.; Guan, Q.; Liang, X.; Li, X.; Pan, Y.; Yue, H.; Yuan, Z.; Zhou, J. Simulating urban land use change by integrating a convolutional neural network with vector-based cellular automata. Int. J. Geogr. Inf. Sci. 2020, 34, 1475–1499. [Google Scholar] [CrossRef]
  10. Lin, J.; Li, X.; Wen, Y.; He, P. Modeling urban land-use changes using a landscape-driven patch-based cellular automaton (LP-CA). Cities 2023, 132, 103906. [Google Scholar] [CrossRef]
  11. Liang, X.; Guan, Q.; Clarke, K.C.; Liu, S.; Wang, B.; Yao, Y. Understanding the drivers of sustainable land expansion using a patch-generating land use simulation (PLUS) model: A case study in Wuhan, China. Comput. Environ. Urban Syst. 2020, 85, 101569. [Google Scholar] [CrossRef]
  12. Verburg, P.H.; Soepboer, W.; Veldkamp, A.; Limpiada, R.; Espaldon, V.; Mastura, S.S.A. Modeling the spatial dynamics of regional land use: The CLUE-S model. Environ. Manag. 2002, 30, 391–405. [Google Scholar] [CrossRef] [PubMed]
  13. Skaare, J.U.; Larsen, H.J.; Lie, E.; Bernhoft, A.; E Derocher, A.; Norstrom, R.; Ropstad, E.; Lunn, N.F.; Wiig, Ø. Ecological risk assessment of persistent organic pollutants in the arctic. Toxicology 2002, 181–182, 193–197. [Google Scholar] [CrossRef] [PubMed]
  14. Hu, J.; Zhao, S.; Nan, Z.; Wu, X.; Sun, X.; Cheng, G. An effective approach for mapping permafrost in a large area using subregion maps and satellite data. Permafr. Periglac. Process. 2020, 31, 548–560. [Google Scholar] [CrossRef]
  15. Huang, F.; Ochoa, C.G.; Jarvis, W.T.; Zhong, R.; Guo, L. Evolution of landscape pattern and the association with ecosystem services in the Ili-Balkhash Basin. Environ. Monit. Assess. 2022, 194, 171. [Google Scholar] [CrossRef] [PubMed]
  16. McEachran, Z.P.; Slesak, R.A.; Karwan, D.L. From skid trails to landscapes: Vegetation is the dominant factor influencing erosion after forest harvest in a low relief glaciated landscape. For. Ecol. Manag. 2018, 430, 299–311. [Google Scholar] [CrossRef]
  17. Wang, H.; Liu, X.; Zhao, C.; Chang, Y.; Liu, Y.; Zang, F. Spatial-temporal pattern analysis of landscape ecological risk assessment based on land use/land cover change in Baishuijiang National nature reserve in Gansu Province, China. Ecol. Indic. 2021, 124, 107454. [Google Scholar] [CrossRef]
  18. Zhang, S.; Zhong, Q.; Cheng, D.; Xu, C.; Chang, Y.; Lin, Y.; Li, B. Landscape ecological risk projection based on the PLUS model under the localized shared socioeconomic pathways in the Fujian Delta region. Ecol. Indic. 2022, 136, 108642. [Google Scholar] [CrossRef]
  19. Yang, R.; Bai, Z.; Pan, J.; Zhang, J.; Liu, X. Ecological risk analysis of countries along the belt and road based on LUCC: Taking Kuwait as a typical case. Acta Ecol. Sin. 2021, 42, 171–179. [Google Scholar] [CrossRef]
  20. Gao, B.; Wu, Y.; Li, C.; Zheng, K.; Wu, Y.; Wang, M.; Fan, X.; Ou, S. Multi-scenario prediction of landscape ecological risk in the Sichuan-Yunnan ecological barrier based on terrain gradients. Land 2022, 11, 2079. [Google Scholar] [CrossRef]
  21. Ren, Y.; Li, Z.; Li, J.; Ding, Y.; Miao, X. Analysis of Land Use/Cover Change and Driving Forces in the Selenga River Basin. Sensors 2022, 22, 1041. [Google Scholar] [CrossRef] [PubMed]
  22. Ma, X.; Yasunari, T.; Ohata, T.; Natsagdorj, L.; Davaa, G.; Oyunbaatar, D. Hydrological regime analysis of the Selenge River basin, Mongolia. Hydrol. Process. 2003, 17, 2929–2945. [Google Scholar] [CrossRef]
  23. Zorigt, M.; Battulga, G.; Sarantuya, G.; Kenner, S.; Soninkhishig, N.; Hauck, M. Runoff dynamics of the upper Selenge basin, a major water source for Lake Baikal, under a warming climate. Reg. Environ. Chang. 2019, 19, 2609–2619. [Google Scholar] [CrossRef]
  24. Kasimov, N.; Karthe, D.; Chalov, S. Environmental change in the Selenga River—Lake Baikal Basin. Reg. Environ. Chang. 2017, 17, 1945–1949. [Google Scholar] [CrossRef]
  25. Hao, J.; Lin, Q.; Wu, T.; Chen, J.; Li, W.; Wu, X.; Hu, G.; La, Y. Spatial–temporal and driving factors of land use/cover change in Mongolia from 1990 to 2021. Remote Sens. 2023, 15, 1813. [Google Scholar] [CrossRef]
  26. Pande, C.B.; Moharir, K.N.; Khadri, S.F.R.; Patil, S. Study of land use classification in an arid region using multispectral satellite images. Appl. Water Sci. 2018, 8, 123. [Google Scholar] [CrossRef]
  27. Yu, M.; Li, Y.; Luo, G.; Yu, L.; Chen, M. Agroecosystem composition and landscape ecological risk evolution of rice terraces in the southern mountains, China. Ecol. Indic. 2022, 145, 109625. [Google Scholar] [CrossRef]
  28. Karimian, H.; Zou, W.; Chen, Y.; Xia, J.; Wang, Z. Landscape ecological risk assessment and driving factor analysis in Dongjiang river watershed. Chemosphere 2022, 307, 135835. [Google Scholar] [CrossRef]
  29. Fan, J.; Wang, Y.; Zhou, Z.; You, N.; Meng, J. Dynamic ecological risk assessment and management of land use in the middle reaches of the Heihe river based on landscape patterns and spatial statistics. Sustainability 2016, 8, 536. [Google Scholar] [CrossRef]
  30. Tian, P.; Li, J.; Gong, H.; Pu, R.; Cao, L.; Shao, S.; Shi, Z.; Feng, X.; Wang, L.; Liu, R. Research on land use changes and ecological risk assessment in Yongjiang river basin in Zhejiang Province, China. Sustainability 2019, 11, 2817. [Google Scholar] [CrossRef]
  31. Qian, Y.; Dong, Z.; Yan, Y.; Tang, L. Ecological risk assessment models for simulating impacts of land use and landscape pattern on ecosystem services. Sci. Total. Environ. 2022, 833, 155218. [Google Scholar] [CrossRef] [PubMed]
  32. Omar, H.; Cabral, P. Ecological Risk Assessment Based on Land Cover Changes: A Case of Zanzibar (Tanzania). Remote Sens. 2020, 12, 3114. [Google Scholar] [CrossRef]
  33. Pontius, R.G.; Huang, J.; Jiang, W.; Khallaghi, S.; Lin, Y.; Liu, J.; Quan, B.; Ye, S. Rules to write mathematics to clarify metrics such as the land use dynamic degrees. Landsc. Ecol. 2017, 32, 2249–2260. [Google Scholar] [CrossRef]
  34. Qiao, F.; Bai, Y.; Xie, L.; Yang, X.; Sun, S. Spatio-temporal characteristics of landscape ecological risks in the ecological functional zone of the Upper Yellow River, China. Int. J. Environ. Res. Public Health 2021, 18, 12943. [Google Scholar] [CrossRef]
  35. Xue, L.; Zhu, B.; Wu, Y.; Wei, G.; Liao, S.; Yang, C.; Wang, J.; Zhang, H.; Ren, L.; Han, Q. Dynamic projection of ecological risk in the Manas River basin based on terrain gradients. Sci. Total Environ. 2018, 653, 283–293. [Google Scholar] [CrossRef]
  36. Jaya, I.G.N.M.; Andriyana, Y.; Tantular, B.; Zulhanif; Ruchjana, B. Spatiotemporal dengue disease clustering by means local spatiotemporal Moran’s index. IOP Conf. Ser. Mater. Sci. Eng. 2019, 621, 012017. [Google Scholar] [CrossRef]
  37. Wang, S.; Li, R.; Wu, Y.; Zhao, S. Vegetation dynamics and their response to hydrothermal conditions in Inner Mongolia, China. Glob. Ecol. Conserv. 2022, 34, e02034. [Google Scholar] [CrossRef]
  38. Priess, J.A.; Schweitzer, C.; Wimmer, F.; Batkhishig, O.; Mimler, M. The consequences of land-use change and water demands in Central Mongolia. Land Use Policy 2011, 28, 4–10. [Google Scholar] [CrossRef]
  39. Pang, G.; Wang, X.; Yang, M. Using the NDVI to identify variations in, and responses of, vegetation to climate change on the Tibetan Plateau from 1982 to 2012. Quat. Int. 2017, 444, 87–96. [Google Scholar] [CrossRef]
  40. Minderlein, S.; Menzel, L. Evapotranspiration and energy balance dynamics of a semi-arid mountainous steppe and shrubland site in Northern Mongolia. Environ. Earth Sci. 2015, 73, 593–609. [Google Scholar] [CrossRef]
  41. Martins, C.C.; Adams, J.K.; Yang, H.; Shchetnikov, A.A.; Di Domenico, M.; Rose, N.L.; Mackay, A.W. Earthquake, floods and changing land use history: A 200-year overview of environmental changes in Selenga River basin as indicated by n-alkanes and related proxies in sediments from shallow lakes. Sci. Total Environ. 2023, 873, 162245. [Google Scholar] [CrossRef] [PubMed]
  42. Goncharov, A.V.; Baturina, N.S.; Maryinsky, V.V.; Kaus, A.K.; Chalov, S.R. Ecological assessment of the Selenga River basin, the main tributary of Lake Baikal, using aquatic macroinvertebrate communities as bioindicators. J. Great Lakes Res. 2020, 46, 53–61. [Google Scholar] [CrossRef]
  43. Meng, X.; Gao, X.; Li, S.; Li, S.; Lei, J. Monitoring desertification in Mongolia based on Landsat images and Google Earth Engine from 1990 to 2020. Ecol. Indic. 2021, 129, 107908. [Google Scholar] [CrossRef]
  44. Yekimovskaya, O.A.; Lopatina, D.N. The features of development of agricultural land use in the Republic of Buryatia and Mongolia (the Selenga River basin). IOP Conf. Ser. Earth Environ. Sci. 2019, 320, 012007. [Google Scholar] [CrossRef]
  45. Bazarzhapov, T.Z.; Shiretorova, V.G.; Radnaeva, L.D.; Suocheng, D.; Tulokhonov, A.K. Chemical composition of surface water in the main tributaries of Lake Baikal—The Selenga and the Barguzin Rivers. IOP Conf. Ser. Earth Environ. Sci. 2019, 320, 012020. [Google Scholar] [CrossRef]
  46. Wei, H.; Wang, J.; Han, B. Desertification information extraction along the China–Mongolia railway supported by multisource feature space and geographical zoning modeling. IEEE J. Sel. Top. Appl. Earth Obs. Remote Sens. 2020, 13, 392–402. [Google Scholar] [CrossRef]
  47. Xu, Y.; Zhang, Y.; Kinnucan, H.; Chen, J. Bound to Ulaanbaatar in Mongolia. Eurasian Geogr. Econ. 2022, 64, 460–483. [Google Scholar] [CrossRef]
  48. Dong, S.; Zheng, J.; Li, Y.; Li, Z.; Li, F.; Jin, L.; Yang, Y.; Bilgaev, A. Quantitative Analysis of the Coupling Coordination Degree Between Urbanization and Eco-environment in Mongolia. Chin. Geogr. Sci. 2019, 29, 861–871. [Google Scholar] [CrossRef]
  49. Ren, Y.; Li, Z.; Li, J.; Dashtseren, A.; Li, Y.; Altanbagana, M. Comparative analysis of driving forces of land use/cover change in the upper, middle and lower reaches of the Selenga River Basin. Land Use Policy 2022, 117, 106118. [Google Scholar] [CrossRef]
  50. Ju, H.; Niu, C.; Zhang, S.; Jiang, W.; Zhang, Z.; Zhang, X.; Yang, Z.; Cui, Y. Spatiotemporal patterns and modifiable areal unit problems of the landscape ecological risk in coastal areas: A case study of the Shandong Peninsula, China. J. Clean. Prod. 2021, 310, 127522. [Google Scholar] [CrossRef]
  51. Swadling, D.S.; West, G.J.; Gibson, P.T.; Laird, R.J.; Glasby, T.M. Don’t go breaking apart: Anthropogenic disturbances predict meadow fragmentation of an endangered seagrass. Aquat. Conserv. Mar. Freshw. Ecosyst. 2023, 33, 56–69. [Google Scholar] [CrossRef]
  52. Ekimovskaya, O.A.; Belozertseva, I.A.; Amgalan, S.E.; Badmaev, N.B. Economic-geographical characteristics of agricultural land use within the Selenga river basin. IOP Conf. Ser. Earth Environ. Sci. 2018, 190, 012019. [Google Scholar] [CrossRef]
  53. Fraver, S.; Brokaw, N.V.L.; Smith, A.P. Delimiting the gap phase in the growth cycle of a Panamanian forest. J. Trop. Ecol. 1998, 14, 673–681. [Google Scholar] [CrossRef]
  54. Duan, S.; He, H.S.; Spetich, M. Effects of growing-season drought on phenology and productivity in the west region of central hardwood forests, USA. Forests 2018, 9, 377. [Google Scholar] [CrossRef]
  55. Fernández-Giménez, M.E.; Venable, N.H.; Angerer, J.; Fassnacht, S.R.; Reid, R.S.; Khishigbayar, J. Exploring linked ecological and cultural tipping points in Mongolia. Anthropocene 2017, 17, 46–69. [Google Scholar] [CrossRef]
  56. Lin, J.; Lin, M.; Chen, W.; Zhang, A.; Qi, X.; Hou, H. Ecological risks of geological disasters and the patterns of the urban agglomeration in the Fujian Delta region. Ecol. Indic. 2021, 125, 107475. [Google Scholar] [CrossRef]
  57. Garmaev, E.Z.; P’yankov, S.V.; Shikhov, A.N.; Ayurzhanaev, A.A.; Sodnomov, B.V.; Abdullin, R.K.; Tsydypov, B.Z.; Andreev, S.G.; Chernykh, V.N. Mapping modern climate change in the Selenga river basin. Russ. Meteorol. Hydrol. 2022, 47, 113–122. [Google Scholar] [CrossRef]
  58. Zhu, Z.; Mei, Z.; Xu, X.; Feng, Y.; Ren, G. Landscape ecological risk assessment based on land use change in the Yellow River basin of Shaanxi, China. Int. J. Environ. Res. Public Health 2022, 19, 9547. [Google Scholar] [CrossRef]
  59. Xu, S.; Wang, J.; Altansukh, O.; Chuluun, T. Spatial-temporal pattern of desertification in the Selenge River Basin of Mongolia from 1990 to 2020. Front. Environ. Sci. 2023, 11, 1125583. [Google Scholar] [CrossRef]
  60. Jiang, L.; Jiapaer, G.; Bao, A.; Kurban, A.; Guo, H.; Zheng, G.; De Maeyer, P. Monitoring the long-term desertification process and assessing the relative roles of its drivers in Central Asia. Ecol. Indic. 2019, 104, 195–208. [Google Scholar] [CrossRef]
  61. Hu, Y.; Han, Y.; Zhang, Y. Land desertification and its influencing factors in Kazakhstan. J. Arid Environ. 2020, 180, 104203. [Google Scholar] [CrossRef]
  62. Guo, X.; Chen, R.; Thomas, D.S.; Li, Q.; Xia, Z.; Pan, Z. Divergent processes and trends of desertification in Inner Mongolia and Mongolia. Land Degrad. Dev. 2020, 32, 3684–3697. [Google Scholar] [CrossRef]
  63. Li, X.; Yang, L. Accelerated Restoration of Vegetation in Wuwei in the Arid Region of Northwestern China since 2000 Driven by the Interaction between Climate and Human Beings. Remote Sens. 2023, 15, 2675. [Google Scholar] [CrossRef]
  64. IPCC. Climate Change 2013: The Physical Science Basis. Contribution of Working Group I to the Fifth Assessment Report of the Intergovernmental Panel on Climate Change; Cambridge University Press: Cambridge, UK, 2013. [Google Scholar]
  65. Enebish, B.; Dashkhuu, D.; Renchin, M.; Russell, M.; Singh, P. Impact of Climate on the NDVI of Northern Mongolia. J. Indian Soc. Remote Sens. 2019, 48, 333–340. [Google Scholar] [CrossRef]
  66. Molinos, J.G.; Takao, S.; Kumagai, N.H.; Poloczanska, E.S.; Burrows, M.T.; Fujii, M.; Yamano, H. Improving the interpretability of climate landscape metrics: An ecological risk analysis of Japan’s Marine Protected Areas. Glob. Chang. Biol. 2017, 23, 4440–4452. [Google Scholar] [CrossRef]
Figure 1. Location map of the study area.
Remotesensing 15 04262 g001
Figure 2. Methodological flowchart for this study.
Remotesensing 15 04262 g002
Figure 3. Land cover map of the Selenga River Basin from 1990 to 2040. (Note: 1 is cropland, 2 is forest, 3 is built area, 4 is water, 5 is barren, 6 is grassland, is direction of land type conversion).
Remotesensing 15 04262 g003
Figure 4. Land use dynamic degrees of the Selenga River Basin from 1990 to 2040.
Remotesensing 15 04262 g004
Figure 5. Variation function curve of landscape risk from 1990 to 2040.
Remotesensing 15 04262 g005
Figure 6. Distribution map of ecological risk levels from 1990 to 2040.
Remotesensing 15 04262 g006
Figure 7. Moran scatter diagram of landscape ecological risk from 1990 to 2040.
Remotesensing 15 04262 g007
Figure 8. Local autocorrelation LISA cluster map of landscape ecological risk.
Remotesensing 15 04262 g008
Figure 9. Partial correlation analysis between climate factors and landscape ecological risks. (a) Controlling temperature and the correlation of LER with precipitation; (b) controlling precipitation and the correlation of LER with temperature.
Remotesensing 15 04262 g009
Table 1. Data source description (All data accessed on 1 January 2023).
Data TypesTimeData SourceData Address
Driving
factors
DEM2000NASAhttps://srtm.csi.cgiar.org
NDVI1990–2020NOAAhttps://www.noaa.gov/
EVI1990–2020NOAAhttps://www.noaa.gov/
Road, Railroad1990–2021GRIP global roadshttps://download.geofabrik.de/index.html
Influencing
factors
Temperature1990–2021CRUhttps://crudata.uea.ac.uk
Precipitation1990–2021CRUhttps://crudata.uea.ac.uk
Table 2. Area of land use types of the Selenga River Basin from 1990 to 2040.
Land Use TypeArea/km2
199020002010202020302040
Cropland7710800577588729940010065
Forest77,35772,88279,20286,09686,32086,546
Built area21224540272410791396
Water464946873957447848805562
Barren447244356707741973957373
Grassland220,601224,770214,670204,538202,498200,530
Table 3. Semi-variance function fitting of the landscape risk index from 1990 to 2040.
YearModelNugget ValueSill ValuesBlock Base RatioRange
1990Gaussian Model0.0094600.0123400.76661 168,932
2000Gaussian Model0.0093940.0146400.64167 220,984
2010Gaussian Model0.0088840.0122600.72463 166,216
2020Exponential Model0.0121480.0143400.84714 193,716
2030Gaussian Model0.0135050.0160000.84406 345,408
2040Exponential Model0.0138070.0163600.84395 215,776
Table 4. Area of ecological risk grades in the Selenga River Basin from 1990 to 2040.
YearEcological Risk Area Percentage (%)LER Value
Low RiskRelatively Low RiskMedium RiskRelatively High RiskHigh RiskMaxMeanMin
19902.3119.3241.2428.428.710.1530.0810
20002.1920.6338.4930.088.610.1460.0810
20102.1818.5340.1326.9412.220.1470.0850
20204.0629.5033.9723.798.680.1610.0780
20304.4527.9232.6423.8411.160.1630.0790
20404.5427.7731.9124.7811.000.1620.0790
Disclaimer/Publisher’s Note: The statements, opinions and data contained in all publications are solely those of the individual author(s) and contributor(s) and not of MDPI and/or the editor(s). MDPI and/or the editor(s) disclaim responsibility for any injury to people or property resulting from any ideas, methods, instructions or products referred to in the content.

