Article

Spatiotemporal Variations of Global Terrestrial Typical Vegetation EVI and Their Responses to Climate Change from 2000 to 2021

1
College of Resource Environment and Tourism, Capital Normal University, Beijing 100048, China
2
Beijing Laboratory of Water Resources Security, Capital Normal University, Beijing 100048, China
3
State Key Laboratory of Simulation and Regulation of Water Cycle in River Basin, China Institute of Water Resources and Hydropower Research, Beijing 100038, China
4
Laboratory of Air and Environmental Monitoring, Department of Environment and Forest Engineering, School of Engineering and Applied Sciences, National University of Mongolia, Ulaanbaatar 210646, Mongolia
*
Author to whom correspondence should be addressed.
Remote Sens. 2023, 15(17), 4245; https://doi.org/10.3390/rs15174245
Submission received: 21 July 2023 / Revised: 22 August 2023 / Accepted: 26 August 2023 / Published: 29 August 2023

Abstract

:
With the increasing impact of climate change on ecosystems, it is crucial to analyze how changes in precipitation and temperature affect global ecosystems. Therefore, this study aims to investigate the spatiotemporal variation characteristics of the Enhanced Vegetation Index (EVI) in the global forest, grassland, shrubland, and tundra (FGST) from 2000 to 2021. We utilized partial correlation analysis and grey relation analysis to assess the responses of different vegetation types to precipitation, temperature, and extreme water and heat indicators. The result shows that, despite a “warmer and drier” trend in FGST (excluding tundra), global climate change has not adversely affected the ongoing vegetation growth. It presents a favorable implication for global carbon dioxide assimilation. Different vegetation types displayed different sensitivities to changes in precipitation and temperature. Shrubland proved to be the most sensitive, followed by grassland, forest, and tundra. As the impacts of global climate change intensify, it becomes crucial to direct our attention toward dynamics of vegetation types demonstrating heightened sensitivity to fluctuations in precipitation and temperature. Our study indicates that, except for forests, extreme precipitation indicators have a stronger impact on EVI than extreme temperature indicators. Forests and tundra have demonstrated heightened susceptibility to the intensity of extreme climatic events, while grasslands and shrublands have been more sensitive to the duration of such events. Understanding these responses can offer valuable insights for developing targeted strategies for adaptation and preservation. Our study enhances comprehension of the feedback relationship between global climate change and vegetation, offering scientific evidence for global climate change evaluation.

1. Introduction

Global precipitation patterns have significantly changed due to climate warming [1], resulting in varying ecosystem impacts [2,3,4]. Satellite observations have shown a greening trend to different extents globally in recent decades [5,6]. However, the causes of greening vary between regions and vegetation types. Recent studies have identified croplands as contributing significantly to global greening [7]. Nevertheless, the changes in croplands are not an accurate reflection of the ecological effects of global climate changes because they are heavily influenced by human activities. Compared with croplands, forests, grasslands, shrublands, and tundra (FGST) are usually more directly affected by climate changes and play a crucial role in maintaining ecological stability, preserving ecosystem diversity [8,9,10], and regulating global water and carbon cycles [11,12]. Temperature is a critical factor that affects the growth of vegetation, and a suitable temperature is a prerequisite for the normal growth and development of vegetation [13,14], particularly for plants in low-temperature environments (e.g., tundra) [15]. In addition, temperature plays a vital role in regulating the physiological activities of plants and soil microorganisms, such as enzymatic reactions [16]. Precipitation is another key factor affecting the ecosystem, being directly or indirectly involved in the physiological activities of vegetation [17]. In arid and semi-arid regions, such as shrublands and grasslands, precipitation (rain and snow) is a pivotal driver of ecosystems [18]. Fluctuations in precipitation can also trigger changes in nutrient cycling and productivity [19]. Identifying the patterns of global changes in FGST and their responses to precipitation and temperature will help us better understand the mechanisms by which climate change affects global ecosystems.
With different growth environments and physiological habits, FGST have varying degrees of sensitivity to changes in precipitation and temperature [20]. Forest ecosystems are particularly sensitive to shifts in temperature and precipitation [21]. In some regions, forest cover increases with warmer temperatures and more favorable precipitation [22], whereas climate disasters caused directly or indirectly by changes in temperature and precipitation, such as drought, wildfires, heavy rains, and floods, increase tree mortality rates [21,23]. Grassland and shrubland ecosystems are primarily found in arid and semi-arid regions and are more susceptible to precipitation [24,25]. In contrast, rising temperatures alter vegetation phenology and accelerate vegetation growth [26]. In addition, the increased frequency of fire and drought events caused by climate change significantly affects the ecological structure and community composition of grassland and shrubland ecosystems [27]. The vegetation growth conditions in the tundra ecosystem in the high latitudes of the northern hemisphere are harsh, with some regions being situated within permafrost zones [15]. With climate change, particularly the thawing and melting of permafrost by the accelerated temperature rise [28], the decrease in albedo caused by melting polar glaciers [15], the extension of the vegetation growing season [29], and the expansion of shrubs [15] have become essential factors contributing to Arctic greening. Furthermore, climate change has increased the intensity and frequency of extreme events globally [30,31,32]. Considering the variations in the adaptive range or resilience of different vegetation types to changes in precipitation and temperature, we need to pay particular attention to the potential impacts of frequent extreme climate events on ecosystem stability. However, our current understanding of how exacerbated extreme climate events under the backdrop of climate change affect different ecosystems remains inadequate. With the increasing scope and magnitude of climate change impacts on global ecosystems, there is an urgent need for a global-scale assessment of the effects of precipitation and temperature changes on different ecosystems to improve our ability to respond to climate change.
As a large-scale and long-term technical approach, remote sensing monitoring for vegetation provides possibilities for assessing global FGST ecosystem changes [6]. EVI (Enhanced Vegetation Index), a more sensitive vegetation index than NDVI (Normalized Difference Vegetation Index) [33], has been validated for its data reliability [34] and is widely used in the monitoring of vegetation dynamics [35,36]. In this study, global FGST ecosystems were selected to investigate the spatiotemporal patterns of EVI and its correlation with precipitation and temperature using linear trend analysis and partial correlation analysis methods. On this basis, integrating extreme climate indices (ECI), the grey relational analysis method was employed to assess the impact of extreme climate events on FGST vegetation. The objectives of this research are as follows: (1) analyze the spatiotemporal patterns of vegetation dynamics in global FGST, (2) identify the sensitivity of different vegetation types to changes in precipitation and temperature, and (3) evaluate the association between global FGST and extreme climate events.

2. Materials and Methods

2.1. Data and Processing

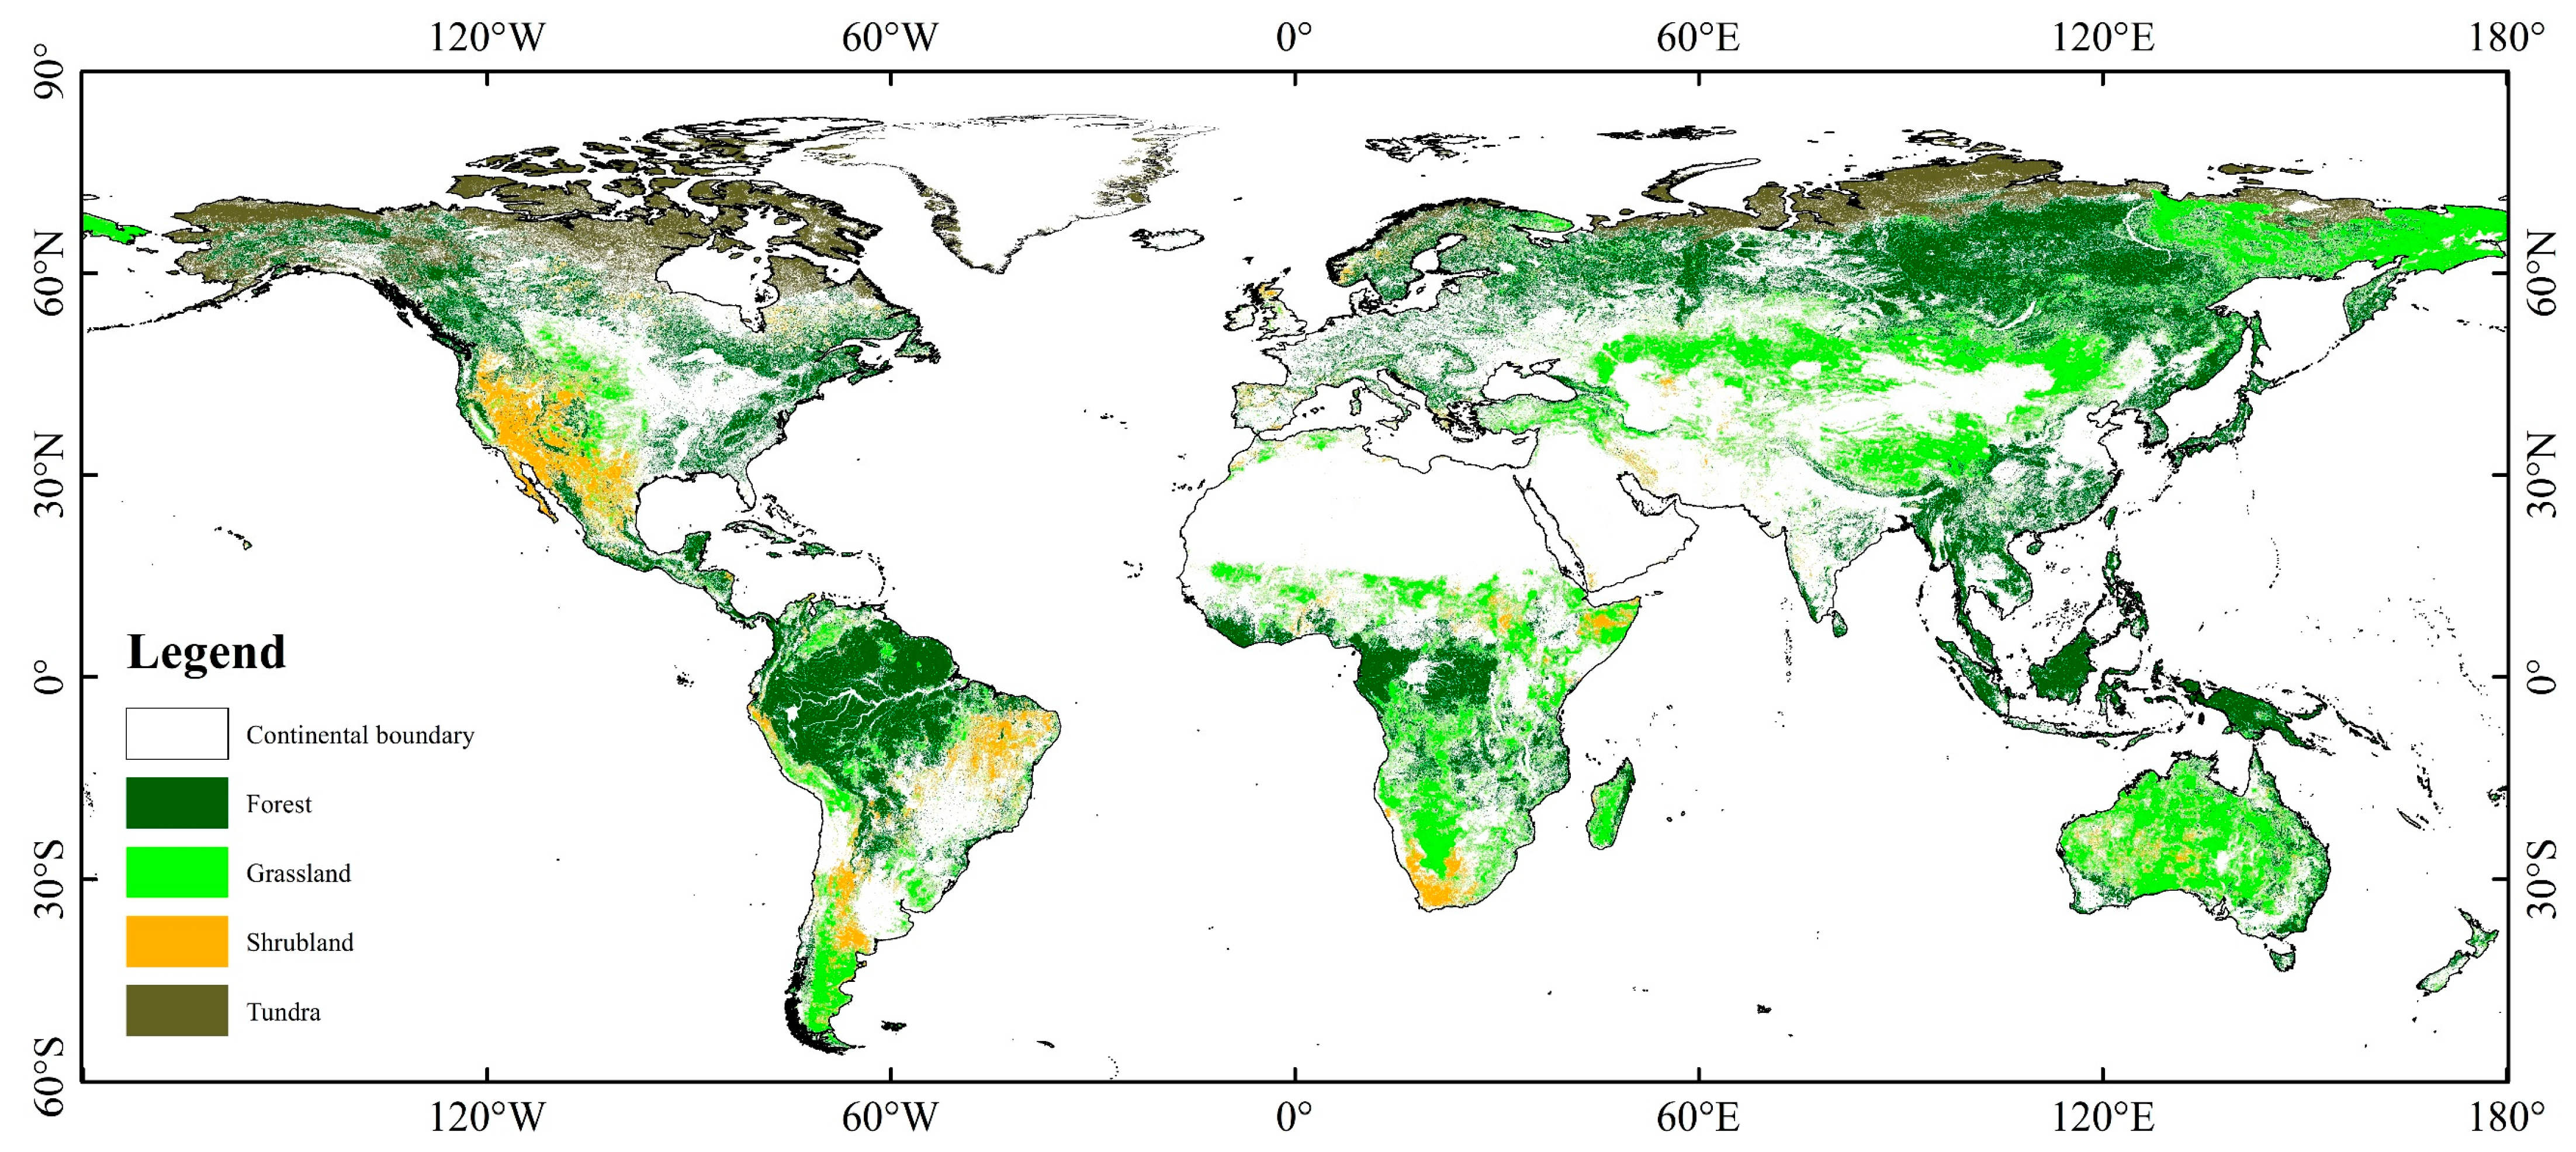
2.1.1. Land Cover Data

The global land cover data for this study were sourced from the GlobeLand30 dataset, obtained from the National Geomatics Center of China (http://www.globallandcover.com, accessed on 1 February 2023). It is a 30 m resolution global land cover data product with 10 land cover classes and three version years, specifically for 2000, 2010, and 2020.
ArcGIS was used to identify regions where the global land cover classes did not change in 2000, 2010, and 2020. The regions with typical global terrestrial vegetation, such as forest, grassland, shrubland, and tundra (Table A1), were then extracted as the study area (Figure 1).

2.1.2. EVI Data

In this study, the EVI data were obtained from the MOD13A2 (version:006) dataset, which was supplied by the Application for Extracting and Exploring Analysis Ready Samples (AppEEARS) National Aeronautics and Space Administration (NASA) EOSDIS Land Processes Distributed Active Archive Center (LP DAAC) (https://appeears.earthdatacloud.nasa.gov/, accessed on 1 February 2023). The data consist of 503 images from 2000 to 2021, with a spatial resolution of 1 km and a temporal resolution of 16 days. A study showed that the one-year EVI calculated by the Maximum Value Composite (MVC) method could reflect the potential productivity of vegetation. In contrast, the one calculated by the arithmetic mean (AM) method can reflect vegetation’s annual average production status [37]. Therefore, to determine the average vegetation status in the global FGST region, we used the AM method to process 23 images (20 images in 2000) in each natural year, generating the annual mean values of the EVI (EVImean-a). It will be used to analyze the spatiotemporal variations of vegetation and its response to climatic conditions.

2.1.3. Meteorological Data

Time-series 3 h meteorological data with 0.25° spatial resolution were obtained from the NASA Global Land Data Assimilation System Version 2.1 (GLDAS-2.1) dataset (available at https://disc.gsfc.nasa.gov/datasets/GLDAS_NOAH025_3H_2.1/summar, accessed on 1 February 2023). The air temperature and precipitation data units in this dataset are Kelvin (K) and kg/m2/s. For convenience of calculation, we converted the air temperature data units from Kelvin (K) to degrees Celsius(°C) (1 °C = 1 K − 273.15) and the precipitation data units from rate (kg/m2/s) to amount (mm).
In this study, the daily temperature and precipitation data were obtained by calculating the AM of all 3 h temperature data and the cumulative values of all 3 h precipitation data for one day, respectively. Then, the annual mean air temperature (AMT) data were calculated using the AM method, and the annual precipitation (AP) data were calculated using the cumulative calculation method. In addition, to analyze the response of vegetation to climate, we resampled the spatial resolution of temperature and precipitation data to 1 km using bilinear interpolation to match the EVI data.

2.2. Methods

2.2.1. Liner Regression Analysis

The interannual trends of vegetation EVI in the global FGST region, temperature, and precipitation from 2000 to 2021 were identified using linear regression analysis. The specific linear regression equation is shown below:
S L O P E = n × i = 1 n ( i × x i ) i = 1 n i × i = 1 n x i n × i = 1 n i 2 ( i = 1 n i ) 2
where SLOPE denotes the change rate of each parameter over the time series, x i represents the value of each parameter in the year i, and n is the total number of years in the study period. In this study, n = 22. SLOPE > 0 indicates an increasing trend for each parameter, and SLOPE < 0 indicates a decreasing trend for each parameter. The ENVI-IDL was used to test the significance of the change trend with a significance level by t-test, where the significance level (α) was set at 0.05 (α = 0.05). The specific equation of the t-test is shown below:
t = S L O P E S b ^
S b ^ = S x ^ i = 1 n ( i i ¯ ) 2
S x ^ = i = 1 n ( x i x ^ i ) 2 n 2
where S b ^ represents the standard error of regression coefficient, S x ^ represents the standard error of regression, and the x ^ i is the fitted value. When t > tα/2, it means the changing trend is significant. When t < tα/2, it means the changing trend is not significant. According to SLOPE and t, the change can be classified into four categories, and the classification criteria are shown in Table A2.

2.2.2. Partial Correlation Analysis

To quantitatively analyze the response of global vegetation EVI in FGST to temperature and precipitation, this study used the partial correlation coefficient to analyze the correlation between EVI and temperature and precipitation [36]. The formula is shown as follows:
r x y , z = r x y r x z × r y z ( 1 r x z 2 ) ( 1 r y z 2 )
where the rxy,z denotes the partial correlation coefficient between variable x and variable z while keeping the variable y constant. The rxy, rxz, and ryz represent the correlation coefficients between variable x and variable y, variable x and variable z, and variable y and variable z, respectively.

2.2.3. Extreme Climate Indices

To quantify the impact of extreme climate on vegetation EVI in the global FGST region, this study selected eight temperature indices and seven precipitation indices, which were recorded by the Expert Team on Climate Change Detection and Indices (ETCCDI) (http://etccdi.pacificclimate.org/list_27_indices.shtml, accessed on 5 February 2023). To facilitate understanding and analysis, we have categorized these indices based on the duration and intensity of extreme climate events. Their classification and definitions are detailed in Table A3.

2.2.4. Grey Relation Analysis

Grey relational analysis (GRA) is a method that assesses the closeness of relationships between corresponding sequences based on the similarity of their geometric shapes. The closer the sequence curves are, the stronger their relationship. It is not affected by sample size or probability distribution.
In this study, GRA was conducted by calculating the grey relational grade (GRG) between different ECI and EVImean-a. It aimed to quantify the impact of varying extreme climate conditions on the vegetation of the global FGST region. The calculation process and the main equations are as follows:
  • Establish a comparison sequence and a reference sequence.
The EVImean-a was set as a reference sequence which can be expressed as:
X 0 = { X 0 ( k ) } , k = 1 , 2 , , n
The ECI were set as a comparison sequence which can be expressed as:
X i = { X i ( k ) } , i = 1 , 2 , , n , k = 1 , 2 , , m
2.
Standardized sequence.
To eliminate the impact of the dimension, we standardized the processing of the original reference sequence and comparison sequence as follows:
X 0 ( k ) = X 0 ( k ) X 0 ¯ σ 0
X i ( k ) = X i ( k ) X i ¯ σ i
where X 0 ¯ and X i ¯ are the means of the reference and comparison sequences, respectively. The σ0 and σi are the standard deviations of the comparison and reference sequences, respectively.
3.
Calculate the relation coefficient.
ξ ( k ) = min i min k Δ i ( k ) + α × max i max k Δ i ( k ) Δ i ( k ) + α × max i max k Δ i ( k )
where ξ k is the grey relation coefficient, Δ i ( k ) is the absolute value of the difference between the comparison sequence and the reference sequence, max i max k Δ i ( k ) and min i min k Δ i ( k ) are the maximum and the minimum values of Δ i ( k ) , and α is the resolution coefficient (α = 0.1) [38].
4.
Calculate the grey relation grade.
r i = k = 1 n ξ i ( k ) n
where ri is the GRG and ranges from 0 to 1. When the GRG is larger, it indicates that the impact of the comparison sequence on the reference sequence is more obvious.

3. Results

3.1. Spatiotemporal Characteristics of EVI in FGST

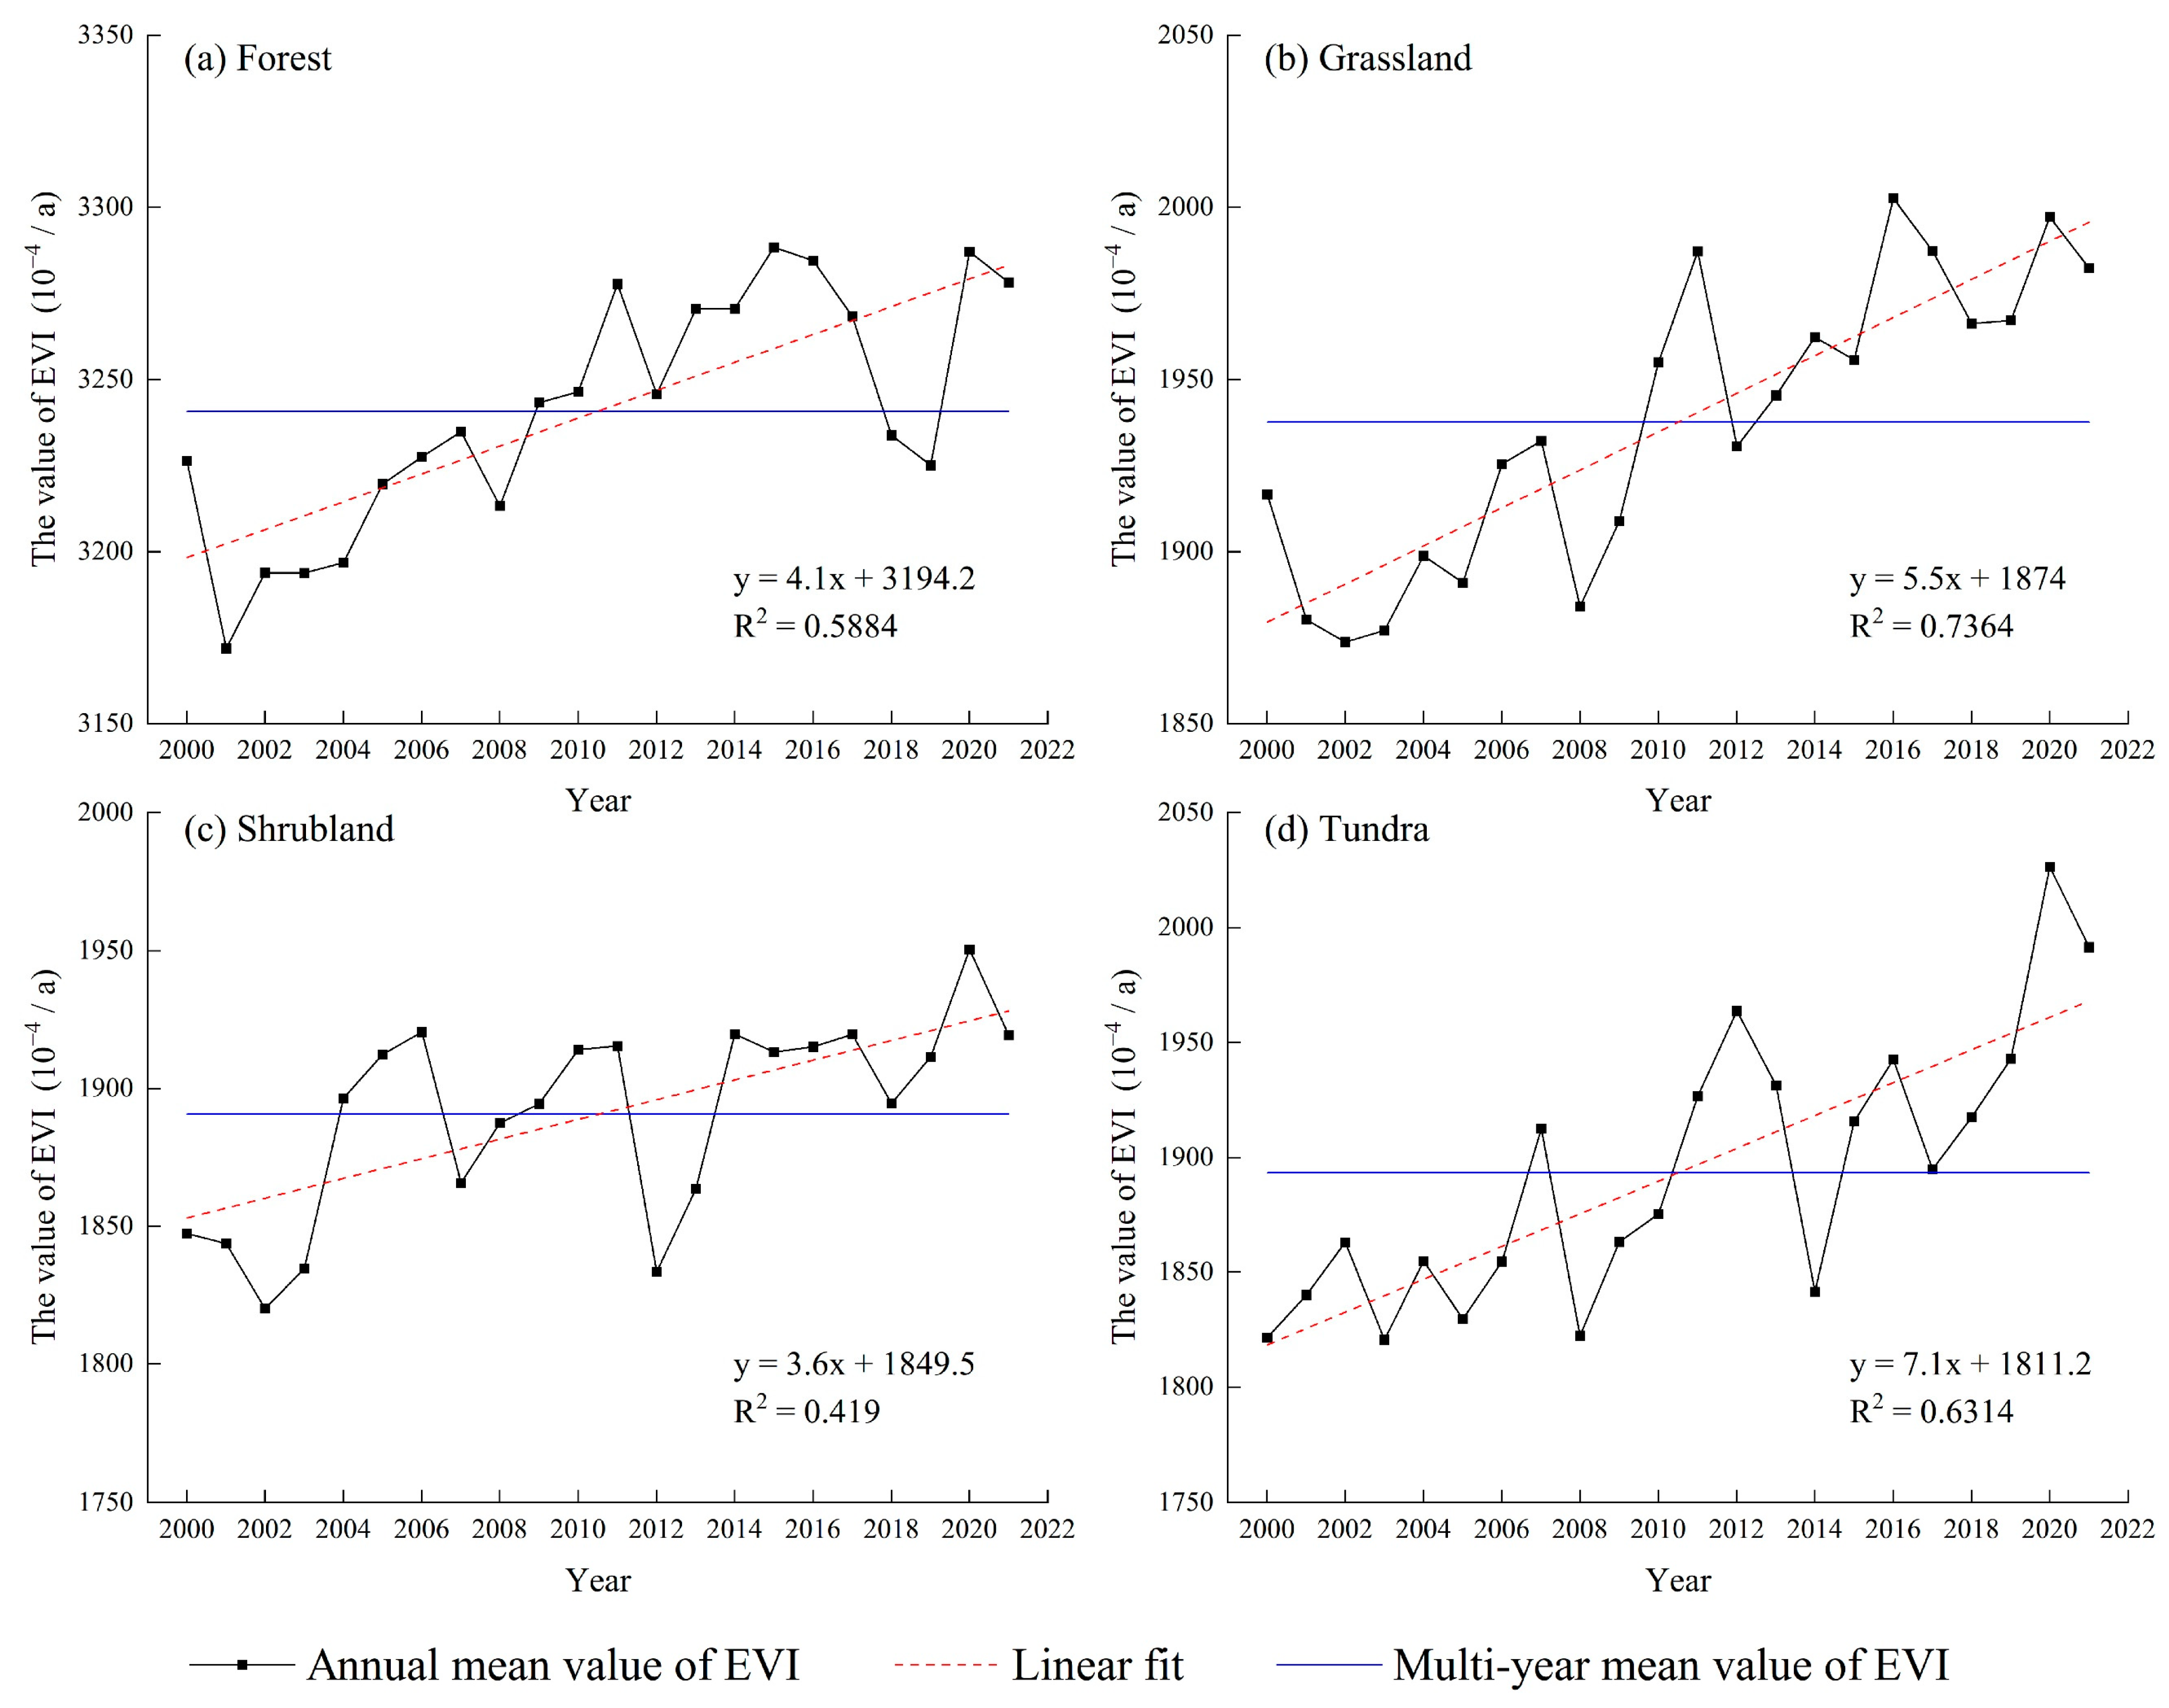
3.1.1. Interannual Variation Characteristics of EVI in FGST

The interannual mean EVI variation in global FGST from 2000 to 2021 is shown in Figure 2. Overall, the global FGST presents varying degrees of increasing trends. Among the different ecosystems, the EVImean-a increase rate of the tundra is the fastest at 7.1 × 10⁻⁴/a. The shrublands demonstrate the slowest EVImean-a increase rate, which is 3.6 × 10⁻⁴/a. Forest and grassland have EVImean-a increase rates of 4.1 × 10⁻⁴/a and 5.5 × 10⁻⁴/a, respectively.
From the changes in anomalies, the number of years with positive anomalies and the number of years with negative anomalies in the EVImean-a are the same for the forest, grassland, and tundra ecosystems, i.e., 11 years. However, for the shrub ecosystem, the number of years with positive anomalies exceeds those with negative anomalies by 6 years. It is worth noting that since 2009, the anomalies of EVImean-a for the global FGST have mostly been positive. In the forest, only in 2018 and 2019 did the EVImean-a rapidly decline below the multi-year mean values of the EVI (EVImean-m), before ascending quickly in 2020. This situation occurred in the grassland, shrubland, and tundra in 2012, 2012, and 2014.

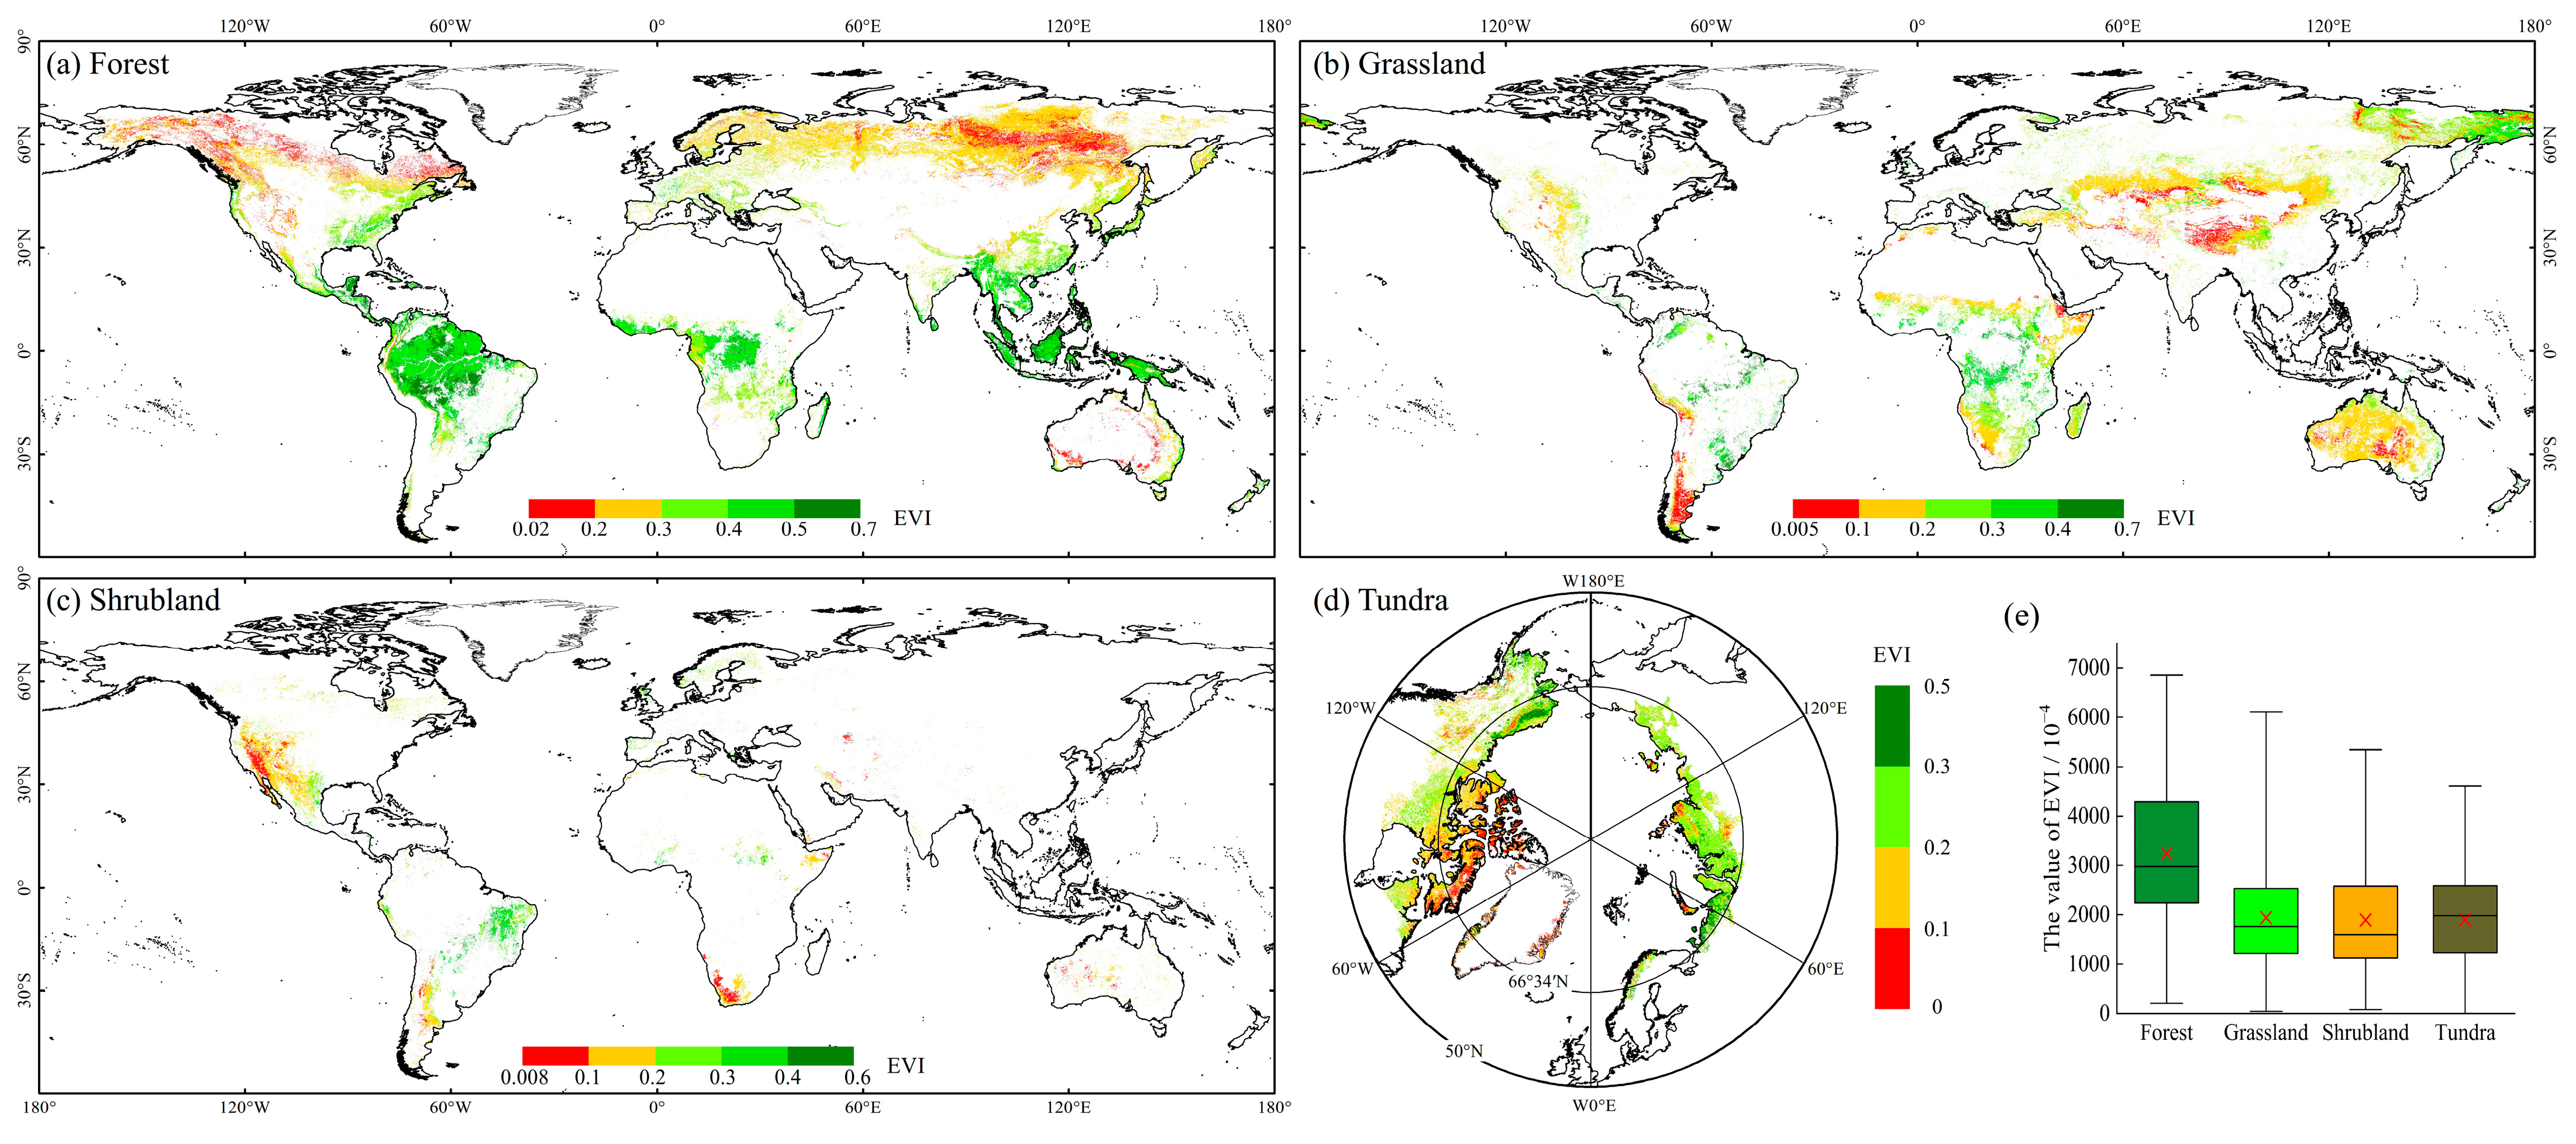
3.1.2. Spatial Characteristics of EVI in FGST

The spatial distribution of the EVImean-m of global FGST from 2000 to 2021 is shown in Figure 3. The EVI spatial distribution generally has a distinct latitudinal zonation ranging from 0 to 0.8, with a decrease from the equator toward the poles. In terms of different ecosystems, the EVImean-m of global forest ranges from 0.02 to 0.6854, with a mean value of 0.3241 (Figure 3a). From the perspective of spatial distribution characteristics, the forest EVI is highest at the equator and gradually decreases towards the north and south, with this pattern being particularly evident in the northern hemisphere. In the equatorial region, such as northern South America, central Africa, and Southeast Asia, it generally exceeds 0.4, and some regions can reach above 0.6. As the latitude increases to 50°N–70°N, it drops below 0.3.
The EVImean-m of the global grasslands ranges from 0.005 to 0.61, with a mean value of 0.1938 (Figure 3b). Similar to forests, the spatial distribution of the grassland EVI also has a latitudinal zonation distribution pattern. However, it varies among different continents. In Africa, the grassland EVI decreases gradually from the equator towards the south. It is centered in Central Asia and increases radially outwards in Eurasia. The grassland EVI in central-western and southern South America is less than 0.3. It mostly remains below 0.2 in Australia and only ranges from 0.2 to 0.3 in the northern and eastern coastal regions.
The EVImean-m of the global shrublands ranges from 0.008 to 0.54, with a mean value of 0.189 (Figure 3c). The shrubland EVI is mostly below 0.2. It is mainly concentrated in western North America, southern South America, and southern Africa. The regions with EVI above 0.3 are distributed primarily in eastern South America.
The EVImean-m of the global tundra ranges from 0.0001 to 0.46, with a mean value of 0.1897 (Figure 3d). Overall, the tundra EVI decreases as latitude increases. Interestingly, within the Arctic Circle, the spatial distribution of the tundra EVI differs significantly between the western and eastern hemispheres. The tundra EVI in the western hemisphere is mostly below 0.1, but it can reach above 0.3 in some regions of Alaska. In the eastern hemisphere, the tundra EVI is mostly above 0.2 and can exceed 0.3 in the coastal regions near 60°E. Only sporadic regions have a tundra EVI below 0.1.

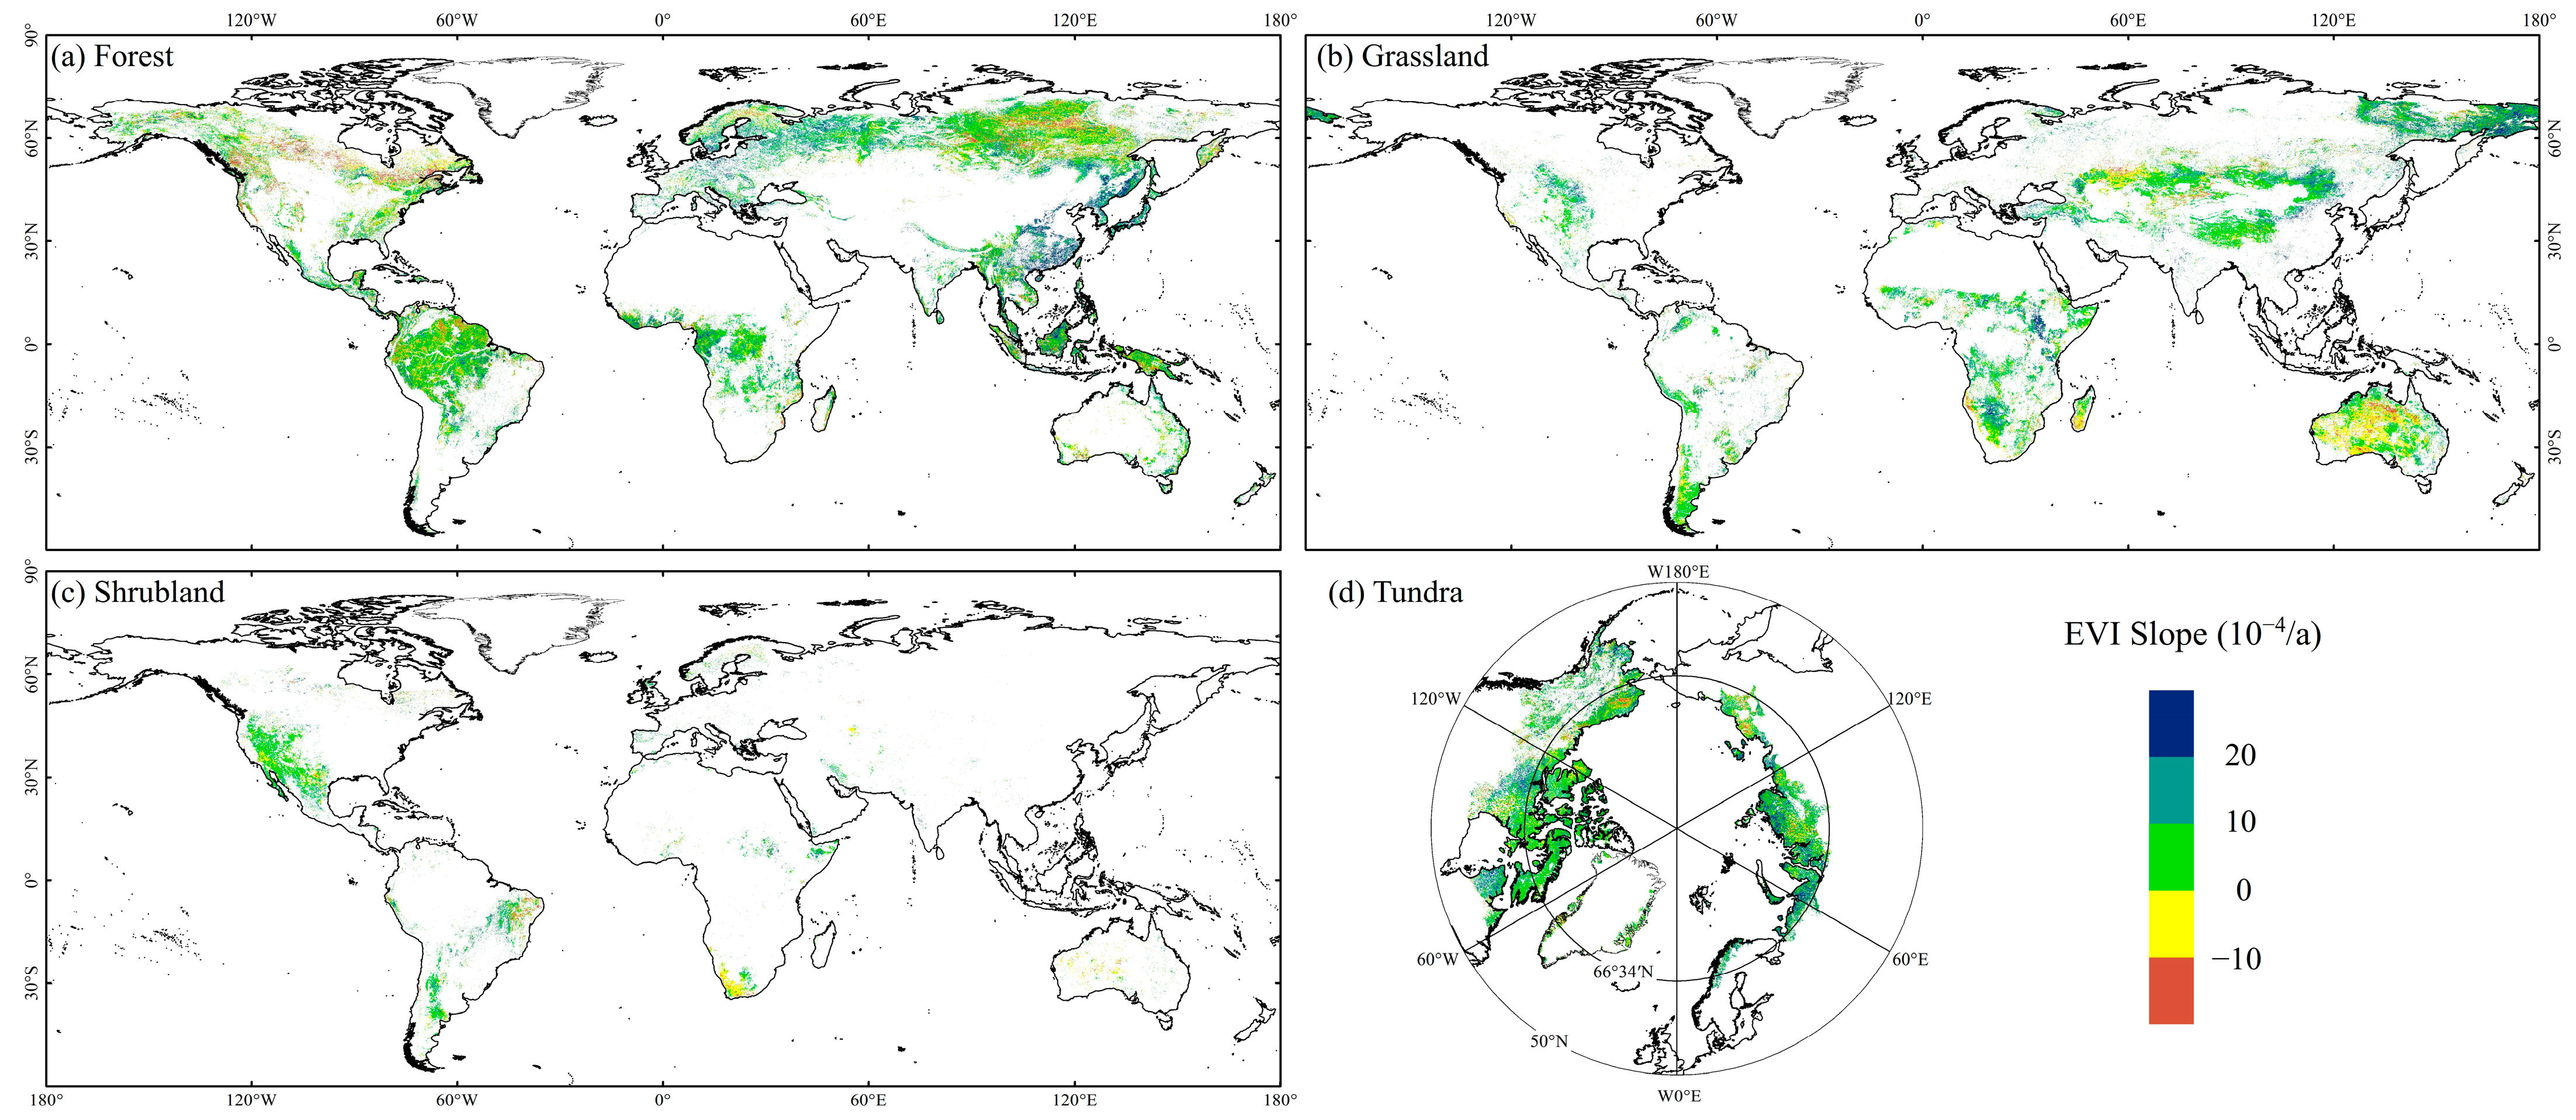
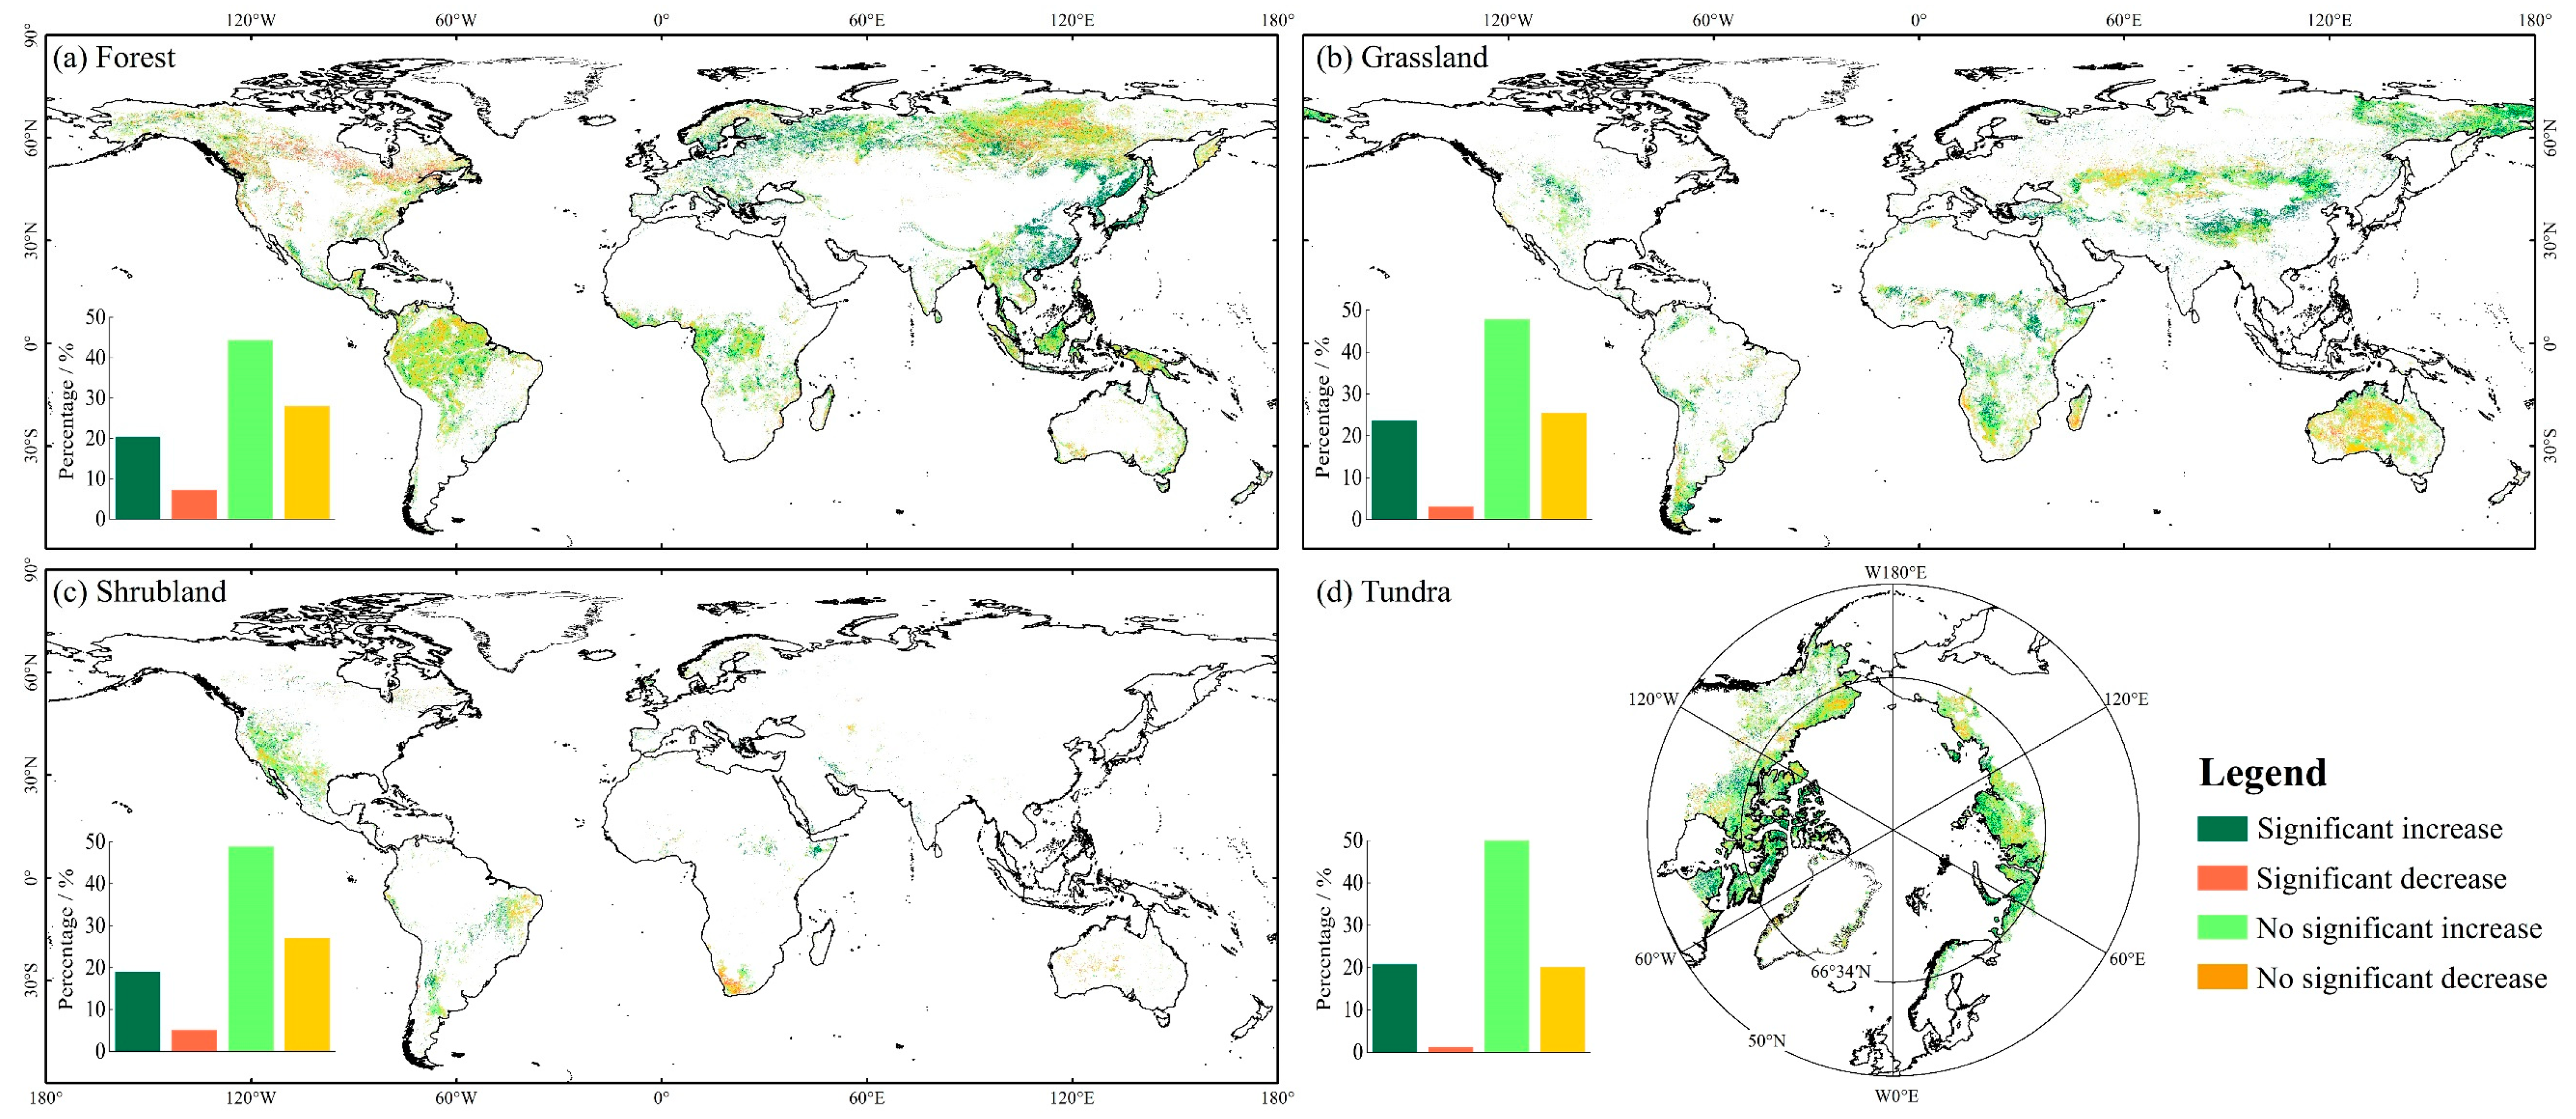
3.1.3. Spatial Variation of EVI in FGST

The EVI trends of the global FGST from 2000 to 2021 were analyzed by linear regression analysis at a pixel level. The results are shown in Figure 4 and Figure 5. The interannual variation of EVI in global FGST is concentrated within the range of −2 × 10⁻⁴/a to 4 × 10⁻⁴/a (Figure 4). The EVI shows an increasing trend in 69.22% of the global FGST ecosystems. The regions with a significant increasing trend (t < tα/2) in EVI accounted for 21.31%. On the other hand, about 30.78% of the regions exhibited a decreasing trend, with 4.86% of the regions showing a significant decreasing trend (t < tα/2). There are significantly more regions with an increasing trend than a decreasing trend (Figure 5).
From the perspective of different ecosystems, 64.73% of the global forest EVI showed an increasing trend, of which 20.37% showed a significant increase. The regions with significant increase trends appeared in Europe and eastern Asia. The increase rate ranged from 9 × 10⁻⁴/a to 50 × 10−4/a, and the average increase rate was 21 × 10−4/a. A total of 35.27% of the global forest EVI showed a decreasing trend, and only 7.22% showed a significant decrease. The regions with significant decreasing trends are mainly concentrated in northern North America and northern Asia. The average rate of decrease was −23 × 10−4/a, and the rate of decrease ranged from −61 × 10−4/a to −8 × 10⁻⁴/a.
The EVI of 71.44% of the global grassland showed a growth trend, and 23.61% showed significant growth (t < tα/2). Significant-growth regions were concentrated in northeastern and central Asia and central Africa. The growth rates ranged from 3 × 10⁻⁴/a to 46 × 10−4/a, with an average growth rate of 18 × 10−4/a. In contrast, the EVI of 28.56% of the global grasslands showed a reduced trend, and only 3.08% showed a significant reduction (t < tα/2), scattered in central and western Australia and southern Madagascar in Africa. The reduction rates ranged from −49 × 10−4/a to −4 × 10⁻⁴/a, with an average reduction rate of −18 × 10−4/a.
A total of 67.75% of the global shrubland EVI showed an increasing trend, of which 18.92% showed a significant increase (t < tα/2). The regions with significant increase trends appeared in western North America, eastern and southern South America, and eastern Africa. The increase rates ranged from 4 × 10⁻⁴/a to 47 × 10−4/a, and the average increase rate was 17 × 10−4/a. By comparison, 35.25% of the global shrub EVI showed a declining trend, of which only 5.11% showed a significant decline (t < tα/2). The regions with significant decline trends are mainly concentrated in southern Africa. The average rate of decline was −16 × 10−4/a, and the rate of decline ranged from −46 × 10−4/a to −4 × 10⁻⁴/a.
The global tundra has the highest increasing proportion among different vegetation types. The EVI of 78.57% showed a rising trend, but only 20.75% showed a significant rise (t < tα/2). Significantly rising regions were concentrated in northern North America, northern Asia, and northern Europe. The rates of increase ranged from 5 × 10⁻⁴/a to 41 × 10−4/a, with an average rise rate of 19 × 10−4/a. On the other hand, the EVI of 21.43% of the global tundra showed a fall trend, and only 1.24% showed a significant fall (t < tα/2), scattered in northern North America. The reduction rates ranged from −42 × 10−4/a to −8 × 10⁻⁴/a, with an average reduction rate of −21 × 10−4/a.

3.2. Relationship between EVI and Climate Factors in FGST

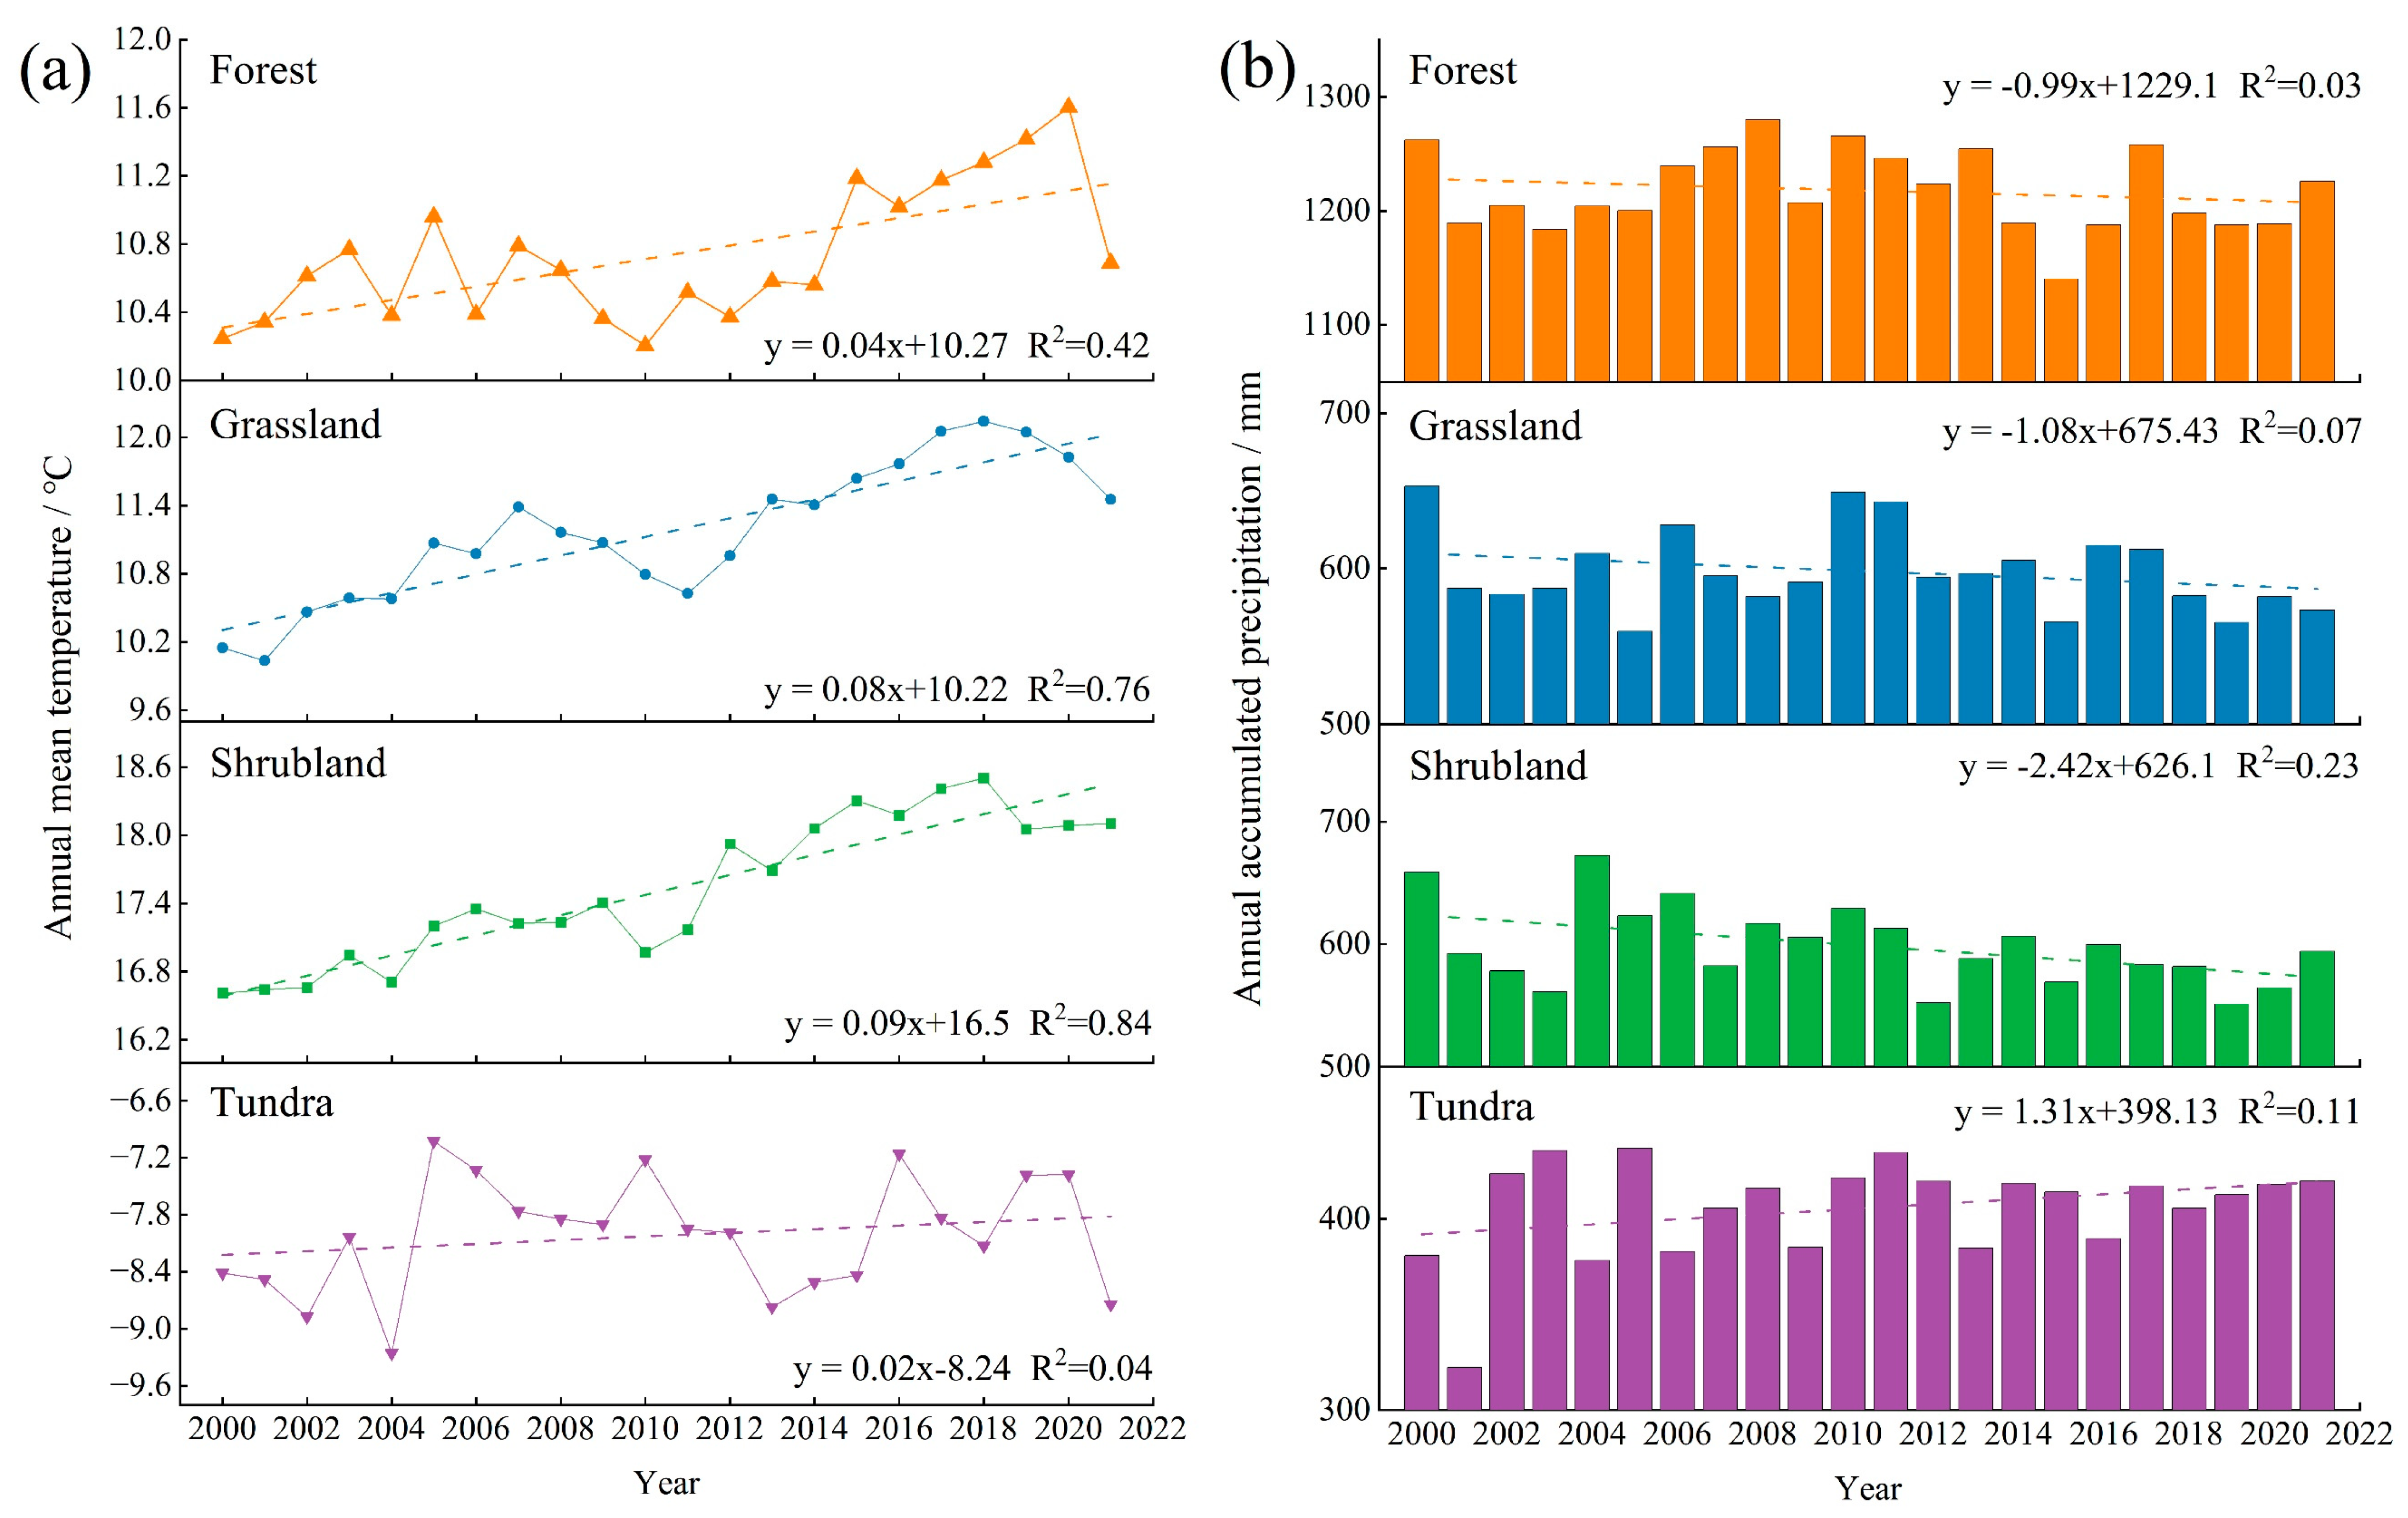
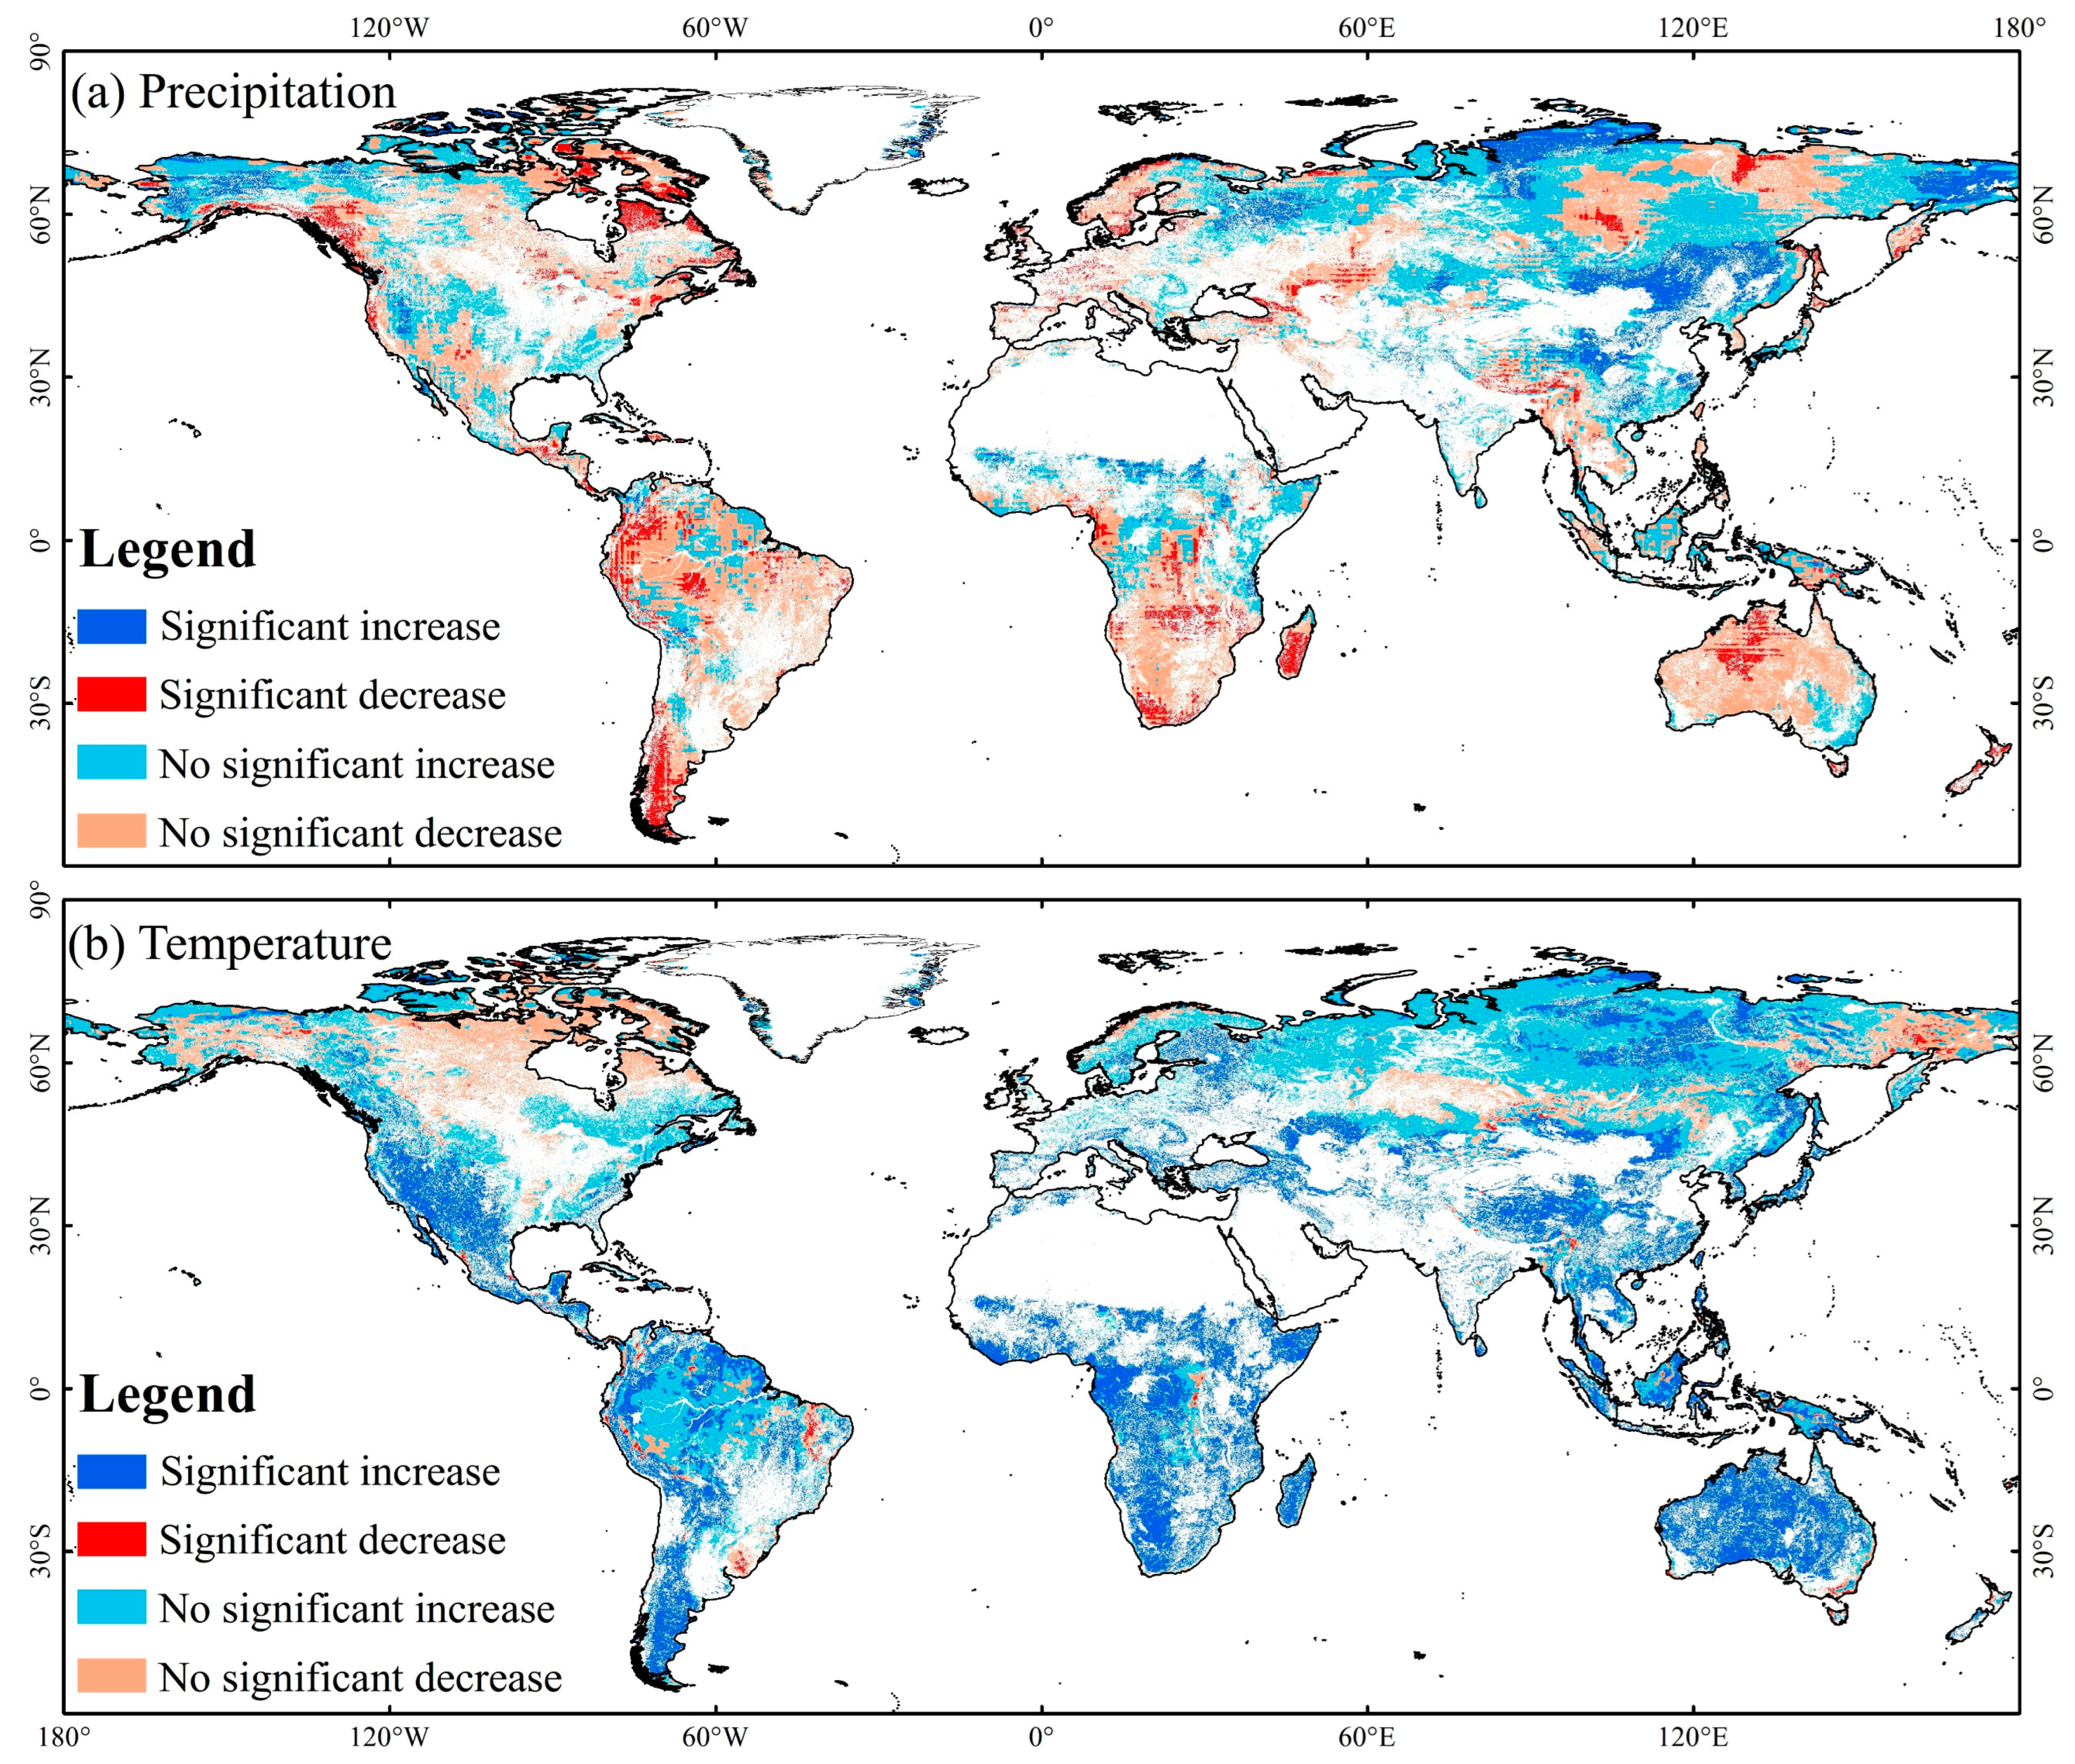
3.2.1. Spatiotemporal Variations of Temperature and Precipitation in FGST

The interannual trends of AMT and AP in the global FGST ecosystems are shown in Figure 6. The AMT shows an increasing trend with varying degrees of fluctuation in global FGST ecosystems from 2000 to 2021 (Figure 6a). Over the past 20 years, the AMT of the global forests was 10.73 °C, with the highest AMT of 11.6 °C in 2020. The AMTs of the global grasslands and shrublands were 11.17 °C and 17.52 °C, respectively. Their highest AMTs appeared in 2018, at 12.14 °C and 18.5 °C, respectively. The AMT of the global tundra was −8.02 °C and the highest AMT was −7.03 °C in 2005. Among different ecosystems, shrublands experienced the fastest temperature increase with a rate of 0.09 °C/a, followed by grasslands with a rate of 0.08 °C/a. Forests and tundra had increase rates of 0.04 °C/a and 0.02 °C/a, respectively.
From 2000 to 2021, the global FGST AP was 1217.76 mm, 598.28 mm, 598.31 mm, and 405.73 mm, respectively (Figure 6b). Over the most recent 20 years, the AP in global forests, grasslands, and shrublands has shown a decreasing trend with varying degrees of fluctuation, but the trends are insignificant. The global shrublands have experienced the fastest decrease, with a rate of 2.42 mm/a. The global grasslands and forests follow with rates of decrease of 1.08 mm/a and 0.99 mm/a, respectively. It is worth noting that the global tundra is the only region in the FGST where the AP has shown an increasing trend. However, the rising trend is insignificant, with a rate of 1.31 mm/a.

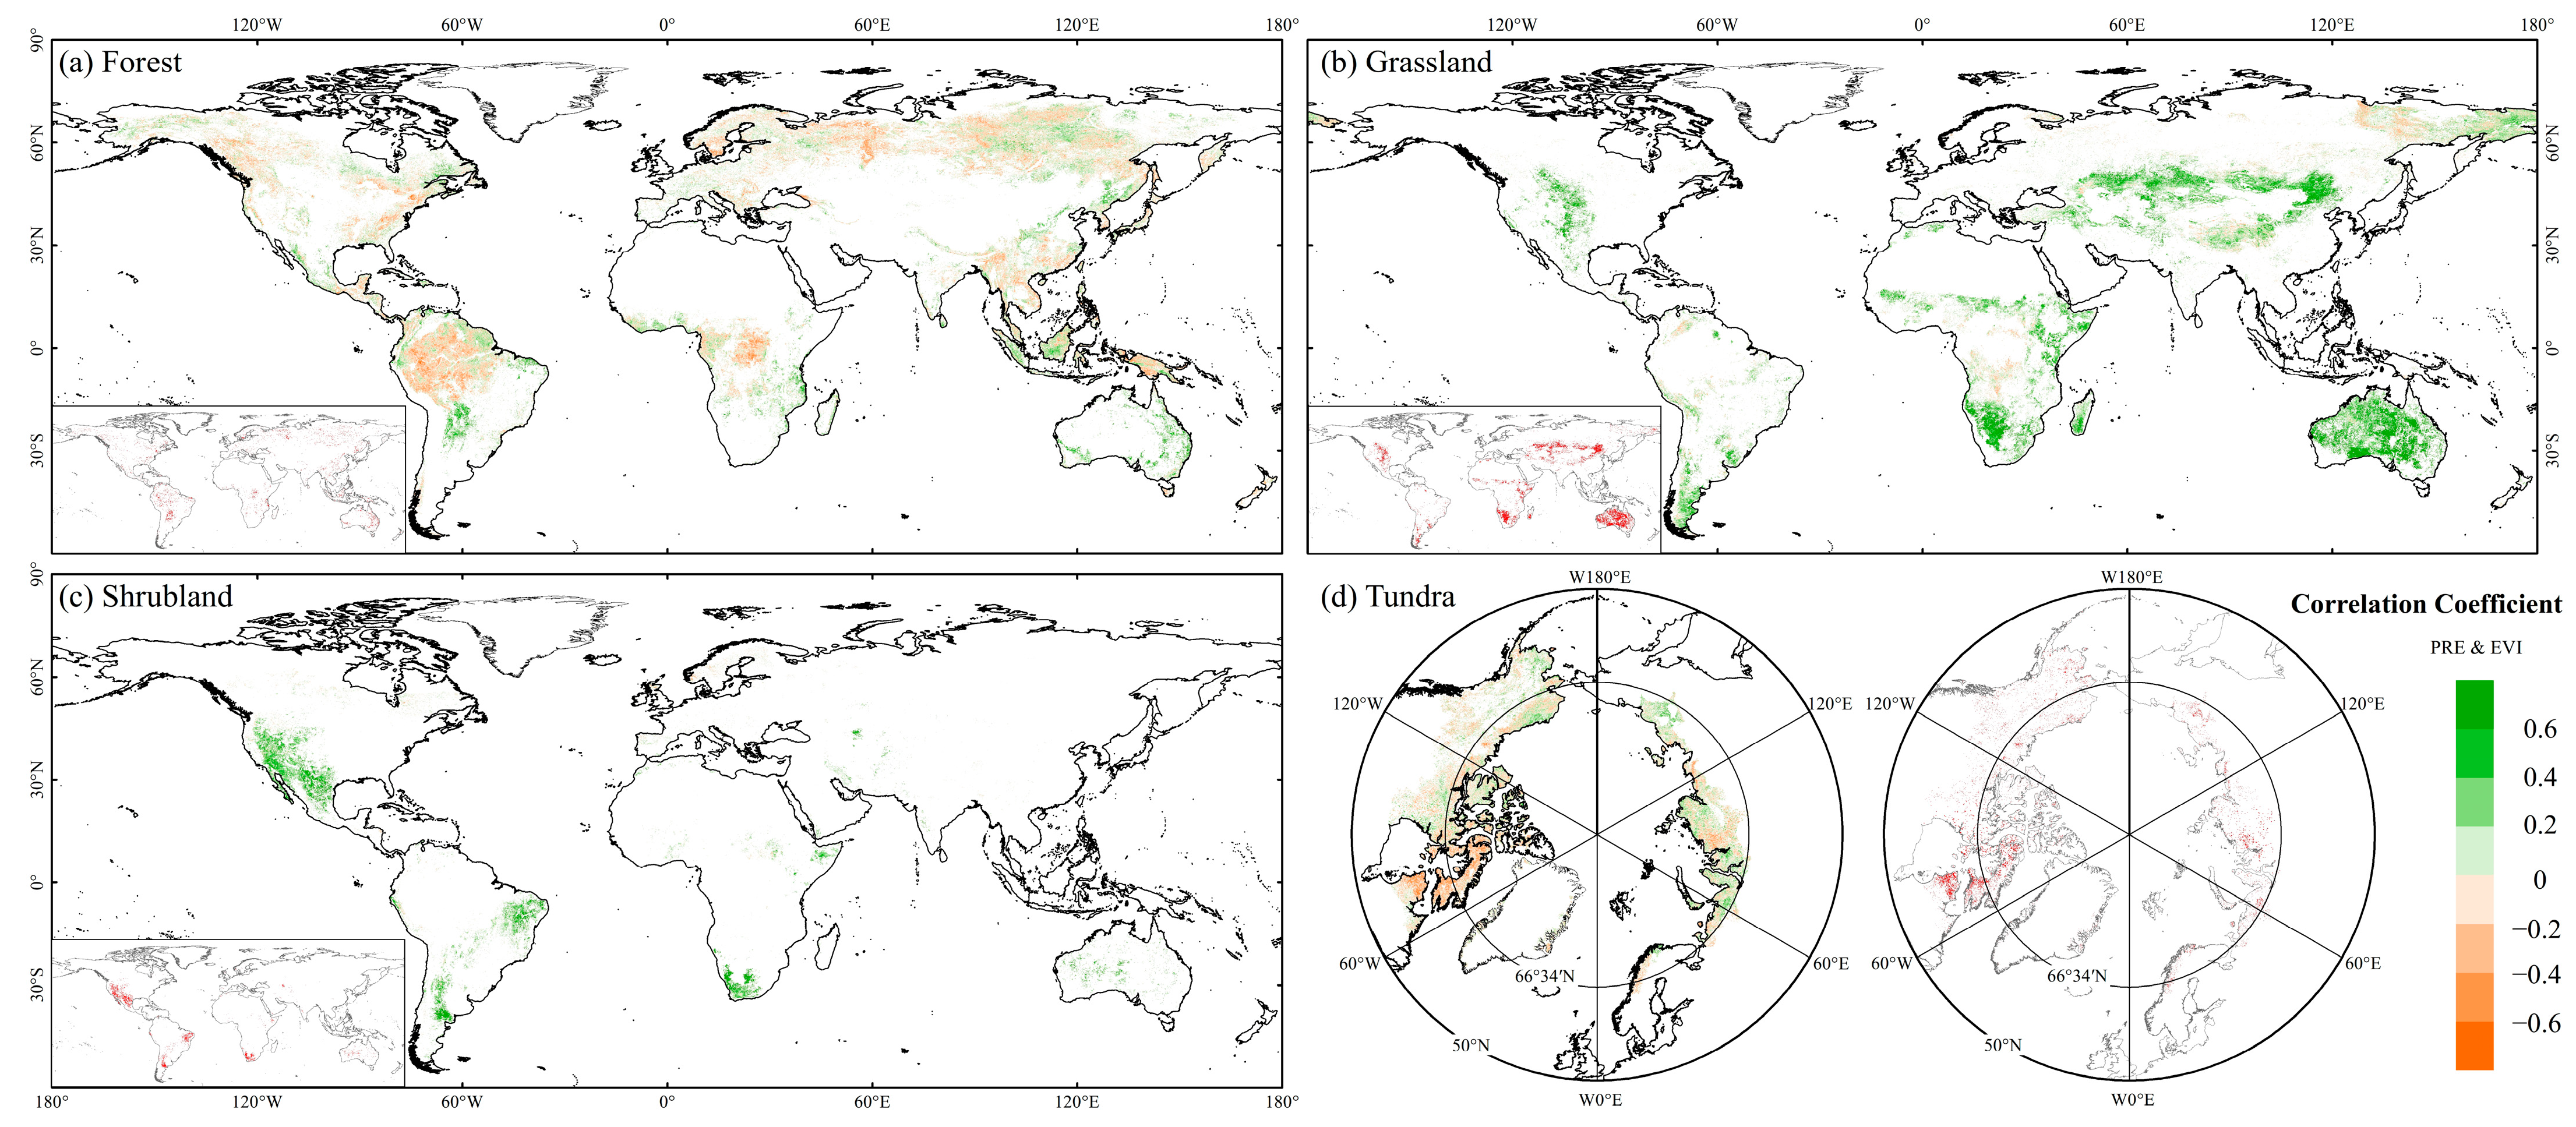
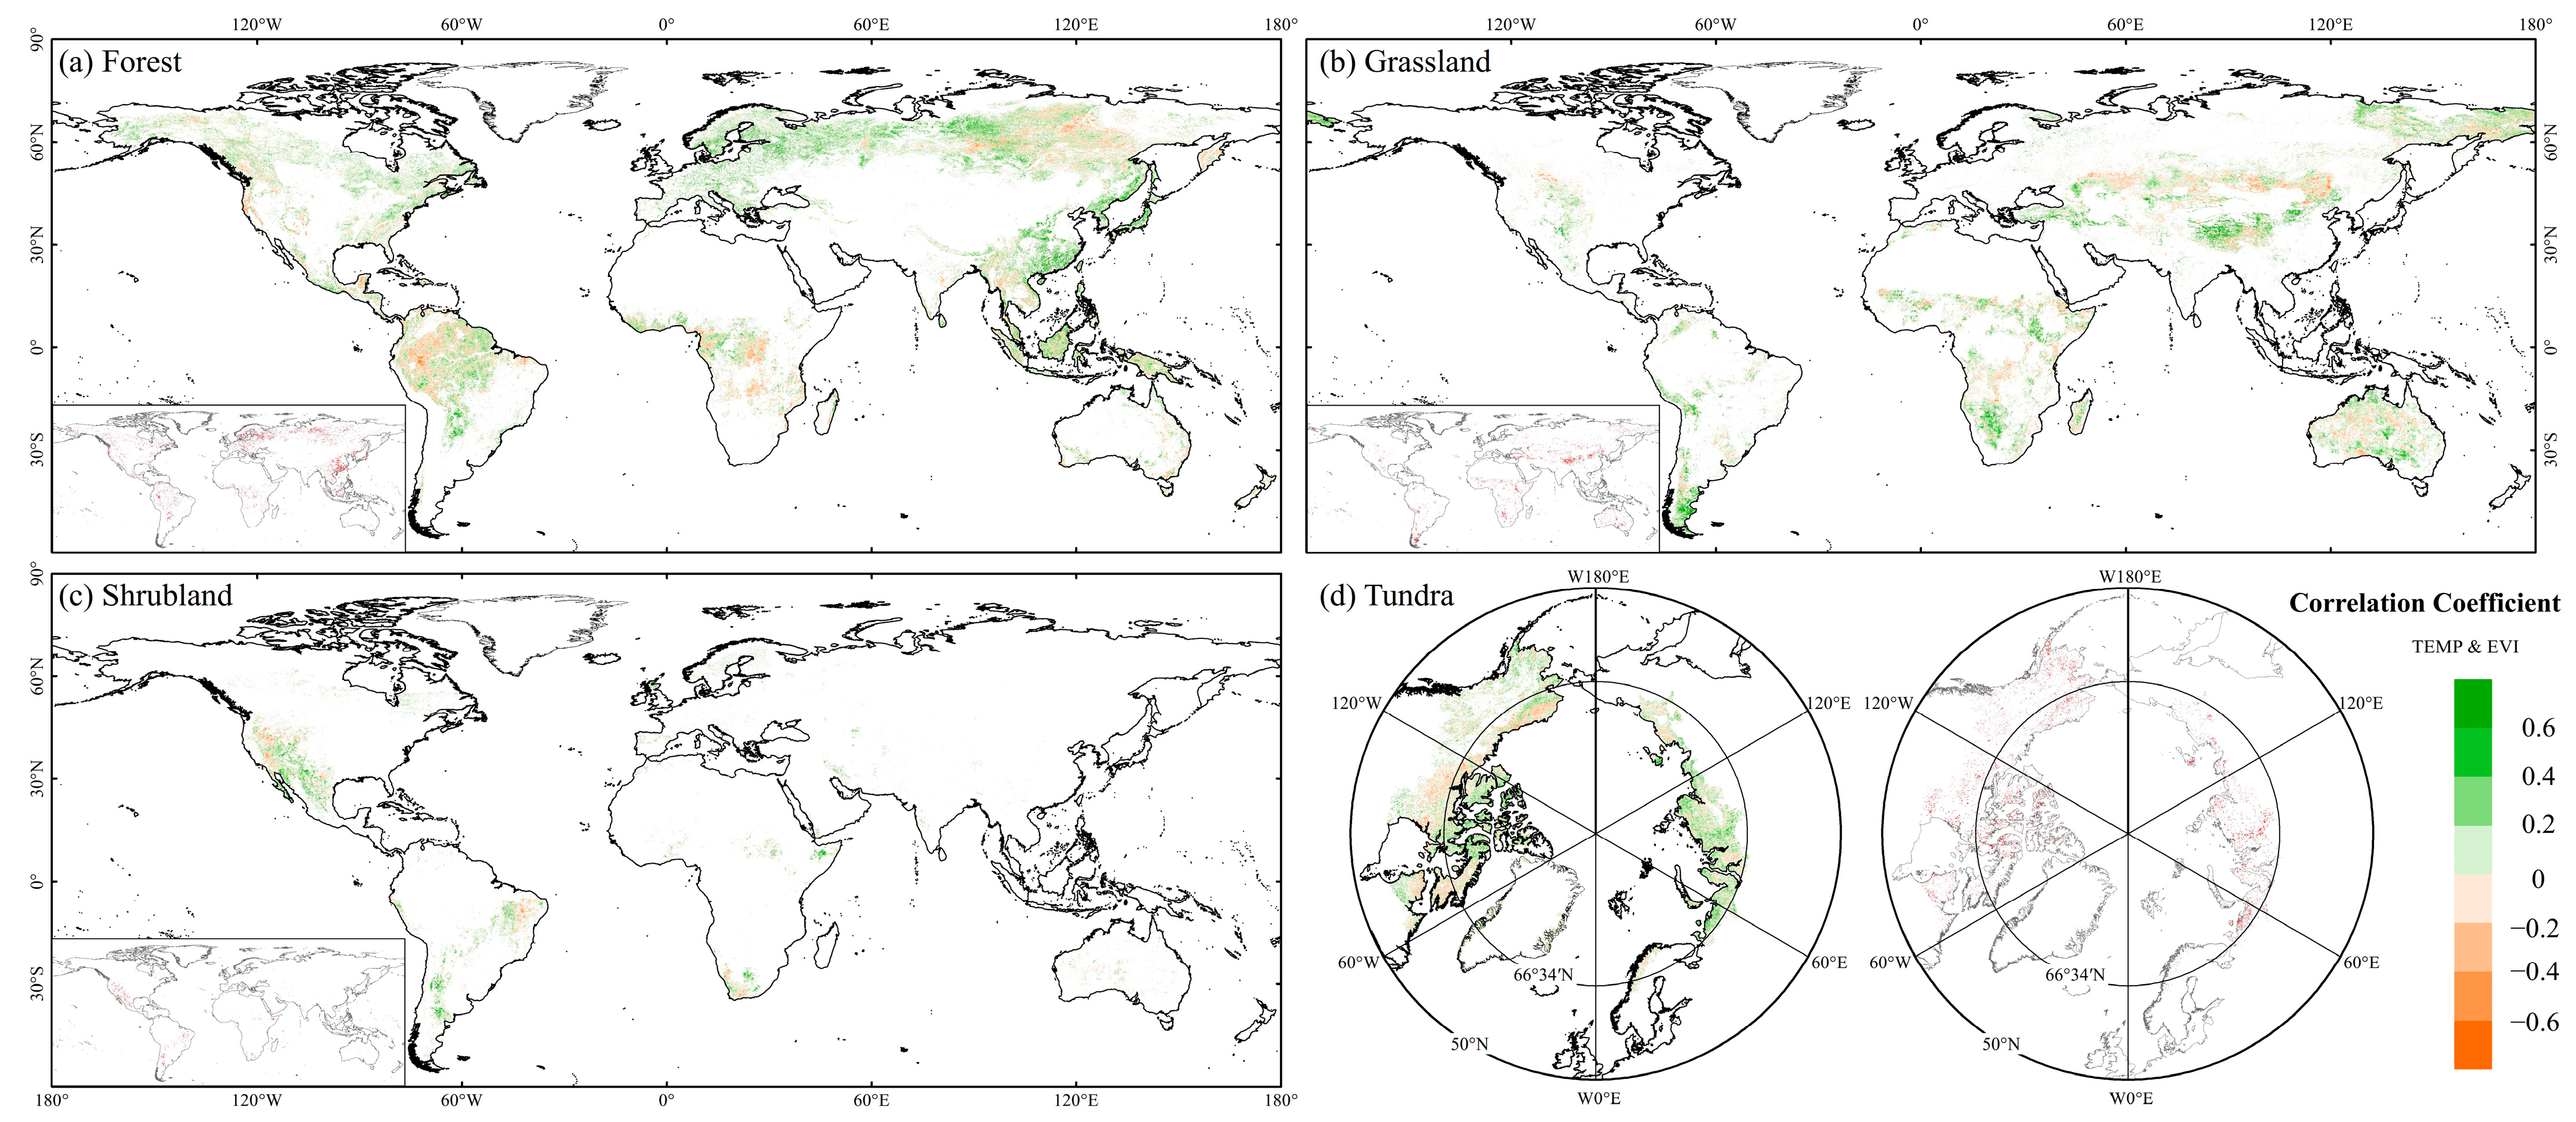
3.2.2. Effects of Climatic Factor Variations on EVI in FGST

The spatial distributions of the partial correlation coefficients of the global FGST EVImean-m with AP and AMT are shown in Figure 7 and Figure 8, respectively.
The correlation between forest EVI, AP, and AMT is relatively low in different ecosystems. Only 14.03% and 11.44% of the regions passed the significance test (Figure 7a and Figure 8a). The global forest EVI positively correlated with AP, accounting for 47.46%. Among them, 6.38% of the regions are significantly positively correlated (p < 0.05), mainly distributed in central South America and Australia. The proportion of regions with a negative correlation between the global forest EVI and AP is 52.54%. A total of 5.06% of the regions reached significance (p < 0.05), mainly in northern South America, central Africa, and northern and southeastern Asia. Regarding the correlation with AMT, 65.25% of the global forest EVI show a positive correlation, with 11.51% reaching a significant level (p < 0.05). The regions with a significant positive correlation are mainly located in eastern and northern Asia and Europe. A total of 34.75% of the global forest EVI has a negative correlation, of which 2.52% of the regions are significantly positively correlated (p < 0.05). The regions with a significant negative correlation are primarily in the northwestern part of South America, central Africa, and northeastern Asia.
Unlike forest, as shown in Figure 7b, the global grassland EVI exhibits a higher correlation with AP but a lower correlation with AMT (Figure 8b), with 40.97% and 14.64% of the regions passing the significance test, respectively. Among the global grassland EVI, 82.5% of the regions correlate positively with AP, with 40% significantly positively correlated (p < 0.05). The regions with a significant positive correlation are primarily distributed in Australia, central Asia, and southern Africa. A total of 17.5% of the regions exhibit a negative correlation with AP, and only 0.97% reach a significant level (p < 0.05). Regarding the correlation with AMT, 63.74% of the regions show a positive correlation, with 12.07% significantly positively correlated (p < 0.05). The regions with a significant positive correlation are mainly in central and eastern Asia and southern South America. Lastly, 36.26% of the regions exhibit a negative correlation, with 2.57% reaching a significant level (p < 0.05).
Similar to grassland, the global shrubland EVI is also highly correlated with AP (Figure 7c) but less correlated with AMT (Figure 8c), with significance in 49.41% and 17.03% of the regions, respectively. The global shrubland EVI positively correlated with AP, accounting for 88.92%. Among them, 48.71% of the regions are significantly positively correlated (p < 0.05), mainly distributed in western North America, eastern and southern South America, and southern Africa. The proportion of regions with a negative correlation between the global shrubland EVI and AP is 11.08%, with 0.7% of the regions reaching significance (p < 0.05). The global shrubland EVI positively correlated with AMT accounted for 66.77%, of which 14.29% reached a significant level (p < 0.05). The regions with significant positive correlation with AMT are mainly located in western North America and southern South America. A total of 33.23% of the global shrubland EVI exhibits a negative correlation with AMT, with 2.74% significantly positively correlated (p < 0.05).
The global tundra EVI is less correlated with AP and AMT, and only 7.34% and 7.42% of the regions passed the significance test, respectively (Figure 7d and Figure 8d). Among the global tundra EVI, 46.87% of the regions correlate positively with AP, with only 2.25% significantly positively correlated (p < 0.05). The regions with a significant positive correlation are primarily distributed in northwestern North America. The percentage of the global tundra EVI negatively correlated with AP is 53.13%, with 4.79% reaching significance (p < 0.05). The regions with a significant negative correlation are mainly found in northeastern North America. Regarding the correlation with AMT, 62.52% of the regions show a positive correlation, with only 5.97% significantly positively correlated (p < 0.05). The regions with a significant positive correlation are mainly found in northwestern North America and northern Asia. A total of 37.48% of the regions exhibit a negative correlation, with only 1.45% reaching a significant level (p < 0.05). The regions with a significant negative correlation are mainly found in northern North America.

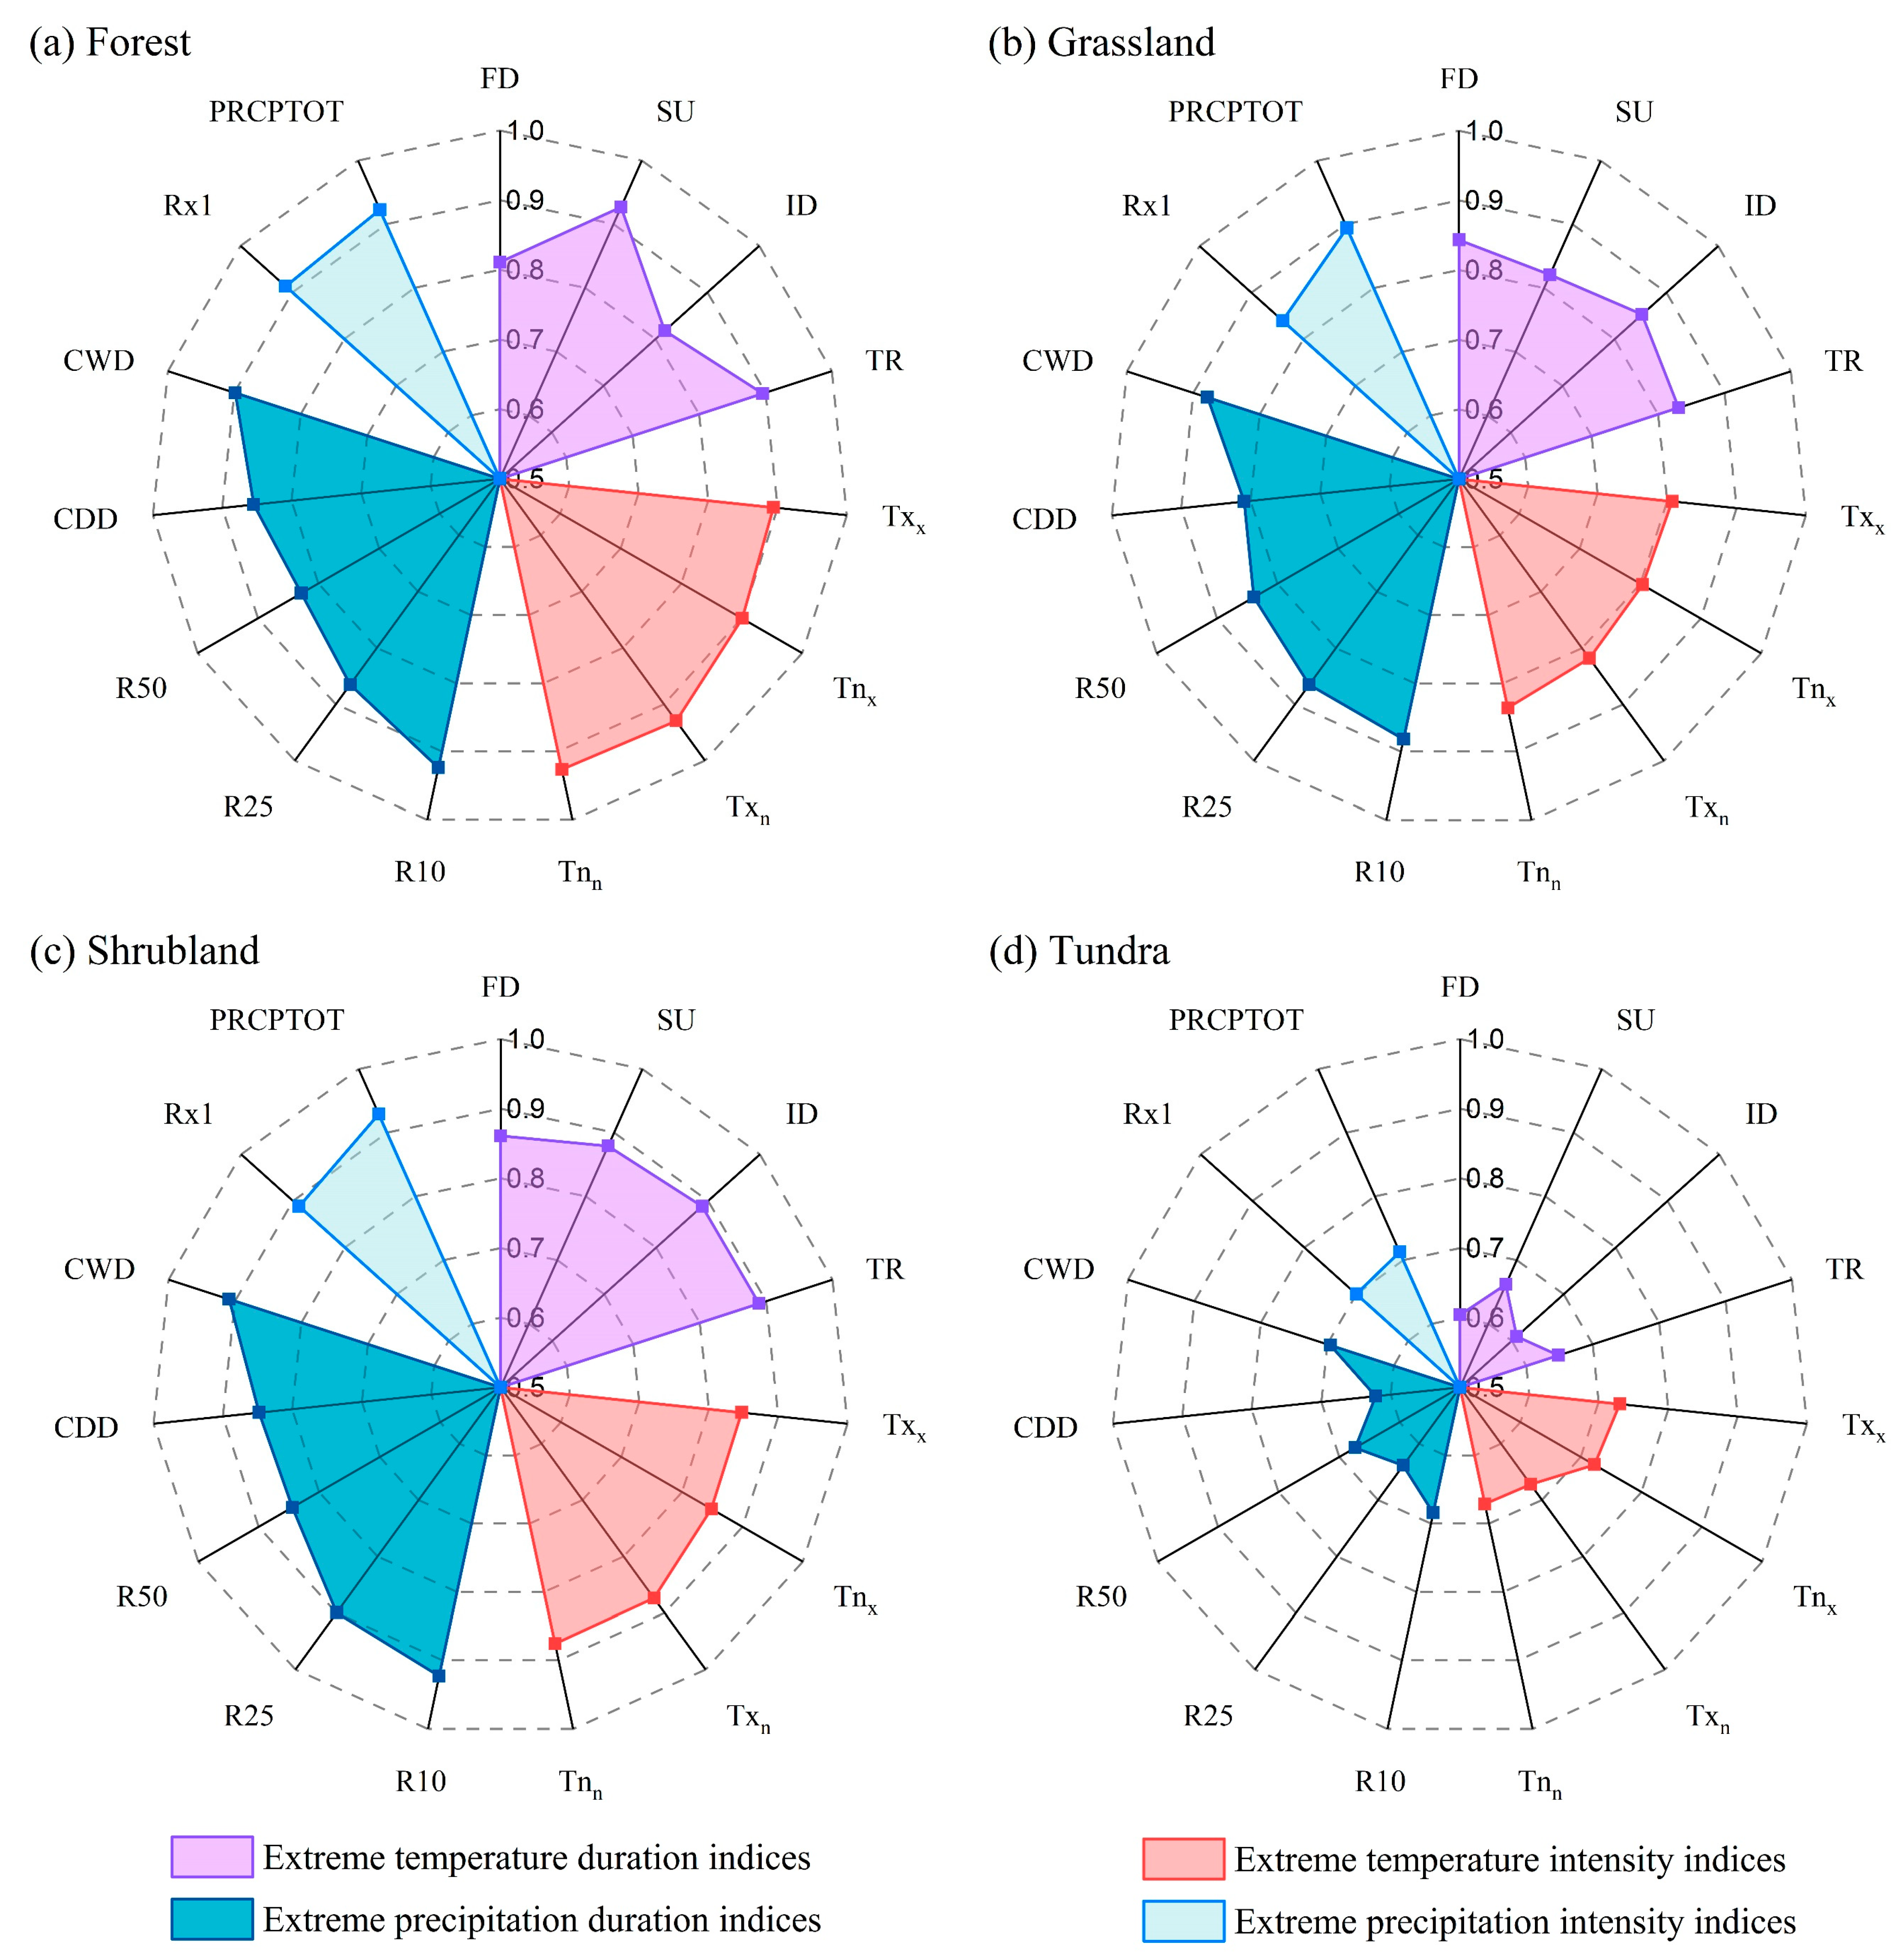
3.3. Association between EVI and Extreme Climate Indices in FGST

The impact of ECI on EVI in global FGST ecosystems was determined by calculating the GRG of EVI using the extreme precipitation index (EPI) and EVI with the extreme temperature index (ETI), respectively.
The GRG of the global forest EVI and ETI ranges from 0.81 to 0.93 (Figure 9a). The three ETIs that have the greatest impact on the global forest EVI are TXn (GRG = 0.93), SU (GRG = 0.927), and TNn (GRG = 0.927). The GRGs of the global forest EVI and EPI are between 0.82 to 0.93. The three EPIs with the most significant influence on the global forest EVI are R10mm (GRG = 0.924), PRCPTOT (GRG = 0.923), and Rx1 (GRG = 0.913).
As shown in Figure 9b, extreme precipitation has a stronger effect on global grassland EVI than extreme temperature. The GRGs of global grassland EVI and ETI are between 0.8 and 0.86. The three ETIs that have the greatest impact on the global grassland EVI are ID (GRG = 0.853), FD (GRG = 0.843), and TNn (GRG = 0.836). The GRG of the global grassland EVI and EPI ranges from 0.8 to 0.9. The three EPIs with the most significant influence on the global grassland EVI are PRCPTOT (GRG = 0.894), R10mm (GRG = 0.882), and CWD (GRG = 0.879).
Similar to the grassland, extreme precipitation has a more influential impact on global shrub EVI than extreme temperature. From Figure 9c, the GRG of the global shrubland EVI and ETI ranges from 0.84–0.89. The three ETIs that have the greatest impact on global shrubland EVI are TR (GRG = 0.889), ID (GRG = 0.889), and SU (GRG = 0.879). The GRG of the global shrubland EVI and EPI are between 0.84 and 0.93. The three EPIs with the most significant influence on the global forest EVI are PRCPTOT (GRG = 0.929), R10mm (GRG = 0.923), and CWD (GRG = 0.909).
The GRGs of the global tundra EVI and ETI ranges from 0.6 to 0.73 (Figure 9d). The three ETIs that have the greatest impact on global tundra EVI are TXx (GRG = 0.73), TNx (GRG = 0.722), and TXn (GRG = 0.672). The GRGs of the global tundra EVI and EPI are between 0.62 and 0.72. The three EPIs with the most significant influence on the global tundra EVI are PRCPTOT (GRG = 0.713), Rx1 (GRG = 0.7), and CWD (GRG = 0.695).
The relation grade between global FGST EVI and ECI varies across different vegetation types, with the order of GRGforest > GRGshrubland > GRGgrassland > GRGtundra. Forest and tundra EVI exhibit the strongest and weakest sensitivity to extreme climate, respectively. Overall, extreme precipitation events have a stronger impact on global FGST EVI (GRG = 0.828) than extreme temperature events (GRG = 0.813). However, when considering different vegetation types, forests show greater sensitivity to temperature extremes, while grasslands, shrublands, and tundra are more sensitive to precipitation extremes. Furthermore, the effects of extreme precipitation and temperature on different vegetation types also differ slightly. The relation grade between global FGST EVI and EPIs follows the order of GRGshrubland > GRGforest > GRGgrassland > GRGtundra. The relation grade between global vegetation EVI and ETIs follows the order of GRGforest > GRGshrubland > GRGgrassland > GRGtundra. Regardless of precipitation or temperature, climate extremes generally affect woody plants more than herbaceous plants [39].

4. Discussion

4.1. Global FGST’s Spatiotemporal Variation of EVI and Its Response to Precipitation and Temperature

Over the past 20 years, the EVI of global FGST has shown an overall increasing trend (Figure 2). Regarding climate impact factors, there has been a consistent warming trend in different vegetation types worldwide from 2000 to 2021, with a mean warming rate of 0.06 °C/a (Figure 6a). In contrast to temperature changes, global accumulated precipitation has decreased slightly for all vegetation types except for the tundra (+1.31 mm per year), with a mean decrease rate of 1.5 mm/a (Figure 6b). The climate change in global FGST ecosystems over the past 20 years seems to be progressing towards a “warmer” and “drier” trend (except for the tundra) [40], but these climate change patterns have not hindered the continuous greening trend of global FGST.
A total of 69.22% of the global FGST EVI shows an increasing trend. The regions with a significant increase account for 21.31% (Figure 5). This greening trend becomes particularly evident for different ecosystems after 2009 (Figure 2). The proportion of EVI increase among different vegetation types follows the order: tundra > grassland > shrubland > forest. The proportion of significant EVI increase follows the order: grassland > tundra > forest > shrubland. The regions with significant EVI increases are mainly located in high-latitude regions and the mid-low-latitude regions of the eastern hemisphere, predominantly in regions with increased precipitation (Figure A1a). Therefore, the local increase in precipitation may be a major contributing factor to the observed increase in vegetation EVI in these regions. The ecological changes of the Tibetan Plateau, known as the “Third Pole” or “Asian Water Tower,” have significant global implications. Our results indicate that the Qinghai-Tibet Plateau has also been identified as one of the regions where EVI has significantly increased over the past 20 years. Some studies suggest that the accelerated melting of glaciers, snow, and permafrost caused by global warming has contributed to the vegetation flourishing in this region [41,42,43]. In addition, it is noteworthy that the global forest EVI experienced a substantial rebound in 2020 and 2021 after decreasing in 2018 and 2019, which was not observed in other ecosystems (Figure 2a). This could be attributed to reduced wood demand and restricted logging activities resulting from the global COVID-19 pandemic [44,45]. Furthermore, the sudden fluctuations of grassland, shrubland, and tundra in 2012, 2012, and 2014 (Figure 2b–d) can be mainly attributed to variations in precipitation or temperature in that year (Figure 6). The regions where the EVI decreased significantly in global FGST ecosystems account for 4.86% (Figure 5). They are primarily located in the mid-latitude regions of the Western Hemisphere and certain regions of the Southern Hemisphere (e.g., Australia). These regions are predominantly found in regions experiencing reduced precipitation (Figure A1a). In addition to the influence of changing water and thermal conditions, human activities and wildfires are also reported to be the reasons for the decline of vegetation EVI in these areas [22,27,46].
Different vegetation types exhibit varying degrees of sensitivity to temperature and precipitation due to differences in their growth environments and physiological characteristics [20]. Through partial correlation analysis, we further investigated the sensitivity of different vegetation types worldwide to the changes in precipitation and temperature in the past 20 years (Figure 7 and Figure 8). In terms of the proportion of regions significantly affected by accumulated precipitation and temperature on the EVI of different vegetation types, they all showed shrubland > grassland > forest > tundra. This indicates that shrublands and grasslands are more sensitive to global climate change than forests and tundra. From the perspective of different climatic factors, accumulated precipitation changes have caused significant EVI variations (p < 0.05) in 40.97% and 49.41% of grasslands and shrublands, respectively, which is much higher than the significant impact of temperature changes in both (significant variation proportions of 14.64% and 17.03%, respectively). This suggests that grasslands and shrublands are more sensitive to accumulated precipitation changes than temperature. The annual mean accumulated precipitation of grasslands and shrublands significantly affected by precipitation changes is 481.15 mm and 490.48 mm, respectively, lower than their annual mean accumulated precipitation of 598.28 mm and 598.31 mm. This reflects that grasslands and shrublands distributed in relatively arid regions are more susceptible to global precipitation changes. In contrast to the higher sensitivity of grasslands and shrublands to precipitation changes, the proportion of significant EVI variations caused by precipitation changes versus temperature changes is not significantly different for forests and tundra. This indicates that forests and tundra have similar sensitivities to precipitation or temperature changes and are weaker than shrublands and grasslands.

4.2. Responses of Different Types of Vegetation EVI to Extreme Events

Overall, the sensitivity of global vegetation EVI to extreme event intensity (EEI) (GRG = 0.832) is higher than extreme event duration (EED) (GRG = 0.812). However, there are differences among different vegetation types. Forest and tundra EVI are more sensitive to EEI, while grassland and shrubland EVI are more sensitive to EED. Compared with forest and tundra, the climate of grasslands and shrublands is drier, with a pronounced rain-heat simultaneous effect [47,48,49]. Under long-term water stress, the impact of EED on grasslands and shrublands EVI is more worthy of attention than EEI.
In terms of different ECIs, the indicator that has the greatest impact on EVI is PRCPTOT (GRG = 0.864), followed by R10mm (GRG = 0.853) and CWD (GRG = 0.846). Studies have shown that precipitation events greater than 10 mm in dry environments are regarded as effective precipitation and ecologically more important for plant growth [50,51,52]. Compared with single heavy precipitation events, continuous precipitation events often have longer-lasting potential ecological effects [53,54]. In addition, our study indicated that continuous precipitation also has a greater effect on vegetation EVI than continuous drought. The indicator that has the least effect on EVI is FD (GRG = 0.780), followed by CDD (GRG = 0.784) and ID (GRG = 0.792). This suggests that the duration of frost and freezing has a relatively small effect on the EVI of FGST.
For different vegetation types, grassland and shrubland exhibit similar response patterns to extreme climate events, probably due to similar water and heat conditions (Figure 9b,c). Nonetheless, the impact of extreme climate events on shrublands (GRGshrubland = 0.880) is generally greater than on grasslands (GRGgrassland = 0.841), which may be attributed to the deeper root distribution of shrublands compared to herbaceous plants. The depth of plant roots appears to correlate with their susceptibility to extreme climate events [55]. Our findings indicate that plants with deeper root systems exhibit heightened sensitivity to ECIs [56]. This relationship also explains why forests and tundra ecosystems exhibit the highest and lowest GRGs with ECIs.
Among the extreme temperature duration indicators, SU and TR are significantly higher than FD and ID. This indicates that the duration of extreme high temperatures has a greater impact on forests than extreme low temperatures. Regarding extreme precipitation events, PRCPTOT, R10mm, and Rx1 significantly affect forests, with all GRG values above 0.9. Tundra shows the lowest correlation with ECIs. Unlike other vegetation types, TXx has the greatest impact on the tundra. Tundra is mainly distributed in high-latitude regions where temperature is the primary limiting factor for vegetation growth. Therefore, changes in extremely high temperatures are particularly noteworthy for vegetation in tundra regions.

4.3. Limitations of the Study and Further Directions

In this study, the low spatial resolution (0.25°) of the GLDAS data may eliminate some climatic change details. In the future, improved access to meteorological datasets, open-source assimilation methods, and downscaling methods may enhance the certainty of further research. The data continuity and accuracy of vegetation indices (VI) are crucial in global vegetation dynamics analysis and ecosystem monitoring [57]. These indices, calculated from satellite remote sensing data, reflect vegetation’s growth status and responses to ecosystems. Since VI is calculated based on the spectral reflectance of different bands, the acquisition method relies on satellite sensors, which makes VI across various vegetation types and environments, offering consistent vegetation monitoring on a global scale [58]. MODIS C6 VI data provide multiple algorithm improvements and calibration adjustments to rectify issues identified in previous data versions. It is widely used in global vegetation dynamics research and is deemed to possess a reasonable level of reliability. Moreover, to understand the climate-driving mechanisms of vegetation change in changing environments, it is essential to consider both VI and vegetation structure indicators (e.g., LAI and net primary productivity), thus enhancing the certainty in climate-driving mechanism analysis.

5. Conclusions

This study analyzed the spatiotemporal variation characteristics of different vegetation types’ EVI worldwide and their responses to climate factors over the past 20 years. We found that global FGST still improved overall despite the “warmer and drier” climate change characteristics during this period. Compared to forests and tundra, shrubs and grasslands exhibited greater sensitivity to global climate change. Grasslands and shrubs distributed in relatively arid regions were more susceptible to global precipitation changes.
We also focused on analyzing the response of FGST to extreme precipitation and temperature events. We found that extreme precipitation events had a stronger impact on global vegetation EVI than extreme temperature events. Forests showed a stronger sensitivity to extreme temperatures, while grasslands, shrublands, and tundra were more sensitive to extreme precipitation. FGST EVI to extreme event intensity was more sensitive than duration.
Our research contributes to an enhanced understanding of the feedback relationship between global climate change and vegetation of different types. The study results provide scientific support for assessing the impacts of global climate change and for the development, utilization, and protection of natural resources.

Author Contributions

Conceptualization, C.L., Y.S., T.Q. and D.Y.; methodology, C.L.; formal analysis, C.L.; investigation, C.L. and X.Z.; data curation, B.D. and H.K.; writing—original draft preparation, C.L.; writing—review and editing, Y.S., T.Q., D.Y., L.Z., B.D. and H.K.; visualization, C.L. and X.Z.; supervision, T.Q. and D.Y.; project administration, D.Y.; funding acquisition, T.Q. and D.Y. All authors have read and agreed to the published version of the manuscript.

Funding

This research was funded by the National Science Fund Project (Grant No. 52130907), the National Key Research and Development Project (Grant No. 2016YFA0601503), and the Five Major Excellent Talent Programs of IWHR (WR0199A012021).

Data Availability Statement

The land use data were obtained from the NGCC (http://www.globallandcover.com, accessed on 1 February 2023), the EVI data were obtained from the NASA (https://appeears.earthdatacloud.nasa.gov/, accessed on 1 February 2023), and the meteorological data were obtained from NASA (https://disc.gsfc.nasa.gov/datasets/GLDAS_NOAH025_3H_2.1/summar, accessed on 1 February 2023). The code used in this study is available by contacting the corresponding author.

Acknowledgments

The authors are grateful to the NGCC for providing the GlobeLand30 dataset, and NASA for providing the Terra MODIS EVI and GLDAS-2.1 datasets. The authors thank the anonymous reviewers for their valuable comments.

Conflicts of Interest

The authors declare no conflict of interest.

Appendix A

Table A1. The definition of land cover.
TypeCodeDefinition
Forest20It refers to the lands covered with trees, the top density of which occupies over 30%. Deciduous broadleaf forest, evergreen broadleaf forest, deciduous coniferous forest, evergreen coniferous forest, mixed forest, and sparse woodland, the top density of which covers 10–30%, are included in this category. It is mainly planted with crops and rarely with fruit trees or other trees that are not included in this category.
Grassland30It refers to the lands covered by natural grass with a cover density of over 10%. The prairies, meadow steppes, alpine grasslands, desert steppes, and lawns, etc., are included in this category. Cultivated pastures are not included in this category.
Shrubland40It refers to the lands covered with shrubs with a cover density of over 30%. Mountain shrubs, deciduous and evergreen shrubs, and desert jungle in desert areas with a cover density of over 10% are included in this category. Tea gardens, coffee gardens, and other economic croplands, etc., are not included in this category.
Tundra70It refers to the lands covered by lichen, moss, hardy perennial herbs, and shrubs in cold and high-altitude mountain areas. Shrub tundra, grass tundra, wet tundra, alpine tundra, and barren tundra, etc., are included in this category.
Table A2. The classification criteria for change trends.
ClassificationSlopet
Significant increase>0t > tα/2
Significant decrease<0t > tα/2
No significant increase>0t < tα/2
No significant decrease<0t < tα/2
Table A3. The classification and definitions of the extreme climate indices used in this study.
CategoryExtreme Climate Index NameDefinitionUnit
Extreme temperature duration indicesNumber of frost days, FDAnnual count of days when daily minimum temperature < 0 °Cd
Number of summer days, SUAnnual count of days when daily maximum temperature > 25 °Cd
Number of icing days, IDAnnual count of days when daily maximum temperature < 0 °Cd
Number of tropical nights, TRAnnual count of days when daily minimum temperature > 20 °Cd
Extreme temperature intensity indicesAnnual maximum value of daily maximum temperature, TXxThe maximum daily maximum temperature for each year°C
Annual maximum value of daily minimum temperature, TNxThe maximum daily minimum temperature for each year°C
Annual minimum value of daily maximum temperature, TXnThe minimum daily maximum temperature for each year°C
Annual minimum value of daily minimum temperature, TNnThe minimum daily minimum temperature for each year°C
Extreme precipitation duration indicesNumber of moderate rain days, R10mmAnnual count of days when the daily precipitation amount ≥ 10 mmd
Number of heavy rain days, R25mmAnnual count of days when the daily precipitation amount ≥ 25 mmd
Number of torrential rain days, R50mmAnnual count of days when the daily precipitation amount ≥ 50 mmd
Maximum length of dry spell, CDDThe maximum number of consecutive days with the daily precipitation amount < 1 mmd
Maximum length of wet spell, CWDThe maximum number of consecutive days with the daily precipitation amount ≥ 1 mmd
Extreme precipitation intensity indicesAnnual maximum value of daily maximum precipitation, Rx1The maximum daily maximum precipitation for each yearmm
Annual total precipitation in wet days, PRCPTOTThe sum of precipitation in a year when the daily precipitation amount ≥ 1 mmmm
Figure A1. The significance of (a) multi-year mean temperature and (b) annual precipitation linear trend in global forest, grassland, shrubland, and tundra (FGST) ecosystems from 2000 to 2021.
Remotesensing 15 04245 g0a1

References

  1. Feng, X.; Liu, C.; Xie, F.; Lu, J.; Chiu, L.S.; Tintera, G.; Chen, B. Precipitation Characteristic Changes Due to Global Warming in a High-Resolution (16 Km) ECMWF Simulation. Q. J. R. Meteorol. Soc. 2019, 145, 303–317. [Google Scholar] [CrossRef] [PubMed]
  2. Zhou, L.; Tian, Y.; Myneni, R.B.; Ciais, P.; Saatchi, S.; Liu, Y.Y.; Piao, S.; Chen, H.; Vermote, E.F.; Song, C.; et al. Widespread Decline of Congo Rainforest Greenness in the Past Decade. Nature 2014, 509, 86–90. [Google Scholar] [CrossRef] [PubMed]
  3. Xie, Y.; Wang, X.; Wilson, A.M.; Silander, J.A. Predicting Autumn Phenology: How Deciduous Tree Species Respond to Weather Stressors. Agric. For. Meteorol. 2018, 250–251, 127–137. [Google Scholar] [CrossRef]
  4. Qiu, T.; Song, C.; Clark, J.S.; Seyednasrollah, B.; Rathnayaka, N.; Li, J. Understanding the Continuous Phenological Development at Daily Time Step with a Bayesian Hierarchical Space-Time Model: Impacts of Climate Change and Extreme Weather Events. Remote Sens. Environ. 2020, 247, 111956. [Google Scholar] [CrossRef]
  5. Zhu, Z.; Piao, S.; Myneni, R.B.; Huang, M.; Zeng, Z.; Canadell, J.G.; Ciais, P.; Sitch, S.; Friedlingstein, P.; Arneth, A.; et al. Greening of the Earth and Its Drivers. Nat. Clim. Chang. 2016, 6, 791–795. [Google Scholar] [CrossRef]
  6. Piao, S.; Wang, X.; Park, T.; Chen, C.; Lian, X.; He, Y.; Bjerke, J.W.; Chen, A.; Ciais, P.; Tømmervik, H.; et al. Characteristics, Drivers and Feedbacks of Global Greening. Nat. Rev. Earth Environ. 2020, 1, 14–27. [Google Scholar] [CrossRef]
  7. Chen, C.; Park, T.; Wang, X.; Piao, S.; Xu, B.; Chaturvedi, R.K.; Fuchs, R.; Brovkin, V.; Ciais, P.; Fensholt, R.; et al. China and India Lead in Greening of the World through Land-Use Management. Nat. Sustain. 2019, 2, 122–129. [Google Scholar] [CrossRef]
  8. Gibson, L.; Lee, T.M.; Koh, L.P.; Brook, B.W.; Gardner, T.A.; Barlow, J.; Peres, C.A.; Bradshaw, C.J.A.; Laurance, W.F.; Lovejoy, T.E.; et al. Primary Forests Are Irreplaceable for Sustaining Tropical Biodiversity. Nature 2011, 478, 378–381. [Google Scholar] [CrossRef]
  9. Leßmeister, A.; Bernhardt-Römermann, M.; Schumann, K.; Thiombiano, A.; Wittig, R.; Hahn, K. Vegetation Changes over the Past Two Decades in a West African Savanna Ecosystem. Appl. Veg. Sci. 2019, 22, 230–242. [Google Scholar] [CrossRef]
  10. Wu, L.; Chen, H.; Chen, D.; Wang, S.; Wu, Y.; Wang, B.; Liu, S.; Yue, L.; Yu, J.; Bai, Y. Soil Biota Diversity and Plant Diversity Both Contributed to Ecosystem Stability in Grasslands. Ecol. Lett. 2023, 26, 858–868. [Google Scholar] [CrossRef]
  11. Sheil, D. Forests, Atmospheric Water and an Uncertain Future: The New Biology of the Global Water Cycle. For. Ecosyst. 2018, 5, 19. [Google Scholar] [CrossRef]
  12. Gang, C.; Wang, Z.; Chen, Y.; Yang, Y.; Li, J.; Cheng, J.; Qi, J.; Odeh, I. Drought-Induced Dynamics of Carbon and Water Use Efficiency of Global Grasslands from 2000 to 2011. Ecol. Indic. 2016, 67, 788–797. [Google Scholar] [CrossRef]
  13. Li, Y.; Li, Z.-L.; Wu, H.; Zhou, C.; Liu, X.; Leng, P.; Yang, P.; Wu, W.; Tang, R.; Shang, G.-F.; et al. Biophysical Impacts of Earth Greening Can Substantially Mitigate Regional Land Surface Temperature Warming. Nat. Commun. 2023, 14, 121. [Google Scholar] [CrossRef]
  14. Zhang, Y.; Piao, S.; Sun, Y.; Rogers, B.M.; Li, X.; Lian, X.; Liu, Z.; Chen, A.; Peñuelas, J. Future Reversal of Warming-Enhanced Vegetation Productivity in the Northern Hemisphere. Nat. Clim. Chang. 2022, 12, 581–586. [Google Scholar] [CrossRef]
  15. Diepstraten, R.A.E.; Jessen, T.D.; Fauvelle, C.M.D.; Musiani, M.M. Does Climate Change and Plant Phenology Research Neglect the Arctic Tundra? Ecosphere 2018, 9, e02362. [Google Scholar] [CrossRef]
  16. Li, Y.; Zhang, W.; Schwalm, C.R.; Gentine, P.; Smith, W.K.; Ciais, P.; Kimball, J.S.; Gazol, A.; Kannenberg, S.A.; Chen, A.; et al. Widespread Spring Phenology Effects on Drought Recovery of Northern Hemisphere Ecosystems. Nat. Clim. Chang. 2023, 13, 182–188. [Google Scholar] [CrossRef]
  17. Chen, J.; Shao, Z.; Deng, X.; Huang, X.; Dang, C. Vegetation as the Catalyst for Water Circulation on Global Terrestrial Ecosystem. Sci. Total Environ. 2023, 895, 165071. [Google Scholar] [CrossRef]
  18. Na, R.; Na, L.; Du, H.; He, H.S.; Shan, Y.; Zong, S.; Huang, L.; Yang, Y.; Wu, Z. Vegetation Greenness Variations and Response to Climate Change in the Arid and Semi-Arid Transition Zone of the Mongo-Lian Plateau during 1982–2015. Remote Sens. 2021, 13, 4066. [Google Scholar] [CrossRef]
  19. Cui, J.; Lian, X.; Huntingford, C.; Gimeno, L.; Wang, T.; Ding, J.; He, M.; Xu, H.; Chen, A.; Gentine, P.; et al. Global Water Availability Boosted by Vegetation-Driven Changes in Atmospheric Moisture Transport. Nat. Geosci. 2022, 15, 982–988. [Google Scholar] [CrossRef]
  20. Sun, Z.; Ouyang, Z.; Zhang, X.; Ren, W. A New Global Dataset of Phase Synchronization of Temperature and Precipitation: Its Climatology and Contribution to Global Vegetation Productivity. Geosci. Data J. 2019, 6, 126–136. [Google Scholar] [CrossRef]
  21. Keenan, R.J. Climate Change Impacts and Adaptation in Forest Management: A Review. Ann. For. Sci. 2015, 72, 145–167. [Google Scholar] [CrossRef]
  22. Wang, G.; Mang, S.L.; Riehl, B.; Huang, J.; Wang, G.; Xu, L.; Huang, K.; Innes, J. Climate Change Impacts and Forest Adaptation in the Asia–Pacific Region: From Regional Experts’ Perspectives. J. For. Res. 2019, 30, 277–293. [Google Scholar] [CrossRef]
  23. Choat, B.; Jansen, S.; Brodribb, T.J.; Cochard, H.; Delzon, S.; Bhaskar, R.; Bucci, S.J.; Feild, T.S.; Gleason, S.M.; Hacke, U.G.; et al. Global Convergence in the Vulnerability of Forests to Drought. Nature 2012, 491, 752–755. [Google Scholar] [CrossRef] [PubMed]
  24. Niu, S.; Wu, M.; Han, Y.; Xia, J.; Li, L.; Wan, S. Water-Mediated Responses of Ecosystem Carbon Fluxes to Climatic Change in a Temperate Steppe. New Phytol. 2008, 177, 209–219. [Google Scholar] [CrossRef] [PubMed]
  25. Zheng, K.; Wei, J.-Z.; Pei, J.-Y.; Cheng, H.; Zhang, X.-L.; Huang, F.-Q.; Li, F.-M.; Ye, J.-S. Impacts of Climate Change and Human Activities on Grassland Vegetation Variation in the Chinese Loess Plateau. Sci. Total Environ. 2019, 660, 236–244. [Google Scholar] [CrossRef]
  26. Wang, H.; Liu, H.; Cao, G.; Ma, Z.; Li, Y.; Zhang, F.; Zhao, X.; Zhao, X.; Jiang, L.; Sanders, N.J.; et al. Alpine Grassland Plants Grow Earlier and Faster but Biomass Remains Unchanged over 35 Years of Climate Change. Ecol. Lett. 2020, 23, 701–710. [Google Scholar] [CrossRef] [PubMed]
  27. Gang, C.; Zhou, W.; Chen, Y.; Wang, Z.; Sun, Z.; Li, J.; Qi, J.; Odeh, I. Quantitative Assessment of the Contributions of Climate Change and Human Activities on Global Grassland Degradation. Environ. Earth Sci. 2014, 72, 4273–4282. [Google Scholar] [CrossRef]
  28. Henry, G.H.R.; Hollister, R.D.; Klanderud, K.; Björk, R.G.; Bjorkman, A.D.; Elphinstone, C.; Jónsdóttir, I.S.; Molau, U.; Petraglia, A.; Oberbauer, S.F.; et al. The International Tundra Experiment (ITEX): 30 Years of Research on Tundra Ecosystems. Arct. Sci. 2022, 8, 550–571. [Google Scholar] [CrossRef]
  29. May, J.L.; Hollister, R.D.; Betway, K.R.; Harris, J.A.; Tweedie, C.E.; Welker, J.M.; Gould, W.A.; Oberbauer, S.F. NDVI Changes Show Warming Increases the Length of the Green Season at Tundra Communities in Northern Alaska: A Fine-Scale Analysis. Front. Plant Sci. 2020, 11, 1174. [Google Scholar] [CrossRef]
  30. Field, C.B.; Barros, V.; Stocker, T.F.; Qin, D.; Dokken, D.J.; Ebi, K.L.; Mastrandrea, M.D.; Mach, K.J.; Plattner, G.-K.; Allen, S.K.; et al. (Eds.) Managing the Risks of Extreme Events and Disasters to Advance Climate Change Adaptation: Special Report of the Intergovernmental Panel on Climate Change; Cambridge University Press: Cambridge, UK, 2012; ISBN 978-1-107-02506-6. [Google Scholar]
  31. Diffenbaugh, N.S.; Singh, D.; Mankin, J.S.; Horton, D.E.; Swain, D.L.; Touma, D.; Charland, A.; Liu, Y.; Haugen, M.; Tsiang, M.; et al. Quantifying the Influence of Global Warming on Unprecedented Extreme Climate Events. Proc. Natl. Acad. Sci. USA 2017, 114, 4881–4886. [Google Scholar] [CrossRef]
  32. Sun, S.; Shi, P.; Zhang, Q.; Wang, J.; Wu, J.; Chen, D. Evolution of Future Precipitation Extremes: Viewpoint of Climate Change Classification. Int. J. Climatol. 2022, 42, 1220–1230. [Google Scholar] [CrossRef]
  33. Didan, K.; Munoz, A.B.; Solano, R.; Huete, A. 34.MODIS Vegetation Index User’s Guide (MOD13 Series); Version 3.1.; Vegetation Index and Phenology Lab, University of Arizona: Tucson, AZ, USA, 2015. [Google Scholar]
  34. Huete, A.; Didan, K.; Miura, T.; Rodriguez, E.P.; Gao, X.; Ferreira, L.G. Overview of the Radiometric and Biophysical Performance of the MODIS Vegetation Indices. Remote Sens. Environ. 2002, 83, 195–213. [Google Scholar] [CrossRef]
  35. Zhang, H.; Zhan, C.; Xia, J.; Yeh, P.J.-F. Responses of Vegetation to Changes in Terrestrial Water Storage and Temperature in Global Mountainous Regions. Sci. Total Environ. 2022, 851, 158416. [Google Scholar] [CrossRef]
  36. Yuan, Z.; Xu, J.J.; Chen, J.; Wang, Y.Q.; Yin, J. EVI Indicated Spatial-Temporal Variations in Vegetation and Their Responses to Climatic and Anthropogenic Factors in the Chinese Mainland Since 2000s. J. Environ. Inform. 2021, 40, 157–175. [Google Scholar] [CrossRef]
  37. Zhang, D.; Geng, X.; Chen, W.; Fang, L.; Yao, R.; Wang, X.; Zhou, X. Inconsistency of Global Vegetation Dynamics Driven by Climate Change: Evidences from Spatial Regression. Remote Sens. 2021, 13, 3442. [Google Scholar] [CrossRef]
  38. Sa, C.; Meng, F.; Luo, M.; Li, C.; Wang, M.; Adiya, S.; Bao, Y. Spatiotemporal Variation in Snow Cover and Its Effects on Grassland Phenology on the Mongolian Plateau. J. Arid Land 2021, 13, 332–349. [Google Scholar] [CrossRef]
  39. Na, L.; Na, R.; Zhang, J.; Tong, S.; Shan, Y.; Ying, H.; Li, X.; Bao, Y. Vegetation Dynamics and Diverse Responses to Extreme Climate Events in Different Vegetation Types of Inner Mongolia. Atmosphere 2018, 9, 394. [Google Scholar] [CrossRef]
  40. Kazemzadeh, M.; Hashemi, H.; Jamali, S.; Uvo, C.B.; Berndtsson, R.; Huffman, G.J. Linear and Nonlinear Trend Analyzes in Global Satellite-Based Precipitation, 1998–2017. Earths Future 2021, 9, e2020EF001835. [Google Scholar] [CrossRef]
  41. Fan, M.; Xu, J.; Yu, W.; Chen, Y.; Wang, M.; Dai, W.; Wang, Y. Recent Tianshan Warming in Relation to Large-Scale Climate Teleconnections. Sci. Total Environ. 2023, 856, 159201. [Google Scholar] [CrossRef]
  42. Lafleur, P.M.; Humphreys, E.R. Tundra Shrub Effects on Growing Season Energy and Carbon Dioxide Exchange. Environ. Res. Lett. 2018, 13, 055001. [Google Scholar] [CrossRef]
  43. Zhang, X.; Chen, Y.; Fang, G.; Xia, Z.; Yang, Y.; Duan, W.; Xia, Q.; Li, S. Future Changes in Extreme Precipitation from 1.0 °C More Warming in the Tienshan Mountains, Central Asia. J. Hydrol. 2022, 612, 128269. [Google Scholar] [CrossRef]
  44. Isenlin COVID-19 Has a Major Impact on World Forestry. Available online: http://www.isenlin.cn/sf_2F72B31295974CDE929EFBFAB0CBFF2F_209_43659777456.html (accessed on 1 June 2023).
  45. Su, F.; Fu, D.; Yan, F.; Xiao, H.; Pan, T.; Xiao, Y.; Kang, L.; Zhou, C.; Meadows, M.; Lyne, V.; et al. Rapid Greening Response of China’s 2020 Spring Vegetation to COVID-19 Restrictions: Implications for Climate Change. Sci. Adv. 2021, 7, eabe8044. [Google Scholar] [CrossRef]
  46. Deb, J.; Phinn, S.; Butt, N.; McAlpine, C. Climate Change Impacts on Tropical Forests: Identifying Risks for Tropical Asia. J. Trop. For. Sci. 2018, 30, 182–194. [Google Scholar]
  47. Chang, J.; Tian, J.; Zhang, Z.; Chen, X.; Chen, Y.; Chen, S.; Duan, Z. Changes of Grassland Rain Use Efficiency and NDVI in Northwestern China from 1982 to 2013 and Its Response to Climate Change. Water 2018, 10, 1689. [Google Scholar] [CrossRef]
  48. Chen, Y.; Li, J.; Ju, W.; Ruan, H.; Qin, Z.; Huang, Y.; Jeelani, N.; Padarian, J.; Propastin, P. Quantitative Assessments of Water-Use Efficiency in Temperate Eurasian Steppe along an Aridity Gradient. PLoS ONE 2017, 12, e0179875. [Google Scholar] [CrossRef]
  49. Zhang, Z.; Chang, J.; Xu, C.-Y.; Zhou, Y.; Wu, Y.; Chen, X.; Jiang, S.; Duan, Z. The Response of Lake Area and Vegetation Cover Variations to Climate Change over the Qinghai-Tibetan Plateau during the Past 30 years. Sci. Total Environ. 2018, 635, 443–451. [Google Scholar] [CrossRef] [PubMed]
  50. Sala, O.E.; Lauenroth, W.K. Small Rainfall Events: An Ecological Role in Semiarid Regions. Oecologia 1982, 53, 301–304. [Google Scholar] [CrossRef] [PubMed]
  51. Schwinning, S.; Sala, O.E.; Loik, M.E.; Ehleringer, J.R. Thresholds, Memory, and Seasonality: Understanding Pulse Dynamics in Arid/Semi-Arid Ecosystems. Oecologia 2004, 141, 191–193. [Google Scholar] [CrossRef]
  52. Song, Y.; Lu, Y.; Guo, Z.; Xu, X.; Liu, T.; Wang, J.; Wang, W.; Hao, W.; Wang, J. Variations in Soil Water Content and Evapotranspiration in Relation to Precipitation Pulses within Desert Steppe in Inner Mongolia, China. Water 2019, 11, 198. [Google Scholar] [CrossRef]
  53. Dou, W.; Xiao, B.; Yao, X.; Kidron, G.J. Asymmetric Responses of Biocrust Respiration to Precipitation Manipulation under a Changing Semiarid Climate. Geoderma 2023, 430, 116318. [Google Scholar] [CrossRef]
  54. Sponseller, R.A.; Hall, S.J.; Huber, D.P.; Grimm, N.B.; Kaye, J.P.; Clark, C.M.; Collins, S.L. Variation in Monsoon Precipitation Drives Spatial and Temporal Patterns of Larrea Tridentata Growth in the Sonoran Desert. Funct. Ecol. 2012, 26, 750–758. [Google Scholar] [CrossRef]
  55. Gao, X.; Zhao, X.; Li, H.; Guo, L.; Lv, T.; Wu, P. Exotic Shrub Species (Caragana Korshinskii) Is More Resistant to Extreme Natural Drought than Native Species (Artemisia Gmelinii) in a Semiarid Revegetated Ecosystem. Agric. For. Meteorol. 2018, 263, 207–216. [Google Scholar] [CrossRef]
  56. Laughlin, D.C.; Mommer, L.; Sabatini, F.M.; Bruelheide, H.; Kuyper, T.W.; McCormack, M.L.; Bergmann, J.; Freschet, G.T.; Guerrero-Ramírez, N.R.; Iversen, C.M.; et al. Root Traits Explain Plant Species Distributions along Climatic Gradients yet Challenge the Nature of Ecological Trade-Offs. Nat. Ecol. Evol. 2021, 5, 1123–1134. [Google Scholar] [CrossRef] [PubMed]
  57. Tian, F.; Fensholt, R.; Verbesselt, J.; Grogan, K.; Horion, S.; Wang, Y. Evaluating Temporal Consistency of Long-Term Global NDVI Datasets for Trend Analysis. Remote Sens. Environ. 2015, 163, 326–340. [Google Scholar] [CrossRef]
  58. Lyapustin, A.; Wang, Y.; Xiong, X.; Meister, G.; Platnick, S.; Levy, R.; Franz, B.; Korkin, S.; Hilker, T.; Tucker, J.; et al. Scientific Impact of MODIS C5 Calibration Degradation and C6+ Improvements. Atmos. Meas. Tech. 2014, 7, 4353–4365. [Google Scholar] [CrossRef]
Figure 1. The global distribution of forest, grassland, shrubland, and tundra. The whole four terrestrial typical vegetation regions are defined according to the GlobeLand30 dataset.
Remotesensing 15 04245 g001
Figure 2. The interannual variation of EVI in global (a) forest, (b) grassland, (c) shrubland, and (d) tundra (FGST) ecosystems from 2000 to 2021.
Remotesensing 15 04245 g002
Figure 3. The spatial distribution of the multi-year mean EVI in global (a) forest, (b) grassland, (c) shrubland, and (d) tundra (FGST) ecosystems from 2000 to 2021. (e) The statistics of each ecosystem, where the red fork is the mean value, and the line in the box is the median line.
Remotesensing 15 04245 g003
Figure 4. The linear trend of EVI in global (a) forest, (b) grassland, (c) shrubland, and (d) tundra (FGST) ecosystems from 2000 to 2021.
Remotesensing 15 04245 g004
Figure 5. The significance of EVI linear trend in global (a) forest, (b) grassland, (c) shrubland, and (d) tundra (FGST) ecosystems from 2000 to 2021.
Remotesensing 15 04245 g005
Figure 6. The interannual characteristics of (a) annual mean temperature and (b) annual precipitation in the global forest, grassland, shrubland, and tundra (FGST) from 2000 to 2021.
Remotesensing 15 04245 g006
Figure 7. The spatial distribution of partial correlation coefficients between EVI and annual precipitation in global (a) forest, (b) grassland, (c) shrubland, and (d) tundra (FGST) ecosystems from 2000 to 2021. The region filled in red at the bottom left corner of (ac) and the right side of (d) is significant at p < 0.05.
Remotesensing 15 04245 g007
Figure 8. The spatial distribution of partial correlation coefficients between EVI and multi-year mean temperature in global (a) forest, (b) grassland, (c) shrubland, and (d) tundra (FGST) ecosystems from 2000 to 2021. The region filled in red at the bottom left corner of (ac) and the right side of (d) is significant at p < 0.05.
Remotesensing 15 04245 g008
Figure 9. The gray relation grade of the extreme climate indices and the global (a) forest, (b) grassland, (c) shrubland, and (d) tundra (FGST) ecosystems EVI from 2000 to 2021.
Remotesensing 15 04245 g009
Disclaimer/Publisher’s Note: The statements, opinions and data contained in all publications are solely those of the individual author(s) and contributor(s) and not of MDPI and/or the editor(s). MDPI and/or the editor(s) disclaim responsibility for any injury to people or property resulting from any ideas, methods, instructions or products referred to in the content.

