Article

Response of Vegetation Phenology to Climate Change on the Tibetan Plateau Considering Time-Lag and Cumulative Effects

1
School of Earth Sciences and Technology, Zhengzhou University, Zhengzhou 450001, China
2
State Key Laboratory of Severe Weather, Chinese Academy of Meteorological Sciences, Beijing 100081, China
*
Author to whom correspondence should be addressed.
Remote Sens. 2024, 16(1), 49; https://doi.org/10.3390/rs16010049
Submission received: 30 October 2023 / Revised: 10 December 2023 / Accepted: 18 December 2023 / Published: 21 December 2023

Abstract

:
The study of the response of vegetation phenology in the Qinghai Tibet Plateau to various climatic variables is paramount to unveiling the reaction of alpine ecosystems to worldwide climate alterations. Nonetheless, the lagged and cumulative effects of various climatic variables on vegetation phenology in the Qinghai Tibet Plateau remain unclear. Therefore, based on MODIS NDVI data, we extracted vegetation phenological parameters from 2001 to 2020, including the start of the vegetation growing season (SOS) and the end of the vegetation growing season (EOS), and then analyzed the response mechanisms of vegetation phenology to pre-seasonal air temperature (T), precipitation (P), and daytime and nighttime land surface temperatures (DLST, NLST) in the Qinghai Tibet Plateau on the basis of an investigation of the lag and cumulative effects. The results showed that: (1) the multiyear mean values of the SOS mainly occurred from 120 to 160 days, accounting for 86.17% of the study area, while the multiyear mean values of the EOS were mainly concentrated between 260 and 280 days, accounting for 77.05% of the study area; (2) air temperature (T), precipitation (P), and daytime and nighttime land surface temperatures (DLST, NLST) had different degrees of lagging effects on the SOS and the EOS. Among them, the time lag effect of precipitation on vegetation phenology was more pronounced; (3) different climatic variables had distinct cumulative effects on vegetation phenology. In contrast to the insignificant cumulative effects of temperature and nighttime surface temperature on the SOS and the EOS, the cumulative effects of precipitation and daytime land surface temperature on the SOS were more pronounced than those on the EOS; (4) the SOS and air temperature, precipitation, and NLST were mainly negatively correlated, in which the proportion of the negative correlation between SOS and NLST was up to 68.80%, and SOS and DLST were mainly positively correlated with a positive correlation proportion of 73.27%, EOS and air temperature, precipitation, and NLST were positively correlated with a positive correlation proportion of EOS and precipitation of up to 71.52%, and EOS and DLST were mainly negatively correlated with a negative correlation ratio of 55.87%.

1. Introduction

With global climate change, greater interest has been drawn to the spatiotemporal variations of land surface vegetation phenology and its relevant environmental variables in global change research [1,2,3]. The vegetative ecosystem of the Qinghai Tibet Plateau is primarily composed of alpine grassland, which is especially susceptible to climate change. According to research on vegetation phenology variations on the Qinghai Tibet Plateau, it has been found that rapid warming causes springtime vegetation phenology to occur earlier [4,5] and autumntime vegetation phenology to occur later [6,7]. And a sequence of shifts in vegetation phenology will unavoidably have a profound impact on grassland productivity, species diversity, terrestrial carbon, and water cycles [8,9]. Since vegetation ecosystems on the Qinghai Tibet Plateau have an essential function in regulating global warming and water resources in East Asia [10,11], investigating how the Qinghai Tibet Plateau’s vegetation phenology responds to climate change is crucial for ensuring ecological stability and sustainable development in the region as well as in East Asia.
Numerous investigations have explored the association between climate parameters and vegetation phenology in the Qinghai Tibet Plateau [12,13,14,15,16]. For instance, Ganjurjav et al. [12] carried out a control experiment and found that, in warm and dry years, the warming temperature will delay the SOS, while in cold and wet years, the warming temperature will advance the SOS. Li et al. [15] reported that the sunshine duration, precipitation, and average temperature in autumn delayed the EOS, while the average temperature and sunshine duration in summer advanced it. In the Qaidam Basin, Fu et al. [16] discovered a combined effect of spring temperature and precipitation on the SOS. However, most studies concentrate on examining the phenology of the vegetation in relation to annual and seasonal climatic change. Research on the lagged and cumulative effects of various preseason climate factors on vegetation phenology in the Qinghai Tibet Plateau is inadequate, and the conclusions reached by different scholars are also inconsistent. For instance, Cong et al. [17] found that the greatest impacts of precipitation and temperature on the EOS on the Qinghai Tibet Plateau occurred mainly in the 2 months prior to the EOS. Li et al. [18] noted that, in the Qinghai Tibet Plateau, the positive correlation percentages between EOS and temperature in the first month and the 1–2 months prior to the EOS, and between EOS and precipitation in the 1–2 months and 1–3 months prior to the EOS were the highest. In contrast, other scholars have suggested that the greatest feedback between temperature, precipitation, and vegetation phenology occurs in the first month before phenology occurs [19,20]. In addition, it has been shown that preseason (before the onset of phenological events) climatic conditions play an essential function in influencing vegetation phenology. For example, the spring temperature (February to April) is the key variable of spring phenological changes in temperate China, where the SOS is significantly connected with the temperature of the first 1–3 months of the SOS [21]. In the temperate typical grassland in the arid and semi-arid zone of Northeast China, the SOS was most significantly related to the precipitation in the 2–4 months prior to the SOS [22]. Early prespring temperatures also have a lagged effect on the spring vegetation phenology in the middle and high latitudes of the Northern Hemisphere and the Yarlung Tsangpo region [23,24]. In conclusion, the lagged and cumulative effects of climatic variables on vegetation phenology are still not sufficiently studied or understood on the Qinghai Tibet Plateau, which limits the accurate modelling and prediction of vegetation phenology and may lead to uncertainty about ecosystems’ carbon sinks responding to climate change [25]. Hence, it is essential to systematically investigate the lagged and cumulative effects of different climate variables on Qinghai Tibet Plateau vegetation phenology, as well as the association between land surface vegetation phenology and climatic parameters there.
When exploring the relationship between vegetation phenology and ambient temperature on the Qinghai Tibet Plateau, most studies have focused on the response of vegetation phenology to maximum, minimum, and mean air temperature [26,27,28,29]. Air temperature, as an important indicator of climate warming, increases the activity of enzymes and accelerates the plant growth process, causing early SOS and delayed EOS [30]. Land surface temperature (LST) characterizes the temperature of the bare ground surface or the top of the canopy. It plays an important role in all physical, biological, and microbiological processes in the soil, which significantly impacts the germination of plant seeds and the growth and development of the plant [31,32]. As land surface temperatures rise in the spring, frozen soils in some parts of the Qinghai Tibet Plateau thaw, and vegetation grows and enters a new phenological cycle [33,34]. Therefore, land surface temperature plays an influential role in the shift of vegetation phenology on the Qinghai Tibet Plateau. For example, the average annual land surface temperature (LST) was significantly correlated with the corresponding vegetation critical phenological periods in Northeast China [35]. Gao et al. [36] found land surface temperature (LST) in the Central Asian Great Lakes region was the primary determinant of the advanced SOS, and the impact of surface temperature on EOS in different climatic zones was also different. Based on the above research results, an in-depth exploration of the effects of various climatic factors on vegetation phenology in the Qinghai Tibet Plateau will help us to fully grasp the influence of changes in climatic events on the vegetation of the ecologically fragile Qinghai Tibet Plateau. It can provide a theoretical foundation for formulating a scientific and rational strategy for conserving and restoring grassland vegetation on the Qinghai Tibet Plateau.
Therefore, we use the MOD13A2 NDVI datasets to extract vegetation phenology parameters from 2001 to 2020, including the SOS and the EOS, and then explore the impact of air temperature, precipitation, and daytime and nighttime land surface temperatures on vegetation phenology after considering the time-lag and cumulative effects. The aim is to attempt to respond to the following questions: (1) What are the time-lag and cumulative effects of different climate variables on the SOS and EOS in the Qinghai Tibet Plateau amidst global climate change conditions? (2) How do various preseason climatic variables affect vegetation phenology on the Qinghai Tibet Plateau?

2. Materials and Methods
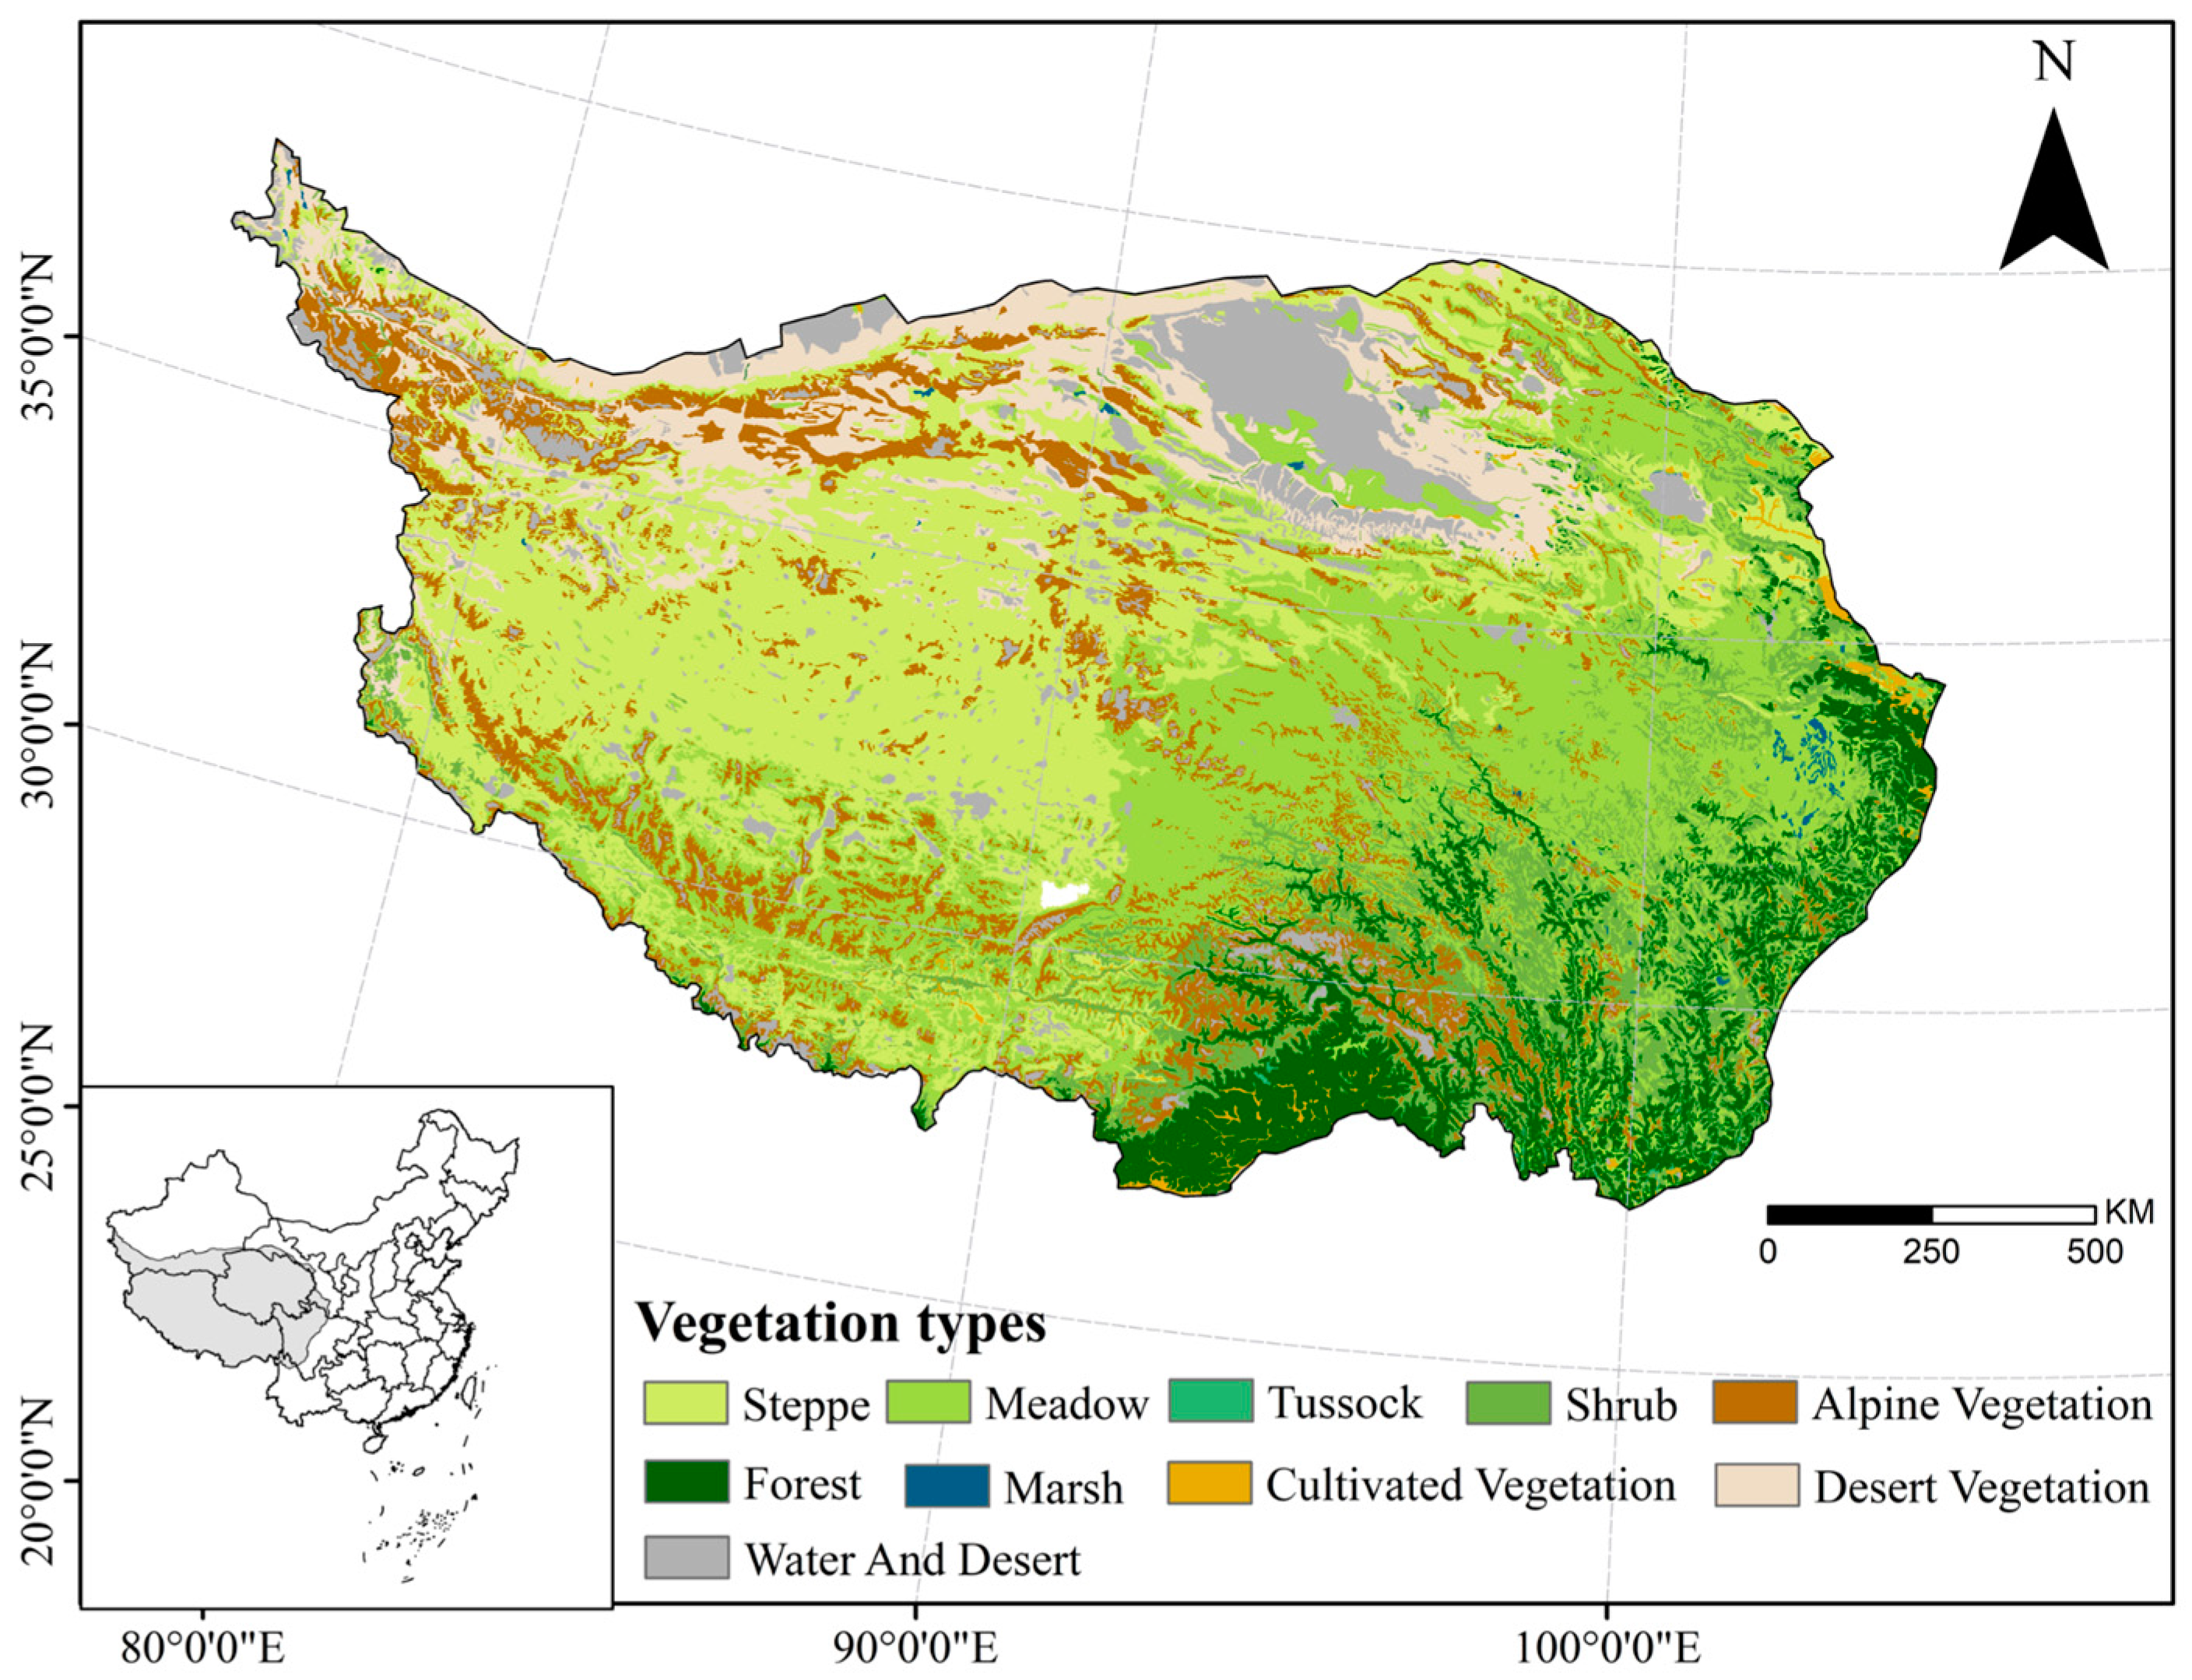
2.1. Study Area

The Qinghai Tibet Plateau is situated in Southwest China with interlocking geographic components and great spatial heterogeneity [7,37] (Figure 1). The Qinghai Tibet Plateau is a distinctive geographical feature, with an enormous terrain drop and a gradually increasing altitude from its southeast corner to the northwest. The average annual temperature drops from 20 °C to less than −6 °C, and the annual precipitation falls accordingly from 2000 mm to less than 50 mm from southeast to northwest. The air is thin, the solar radiation is intense, and the light and heat resources are sufficient [20]. The Qinghai Tibet Plateau is rich in vegetation types. The vegetation is influenced by altitude, highland monsoon climate, and high mountain ranges, etc. The vegetation zoning of China divides the Qinghai Tibet Plateau into 11 different vegetation types, mainly including steppe, meadow, shrub, alpine, and desert vegetation.

2.2. Data Acquisition

(1)
NDVI data: The NASA MOD13A2 datasets, with a 1 km geographical resolution and a 16-d temporal interval, spanning 2001–2021, served as the source for the NDVI data. A threshold of 0.05 in the annual mean NDVI was utilized to exclude the impact of non-vegetation factors [38]. The quality control bands of NDVI were extracted from the MOD13A2 dataset, and different weights were set for different pixel values [39] to improve the accuracy of fitting the NDVI time series. In particular, the weight of the ideal pixel was set to 1, the weight of the less ideal pixel was set to 0.8, and the weight of the pixel covered by snow and ice and cloud masking was set to 0.2.
(2)
Meteorological data: Monthly temperature data are supported by the National Tibetan Plateau Science Data Centre (http://data.tpdc.ac.cn (accessed on 6 December 2022)). The Delta spatial downscaling program generated the dataset based on the global 0.5° climate dataset published by CRU and the global high-resolution climate dataset, published by WorldClim and validated using data from 496 independent meteorological observations. Monthly precipitation data are supported by the National Earth System Science Data Centre (http://gre.geodata.cn (accessed on 15 December 2022)). The dataset was based on precipitation monitoring data from more than 2400 surface weather stations, which were interpolated using the spatial interpolation software anusplin 4.4 for climate data. Both datasets span the period 2001–2020 and were finally uniformly re-interpolated to raster datasets with a spatial resolution of 1 km.
(3)
Land surface temperature data: The daytime and nighttime land surface temperatures were sourced from the MOD11A2 dataset, with a time interval of 8 d and a spatial resolution of 1 km, spanning from 2001 to 2020. The vacant values of surface temperature were filled by interpolation using the surrounding image element averages. Then, the monthly averages were synthesized, and the units were converted into degrees Celsius.
(4)
Vegetation type data: The Centre for Resource and Environmental Science and Data of the Chinese Academy of Sciences (https://www.resdc.cn/ (accessed on 5 February 2023)) contributed the 1:1 million spatial distribution data of plant types in China.
(5)
Land use data: The data were obtained from the Centre for Resource and Environmental Science and Data of the Chinese Academy of Sciences (https://www.resdc.cn/ (accessed on 26 February 2023)) with a spatial resolution of 1 km. According to the first-class land use types, it can be divided into six types: cultivated land, forest land, grassland, water area, construction land, and unused land. Based on the land use data from two periods in 2000 and 2020, extract the areas where the land use cover type did not change during the research period and then extract the vegetation cover area as the research area [40,41].

2.3. Methods

(1)
Vegetation phenology extraction
Based on the TIMESAT 3.3 platform, the Asymmetrical Gaussian function fitting method (A-G filter) [42] was used for the reconstruction of the NDVI time series, followed by a dynamic thresholding method put forward by Jonsson et al. [43] (Per Jönsson; Lars Eklundh, 2002) to extract vegetation phenology from 2001 to 2020. In accordance with the NDVI time series characteristics of the study area and previous experience [27,44], the time when the NDVI rises to 20% of the current year’s NDVI amplitude is determined as the SOS during the rising NDVI phase, and the time when the NDVI falls to 50% of the current year’s NDVI amplitude is determined as the EOS during the falling NDVI phase.
(2)
Lagging and cumulative correlation analysis
In this study, based on the average dates of the SOS and EOS from 2001 to 2020 on the Qinghai Tibet Plateau, May was selected as the starting month of SOS and October as the starting month of EOS. Then, the average air temperature, precipitation, and average diurnal land surface temperature at different lag times and cumulative times before the start of SOS and EOS were calculated in monthly steps. Next, the correlated coefficients with regard to vegetation phenology and climate variables at different lag times and cumulative times were calculated using correlation analysis, and the time that corresponds to the maximum absolute value of the correlation coefficient was taken as the lag response time and cumulative response time of vegetation phenology to climate variables [45,46]. The lag response time was calculated as follows:
R _ l a g i = c o r r ( x , y i ) 0 i 5
R m a x _ l a g i = m a x ( R _ l a g i ) 0 i 5 ,
where R _ l a g i is the Pearson correlation coefficient between vegetation phenology and climatic factors for each lag month; variable x indicates SOS or EOS; variable y i denotes each climatic factor on a 1-month scale with a lag of i months; R max _ l a g i denotes the maximum value in | R _ l a g j | ; and the lag response time was determined to be the time that corresponds to the R max _ l a g i .
The cumulative response time was calculated as follows:
R _ c u m j = c o r r ( x , y j ) 0 j 5
R m a x _ c u m j = m a x ( R _ c u m j ) 0 j 5 ,
where R _ c u m j is the Pearson correlation coefficient between vegetation phenology and various climatic factors at different accumulation times; variable x indicates SOS or EOS; variable y j represents different climatic factors for the cumulative j months; R max _ c u m j denotes the maximum value in | R _ c u m j | ; and the cumulative response time was determined to be the time that corresponds to the R max _ c u m j .
(3)
Partial correlation analysis
After analyzing the lagged and cumulative effects of each climatic variable on vegetation phenology, using the high-order partial correlation method to investigate the correlation between the SOS and the EOS and pre-seasonal climate variables. The following is the formula for the partial correlation for phenology i and climate factor j [47,48]:
R i j . l 1 l 2 l g = R i j . l 1 l 2 l g 1 R i l g . l 1 l 2 l g 1 R j l g . l 1 l 2 l g 1 1 R i l g . l 1 l 2 l g 1 2 1 R j l g . l 1 l 2 l g 1 2
where R i j is the g order partial correlation coefficient between phenology i and climate factor j , the control variables are other climatic factors, and the right-hand sides of the equation are all partial correlation coefficients of order g 1 .

3. Results

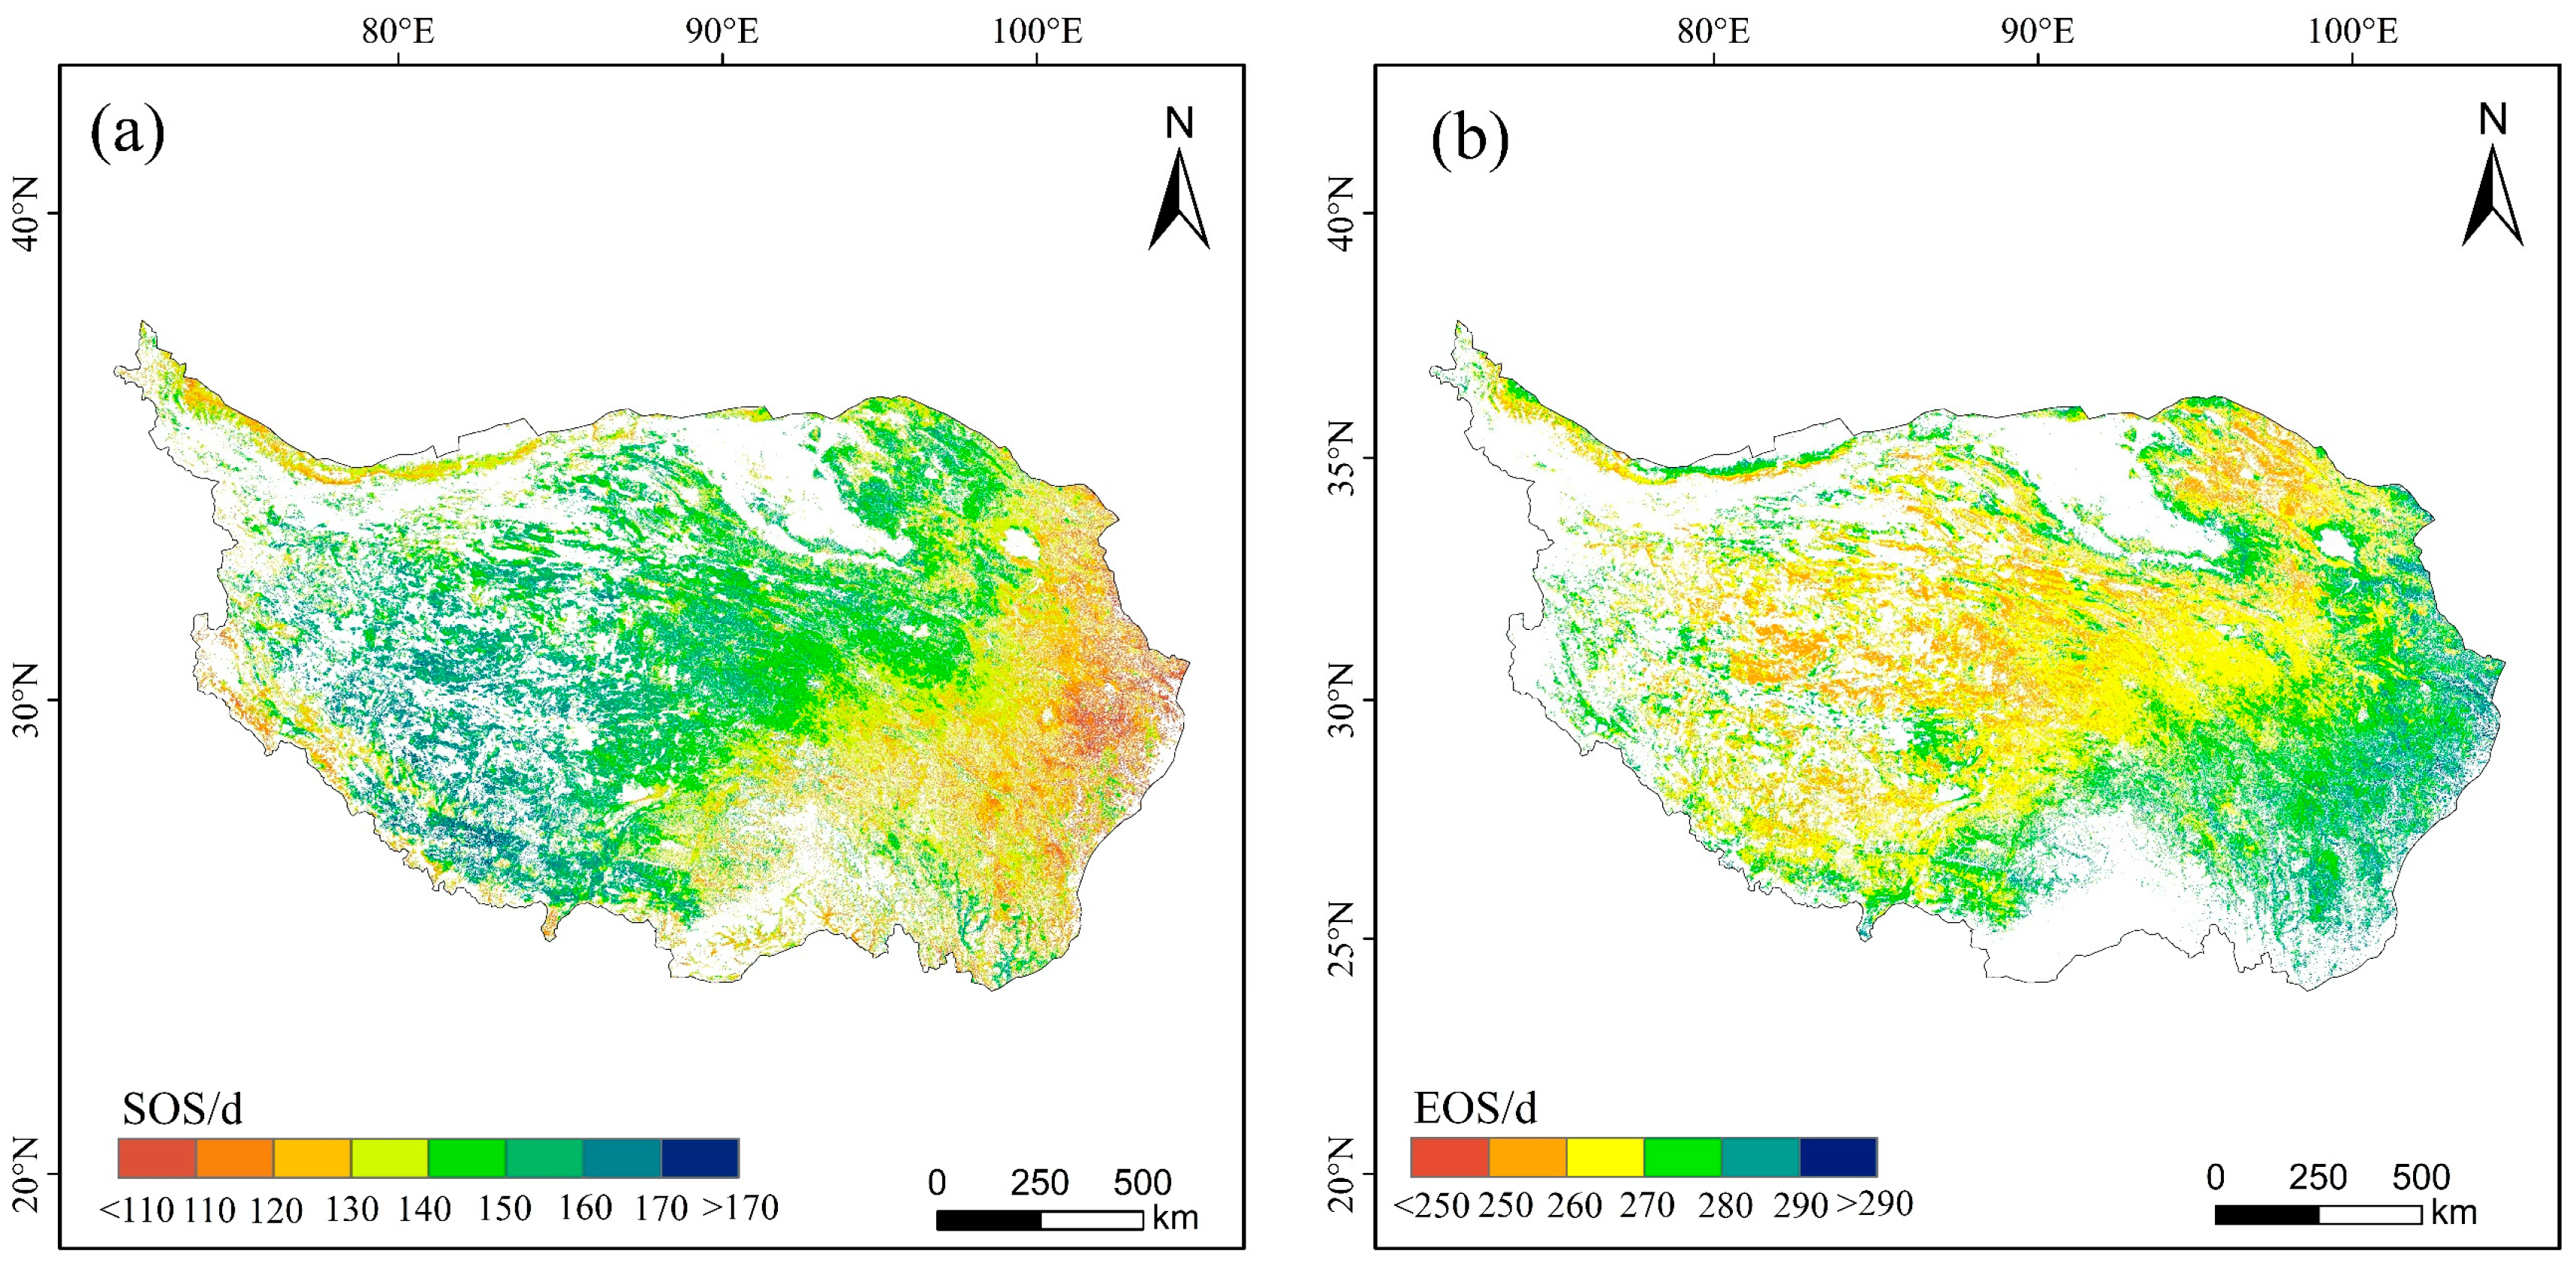
3.1. Spatial Distribution of Vegetation Phenology

The spatial distribution of the multiyear means of vegetation phenology on the Qinghai Tibet Plateau from 2001 to 2020 is shown in Figure 2. The duration of SOS was extended from 100 to 180 days, i.e., from early April to late June. The SOS was mainly concentrated between 120 and 160 days, accounting for 86.17% of the study area. From east to west, SOS appeared earlier in the valley area and later in the mountain (Figure 2a). The time range of the EOS is between 245 and 300 days, i.e., from early September to late October. EOS mainly occurred from 260 to 280 days, accounting for 77.05% of the study area. The earlier EOSs were mainly concentrated in the western region, while the later EOSs were mainly concentrated in the southeast region. In order to verify the credibility of the vegetation phenology extracted by remote sensing, the results of this study were compared with and verified using those of other scholars. The comparison results are shown in Table 1. The results of the vegetation phenology extracted in this study are basically consistent with those of Huang et al. [49], Yuan et al. [50], and Ji et al. [38]. In general, the phenological parameters extracted in this study have high reliability and can reflect the basic characteristics of phenology in the region.

3.2. Time-Lag Effect of Climate Factors on Vegetation Phenology

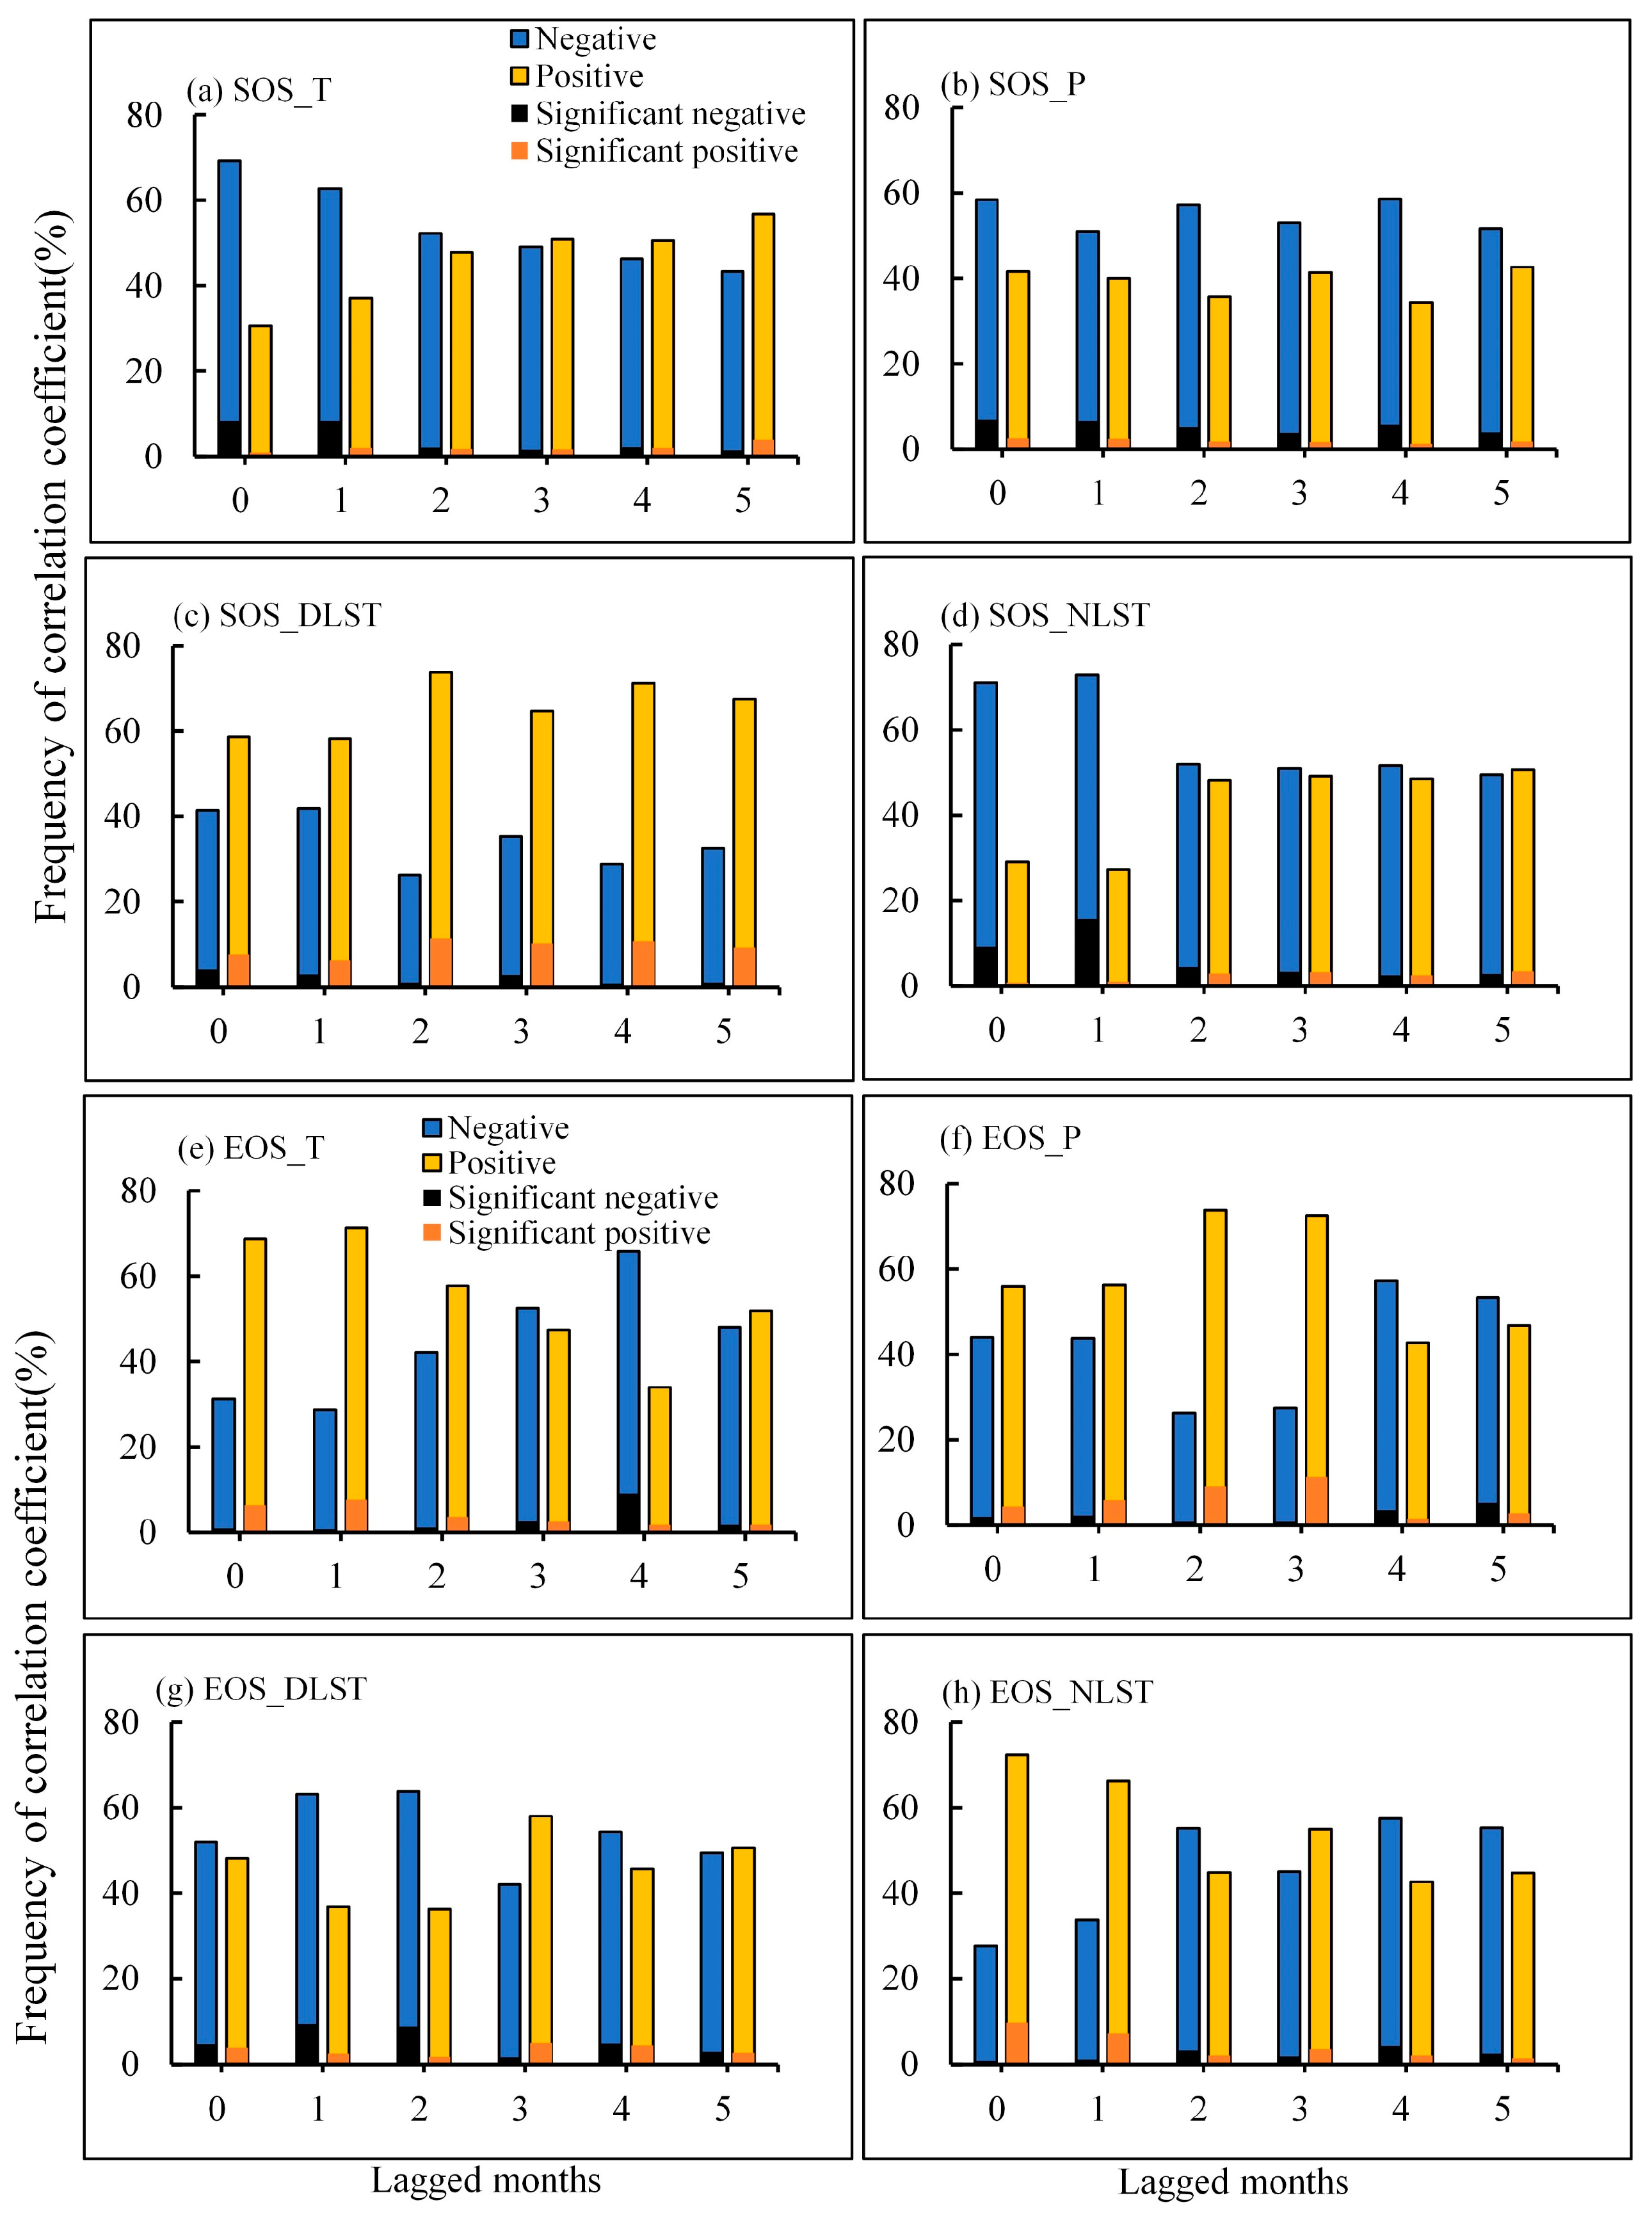
3.2.1. Temporal Variation of Time-Lag Effects

Figure 3 illustrates the frequency distribution of the correlation coefficients of SOS, EOS, and different climate factors at different lag times. The percentage of negative correlation between SOS and air temperature decreased gradually as the lag time moves forward. The highest percentage of significant negative correlation between SOS and air temperature was found at a lag time of 1 month with a percentage of 8.35%. SOS and precipitation were predominantly negatively correlated at different lag times, with the highest percentage of negative correlation between SOS and precipitation being 58.6% at a lag of 4 months. The highest percentage of significant negative correlation between SOS and precipitation was 6.94% at a lag of 0 months. SOS and DLST were mainly positively correlated at different lag times. The highest percentage of significant positive correlation between SOS and DLST was 11.37% at a lag time of 2 months. Except for the fifth month preceding the SOS, the SOS and NLST were predominantly negatively correlated from 0 to 4 months prior to the SOS, with the highest percentage of significant negative correlation at a lag time of 1 month being 15.75%.
EOS and air temperatures in the 0–2 and 5 months preceding the EOS were mainly positively correlated. EOS and air temperatures in the 3–4 months preceding the EOS were mainly negatively correlated. The highest percentage of significant positive correlation between EOS and air temperature was 7.67% at a lag time of 1 month, and the highest percentage of significant negative correlation was 9.03% at a lag time of 4 months. EOS and precipitation in the 0–3 months prior to the EOS were mainly negatively correlated, EOS and precipitation in the 4–5 months prior to EOS were mainly negatively correlated, with the highest percentage of significant positive correlation at a lag time of 3 months being 11.29%. EOS and DLST in the 0–2 and 4 months preceding the EOS were predominantly negatively correlated, with the highest percentage of significant negative correlation at a lag time of 1 month being 9.41%. EOS and DLST in the 3rd and 5th months prior to the EOS were predominantly positively correlated. The EOS and NLST in the 0–1 and 3 months prior to the EOS were mainly positively correlated, with the highest percentage of significant positive correlations at a lag time of 0 months being 9.76%. EOS and NLST in the 2nd and 4–5 months prior to the EOS were mainly negatively correlated.

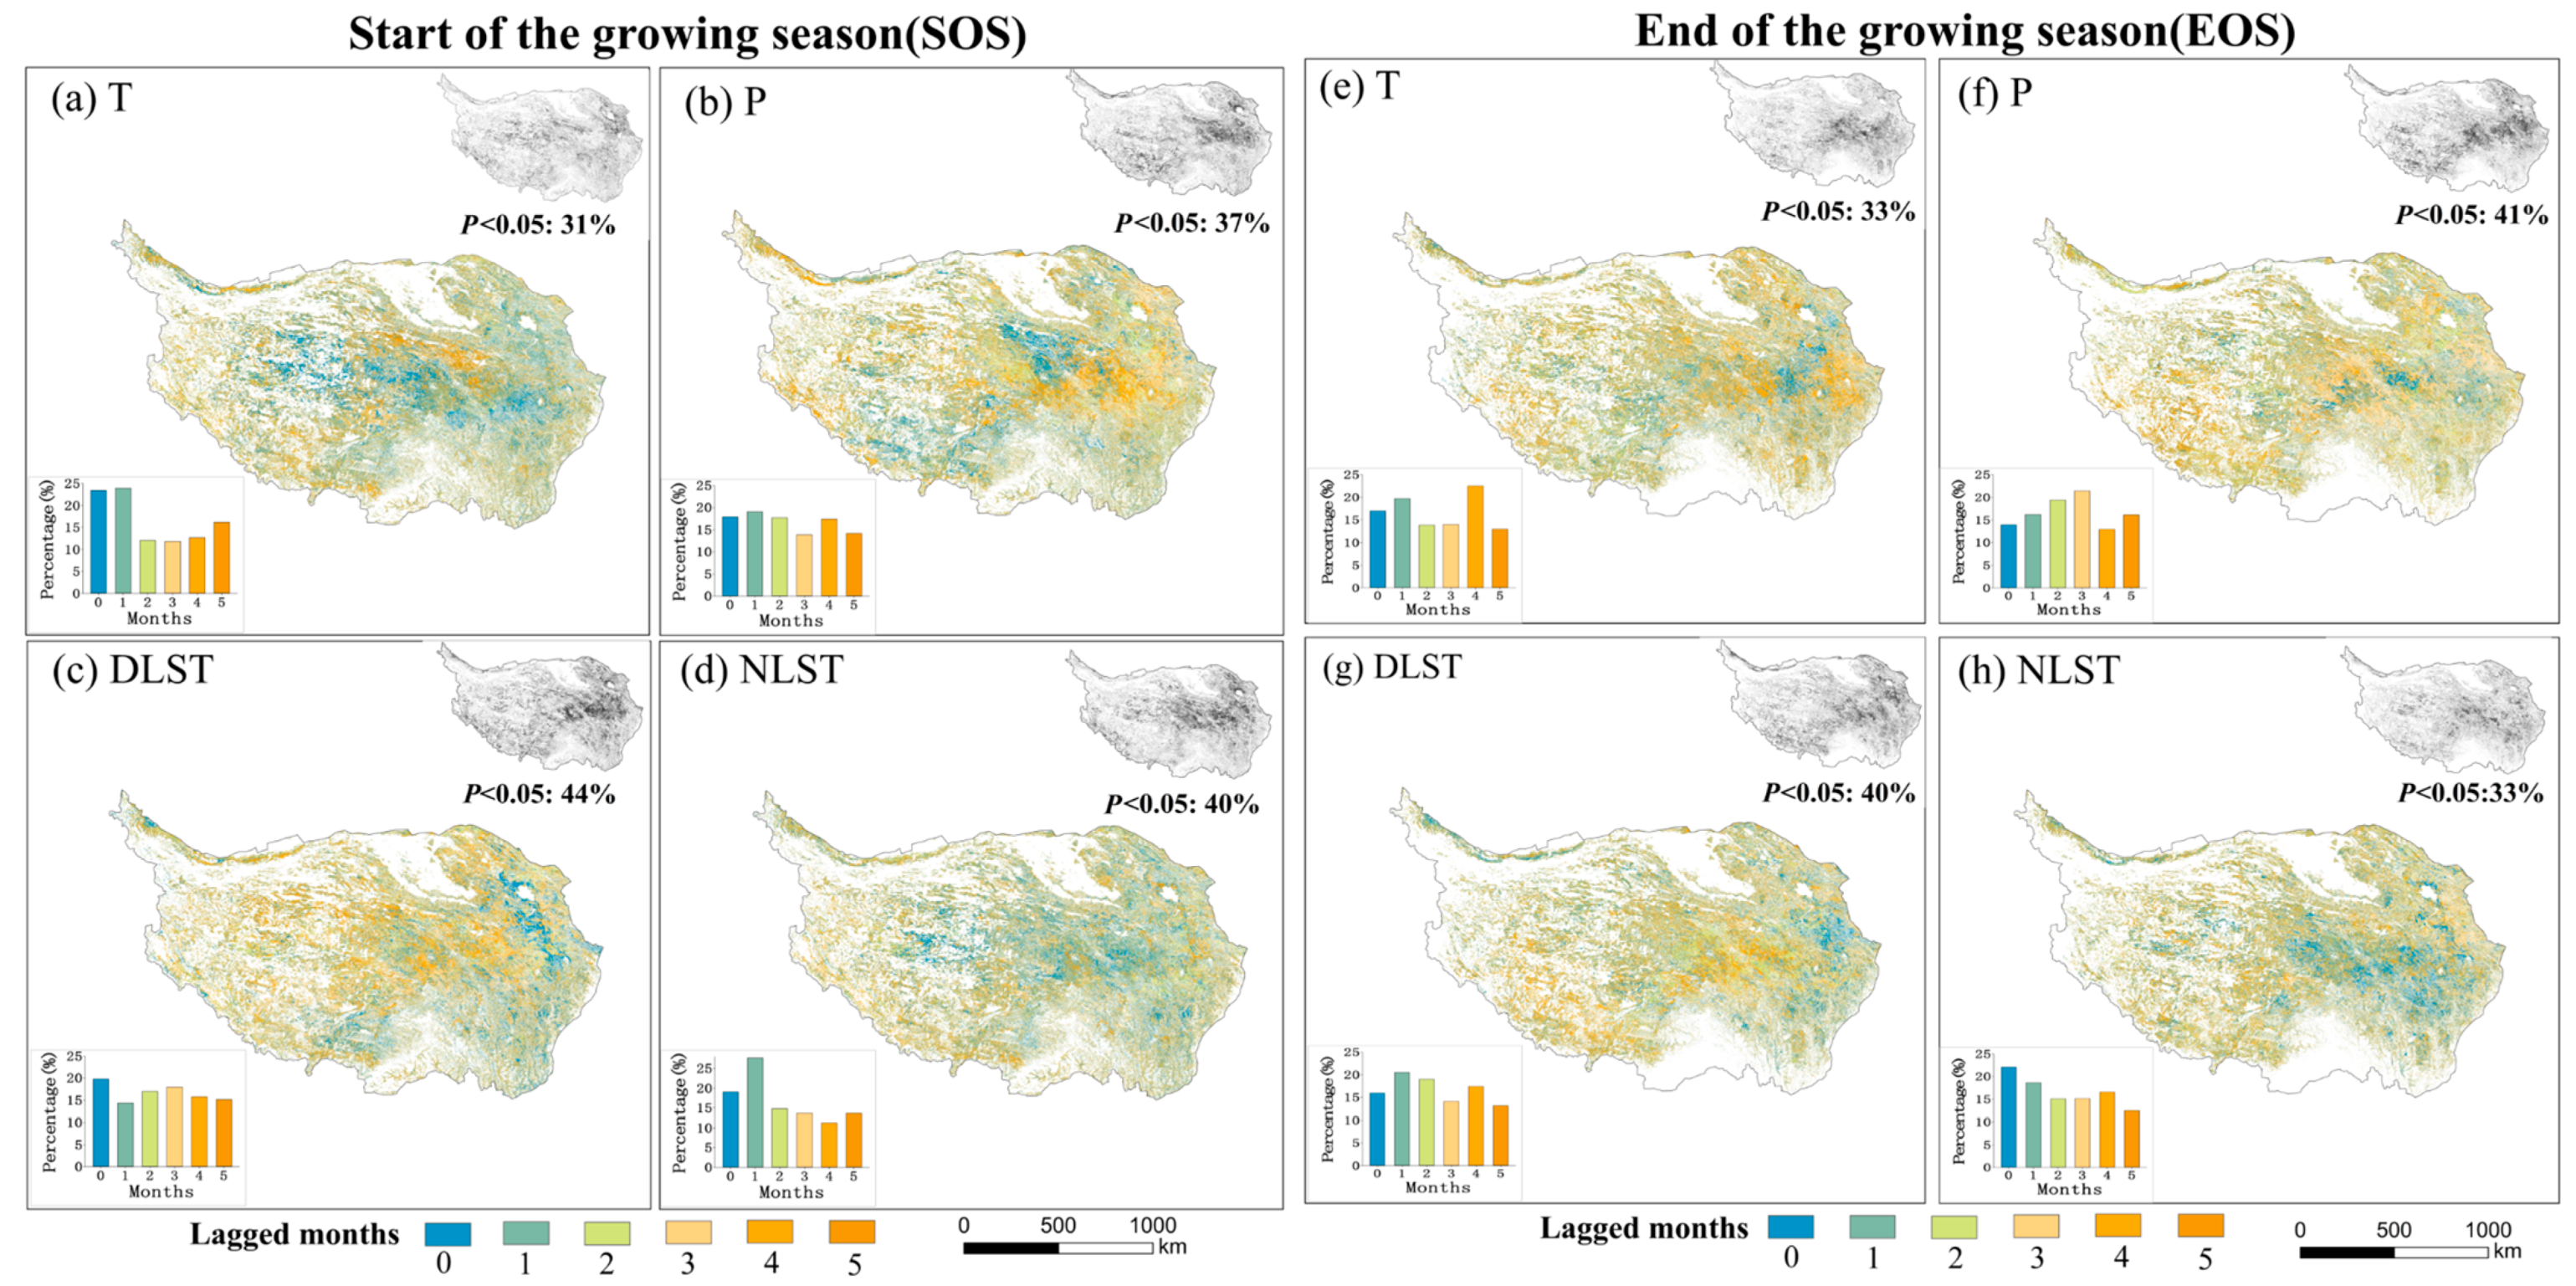
3.2.2. Spatial Patterns of Time-Lag Effects

Figure 4 illustrates the geographic distribution of the lag response time of the SOS and EOS to climate variables. As seen in Figure 4a–d, the response of SOS to air temperature and NLST was mainly lagged from 0 to 1 month. The response of SOS to air temperature and NLST lagged by 1 month had the highest percentages of 23.97% and 27.70%, respectively, indicating that the air temperature and NLST did not have a significant lag effect on the SOS. The SOS mainly responded to precipitation with a lag of 0 to 2 months, and the highest proportion of SOS responding to precipitation with a lag of 1 month was 19.06%. The percentages of SOS that mainly lagged by 0 months and lagged by 2 and 3 months in response to the DLST were higher, with 19.78%, 17.01%, and 17.95%, respectively, indicating that the DLST of the current month and preseason 2–3 months had a greater influence on the SOS. Regarding spatial distribution, the SOS in the east-central Qinghai Tibet Plateau responded mainly to air temperature with a lag of 0 months, precipitation with a lag of 3–4 months, and NLST with a lag of 1 month. The southwestern part responded mainly to precipitation with a 1 month lag and to DLST with a 2–3 month lag.
As shown in Figure 4e–h, the percentages of EOS lagging by 1 and 4 months responding to air temperature were higher at 19.66% and 22.5%, respectively, indicating that the air temperature of the first and fourth months preceding the EOS significantly impacted it. The EOS mainly responded to precipitation with a lag of 1–3 months, and the highest proportion of the response to precipitation with a lag of 3 months was 21.38%, demonstrating that the EOS was greatly influenced by precipitation in the 1–3 months preceding the EOS. The percentages of EOS lagging by 1 and 2 months responding to DLST were higher at 20.49% and 18.97%, respectively, indicating that DLST in the 1–2 months preceding the EOS had a greater influence on it. The highest percentage of EOS lagging by 0 months in response to NLST was 22.15%, which showed that the NLST had no significant lag effect on the EOS. In terms of spatial distribution, the EOS in the eastern part responded mainly to air temperature in the current month or with a lag of 4 months, precipitation with a lag of 3 months, and NLST with a lag of 1 month. The southwestern part responded mainly to precipitation with a 5-month lag and to DLST with a 4 month lag.

3.3. Cumulative Effects of Climate Factors on Vegetation Phenology

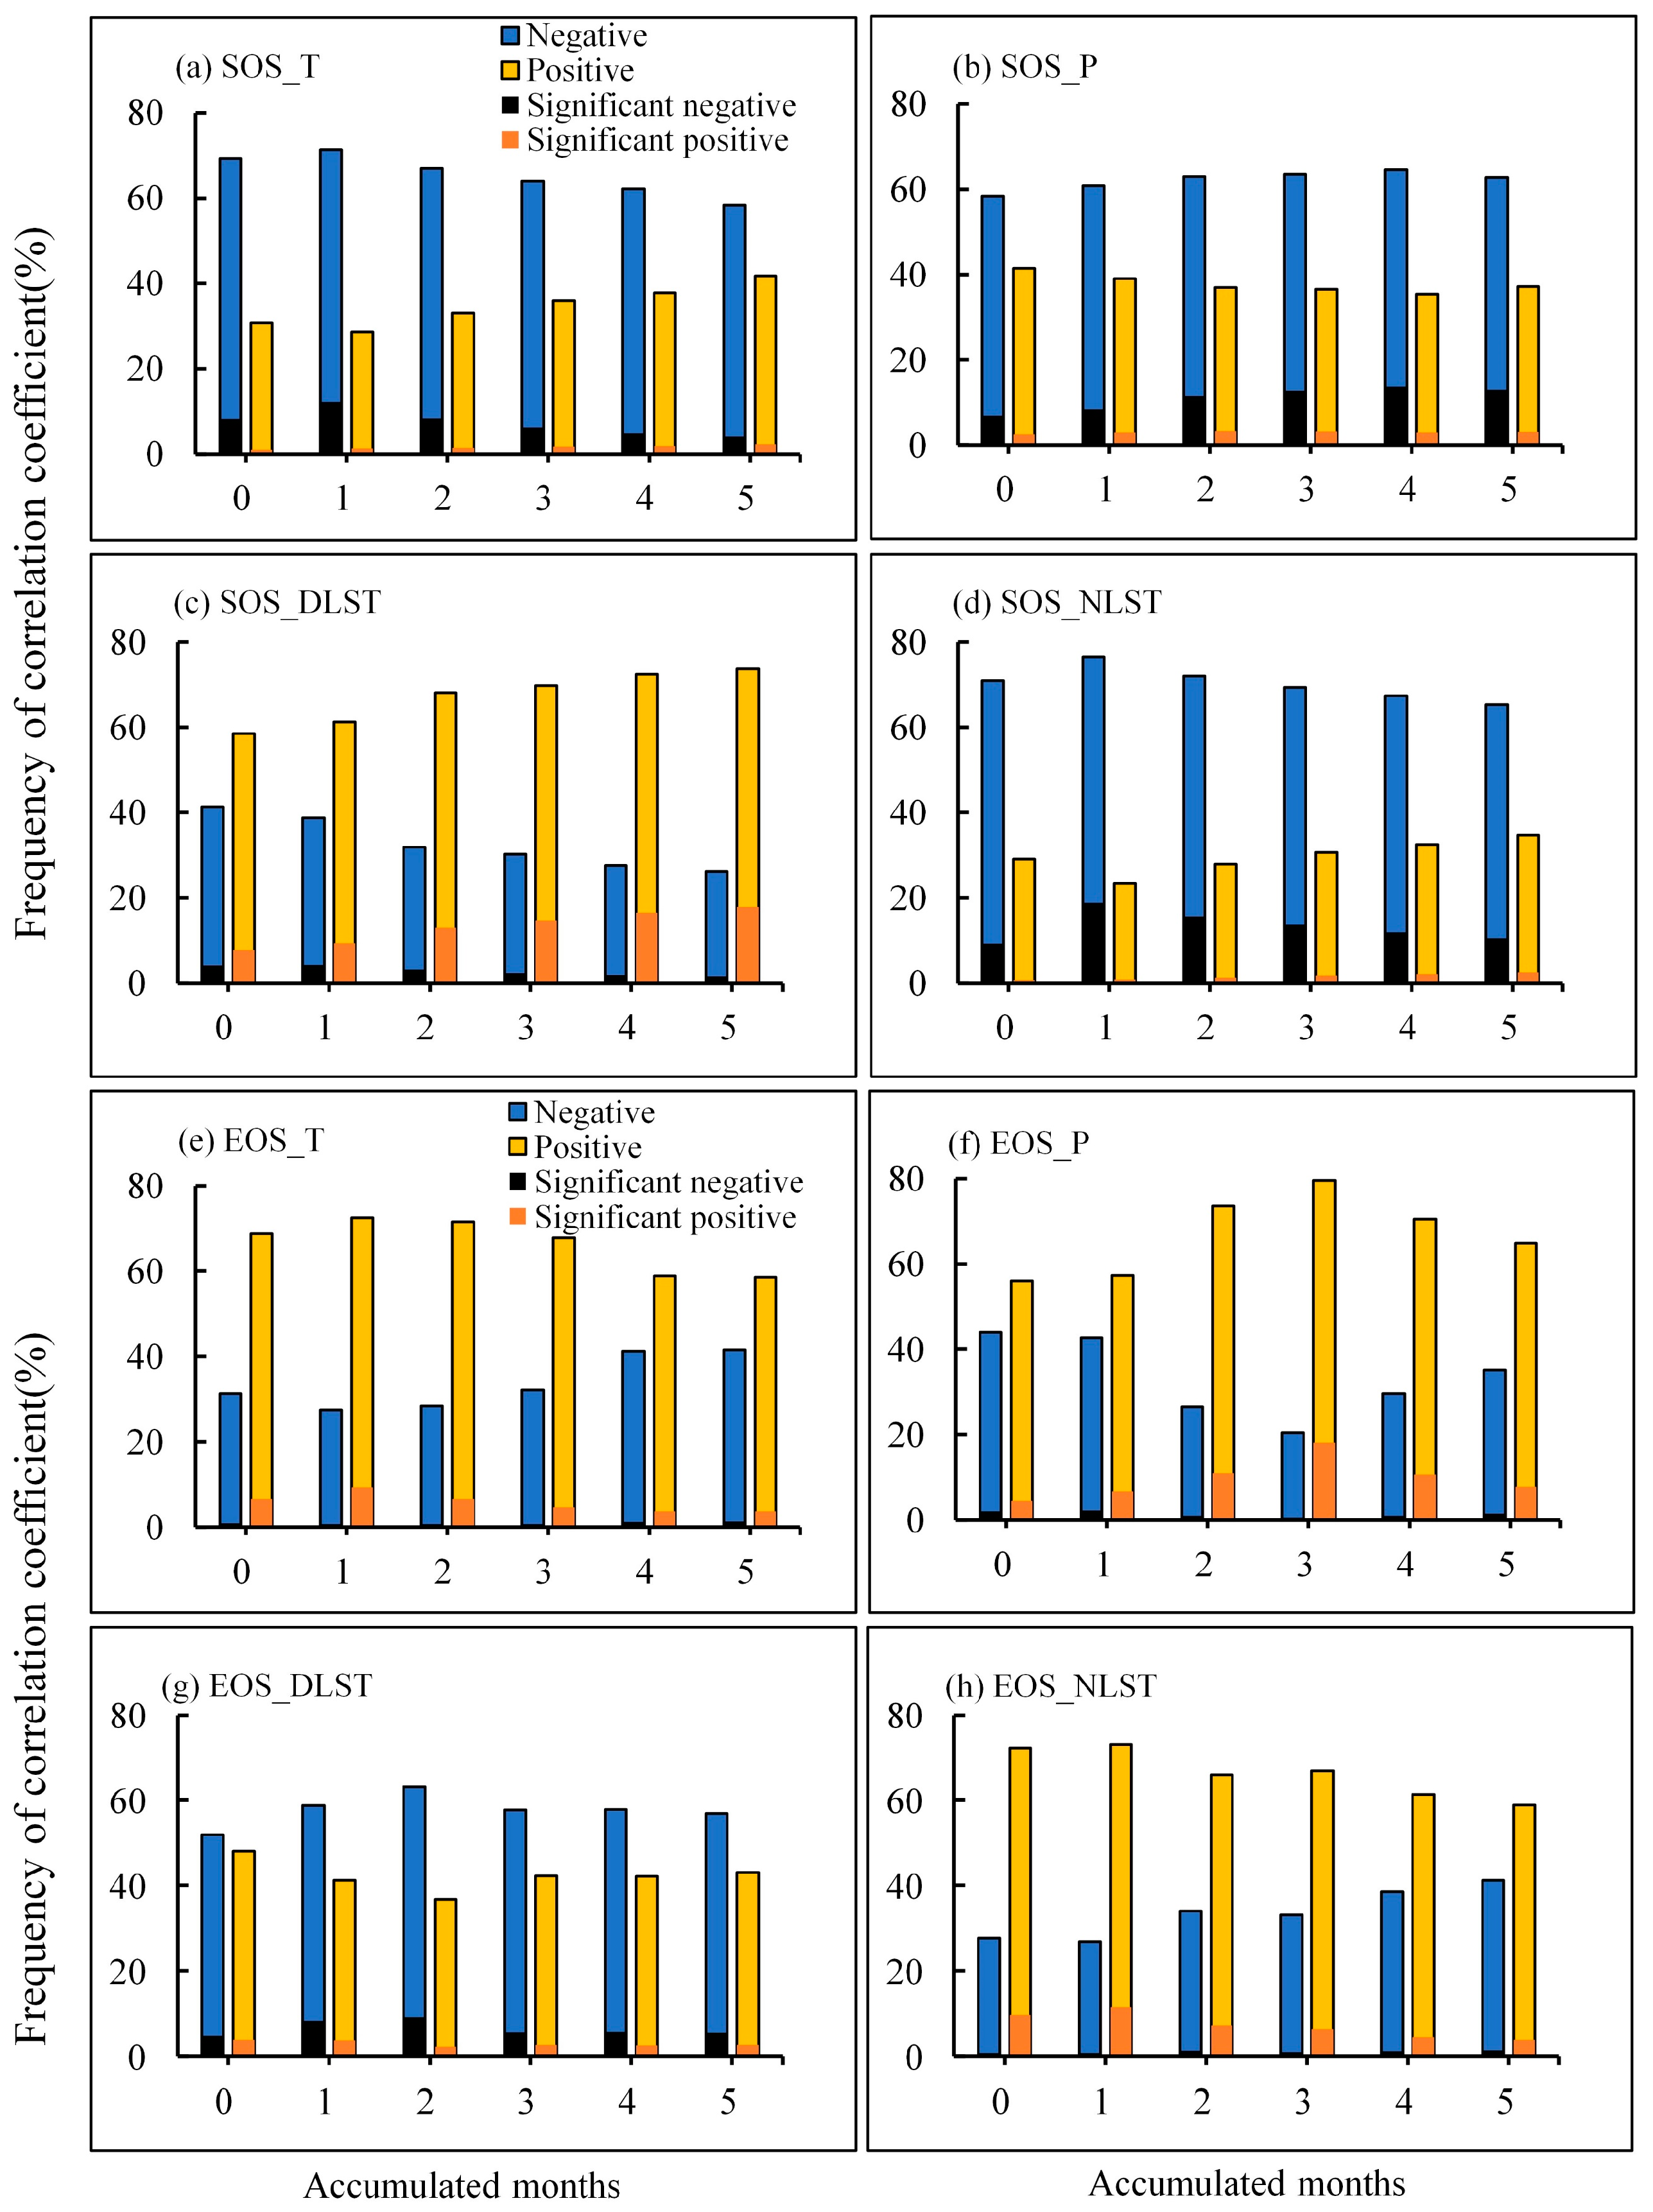
3.3.1. Temporal Variation of Cumulative Effects

Figure 5 illustrates the frequency distribution of the correlation coefficients of the SOS, the EOS, and different climate variables at multiple accumulation times. Except for the DLST, the SOS and other climatic factors were mainly negatively correlated at different cumulative periods. The highest percentages of significant negative correlations between SOS and air temperature, precipitation, and NLST were observed at cumulative times of 1 month, 4 months, and 1 month, respectively, with the percentages of significant negative correlations being 12.13%, 13.82%, and 18.84%, respectively. The highest percentage of significant positive correlation between SOS and DLST was 17.87% at a cumulative time of 5 months.
Except for the DLST, the EOS and other climatic factors were predominantly positively correlated at different cumulative periods. The highest percentage of significant positive correlations between EOS and air temperature, precipitation, and NLST were observed at cumulative times of 1 month, 3 months, and 1 month, respectively, with the percentage of significant positive correlations being 9.35%, 18.1%, and 11.48%, respectively. The highest percentage of significant negative correlation between EOS and the DLST was 9.18% at a cumulative time of 2 months.

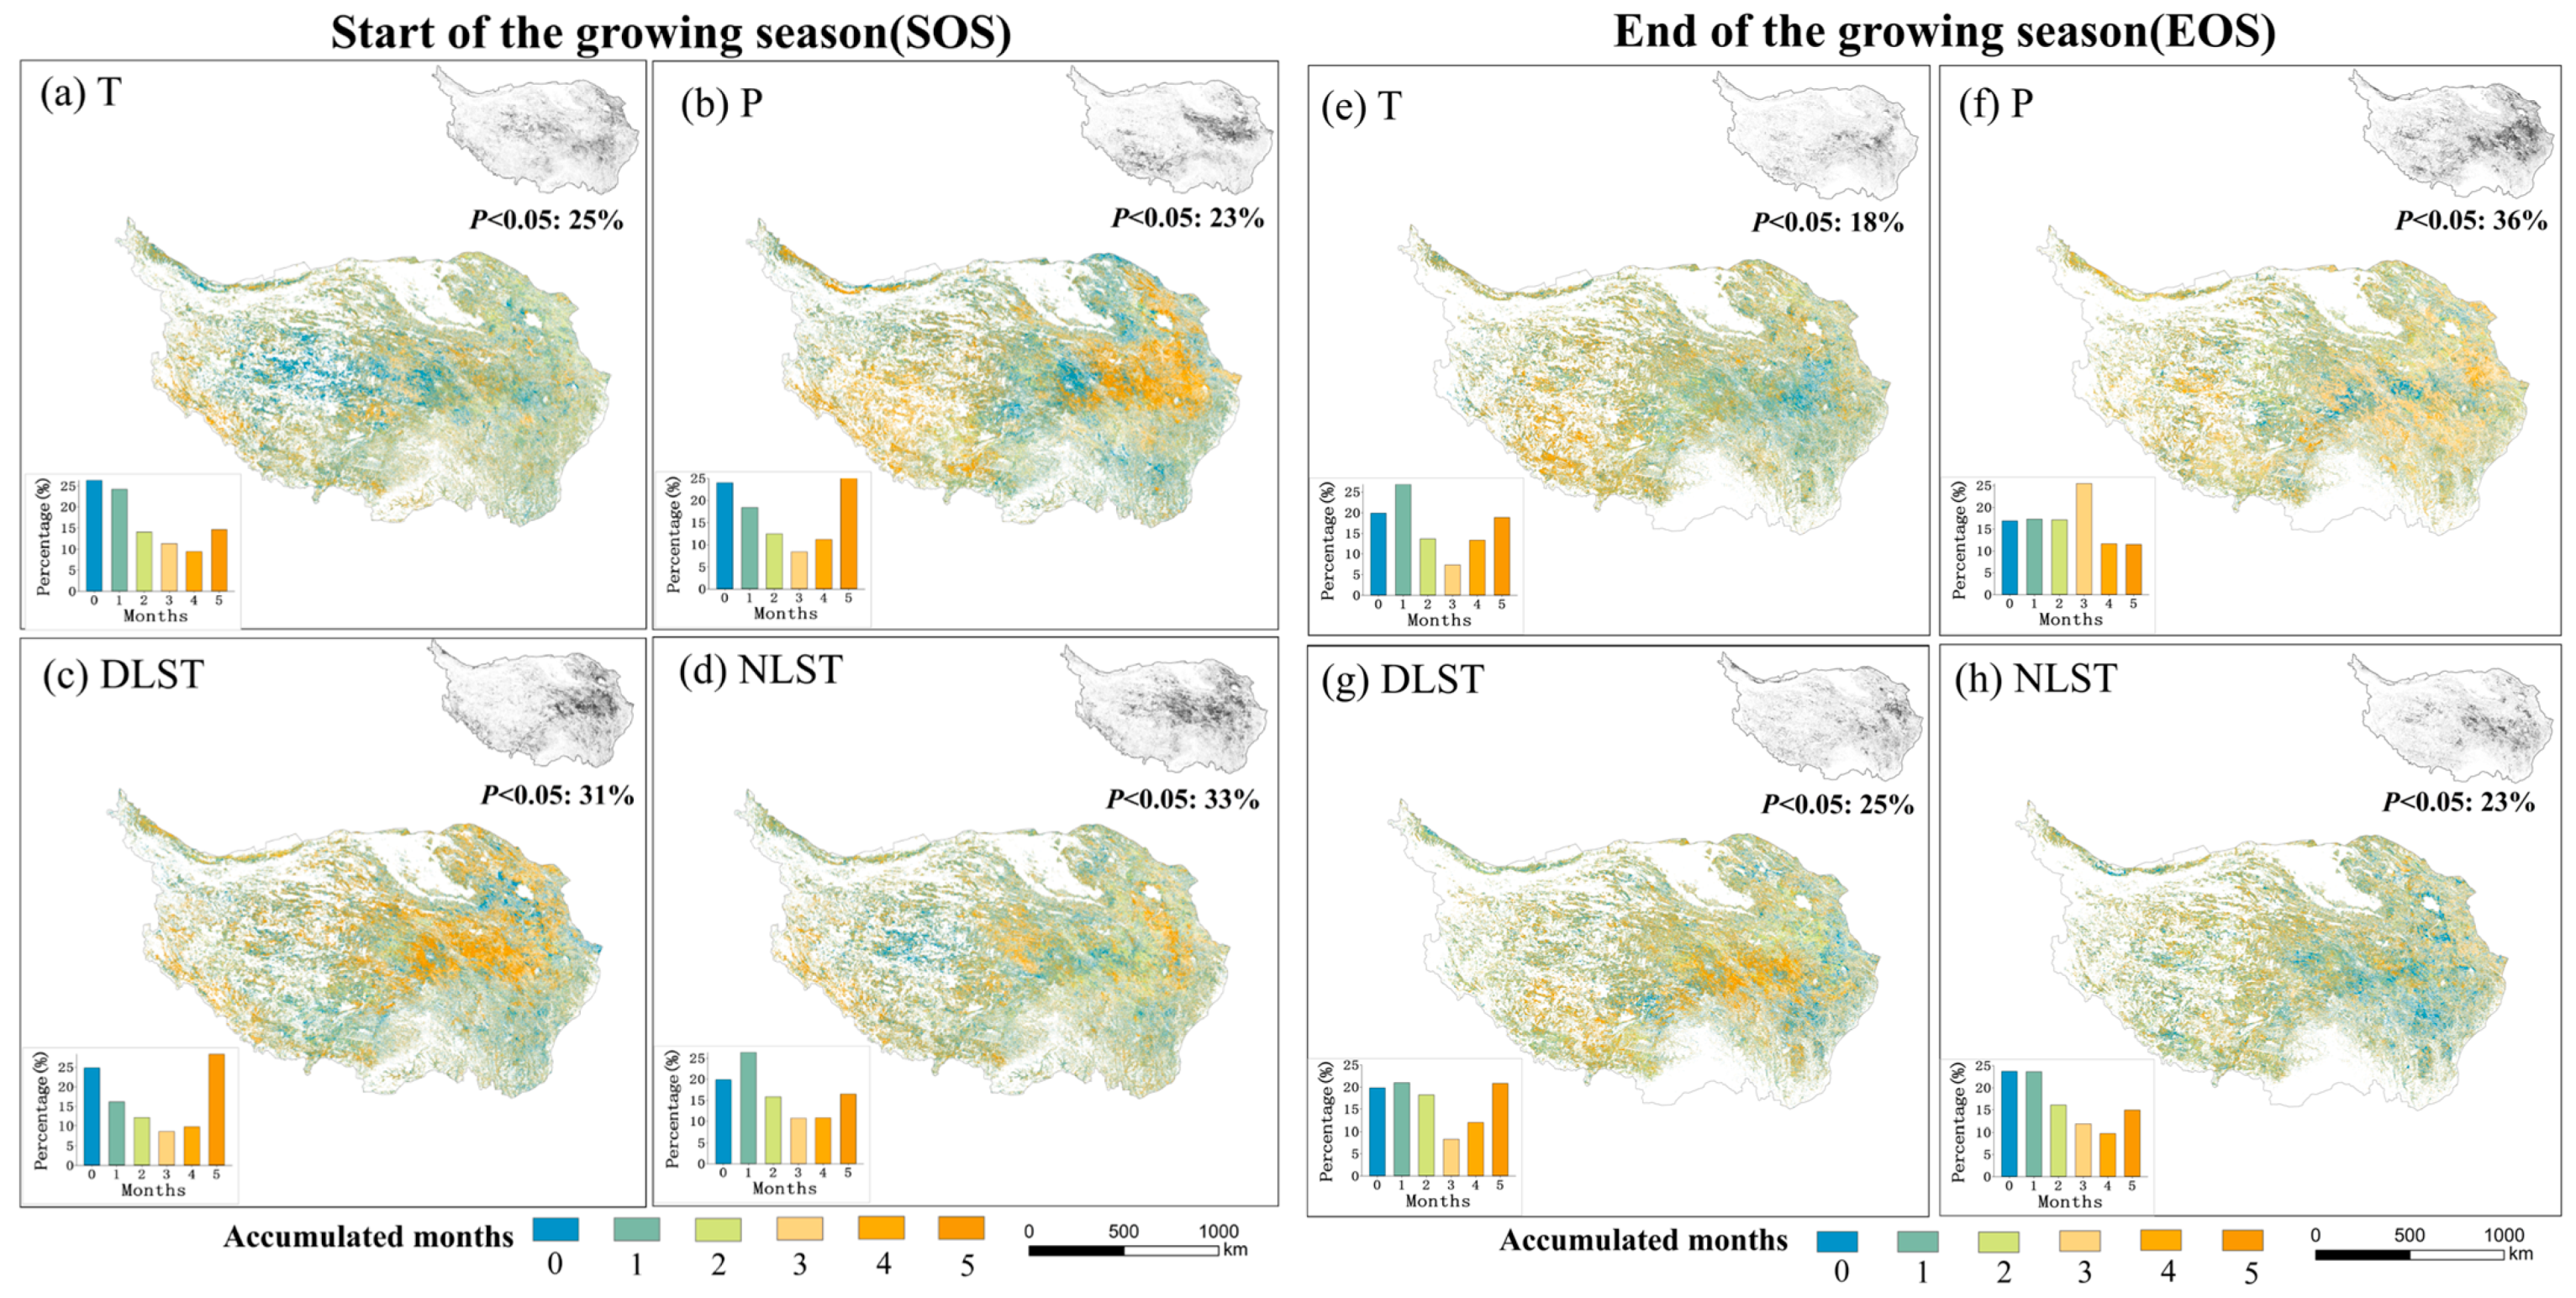
3.3.2. Spatial Distribution of Cumulative Effects

Figure 6 depicts the geographic distribution of the cumulative response times of the SOS and the EOS to climate variables. As shown in Figure 6a–d, the area of the SOS affected by the current month’s air temperature was the largest, suggesting that the cumulative effect of temperature on the SOS was insignificant. The percentage of cumulative response time of SOS to precipitation, DLST, and NLST was highest at 5 months, 5 months, and 1 month, respectively. With regard to spatial distribution, the cumulative response times of the SOS to air temperature and NLST in the northwestern part were mainly 0–1 month, and the cumulative response time of the SOS to precipitation in the southwestern region was mainly 3–4 months, and the SOS in the eastern region had a cumulative response time of 4–5 months for precipitation and DLST.
As shown in Figure 6e–h, the percentages of cumulative response times of the EOS to air temperature, precipitation, and DLST were highest at 1 month, 3 months, and 1 month, respectively, indicating that the preseason cumulative 1-month average air temperature, cumulative 3 month precipitation, and cumulative 1 month average daytime land surface temperature had a higher influence on the EOS. The percentage of cumulative response time of EOS to the NLST was higher when the cumulative time was 0 and 1 month, indicating that night surface temperature has no significant cumulative effect on the EOS. With regard to spatial distribution, the cumulative response times of the EOS to air temperature, precipitation, and NLST in the eastern region were 0–1 month, 3 months, and 0–1 month, respectively. The cumulative response times of the EOS to air temperature and DLST in the southwestern region were 4–5 months and 1 month, respectively.

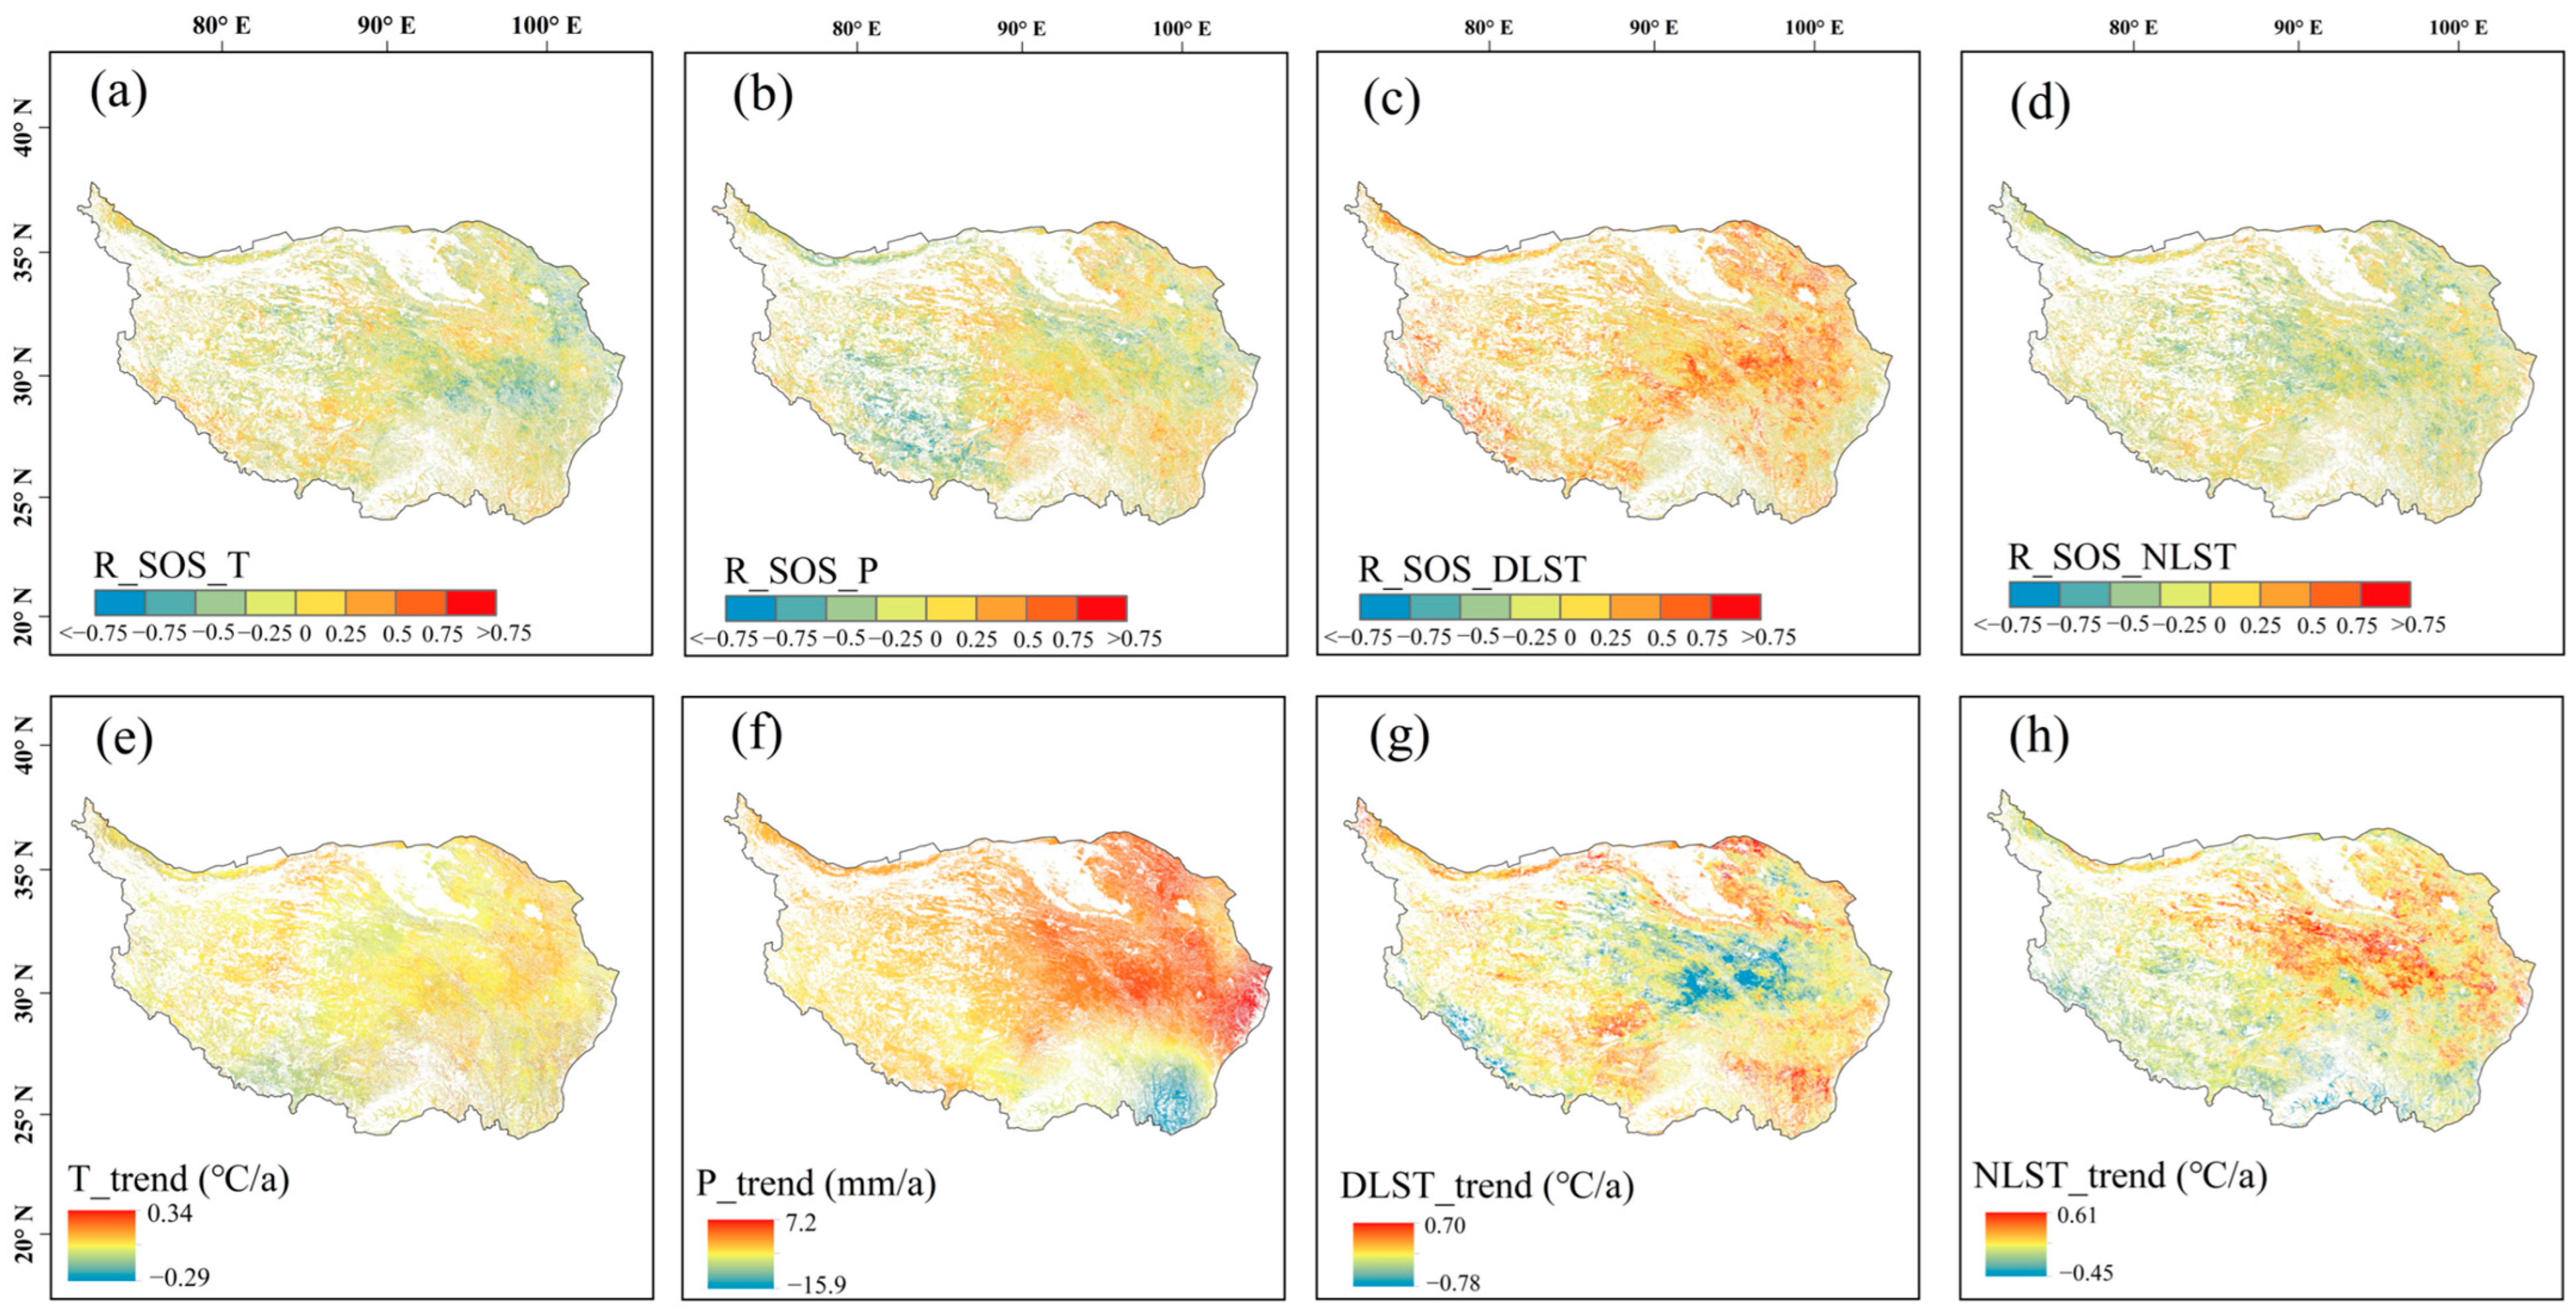
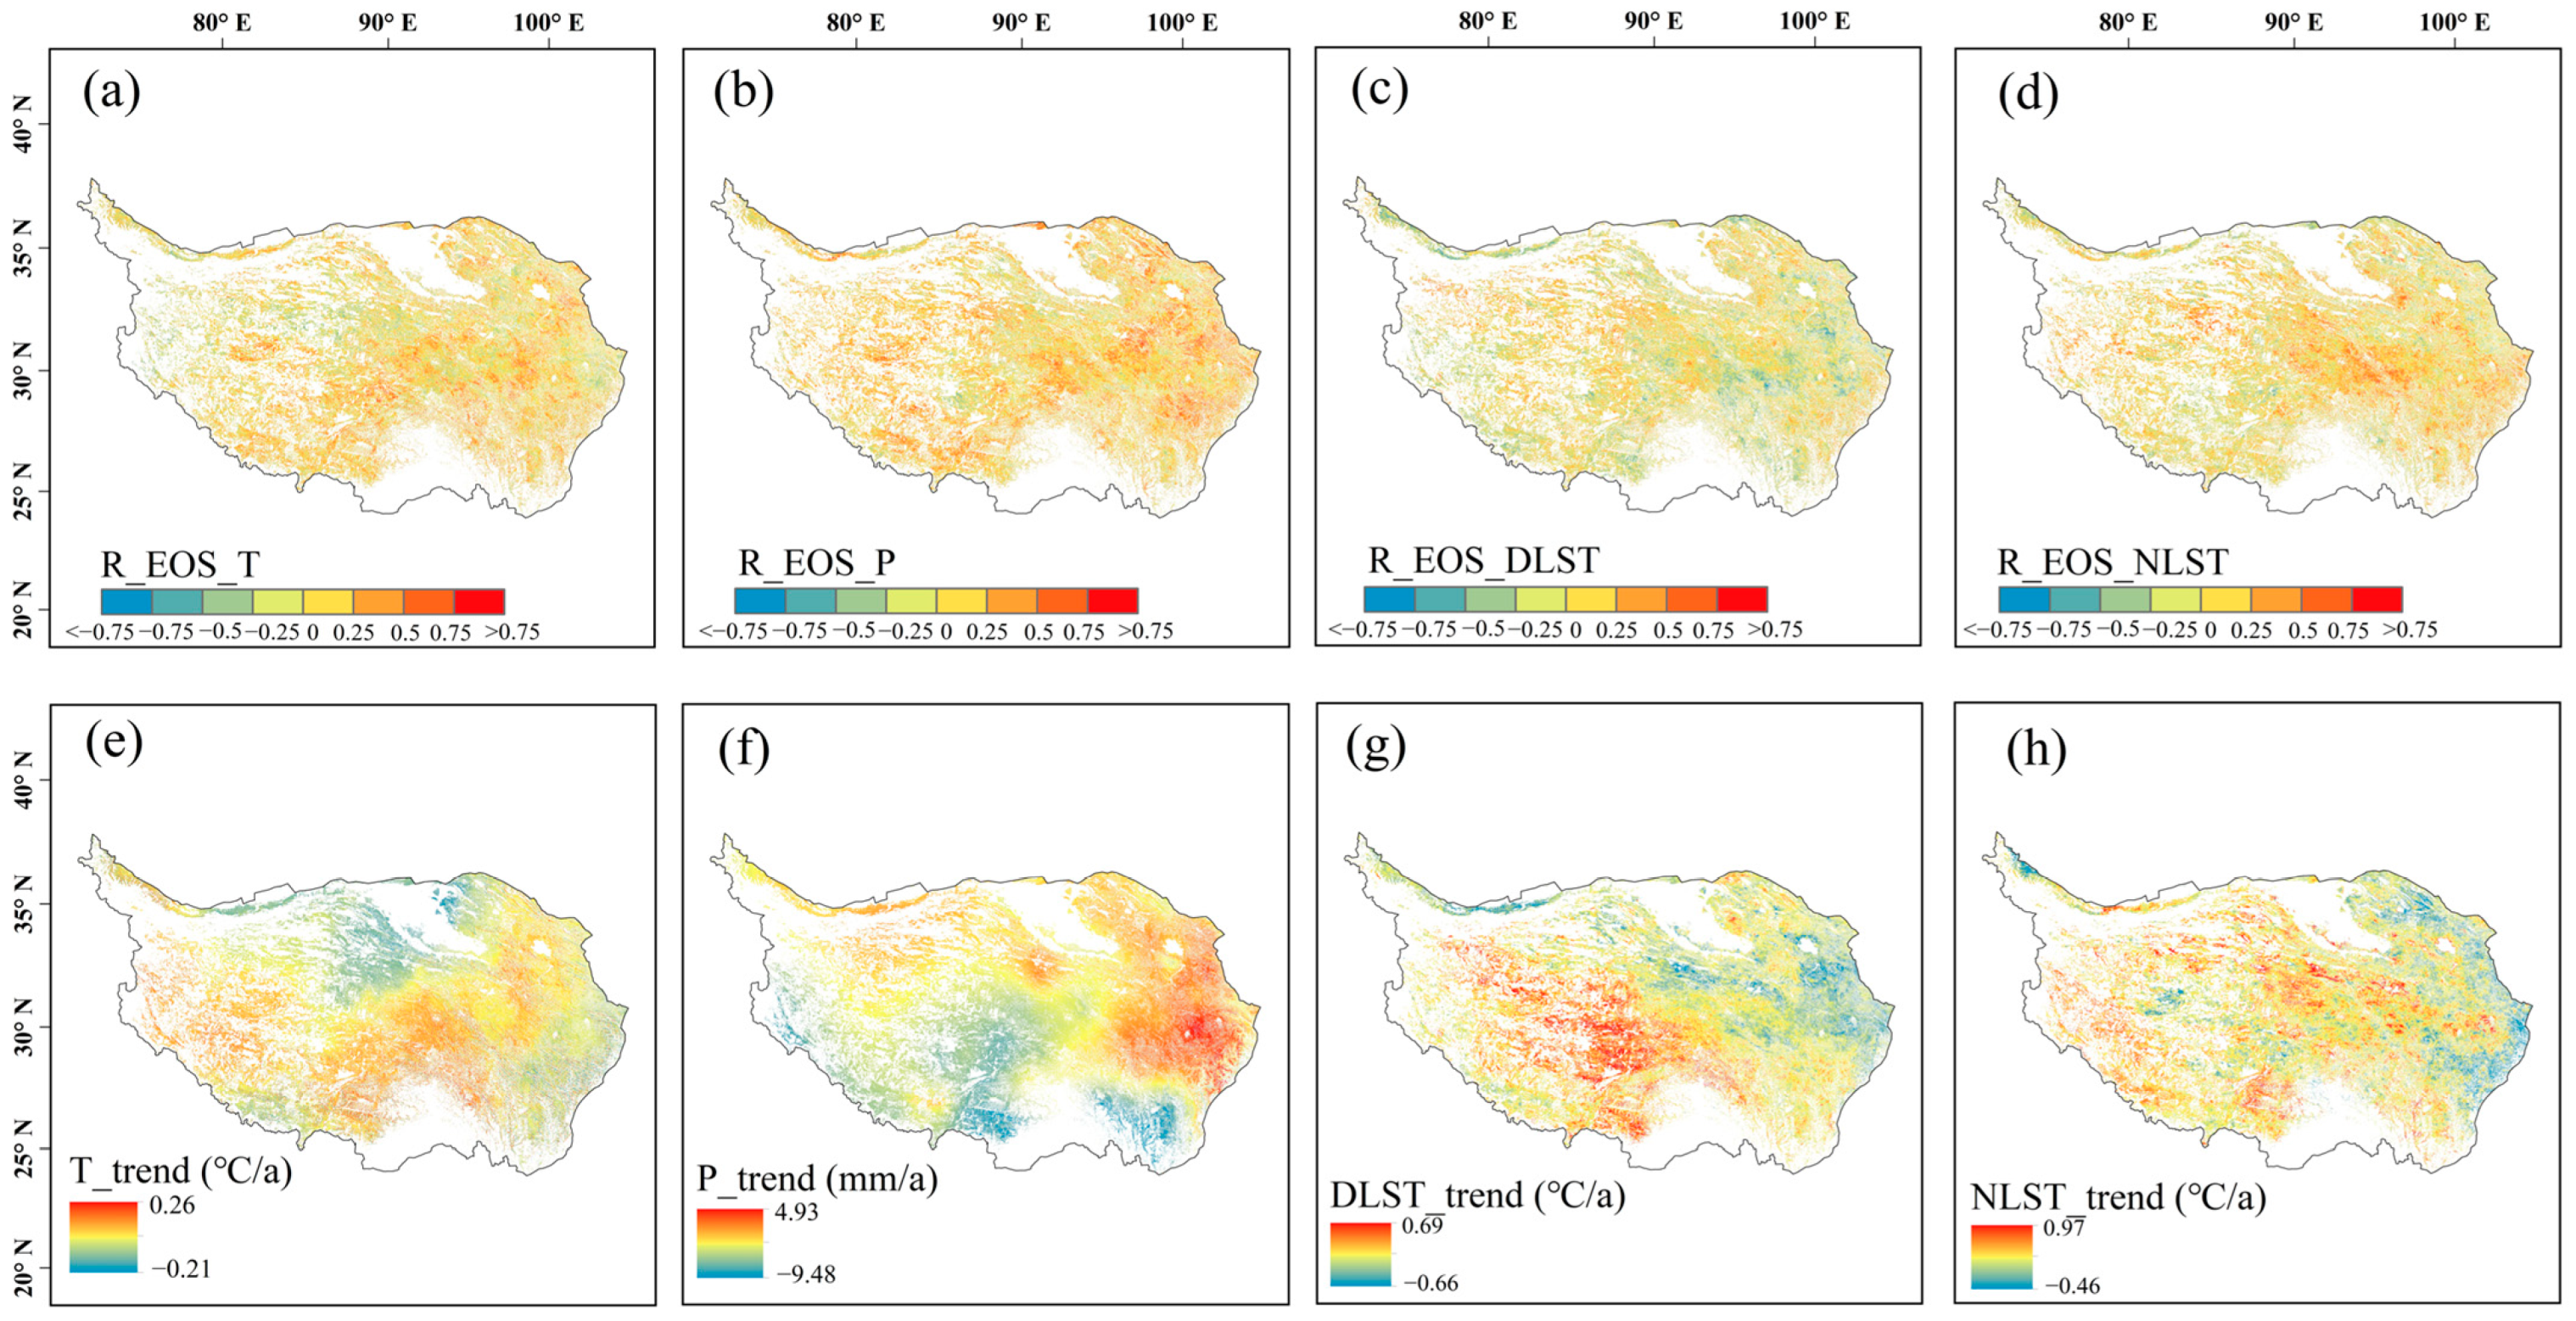
3.4. Response of Vegetation Phenology to Climate Change

By comparing Figure 3 and Figure 5, it was found that the percentage of correlation coefficients between vegetation phenology and climatic variables that passed the 0.05 significance test in the cumulative effect was generally higher than the percentage that passed the significance test in the lagged effect. Therefore, the period corresponding to the highest value of the percentage of the cumulative effect that passed the significance test was chosen as the preseason time when climatic factors significantly affected vegetation phenology to evaluate the partial correlation between vegetation phenology and climate variables.
In Figure 7, with regard to the SOS and climate factors, (a–d) show the partial correlation coefficients, and (e–h) show the spatial variation trend of each climatic factor preceding the SOS. SOS and air temperature were primarily negatively correlated and concentrated in the Qinghai Tibet Plateau’s eastern region, with 64.96% of the entire area exhibiting a negative correlation, of which 7.63% was significantly negative (Figure 7a). The Tibetan Plateau had an overall upward trend in temperature, with the exception of the southwest (Figure 7e). Therefore, the rising temperatures will contribute to an advanced SOS on the eastern Tibetan Plateau.
SOS and precipitation had primarily negative correlations and were concentrated in the northeastern and southwestern regions, making up 58.73% of the entire area, of which 6.85% was significantly negative (Figure 7b). From east to west, there was an increasing-to-declining trend in the amount of precipitation (Figure 7f). Therefore, the eastern Qinghai Tibet Plateau’s increased precipitation will contribute to an advanced SOS, while the reduction in precipitation in the southwest part may cause a delay of the SOS in the southwest.
SOS and DLST exhibited a predominantly positive correlation over 73.27% of the area, with a substantial positive correlation seen over 13.58% of the region (Figure 7c). Most of the middle and eastern areas of the Qinghai Tibet Plateau’s DLST primarily displayed a declining trend (Figure 7g). Therefore, the decrease in daytime land surface temperature in the eastern region may lead to an earlier SOS in the eastern region, and the increase in daytime land surface temperature in the southwest may contribute to the delay of the SOS.
SOS and NLST exhibited a mainly negative correlation over 68.80% of the entire region, with a significant negative correlation observed over 8.23% of the region (Figure 7d). The nighttime land surface temperatures on the Qinghai Tibet Plateau demonstrated a rising tendency in the east (Figure 7h), and thus an earlier SOS in the east was caused by rising nighttime land surface temperatures.
In Figure 8, with regard to the EOS and climate factors, (a−d) show the partial correlation coefficients, and (e−h) show the spatial variation trend of each climatic factor preceding the EOS. The EOS and air temperature mainly showed a positive correlation (61.63%), of which 4.99% was significantly positive (Figure 8a). With the exception of a small part in the north, temperatures on the Qinghai Tibet Plateau exhibited a generally rising trend (Figure 8e), so the EOS will be delayed due to the rise in temperature.
The EOS and precipitation generally exhibited a positive correlation (71.74%), with 7.51% exhibiting a significant positive correlation (Figure 8b). A downward trend in precipitation was observed in the southwest and an upward trend in the eastern portion (Figure 8f). Thus, precipitation increasing in the east will delay the EOS, whereas precipitation decreasing in the southwest may advance it.
The EOS and DLST were negatively correlated (55.95%) in the eastern part and western margins, with a significant negative correlation area of 4.6% (Figure 8c). Daytime land surface temperature in the eastern Tibetan Plateau trended downward, while in the southwestern region, it mainly trended upward (Figure 8g). Therefore, the decline in daytime surface temperature in the eastern region will delay the EOS, and the rise in daytime surface temperature in the southwest region may contribute to an advanced EOS.
The EOS and NLST were generally positively correlated (59.83%), of which 5.05% of the area was significantly positive (Figure 8d), while the nighttime land surface temperature generally showed an upward trend (Figure 8h). As a result, the rise in nighttime land surface temperature will delay the EOS.
Figure 9 illustrates the partial correlations of the SOS and EOS with air temperature, precipitation, and daytime and nighttime land surface temperatures for different vegetation types. Regarding SOS, SOS for the five vegetation types exhibited a predominantly negative link with preseason air temperature and NLST and a positive link with preseason DLST. Specifically, meadow SOS exhibited a higher correlation with air temperature, day and night land surface temperature than the other vegetation types. In regard to the relation between SOS and preseason precipitation, except for alpine vegetation and shrub vegetation, the SOS of other vegetation had a negative link with precipitation. With regard to EOS, EOS for the five vegetation types exhibited a predominantly positive link with preseason air temperature, precipitation, and nighttime land surface temperature, with meadows’ EOS and shrub EOS having higher correlations with each climatic factor than other vegetation types. EOS and DLST, and EOS and preseason DLST were mainly negatively correlated, except for alpine vegetation and grassland.

4. Discussion

4.1. Lag and Cumulative Effects of Climatic Factors on Vegetation Phenology

In this study, the time-lag effect of air temperature on the SOS was primarily concentrated in 0–1 month and, on the EOS, it was primarily focused in month 1 and month 4. The above results were more consistent with the research results of Wu et al. [51] and Ye et al. [52], who concluded that the SOS exhibited no significant lag effect on air temperature, and were different from those of Yuan et al. [24], who found that preseason temperatures had no significant lag effect on the EOS. This study found that the proportion of EOS lagging by 4 months in response to air temperature was the highest, and the increase in air temperature in the fourth month prior to the EOS will cause the advance of EOS, which may be connected to a reduction in soil moisture and an increase in evapotranspiration caused by vegetation greening in spring [53]. In addition to inhibiting current vegetation growth, drought and high temperatures have a delayed influence on subsequent vegetation development, accelerating plant senescence [54,55]. In the cumulative effect, the cumulative times of air temperature on the two vegetation phenological stages of the SOS and the EOS were mainly concentrated in month 0–1, revealing that the cumulative influence of temperature on the SOS and the EOS was not substantial and that vegetation was sensitive to temperature changes and could respond quickly to temperature changes [25,56].
In comparison to temperature, preseason precipitation exhibited a noticeable lag impact on both the SOS and the EOS. The time-lag effect of precipitation on the SOS was mostly concentrated in months 0–2, and on the EOS, it was mostly focused in months 1–3, which may be because vegetation growth needs to obtain water from the soil that penetrates through various soil layers, which requires a specific amount of time [52]. Early in the vegetation growth process, the vegetation root system is shallow and mainly draws water from the shallow soil, while in the later growth stages, the vegetation root system is more mature and the deeper root system draws water from the soil more slowly [57], so the lag time of precipitation on the EOS is longer. We found that the cumulative effect of precipitation on the SOS was the highest in month 5, and the cumulative effect on the EOS was the highest in month 3. The cumulative demand for precipitation was greater at the SOS than at the EOS on the Qinghai Tibet Plateau, which may be due to the vegetation needing more water at the early growth stages compared to the senescence period [25].
In addition, our results indicated that DLST and NLST also had time-lag effects on the SOS and EOS on the Qinghai Tibet Plateau. The mean lagged time of DLST on vegetation phenology was longer than that of NLST, which may be because plant growth in alpine terrestrial ecosystems may need a considerable amount of time to store more energy from daytime photosynthesis to sustain vegetation growth and development [58]. Vegetation in alpine ecosystems may have evolved a mechanism to respond rapidly to nighttime temperature to compensate for the negative effects of nighttime respiration by increasing daytime photosynthesis, resulting in a long lag duration in vegetation phenology response to daytime land surface temperatures [59]. The cumulative effect of DLST on the SOS was the highest in month 5, and the cumulative effect on the EOS was the highest in month 1, which may be because vegetation needs more heat accumulation in the early growth phase to attain the temperature threshold needed for plant growth [25]. The cumulative impact of NLST on vegetation phenology was comparable to that of temperature, with the cumulative duration being mostly within the 0–1 month range.
In general, precipitation and DLST exhibited more significant lagged and cumulative effects on the SOS and EOS than air temperature and NLST. Systematic investigation and analysis of the lag and cumulative effect of different climatic variables on different stages of vegetation phenology may offer guidance for selecting climate parameters in the vegetation phenology model. This will deepen our comprehension of how vegetation interacts with climate by enabling us to estimate and evaluate ecosystem carbon flux using precisely anticipated plant phenology.

4.2. Response of the SOS and EOS to Different Climatic Factors

The key role of air temperature in regulating vegetation phenology has been demonstrated by earlier studies. [23]. According to this study, higher preseason temperatures on the Qinghai Tibet Plateau caused an earlier SOS and a later EOS. On one hand, plants require a certain cumulative temperature above a particular threshold to initiate SOS, and rising temperature will hasten soil thawing and vegetation emergence [60]. On the other hand, the rise in warmth will hasten the SOS by lessening springtime frost damage to vegetation [61]. In contrast, preseason temperature was mainly positively correlated with the EOS (61.63%), which could potentially be credited to the fact that preseason warming heightens photosynthetic activity during vegetation senescence and slows the rate of chlorophyll degradation [62], causing a delayed EOS.
Compared to air temperature, precipitation was also crucial in regulating the vegetation phenology on Qinghai Tibet Plateau. Preseason precipitation increases in the eastern will lead to an advanced SOS, while the decrease in precipitation in the southwest will delay the SOS, which is essentially in line with the prior research findings, i.e., the delay of SOS in the southwest is mainly related to preseason precipitation [19,20]. The interannual variation trend of preseason precipitation was different in terms of spatial distribution, with a declining trend in the southwestern area and an inclining trend in the eastern region. The onset of vegetation phenology in spring will be limited by water availability in arid areas. Therefore, the decrease in precipitation in the southwest will cause the SOS to be delayed. For the EOS, the increasing preseason precipitation would delay the EOS, while the preseason precipitation displayed a declining tendency and the daytime land surface temperature exhibited an increasing trend in the southwest (Figure 8f,g), which would aggravate the drought degree in the region and cause the advance of the EOS in the region. Increased preseason precipitation enhances nutrient uptake by vegetation and promotes the efficiency of vegetative photosynthesis, whereas a water deficit increases the probability of chlorophyll degradation and vegetation death in arid and semiarid areas [63]. Thus, increased preseason cumulative precipitation can alleviate drought stress and delay leaf senescence.
Preseason day and night land surface temperatures affect soil temperature and humidity, which in turn affect vegetation phenology. In this study, we found that the SOS was mainly positively (73.27%) and negatively (68.8%) correlated with the preseason DLST and NLST, respectively (Figure 8c,d). The result was consistent with the view of Shao et al. [64] that SOS is positively correlated with DLST. In arid areas, the increase in DLST leads to intensified water evaporation, which damages vegetation growth and thus has an inhibitory effect on SOS. In this study, we found that DLST exhibited a declining trend in the east-central region and a rising change trend in the southwestern region. The change trend of NLST temperature was opposite to that of the DLST in spatial distribution. The decrease in day land surface temperature can prevent an increase in evaporation in the vegetation root zones, while the rise in night surface temperature is conducive to increasing the heat accumulation required for germination and leaf expansion, avoiding the effects of frost on vegetation, and thus accelerating vegetation recovery [65]. In addition, Shen et al. [26] have found that the impact of nighttime temperature on the SOS in the Qinghai Tibet Plateau was greater than that of daytime temperature on the SOS. Therefore, the combined influence of pre-season diurnal land surface temperature in the eastern region may advance the SOS in the eastern region. The rise of daytime land surface temperature in the southwest region may delay the SOS. For the EOS, a rise in daytime land surface temperatures caused the EOS to occur earlier, and a rise in nighttime land surface temperatures caused the EOS to occur later, consistent with previous studies using maximum and minimum temperatures to explore the effects on the EOS on the Qinghai Tibet Plateau [66]. The loss in availability of soil water will be a result of the increase in evapotranspiration brought on by the rise in daytime land surface temperature. In addition, limited preseason rainfall in the southwest may lead to early leaf senescence. However, increased nighttime land surface temperature can mitigate frost damage by reducing the freezing days and the environmental stress on plant growth, thereby delaying leaf senescence [36,67]. In conclusion, DLST and NLST have a vital role in regulating vegetation phenology on the Qinghai Tibet Plateau, especially at the SOS. Thus, it is essential to investigate how variations in daytime and nighttime land surface temperatures impact the phenology of plants.

5. Conclusions

This study sought to investigate the lagged and cumulative effects of air temperature, precipitation, and daytime and nighttime land surface temperatures on the SOS and the EOS, as well as to analyze the responses of the SOS and EOS to four various pre-seasonal climatic factors on the Tibetan Plateau from 2001 to 2020. The specific conclusions are as follows:
(1)
The spatial distribution of multiyear means of vegetation phenology is characterized by elevation. From southwest to northeast, the elevation gradually increased, SOS was gradually delayed from 100 days to 180 days, and EOS gradually advanced from 245 days to 300 days.
(2)
Each climatic factor had different degrees of time-lag and cumulative effect on vegetation phenology. Compared with air temperature and nighttime land surface temperature, precipitation and daytime land surface temperature exhibited a pronounced lag effect and cumulative effect on vegetation phenology. In addition, the cumulative effects of precipitation and daytime land surface temperature on the SOS were greater than those on the EOS.
(3)
The rise in preseason air temperature and nighttime land surface temperature were the primary factors advancing the SOS in the eastern part. Additionally, a decline in precipitation and a rise in daytime land surface temperature were the primary causes delaying the SOS in the southwestern Qinghai Tibet Plateau. Rising air temperatures and increasing precipitation were the primary drivers delaying the EOS in the eastern region, whereas decreasing precipitation and rising daytime land surface temperature were the primary factors advancing the EOS in the western Qinghai Tibet Plateau.
(4)
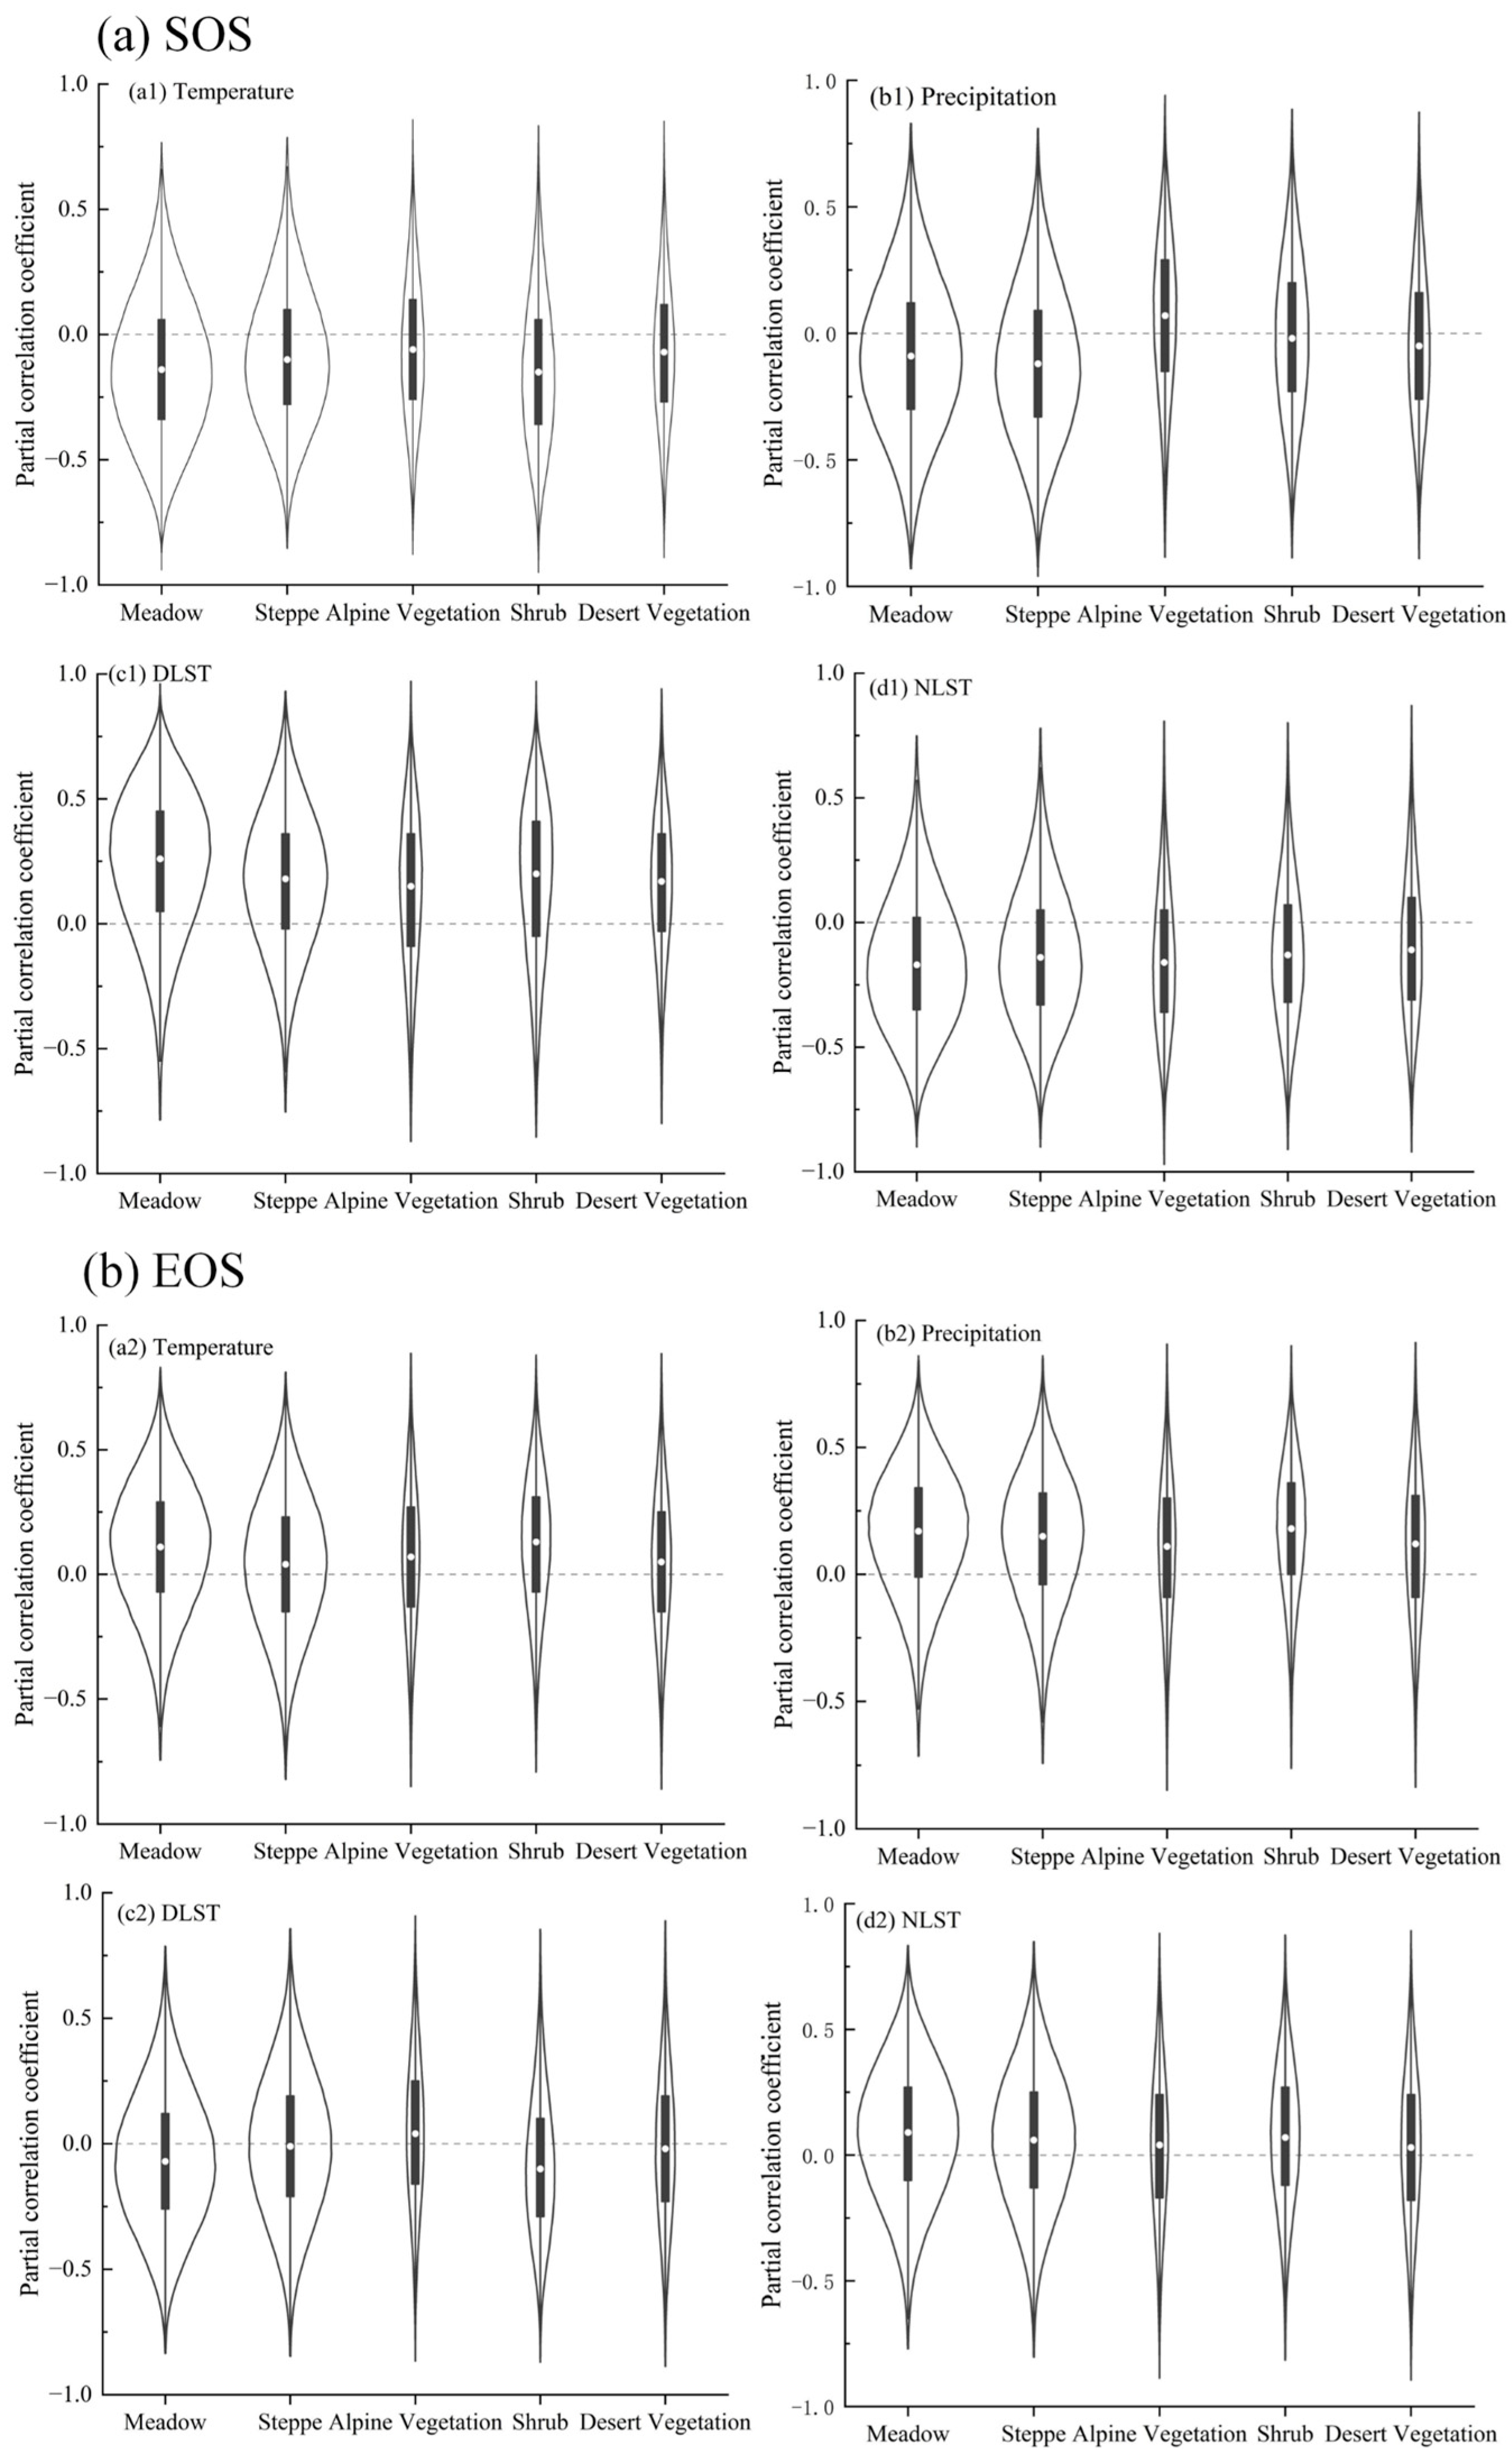
The SOS and EOS of different vegetation types responded differently to various climate factors. Compared to other vegetation types, meadow SOS had a stronger link with air temperature, DLST, and NLST. The shrub EOS was more correlated with each climatic factor than other vegetation.

Author Contributions

Conceptualization, X.H. and A.L.; methodology, A.L.; software, X.H. and A.L.; validation, L.W. and A.L.; formal analysis, A.L. and X.H.; writing—original draft preparation, A.L.; writing—review and editing, X.H., A.L. and L.W.; supervision, Z.T. and G.Z. All authors have read and agreed to the published version of the manuscript.

Funding

This research was funded by the sub-theme of the project “Westerly-monsoon synergy and its environmental effects” of the Second Comprehensive Scientific Expedition to the Tibetan Plateau, grant number 2019QZKK0106.

Data Availability Statement

The data presented in this study are available on request from the corresponding author.

Acknowledgments

We are grateful to NASA for providing the MOD13A2 data and MOD11A2 data. We sincerely appreciate the National Tibetan Plateau Data Center for supplying the temperature data.

Conflicts of Interest

The authors declare no conflicts of interest.

References

  1. Peñuelas, J.; Rutishauser, T.; Filella, I. Phenology Feedbacks on Climate Change. Science 2009, 324, 887–888. [Google Scholar] [CrossRef] [PubMed]
  2. Adole, T.; Dash, J.; Rodriguez-Galiano, V.; Atkinson, P.M. Photoperiod Controls Vegetation Phenology across Africa. Commun. Biol. 2019, 2, 391. [Google Scholar] [CrossRef] [PubMed]
  3. Yu, L.; Liu, T.; Bu, K.; Yan, F.; Yang, J.; Chang, L.; Zhang, S. Monitoring the Long Term Vegetation Phenology Change in Northeast China from 1982 to 2015. Sci. Rep. 2017, 7, 14770. [Google Scholar] [CrossRef]
  4. Zheng, Z.; Zhu, W.; Chen, G.; Jiang, N.; Fan, D.; Zhang, D. Continuous but Diverse Advancement of Spring-Summer Phenology in Response to Climate Warming across the Qinghai-Tibetan Plateau. Agric. For. Meteorol. 2016, 223, 194–202. [Google Scholar] [CrossRef]
  5. Yang, B.; He, M.; Shishov, V.; Tychkov, I.; Vaganov, E.; Rossi, S.; Ljungqvist, F.C.; Bräuning, A.; Grießinger, J. New Perspective on Spring Vegetation Phenology and Global Climate Change Based on Tibetan Plateau Tree-Ring Data. Proc. Natl. Acad. Sci. USA 2017, 114, 6966–6971. [Google Scholar] [CrossRef] [PubMed]
  6. Zu, J.; Zhang, Y.; Huang, K.; Liu, Y.; Chen, N.; Cong, N. Biological and Climate Factors Co-Regulated Spatial-Temporal Dynamics of Vegetation Autumn Phenology on the Tibetan Plateau. Int. J. Appl. Earth Obs. Geoinf. 2018, 69, 198–205. [Google Scholar] [CrossRef]
  7. Peng, J.; Wu, C.; Wang, X.; Lu, L. Spring Phenology Outweighed Climate Change in Determining Autumn Phenology on the Tibetan Plateau. Int. J. Climatol. 2021, 41, 3725–3742. [Google Scholar] [CrossRef]
  8. Wang, Z.; Cao, S.; Cao, G.; Lan, Y. Effects of Vegetation Phenology on Vegetation Productivity in the Qinghai Lake Basin of the Northeastern Qinghai–Tibet Plateau. Arab. J. Geosci. 2021, 14, 1030. [Google Scholar] [CrossRef]
  9. Li, P.; Zhu, W.; Xie, Z. Diverse and Divergent Influences of Phenology on Herbaceous Aboveground Biomass across the Tibetan Plateau Alpine Grasslands. Ecol. Indic. 2021, 121, 107036. [Google Scholar] [CrossRef]
  10. Ganjurjav, H.; Gao, Q.; Schwartz, M.W.; Zhu, W.; Liang, Y.; Li, Y.; Wan, Y.; Cao, X.; Williamson, M.A.; Jiangcun, W.; et al. Complex Responses of Spring Vegetation Growth to Climate in a Moisture-Limited Alpine Meadow. Sci. Rep. 2016, 6, 23356. [Google Scholar] [CrossRef]
  11. Kong, D.; Zhang, Q.; Huang, W.; GU, X. Vegetation Phenology Change in Tibetan Plateau from 1982 to 2013 and Its Related Meteorological Factors. Acta Geogr. Sin. 2017, 72, 39–52. [Google Scholar] [CrossRef]
  12. Ganjurjav, H.; Gornish, E.S.; Hu, G.; Schwartz, M.W.; Wan, Y.; Li, Y.; Gao, Q. Warming and Precipitation Addition Interact to Affect Plant Spring Phenology in Alpine Meadows on the Central Qinghai-Tibetan Plateau. Agric. For. Meteorol. 2020, 287, 107943. [Google Scholar] [CrossRef]
  13. Qin, G.; Adu, B.; Li, C.; Wu, J. Diverse Responses of Phenology in Multi-Grassland to Environmental Factors on Qinghai–Tibetan Plateau in China. Theor. Appl. Climatol. 2022, 148, 931–942. [Google Scholar] [CrossRef]
  14. Li, X.; Zhao, C.; Kang, M.; Ma, M. Responses of Net Primary Productivity to Phenological Dynamics Based on a Data Fusion Algorithm in the Northern Qinghai-Tibet Plateau. Ecol. Indic. 2022, 142, 109239. [Google Scholar] [CrossRef]
  15. Li, P.; Peng, C.; Wang, M.; Luo, Y.; Li, M.; Zhang, K.; Zhang, D.; Zhu, Q. Dynamics of Vegetation Autumn Phenology and Its Response to Multiple Environmental Factors from 1982 to 2012 on Qinghai-Tibetan Plateau in China. Sci. Total Environ. 2018, 637–638, 855–864. [Google Scholar] [CrossRef] [PubMed]
  16. Fu, Y.; Chen, H.; Niu, H.; Zhang, S.; Yang, Y. Spatial and Temporal Variation of Vegetation Phenology and Its Response to Climate Changes in Qaidam Basin from 2000 to 2015. J. Geogr. Sci. 2018, 28, 400–414. [Google Scholar] [CrossRef]
  17. Cong, N.; Shen, M.; Piao, S. Spatial Variations in Responses of Vegetation Autumn Phenology to Climate Change on the Tibetan Plateau. J. Plant Ecol. 2016, 10, 744–752. [Google Scholar] [CrossRef]
  18. Li, P.; Zhu, Q.; Peng, C.; Zhang, J.; Wang, M.; Zhang, J.; Ding, J.; Zhou, X. Change in Autumn Vegetation Phenology and the Climate Controls From 1982 to 2012 on the Qinghai–Tibet Plateau. Front. Plant Sci. 2020, 10, 1677. [Google Scholar] [CrossRef]
  19. Shen, M.; Zhang, G.; Cong, N.; Wang, S.; Kong, W.; Piao, S. Increasing Altitudinal Gradient of Spring Vegetation Phenology during the Last Decade on the Qinghai–Tibetan Plateau. Agric. For. Meteorol. 2014, 189–190, 71–80. [Google Scholar] [CrossRef]
  20. Liu, X.; Chen, Y.; Li, Z.; Li, Y.; Zhang, Q.; Zan, M. Driving Forces of the Changes in Vegetation Phenology in the Qinghai–Tibet Plateau. Remote Sens. 2021, 13, 4952. [Google Scholar] [CrossRef]
  21. Wu, X.; Liu, H. Consistent Shifts in Spring Vegetation Green-up Date across Temperate Biomes in China, 1982–2006. Glob. Chang. Biol. 2013, 19, 870–880. [Google Scholar] [CrossRef] [PubMed]
  22. Tao, F.; Yokozawa, M.; Zhang, Z.; Hayashi, Y.; Ishigooka, Y. Land Surface Phenology Dynamics and Climate Variations in the North East China Transect (NECT), 1982–2000. Int. J. Remote Sens. 2008, 29, 5461–5478. [Google Scholar] [CrossRef]
  23. Cong, N.; Zhang, Y.-J.; Zhu, J.-T. Temperature sensitivity of vegetation phenology in spring in mid- to high-latitude regions of Northern Hemisphere during the recent three decades. Chin. J. Plant Ecol. 2022, 46, 125–135. [Google Scholar] [CrossRef]
  24. Yuan, M.; Wang, L.; Lin, A.; Liu, Z.; Qu, S. Variations in Land Surface Phenology and Their Response to Climate Change in Yangtze River Basin during 1982–2015. Theor. Appl. Climatol. 2019, 137, 1659–1674. [Google Scholar] [CrossRef]
  25. Ding, Y.; Li, Z.; Peng, S. Global Analysis of Time-Lag and -Accumulation Effects of Climate on Vegetation Growth. Int. J. Appl. Earth Obs. Geoinf. 2020, 92, 102179. [Google Scholar] [CrossRef]
  26. Shen, M.; Piao, S.; Chen, X.; An, S.; Fu, Y.H.; Wang, S.; Cong, N.; Janssens, I.A. Strong Impacts of Daily Minimum Temperature on the Green-up Date and Summer Greenness of the Tibetan Plateau. Glob. Chang. Biol. 2016, 22, 3057–3066. [Google Scholar] [CrossRef] [PubMed]
  27. Zhang, Q.; Kong, D.; Shi, P.; Singh, V.P.; Sun, P. Vegetation Phenology on the Qinghai-Tibetan Plateau and Its Response to Climate Change (1982–2013). Agric. For. Meteorol. 2018, 248, 408–417. [Google Scholar] [CrossRef]
  28. Gao, M.; Wang, X.; Meng, F.; Liu, Q.; Li, X.; Zhang, Y.; Piao, S. Three-dimensional Change in Temperature Sensitivity of Northern Vegetation Phenology. Glob. Chang. Biol. 2020, 26, 5189–5201. [Google Scholar] [CrossRef]
  29. An, S.; Chen, X.; Zhang, X.; Lang, W.; Ren, S.; Xu, L. Precipitation and Minimum Temperature Are Primary Climatic Controls of Alpine Grassland Autumn Phenology on the Qinghai-Tibet Plateau. Remote Sens. 2020, 12, 431. [Google Scholar] [CrossRef]
  30. Zhang, X.; Friedl, M.A.; Schaaf, C.B.; Strahler, A.H. Climate Controls on Vegetation Phenological Patterns in Northern Mid- and High Latitudes Inferred from MODIS Data. Glob. Chang. Biol. 2004, 10, 1133–1145. [Google Scholar] [CrossRef]
  31. Hu, J.-Y.; Zhao, L. Applicability Evaluation and Correction of CLDAS Surface Temperature Products in Permafrost Region of Qinghai-Tibet Plateau. Clim. Chang. Res. 2023, 19, 1–17. [Google Scholar] [CrossRef]
  32. Zhou, T.; Zhang, Y. Relationship Betw Een Vegetation Index and Ground Surface Temperature on the Tibetan Plateau Alpine Grassland. J. Glaciol. Geocryol. 2015, 37, 58–69. [Google Scholar] [CrossRef]
  33. Wang, X.; Jin, R.; Du, P.J.; Liang, H. Trend of Surface Freeze-Thaw Cycles and Vegetation Green-up Date and Their Response to Climate Change on the Qinghai-Tibet Plateau. J. Remote Sens. 2018, 22, 508–520. [Google Scholar] [CrossRef]
  34. Ding, C.; Huang, W.; Liu, M.; Zhao, S. Change in the Elevational Pattern of Vegetation Greenup Date across the Tianshan Mountains in Central Asia during 2001–2020. Ecol. Indic. 2022, 136, 108684. [Google Scholar] [CrossRef]
  35. Hu, Z.; Dai, H.; Hou, F.; Li, E. Spatio-Temporal Change of Urban-Rural Vegetation Phenology and Its Response to Land Surface Temperature in Northeast China. Acta Ecol. Sin. 2020, 40, 4137–4145. [Google Scholar] [CrossRef]
  36. Gao, X.; Zhao, D. Impacts of Climate Change on Vegetation Phenology over the Great Lakes Region of Central Asia from 1982 to 2014. Sci. Total Environ. 2022, 845, 157227. [Google Scholar] [CrossRef] [PubMed]
  37. Xu, J.; Tang, Y.; Xu, J.; Shu, S.; Yu, B.; Wu, J.; Huang, Y. Impact of Snow Cover Phenology on the Vegetation Green-Up Date on the Tibetan Plateau. Remote Sens. 2022, 14, 3909. [Google Scholar] [CrossRef]
  38. Ji, Z.X.; Pei, T.T.; Chen, Y.; Hou, Q.Q.; XIE, B.P.; Wu, H.W. Grassland Phenological Dynamics and Its Response to Driving Factors on the Qinghai-Tibet Plateau. Pratacult. Sci. 2023, 47, 4–14. [Google Scholar] [CrossRef]
  39. Song, C.; Ke, L.; You, S.; Liu, G.; Zhong, X. Comparison of Three NDVI Time-Series Fitting Methods Based on TIMESAT—Taking the Grassland in NorthernTibet as Case. Remote Sens. Technol. Appl. 2011, 26, 147–155. [Google Scholar]
  40. Li, T.; Guo, Z.; Ma, C. Spatiotemporal Changes of Piedmont Phenology in the Transitional Zone between the Second and Third Steps, China. Geogr. Res. 2022, 41, 3000–3020. [Google Scholar]
  41. Geng, Q.; Chen, Q.; He, X. Vegetation dynamics and its response to climate change and human activities based on different vegetation types in China. Acta Ecol. Sin. 2022, 42, 3557–3568. [Google Scholar] [CrossRef]
  42. Wang, Y.; Luo, Y.; Shafeeque, M. Interpretation of Vegetation Phenology Changes Using Daytime and Night-Time Temperatures across the Yellow River Basin, China. Sci. Total Environ. 2019, 693, 133553. [Google Scholar] [CrossRef] [PubMed]
  43. Jonsson, P.; Eklundh, L. Seasonality Extraction by Function Fitting to Time-Series of Satellite Sensor Data. IEEE Trans Geosci. Remote Sens. 2002, 40, 1824–1832. [Google Scholar] [CrossRef]
  44. Li, C.; Wang, R.; Cui, X.; Wu, F.; Yan, Y.; Peng, Q.; Qian, Z.; Xu, Y. Responses of Vegetation Spring Phenology to Climatic Factors in Xinjiang, China. Ecol. Indic. 2021, 124, 107286. [Google Scholar] [CrossRef]
  45. Wei, X.; He, W.; Zhou, Y.; Ju, W.; Xiao, J.; Li, X.; Liu, Y.; Xu, S.; Bi, W.; Zhang, X.; et al. Global Assessment of Lagged and Cumulative Effects of Drought on Grassland Gross Primary Production. Ecol. Indic. 2022, 136, 108646. [Google Scholar] [CrossRef]
  46. Zhan, C.; Liang, C.; Zhao, L.; Jiang, S.; Niu, K.; Zhang, Y. Drought-Related Cumulative and Time-Lag Effects on Vegetation Dynamics across the Yellow River Basin, China. Ecol. Indic. 2022, 143, 109409. [Google Scholar] [CrossRef]
  47. Ji, Z.; Pei, T.; Chen, Y.; Qin, G.; Hou, Q. Vegetation Phenology Change and Its Response to Seasonal Climate Changes on the Loess Plateau. Acta Ecol. Sin. 2021, 41, 6600–6612. [Google Scholar] [CrossRef]
  48. Cui, X.; Xu, G.; He, X.; Luo, D. Influences of Seasonal Soil Moisture and Temperature on Vegetation Phenology in the Qilian Mountains. Remote Sens. 2022, 14, 3645. [Google Scholar] [CrossRef]
  49. Huang, W.J.; Zeng, T.Y.; Huang, X.D. Spatiotemporal Dynamics of Alpine Grassland Phenology on the Tibetan Plateau. Pratacult. Sci. 2019, 36, 1032–1043. [Google Scholar] [CrossRef]
  50. Yuan, Q.; Yang, J. Phenological changes of grassland vegetation and its response to climate change in Qinghai-Tibet Plateau. Chin. J. Grassl. 2021, 43, 32–43. [Google Scholar] [CrossRef]
  51. Wu, D.; Zhao, X.; Liang, S.; Zhou, T.; Huang, K.; Tang, B.; Zhao, W. Time-Lag Effects of Global Vegetation Responses to Climate Change. Glob. Chang. Biol. 2015, 21, 3520–3531. [Google Scholar] [CrossRef]
  52. Yuan, Y.; Bao, A.; Jiapaer, G.; Jiang, L.; De Maeyer, P. Phenology-Based Seasonal Terrestrial Vegetation Growth Response to Climate Variability with Consideration of Cumulative Effect and Biological Carryover. Sci. Total Environ. 2022, 817, 152805. [Google Scholar] [CrossRef] [PubMed]
  53. Lian, X.; Piao, S.; Li, L.Z.X.; Li, Y.; Huntingford, C.; Ciais, P.; Cescatti, A.; Janssens, I.A.; Peñuelas, J.; Buermann, W.; et al. Summer Soil Drying Exacerbated by Earlier Spring Greening of Northern Vegetation. Sci. Adv. 2020, 6, eaax0255. [Google Scholar] [CrossRef] [PubMed]
  54. De Boeck, H.J.; Bassin, S.; Verlinden, M.; Zeiter, M.; Hiltbrunner, E. Simulated Heat Waves Affected Alpine Grassland Only in Combination with Drought. New Phytol. 2016, 209, 531–541. [Google Scholar] [CrossRef] [PubMed]
  55. Peng, J.; Wu, C.; Zhang, X.; Wang, X.; Gonsamo, A. Satellite Detection of Cumulative and Lagged Effects of Drought on Autumn Leaf Senescence over the Northern Hemisphere. Glob. Chang. Biol. 2019, 25, 2174–2188. [Google Scholar] [CrossRef] [PubMed]
  56. Wen, Y.; Liu, X.; Xin, Q.; Wu, J.; Xu, X.; Pei, F.; Li, X.; Du, G.; Cai, Y.; Lin, K.; et al. Cumulative Effects of Climatic Factors on Terrestrial Vegetation Growth. J. Geophys. Res. Biogeosci. 2019, 124, 789–806. [Google Scholar] [CrossRef]
  57. Di, L.; Rundquist, D.C.; Han, L. Modelling Relationships between NDVI and Precipitation during Vegetative Growth Cycles. Int. J. Remote Sens. 1994, 15, 2121–2136. [Google Scholar] [CrossRef]
  58. Wang, W.; Anderson, B.T.; Entekhabi, D.; Huang, D.; Su, Y.; Kaufmann, R.K.; Myneni, R.B. Intraseasonal Interactions between Temperature and Vegetation over the Boreal Forests. Earth Interact. 2007, 11, 1–30. [Google Scholar] [CrossRef]
  59. Wen, Y.; Liu, X.; Yang, J.; Lin, K.; Du, G. NDVI Indicated Inter-Seasonal Non-Uniform Time-Lag Responses of Terrestrial Vegetation Growth to Daily Maximum and Minimum Temperature. Glob. Planet. Chang. 2019, 177, 27–38. [Google Scholar] [CrossRef]
  60. Qiao, C.; Shen, S.; Cheng, C.; Wu, J. Vegetation Phenology in the Qilian Mountains and Its Response to Temperature from 1982 to 2014. Remote Sens. 2021, 13, 286. [Google Scholar] [CrossRef]
  61. Ren, P.; LI, P.; Peng, C.; Zhou, X.; Yang, M. Temporal and Spatial Variation of Vegetation Photosynthetic Phenology in Dongting Lake Basin and Its Response to Climate Change. Chin. J. Plant Ecol. 2023, 47, 319–330. [Google Scholar] [CrossRef]
  62. Liu, Q.; Fu, Y.; Zeng, Z.; Huang, M.; Li, X. Temperature, Precipitation, and Insolation Effects on Autumn Vegetation Phenology in Temperate China. Glob. Chang. Biol. 2015, 22, 644–655. [Google Scholar] [CrossRef] [PubMed]
  63. Ge, W.; Han, J.; Zhang, D.; Wang, F. Divergent Impacts of Droughts on Vegetation Phenology and Productivity in the Yungui Plateau, Southwest China. Ecol. Indic. 2021, 127, 107743. [Google Scholar] [CrossRef]
  64. Shao, Y.; Wang, J.; Yan, X. The Phenological Characteristics of Mongolian Vegetation and Its Response to Geographical Elements. Geogr. Res. 2021, 40, 3029–3045. [Google Scholar]
  65. Mei, L.; Bao, G.; Tong, S.; Yin, S.; Bao, Y.; Jiang, K.; Hong, Y.; Tuya, A.; Huang, X. Elevation-Dependent Response of Spring Phenology to Climate and Its Legacy Effect on Vegetation Growth in the Mountains of Northwest Mongolia. Ecol. Indic. 2021, 126, 107640. [Google Scholar] [CrossRef]
  66. Yang, Z.; Shen, M.; Jia, S.; Guo, L.; Yang, W.; Wang, C.; Chen, X.; Chen, J. Asymmetric Responses of the End of Growing Season to Daily Maximum and Minimum Temperatures on the Tibetan Plateau: Autumn Phenology on Tibetan Plateau. J. Geophys. Res. Atmos. 2017, 122, 13278–13287. [Google Scholar] [CrossRef]
  67. Li, P.; Liu, Z.; Zhou, X.; Xie, B.; Li, Z.; Luo, Y.; Zhu, Q.; Peng, C. Combined Control of Multiple Extreme Climate Stressors on Autumn Vegetation Phenology on the Tibetan Plateau under Past and Future Climate Change. Agric. For. Meteorol. 2021, 308–309, 108571. [Google Scholar] [CrossRef]
Figure 1. Location of the Tibetan Plateau and spatial distribution of various vegetation types.
Remotesensing 16 00049 g001
Figure 2. Spatial distribution of mean vegetation phenology from 2001 to 2020. (a) Spatial distribution of annual mean SOS. (b) Spatial distribution of annual mean EOS.
Remotesensing 16 00049 g002
Figure 3. Frequency distribution of the correlation coefficient between SOS, EOS, and climate factors for different lag times. Significant negative and positive correlation means passing a 0.05 significance test.
Remotesensing 16 00049 g003
Figure 4. Spatial distribution of SOS and EOS lagged response time to climate factors on the Tibetan Plateau (the upper right shows the percentages passing the 0.05 significance test).
Remotesensing 16 00049 g004
Figure 5. Frequency distribution of the correlation coefficient between SOS, EOS, and climate factors for multiple accumulation times. Significant negative and positive correlation means passing a 0.05 significance test.
Remotesensing 16 00049 g005
Figure 6. Spatial pattern of the cumulative response time of SOS and EOS to climatic factors (the upper right corner shows the percentages passing the 0.05 significance test).
Remotesensing 16 00049 g006
Figure 7. Partial correlations between SOS and climate factors (ad) and climatic factors’ variation trend (eh).
Remotesensing 16 00049 g007
Figure 8. Partial correlations between EOS and climate factors (ad) and climatic factors’ variation trend (eh).
Remotesensing 16 00049 g008
Figure 9. Partial correlations of the SOS and EOS with each climate factor for different vegetation types.
Remotesensing 16 00049 g009
Table 1. Comparison of phenological results of this paper with other results from studies on the Qinghai Tibet Plateau.
Study PhaseSOS/dEOS/dData SourcesLiterature Sources
2001–2015110–170260–300MOD13A1[49]
2000–2019110–180240–300MOD13Q1[50]
2000–2020120–180240–300MOD13A2[38]
2001–2020110–180245–300MOD13A2This paper
Disclaimer/Publisher’s Note: The statements, opinions and data contained in all publications are solely those of the individual author(s) and contributor(s) and not of MDPI and/or the editor(s). MDPI and/or the editor(s) disclaim responsibility for any injury to people or property resulting from any ideas, methods, instructions or products referred to in the content.

