

Application of Remote Sensing in Detecting and Monitoring Water Stress in Forests

Abstract
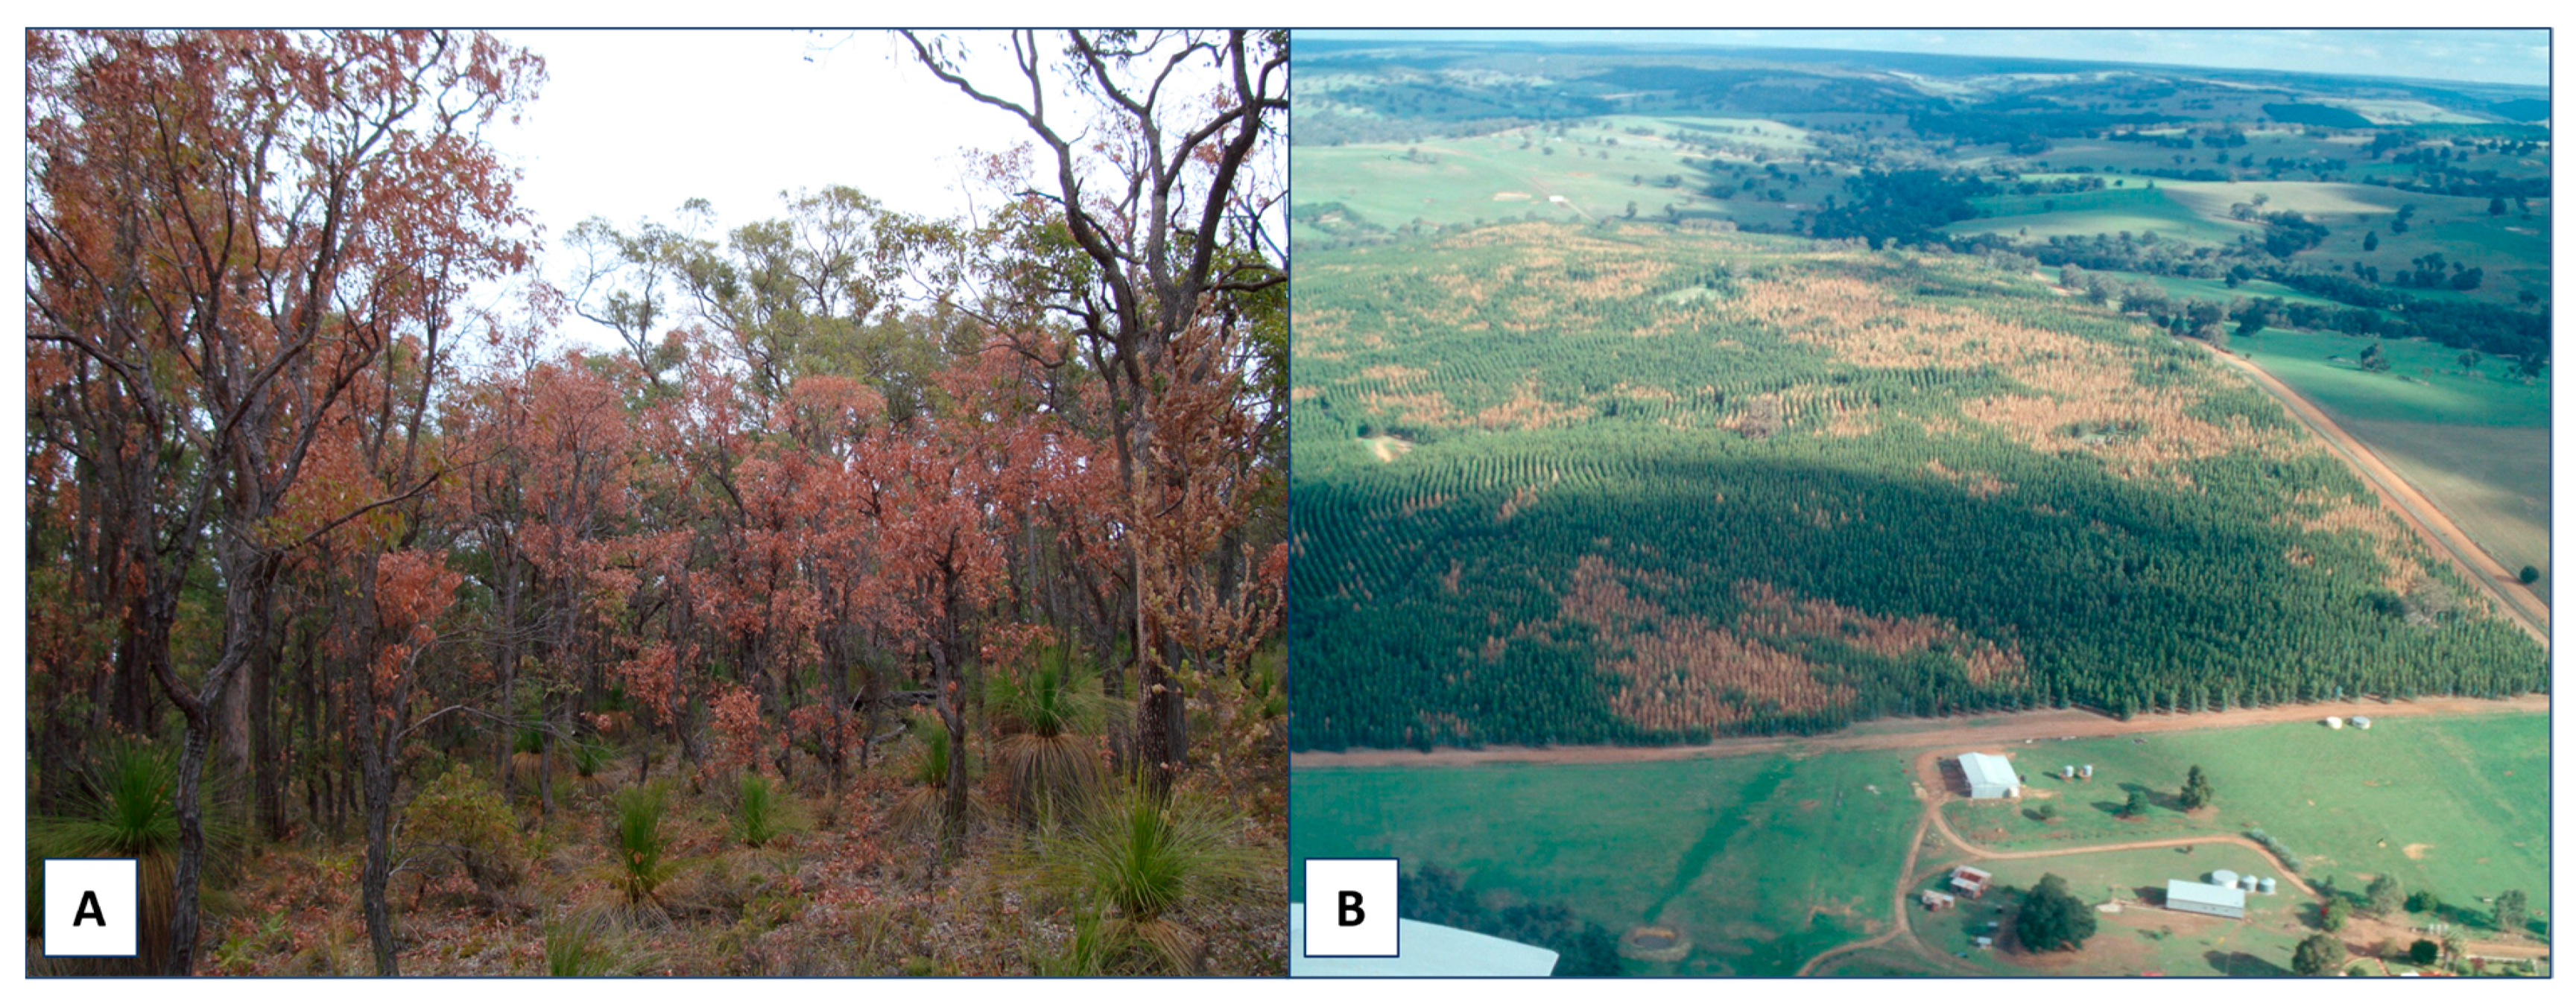
:1. Introduction
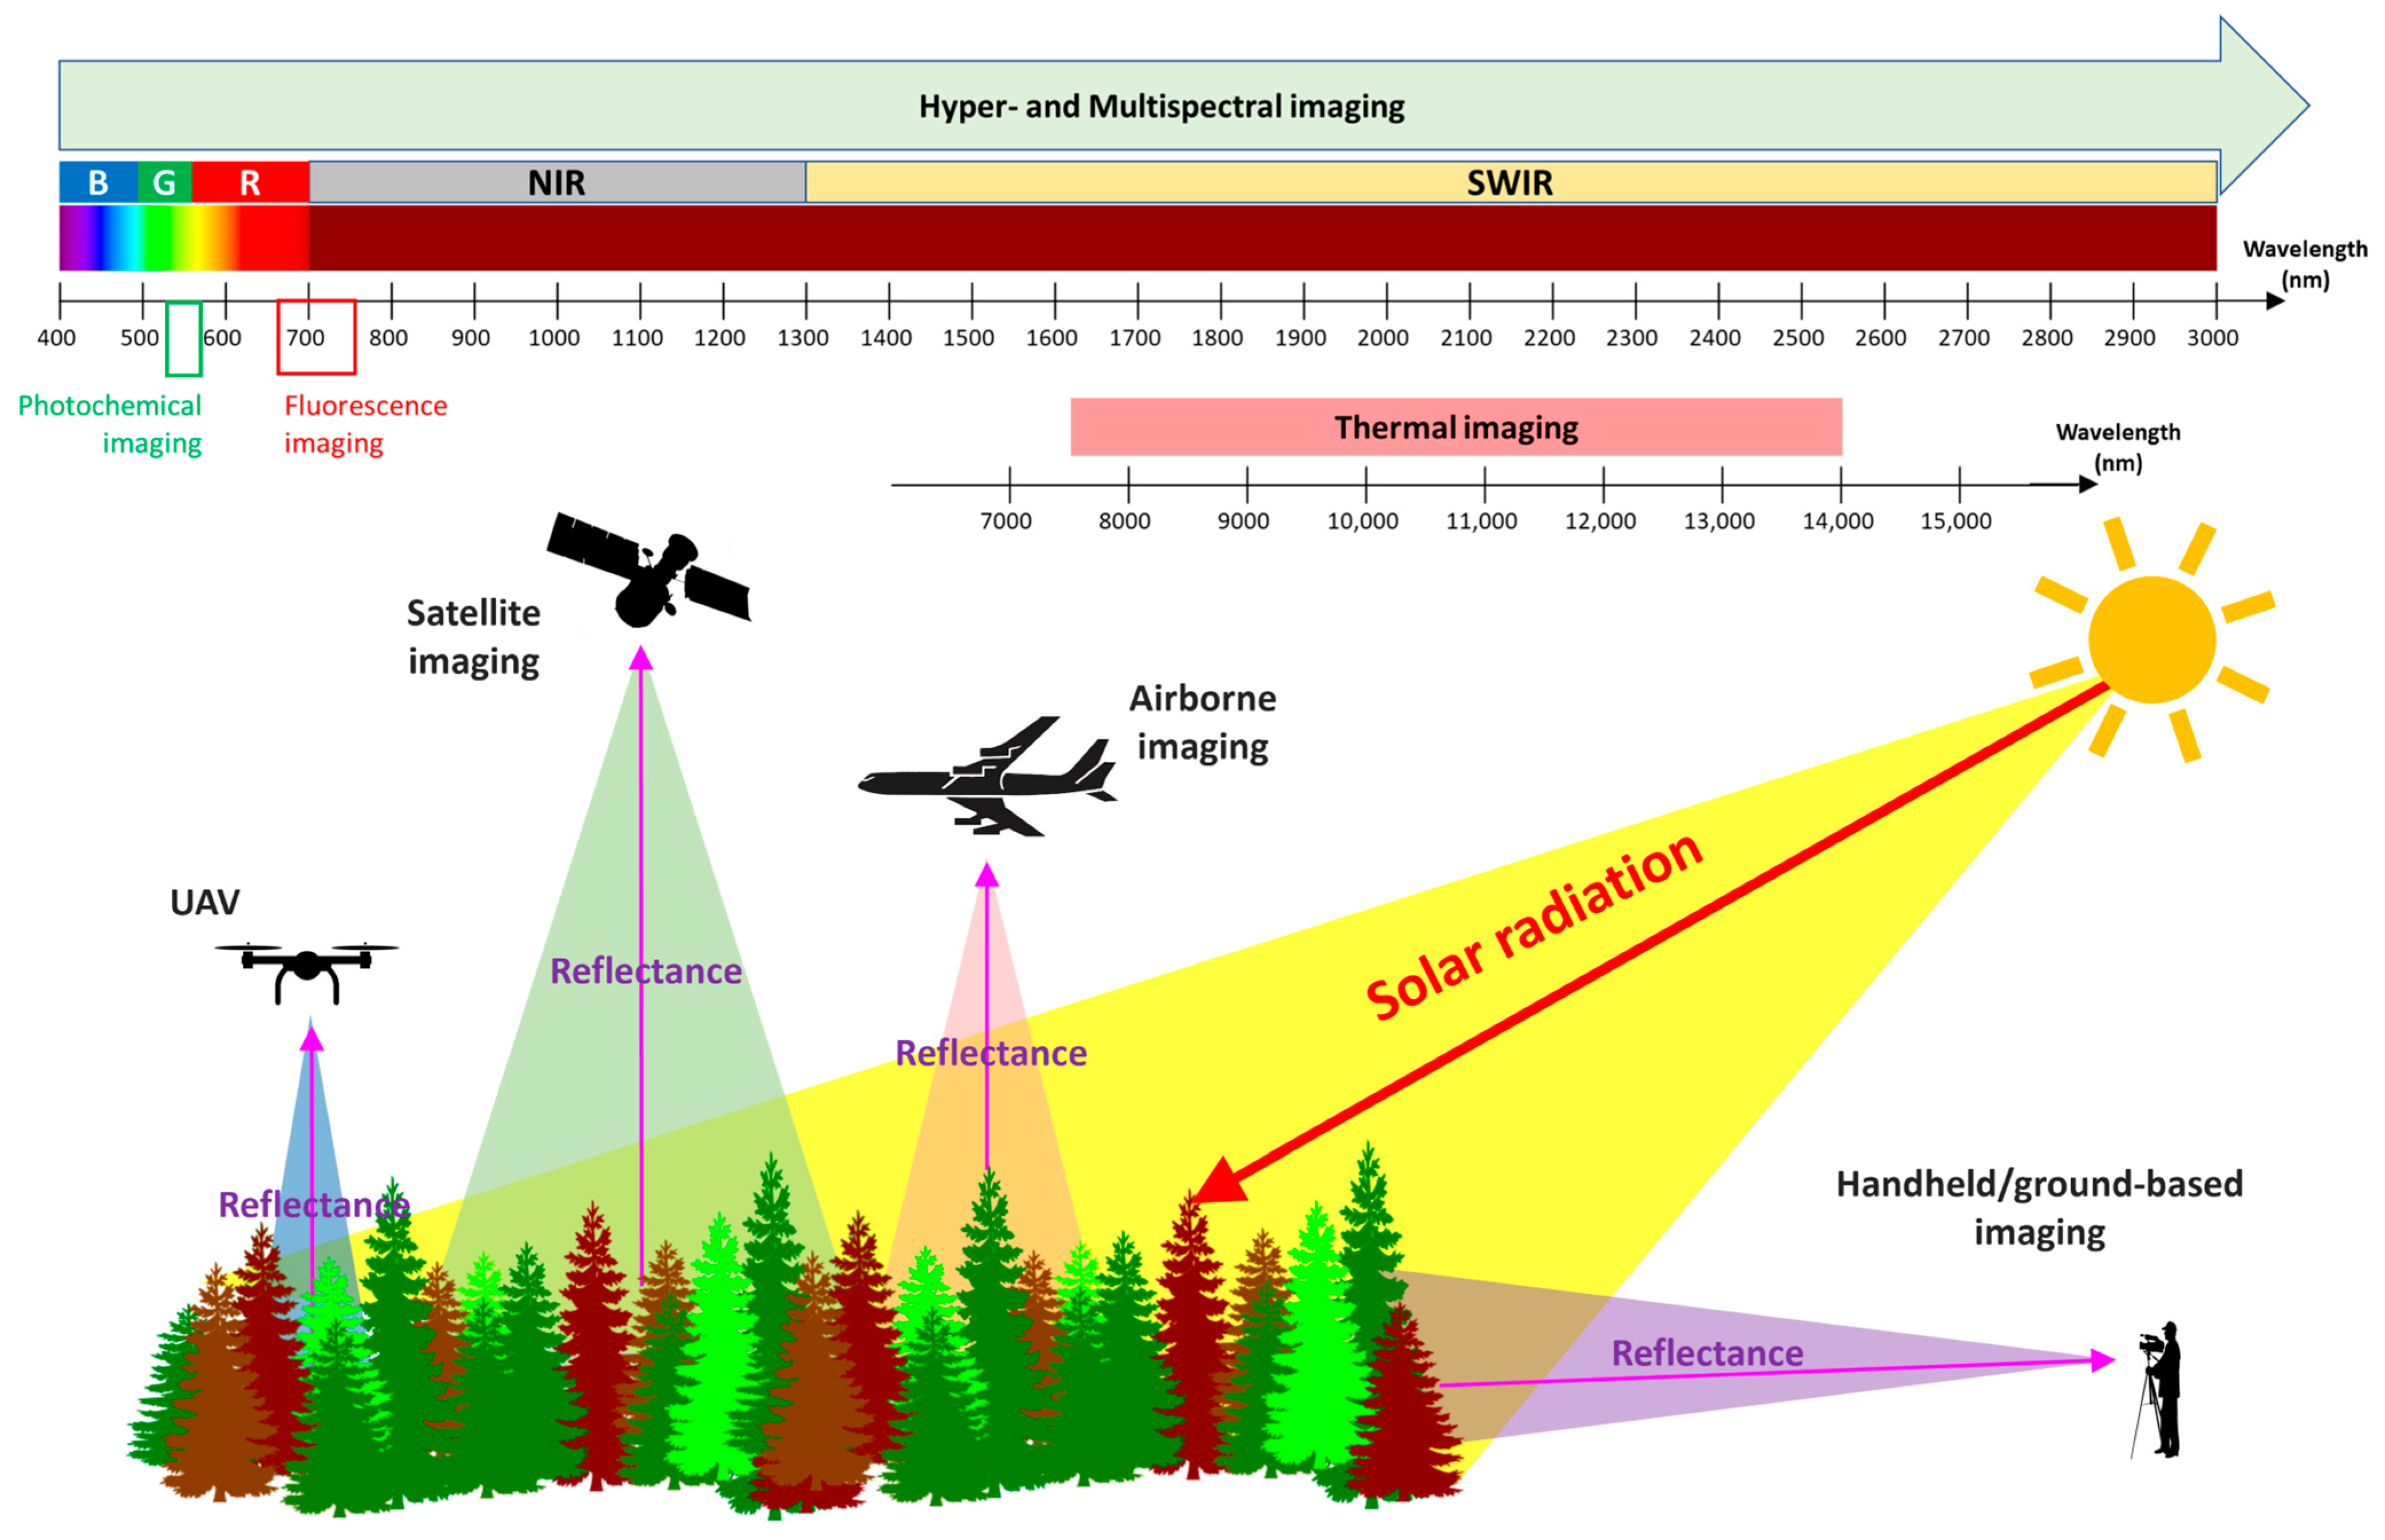
2. Remote Sensing for Detection of Plant Water Stress
2.1. General Principles
2.2. Vegetation Indices
2.3. Spectral Characteristics of Leaf Chlorophyll Content
2.4. Spectral Characteristics of Leaf Water Content
2.5. Spectral Characteristics of Canopy Temperature
2.6. Spectral Characteristics of Plant Photosynthetic Efficiency
3. Remote Sensing Application for Water Stress Management in Forestry
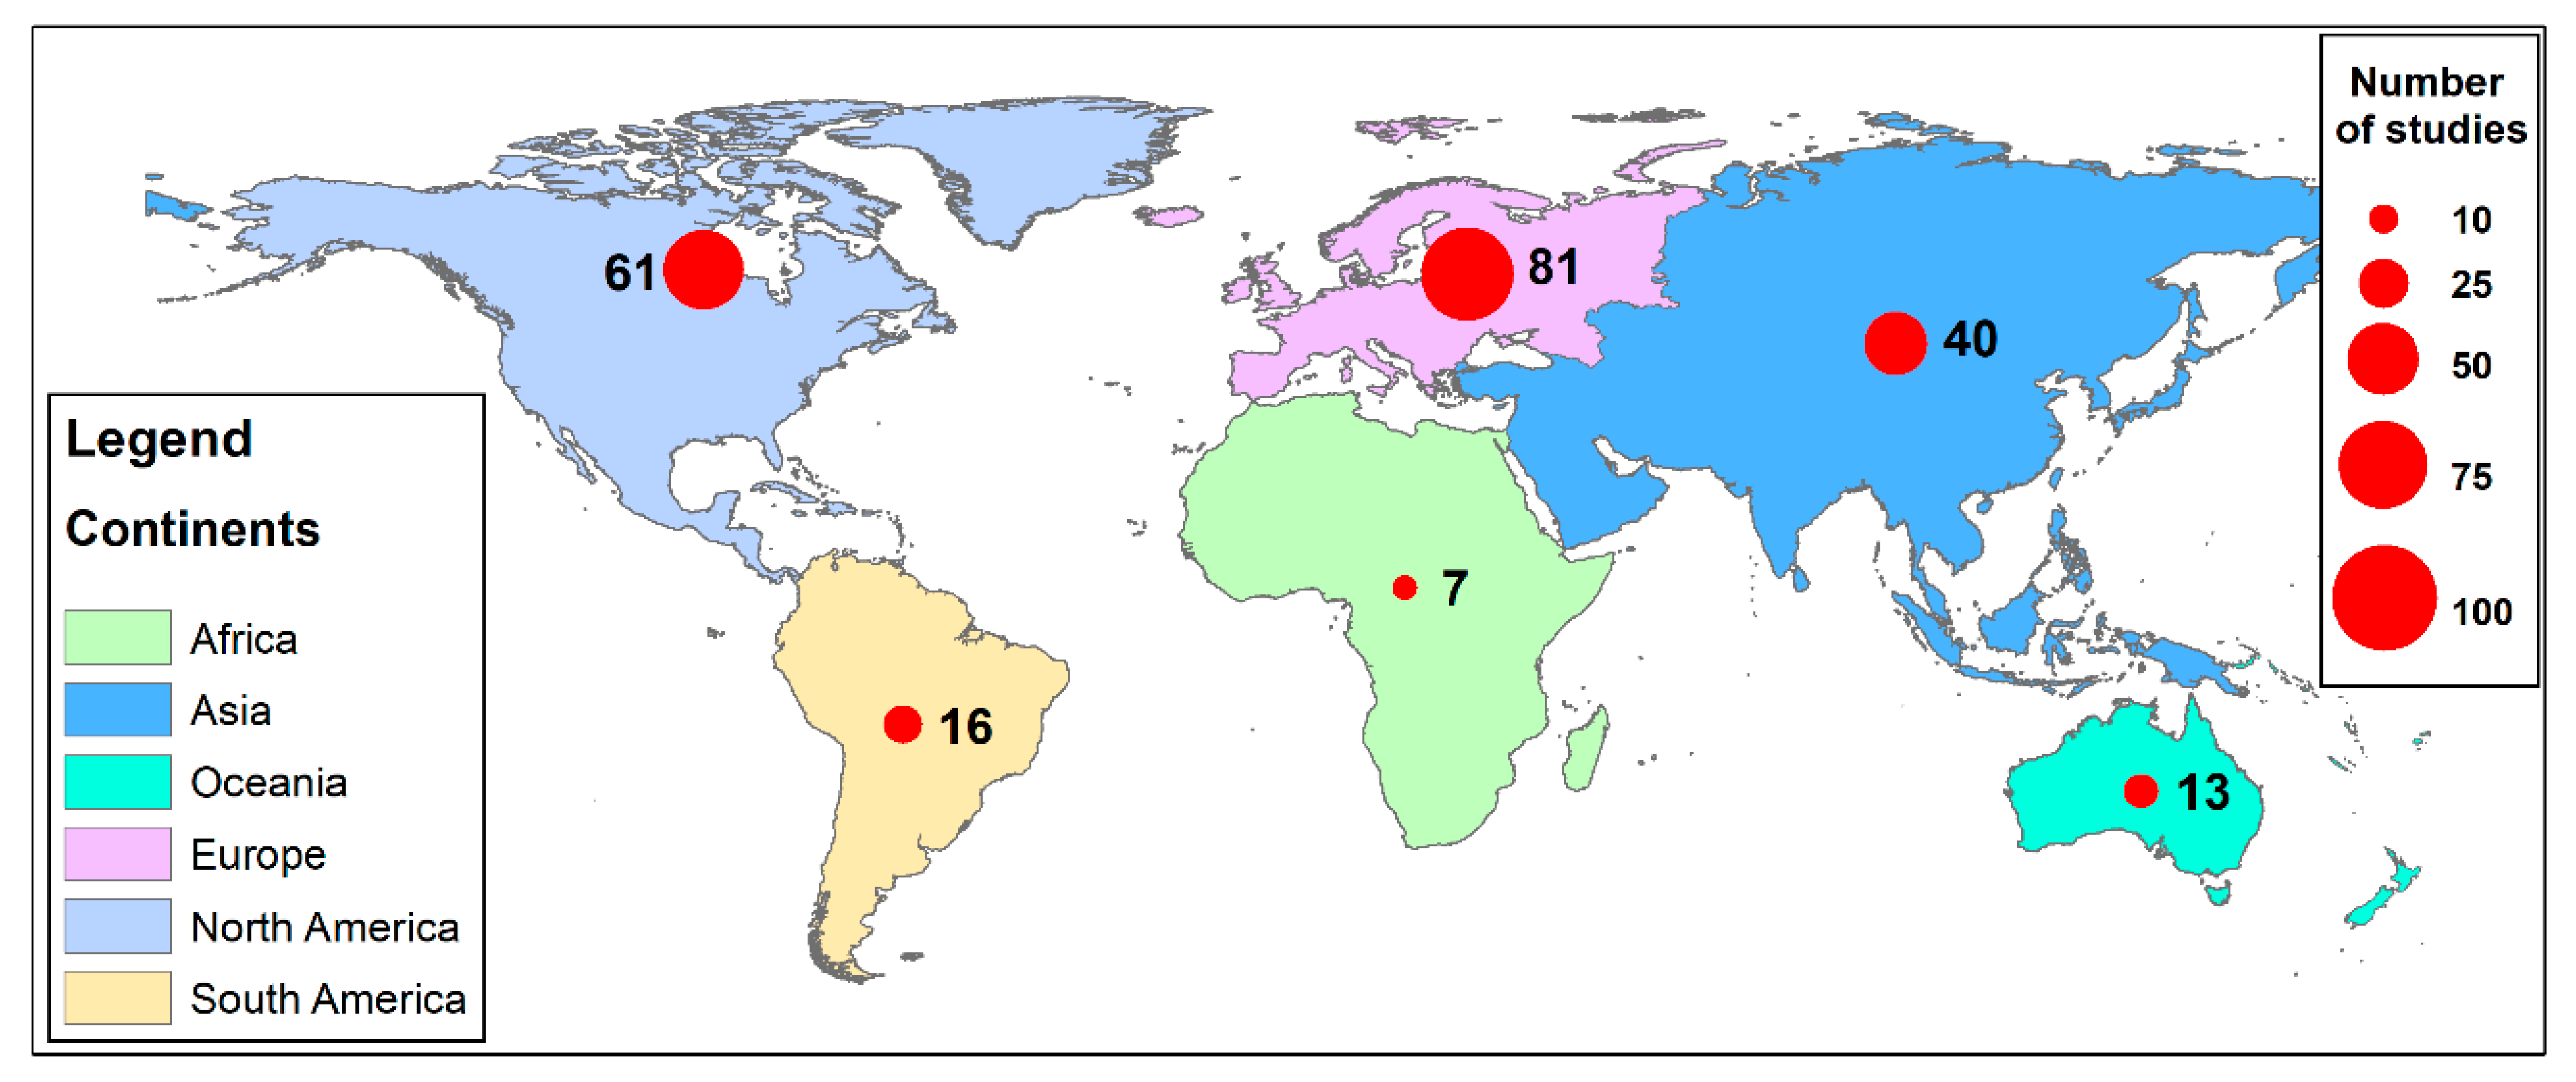
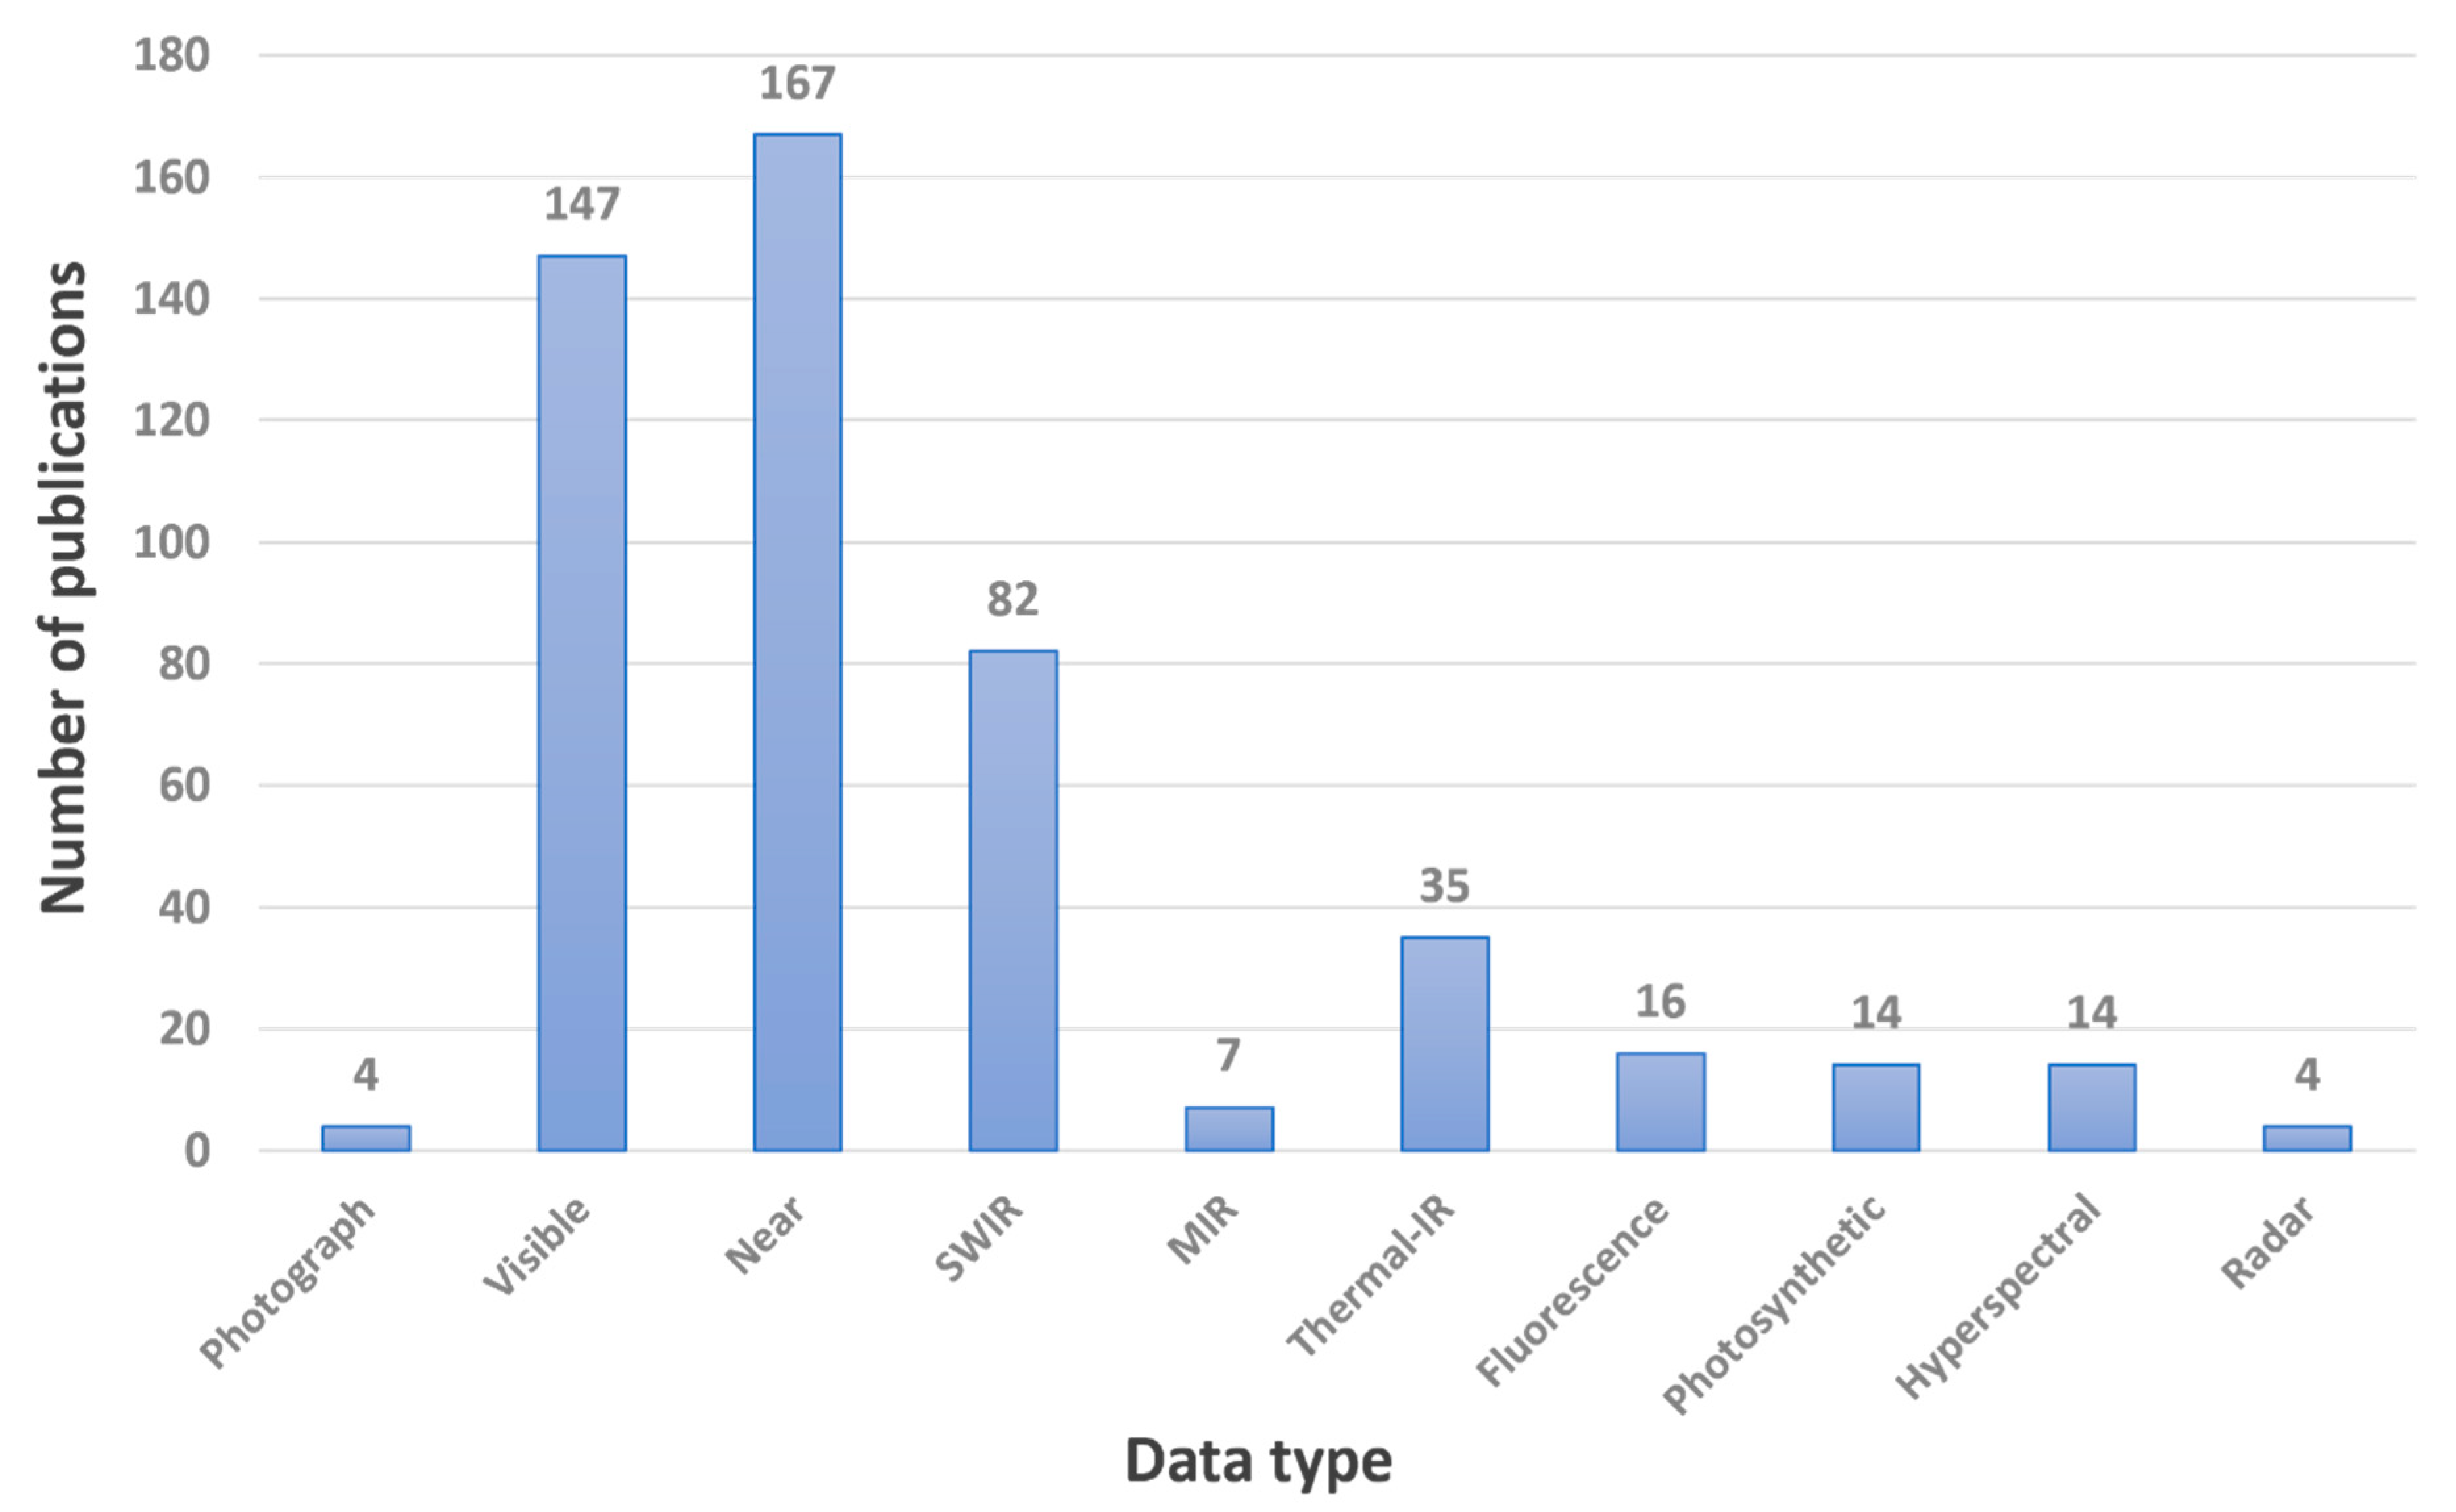
3.1. Overall Trend of Remote Sensing Applications for Forest Water Stress Assessment
3.2. Change in Applications over Time
3.3. Overall Findings
4. Integration of Remote Sensing of Water Stress with Other Spatial Datasets for Forest Management
5. Conclusions
Author Contributions
Funding
Conflicts of Interest
References
- Trenberth, K.E.; Dai, A.; Van Der Schrier, G.; Jones, P.D.; Barichivich, J.; Briffa, K.R.; Sheffield, J. Global warming and changes in drought. Nat. Clim. Change 2014, 4, 17–22. [Google Scholar] [CrossRef]
- Cook, B.I.; Mankin, J.S.; Anchukaitis, K.J. Climate change and drought: From past to future. Curr. Clim. Change Rep. 2015, 4, 164–179. [Google Scholar] [CrossRef]
- Samaniego, L.; Thober, S.; Kumar, R.; Wanders, N.; Rakovec, O.; Pan, M.; Zink, M.; Sheffield, J.; Wood, E.F.; Marx, A. Anthropogenic warming exacerbates European soil moisture droughts. Nat. Clim. Change 2018, 8, 421–426. [Google Scholar] [CrossRef] [Green Version]
- IPCC. Climate Change 2022: Impacts, Adaptation and Vulnerability; Intergovernmental Panel on Climate Change: Geneva, Switzerland, 2022. [Google Scholar]
- Christensen, L.; Adams, H.R.; Tai, X.; Barnard, H.R.; Brooks, P.D. Increasing plant water stress and decreasing summer streamflow in response to a warmer and wetter climate in seasonally snow-covered forests. Ecohydrology 2020, 14, 18. [Google Scholar] [CrossRef]
- Williams, A.P.; Cook, E.R.; Smerdon, J.E.; Cook, B.I.; Abatzoglou, J.T.; Bolles, K.; Baek, S.H.; Badger, A.M.; Livneh, B. Large contribution from anthropogenic warming to an emerging North American megadrought. Science 2020, 368, 314–318. [Google Scholar] [CrossRef] [PubMed]
- IPCC. Climate Change 2014: Mitigation of Climate Change; Intergovernmental Panel on Climate Change: Geneva, Switzerland; Cambridge University Press: New York, NY, USA, 2015. [Google Scholar]
- D’Orangeville, L.; Maxwell, J.; Kneeshaw, D.; Pederson, N.; Duchesne, L.; Logan, T.; Houle, D.; Arseneault, D.; Beier, C.M.; Bishop, D.A.; et al. Drought timing and local climate determine the sensitivity of eastern temperate forests to drought. Glob. Change Biol. 2015, 24, 2339–2351. [Google Scholar] [CrossRef]
- Cholet, C.; Houle, D.; Sylvain, J.-D.; Doyon, F.; Maheu, A. Climate Change Increases the Severity and Duration of Soil Water Stress in the Temperate Forest of Eastern North America. Front. For. Glob. Change 2022, 5, 13. [Google Scholar] [CrossRef]
- Lisar, S.Y.S.; Motafakkerazad1, R.; Hossain, M.M.; Rahman, I.M.M. Water Stress in Plants: Causes, Effects and Responses In Water Stress; Rahman, I.M.M., Hasegawa, H., Eds.; IntechOpen: London, UK, 2012. [Google Scholar]
- Imadi, S.R.; Gul, A.; Dikilitas, M.; Karakas, S.; Sharma, I.; Ahmad, P. Water stress: Types, causes, and impact on plant growth and development. In Water Stress and Crop Plants: A Sustainable Approach, Volume 2; Ahmad, P., Ed.; John Wiley & Sons Ltd.: Hoboken, NJ, USA, 2016. [Google Scholar]
- Hsiao, T.C. Plant Responses to Water Stress. Annu. Rev. Plant Physiol. 1973, 24, 519–570. [Google Scholar] [CrossRef]
- Vaadia, Y.; Raney, F.C.; Hagan, R.M. Plant Water Deficits and Physiological Processes. Annu. Rev. Plant Physiol. 1961, 12, 265–292. [Google Scholar] [CrossRef]
- Kramer, P.J. Water Stress and Plant Growth. Agron. J. 1963, 55, 31–35. [Google Scholar] [CrossRef]
- Escalona, J.; Flexas, J.; Medrano, H. Stomatal and non-stomatal of photosynthesis under water stress in field grown grapevines. Funct. Plant Biol. 2000, 27, 87. [Google Scholar] [CrossRef]
- Ordin, L. Effect of Water Stress on Cell Wall Metabolism of Avena Coleoptile Tissue. Plant Physiol. 1960, 35, 443–450. [Google Scholar] [CrossRef] [Green Version]
- Jaleel, C.; Manivannan, P.; Wahid, A.; Farooq, M.; Al-Juburi, H.; Somasundaram, R.; Panneerselvam, R. Drought Stress in Plants: A Review on Morphological Characteristics and Pigments Composition. Int. J. Agric. Biol. 2009, 11, 100–105. [Google Scholar]
- Bohnert, H.J.; Jensen, R.G. Strategies for engineering water-stress tolerance in plants. Trend Biotechnol. 1996, 14, 89–97. [Google Scholar] [CrossRef]
- Farahani, H.A.; Valadabadi, S.A.; Daneshian, J.; Khalvati, M.A. Evaluation changing of essential oil of balm (Melissa officinalis L.) under water deficit stress conditions. J. Med. Plants Res. 2009, 3, 329–333. [Google Scholar]
- Dobbertin, M.; Wermelinger, B.; Bigler, C.; Bürgi, M.; Carron, M.; Forster, B.; Gimmi, U.; Rigling, A. Linking Increasing Drought Stress to Scots Pine Mortality and Bark Beetle Infestations. Sci. World J. 2007, 7, 9. [Google Scholar] [CrossRef] [Green Version]
- Wang, W.; Peng, C.; Kneeshaw, D.D.; Larocque, G.R.; Luo, Z. Drought-induced tree mortality: Ecological consequences, causes, and modeling. Environ. Rev. 2012, 20, 109–121. [Google Scholar] [CrossRef] [Green Version]
- Kharuk, V.I.; Im, S.T.; Petrov, I.A.; Dvinskaya, M.L.; Fedotova, E.V.; Ranson, K.J. Fir decline and mortality in the southern Siberian Mountains. Reg. Environ. Change 2017, 17, 803–812. [Google Scholar] [CrossRef]
- Xu, P.; Zhou, T.; Yi, C.; Luo, H.; Zhao, X.; Fang, W.; Gao, S.; Liu, X. Impacts of Water Stress on Forest Recovery and Its Interaction with Canopy Height. Environ. Res. Public Health 2018, 15, 16. [Google Scholar] [CrossRef] [Green Version]
- Hardy, G.; Matusick, G.; Ruthrof, K. Impacts of large scale drought deaths in Western Australia’s northern jarrah (Eucalyptus marginata) forest. In Proceedings of the Ecological Society of Australia, Annual Conference, Melbourne, Australia, 27–30 November 2012. [Google Scholar]
- Matusick, G.; Ruthrof, K.X.; Brouwers, N.C.; Dell, B.; Hardy, G.S.J. Sudden forest canopy collapse corresponding with extreme drought and heat in a mediterranean-type eucalypt forest in southwestern Australia. Eur. J. For. Res. 2013, 132, 497–510. [Google Scholar] [CrossRef] [Green Version]
- Zou, J.; Ding, J.; Qin, Y.; Wang, F. Response of water use efficiency of Central Asia ecosystem to drought based on remote sensing data. Trans. Chin. Soc. Agric. Eng. 2018, 34, 145–152. [Google Scholar]
- Anderson, L.O.; Ribeiro Neto, G.; Cunha, A.P.; Fonseca, M.G.; Moura, Y.M.d.; Dalagnol, R.; Wagner, F.H.; Aragao, L.E.O.e.C.d. Vulnerability of Amazonian forests to repeated droughts. Philos. Trans. R. Soc. B Biol. Sci. 2018, 373, 20170411. [Google Scholar] [CrossRef] [PubMed]
- Lucas, A. Water Stress and Disease Development in Eucalyptus marginata (Jarrah) Infected with Phytophthora cinnamomi. Ph.D. Dissertation, Murdoch University, Perth, Australia, 2003. [Google Scholar]
- Zou, L.; Cao, S.; Zhao, A.; Sanchez-Azofeifa, A. Assessing the Temporal Response of Tropical Dry Forests to Meteorological Drought. Remote Sens. 2020, 12, 2341. [Google Scholar] [CrossRef]
- Meyer, B.F.; Buras, A.; Rammig, A.; Zang, C.S. Higher susceptibility of beech to drought in comparison to oak. Dendrochronologia 2020, 64, 125780. [Google Scholar] [CrossRef]
- Huete, A.R. Chapter 11—Remote sensing for environmental monitoring. In Environmental Monitoring and Characterization; Artiola, J.F., Pepper, I.L., Brusseau, M.L., Eds.; Academic Press: Cambridge, MA, USA, 2004; pp. 183–206. [Google Scholar]
- Wang, J.; Sammis, T.W.; Gutschick, V.P.; Gebremichael, M.; Dennis, S.O.; Harrison, R.E. Review of Satellite Remote Sensing Use in Forest Health Studies. Open Geogr. J. 2010, 3, 28–42. [Google Scholar] [CrossRef]
- Ahmad, U.; Alvino, A.; Marino, S. A Review of Crop Water Stress Assessment Using Remote Sensing. Remote Sens. 2021, 13, 4155. [Google Scholar] [CrossRef]
- Virnodkar, S.S.; Pachghare, V.K.; Patil, V.C.; Jha, S.K. Remote sensing and machine learning for crop water stress determination in various crops: A critical review. Precis. Agric. 2020, 21, 1121–1155. [Google Scholar] [CrossRef]
- Hansen, M.C.; Thomas, R.L. A review of large area monitoring of land cover change using Landsat data. Remote Sens. Environ. 2012, 122, 66–74. [Google Scholar] [CrossRef]
- Zhang, Y.; Peng, C.; Li, W.; Fang, X.; Zhang, T.; Zhu, Q.; Chen, H.; Zhao, P. Monitoring and estimating drought-induced impacts on forest structure, growth, function, and ecosystem services using remote-sensing data: Recent progress and future challenges. Environ. Rev. 2013, 21, 103–115. [Google Scholar] [CrossRef]
- Harris, A.; Bryant, R.G.; Baird, A.J. Mapping the effects of water stress on Sphagnum: Preliminary observations using airborne remote sensing. Remote Sens. Environ. 2006, 100, 363–378. [Google Scholar] [CrossRef]
- Joshi, R.C.; Ryu, D.; Sheridan, G.J.; Lane, P.N.J. Modeling Vegetation Water Stress over the Forest from Space: Temperature Vegetation Water Stress Index (TVWSI). Remote Sens. 2021, 13, 23. [Google Scholar] [CrossRef]
- Liu, N.; Deng, Z.; Wang, H.; Luo, Z.; Gutiérrez-Juradob, H.A.; He, X.; Guan, H. Thermal remote sensing of plant water stress in natural ecosystems. For. Ecol. Manag. 2020, 476, 14. [Google Scholar] [CrossRef]
- Anderson, L.O.; Malhi, Y.; Aragao, L.E.O.C.; Ladle, R.; Arai, E.; Barbier, N.; Phillips, O. Remote sensing detection of droughts in Amazonian forest canopies. New Phytol. 2010, 187, 733–750. [Google Scholar] [CrossRef]
- Govender, M.; Dye, P.J.; Weiersbye, I.M.; Witkowski, E.T.F.; Ahmed, F. Review of commonly used remote sensing and ground-based technologies to measure plant water stress. Water SA 2009, 35, 741–752. [Google Scholar] [CrossRef] [Green Version]
- Clay, D.; Kim, K.-i.; Chang, J.; Clay, S.; Dalsted, K. Characterizing Water and Nitrogen Stress in Corn Using Remote Sensing. Agron. J. 2006, 98, 579–587. [Google Scholar] [CrossRef]
- Cohen, W.B. Response Of Vegetation Indices To Changes In Three Measures Of Leaf Water Stress. Photogramm. Eng. Remote Sens. 1991, 57, 195–202. [Google Scholar]
- Sepulcre-Cantó, G.; Zarco-Tejada, P.J.; Jiménez-Muñoz, J.C.; Sobrino, J.A.; de Miguel, E.; Villalobos, F.J. Detection of water stress in an olive orchard with thermal remote sensing imagery. Agric. For. Meteorol. 2006, 136, 31–44. [Google Scholar] [CrossRef]
- Gausman, H.W. Reflectance of leaf components. Remote Sens. Environ. 1977, 6, 1–9. [Google Scholar] [CrossRef]
- Ceccato, P.; Flasse, S.; Tarantola, S.; Jacquemoud, S.; Grégoire, J.-M. Detecting vegetation leaf water content using reflectance in the optical domain. Remote Sens. Environ. 2001, 77, 22–33. [Google Scholar] [CrossRef]
- Zhang, F.; Zhou, G. Estimation of vegetation water content using hyperspectral vegetation indices: A comparison of crop water indicators in response to water stress treatments for summer maize. BMC Ecol. 2019, 19, 12. [Google Scholar] [CrossRef] [Green Version]
- Coops, N.; Stone, C.; Culvenor, D.S.; Chisholm, L.A.; Merton, R.N. Chlorophyll content in eucalypt vegetation at the leaf and canopy scales as derived from high resolution spectral data. Tree Physiol. 2003, 23, 23–31. [Google Scholar] [CrossRef] [PubMed] [Green Version]
- Curran, P.J.; Dungan, J.L.; Gholz, H.L. Exploring the relationship between reflectance red edge and chlorophyll content in slash pine. Tree Physiol. 1990, 7, 33–48. [Google Scholar] [CrossRef] [PubMed]
- Stone, C.; Chisholm, L.; Coops, N. Spectral reflectance characteristics of eucalypt foliage damaged by insects. Aust. J. Bot. 2001, 49, 687–698. [Google Scholar] [CrossRef] [Green Version]
- Blackburn, G.A. Relationships between Spectral Reflectance and Pigment Concentrations in Stacks of Deciduous Broadleaves. Remote Sens. Environ. 1999, 70, 224–237. [Google Scholar] [CrossRef]
- Rouse, J.W.; Haas, R.H.; Schell, J.A.; Deering, D.W. Monitoring Vegetation Systems in the Great Plains with Erts. Nasa Spec. Publ. 1974, 351, 309–317. [Google Scholar]
- Lichtenthaler, H.K. Chlorophylls and Carotenoids: Pigments of Photosynthetic Biomembranes. Methods Enzymol. 1987, 148, 350–382. [Google Scholar] [CrossRef]
- Faurtyot, T.; Baret, F. Vegetation water and dry matter contents estimated from top-of-the-atmosphere reflectance data: A simulation study. Remote Sens. Environ. 1997, 61, 34–45. [Google Scholar] [CrossRef]
- Asner, G.P. Biophysical and Biochemical Sources of Variability in Canopy Reflectance. Remote Sens. Environ. 1998, 64, 234–253. [Google Scholar] [CrossRef]
- Coops, N.; Dury, S.; Smith, M.-L.; Martin, M.; Ollinger, S. Comparison of green leaf eucalypt spectra using spectral decomposition. Aust. J. Bot. 2002, 50, 567–576. [Google Scholar] [CrossRef]
- Curran, P.J.; Dungan, J.L.; Macler, B.A.; Plummer, S.E. The effect of a red leaf pigment on the relationship between red edge and chlorophyll concentration. Remote Sens. Environ. 1991, 35, 69–76. [Google Scholar] [CrossRef]
- Laskari, M.; Menexes, G.; Kalfas, I.; Gatzolis, I.; Dordas, C. Water Stress Effects on the Morphological, Physiological Characteristics of Maize (Zea mays L.), and on Environmental Cost. Agron. J. 2022, 12, 2386. [Google Scholar] [CrossRef]
- Eitel, J.U.H.; Gessler, P.E.; Smith, A.M.S.; Robberecht, R. Suitability of existing and novel spectral indices to remotely detect water stress in Populus spp. For. Ecol. Manag. 2006, 229, 170–182. [Google Scholar] [CrossRef]
- Fuchs, M. Infrared measurement of canopy temperature and detection of plant water stress. Theor. Appl. Climatol. 1990, 42, 253–261. [Google Scholar] [CrossRef]
- Kurihara, J.; Koo, V.-C.; Guey, C.W.; Lee, Y.P.; Abidin, H. Early Detection of Basal Stem Rot Disease in Oil Palm Tree Using Unmanned Aerial Vehicle-Based Hyperspectral Imaging. Remote Sens. 2022, 14, 10. [Google Scholar] [CrossRef]
- García-Tejero, I.F.; Gutiérrez-Gordillo, S.; Ortega-Arévalo, C.; Iglesias-Contreras, M.; Moreno, J.M.; Souza-Ferreira, L.; Durán-Zuazo, V.H. Thermal imaging to monitor the crop-water status in almonds by using the non-water stress baselines. Sci. Hortic. 2018, 238, 91–97. [Google Scholar] [CrossRef]
- Farooq, M.; Wahid, A.; Kobayashi, N.; Fujita, D.; Basra, S.M.A. Plant drought stress: Effects, mechanisms and management. J. Plant Physiol. 2009, 165, 133–151. [Google Scholar] [CrossRef] [Green Version]
- Pirzad, A.; Shakiba, M.R.; Zehtab-Salmasi, S.; Mohammadi, S.A.; Darvishzadeh, R.; Samadi, A. Effect of water stress on leaf relative water content, chlorophyll, proline and soluble carbohydrates in Matricaria chamomilla L. J. Med. Plants Res. 2011, 5, 2483–2488. [Google Scholar]
- Rolando, C.A.; Little, K.M. Using chlorophyll fluorescence to determine stress in Eucalyptus grandis seedlings. S. Afr. For. J. 2003, 197, 5–12. [Google Scholar] [CrossRef]
- Surendar, K.; Devi, D.; Ravi, I.; Jeyakumar, P.; Velayudham, K. Effect of Water Stress on Leaf Temperature, Transpiration Rate, Stomatal Diffusive Resistance and Yield of Banana. Plant Gene Trait. 2013, 4, 43–47. [Google Scholar] [CrossRef] [Green Version]
- Govindjee; Downton, W.J.S.; Fork, D.C.; Armond, P.A. Chlorophyll A fluorescence transient as an indicator of water potential of leaves. Plant Sci. Lett. 1981, 20, 191–194. [Google Scholar] [CrossRef]
- Lichtenthaler, H.K.; Buschmann, C.; Rinderle, U.; Schmuck, G. Application of chlorophyll fluorescence in ecophysiology. Radiat. Environ. Biophys. 1996, 25, 297–308. [Google Scholar] [CrossRef] [PubMed]
- Jordan, C.F. Derivation of Leaf-Area Index from Quality of Light on the Forest Floor. Ecology 1969, 50, 663–666. [Google Scholar] [CrossRef]
- Huete, A.R. A soil-adjusted vegetation index (SAVI). Remote Sens. Environ. 1988, 25, 295–309. [Google Scholar] [CrossRef]
- Huete, A.; Didan, K.; Miura, T.; Rodriguez, E.P.; Gao, X.; Ferreira, L.G. Overview of the radiometric and biophysical performance of the MODIS vegetation indices. Remote Sens. Environ. 2002, 83, 195–213. [Google Scholar] [CrossRef]
- Gabban, A.; San-Miguel-Ayanz, J.; Barbosa, P.; Libertà, G. Analysis of NOAA-AVHRR NDVI inter-annual variability for forest fire risk estimation. Int. J. Remote Sens. 2006, 27, 1725–1732. [Google Scholar] [CrossRef]
- Ghulam, A.; Qin, Q.; Zhan, Z. Designing of the perpendicular drought index. Environ. Geol. 2006, 52, 1045–1052. [Google Scholar] [CrossRef]
- Ghulam, A.; Qin, Q.; Teyip, T.; Li, Z. Modified perpendicular drought index (MPDI): A real-time drought monitoring method. ISPRS J. Photogramm. Remote Sens. 2007, 62, 150–164. [Google Scholar] [CrossRef]
- Hunt, E.R.; Rock, B.N.; Nobel, P.S. Measurement of leaf relative water content by infrared reflectance. Remote Sens. Environ. 1987, 22, 429–435. [Google Scholar] [CrossRef]
- Gao, B.-c. A normalized difference water index for remote sensing of vegetation liquid water from space—NDWI. Remote Sens. Environ. 1996, 58, 257–266. [Google Scholar] [CrossRef]
- Fensholt, R.; Sandholt, I. Derivation of a shortwave infrared water stress index from MODIS near- and shortwave infrared data in a semiarid environment. Remote Sens. Environ. 2003, 87, 111–121. [Google Scholar] [CrossRef]
- Maki, M.; Ishiahra, M.; Tamura, M. Estimation of leaf water status to monitor the risk of forest fires by using remotely sensed data. Remote Sens. Environ. 2004, 90, 441–450. [Google Scholar] [CrossRef]
- Jang, J.-D.; Viau, A.A.; Anctil, F. Thermal-water stress index from satellite images. Int. J. Remote Sens. 2006, 27, 1619–1639. [Google Scholar] [CrossRef]
- Gamon, J.A.; Peñuelas, J.; Field, C.B. A narrow-waveband spectral index that tracks diurnal changes in photosynthetic efficiency. Remote Sens. Environ. 1992, 41, 35–44. [Google Scholar] [CrossRef]
- Gitelson, A.A.; Kaufman, Y.J.; Merzlyak, M.N. Use of a green channel in remote sensing of global vegetation from EOS-MODIS. Remote Sens. Environ. 1996, 58, 289–298. [Google Scholar] [CrossRef]
- Carlson, T.N.; Ripley, D.A. On the relation between NDVI, fractional vegetation cover, and leaf area index. Remote Sens. Environ. 1997, 62, 241–252. [Google Scholar] [CrossRef]
- Gitelson, A.A.; Gritz, Y.; Merzlyak, M.N. Relationships between leaf chlorophyll content and spectral reflectance and algorithms for non-destructive chlorophyll assessment in higher plant leaves. J. Plant Physiol. 2003, 160, 271–282. [Google Scholar] [CrossRef]
- Gamon, J.; Serrano, L.; Surfus, J. The photochemical reflectance index: An optical indicator of photosynthetic radiation use efficiency across species, functional types, and nutrient levels. Oecologia 1997, 112, 492–501. [Google Scholar] [CrossRef]
- Sukhova, E.; Sukhov, V. Relation of Photochemical Reflectance Indices Based on Different Wavelengths to the Parameters of Light Reactions in Photosystems I and II in Pea Plants. Remote Sens. 2020, 12, 24. [Google Scholar] [CrossRef] [Green Version]
- Zhang, C.; Filella, I.; Garbulsky, M.F.; Peñuelas, J. Affecting Factors and Recent Improvements of the Photochemical Reflectance Index (PRI) for Remotely Sensing Foliar, Canopy and Ecosystemic Radiation-Use Efficiencies. Remote Sens. 2016, 8, 677. [Google Scholar] [CrossRef] [Green Version]
- Jackson, R.D.; Idso, S.B.; Reginato, R.J.; Pinter, P.J. Canopy temperature as a crop water stress indicator. Water Resour. Res. 1981, 17, 1133–1138. [Google Scholar] [CrossRef]
- Moran, M.S.; Clarke, T.R.; Inoue, Y.; Vidal, A. Estimating crop water deficit using the relation between surface-air temperature and spectral vegetation index. Remote Sens. Environ. 1994, 49, 246–263. [Google Scholar] [CrossRef]
- Carlson, T.N.; Gillies, R.R.; Perry, E.M. A method to make use of thermal infrared temperature and NDVI measurements to infer surface soil water content and fractional vegetation cover. Remote Sens. Rev. 1994, 52, 45–59. [Google Scholar] [CrossRef]
- Wang, P.-x.; Li, X.-w.; Gong, J.-y.; Song, C. Vegetation temperature condition index and its application for drought monitoring. In Proceedings of the Geoscience and Remote Sensing Symposium, Sydney, NSW, Australia, 9–13 July 2002. [Google Scholar]
- Sandholt, I.; Rasmussen, K.; Andersen, J. A simple interpretation of the surface temperature/vegetation index space for assessment of surface moisture status. Remote Sens. Environ. 2002, 79, 213–224. [Google Scholar] [CrossRef]
- Shakya, N.; Yamaguchi, Y. Vegetation, water and thermal stress index for study of drought in Nepal and central northeastern India. Int. J. Remote Sens. 2010, 31, 903–912. [Google Scholar] [CrossRef]
- Wu, M.; Lu, H. A modified vegetation water supply index (MVWSI) and its application in drought monitoring over Sichuan and Chongqing, China. J. Integr. Agric. 2016, 15, 2132–2141. [Google Scholar] [CrossRef]
- Amani, M.; Salehi, B.; Mahdavi, S.; Masjedi, A.; Dehnavi, S. Temperature-Vegetation-soil Moisture Dryness Index (TVMDI). Remote Sens. Environ. 2017, 197, 1–14. [Google Scholar] [CrossRef]
- Gitelson, A.A.; Merzlyak, M.N. Signature Analysis of Leaf Reflectance Spectra: Algorithm Development for Remote Sensing of Chlorophyll. J. Plant Physiol. 1996, 148, 494–500. [Google Scholar] [CrossRef]
- Zarco-Tejada, P.J.; Miller, J.R.; Mohammed, G.H.; Noland, T.L. Chlorophyll Fluorescence Effects on Vegetation Apparent Reflectance: I. Leaf-Level Measurements and Model Simulation. Remote Sens. Environ. 2000, 74, 582–595. [Google Scholar] [CrossRef]
- Gitelson, A.A.; Zur, Y.; Chivkunova, O.B.; Merzlyak, M.N. Assessing carotenoid content in plant leaves with reflectance spectroscopy. Plant Physiol. Biochem. 2002, 75, 272–281. [Google Scholar] [CrossRef]
- Datt, B. A New Reflectance Index for Remote Sensing of Chlorophyll Content in Higher Plants: Tests using Eucalyptus Leaves. J. Plant Physiol. 1999, 154, 30–36. [Google Scholar] [CrossRef]
- Peñuelas, J.; Gamon, J.A.; Fredeen, A.L.; Merino, J.; Field, C.B. Reflectance indices associated with physiological changes in nitrogen- and water-limited sunflower leaves. Remote Sens. Environ. 1994, 48, 135–146. [Google Scholar] [CrossRef]
- Musick, H.B.; Pelletier, R.E. Response to soil moisture of spectral indexes derived from bidirectional reflectance in thematic mapper wavebands. Remote Sens. Environ. 1988, 25, 167–184. [Google Scholar] [CrossRef]
- Hunt, E.R., Jr.; Rock, B.N. Detection of changes in leaf water content using near- and middle-infrared reflectances. Remote Sens. Environ. 1989, 30, 43–54. [Google Scholar] [CrossRef]
- Tucker, C.J. Remote sensing of leaf water content in the near infrared. Remote Sens. Environ. 1980, 10, 23–32. [Google Scholar] [CrossRef]
- Pu, R.; Ge, S.; Kelly, N.M.; Gong, P. Spectral absorption features as indicators of water status in coast live oak (Quercus agrifolia) leaves. Int. J. Remote Sens. 2003, 24, 1799–1810. [Google Scholar] [CrossRef]
- Jackson, T.J.; Chen, D.; Cosh, M.; Li, F.; Anderson, M.; Walthall, C.; Doriaswamy, P.; Hunt, E.R. Vegetation water content mapping using Landsat data derived normalized difference water index for corn and soybeans. Remote Sens. Environ. 2004, 92, 475–482. [Google Scholar] [CrossRef]
- Carroll, D.A.; Hansen, N.C.; Hopkins, B.G.; DeJonge, K.C. Leaf temperature of maize and Crop Water Stress Index with variable irrigation and nitrogen supply. Irrig. Sci. 2017, 35, 549–560. [Google Scholar] [CrossRef]
- Zhang, R.; Zhou, Y.; Yue, Z.; Chen, X.; Cao, X.; Ai, X.; Jiang, B.; Xing, Y. The leaf-air temperature difference reflects the variation in water status and photosynthesis of sorghum under waterlogged conditions. PLoS ONE 2019, 14, e0219209. [Google Scholar] [CrossRef] [Green Version]
- Jackson, R.D. Canopy Temperature and Crop Water Stress. Adv. Irrig. 1982, 1, 43–85. [Google Scholar] [CrossRef]
- Shahenshah; Isoda, A. Effects of Water Stress on Leaf Temperature and Chlorophyll Fluorescence Parameters in Cotton and Peanut. Plant Prod. Sci. 2010, 13, 269–278. [Google Scholar] [CrossRef]
- Netto, A.T.; Campostrini, E.; de Oliveira, J.G.; Bressan-Smith, R.E. Photosynthetic pigments, nitrogen, chlorophyll a fluorescence and SPAD-502 readings in coffee leaves. Sci. Hortic. 2005, 104, 199–209. [Google Scholar] [CrossRef]
- Ma, H.; Cui, T.; Cao, L. Monitoring of Drought Stress in Chinese Forests Based on Satellite Solar-Induced Chlorophyll Fluorescence and Multi-Source Remote Sensing Indices. Remote Sens. 2023, 15, 879. [Google Scholar] [CrossRef]
- Pandiyan, S.; Navaneethan, C.; Vijayan, R.; Gunasekaran, G.; Khan, K.Y.; Guo, Y. Evaluation of drought using satellite solar-induced chlorophyll fluorescence during crop development stage over Xinjiang, China. Measurement 2021, 187, 11032. [Google Scholar] [CrossRef]
- Kior, A.; Sukhov, V.; Sukhova, E. Application of Reflectance Indices for Remote Sensing of Plants and Revealing Actions of Stressors. Photonics 2021, 8, 27. [Google Scholar] [CrossRef]
- Maxwell, K.; Johnson, G.N. Chlorophyll fluorescence—A practical guide. J. Exp. Bot. 2000, 51, 659–668. [Google Scholar] [CrossRef] [PubMed]
- Millard, J.P.; Jackson, R.D.; Goettelman, R.C.; Reginato, R.J.; Idso, S.B. Crop water-stress assessment using an airborne thermal scanner. Photogramm. Eng. Remote Sens. 1978, 44, 77–85. [Google Scholar]
- Goillot, C.C. Airborne thermography or infrared remote sensing. Bibl. Radiol. 1975, 6, 237–248. [Google Scholar]
- Katimbo, A.; Rudnick, D.R.; DeJonge, K.C.; Lo, T.H.; Qiao, X.; Franz, T.E.; Nakabuye, H.N.; Duan, J. Crop water stress index computation approaches and their sensitivity to soil water dynamics. Agric. Water Manag. 2022, 266, 107575. [Google Scholar] [CrossRef]
- Burrows, N.; Baker, P.; Harper, R.; Silberstein, R. A report on Silvicultural Guidelines 2033 Forest Management Plan for the Western Australian Department of Biodiversity, Conservation and Attractions. Available online: https://www.dbca.wa.gov.au/sites/default/files/2022-10/Independent%20Silviculture%20Review%20Panel%20Report%20May%202022.pdf (accessed on 18 November 2022).
- Gavinet, J.; Ourcival, J.M.; Gauzere, J.; De Jalón, L.G.; Limousin, J.M. Drought mitigation by thinning; Benefits from the stem to the stand along 15 years of experimental rainfall exclusion in a holm oak coppice. For. Ecol. Manag. 2020, 473, 10. [Google Scholar] [CrossRef]
- Liu, N.; Harper, R.J.; Smettem, K.R.J.; Dell, B.; Liu, S. Responses of streamflow to vegetation and climate change in southwestern Australia. J. Hydrol. 2019, 572, 761–770. [Google Scholar] [CrossRef]
- Yu, P.; Zhou, T.; Luo, H.; Liu, X.; Shi, P.; Zhao, X.; Xiao, Z.; Zhang, Y.; Zhou, P. Interannual variation of gross primary production detected from optimal convolutional neural network at multi-timescale water stress. Remote Sens. Ecol. Conserv. 2022, 8, 409–425. [Google Scholar] [CrossRef]
- Sang, Z.; Hamann, A. Climatic limiting factors of North American ecosystems: A remote-sensing based vulnerability analysis. Environ. Res. Lett. 2022, 17, 094011. [Google Scholar] [CrossRef]
- Lyons, D.S.; Dobrowski, S.Z.; Holden, Z.A.; Maneta, M.P.; Sala, A. Soil moisture variation drives canopy water content dynamics across the western US. Remote Sens. Environ. 2020, 253, 112233. [Google Scholar] [CrossRef]
- Ji, Y.; Li, Y.; Yao, N.; Biswas, A.; Zou, Y.; Meng, Q.; Liu, F. The lagged effect and impact of soil moisture drought on terrestrial ecosystem water use efficiency. Ecol. Indic. 2021, 133, 108349. [Google Scholar] [CrossRef]
- Przeździecki, K.; Zawadzki, J.J.; Urbaniak, M.; Ziemblińska, K.; Miatkowski, Z. Using temporal variability of land surface temperature and normalized vegetation index to estimate soil moisture condition on forest areas by means of remote sensing. Ecol. Indic. 2023, 148, 110088. [Google Scholar] [CrossRef]
- Ghasempour, R.; Aalami, M.T.; Kirca, V.S.O.; Roushangar, K. Remote sensing-based drought severity modeling and mapping using multiscale intelligence methods. Stoch. Environ. Res. Risk Assess. 2023, 37, 889–902. [Google Scholar] [CrossRef]
- Korner, C. Humidity responses in forest trees: Precautions in thermal scanning surveys. Arch. Meteorol. Geophys. Bioclimatol. B 1985, 36, 83–96. [Google Scholar] [CrossRef]
- Spencer, R.D. Large-scale aerial photo comparison for detecting pine dieback. Aust. For. 1985, 48, 102–108. [Google Scholar] [CrossRef]
- Running, S.W.; Nemani, R.R. Relating seasonal patterns of the AVHRR vegetation index to simulated photosynthesis and transpiration of forests in different climates. Remote Sens. Environ. 1988, 24, 347–367. [Google Scholar] [CrossRef]
- Pierce, L.L.; Running, S.W.; Riggs, G.A. Remote detection of canopy water stress in coniferous forests using the NS001 thematic mapper simulator and the thermal infrared multispectral scanner. PE&RS Photogramm. Eng. Remote Sens. 1990, 56, 579–586. [Google Scholar]
- Cohen, W.B. Temporal versus spatial variation in leaf reflectance under changing water stress conditions. Int. J. Remote Sens. 1991, 12, 1865–1876. [Google Scholar] [CrossRef]
- Riggs, G.A.; Running, S.W. Detection Of Canopy Water-Stress In Conifers Using The Airborne Imaging Spectrometer. Remote Sens. Environ. 1991, 35, 51–68. [Google Scholar] [CrossRef]
- Kalluri, S.N.V.; Doraiswamy, P. Modeling transpiration and water stress in vegetation from satellite and ground measurements. In Proceedings of the 1995 International Geoscience and Remote Sensing Symposium (IGARSS 95), Florence, Italy, 10–14 July 1995; pp. 1483–1487. [Google Scholar]
- Vidal, A.; Devauxros, C. Evaluating Forest-Fire Hazard With A Landsat Tm Derived Water-Stress Index. Agric. For. Meteorol. 1995, 77, 207–224. [Google Scholar] [CrossRef]
- Gunther, K.P.; Dahn, H.G.; Ludeker, W. Remote-Sensing Vegetation Status By Laser-Induced Fluorescence. Remote Sens. Environ. 1994, 47, 10–17. [Google Scholar] [CrossRef]
- Valentini, R.; Cecchi, G.; Mazzinghi, P.; Mugnozza, G.S.; Agati, G.; Bazzani, M.; Deangelis, P.; Fusi, F.; Matteucci, G.; Raimondi, V. Remote-sensing of chlorophyll-a fluorescence of vegetation canopies.2. Physiological significance of fluorescence signal in response to environmental stresses. Remote Sens. Environ. 1994, 47, 29–35. [Google Scholar] [CrossRef]
- Buschmann, C.; Schweiger, J.; Lichtenthaler, H.K.; Richter, P. Application of the Karlsruhe CCD-OMA LIDAR-fluorosensor in stress detection of plants. J. Plant Physiol. 1996, 148, 548–554. [Google Scholar] [CrossRef]
- Lichtenthaler, H.K.; Subhash, N.; Wenzel, O.; Miehe, J.A.; IEEE. Laser-induced imaging of blue/red and blue/far-red fluorescence ratios, F440/F690 and F440/F740, as a means of early stress detection in plants. In Proceedings of the 1997 International Geoscience and Remote Sensing Symposium (IGARSS 97) on Remote Sensing—A Scientific Vision for Sustainable Development, Singapore, 3–8 August 1997; pp. 1799–1801. [Google Scholar]
- Illera, P.; Delgado, J.A.; Unzueta, A.F.; Manso, A.A.F. Integration of NOAA-AVHRR and meteorological data in a GIS—Application for vegetation monitoring in Castilla y Leon, Spain. In Proceedings of the 19th EARSeL Symposium on Remote Sensing in the 21st Century, Valladolid, Spain, 31 May–2 June 1999; pp. 47–54. [Google Scholar]
- Illera, P.; Fernandez, A.; Calle, A. Operational forest fire danger indices derived from NOAA images. In Remote Sensing’96: Integrated Applications for Risk Assessment and Disaster Prevention for the Mediterranean: Proceedings of the 16th EARSel Symposium on Integrated Applications for Risk Assessment and Disaster Prevention for the Mediterranean, Malta, 20–23 May 1996; A A Balkema Publishers: London, UK, 1997; pp. 319–325. [Google Scholar]
- Illera, P.; Fernandez, A.; Delgado, J.A. Temporal evolution of the NDVI as an indicator of forest fire danger. Int. J. Remote Sens. 1996, 17, 1093–1105. [Google Scholar] [CrossRef]
- Karlikowski, T.; Dabrowska-Zieliska, K.; Zawila-Niedzwiecki, T.; Gruszczynska, M.; Santorski, Z.; Sakowska, H.; Janowska, M. The use of NOAA-AVHRR images for forest fire risk assessment. Pr. Inst. Badaw. Lesn. 1997, 72, 72. [Google Scholar]
- Deshayes, M.; Guyon, D.; Jeanjean, H.; Stach, N.; Jolly, A.; Hagolle, O. The contribution of remote sensing to the assessment of drought effects in forest ecosystems. Ann. For. Sci. 2006, 63, 579–595. [Google Scholar] [CrossRef] [Green Version]
- Penuelas, J.; Llusia, J.; Pinol, J.; Filella, I. Photochemical reflectance index and leaf photosynthetic radiation-use-efficiency assessment in Mediterranean trees. Int. J. Remote Sens. 1997, 18, 2863–2868. [Google Scholar] [CrossRef]
- Penuelas, J.; Pinol, J.; Ogaya, R.; Filella, I. Estimation of plant water concentration by the reflectance water index WI (R900/R970). Int. J. Remote Sens. 1997, 18, 2869–2875. [Google Scholar] [CrossRef]
- Asner, G.P.; Nepstad, D.; Cardinot, G.; Ray, D. Drought stress and carbon uptake in an Amazon forest measured with spaceborne imaging spectroscopy. Proc. Natl. Acad. Sci. USA 2004, 101, 6039–6044. [Google Scholar] [CrossRef] [Green Version]
- Harding, L.W.; Miller, W.D.; Swift, R.N.; Wright, C.W. Aircraft Remote Sensing. In Encyclopedia of Ocean Sciences, 2nd ed.; Academic Press: Cambridge, MA, USA, 2001; pp. 138–146. [Google Scholar]
- Gobron, N.; Pinty, B.; Mélin, F.; Taberner, M.; Verstraete, M.M.; Belward, A.; Lavergne, T.; Widlowski, L. The state of vegetation in Europe following the 2003 drought. Int. J. Remote Sens. 2005, 26, 2013–2020. [Google Scholar] [CrossRef]
- Gonzalez-Alonso, F.; Merino-de-Miguel, S.; Cuevas, J.M.; Roldan-Zamarron, A.; Garcia-Gigorro, S.; Calle, A.; Casanova, J.L.; Romo, A. Previous Drought Conditions and Losses Produced at the Valencia de Alcantara Forest Fire in August 2003. In New strategies for European Remote Sensing, Proceedings of the 24th Symposium of the European Association of Remote Sensing Laboratories, Dubrovnik, Croatia, 25–27 May 2004; Millpress Science: Rotterdam, The Netherlands, 2005; pp. 95–99. [Google Scholar]
- Leblon, B. Monitoring forest fire danger with remote sensing. Nat. Hazards 2005, 35, 343–359. [Google Scholar] [CrossRef]
- Reichstein, M.; Ciais, P.; Papale, D.; Valentini, R.; Running, S.; Viovy, N.; Cramer, W.; Granier, A.; Ogee, J.; Allard, V.; et al. Reduction of ecosystem productivity and respiration during the European summer 2003 climate anomaly: A joint flux tower, remote sensing and modelling analysis. Glob. Change Biol. 2007, 13, 634–651. [Google Scholar] [CrossRef]
- Gouveia, C.; Trigo, R.M.; DaCamara, C.C. Drought and vegetation stress monitoring in Portugal using satellite data. Nat. Hazards Earth Syst. Sci. 2009, 9, 185–195. [Google Scholar] [CrossRef] [Green Version]
- Wang, C.; Lu, Z.; Haithcoat, T.L. Using Landsat images to detect oak decline in the Mark Twain National Forest, Ozark Highlands. For. Ecol. Manag. 2007, 240, 70–78. [Google Scholar] [CrossRef]
- Lu, X.; Zhuang, Q. Evaluating evapotranspiration and water-use efficiency of terrestrial ecosystems in the conterminous United States using MODIS and AmeriFlux data. Remote Sens. Environ. 2010, 114, 1924–1939. [Google Scholar] [CrossRef]
- Wang, L.; Luo, Y.Q.; Huang, H.G.; Shi, J.; Keliövaara, K.; Teng, W.X.; Qi, G.X. Reflectance features of water stressed Larix gmelinii needles. For. Stud. China 2009, 11, 28–33. [Google Scholar] [CrossRef]
- Jiang, Z.; Li, L.; Ustin, S.L. Estimation of canopy water content with MODIS spectral index. In Proceedings of the SPIE—The International Society for Optical Engineering, San Diego, CA, USA, 3–4 August 2009. [Google Scholar]
- Goerner, A.; Reichstein, M.; Rambal, S. Tracking seasonal drought effects on ecosystem light use efficiency with satellite-based PRI in a Mediterranean forest. Remote Sens. Environ. 2009, 113, 1101–1111. [Google Scholar] [CrossRef]
- Moreno, A.; Maselli, F.; Gilabert, M.A.; Chiesi, M.; Martinez, B.; Seufert, G. Assessment of MODIS imagery to track light-use efficiency in a water-limited Mediterranean pine forest. Remote Sens. Environ. 2012, 123, 359–367. [Google Scholar] [CrossRef]
- Gilabert, M.A.; Moreno, A.; Maselli, F.; Chiesi, M.; Martinez, B.; Seufert, G.; Melia, J. Tracking Seasonal Drought Effects On Ecosystem Light Use Efficiency In A Mediterranean Forest Using Climatic And Remote Sensing Data. In Proceedings of the IEEE International Geoscience and Remote Sensing Symposium (IGARSS), Munich, Germany, 22–27 July 2012; pp. 1147–1150. [Google Scholar]
- Ishimura, A.; Shimizu, Y.; Rahimzadeh-Bajgiran, P.; Omasa, K. Remote sensing of Japanese beech forest decline using an improved Temperature Vegetation Dryness Index (iTVDI). IForest 2011, 4, 195–199. [Google Scholar] [CrossRef] [Green Version]
- Byer, S.; Jin, Y. Detecting Drought-Induced Tree Mortality in Sierra Nevada Forests with Time Series of Satellite Data. Remote Sens. 2017, 9, 929. [Google Scholar] [CrossRef] [Green Version]
- Brouwers, N.C.; van Dongen, R.; Matusick, G.; Coops, N.C.; Strelein, G.; Hardy, G. Inferring drought and heat sensitivity across a Mediterranean forest region in southwest Western Australia: A comparison of approaches. Forestry 2015, 88, 454–464. [Google Scholar] [CrossRef] [Green Version]
- Luo, H.; Zhou, T.; Wu, H.; Zhao, X.; Wang, Q.; Gao, S.; Li, Z. Contrasting Responses of Planted and Natural Forests to Drought Intensity in Yunnan, China. Remote Sens. 2016, 8, 635. [Google Scholar] [CrossRef] [Green Version]
- Lee, J.E.; Frankenberg, C.; Tol, C.v.d.; Berry, J.A.; Guanter, L.; Boyce, C.K.; Fisher, J.B.; Morrow, E.; Worden, J.R.; Asefi, S.; et al. Forest productivity and water stress in Amazonia: Observations from GOSAT chlorophyll fluorescence. Proc. R. Soc. B Biol. Sci. 2013, 280, 20130171. [Google Scholar] [CrossRef] [Green Version]
- Stone, C.; Penman, T.; Turner, R. Managing drought-induced mortality in Pinus radiata plantations under climate change conditions: A local approach using digital camera data. For. Ecol. Manag. 2012, 265, 94–101. [Google Scholar] [CrossRef]
- Buddenbaum, H.; Hientgen, J.; Dotzler, S.; Werner, W.; Hill, J. A BiomeBGC-based evaluation of dryness stress of central European forests. Int. Arch. Photogramm. Remote Sens. Spat. Inf. Sci. 2015, XL-7/W3, 345–351. Available online: https://isprs-archives.copernicus.org/articles/XL-7-W3/345/2015/ (accessed on 18 November 2022). [CrossRef] [Green Version]
- Su, B.; Xue, J.; Xie, C.; Fang, Y.; Song, Y.; Fuentes, S. Digital surface model applied to unmanned aerial vehicle based photogrammetry to assess potential biotic or abiotic effects on grapevine canopies. Int. J. Agric. Biol. Eng. 2016, 9, 119–130. [Google Scholar] [CrossRef]
- Ludovisi, R.; Tauro, F.; Salvati, R.; Khoury, S.; Mugnozza, G.S.; Harfouche, A. UAV-Based Thermal Imaging for High-Throughput Field Phenotyping of Black Poplar Response to Drought. Front. Plant Sci. 2017, 8, 1681. [Google Scholar] [CrossRef]
- Gomez-Candon, D.; Virlet, N.; Labbe, S.; Jolivot, A.; Regnard, J.L. Field phenotyping of water stress at tree scale by UAV-sensed imagery: New insights for thermal acquisition and calibration. Precis. Agric. 2016, 17, 786–800. [Google Scholar] [CrossRef]
- Steele-Dunne, S.C.; Friesen, J.; van de Giesen, N. Using Diurnal Variation in Backscatter to Detect Vegetation Water Stress. Ieee Trans. Geosci. Remote Sens. 2012, 50, 2618–2629. [Google Scholar] [CrossRef]
- Konings, A.G.; Yu, Y.; Xu, L.; Yang, Y.; Schimel, D.S.; Saatchi, S.S. Active microwave observations of diurnal and seasonal variations of canopy water content across the humid African tropical forests. Geophys. Res. Lett. 2017, 44, 2290–2299. [Google Scholar] [CrossRef]
- Vreugdenhil, M.; Greimeister-Pfeil, I.; Preimesberger, W.; Camici, S.; Dorigo, W.; Enenkel, M.; van der Schalie, R.; Steele-Dunne, S.; Wagner, W. Microwave remote sensing for agricultural drought monitoring: Recent developments and challenges. Front. Water 2022, 4. Available online: https://www.frontiersin.org/journals/water/articles/10.3389/frwa.2022.1045451/full (accessed on 18 November 2022). [CrossRef]
- Sun, S.; Sun, G.; Caldwell, P.; McNulty, S.G.; Cohen, E.; Xiao, J.; Zhang, Y. Drought impacts on ecosystem functions of the U.S. National Forests and Grasslands: Part I evaluation of a water and carbon balance model. For. Ecol. Manag. 2015, 353, 260–268. [Google Scholar] [CrossRef] [Green Version]
- Nydick, K.R.; Stephenson, N.L.; Ambrose, A.R.; Asner, G.P.; Baxter, W.L.; Das, A.J.; Dawson, T.; Martin, R.E.; Paz-Kagan, T. Leaf to landscape responses of giant sequoia to hotter drought: An introduction and synthesis for the special section. For. Ecol. Manag. 2018, 419, 249–256. [Google Scholar] [CrossRef]
- Martin, R.E.; Asner, G.P.; Francis, E.; Ambrose, A.; Baxter, W.; Das, A.J.; Vaughn, N.R.; Paz-Kagan, T.; Dawson, T.; Nydick, K.; et al. Remote measurement of canopy water content in giant sequoias (Sequoiadendron giganteum) during drought. For. Ecol. Manag. 2018, 419, 279–290. [Google Scholar] [CrossRef]
- Paz-Kagan, T.; Asner, G.P. Drivers of woody canopy water content responses to drought in a Mediterranean-type ecosystem. Ecol. Appl. 2017, 27, 2220–2233. [Google Scholar] [CrossRef]
- Miranda, A.; Lara, A.; Altamirano, A.; Di Bella, C.; González, M.E.; Julio Camarero, J. Forest browning trends in response to drought in a highly threatened mediterranean landscape of South America. Ecol. Indic. 2020, 115, 106401. [Google Scholar] [CrossRef]
- Qi, Y.; Zeng, Z.C. Weak Response of Vegetation Photosynthesis to Meteorological Droughts in Southwest China: Insights from Gome-2 Solar-Induced Fluorescence. In Proceedings of the International Geoscience and Remote Sensing Symposium (IGARSS), Waikoloa, HI, USA, 26 September–2 October 2020; pp. 4995–4998. [Google Scholar]
- Schuldt, B.; Buras, A.; Arend, M.; Vitasse, Y.; Beierkuhnlein, C.; Damm, A.; Gharun, M.; Grams, T.E.E.; Hauck, M.; Hajek, P.; et al. A first assessment of the impact of the extreme 2018 summer drought on Central European forests. Basic Appl. Ecol. 2020, 45, 86–103. [Google Scholar] [CrossRef]
- Sturm, J.; Santos, M.J.; Schmid, B.; Damm, A. Satellite data reveal differential responses of Swiss forests to unprecedented 2018 drought. Glob. Change Biol. 2022, 28, 2956–2978. [Google Scholar] [CrossRef] [PubMed]
- Avetisyan, D. A satellite-based modified plant senescence reflectance index for green-water drought monitoring. In Proceedings of the SPIE—The International Society for Optical Engineering, Online, 13–17 September 2021. [Google Scholar]
- Merzlyak, M.N.; Gitelson, A.A.; Chivkunova, O.B.; Rakitin, V.Y. Non-destructive optical detection of pigment changes during leaf senescence and fruit ripening. Physiol. Plant. 1999, 106, 135–141. [Google Scholar] [CrossRef] [Green Version]
- Masiello, G.; Ripullone, F.; De Feis, I.; Rita, A.; Saulino, L.; Pasquariello, P.; Cersosimo, A.; Venafra, S.; Serio, C. The IASI Water Deficit Index to Monitor Vegetation Stress and Early Drying in Summer Heatwaves: An Application to Southern Italy. Land 2022, 11, 1366. [Google Scholar] [CrossRef]
- Fuentes, S.; Tongson, E.; Viejo, C.G. Urban green infrastructure monitoring using remote sensing from integrated visible and thermal infrared cameras mounted on a moving vehicle. Sensors 2021, 21, 295. [Google Scholar] [CrossRef]
- Zeng, Y.; Chen, M.; Hao, D.; Damm, A.; Badgley, G.; Rascher, U.; Johnson, J.E.; Dechant, B.; Siegmann, B.; Ryu, Y.; et al. Combining near-infrared radiance of vegetation and fluorescence spectroscopy to detect effects of abiotic changes and stresses. Remote Sens. Environ. 2022, 270, 112856. [Google Scholar] [CrossRef]
- Cao, Y.X.; Huang, Z.; Xu, X.J.; Chen, S.; Wang, Z.; Feng, H.; Yu, Q.; He, J.Q. Responses of solar-induced chlorophyll fluorescence to meteorological drought across the Loess Plateau, China. Chin. J. Appl. Ecol. 2022, 33, 457–466. [Google Scholar] [CrossRef]
- Dotzler, S.; Hill, J.; Buddenbaum, H.; Stoffels, J. The Potential of EnMAP and Sentinel-2 Data for Detecting Drought Stress Phenomena in Deciduous Forest Communities. Remote Sens. 2015, 7, 14227–14258. [Google Scholar] [CrossRef] [Green Version]
- Moreno, A.; Maselli, F.; Chiesi, M.; Genesio, L.; Vaccari, F.; Seufert, G.; Gilabert, M.A. Monitoring water stress in Mediterranean semi-natural vegetation with satellite and meteorological data. Int. J. Appl. Earth Obs. Geoinf. 2014, 26, 246–255. [Google Scholar] [CrossRef]
- Zhang, L.; Jiao, W.; Zhang, H.; Huang, C.; Tong, Q. Studying drought phenomena in the Continental United States in 2011 and 2012 using various drought indices. Remote Sens. Environ. 2017, 190, 96–106. [Google Scholar] [CrossRef]
- Vacchiano, G.; Garbarino, M.; Mondino, E.B.; Motta, R. Evidences of drought stress as a predisposing factor to Scots pine decline in Valle d’Aosta (Italy). Eur. J. For. Res. 2012, 131, 989–1000. [Google Scholar] [CrossRef]
- Chakraborty, T.; Sarkar, S.K.; Morshed, M.M. Big data and remote sensing for multi-decadal drought impact assessment on Shorea robusta. Theor. Appl. Climatol. 2022, 148, 1587–1602. [Google Scholar] [CrossRef]
- Ciezkowski, W.; Szporak-Wasilewska, S.; Kleniewska, M.; Jozwiak, J.; Gnatowski, T.; Dabrowski, P.; Goraj, M.; Szatylowicz, J.; Ignar, S.; Chormanski, J. Remotely Sensed Land Surface Temperature-Based Water Stress Index for Wetland Habitats. Remote Sens. 2020, 12, 631. [Google Scholar] [CrossRef] [Green Version]
- Drake, P.L.; Callow, N.J.; Leopold, M.; Pires, R.N.; Veneklaas, E.J. Thermal imagery of woodland tree canopies provides new insights into drought-induced tree mortality. Sci. Total. Environ. 2022, 834, 155395. [Google Scholar] [CrossRef]
- Farhani, N.; Carreau, J.; Kassouk, Z.; Le Page, M.; Lili Chabaane, Z.; Boulet, G. Analysis of Multispectral Drought Indices in Central Tunisia. Remote Sens. 2022, 14, 1813. [Google Scholar] [CrossRef]
- Springgay, E.; Ramirez, S.C.; Janzen, S.; Brito, V.V. The Forest–Water Nexus: An International Perspective. Forests 2019, 10, 915. [Google Scholar] [CrossRef] [Green Version]
- Harper, R.; Smettem, K.R.J.; Ruprecht, J.K.; Dell, B.; Liu, N. Forest-water interactions in the changing environment of south-western Australia. Ann. For. Sci. 2019, 76, 95. [Google Scholar] [CrossRef]
- Thammanu, S.; Marod, D.; Han, H.; Narayan Bhusal, L.A.; Ketdee, P.; Gaewsingha, N.; Lee, S. The influence of environmental factors on species composition and distribution in a community forest in Northern Thailand. J. For. Res. 2021, 32, 649–662. [Google Scholar] [CrossRef]
- Wu, Z.; Yin, H.; He, H.; Li, Y. Dynamic-LSTM hybrid models to improve seasonal drought predictions over China. J. Hydrol. 2022, 615, 128706. [Google Scholar] [CrossRef]
- Feng, P.; Wang, B.; Luo, J.-J.; Liu, D.L.; Waters, C.; Ji, F.; Ruan, H.; Xiao, D.; Shi, L.; Yu, Q. Using large-scale climate drivers to forecast meteorological drought condition in growing season across the Australian wheatbelt. Sci. Total. Environ. 2020, 724, 138162. [Google Scholar] [CrossRef]
- Valeriano, C.; Gazol, A.; Colangelo, M.; González de Andrés, E.; Camarero, J.J. Modeling Climate Impacts on Tree Growth to Assess Tree Vulnerability to Drought During Forest Dieback. Front. Plant Sci. 2021, 12. Available online: https://www.frontiersin.org/articles/10.3389/fpls.2021.672855/full (accessed on 18 November 2022). [CrossRef]
- Uddin, J.; Li, Y.; Sattar, A.; Mistry, S. Climatic water balance forecasting with machine learning and deep learning models over Bangladesh. Int. J. Climatol. 2022, 42, 10083–10106. [Google Scholar] [CrossRef]
- Avetisyan, D.; Borisova, D.; Velizarova, E. Integrated Evaluation of Vegetation Drought Stress through Satellite Remote Sensing. Forests 2021, 12, 974. [Google Scholar] [CrossRef]


| Vegetation Index | Formula | Reference |
|---|---|---|
| Typical Vegetation Indices | ||
| Simple Ratio Index (SR) | [69] | |
| Normalised Difference Vegetation Index (NDVI) | [52] | |
| Soil-adjusted Vegetation Index (SAVI) | [70] | |
| Enhanced Vegetation Index (EVI) | [71] | |
| Dynamic Relative Greenness Index (DRGI) | [72] | |
| Perpendicular Drought Index (PDI) | [73] | |
| Modified Perpendicular Drought Index (MPDI) | [74] | |
| Water Vegetation Indices | ||
| Leaf Water Content Index (LWCI) | [75] | |
| Normalised Difference Water Index (NDWI) | [76] | |
| Moisture Stress Index (MSI) | [46] | |
| Shortwave Infrared Water Stress Index (SIWSI) | [77] | |
| Vegetation Dryness Index (VDI) | [78] | |
| Normalised Moisture Index (NMI) | [79] | |
| Pigment Vegetation Indices | ||
| Photochemical Reflectance Index (PRI) | [80] | |
| ”Green” NDVI | [81] | |
| Normalised Difference Red-Edge index (NDRE) | [82] | |
| Chlorophyll Index (CI) | [83] | |
| Modified Photochemical Reflectance Index (PRIm) | m = 531, 515, 525, 535, 545 nm | [84,85] |
m = 512, 515, 551, 555, 602, 645, 667, 668 nm | [86] | |
| Temperature Vegetation Indices | ||
| Crop Water Stress Index (CWSI) | [87] | |
| Water Deficit Index (WDI) | [88] | |
| Vegetation Water Supply Index (VWSI) | [89] | |
| Vegetation Temperature Condition Index (VTCI) | [90] | |
| Temperature Vegetation Dryness Index (TVDI) | [91] | |
| Vegetation Water Temperature Condition Index (VWTCI) | [92] | |
| Modified Vegetation Water Supply Index (VWSI) | [93] | |
| Temperature Vegetation Soil Moisture Dryness Index (TVMDI) | [94] | |
| Temperature Vegetation Water Stress Index (TVWSI) | [38] | |
Disclaimer/Publisher’s Note: The statements, opinions and data contained in all publications are solely those of the individual author(s) and contributor(s) and not of MDPI and/or the editor(s). MDPI and/or the editor(s) disclaim responsibility for any injury to people or property resulting from any ideas, methods, instructions or products referred to in the content. |
© 2023 by the authors. Licensee MDPI, Basel, Switzerland. This article is an open access article distributed under the terms and conditions of the Creative Commons Attribution (CC BY) license (https://creativecommons.org/licenses/by/4.0/).
Share and Cite
Le, T.S.; Harper, R.; Dell, B. Application of Remote Sensing in Detecting and Monitoring Water Stress in Forests. Remote Sens. 2023, 15, 3360. https://doi.org/10.3390/rs15133360
Le TS, Harper R, Dell B. Application of Remote Sensing in Detecting and Monitoring Water Stress in Forests. Remote Sensing. 2023; 15(13):3360. https://doi.org/10.3390/rs15133360
Chicago/Turabian StyleLe, Thai Son, Richard Harper, and Bernard Dell. 2023. "Application of Remote Sensing in Detecting and Monitoring Water Stress in Forests" Remote Sensing 15, no. 13: 3360. https://doi.org/10.3390/rs15133360