Article

Semi-Supervised Person Detection in Aerial Images with Instance Segmentation and Maximum Mean Discrepancy Distance

1
School of Electronics and Information, Northwestern Polytechnical University, Xi’an 710072, China
2
College of Mathematics and Computer Science, Yan’an University, Yan’an 716000, China
*
Author to whom correspondence should be addressed.
Remote Sens. 2023, 15(11), 2928; https://doi.org/10.3390/rs15112928
Submission received: 17 April 2023 / Revised: 26 May 2023 / Accepted: 1 June 2023 / Published: 4 June 2023
(This article belongs to the Special Issue Active Learning Methods for Remote Sensing Data Processing)

Abstract

:
Detecting sparse, small, lost persons with only a few pixels in high-resolution aerial images was, is, and remains an important and difficult mission, in which a vital role is played by accurate monitoring and intelligent co-rescuing for the search and rescue (SaR) system. However, many problems have not been effectively solved in existing remote-vision-based SaR systems, such as the shortage of person samples in SaR scenarios and the low tolerance of small objects for bounding boxes. To address these issues, a copy-paste mechanism (ISCP) with semi-supervised object detection (SSOD) via instance segmentation and maximum mean discrepancy distance is proposed (MMD), which can provide highly robust, multi-task, and efficient aerial-based person detection for the prototype SaR system. Specifically, numerous pseudo-labels are obtained by accurately segmenting the instances of synthetic ISCP samples to obtain their boundaries. The SSOD trainer then uses soft weights to balance the prediction entropy of the loss function between the ground truth and unreliable labels. Moreover, a novel evaluation metric MMD for anchor-based detectors is proposed to elegantly compute the IoU of the bounding boxes. Extensive experiments and ablation studies on Heridal and optimized public datasets demonstrate that our approach is effective and achieves state-of-the-art person detection performance in aerial images.

1. Introduction

Search and rescue (SaR) of survivors involves a race against time, which is of great significance to the construction of aerial SaR systems. The traditional method puts both pending rescuers and SaR workers in danger because of bad terrain and inefficient rescue measures. Unmanned aerial vehicles (UAVs) can provide immediate situational awareness over large areas. This makes SaR operations much cheaper and safer by reducing the time and number of rescuers needed in emergencies. In recent years, SaR missions based on drones, which allow for quick aerial views of huge regions with potentially difficult-to-reach terrain, have been developed in many countries [1,2,3,4]. While object detection as a crucial SaR mission step has advanced somewhat, it is still far from meeting the technical requirements for ground application, which may warrant further research.
In recent years, aerial-based person detection (APD) has gradually become a hot and challenging research topic in the field of low-altitude remote sensing. Researchers have attempted to create datasets of persons in aerial images and have obtained some promising results by utilizing existing creative object detection algorithms based on natural images. However, the results have been weak and lack robustness [5,6,7,8]. Compared to remote sensing objects [9,10,11,12,13,14,15], such as ships, vehicles, and airplanes, persons in aerial images are frequently costly to identify in SaR scenes, difficult to label manually, have fewer available datasets, and have multi-view shooting features that vary greatly. As a result, detecting persons is more difficult and prevents implementation of applications. The key step in APD is to collect a sufficient number of clear drone-based person objects and labeled instances, also addressing the issue of the person’s weak features and sparse distribution in high-resolution aerial images. Existing methods present a range of problems which urgently need to be solved, which are discussed below.
To tackle the few-shot problem, some popular approaches aim to get enough pseudo-labels through semi-supervised learning, which can effectively improve the performance of the anchor-based object detector. Since there are not many person labels in SaR scenes, the detector needs to be trained on unlabeled data that was generated by synthetic or online techniques. Several studies have used transfer learning [16] and active learning [17] to achieve high-accuracy results with less training data, using consistency-based and pseudo-label-based methods. First, [18] used unlabeled data to learn the model’s consistency, while [19] created fake labels to enable model training. The authors of [20] proposed a consistency-based semi-supervised object detection (CSD) method that can work on both single-stage and two-stage detectors by flipping the unlabeled samples horizontally and feeding them into the feature map of the detector network to calculate the consistency loss at the corresponding position. In [21], hard pseudo-labels were used for self-training and incorporated consistent regularization as a data augmentation principle into the training. The authors of [22] devised the co-rectify scheme, which involved training two models to check and correct each other’s pseudo-labels, which stopped false predictions from increasing and improved model accuracy by obtaining pseudo-labels online. In [23] the average RPN score of the proposal was used, which was identified through multi-stage learning, as a measure of uncertainty at the image level to make pseudo-labels and solve the problem of label noise overfitting caused by direct fitting. The authors of [24] suggested that there was a natural category imbalance in object detection. The authors designed an “unbiased teacher”, which uses the structure of a “mean teacher” to make a fake label to supervise both RPN and ROI heads. However, existing works focus solely on confidence scores for pseudo-labels, which cannot guarantee the localization accuracy of pseudo-boxes; in terms of consistency training, the widely used random resizing training only considers label-level consistency, while ignoring feature-level consistency. In this article, cooperative training strategies are designed for a soft threshold between reliable and pseudo-labels and candidate bounding boxes are sorted by probability predictive entropy to improve detection performance.
To detect small and indistinct persons in high-resolution aerial images, anchor-based detectors with intersection over union (IoU) for label assignment can be a reliable choice. IoU is the ratio of two boxes’ intersection to their union by calculating the overlap of the ground truth (GT) and prediction bounding boxes (PBBs), which has been used to assess the performance of object detection and segmentation. In anchor-based object detectors, several candidate bounding boxes are often generated simultaneously by the model, the boxes are sorted by their confidence level, and then the IoU [25] is calculated between the boxes to determine which one is the real object with others being deleted by non-maximal suppression (NMS). Some typical algorithms for optimizing IoU, for example, ref. [25], determine the similarity of two images in terms of their shapes, but they cannot show their distance and aspect ratio.The authors of [26] solved the problem of comparing the distance between two bounding boxes that do not overlap by generalizing to improve the way that the bounding boxes’ overlap is calculated. However, this still does not give a good picture of how close two bounding boxes are in terms of their distance and aspect ratio. In [27], how the two boxes overlapped, how far apart they were, and how big they were were considered. Then, the distance between them was made as small as possible, which made the loss function converge more quickly. To better reflect the difference between the two boxes, the CIoU of [27] added an image similarity influence factor to the DIoU of [27]. Ref. [28] broke down the aspect ratios and added anchor-based focal focus quality to improve the regression accuracy, as adding aspect ratios to CIoU can make it difficult for the model to find the best way to maximize similarity. Although the above methods have been shown to be effective in detecting natural images, using a fixed IoU threshold in aerial images could result in the loss of the small-scale object boxes, and the performance of detectors could be severely harmed by a person’s slight deviation.
In this article, we propose a simple and efficient semi-supervised learning method for detecting persons in high-resolution aerial images. We introduce an instance segmentation copy-paste mechanism (ISCP) to increase the number of hard examples, and solve the training of GT and pseudo-labels by use of SSOD in unlabeled images. A maximum mean discrepancy distance (MMD) [29] is designed to improve the anchor-based detector’s evaluation metrics in SaR scenes. This work represents a significant step forward for person detection in aerial images.
In summary, the article makes the following contributions:
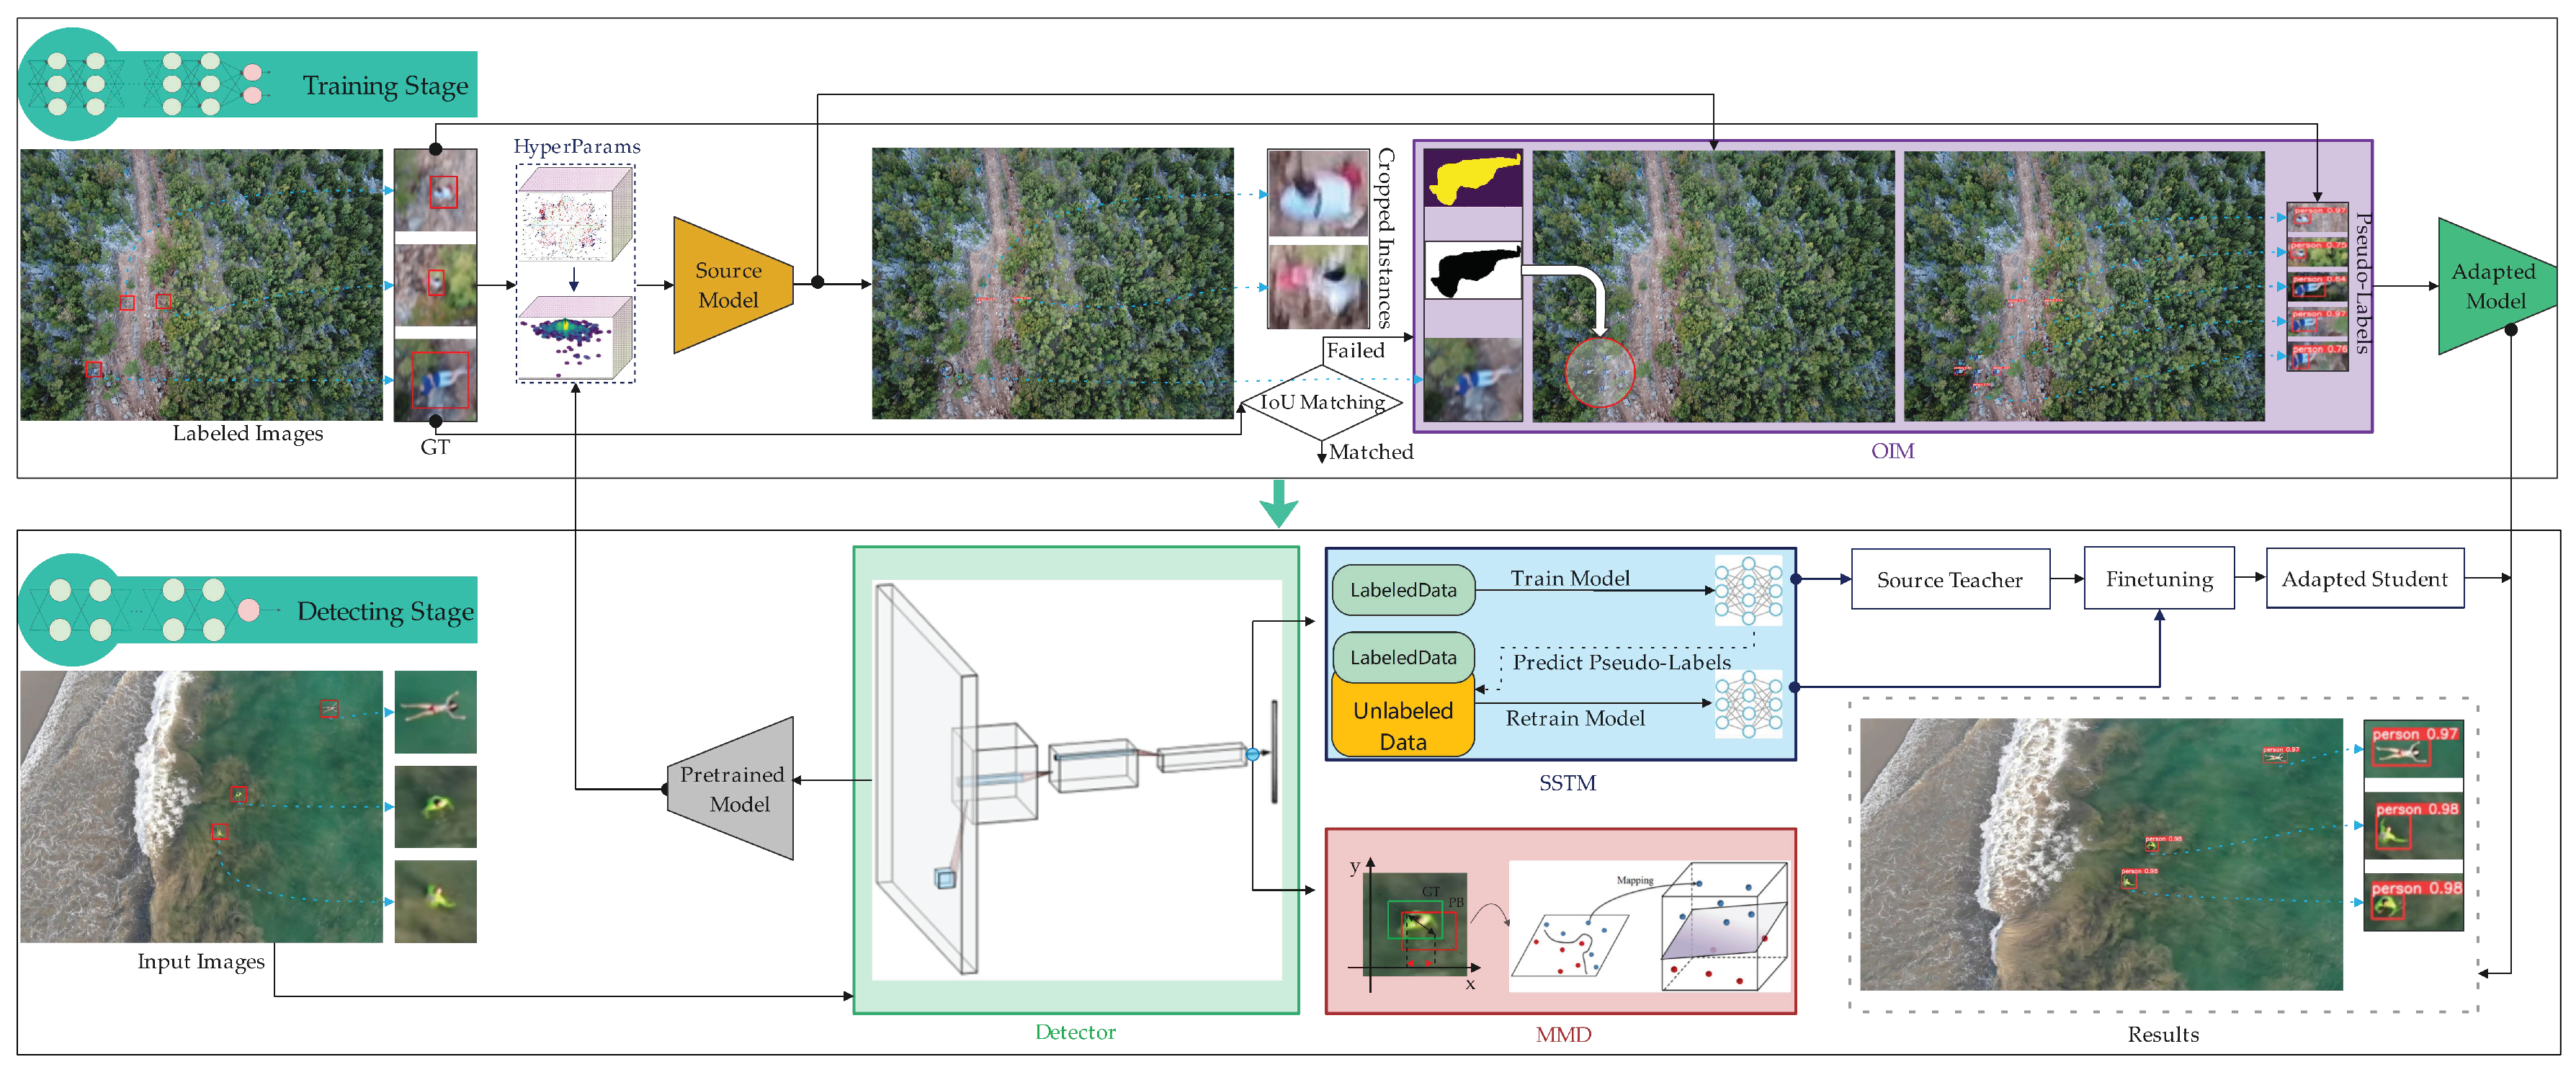
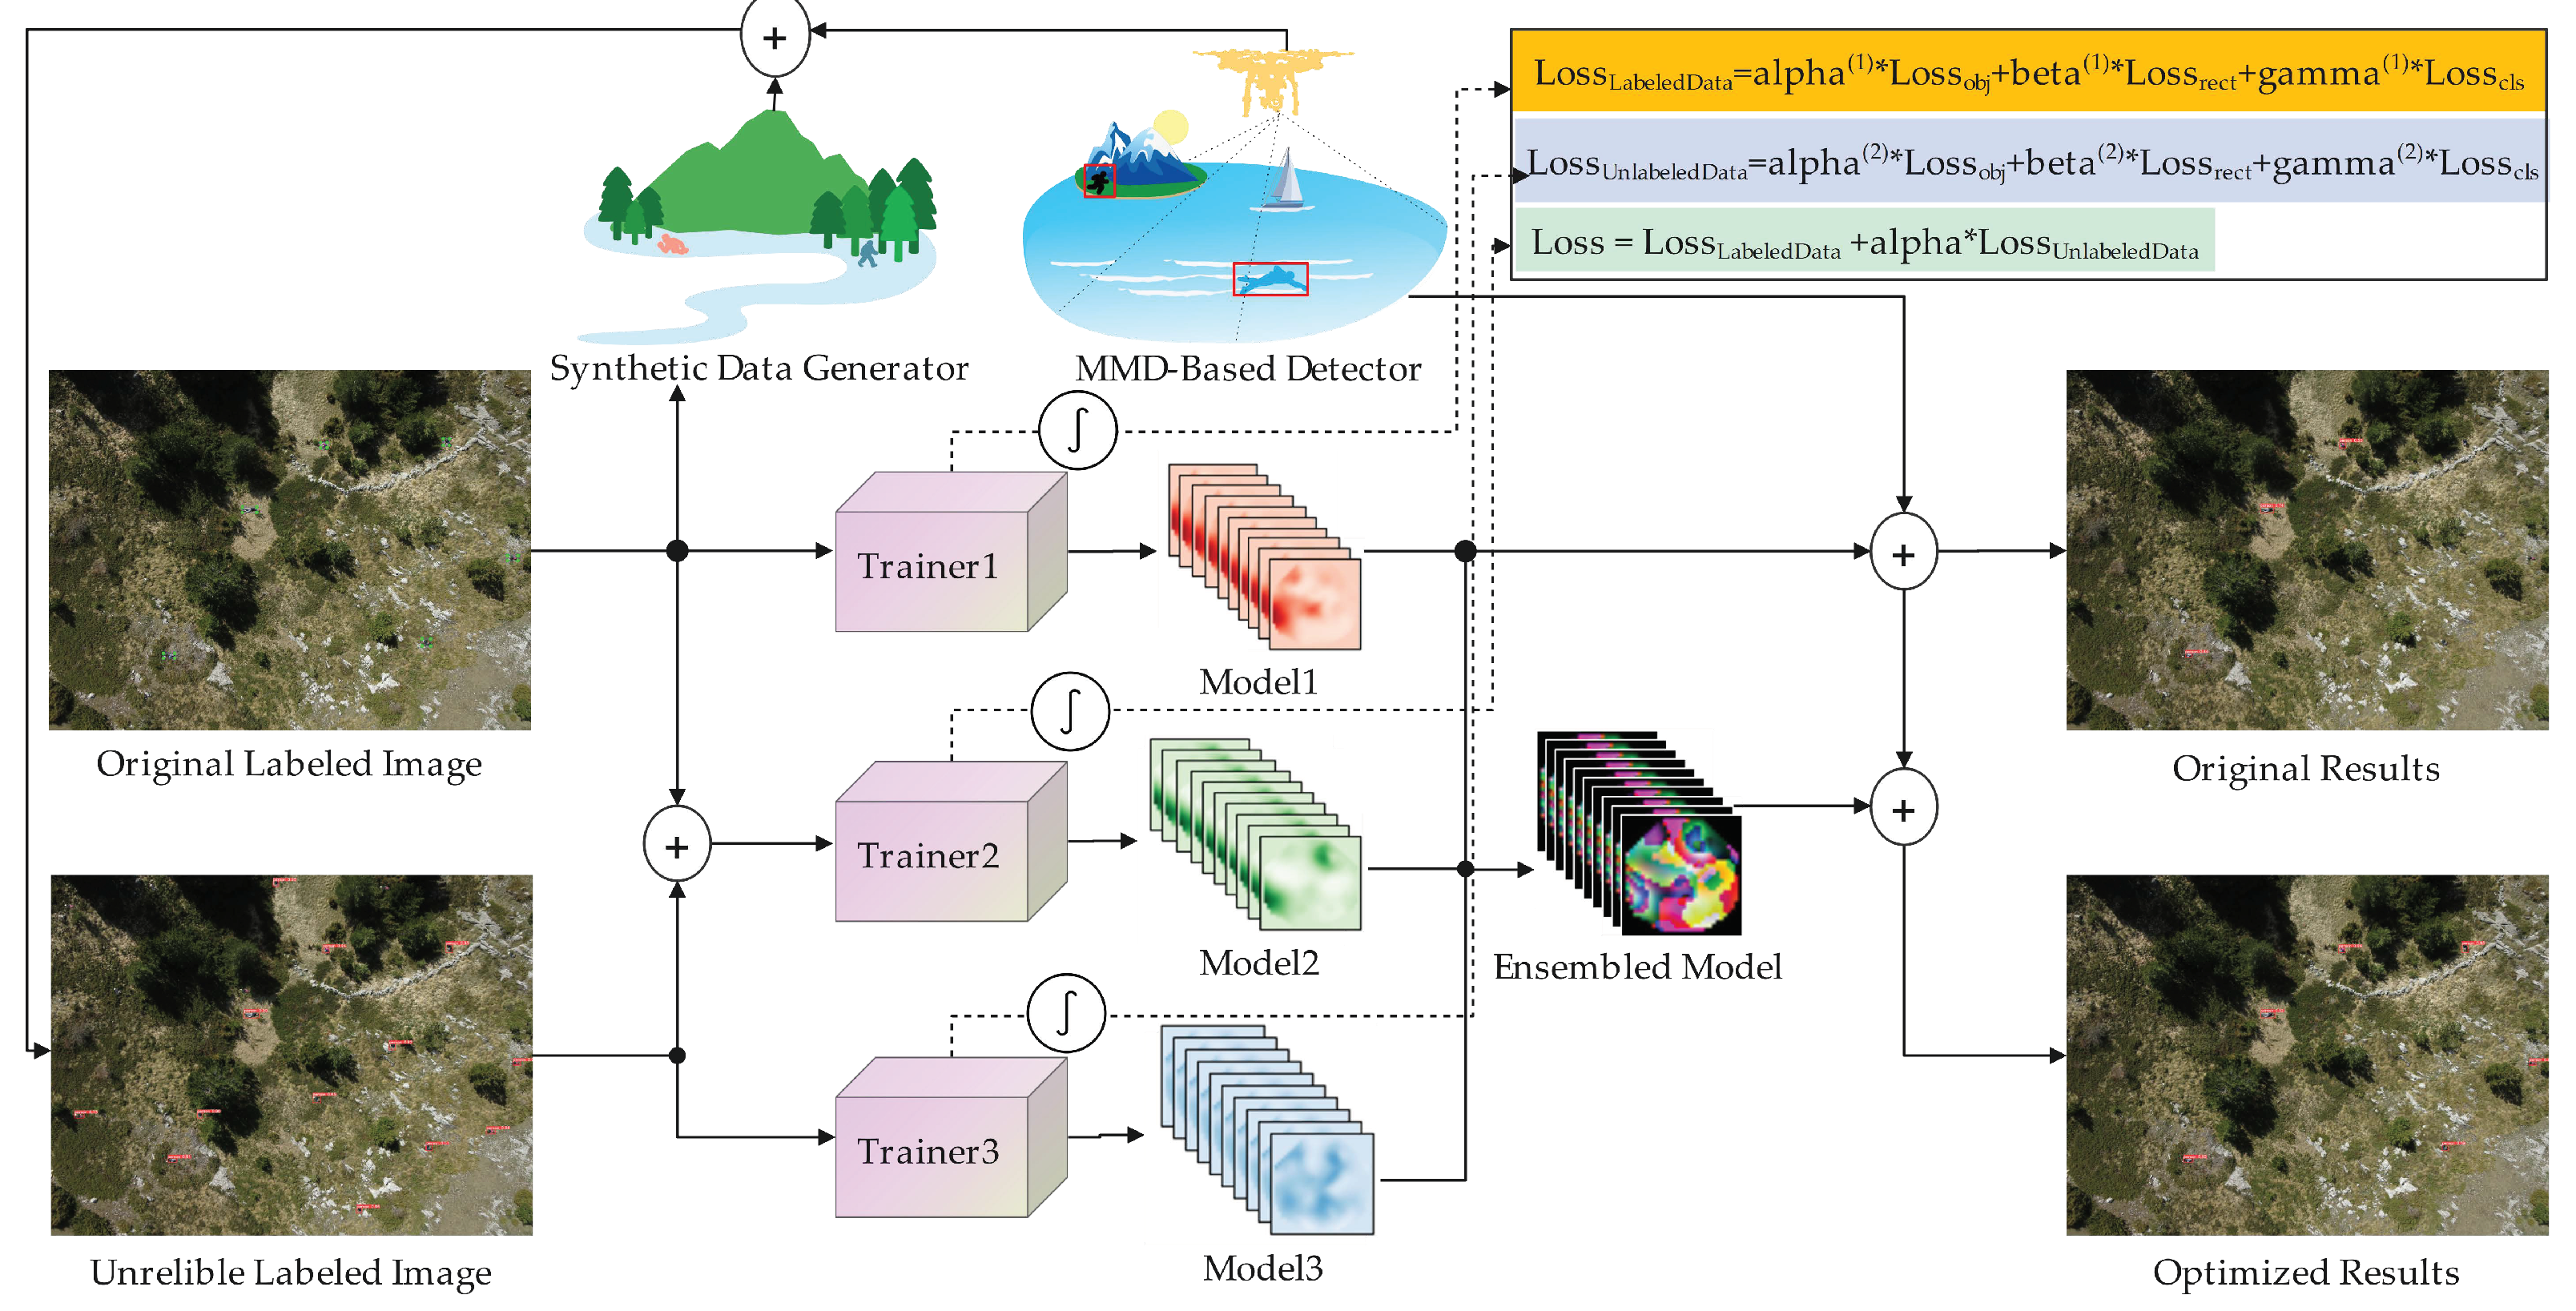
  • A semi-supervised learning strategy with pseudo-labels is developed for SaR scenarios, which mainly consists of three steps: training high-confidence teacher models from reliable labels, data augmentation with the instance segmentation copy-paste mechanism, and use of a teacher-student model with consistent loss function.
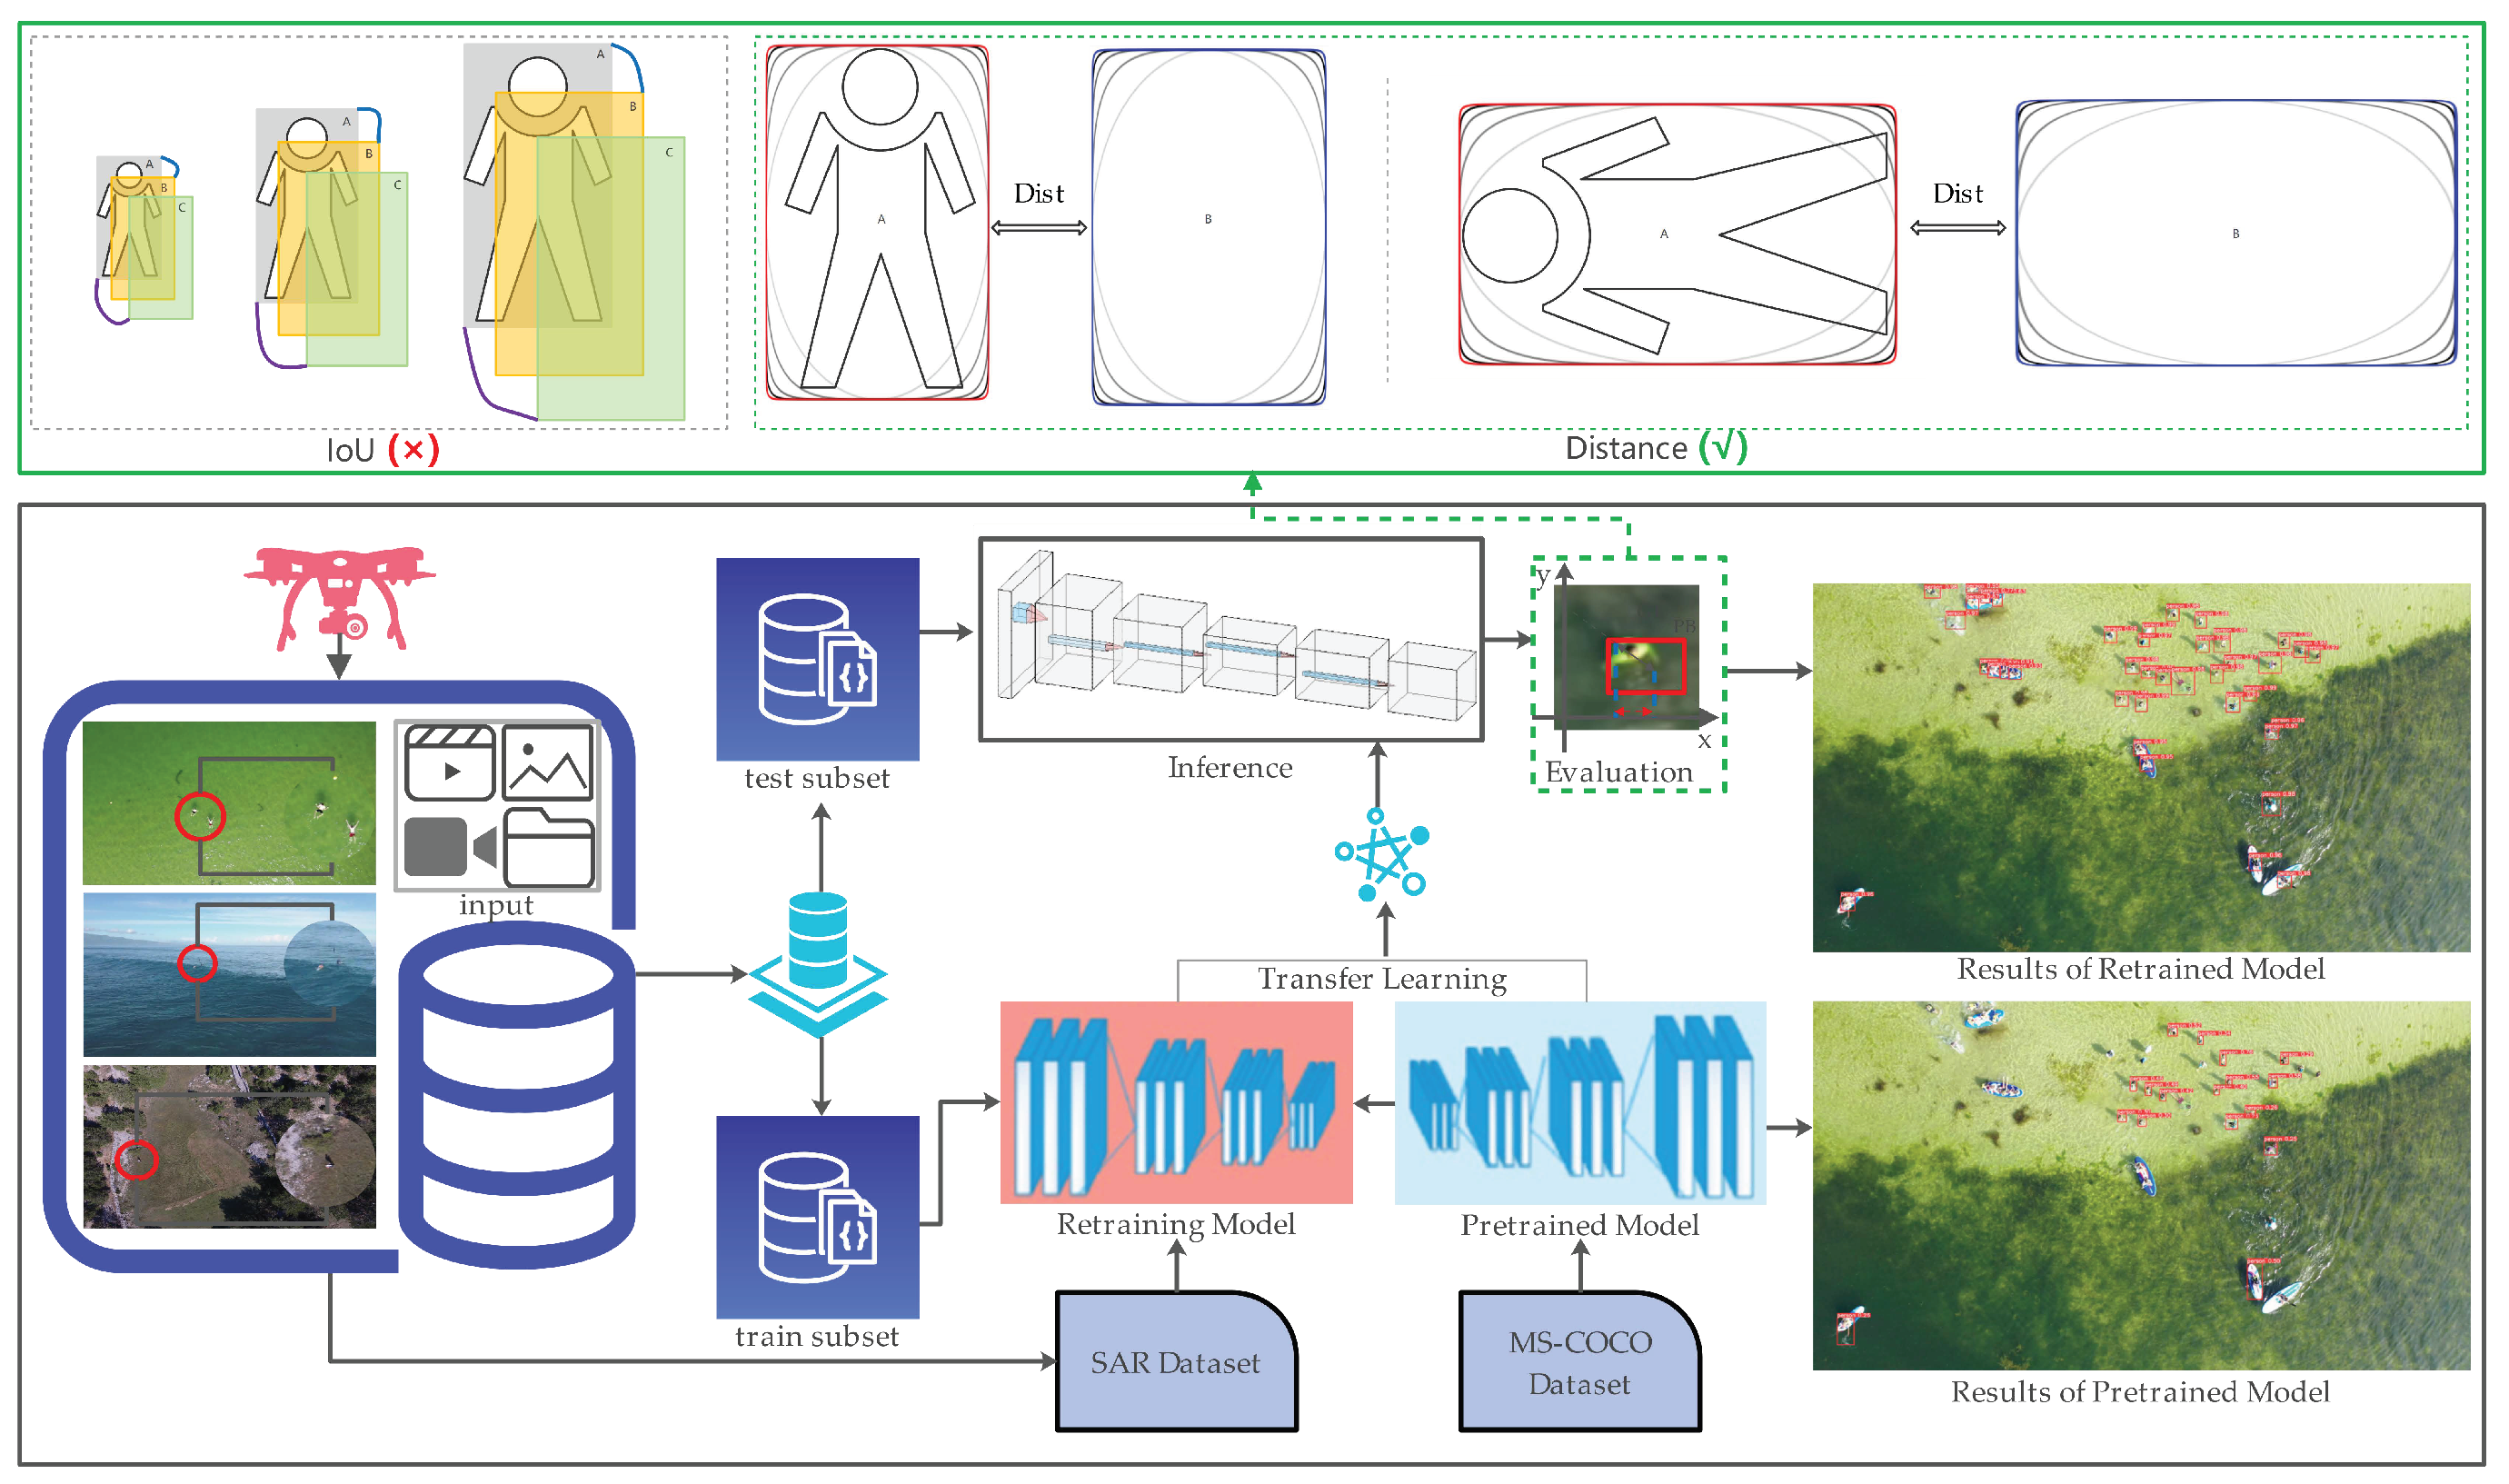
  • To further boost the performance and effectiveness, the algorithm utilizes an MMD distance to evaluate the detector’s metrics, which can be easily embedded in single-stage and two-stage object detectors.
  • The detection results of both public and optimized datasets are compared. Moreover, the detection results are also compared with other detection algorithms. The experimental results show that our proposed method achieved SOTA.
  • To explore the robustness of person detection from aerial images for different SaR applications, datasets with multiple scenes are created and evaluated for non-commercial purposes.
The work presented in the article is structured as follows: Section 2 briefly describes anchor-based detectors with semi-supervised learning and maximum mean discrepancy distance for person detection, and presents a precise description of our approach. Section 3 describes a detailed investigation of detection results and quantitative performance evaluation with and without our optimized datasets and improved algorithms. Moreover, we discuss how different training strategies and hyperparameter settings affect detector performance. Section 4 summarizes the work and discusses future directions.

2. Materials and Methods

2.1. General Framework of Our Proposed Approach

In this work, we present a person detection method for aerial images. The overall framework, along with its technical components, is illustrated in Figure 1. The system is mainly categorized into four different modules: an object implantation module (OIM), a semi-supervised training module (SSTM), a maximum mean discrepancy distance evaluation module (MMD) and a detector. The OIM’s primary function is to generate masks from hard or not-detected samples and to implant them around the original objects, while retaining information about other objects. The SSTM takes real labels and high-confidence pseudo-labels to train and update the model by setting different weight ratios between the source teacher and the adapted student. The MMD evaluates the model’s performance parameters by approximating the object’s bounding boxes (BBs) as a new two-dimensional distribution function and comparing the distribution differences between the candidate P-BBs and the ground truth (GT). Any two-stage or single-stage anchor-based detector is acceptable as the detector. We adopt a practical and efficient detection paradigm available today for person detection, i.e., [30], that was already trained for the multiple models from the MS-COCO and VOC datasets and added many tricks from the latest detection algorithms. An overview of the framework is provided in the following subsection.

2.2. Anchor-Based Detectors with Maximum Mean Discrepancy Distance

The maximum mean discrepancy distance (MMD) [29] is used to see if two samples are from the same distribution. In transfer learning, MMD is a common metric used to measure how similar the source and target domains are in a regenerated Hilbert space. The training and test sets are taken from different but related distributions. Given the low tolerance of existing IoU evaluation methods for tiny object bounding boxes [31], for example, when computing IoU in the green box of Figure 2, slight deviations reduce the value of IoU; however, different size of objects results in varying degree of deterioration. (Reference our experimental result—small: I o U A B = 0.486, I o U A C = 0.091 (0.395↓); middle: I o U A B = 0.623, I o U A C = 0.375 (0.248↓); large: I o U A B = 0.755, I o U A C = 0.613 (0.142↓)). A better metric is designed for tiny objects based on the maximum mean discrepancy distance since it can consistently reflect the distance between distributions even if they have no overlap. Therefore, the new metric has better properties than IoU for measuring the similarity between tiny objects. The details are as follows:
Pixels of tiny objects and backgrounds in the rectangular bounding box are skewed and do not accurately represent the genuine object boundaries. Specifically, more pixels of the object are found towards the center, while more pixels of the background are found near the bounding box. To better describe the weights of the different pixels in the bounding boxes, the bounding box can be modeled into two dimensions with a K-rank Gaussian distribution, where the center pixel of the bounding box has the highest weight, and the importance of the pixel decreases from the center to the boundary. In this article, we follow the paradigm of taking the center point of the bounding box as the Gaussian distribution mean vector.
The horizontal bounding box is defined as R = ( b b _ c x , b b _ c y , b b _ w , b b _ h ), where ( b b _ c x , b b _ c y ), b b _ w and b b _ h denote the center coordinates, width and height, respectively. The inner ellipse of the horizontal rectangular box is shown in the Figure 2 distance evaluation module. The closer the inner ellipse is to the rectangular boundary, the higher the rank, so the equation of its inscribed ellipse can be represented as
x b b _ c x k b b _ σ x k + y b b _ c y k b b _ σ y k = 1 , s . t . , σ x b b _ w 2 , σ y b b _ h 2
As shown in Equation (1), which translates the samples from the original space to the high-dimensional space using a Gaussian distribution function, applying a Gaussian kernel function yields linearly differentiable samples in the high-dimensional space. Furthermore, the similarity between the bounding boxes A and B can be converted to the distribution distance between two Gaussian distributions.
k x n , x m = exp x n x m 2 2 σ x 2 σ x σ y exp x n x m 2 2 σ y 2 σ x < σ y
k y n , y m = exp y n y m 2 2 σ x 2 σ x σ y exp y n y m 2 2 σ y 2 σ x < σ y
where σ x , σ y are the lengths of the semi-axes along the x- and y-axes. The largest of σ x and σ y are chosen from Equations (2) and (3) as the bandwidth of the Gaussian kernel. Multiple sample points within the rectangular box distribution function can be obtained using Equation (1) to generate the two bounding box sample space of Equations (4) and (5), and multiple rectangular boxes are similarly processed.
BB 1 = N 1 , N 2 , N 3 , , N n
BB 2 = M 1 , M 2 , M 3 , , M m
The moments of a random variable can be used to characterize high-dimensional random events but do not have direct distribution variables. Because the meanness and variance are not always perfectly reflective of a distribution, higher-order moments are required to be characterized. When the two distributions are not identical, the moment with the greatest difference between them should be utilized as the measure of the two distributions. MMD [29] is a typical loss function used in migration learning and is frequently used to estimate the distance between two distributions, which can be simplified as Equation (6):
MMD [ F , B B 1 , B B 2 ] = sup f H 1 E B B 1 [ f ( N ) ] E B B 2 [ f ( M ) ] = sup f H 1 E B B 1 ϕ ( N ) , f H E B B 2 ϕ ( M ) , f H = sup f H 1 μ B B 1 μ B B 2 , f H = μ B B 1 μ B B 2 H ,
where B B 1 and B B 2 are two bounding boxes of the sample space, f ( N ) and f ( M ) are probability density functions of B B 1 and B B 2 , and ϕ ( N ) and ϕ ( M ) denote distribution functions of B B 1 and B B 2 . So, Equation () provides the biggest difference ( H ) in the mean distances between two distributions ( ϕ ( N ) and ϕ ( M ) ) in Hilbert space ( F ).
M M D 2 [ F , B B 1 , B B 2 ] = 1 n i = 1 n f x i 1 m j = 1 m f x j H 2 = 1 n 2 i = 1 n i = 1 n k x i , x i 2 n m i = 1 n j = 1 m k x i , y j + 1 m 2 j = 1 m j = 1 m k y j , y j = tr K L
where n samples are assumed in the source domain ( BB 1 ) and m samples are assumed in the target domain ( BB 2 ). Until now, the key to MMD has been to select an appropriate ϕ ( x ) as the mapping function. The Gaussian kernel method is useful since it does not require explicit representation of the mapping function to obtain the inner product of two vectors. As shown in Equation (7), the MMD is squared, simplified to obtain the inner product, and written down as a kernel function.
K = K n , n K n , m K m , n K m , m
L = 1 n 2 , x i S 1 m 2 , y j T 2 m n , otherwise
where the inner product of x i , y j in the feature space equals the result of their calculation by the kernel function k in the original sample space. It is frequently simplified to a matrix form, i.e., equation, to aid calculation of Equations (8) and (9), where K is the kernel matrix and L is the MMD matrix. The K matrix can be fed into the Gaussian kernel function to calculate the distance between two bounding boxes, and so on. After calculating the distance between multiple bounding boxes, the least in order of distance is chosen as the positive sample matching result, while the others are considered negative samples.
As shown in Figure 2, The UAV-recorded person samples are used to train the detection model. The model learns the new features of the dataset and performs detection using the testing dataset. The additional trained improved layer is interfaced with the previously trained model with transfer learning. The results of the trained and pretrained models are assessed and processed for SaR purposes.

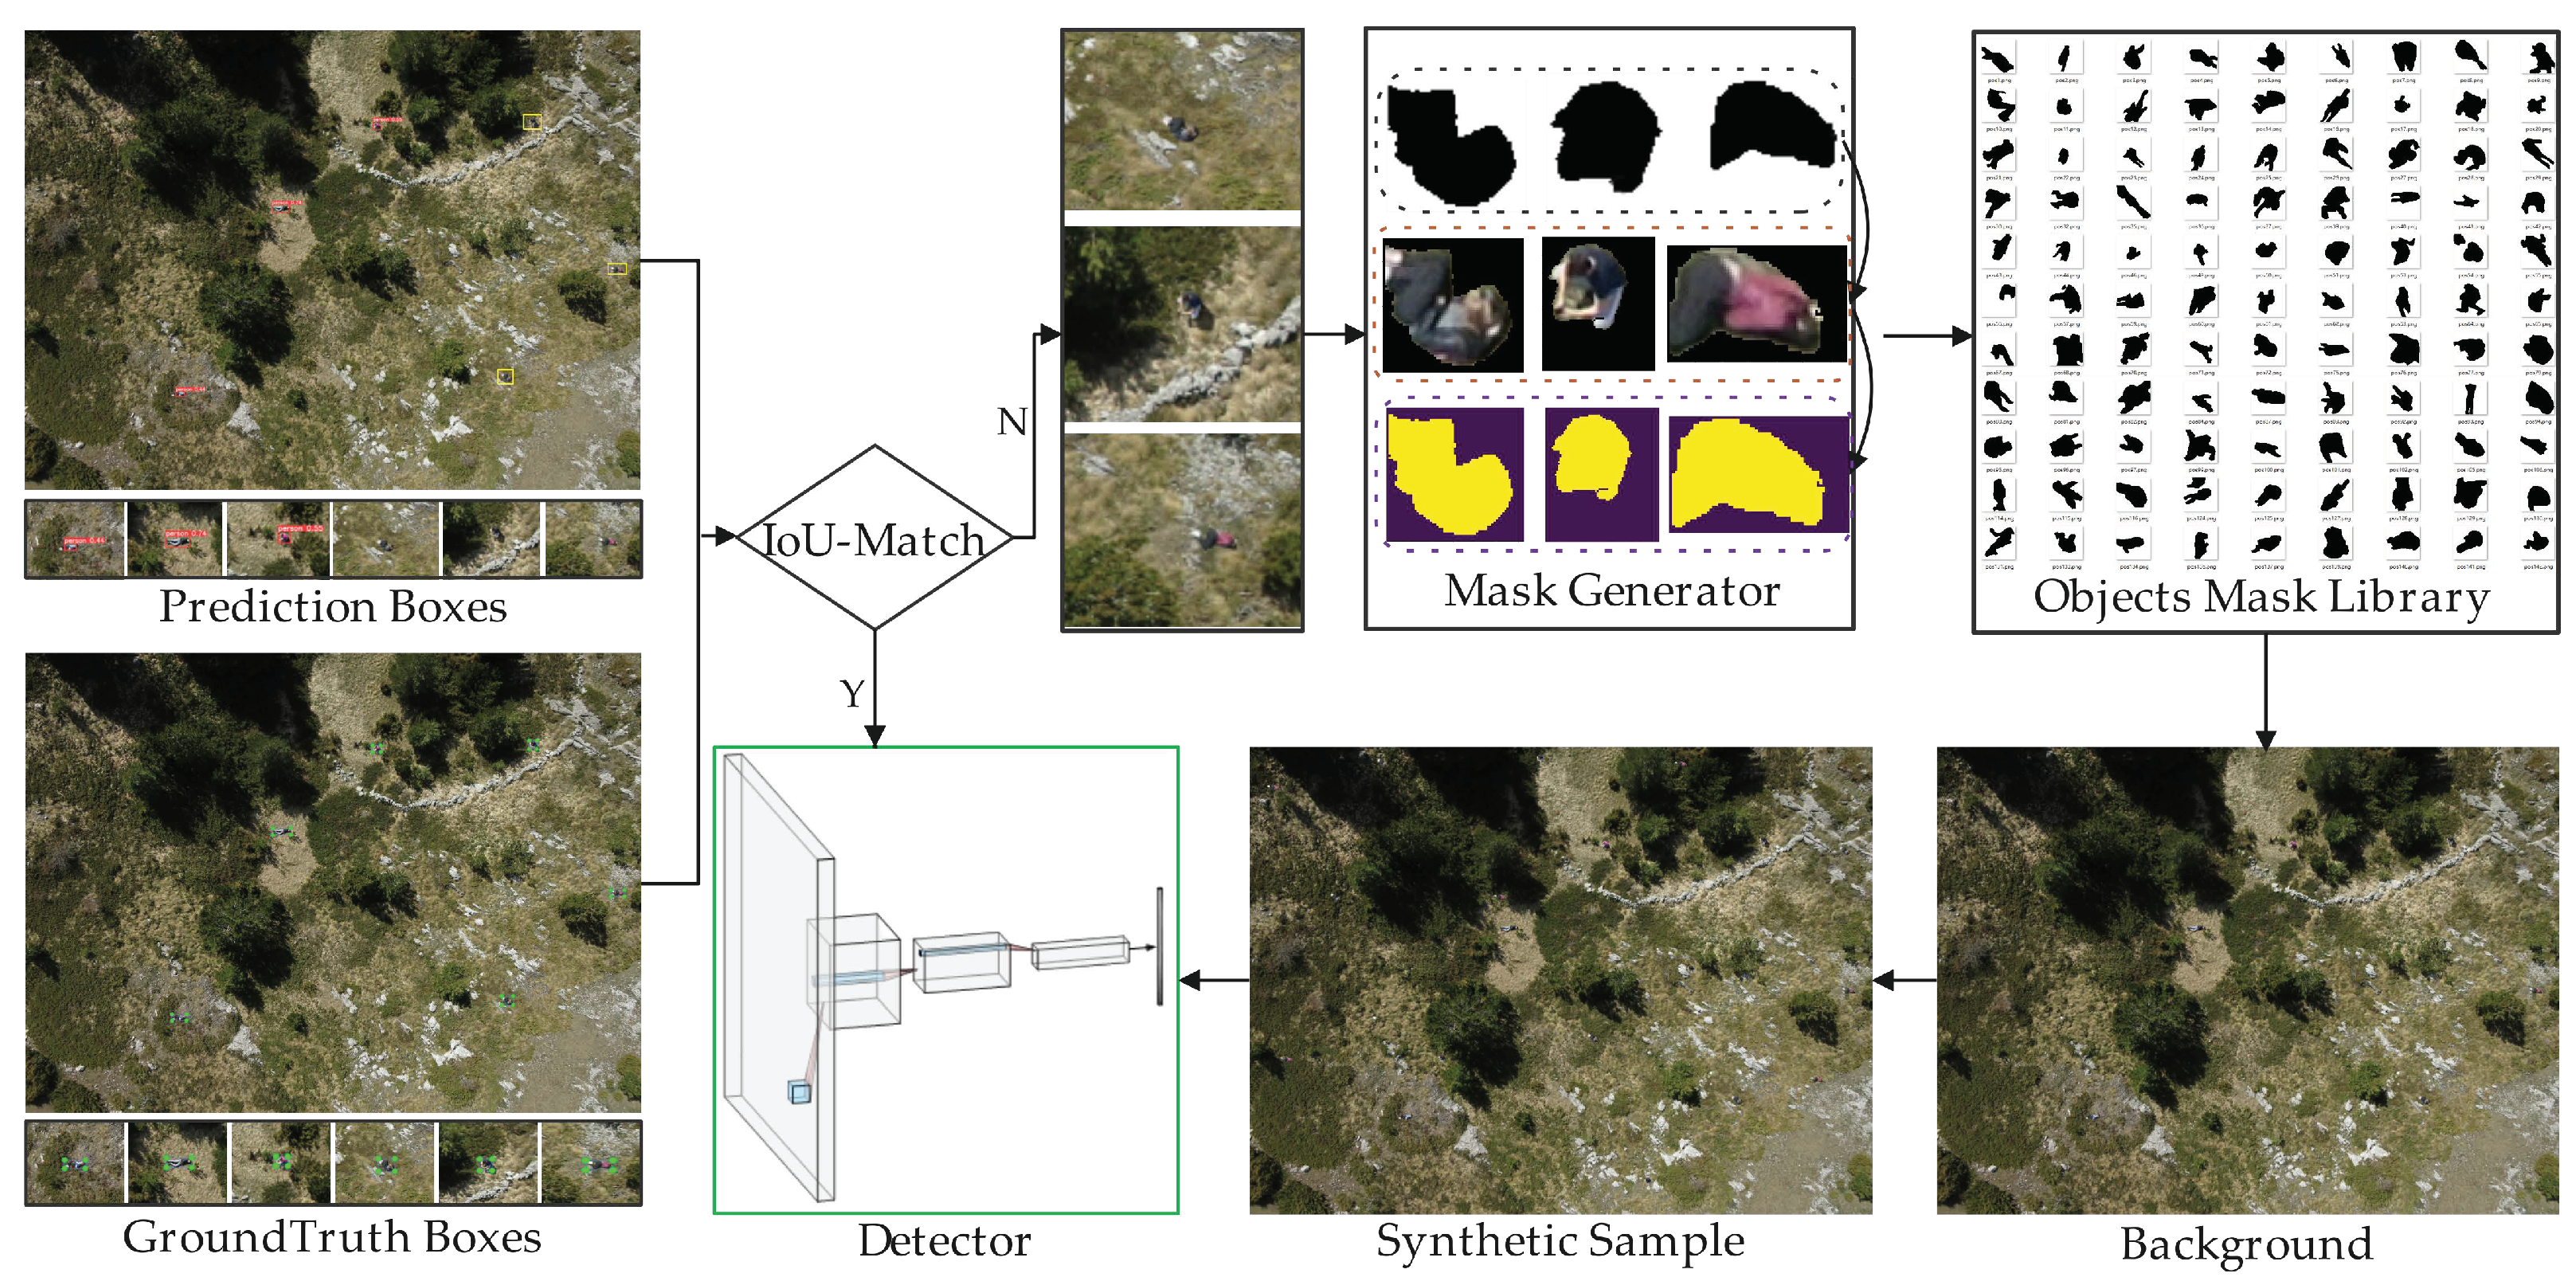
2.3. Synthetic Data Generation by Object Implantation

Samples from SaR are typically associated with non-urban and hidden terrains, and the available persons are inevitably reduced. The OIM mainly generates a sufficient number of pseudo-labels in unlabeled images, while the ISCP mechanism of the OIM module expands numerous object instances, which will not affect the accuracy metrics of the detectors during the training. As shown in Figure 3, this incorporates the three steps listed
  • The detector infers unlabeled images using the pretrained model and computes IoU matching between the GT and P-BBs to obtain undetected object instances.
  • The generator obtains (as shown in Figure 3) masks of undetected object instances.
  • Synthetic samples are created by randomly combining unreliable instances and backgrounds according to the objects’ mask library (OML, which comes from the results of instance segmentation).
To optimize the model parameters, the original samples are fed back into the trainer along with the pseudo-labels. However, because of their unreliability, the majority of the pixels may not be used. We believe that all the prediction probabilities of objects are treated in a unified loss function with different weights on both unlabeled and labeled data, using a dual input layer to optimize the prediction entropy of the loss function between the GT and unreliable labels.
The mask generator shown in Figure 4 is based on [30] with the added semantic segmentation head of [32], and creates a segmented dataset on the detected cropped maps. As shown in Figure 4, ARM and FFM modules are added to the neck of [30], which perform small-step spatial pathways that maintain spatial position data to build high-resolution feature maps, and design a semantic path with a fast down-sampling rate to obtain objective perceptual fields. The results are divided into two parts: the detection result of yolov5 with dimension 25,200 × 177, where the first 85 columns represent the result of each detection box and the last 32 columns represent the mask coefficients of each detection box, and the segmentation result of BiSeNet, which contains: a prototype mask with dimension 32 × 81 × 81, where post-processing of instance segmentation equals the weighted sum of the mask coefficients within the bounding box and the prototype mask to acquire the best performance of instance segmentation. It is worth noting that the other modules are the same as [30]. For additional details on the implementation of the object implantation with instance segmentation copy-paste mechanism, please refer to our Algorithm 1.
Algorithm 1: Object implantation with Instance Segmentation Copy-Paste (ISCP) based on the YOLOv5 detector
Input: 
Prediction samples of the Heridal dataset for the current batch, as a group,
   
P S b i ; Ground truth of the Heridal dataset for the current batch, as a group,
   
G T b i ; Background samples of the Heridal dataset for the current batch, as a
   
group, B S b i ; Mask datasets of detectors on former batches, M b i 1 ;
Output: 
Mask Datasets of detectors on the current batch, M b i ;
1:
Extracting the set of reliable negative and/or positive samples T S b i from P S b i
with help of G T b i by offline IoU-Match;
2:
Training mask of numerous bounding boxes M on T S b i G T b i (optimized G T b i
from G T b i ), with help of data in former batches;
3:
M b i = M b i 1 c u p M ;
4:
Generate samples O M L b i in T S b i P S b i by M b i to object mask library;
5:
Add randomly O M L b i samples from object mask library to a background
samples B S b i to expand G T b i samples;
6:
Deleting some weak detectors in G T b i so as to keep the capacity of G T b i ;
7:
return  M b i , G T b i .

2.4. Pseudo-Label-Assisted Trainers with Semi-Supervised Learning

Typically, labeling takes more time and is much more valuable than data, which is usually fairly easy to obtain. Some parts of the data are labeled to create supervised data, and can then effectively use additional unlabeled data. Semi-supervised learning has the following advantages:
  • It reduces the reliance of machine learning models on labeled data significantly, especially when the project is in its early stages.
  • Even if the data is unlabeled, the distribution of the unlabeled data can provide a wealth of information to guide model iteration.
  • In most cases, unmarked data is easily accessible, and the amount of data is large. Quantity is more important than quality. When used correctly, it can be extremely beneficial.
The most common and effective way to promote the performance of detection is self-training, which involves jointly training the model using a small amount of labeled data and a large amount of unlabeled data. First, a model is trained using labeled data with no constraints on the training method. The trained model is then used to predict the unlabeled data and obtain the label, which is referred to as a pseudo-label. Next, from the pseudo-label, some samples are chosen and placed in the labeled data. The selection method is also adaptable; for example, it can be used with greater confidence in labeled data. Finally, the model is retrained, and iterations resume. Labeling the synthetic samples mentioned in Figure 3 one-by-one would be a time-consuming and labor-intensive task. We present a simple and effective semi-supervised training method that uses a high confidence detection model to infer unlabeled images so that pseudo-labels are obtained, adding original training data to strengthen the trainer’s robustness. As shown in Figure 5, the model is trained with three datasets (original data, pseudo-labeled data, original and pseudo-labeled data) and the trainer outputs are fused at the decision level. Concretely, loss of the trainer is computed with labeled data ( L o s s L a b e l e d D a t a ), and also loss of the trainer is computed with unlabeled data ( L o s s U n l a b e l e d D a t a ), with soft weights of the total loss assigned between different datasets. Meanwhile, the detection results are optimized with ensemble learning. For additional detail on the implementation of expanding samples with semi-supervised learning and model ensemble learning, please refer to our Algorithm 2.
Algorithm 2: Training process of semi-supervised learning and model ensemble learning based on the YOLOv5 detector
Input: 
The set of original labeled images for current batch, L b i ; The set of unreliable
   
labeled images for current batch, U b i ; samples ratio of labeled and unlabeled
   
datasets; ζ : weight threshold; λ 1 / λ 2 . Co-training ensemble of detectors on
   
former batches, C E n 1 ;
Output: 
Co-training ensemble of detectors on the current batch, C E n ;
1:
Extracting the set of reliable ground truth and/or pseudo-labels P b i from U b i
with help of L b i and detectors;
2:
Training ensemble of detectors C E on L i P b i , with help of data in former
batches, where samples ratio is set to ζ ;
3:
C E n = C E n 1 c u p C E ;
4:
Training ensemble of detectors with different weight threshold λ 1 or λ 2 with
help of data L i P b i ;
5:
C E n = C E n 1 c u p C E / λ 1 or λ 2 ;
6:
Detecting samples in U b i P b i by C E n ;
7:
Deleting some weak detecting in C E n so as to keep the capacity of C E n ;
8:
return  C E n ;

3. Experimental Results and Analysis

This section focuses on benchmarking some representative object detectors and effectiveness verification of our proposed method. Firstly, the experimental settings, including the datasets, parameter settings and evaluation metrics, are presented. Then, a large-scale benchmark based on a comprehensive series of detectors is provided. Finally, the effectiveness of our proposed method is validated by extensive comparative experiments and ablation studies.

3.1. Experiment Setting
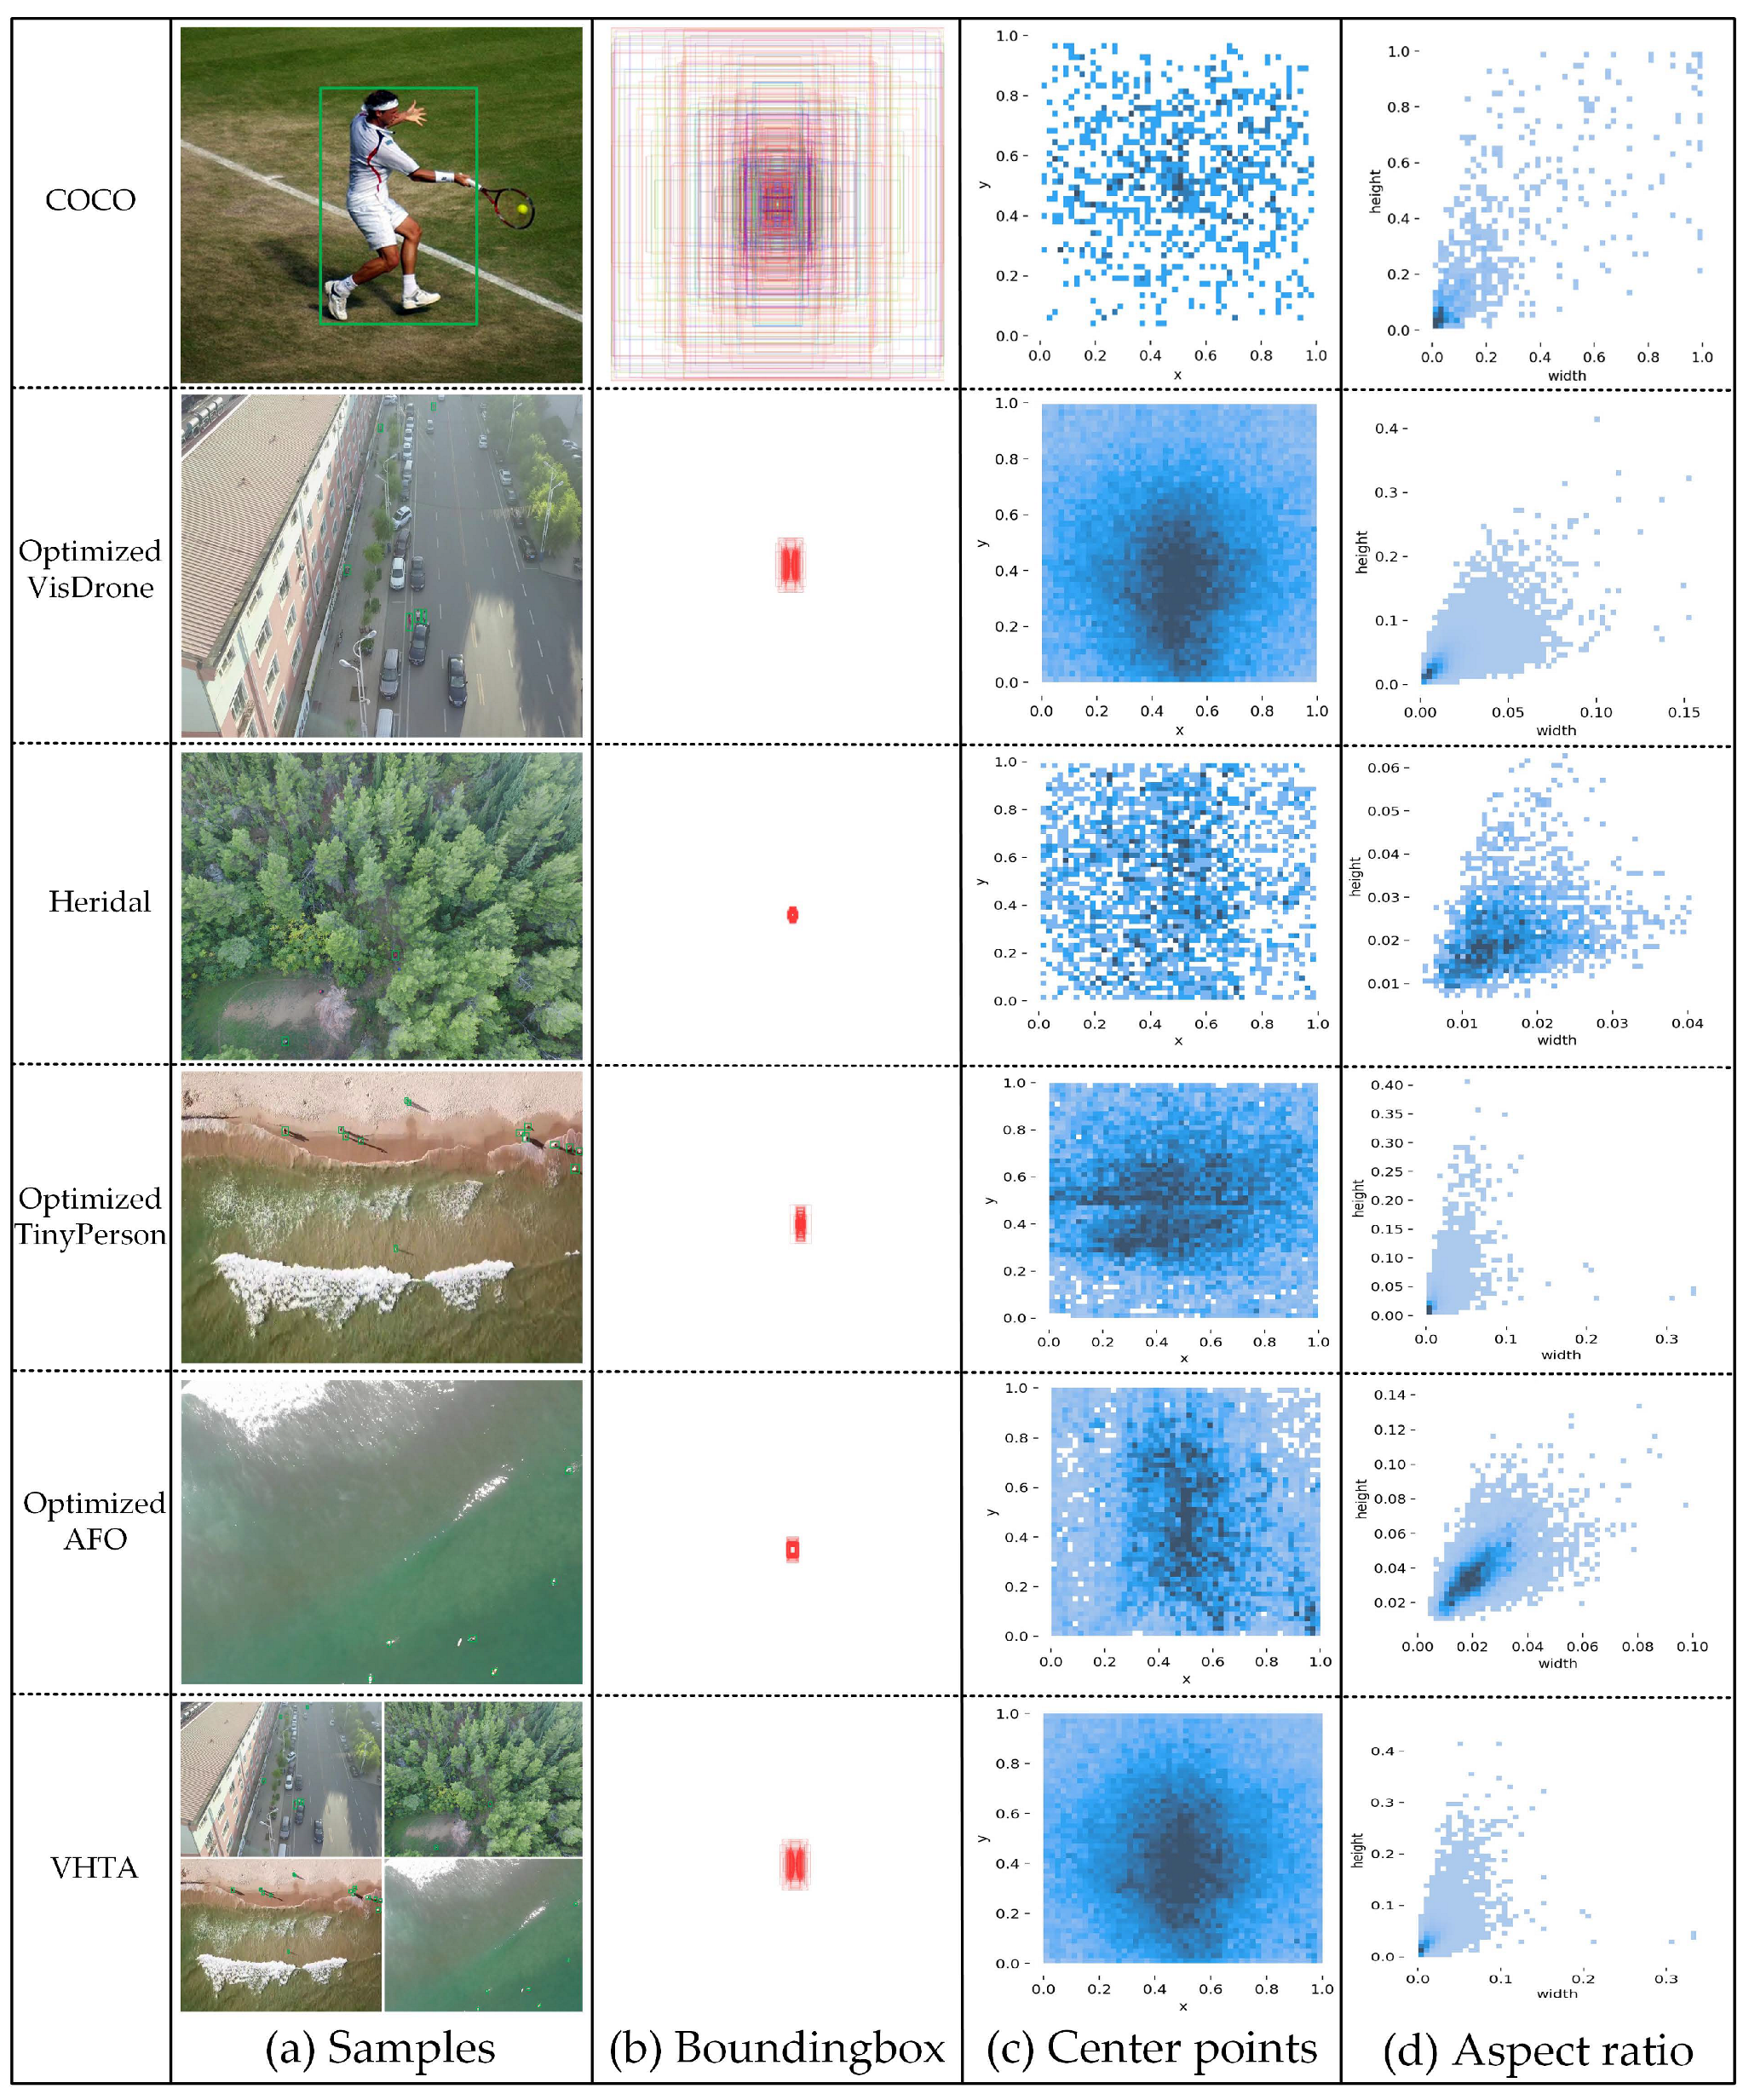
3.1.1. Datasets

Pixels smaller than 32 × 32 are generally viewed as tiny objects, which have been defined in the MS-COCO dataset. It has been found through research and experience that persons essentially meet this condition in the drone scenario. Descriptions of some typical publicly available datasets containing persons are as follows:
  • VisDrone dataset [33], which contains details of urban areas and neighborhoods. It includes 288 video clips, 261,908 frames, and 10,209 still images, with labels covering three domains: object detection, object tracking, and congestion counting.
  • TinyPerson dataset [16], which consists of 1610 labeled images with 72,651 person instances and 759 unlabeled images, referring to dense and complex environments at sea or the seaside in faraway and large-scale scenes.
  • Heridal dataset [5] based on collection of images by unmanned helicopters, including 1650 high-resolution images (4000 × 3000) containing persons from non-urban areas, such as mountains, forests, oceans, and deserts.
  • AFO dataset [4], which contains 3647 images with close to 40,000 labeled floating objects (human, wind/sup-board, boat, buoy, sailboat, and kayak).
In these datasets [4,5,16,33], we pay particular attention to samples of persons, removing the influence of other categories. Table 1 presents a comparison of the original and optimized datasets. The resolution of all samples in the optimized dataset is 1536 × 1536. Figure 6a–d refer to samples, rectangular labels, center points, and the aspect ratio for persons for different datasets, respectively. These datasets have smaller label sizes than the MS-COCO dataset, but the person instance in the Heridal dataset has the smallest label size. When the aspect ratio and centroid of the labels in those datasets are recorded, the K-means cluster first calculates the best preset size of anchors in the different datasets. Samples from the four datasets are combined [4,5,16,33] to create a new dataset (VHTA), with the goal of validating our proposed methods in rich scenarios with numerous viewpoints on SaR sceneries, and establishing a theoretical foundation to prepare for acquisition of our own dataset in the future. There is no validation set for the Heridal and TinyPerson datasets, which is critical for the training of machine learning models, so, samples are re-parted on the optimized dataset.

3.1.2. Parameter Settings

The experiments were carried out on a Red Hat 4.8.5-44 operating system, an Intel(R) Xeon(R) Gold 6134 CPU @ 3.20 GHz, with an NVIDIA GeForce Tesla V100 × 2 GPU (16 GB of each memory on a single card), CUDA and cuDNN versions v10.2 and v8.0.1, Pytorch version 1.8.0, JetBrains PyCharm Community Edition 2021.3.2 × 64, and Python 3.8. The ImageNet pretrained ResNet-101 was used for the backbone. All models were trained using the stochastic gradient descent (SGD) optimizer for 300 epochs with 0.9 momenta and 0.0001 weight decay. The initial learning rate was set to 0.01 with decay at epoch 10. The input resolution of images was [1536, 1536], but multiscale training was not used. Scratch-low values were used in the nano and small models, while scratch-high values were used for the rest. mAP@val was used for single-model and single-scale on these datasets. Test time augmentation (TTA) included reflection and scale augmentation. In the inference stage, a preset score of 0.25 to remove background bounding boxes and NMS were used with an IoU threshold of 0.45 to obtain the top 3000 confident bounding boxes. The above training and inference parameters were used in all experiments unless specified otherwise.

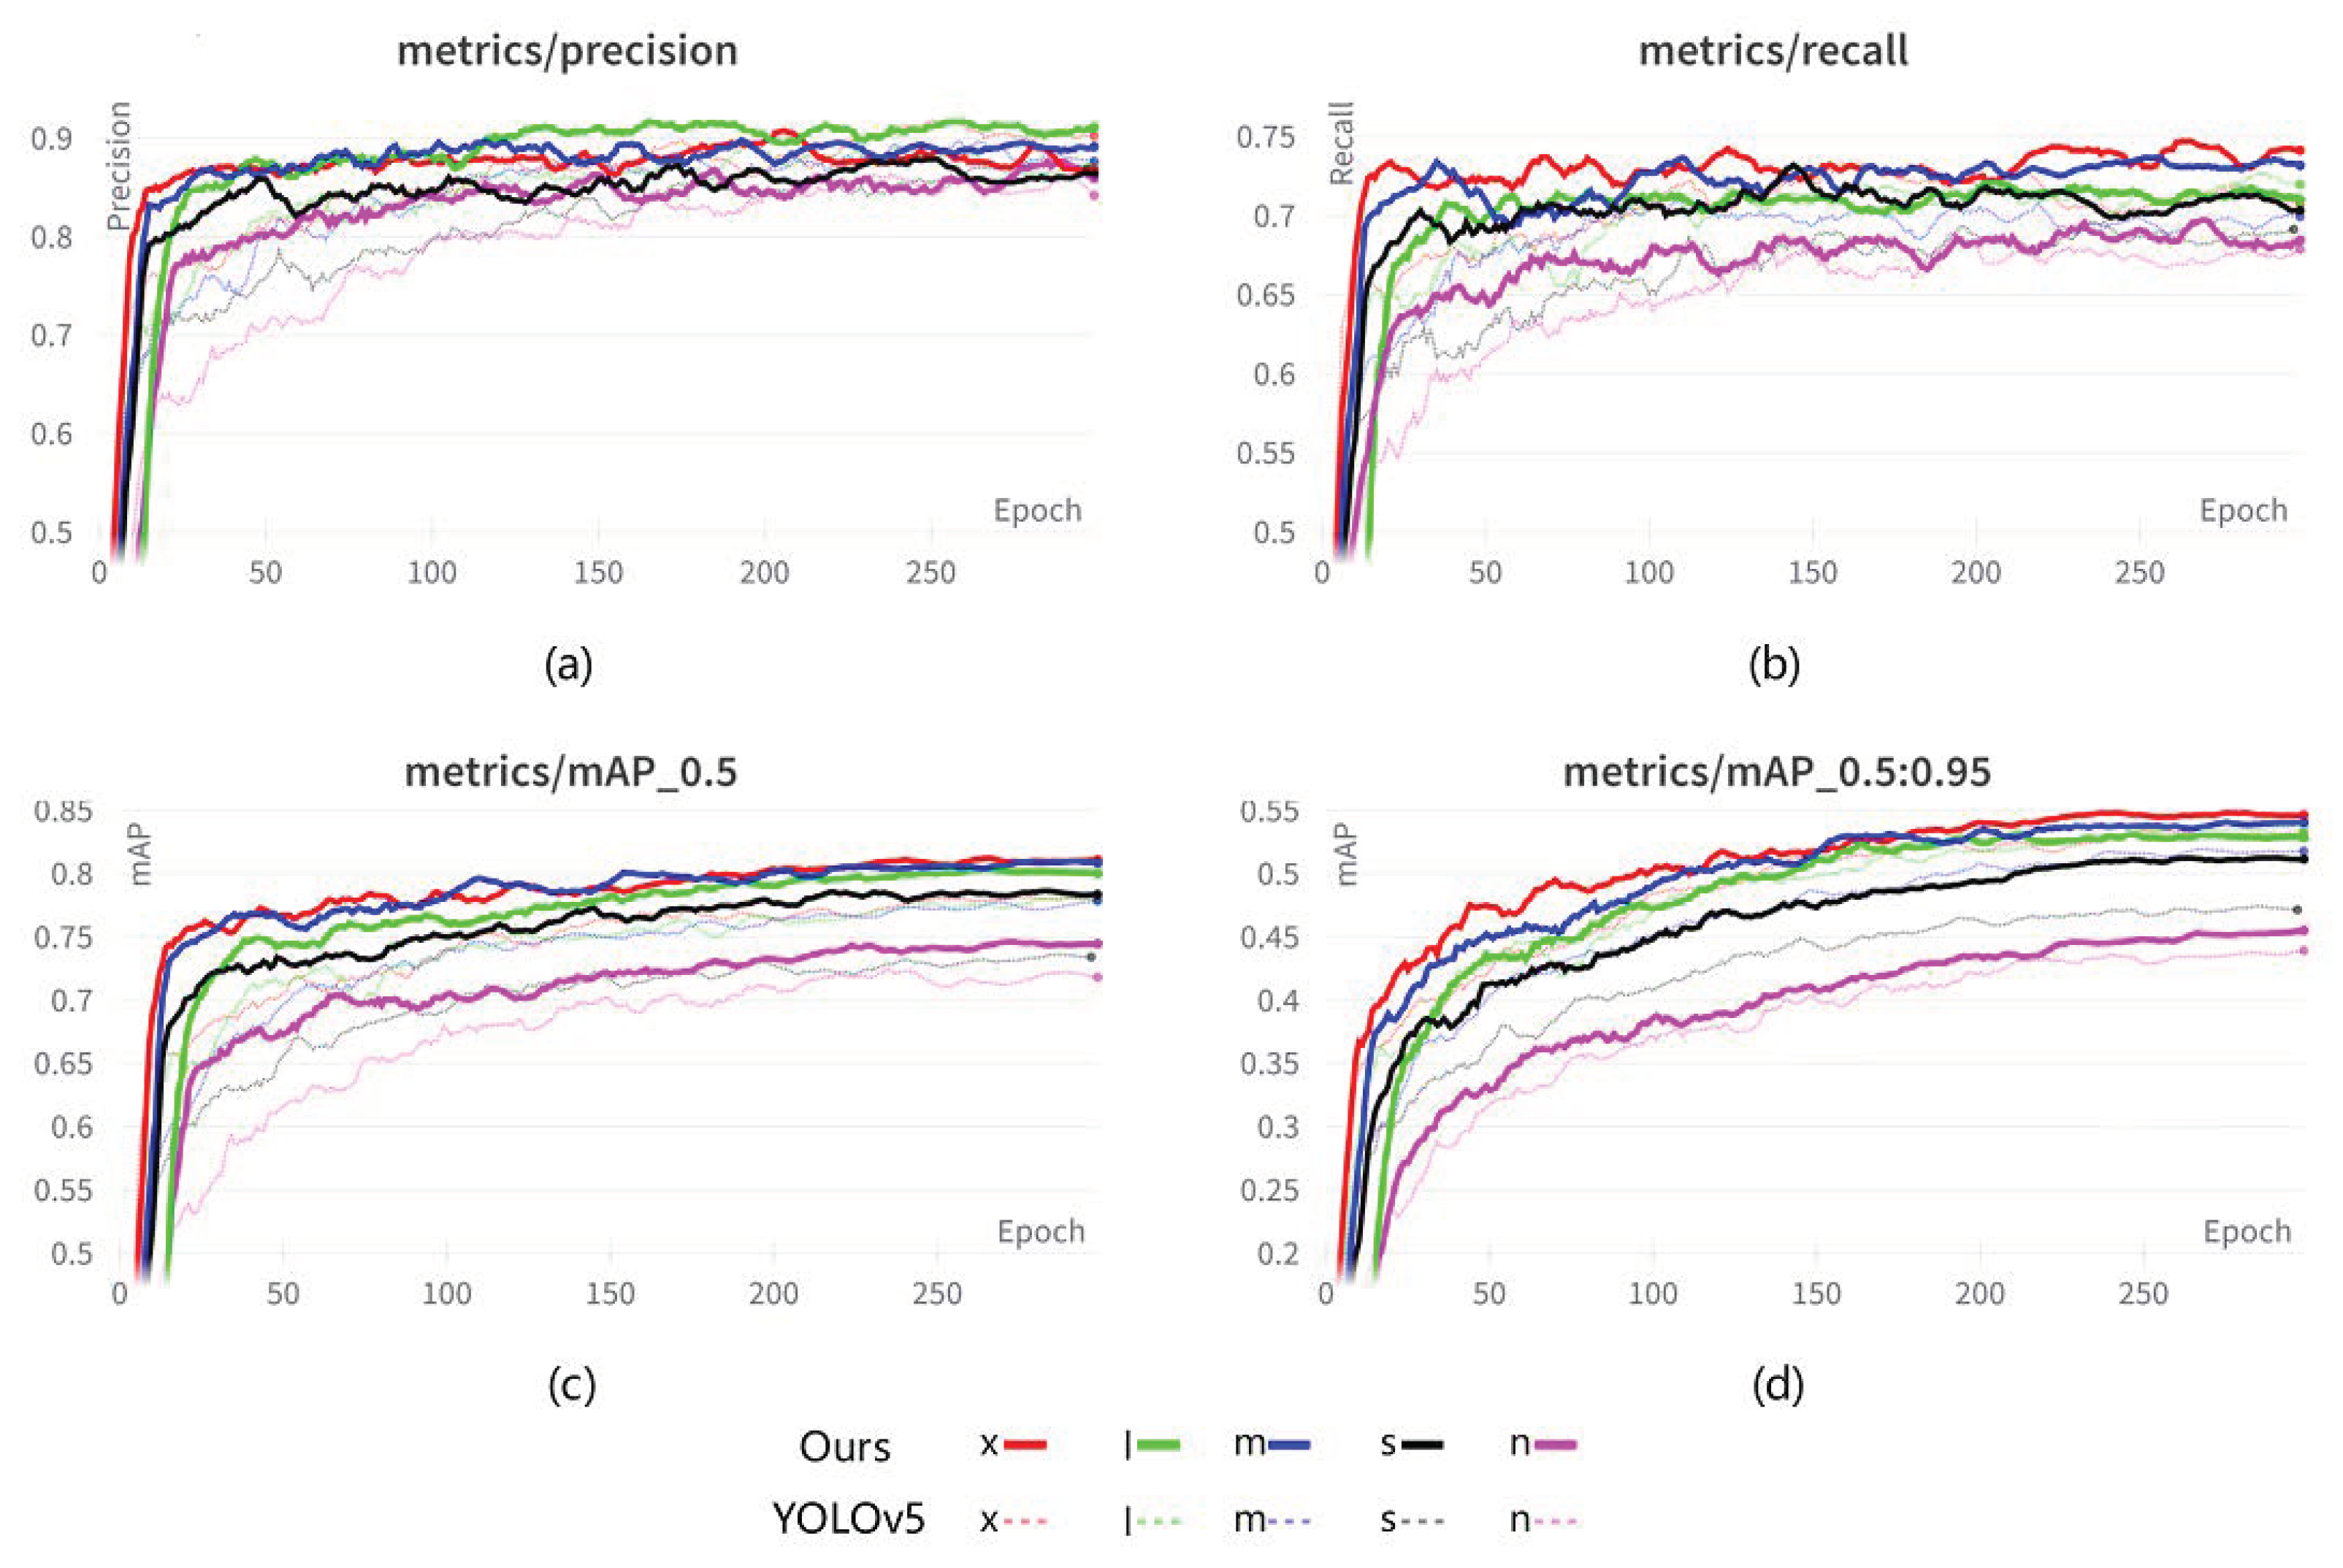
3.1.3. Evaluation Metrics

Recently, the evaluation metrics for object detection have generally consisted of two categories: the prediction metrics (IoU) and the classification metrics with precision, recall, etc., where precision and recall merely show the proportion of accurate and inaccurate instance predictions to all cases. Current main object detectors generally set the default IoU to 0.45 in the training stage. The mAP (mean average precision), including mAP@0.5, which refers to the mean AP with an IoU threshold higher than 0.5, and mAP@0.5:0.95, which refers to the mean AP above the IoU threshold (from 0.5 to 0.95 with a step size of 0.05), is used to evaluate the detection performance of our proposed method. The models are also tested with the COCO evaluation parameters. Specifically, A P 0.5 means the IoU threshold defining true positive (TP) is 0.5, A P 0.75 means the IoU threshold defining TP is 0.75, and A P 0.5 : 0.95 means the average value from A P 0.5 to A P 0.95 , with an IoU interval of 0.05. Note that A P 0.5 , A P 0.75 and A P 0.5 : 0.95 take objects of all scales into consideration. Furthermore, in the Heridal dataset, A P l , A P m , and A P s are for large-, medium-, and small-scale evaluations, respectively. Average recall with a maximum detection number of 1, 10, and 100 is denoted by A R 1 , A R 10 , and A R 100 , respectively.

3.2. Experiments on Optimized Heridal Dataset

The optimized Heridal_ForestPerson dataset was used in the experiments, representing the first captured real and high-resolution images for the purpose of person detection from UAVs. We demonstrate how our proposed approach can greatly improve the performance of object detectors by removing their sensitivity limitations when dealing with small objects. Four groups of experiments are considered, including experimental results for the MMD evaluator, analysis results with OIM and SSTM, and the ablation study, with discussion provided of these.

3.2.1. Experimental Results of MMD Evaluator

The CIoU loss was modified by our distance evaluation method based on the YOLOv5 framework and was tested under different depth models to validate the effectiveness of the MMD evaluator. The training curves are presented in Figure 7. As shown, our proposed method outperformed CIoU at A P 0.5 and A P 0.5 : 0.95 , with the magnitude of the improvement varying with the depth of model. As illustrated in Table 2, pretrained model ‘x’ achieved better results in the MMD evaluation experiment, with the training evaluation metrics (recall, A P 0.5 v a l , A P 0.5 t e s t , A P 0.5 : 0.95 v a l , A P 0.5 : 0.95 t e s t ) improving compared to YOLOv5 by 3.27%, 3.0%, 3.77%, 1.5%, and 1.51%, respectively. However, the precision decreased by 3.43%. The pretrained model ‘s’ achieved better detection performance, with only 6.7M parameters and 15.2M GFLOPs. Detection accuracy was acceptable to some extent. Table 2 also reveals that MMD performed better on the ‘s’ model; hence, the primary pretrained model (‘s’) was utilized in the following tests. It should be noted that, based on training experience, batch size has little or no effect on detection performance, so the varied batch sizes were simply used to increase training efficiency and were not compared under the same batch size.

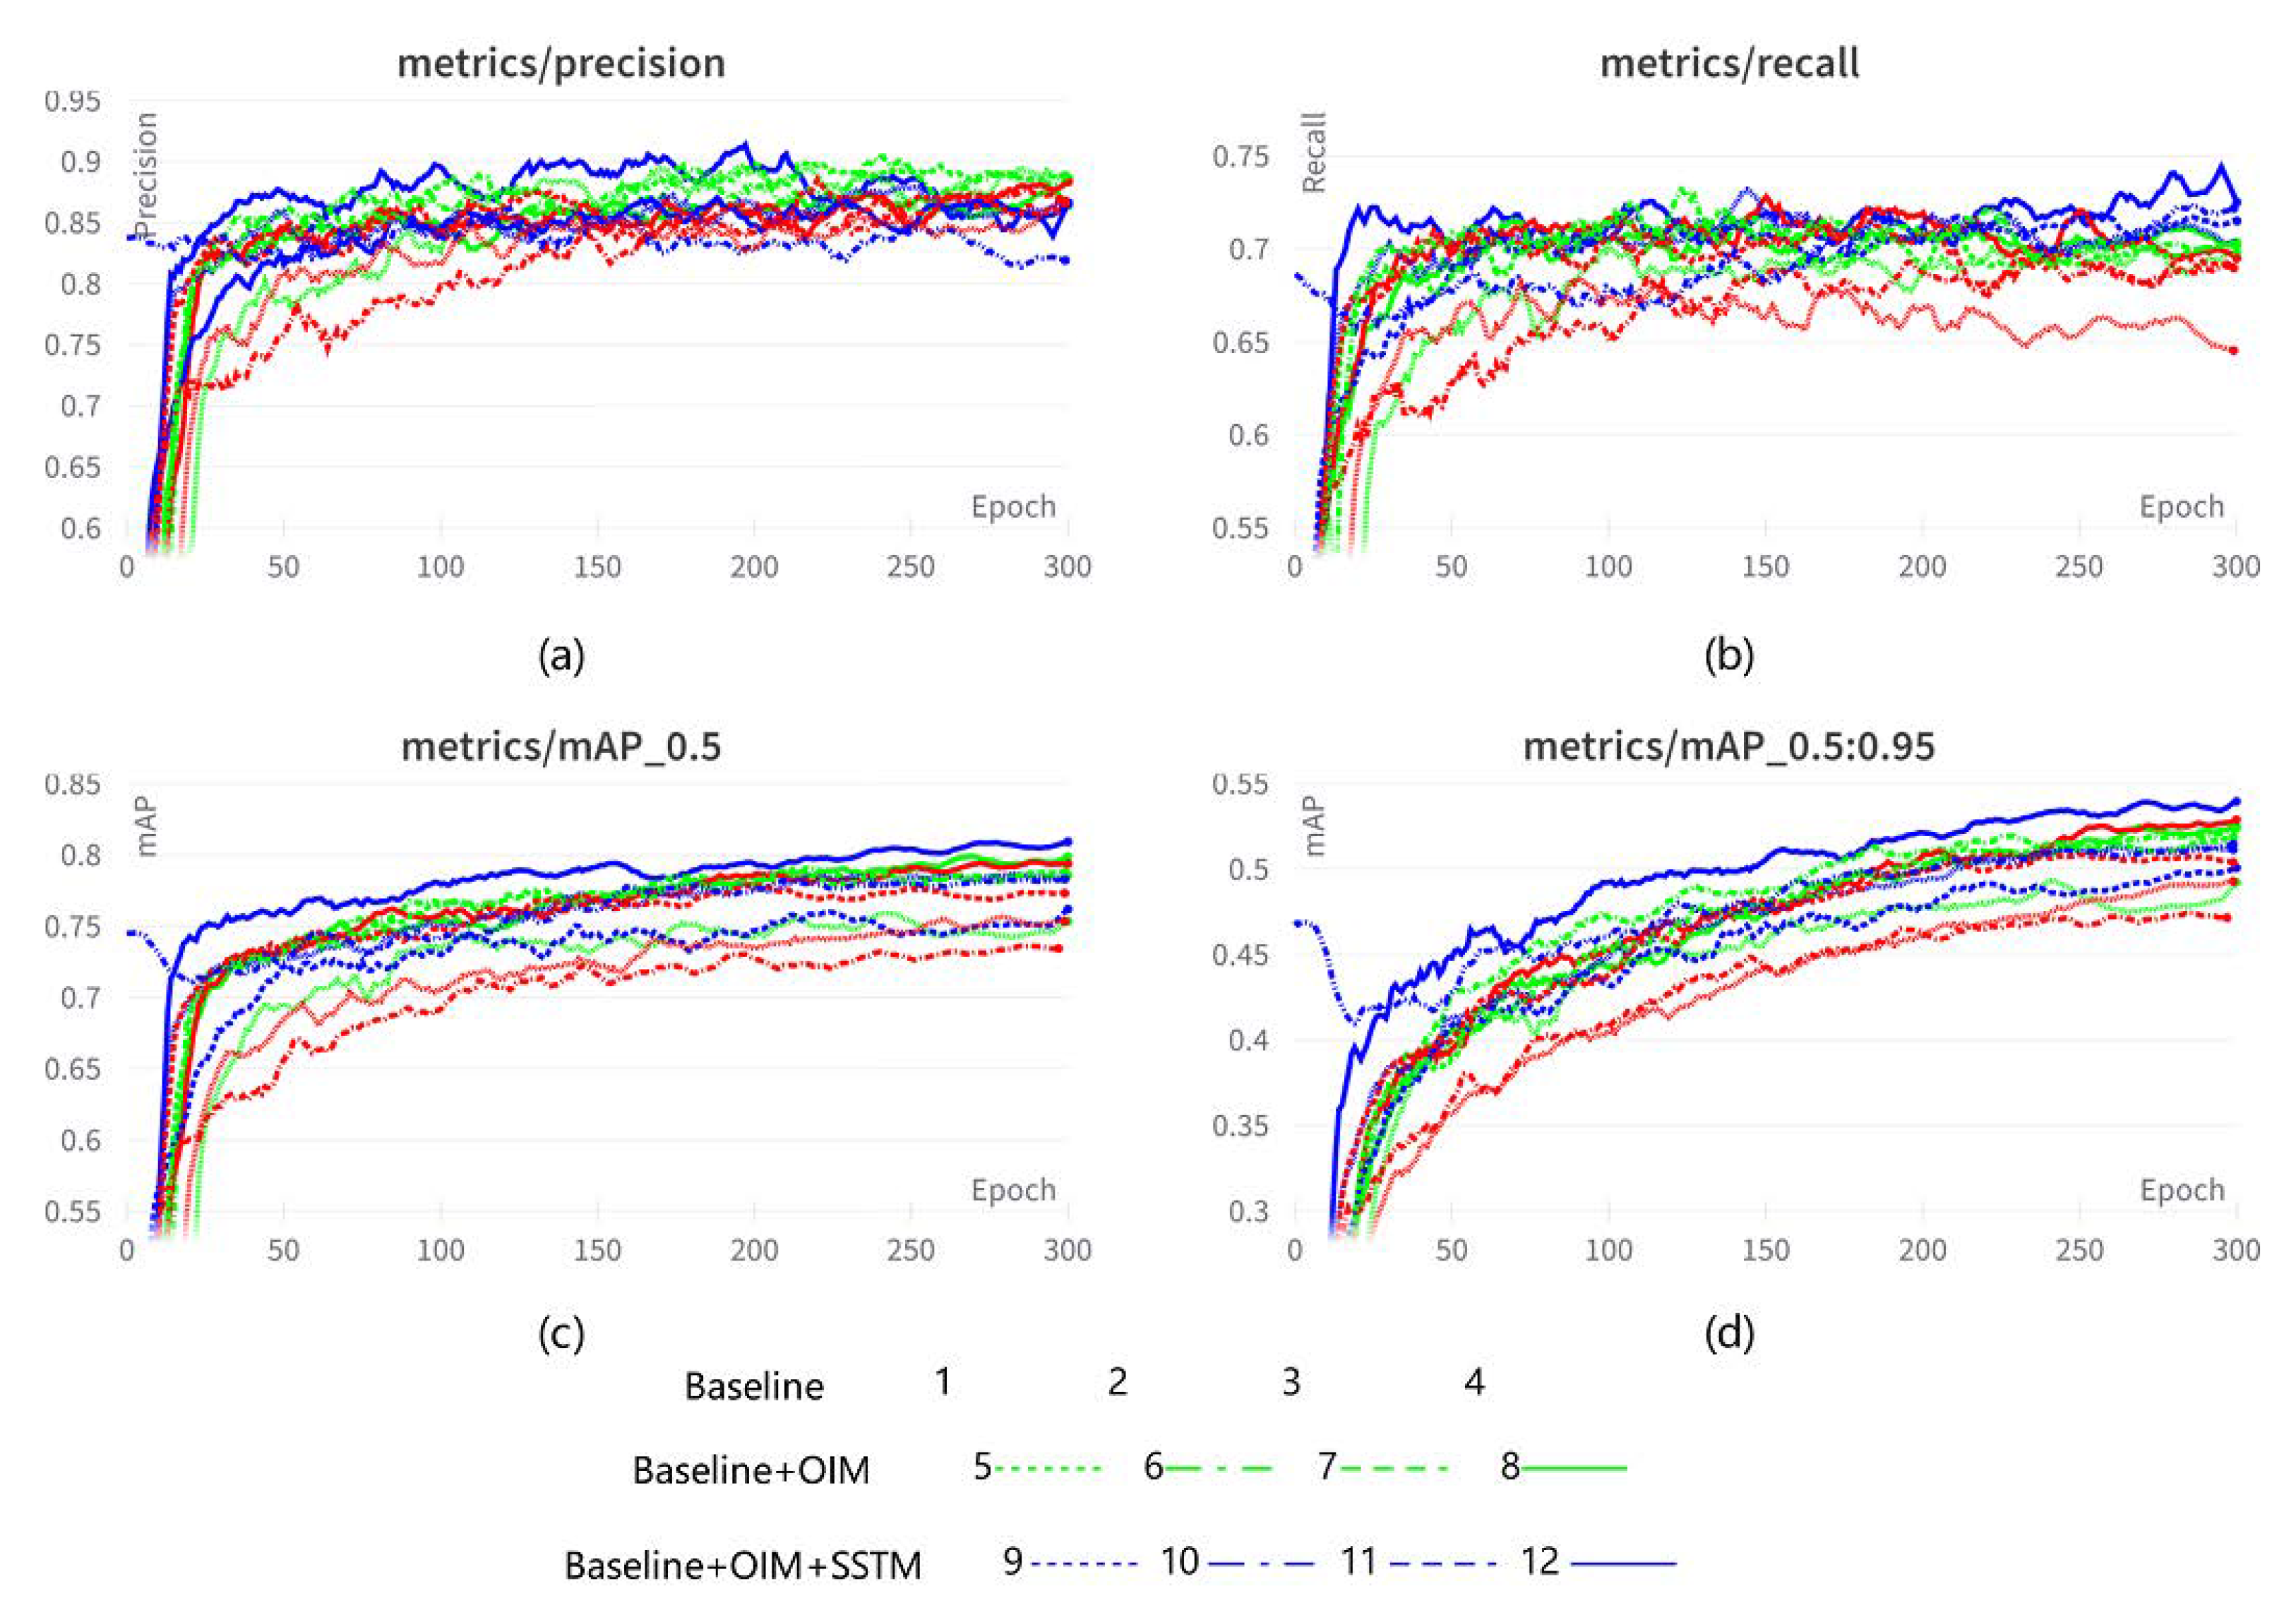
3.2.2. Analysis Results with OIM and SSTM

Since there are not enough person examples in the Heridal_ForestPerson dataset, a copy-paste mechanism to insert instances into the original images was used and then semi-supervised learning was employed to fine-tune the training model. Specifically, positive and negative examples from the Heridal Patch library (the Heridal Patch library refers to saving of crops that groundtruth objects from all samples of Heridal datasets with unified instance size of 81 × 81) were copied onto the samples in a specified proportion, with the repeat option to increase samples. Then, 1000+ segmented samples on the Patch library were manually labeled as the training set for instance segmentation, segmenting of all instances in the Patch library was finished with the help of YOLOv5 and BiSeNet to obtain clean masks without redundant backgrounds, and then these were pasted into the original samples. As shown in Table 3, the sample size for copy-paste with instance segmentation was used as for the simple copy-paste. The original instance size in the Patch library was 81 × 81, but all instances were resized to 32 × 32 to confirm that they belonged to small objects. It is worth noting that the samples were not raised in the test subset, but instead the same sample as Heridal_ForestPerson’s test subset was maintained.
Objects implanted by copy-paste with instance segmentation in Table 3 lack label information, so that re-inference of all newly generated samples is once more required on the pretrained model, achieving higher confidence labels as pseudo-labels. As a result, pseudo-labels and real labels are added to the trainer in a certain proportion. The trainer’s loss function is divided into two parts, the loss of real labels and the loss of pseudo-labels, and the complete loss should be the weighted sum of the two. It should be noted that the CIoU loss is based on the YOLOv5 framework, rather than our proposed MMD-based loss in this subsection. As shown in Figure 8, object implantation with instance segmentation and semi-supervised learning with pseudo-labels can effectively improve the training metrics (recall, A P 0.5 , A P 0.5 : 0.95 ), but improvement in precision is not obvious. The likely explanation is that increasing the number of instances exponentially raises the leakage rate but has less influence on the detection accuracy.
Table 4 defines four critical fine-tuning parameters: copy-paste refers to the number of object implantations, Scale means instances scaling to samples, Loss_Weights refers to the percentage of loss between the real and pseudo-labels. Repeat refers to adjusting different parameters to obtain better detection performance. It was observed that when the parameters [copy-paste, Scale, Loss_Weights, Repeat] = [3, 0.5, 1, No], the Baseline method achieved the best results. When the parameters [copy-paste, Scale, Loss_Weights, Repeat] = [3, 0.9, 0.5, Yes], the OIM method achieved the best results. When the parameters [copy-paste, Scale, Loss_Weights, Repeat] = [3, 0.9, 1, Yes], the OIM + SSTM method achieved the best results. As a result, we believe that more implantation of objects is not better, but too many cases may lead to model overfitting. Second, the scaling of instances was kept as close to the native instance size as possible, and the implanted instances were either too large or too tiny to deteriorate the model’s performance. Due to the issue of training time, the trainer had as many real labels as pseudo-labels, no more ablation experiments were performed, and there was still space for improvement afterwards. The parameter of repeated samples was used in all of our approaches to improve the model’s robustness. By the above method, the best performance metrics [precision, recall, A P 0.5 t e s t , A P 0.5 : 0.95 t e s t ] were [0.8914, 0.7162, 0.8117, 0.5436].

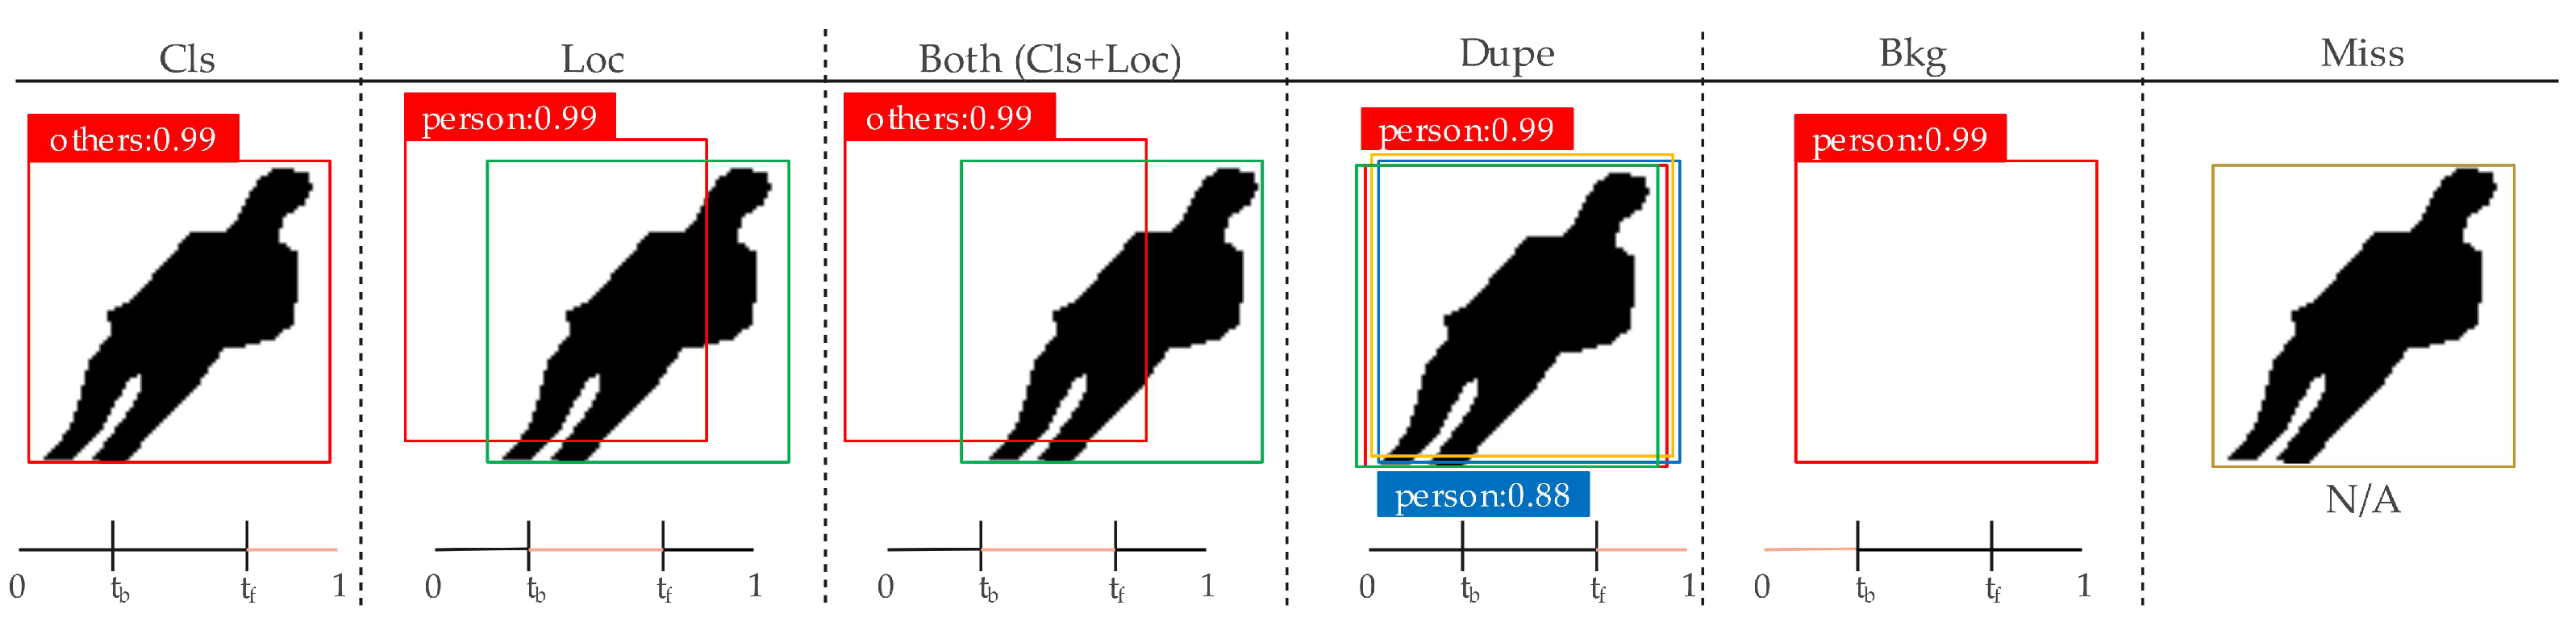
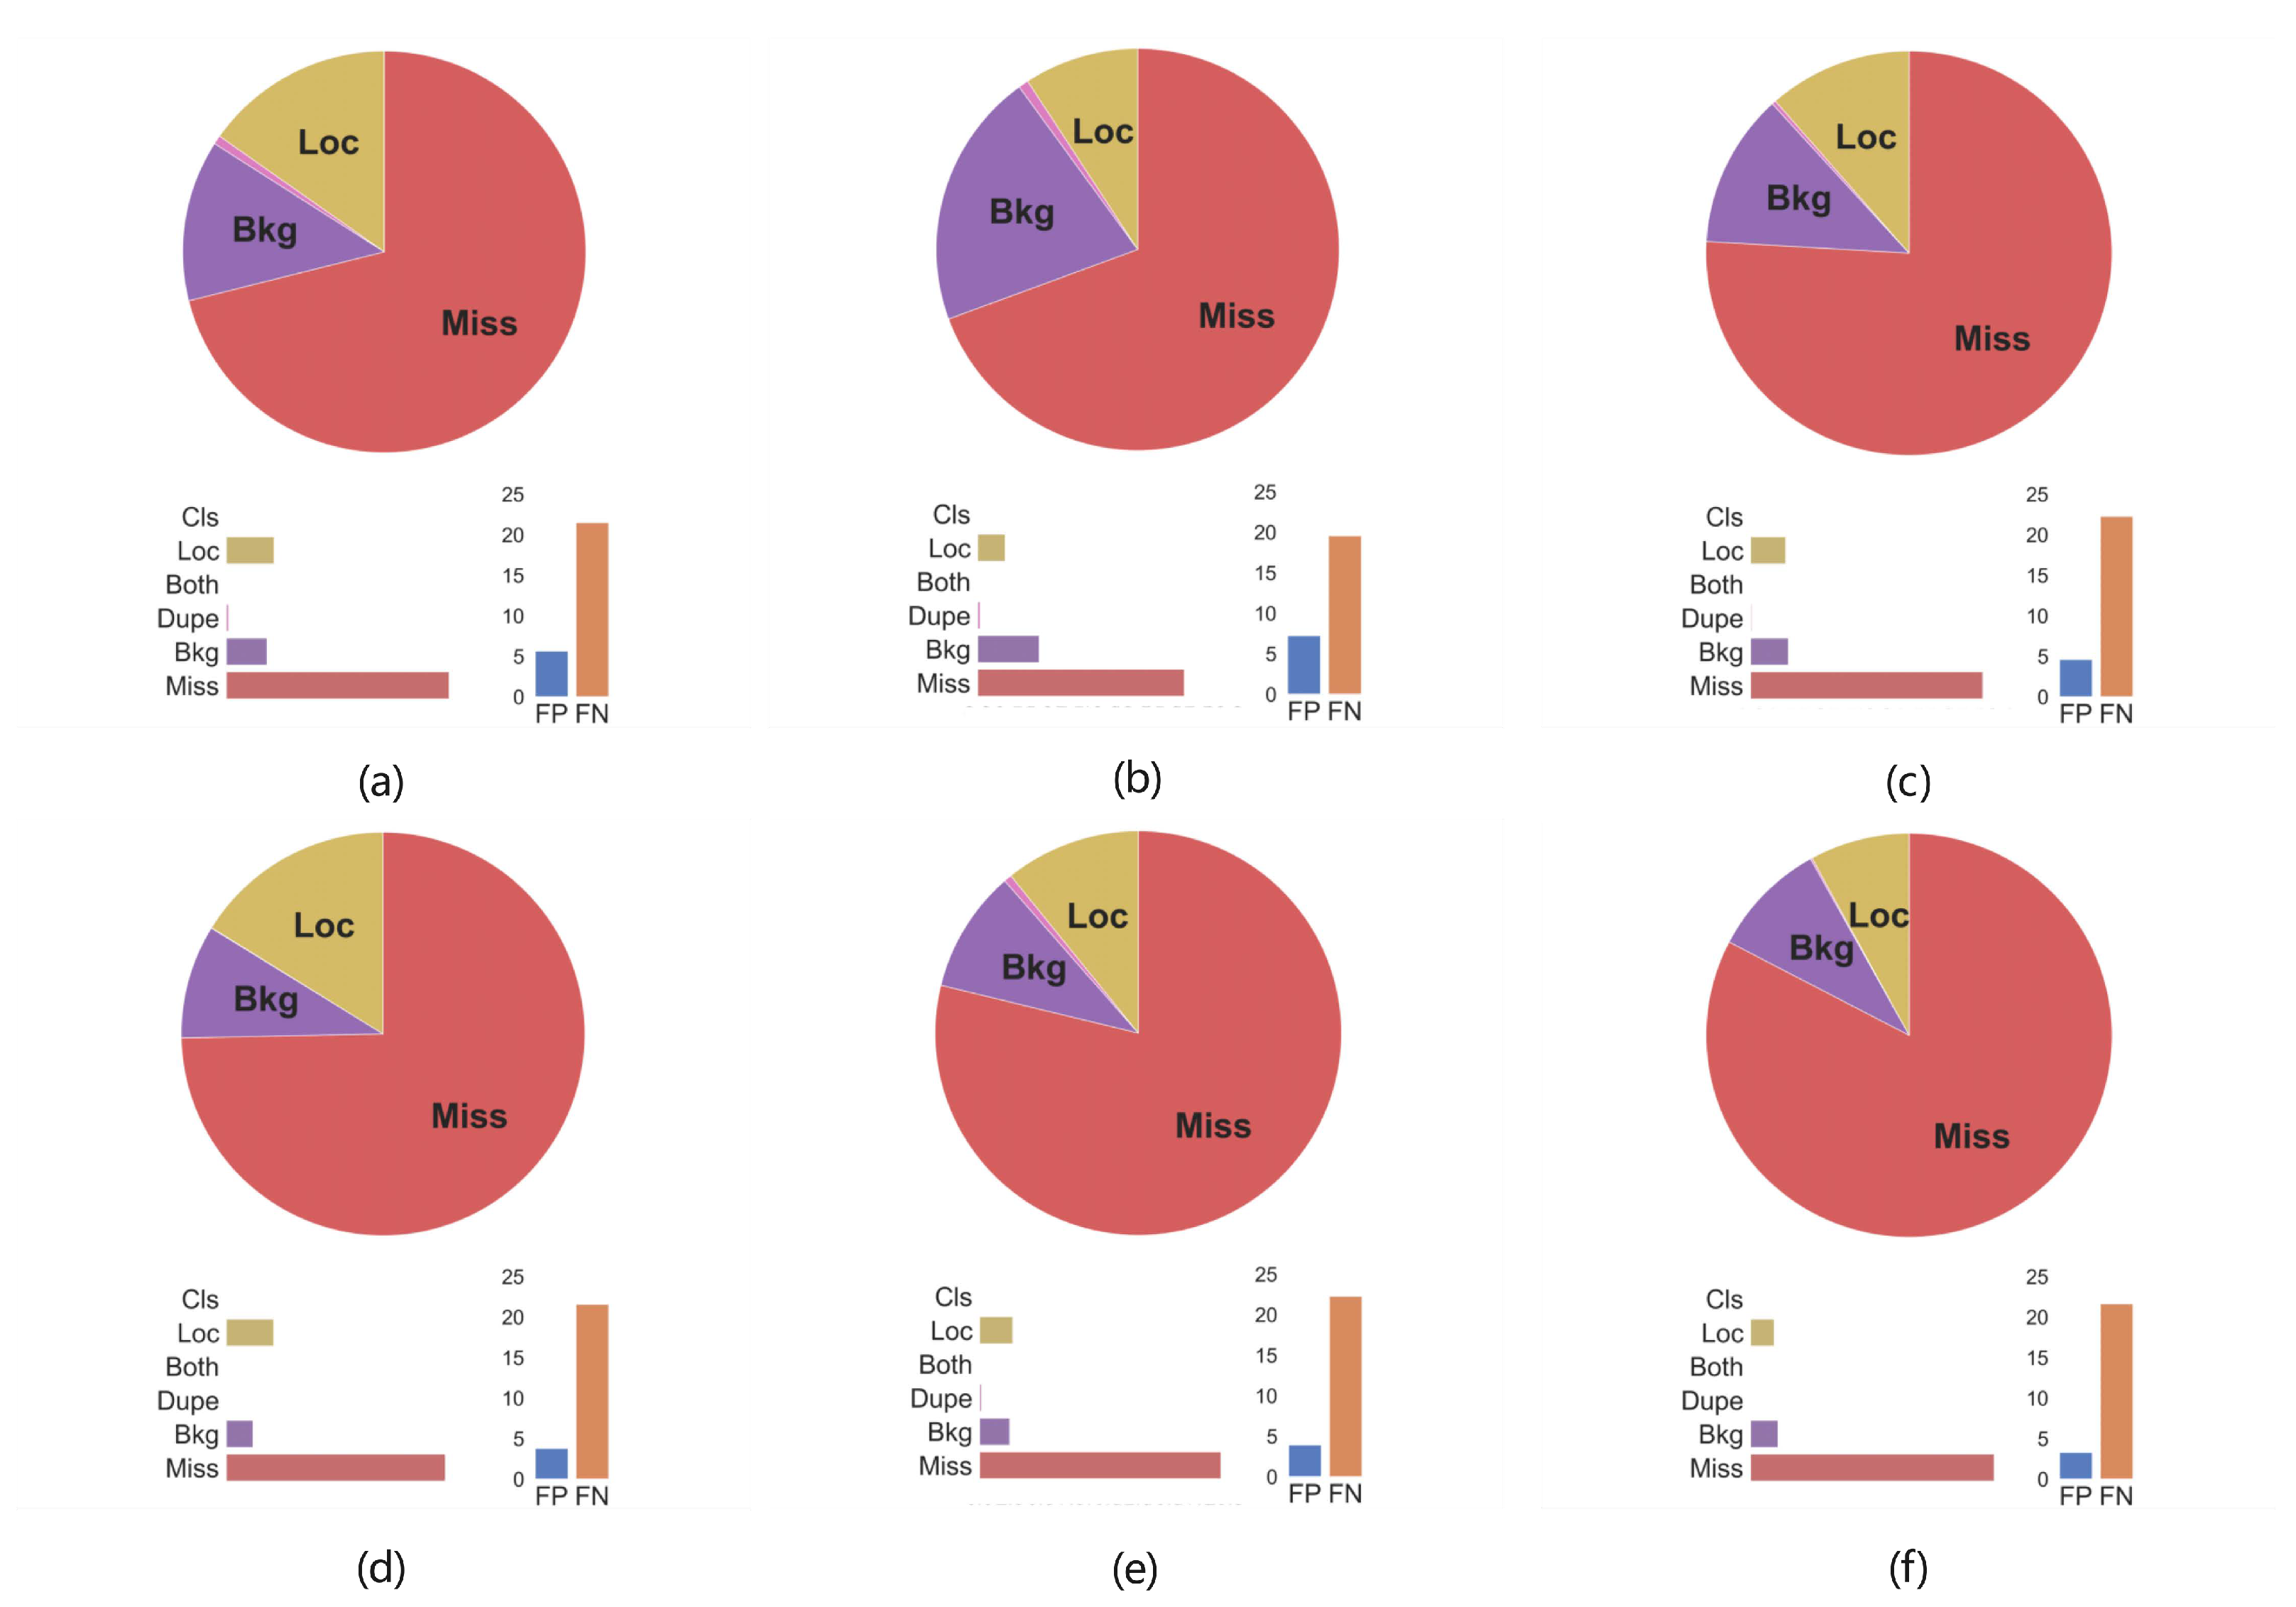
3.2.3. Error Analysis

In order to evaluate causes of the decline in mAP, numerous mistake categories are designed, which can be useful for analyzing the model’s strengths and weaknesses; they can also assist in determining which flaws a trick corrects, hence improving the mAP metrics [34]. As shown in Figure 9, the IoU thresholds t f and t b were set to 0.5 and 0.1, respectively. The definitions of the six mistake categories are:
  • Classification error (Cls), I o U m a x t f , which means localized correctly but classified incorrectly.
  • Localization error (Loc), t b I o U m a x t f , which means classified correctly but localized incorrectly.
  • Classification and localization errors (Both), t b I o U m a x t f , which means classified incorrectly and also localized incorrectly.
  • Duplicate detection error (Dupe), I o U m a x t f , which means multiple detection boxes with various confidence levels.
  • Background error (Bkg), I o U m a x t b , which means background detection boxes, but no instance.
  • Missed GT error (Miss), which means all undetected ground truths, other than Cls and Loc errors.
Fixing an error can facilitate the mAP and evaluate the importance of the error category, by comparing the improvement of mAP to determine the importance of an error. Twelve strategies are analyzed in Table 4 by six error types mentioned in Figure 9. As shown in Table 5, six main errors (Cls, Loc, Both, Dupe, Bkg, Miss) and two special errors (false positive detection (FP), false negative detection (FN)) are counted. Because the Heridal_ ForestPerson dataset contains only one class (person), Cls and Both errors are zero. Miss and FN have the highest errors, which are caused primarily by: (1) Detailed features of small persons practically vanishing after multi-layer convolution, causing a failed regression map to a person’s specific location in the original images; (2) When computed for loss by CIoU, minor position and posture deviation of persons is treated as a negative sample, lowering the detection performance. As shown in Figure 10, the percentage of Miss is more than 50% in all methods, and the Miss error becomes more apparent with the more objects that are implanted. However, the Bkg error achieves lower values to alleviate the imbalance of the positive and negative samples. In addition, object implantation combined with pseudo-label training can help to reduce Loc and Dupe errors. Therefore, under certain parameter settings, methods 5–12 (ours) achieve better detection performance.

3.2.4. Ablation Study

The effectiveness of our strategy was evaluated with the addition of various modules, including CP (copy-paste), OIM (object implantation module), SSTM (semi-supervised training module), CIoU and MMD (maximum mean discrepancy). As shown in Table 6, the detection performance for different combinations of OIM, SSTM, and MMD was compared, where CP and CIoU based on YOLOv5 was set to Baseline. It was observed that the A P 0.5 t e s t obtained with OIM+CIoU was 0.7855, a 3.35% improvement over Baseline with CIoU alone, and a 2.25% improvement over Baseline with CP+CIoU. The A P 0.5 t e s t of OIM+SSTM+CIoU achieved 0.8073, a 2.18% improvement over OIM+CIoU, which showed that semi-supervised learning strategies were effective. Following numerous ablation experiments, the optimal training parameter metrics [precision, recall, A P 0.5 t e s t , A P 0.5 : 0.95 t e s t ] were [0.9152, 0.7389, 0.8079, 0.5436] with the combination of OIM+SSTM+MMD. Furthermore, we found that the reuse of CP and OIM did not always work well, and may have caused the A P 0.5 t e s t to drop (from 0.8115 to 0.8079, and decline by 0.36%).

3.2.5. Discussions

During the inference stage, a variety of practical tips were applied to improve the accuracy of the trained model, most notably including: test-time augmentation (TTA), which entails making multiple augmented copies of each image in the test subset, allowing the model to make predictions, and then returning the set of predictions in each image; model ensembling (ME), which fuses multiple trained models based on the voting method (this article’s method) to achieve better detection results for a fusion-based multimodel; weighted boxes fusion (WBF), which combines and sorts boxes by decreasing the order of the confidence scores; and low-precision parameter quantization (LPPQ) with batch inference (BI) to accelerate model inference. As shown in Table 7, TTA with 2400 × 2400 of input size achieved better A P 0.5 t e s t than the Baseline (improved 1% or so). Compared to TTA, TTA+ME improved by 0.5%; TTA+ME+WBF also resulted in improvement by 1.1%. As a result, employing various augmentation methods during the inference process was able to improve the model’s detection performance by 2.1%. Then, BI and PQ methods were performed to speed up the inference process whereby many tips were stacked on top of each other.

3.2.6. Comparisons with the State-of-The-Art

Firstly, five current techniques were chosen to contrast with our proposed data augmentation, including: Copy-Paste [35], Simple Copy-Paste [36], Mixup [37], CutMix [38] and Mosaic [39]. All the experimental results are shown in Table 8. It can be seen that the CP+SSL method improved the A P I o U = 50 metric of the above methods by 3.45, 1.7, 2.26, 0.42 and 0.6 AP points, respectively. Secondly, the detection performance in label alignment with IoU evaluation on the basis of data augmentation was investigated, including: CIoU [25], DIoU [27], GIoU [26], EIoU [28], Alpha-IoU [40], SIoU [41], and label alignment with distance evaluation, including, DotD [42] and NWD [43]. Distance evaluation yielded higher detector AP metrics than IoU evaluation, and the CP+SSL+MMD method outperformed the best distance evaluation method by 1.16%. Finally, multiple detection algorithms on the basis of data augmentation, including single-stage anchor-based detectors—YOLO series [30,39,44,45], SSD [46], RetinaNet [47]—and a two-stage anchor-based detector, Faster R-CNN [48], were compared to our proposed multi-strategy collaboration method. When compared to existing methods, our algorithm offered some advantages in both AP and AR. The performance improvements were encouraging and were even more obvious when the objects were extremely tiny.

3.3. Experiments on Other Datasets

To further demonstrate the effectiveness of our proposed method, we compared it to typical detection algorithms based on MMDetection (https://github.com/open-mmlab/mmdetection, accessed on 15 March 2023) and the YOLOAir (https://github.com/iscyy/yoloair, accessed on 15 March 2023) toolkit. The original and optimized datasets used in the trials can be found in Table 1.

3.3.1. Comparative Experiments on Optimized Datasets

To verify the resilience of our approach on diverse datasets, it was compared separately to the SOTA algorithms. The default public test results were performed on the original dataset, and the training metrics on the optimized dataset were performed with our method in this study. As shown in Table 9, our proposed approach significantly improved detection performance on the optimized dataset, paving the way for commercial applications of SaR tasks.

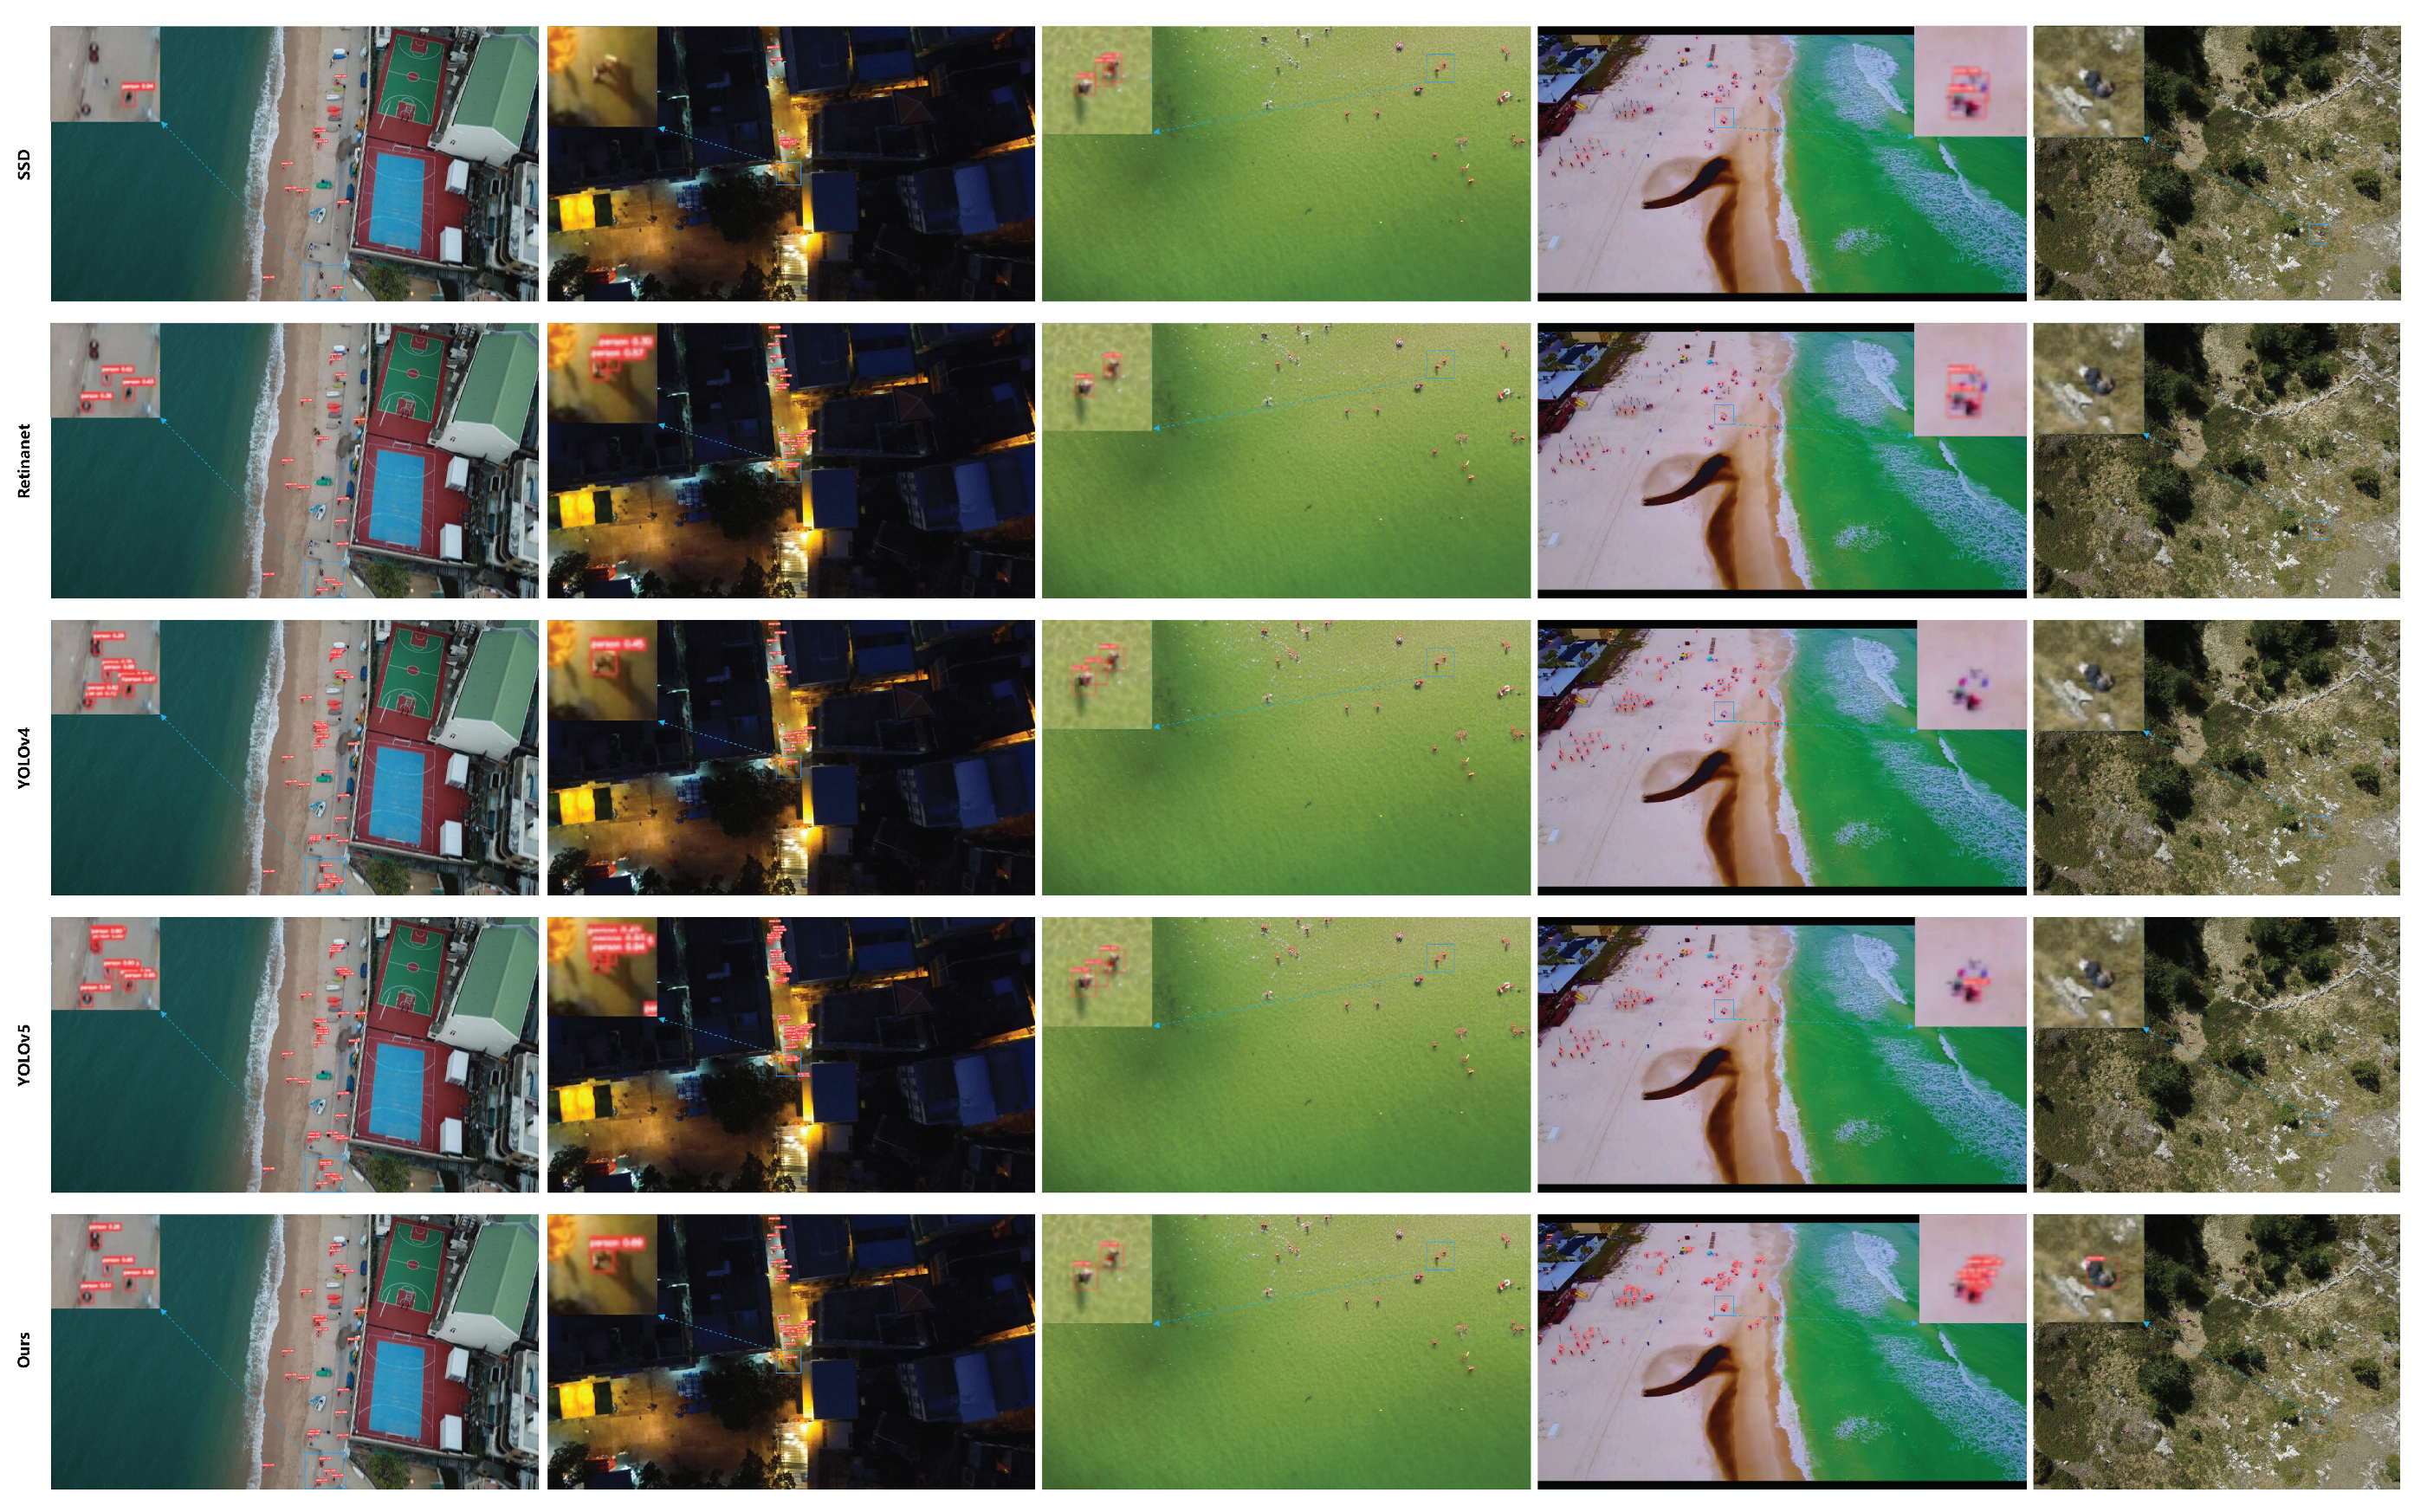
3.3.2. Visualization

Figure 11 depicts some visualization findings for baseline detectors and our proposed detectors in five scenarios, which are from our created VHTA dataset. The detection results show a significant improvement when compared to the baseline detectors. In particular, the following observations can be made: The most noticeable improvement was that our proposed method was able to significantly reduce FN. When detecting microscopic objects, FN is a common scenario with baseline detectors due to a lack of supervisory information. It was also shown that anchor-based detectors can learn enough supervision information from positive small samples when equipped with YOLO series. Furthermore, a considerable number of FPs may be detected in the SSD detection results, indicating that SSD fails to categorize correct predictions from numerous detection candidates. Surprisingly, our method can correctly handle FP detections, meaning that the assigned positive/negative samples are of higher quality.

4. Conclusions

In this article, a method for person detection in aerial images using multi-strategy collaboration is proposed, which aims to tackle the difficulty of small object detection and the problem of few samples in the SaR task. Practical, reliable and multi-scene SaR data are created to fusion person (also including pedestrians, people, and human beings) labels from publicly available datasets. In response to small and unbalanced samples, synthetic samples are generated with object implantation methods and virtual synthesis software; meanwhile, combined instance segmentation with semi-supervised learning achieves more unreliable pseudo-labels. To address the low tolerance of existing IoU evaluation methods for tiny objects, a better metric is designed based on the maximum mean discrepancy distance to measure the similarity of the bounding boxes. The experimental results obtained demonstrate that the proposed method is more accurate than the considered benchmark methods for person detection in SaR scenarios.

Author Contributions

X.Z.: methodology, writing—original draft; Y.F.: validation, writing—review and editing; S.Z.: funding acquisition; N.W.: data curation, software; S.M.: project administration; resources; M.H.: formal analysis, supervision. All authors have read and agreed to the published version of the manuscript.

Funding

This research was funded by the National Natural Science Foundation of China under grant numbers 62271409 and 62262067.

Data Availability Statement

The data presented in this study are openly available on the website: VisDrone (http://aiskyeye.com/download/, accessed on 15 March 2023), TinyPerson (https://github.com/ucas-vg/TinyBenchmark, accessed on 15 March 2023), Heridal (http://ipSaR.fesb.unist.hr/HERIDAL%20database.html, accessed on 15 March 2023), AFO (http://afo-dataset.pl/download/, accessed on 15 March 2023).

Acknowledgments

The authors thank the anonymous reviewers for their suggestions and insightful comments on this article.

Conflicts of Interest

The authors declare no conflict of interest.

References

  1. Martinez-Alpiste, I.; Golcarenarenji, G.; Wang, Q.; Alcaraz-Calero, J.M. Search and rescue operation using UAVs: A case study. Expert Syst. Appl. 2021, 178, 114937. [Google Scholar] [CrossRef]
  2. Niedzielski, T.; Jurecka, M.; Miziński, B.; Pawul, W.; Motyl, T. First Successful Rescue of a Lost Person Using the Human Detection System: A Case Study from Beskid Niski (SE Poland). Remote. Sens. 2021, 13, 4903. [Google Scholar] [CrossRef]
  3. Varga, L.A.; Kiefer, B.; Messmer, M.; Zell, A. SeaDronesSee: A Maritime Benchmark for Detecting Humans in Open Water. In Proceedings of the 2022 IEEE/CVF Winter Conference on Applications of Computer Vision (WACV), Waikoloa, HI, USA, 3–8 January 2022. [Google Scholar] [CrossRef]
  4. Gasienica-Jozkowy, J.; Knapik, M.; Cyganek, B. An ensemble deep learning method with optimized weights for drone-based water rescue and surveillance. Integr. -Comput. -Aided Eng. 2021, 28, 221–235. [Google Scholar] [CrossRef]
  5. Božić-Štulić, D.; Marušić, Ž.; Gotovac, S. Deep Learning Approach in Aerial Imagery for Supporting Land Search and Rescue Missions. Int. J. Comput. Vis. 2019, 127, 1256–1278. [Google Scholar] [CrossRef]
  6. Pyrrö, P.; Naseri, H.; Jung, A. Rethinking Drone-Based Search and Rescue with Aerial Person Detection. arXiv 2021, arXiv:2111.09406. [Google Scholar]
  7. Marušić, Ž.; Božić-Štulić, D.; Gotovac, S.; Marušić, T. Region proposal approach for human detection on aerial imagery. In Proceedings of the 2018 3rd International Conference on Smart and Sustainable Technologies (SpliTech), Split, Croatia, 26–29 June 2018; pp. 1–6. [Google Scholar]
  8. Vasić, M.K.; Papić, V. Multimodel Deep Learning for Person Detection in Aerial Images. Electronics 2020, 9, 1459. [Google Scholar] [CrossRef]
  9. Mei, S.; Geng, Y.; Hou, J.; Du, Q. Learning hyperspectral images from RGB images via a coarse-to-fine CNN. Sci. China Inf. Sci. 2021, 65. [Google Scholar] [CrossRef]
  10. Mei, S.; Li, X.; Liu, X.; Cai, H.; Du, Q. Hyperspectral Image Classification Using Attention-Based Bidirectional Long Short-Term Memory Network. IEEE Trans. Geosci. Remote. Sens. 2022, 60, 1–12. [Google Scholar] [CrossRef]
  11. Mei, S.; Chen, X.; Zhang, Y.; Li, J.; Plaza, A. Accelerating Convolutional Neural Network-Based Hyperspectral Image Classification by Step Activation Quantization. IEEE Trans. Geosci. Remote. Sens. 2022, 60, 1–12. [Google Scholar] [CrossRef]
  12. Cheng, G.; Lang, C.; Wu, M.; Xie, X.; Yao, X.; Han, J. Feature enhancement network for object detection in optical remote sensing images. J. Remote. Sens. 2021, 48, 19–32. [Google Scholar] [CrossRef]
  13. Fu, J.; Sun, X.; Wang, Z.; Fu, K. An Anchor-Free Method Based on Feature Balancing and Refinement Network for Multiscale Ship Detection in SAR Images. IEEE Trans. Geosci. Remote. Sens. 2021, 59, 1331–1344. [Google Scholar] [CrossRef]
  14. Wang, L.; Yang, X.; Tan, H.; Bai, X.; Zhou, F. Few-Shot Class-Incremental SAR Target Recognition Based on Hierarchical Embedding and Incremental Evolutionary Network. IEEE Trans. Geosci. Remote. Sens. 2023, 61, 1–11. [Google Scholar] [CrossRef]
  15. Fu, K.; Fu, J.; Wang, Z.; Sun, X. Scattering-Keypoint-Guided Network for Oriented Ship Detection in High-Resolution and Large-Scale SAR Images. IEEE J. Sel. Top. Appl. Earth Obs. Remote. Sens. 2021, 14, 11162–11178. [Google Scholar] [CrossRef]
  16. Yu, Z.; Chen, L.; Cheng, Z.; Luo, J. TransMatch: A Transfer-Learning Scheme for Semi-Supervised Few-Shot Learning. In Proceedings of the 2020 IEEE/CVF Conference on Computer Vision and Pattern Recognition (CVPR, Seattle, WA, USA, 13–19 June 2020. [Google Scholar] [CrossRef]
  17. Choi, J.; Elezi, I.; Lee, H.J.; Farabet, C.; Alvarez, J.M. Active Learning for Deep Object Detection via Probabilistic Modeling. In Proceedings of the 2021 IEEE/CVF International Conference on Computer Vision (ICCV), Montreal, QC, Canada, 10–17 October 2021. [Google Scholar] [CrossRef]
  18. Abuduweili, A.; Li, X.; Shi, H.; Xu, C.Z.; Dou, D. Adaptive Consistency Regularization for Semi-Supervised Transfer Learning. In Proceedings of the 2021 IEEE/CVF Conference on Computer Vision and Pattern Recognition (CVPR), Nashville, TN, USA, 20–25 June 2021. [Google Scholar] [CrossRef]
  19. Li, H.; Wu, Z.; Shrivastava, A.; Davis, L.S. Rethinking Pseudo Labels for Semi-supervised Object Detection. Proc. AAAI Conf. Artif. Intell. 2022, 36, 1314–1322. [Google Scholar] [CrossRef]
  20. Jeong, J.; Lee, S.; Kim, J.; Kwak, N. Consistency-Based Semi-Supervised Learning for Object Detection. In Advances in Neural Information Processing Systems; Wallach, H., Larochelle, H., Beygelzimer, A., dAlché Buc, F., Fox, E., Garnett, R., Eds.; Curran Associates, Inc.: Brooklyn, NY, USA, 2019; Volume 32. [Google Scholar]
  21. Sohn, K.; Zhang, Z.; Li, C.L.; Zhang, H.; Lee, C.Y.; Pfister, T. A Simple Semi-Supervised Learning Framework for Object Detection. arXiv 2005, arXiv:cs/2005.04757. [Google Scholar]
  22. Zhou, Q.; Yu, C.; Wang, Z.; Qian, Q.; Li, H. Instant-Teaching: An End-to-End Semi-Supervised Object Detection Framework. In Proceedings of the 2021 IEEE/CVF Conference on Computer Vision and Pattern Recognition (CVPR), Nashville, TN, USA, 20–25 June 2021. [Google Scholar] [CrossRef]
  23. Wang, Z.; Li, Y.; Guo, Y.; Fang, L.; Wang, S. Data-Uncertainty Guided Multi-Phase Learning for Semi-Supervised Object Detection. In Proceedings of the 2021 IEEE/CVF Conference on Computer Vision and Pattern Recognition (CVPR), Nashville, TN, USA, 20–25 June 2021. [Google Scholar] [CrossRef]
  24. Liu, Y.C.; Ma, C.Y.; Kira, Z. Unbiased Teacher v2: Semi-supervised Object Detection for Anchor-free and Anchor-based Detectors. In Proceedings of the 2022 IEEE/CVF Conference on Computer Vision and Pattern Recognition (CVPR), New Orleans, LA, USA, 18–24 June 2022. [Google Scholar] [CrossRef]
  25. Jiang, B.; Luo, R.; Mao, J.; Xiao, T.; Jiang, Y. Acquisition of Localization Confidence for Accurate Object Detection. In Computer Vision–ECCV 2018; Springer International Publishing: Berlin/Heidelberg, Germany, 2018; pp. 816–832. [Google Scholar] [CrossRef] [Green Version]
  26. Rezatofighi, H.; Tsoi, N.; Gwak, J.; Sadeghian, A.; Reid, I.; Savarese, S. Generalized Intersection Over Union: A Metric and a Loss for Bounding Box Regression. In Proceedings of the 2019 IEEE/CVF Conference on Computer Vision and Pattern Recognition (CVPR), Long Beach, CA, USA, 15–20 June 2019. [Google Scholar] [CrossRef] [Green Version]
  27. Zheng, Z.; Wang, P.; Liu, W.; Li, J.; Ye, R.; Ren, D. Distance-IoU Loss: Faster and Better Learning for Bounding Box Regression. Proc. AAAI Conf. Artif. Intell. 2020, 34, 12993–13000. [Google Scholar] [CrossRef]
  28. Zhang, Y.F.; Ren, W.; Zhang, Z.; Jia, Z.; Wang, L.; Tan, T. Focal and efficient IOU loss for accurate bounding box regression. Neurocomputing 2022, 506, 146–157. [Google Scholar] [CrossRef]
  29. Pan, S.J.; Kwok, J.T.; Yang, Q. Transfer Learning via Dimensionality Reduction. In Proceedings of the 23rd National Conference on Artificial Intelligence—Volume 2; AAAI Press: Chicago, IL, USA, 2008; pp. 677–682. [Google Scholar]
  30. Zhu, X.; Lyu, S.; Wang, X.; Zhao, Q. TPH-YOLOv5: Improved YOLOv5 Based on Transformer Prediction Head for Object Detection on Drone-captured Scenarios. In Proceedings of the 2021 IEEE/CVF International Conference on Computer Vision Workshops (ICCVW), Montreal, BC, Canada, 11–17 October 2021. [Google Scholar]
  31. Cheng, G.; Yuan, X.; Yao, X.; Yan, K.; Zeng, Q.; Han, J. Towards Large-Scale Small Object Detection: Survey and Benchmarks. arXiv 2022, arXiv:2207.14096. [Google Scholar]
  32. Yu, C.; Gao, C.; Wang, J.; Yu, G.; Shen, C.; Sang, N. Bisenet v2: Bilateral network with guided aggregation for real-time semantic segmentation. Int. J. Comput. Vis. 2021, 129, 3051–3068. [Google Scholar] [CrossRef]
  33. Du, D.; Zhu, P.; Wen, L.; Bian, X.; Lin, H. VisDrone-DET2019: The Vision Meets Drone Object Detection in Image Challenge Results. In Proceedings of the 2019 IEEE/CVF International Conference on Computer Vision Workshop (ICCVW), Seoul, Republic of Korea, 27–28 October 2019. [Google Scholar] [CrossRef]
  34. Bolya, D.; Foley, S.; Hays, J.; Hoffman, J. TIDE: A General Toolbox for Identifying Object Detection Errors. In Computer Vision–ECCV 2020; Springer: Berlin/Heidelberg, Germany, 2020; pp. 558–573. [Google Scholar] [CrossRef]
  35. Kisantal, M.; Wojna, Z.; Murawski, J.; Naruniec, J.; Cho, K. Augmentation for small object detection. In Proceedings of the 9th International Conference on Advances in Computing and Information Technology (ACITY 2019), Sydney, Australia, 21–22 December 2019. [Google Scholar]
  36. Ghiasi, G.; Cui, Y.; Srinivas, A.; Qian, R.; Lin, T.Y.; Cubuk, E.D.; Le, Q.V.; Zoph, B. Simple Copy-Paste is a Strong Data Augmentation Method for Instance Segmentation. In Proceedings of the 2021 IEEE/CVF Conference on Computer Vision and Pattern Recognition (CVPR), Nashville, TN, USA, 20–25 June 2021. [Google Scholar] [CrossRef]
  37. Zhang, H.; Cisse, M.; Dauphin, Y.N.; Lopez-Paz, D. Mixup: Beyond Empirical Risk Minimization. arXiv 2022, arXiv:1710.09412. [Google Scholar]
  38. Yun, S.; Han, D.; Chun, S.; Oh, S.J.; Yoo, Y.; Choe, J. CutMix: Regularization Strategy to Train Strong Classifiers with Localizable Features. In Proceedings of the 2019 IEEE/CVF International Conference on Computer Vision (ICCV), Seoul, Republic of Korea, 27 October–2 November 2019. [Google Scholar] [CrossRef] [Green Version]
  39. Bochkovskiy, A.; Wang, C.Y.; Liao, H.Y.M. YOLOv4: Optimal Speed and Accuracy of Object Detection. arXiv 2020, arXiv:2004.10934. [Google Scholar]
  40. He, J.; Erfani, S.; Ma, X.; Bailey, J.; Chi, Y.; Hua, X.S. alphaIoU: A Family of Power Intersection over Union Losses for Bounding Box Regression. Adv. Neural Inf. Process. Syst. 2021, 34, 20230–20242. [Google Scholar]
  41. Gevorgyan, Z. SIoU Loss: More Powerful Learning for Bounding Box Regression. arXiv 2022, arXiv:2205.12740. [Google Scholar]
  42. Xu, C.; Wang, J.; Yang, W.; Yu, L. Dot Distance for Tiny Object Detection in Aerial Images; IEEE: Piscataway, NJ, USA, 2021; pp. 1192–1201. [Google Scholar]
  43. Xu, C.; Wang, J.; Yang, W.; Yu, H.; Yu, L.; Xia, G.S. Detecting Tiny Objects in Aerial Images: A Normalized Wasserstein Distance and a New Benchmark. ISPRS J. Photogramm. Remote. Sens. 2022, 190, 79–93. [Google Scholar] [CrossRef]
  44. Li, C.; Li, L.; Jiang, H.; Weng, K.; Geng, Y.; Li, L.; Ke, Z.; Li, Q.; Cheng, M.; Nie, W.; et al. YOLOv6: A Single-Stage Object Detection Framework for Industrial Applications. arXiv 2022, arXiv:2209.02976. [Google Scholar]
  45. Wang, C.Y.; Bochkovskiy, A.; Liao, H.Y.M. YOLOv7: Trainable Bag-of-Freebies Sets New State-of-the-Art for Real-Time Object Detectors. arXiv 2023, arXiv:2207.02696. [Google Scholar]
  46. Nagrath, P.; Jain, R.; Madan, A.; Arora, R.; Kataria, P.; Hemanth, J. SSDMNV2: A real time DNN-based face mask detection system using single shot multibox detector and MobileNetV2. Sustain. Cities Soc. 2021, 66, 102692. [Google Scholar] [CrossRef]
  47. Lin, T.Y.; Goyal, P.; Girshick, R.; He, K.; Dollar, P. Focal Loss for Dense Object Detection. In Proceedings of the 2017 IEEE International Conference on Computer Vision (ICCV), Venice, Italy, 22–29 October 2017. [Google Scholar] [CrossRef] [Green Version]
  48. Ren, S.; He, K.; Girshick, R.; Sun, J. Faster R-CNN: Towards Real-Time Object Detection with Region Proposal Networks. IEEE Trans. Pattern Anal. Mach. 2017, 39, 1137–1149. [Google Scholar] [CrossRef] [PubMed] [Green Version]
  49. Chen, Q.; Wang, Y.; Yang, T.; Zhang, X.; Cheng, J.; Sun, J. You Only Look One-Level Feature. In Proceedings of the IEEE/CVF Conference on Computer Vision and Pattern Recognition, Nashville, TN, USA, 20–25 June 2021; pp. 13039–13048. [Google Scholar]
  50. Ge, Z.; Liu, S.; Wang, F.; Li, Z.; Sun, J. YOLOX: Exceeding YOLO Series in 2021. arXiv 2021, arXiv:2107.08430. [Google Scholar]
  51. Zhang, X.; Feng, Y.; Zhang, S.; Wang, N.; Mei, S. Finding Nonrigid Tiny Person With Densely Cropped and Local Attention Object Detector Networks in Low-Altitude Aerial Images. IEEE J. Sel. Top. Appl. Earth Obs. Remote. Sens. 2022, 15, 4371–4385. [Google Scholar] [CrossRef]
  52. Tian, Z.; Shen, C.; Chen, H.; He, T. FCOS: Fully Convolutional One-Stage Object Detection. In Proceedings of the 2019 IEEE/CVF International Conference on Computer Vision (ICCV), Seoul, Republic of Korea, 27 October–2 November 2019. [Google Scholar] [CrossRef] [Green Version]
  53. Liu, Z.; Gao, G.; Sun, L.; Fang, Z. HRDNet: High-Resolution Detection Network for Small Objects. In Proceedings of the 2021 IEEE International Conference on Multimedia and Expo (ICME), Shenzhen, China, 5–9 July 2021. [Google Scholar]
Figure 1. General framework of our proposed method. It mainly includes four separate modules: OIM is used to generate rich and diverse samples with ISCP; SSTM improves the generalization ability of the model by iteratively training the authenticity labels; MMD is an optimized bounding box loss evaluation method that replaces IoU analysis to detect performance metrics; All of the above modules are embedded into the detector. Note that there are slight modifications in the tactics employed in the training and detection phases.
Remotesensing 15 02928 g001
Figure 2. MMD-based detectors with transfer learning. Input data sources include files, pictures, video streams, and cameras. The MMD evaluation method is either incorporated as a distinct module or integrated directly into the loss function of the anchor-based detector.
Remotesensing 15 02928 g002
Figure 3. Synthetic data generation with instance segmentation on the OML.
Remotesensing 15 02928 g003
Figure 4. Anchor-based detector with decoupled head to support instance segmentation. YOLOv5 includes CBS, CSPX_X, SPPF, and CBR modules, whereas BiSeNet adds ARM and FFM modules, mostly to include the BiSeNet network structure in the detector’s neck.
Remotesensing 15 02928 g004
Figure 5. Pseudo-label co-training and model ensemble learning.
Remotesensing 15 02928 g005
Figure 6. Instances comparison in various datasets, including MS-COCO, VisDrone, Heridal, TinyPerson, AFO and VHTA datasets. (a) Distribution of samples in various SaR scenes. (b) Statistics of ground truth of person category. (c) Statistics of coordinates (center point [x, y]) of person category. (d) Statistics of aspect ratio ([width, height]) of person category.
Remotesensing 15 02928 g006
Figure 7. Comparison of MMD and CIoU training curves for various depth models with the Heridal_ForestPerson dataset. (ad) refer to metrics of object detection, including precision, recall, mAP_0.5, and mAP_0.5:0.95. Solid curve colors represent MMD evaluation results under different depth models. Dash curve colors represent CIoU evaluation results under different depth models. ‘x’, ‘l’, ‘m’, ‘s’ and ‘n’ denote the depth of the different backbones of the pretrained models, respectively. All benchmarks tested in YOLOv5 framework.
Remotesensing 15 02928 g007
Figure 8. Training curves on the Heridal_ForestPerson dataset with object implantation and semi-supervised learning. (ad) refer to metrics of object detection, including precision, recall, mAP_0.5, and mAP_0.5:0.95. On the Heridal_ForestPerson dataset, the red, green, and blue curves reflect the training outcomes of YOLOv5, YOLOv5 + copy-paste with instance segmentation, and YOLOv5 + copy-paste with instance segmentation + semi-supervised learning, respectively. Different lines represent various object implantation strategies. All the experimental results were tested with the ‘s’ pretrained model.
Remotesensing 15 02928 g008
Figure 9. Define six mistake categories. False positive (FP) detection is represented by red boxes, True positive (TP) detection by green boxes, and ground truth (GT) by blue boxes. The IoU between boxes with GT is indicated by an orange highlight at the bottom of the subplots.
Remotesensing 15 02928 g009
Figure 10. Summary of errors on the Heridal_ForestPerson dataset. (af) represent errors in methods Nos. 3, 4, 7, 8, 11, and 12 from Table 5.
Remotesensing 15 02928 g010
Figure 11. Visualization of detection results using baseline detectors (first four rows) and our proposed detector (the fifth row) of our created VHTA dataset. The test results of the various methods have been partially enlarged for clarity.
Remotesensing 15 02928 g011
Table 1. Comparison of typical datasets and optimization labels of persons in drone-based scenarios.
DatasetDescriptionCategoriesPublished_YearSrc_SizeNumber of Samples
Train_SetVal_SetTest_SetTotal
VisDrone2019UAVs collected samples from 14
different cities in China, including rectangular labels for
10 common objects.
[pedestrian, person, car, van, bus,
bus, truck, motor, bicycle,
awning tricycle, tricycle, ignore]
ICCV_20191920 × 1080,
1360 × 765,
960 × 540, etc.
647154815808599
HeridalFound lost persons in non-urban terrain: mountains,
forests, deserts, etc.
[person]IJCV_20194000 × 30001548-1021650
TinyPersonThe first long-distance person detection benchmark
dataset.
[sea person, earth person, ignore]WACV_20201920 × 1080,
1280 × 720,
1024 × 724, etc.
794-8161610
AFOMarine search and rescue operations with 40,000 hand-
annotated persons and objects floating in the water.
[human, board, boat, buoy, sailboat, kayak]ICAE_20213840 × 216024584926973647
Optimized DatasetDescriptionCategoriesPublished_YearSrc_SizeNumber of Subset
Train_SetVal_SetTest_SetTotal
VisDrone_CityPersonMerge two classes [pedestrian, person] into single class [person].person-1536 × 1536568453112677482
Heridal_ForestPersonInstances add to the background images for synthetic samples.person-1536 × 15368781001011079
Tiny_SeasidePersonMerge two classes [sea person, earth person] into single class [person].person-1536 × 153610171003811498
AFO_SeaPersonPick out labels and samples that contain person.person-1536 × 153616962112002107
VHTA_PersonCreate a multi-scene, full-time, high-view, and small
person search and rescue dataset by UAVs.
person-1536 × 15369275942194912166
Table 2. Comparison of MMD and CIoU training metrics in various depth and width models with Heridal_ForestPerson dataset.
MethodNo.Pretrained
Model
Batch_SizePrecisionRecall AP 0.5 val AP 0.5 test AP 0.5 : 0.95 val AP 0.5 : 0.95 test Params
/M
GFLOPs
/M
Training Time
/h_m_s
Ours
(MMD)
1x40.87060.73890.81150.81060.54630.541285.4204.919h_22m_55s
−3.43%↓+3.27% ↑ +3.00%↑+3.77%↑+1.50% ↑+1.51% ↑
2l80.91520.70620.79980.79140.52730.515644.9108.69h_22m_33s
+4.39%↑ −1.78%↓+1.88%↑+1.60% ↑−0.69% ↓−0.57% ↓
3m160.89140.73290.80790.80020.54050.532719.847.49h_34m_49s
+1.73%↑+3.27% ↑+2.84%↑+2.70%↑+2.23% ↑+2.78% ↑
4s320.86760.70030.78410.77950.51150.50236.715.29h_43m_37s
−0.17%↓+0.89% ↑+4.98%↑ +5.27%↑ +4.02% ↑+3.71%↑
5n640.85040.69130.74550.73690.45660.44831.63.99h_35m_44s
+1.18%↑+1.18% ↑+2.79%↑+2.75%↑+1.47% ↑+0.98%↑
YOLOv5
(CIoU)
6x40.90490.70620.78150.77290.53130.526185.4204.919h_8m_27s
7l80.87130.7240.7810.77540.53420.521344.9108.69h_46m_46s
8m160.87410.70020.77950.77250.51820.504919.847.49h_26m_3s
9s320.86930.69140.73430.72680.47130.46526.715.29h_33m_5s
10n640.83860.67950.71760.70940.44190.43851.63.99h_34m_41s
The blue markers are the maximum percentage of growth, and the bold fonts are the optimal value of the metrics.
Table 3. Number of implanted instances with two methods on the Heridal_ForestPerson dataset.
MethodNo.Block_SizeNum_PosNum_NegRepeatNumber of Instance
Train_SetVal_SetTest_SetTotal
Copy-Paste132 × 3230 77,0555019169283,766
232 × 3230154,11010,0381692165,840
332 × 3231154,11010,0381692165,840
432 × 3232154,11010,0381692165,840
532 × 3250 128,42583651692138,482
632 × 3270 179,79511,7111692193,198
732 × 3290 231,16515,0571692247,914
Instance Segmentation + Copy-Paste(Ours)832 × 3230 77,0555019169283,766
932 × 3230154,11010,0381692165,840
1032 × 3231154,11010,0381692165,840
1132 × 3232154,11010,0381692165,840
1232 × 3250 128,42583651692138,482
1332 × 3270 179,79511,7111692193,198
1432 × 3290 231,16515,0571692247,914
Table 4. Training metrics on the Heridal_ForestPerson dataset with object implantation and semi-supervised learning.
MethodNo.ModelParamsPrecisionRecall AP 0.5 test AP 0.5 : 0.95 test
Copy-PasteScaleLoss_WeightsRepeat
Baseline1YOLOv5s10.11×0.86790.64390.7520.493
230.51×0.86930.69140.73430.4713
350.71×0.87210.68840.77290.5034
430.51×0.89260.69140.79620.5311
OIM510.10.10.88720.70030.76190.503
630.70.50.88420.70330.78750.526
750.50.50.88760.70320.78840.5205
830.90.50.85250.70330.80370.5287
OIM+SSTM910.10.10.86760.70030.78410.5115
1030.70.50.81880.7240.78370.5161
1150.50.50.870.71510.77120.5033
1230.90.50.89140.71620.81170.5436
The bold fonts are the optimal value of the metrics.
Table 5. Statistics and analysis of multiple error types with various strategies mentioned in Table 4 on the Heridal_ForestPerson dataset.
MethodNo.Main ErrorSpecial Error
ClsLocBothDupeBkgMissFALSE_PosFALSE_Neg
Baseline103.900.183.3318.215.6321.5
202.2300.2516.837.2119.54
304.7500.03318.345.421.88
403.1100.082.7319.533.5422.35
OIM502.8600.083.0818.984.5922.25
603.6200.012.4620.573.4224.3
703.8700.012.1817.893.8121.57
802.9500.072.5918.793.921.61
OIM+SSTM902.700.162.4519.723.9222.26
1003.45002.4220.763.3325.35
1102.3300.083.3920.434.2522.91
1201.9100.032.1619.93.321.64
The bold fonts are the optimal value of the metrics.
Table 6. Comparative studies of various module configurations under ‘s’ pretrained model on the Heridal_ForestPerson dataset.
MethodCPOIMSSTMCIoUMMDPrecisionRecall AP 0.5 test AP 0.5 : 0.95 test
Baseline 0.86790.64390.7520.493
0.86980.64920.7630.4922
Ours 0.88470.67290.78550.5023
0.89570.70220.80120.5241
0.90190.71230.80730.5304
0.90490.7240.81150.547
0.9152
(+4.73%↑)
0.7389
(+9.5%↑)
0.8079
(+5.59%↑)
0.5436
(+5.02%↑)
The blue markers represent our proposed method’s percentage improvement over the Baseline.
Table 7. Comparison of inference performance with multiple augmentation methods on different devices.
MethodModelBatch
Size
Input
Size
AP 0.5 test Params
/M
GFLOPs
/M
Speed test
(Tx2 b1/ms)
Speed test
(NX b1/ms)
Speed test
(V100 b1/ms)
PrepInferNMSTotal Time
Baselines215360.7886.715.8283.475.40.77.91.510.1
Baseline + TTAs216000.7536.715.8596.5148.60.621.91.223.7
s219200.7916.715.8612.3173.20.925.71.227.8
s224000.7986.715.8814.9246.52.733.41.137.2
s232000.796.715.81473.15225.352.8159.1
Baseline++TTA + MEs+m215360.79619.947.9588.7139.50.919.71.121.7
s+l215360.79544107.6606.5166.90.926.81.128.8
s+x215360.79882.2203.8923.8304.70.642.81.144.5
s+x224000.80382.2203.85129.61508.922020.9204.9
s+m+l215360.79344107.6867.4272.90.639.51.141.2
s+m+x215360.79582.2203.81369.5481.21.255.31.157.6
Baseline+TTA+ME+WBFs+x215360.80682.2203.81583.7678.90.744.616.862.1
s+x224000.80982.2203.86492.32225.12.5205.849.3257.6
s+m+x215360.80544107.61979.5611.21.255.327.283.7
s+l+x215360.80282.2203.82647806.31.856.943.2101.9
Baselines215360.7886.715.8283.475.40.77.91.510.1
BIs415360.7866.715.8219.149.60.74.81.57
s815360.7896.715.8178.833.40.43.71.75.8
LPPQ (fp16)s415360.7754.311.2208.347.40.32.91.64.8
s815360.7744.311.1171.2320.32.61.34.2
s+x824000.79457.9147.83842.51124.92.5114.749.3166.5
The bold fonts are the optimal value of the metrics.
Table 8. Comparison of the training metrics between our proposed method and SOTA in the Heridal dataset.
MethodAPAPAPAPAPAPARARARARARAR
IoU = 0.5:0.95IoU = 0.5IoU = 0.75smallmediumlargemax = 1max = 10max = 100smallmediumlarge
Data Augmentation
Baseline0.53030.76250.64690.4580.72640.84340.33160.72970.76460.63420.76120.8604
Copy-Paste [35]0.5330.75390.62070.45660.72880.82060.33450.72690.75810.63440.75110.8655
Simple Copy-Paste [36]0.54170.77140.64860.46290.72960.81850.33670.730.75690.63760.7530.8516
Mixup [37]0.52880.76580.65030.44760.71640.84690.33520.71680.75220.64080.74890.86
CutMix [38]0.53470.78420.65520.45210.71530.83850.33980.72850.74690.64150.74350.8579
Mosaic [39]0.53850.78240.65230.46380.72540.83160.33730.72610.74540.63980.75270.8667
CP + SSL (Ours)0.54760.78840.65820.47250.73960.84670.35270.73140.75280.65110.75080.872
(+1.73%)(+2.59%)(+1.13%)(+1.45%)(+1.32%)(+0.33%)(+2.11%)(+0.17%)(−1.18%)(+1.69%)(−1.04%)(+1.16%)
Label Assignment + Data Augmentation
CIoU [25]0.54760.78840.65820.47250.73960.84670.35270.73140.75280.65110.75080.872
DIoU [27]0.54850.77430.64970.46180.72630.8540.34610.71560.74220.65880.73690.86
GIoU [26]0.54110.76590.6320.46630.72850.84610.34140.73590.73960.65030.73860.8741
EIoU [28]0.53590.72510.63780.45260.71480.84570.33690.74240.74570.65470.74540.8572
Alpha-IoU [40]0.5510.77520.64750.45880.73020.84890.34520.73660.74630.64190.75480.8601
SIoU [41]0.55270.76390.63190.46270.71540.84320.33680.73640.74890.64370.73290.8547
DotD [42]0.54260.78950.64560.4690.73440.84750.35420.71150.75430.650.72460.8721
NWD [43]0.54290.79630.66170.47330.73170.85260.35670.7280.74990.64270.73630.8699
CP+SSL+MMD (Ours)0.54360.80790.66980.47560.73860.85660.35240.73590.76370.65480.75110.8768
(−0.4%)(+1.95%)(+1.16%)(+0.31%)(−0.1%)(+0.99%)(−0.3%)(+0.45%)(+1.09%)(+0.37%)(+0.3%)(+0.48%)
YOLO Series + Data Augmentation
YOLO v4 [39]0.53680.76690.6670.48140.77460.83060.34580.74550.75460.66080.75220.8692
YOLO v5 [30]0.54760.78840.65820.47250.73960.84670.35270.73140.75280.65110.75080.872
YOLO v6 [44]0.54450.78550.67160.48790.74520.85690.34290.73960.75490.64250.75130.8796
YOLO v7 [45]0.55610.79540.66830.49620.73260.8550.34140.74210.76070.6360.75290.8807
Others + Data Augmentation
SSD [46]0.38560.68290.53470.36240.52080.71240.20430.62070.54530.50290.51890.6479
Faster RCNN [48]0.55930.81440.67890.53290.75220.85460.41560.74960.76320.6570.76230.8854
Retinanet [47]0.53270.78650.66280.46680.73410.83230.36170.74010.76210.68420.74980.8726
Ours
CP+SSL0.54760.78840.65820.47250.73960.84670.35270.73140.75280.65110.75080.872
CP+SSL+MMD0.54360.80790.66980.47560.73860.85660.35240.73590.76370.65480.75110.8768
CP + SSL + MMD + TTA0.55070.81420.67510.47210.74070.85530.35850.74270.7640.65740.75120.8845
CP + SSL + MMD + TTA + ME0.55840.82160.67690.47560.74630.85710.36140.74680.76390.66290.75690.8896
CP + SSL + MMD + TTA + ME + WBF0.56010.82870.68420.4887↓0.75480.86290.36850.75290.77480.6675↓0.76370.8945
(+1.25%)(+4.03%)(+2.6%)(+1.25%)(+1.52%)(+1.62%)(+1.58%)(+2.15%)(+2.2%)(+1.64%)(+1.29%)(+2.25%)
The bold fonts are the optimal value of the metrics. The blue markers represent the outcomes of various types of optimal methods when compared to our proposed method.
Table 9. Comparison of the training metrics between our proposed method and SOTA algorithms across multiple datasets.
DataSetCategoryMethodInputSizeBackBonePreTrainedModelPrecision/%Recall/%APval@0.5/%
VisDrone2019 [33]pedestrianYOLOv4 [39]608DarkNet-53yolov4-csp-x-swish0.680660.478520.48004
YOLOF [49]608R-50-C5yolof_r50_c5_8x8_1x0.687590.452760.48772
YOLOv5 [30]640DarkNet-53 + Focusyolov5x60.673690.471690.47202
YOLOX [50]640Darknet53yolox-x0.670080.468930.47257
DCLANet [51]640DarkNet-53 + Focusyolov5x60.698270.467510.47782
VisDrone_CityPersonpersonOurs640DarkNet-53 + Focusyolov5s0.71829(+2.002%)0.45636(−1.115%)0.49061(+1.279%)
Heridal [5]personSSD [46]1333 × 1000VGG16ssd512_coco4.3394.36-
Faster RCNN [48]1333 × 1000ResNet101 + FPNfaster_rcnn_r101_fpn_1x_coco58.185-
[5]1333 × 1000RPM + SODfaster_rcnn_r101_fpn_1x_coco34.888.9-
RPN [7]4000 × 3000ResNet101+FPNrpn_x101_32x4d_fpn_1x_coco41.5495.54-
RFCCD [8]4000 × 3000ResNet101+FPNrpn_x101_32x4d_fpn_1x_coco68.8994.65-
Heridal_ForestPersonpersonOurs1536 × 1536DarkNet-53 + Focusyolov5s91.5273.8980.79
yolov5x694.78(+25.89%)80.32(−14.33%)85.68
TinyPerson [16]personRetinaNet [47]640 × 512ResNet50retinanet_r50_fpn_1x_coco--48.26
Faster RCNN [48]640 × 512ResNet50 + FPNfaster_rcnn_r101_fpn_1x_coco--63.18
Faster RCNN [48]640 × 512ResNet50 + PANet + FPNfaster_rcnn_r101_panet_fpn_1x_coco--70.32
FCOS [52]640 × 512ResNet50fcos_r50_caffe_fpn_gn_head_1x_coco--40.54
Swin-T [53]640 × 512ResNet50retinanet_swin-t-p4-w7_fpn_1xcoco--52.53
Tiny_SeasidePersonpersonOurs1536 × 1536DarkNet-53+ Focusyolov5s78.556.167.48(+14.95%)
AFO [4]human+buoyYOLOv4 [39]544 × 544CSPDarknet53-PANet-SPPyolov4-csp-panet-spp-x-swish--54.58
SSD [46]300 × 300MobileNet v2ssd300_mobilenetv2_600e_coco--24.34
Faster RCNN [48]1333 × 750ResNet101 + FPNfaster_rcnn_r101_fpn_1x_coco--64.11
RetinaNet [47]1333 × 750ResNet101 + FPNretinanet_r101_fpn_1x_coco--65
[4]1333 × 750ResNet101 + FPNretinanet_r101_fpn_1x_coco--70.53
AFO_SeaPersonpersonOurs1536 × 1536DarkNet-53 + Focusyolov5s95.5593.3796.34(+25.81%)
VHTA_Person(Ours)personOurs1536 × 1536DarkNet-53 + Focusyolov5s74.3952.1663.28
1536 × 1536DarkNet-53 + Focusyolov5m77.5654.1765.89
1536 × 1536DarkNet-53 + Focusyolov5l75.3556.2964.8
1536 × 1536DarkNet-53 + Focusyolov5x75.9255.8665.4
1536 × 1536DarkNet-53 + Focusyolov5x676.5957.3266.37
The blue markers are the optimal value of the metrics.
Disclaimer/Publisher’s Note: The statements, opinions and data contained in all publications are solely those of the individual author(s) and contributor(s) and not of MDPI and/or the editor(s). MDPI and/or the editor(s) disclaim responsibility for any injury to people or property resulting from any ideas, methods, instructions or products referred to in the content.

