Article

Polarimetric Range Extended Target Detection via Adaptive Range Weighted Feature Extraction

1
Radar Research Laboratory, School of Information and Electronics, Beijing Institute of Technology, Beijing 100081, China
2
Electromagnetic Sensing Research Center of CEMEE State Key Laboratory, School of Information and Electronics, Beijing Institute of Technology, Beijing 100081, China
3
Beijing Institute of Technology Chongqing Innovation Center, Chongqing 401120, China
4
Advanced Technology Research Institute, Beijing Institute of Technology, Jinan 250300, China
*
Author to whom correspondence should be addressed.
Remote Sens. 2023, 15(11), 2929; https://doi.org/10.3390/rs15112929
Submission received: 17 May 2023 / Accepted: 2 June 2023 / Published: 4 June 2023
(This article belongs to the Special Issue Advances in Radar Systems for Target Detection and Tracking)

Abstract

:
In ground static target detection, polarimetric high-resolution radar can distinguish the target from the strong ground clutter by reducing the clutter power in the range cell and providing additional polarimetric features. Since the energy of a target is split over several range cells, the resulting detection problem is called polarimetric range extended target (RET) detection, where all target scattering centers should be considered. In this paper, we propose a novel polarimetric RET detection method via adaptive range weighted feature extraction. Specifically, polarimetric features of range cells are extracted, and a pretrained attention-mechanism-based module is used to adaptively calculate range cells weights, which are used to accumulate the range cells features as detection statistics. While calculating weights, both amplitude and polarimetric features are considered. This method can make the most of polarization information and improve the accumulation effect, thus increasing the discrimination between targets and clutter. The effectiveness of the proposed method is verified compared to both popular energy-domain detection methods and existing feature-domain detection methods, and the results show that our method exhibits superior detection performance. Moreover, we further analyze our method on different target models and different clutter distributions to prove that our method is suitable for different types of targets and clutter.

1. Introduction

Polarimetric high-resolution radar plays an important role in ground static target detection. On the one hand, high resolution can reduce clutter energy per range cell [1,2]. On the other hand, polarization can provide different scattering characteristics information between clutter and targets [3,4]. In polarimetric high-resolution radar, the energy of a target splits in the resulting polarimetric high-resolution range profile (HRRP), leading to the range extended target (RET, also known as range spread target or range distributed target) detection problem [5,6,7].
Existing polarimetric high-resolution radar RET detection (hereinafter referred to as polarimetric RET detection) methods mainly detect in the energy domain. In these energy-domain detection methods, multi-polarization channels are fused into one channel to suppress clutter [8,9,10,11,12], and then extended target detection methods are used on the fused channel to determine whether a target exists [13,14,15,16,17,18,19]. However, in some scenes with strong clutter, distinguishing targets from clutter by only energy information is challenging and many false alarms may emerge in the outputs of these energy-domain detection methods [20,21,22,23,24].
Recently, in RET detection, many methods exploiting the features of clutter have been developed [25,26,27,28]. In these feature-domain detection methods, features are extracted from range cells as detection statistics, and then targets and clutter are distinguished in the feature space. These methods exploit more scattering characteristics beyond energy, resulting in better detection performance [29,30,31]. For example, in [32], waveform contrast features were used in ground moving target detection and improved robustness to low signal-to-noise ratio scenarios. In [33], cross time-frequency distribution features were used in aircraft detection. Other studies mainly focus on maritime target detection. In [23], the correlation feature was used to eliminate the negative effect of the nonstationary property of sea clutter. Similarly, in [34], features about the consistency factor of speckle were used to eliminate the negative effect of the nonstationary property of sea clutter. In [35], waveform contrast features were used to eliminate the detrimental influence of range migration. In addition, there are also fractal features [36], Hurst exponent features [37], etc., but there are few detection methods using polarimetric information.
Inspired, we focus on extracting polarimetric features for target detection. Drawing on other feature-domain detection methods, the process of using polarization features to obtain detection statistics is mainly divided into two steps: first extract features for each range cell, and then accumulate features of multiple range cells. For polarization feature extraction, there has been a lot of research [38,39,40,41,42]. For feature accumulation of multiple range cells, since the position of the target is unknown, either all range cells are considered to have the same contribution and accumulated; or only high-amplitude range cells are considered to have a contribution and accumulated. The former will accumulate too much clutter, similar to the collapsing loss [43] faced by energy-domain detection methods. The latter will lose weak scattering centers whose characteristics are significantly different from clutter. Determining how to make range cells participate in accumulation to obtain better feature-domain detection statistics (FDS) needs to be researched.
In this paper, we propose a novel feature-domain range extended target detection method for polarimetric high-resolution radar via adaptive range weighted feature extraction. First, we extract multiple polarimetric features for each range cell. Then, a pretrained attention mechanism network (AMN) is used to adaptively calculate the weight for each range cell, which reflects the contribution of each range cell to the detection task. Next, features of range cells are accumulated by these weights to achieve FDS. Especially, the AMN is pretrained to obtain the ability to find the difference between targets and clutter and adaptively calculating weights, and both amplitude and feature information are considered in the training process to further improve the weights calculation performance.
The contributions of this paper can be summarized as follows:
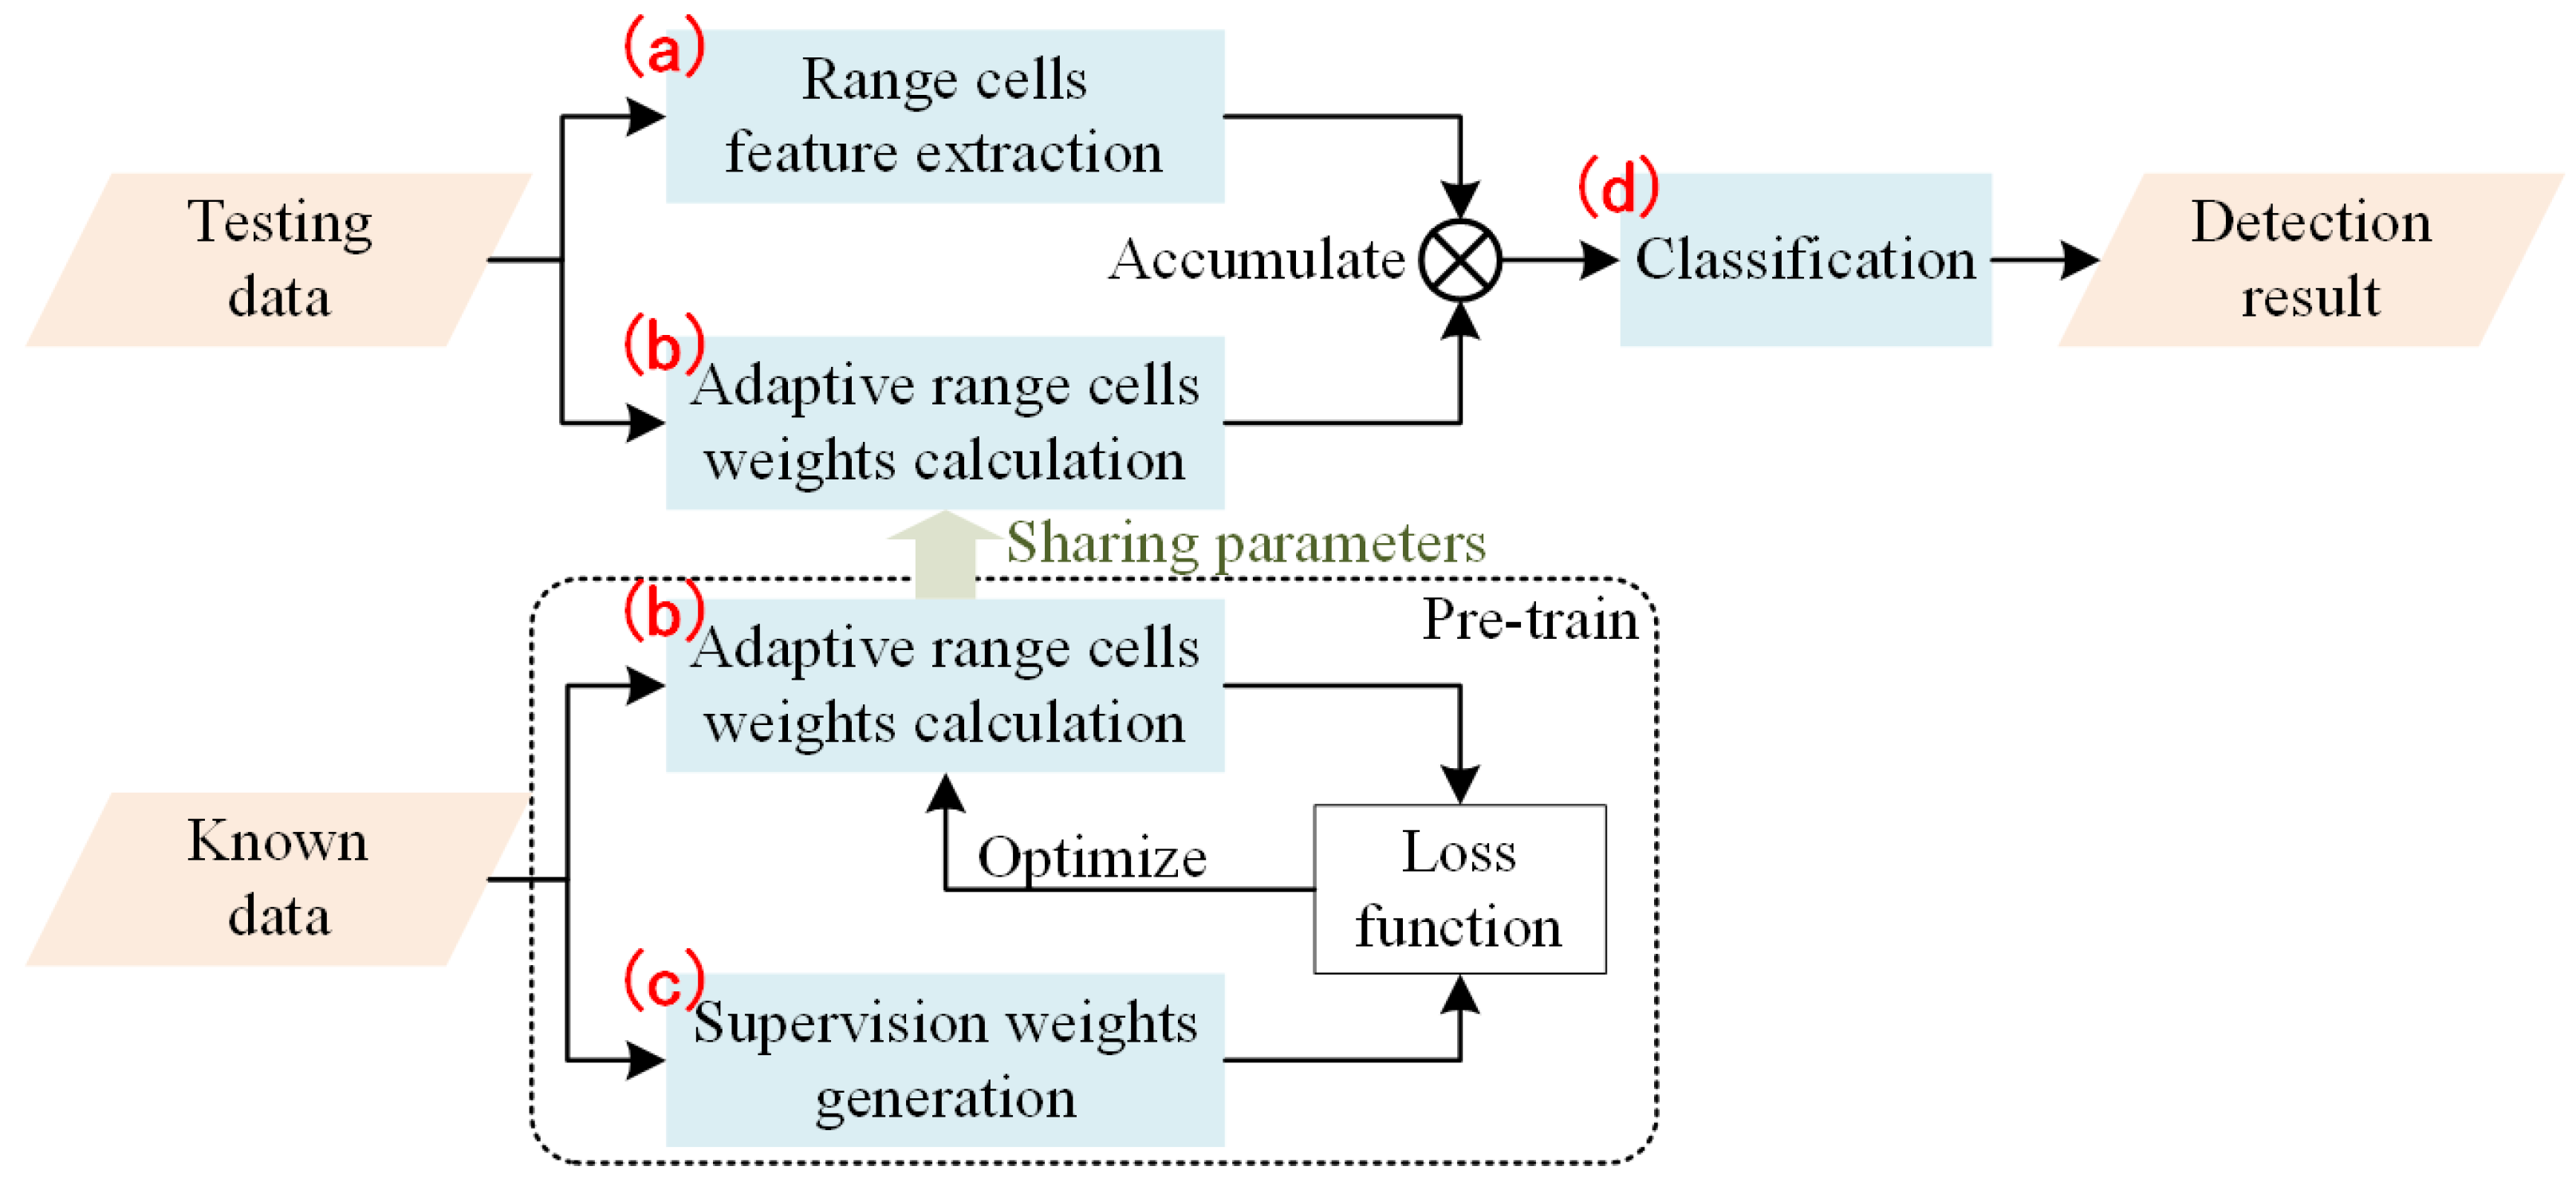
  • We propose a feature-domain polarimetric RET detection framework. There are two branches in this framework; one extracts polarimetric features on each range cell and the other calculates weight for each range cell. By using range cells weights to accumulate features of range cells as FDS, the influence of clutter can be reduced while the weak scattering centers can be preserved, thereby improving detection performance.
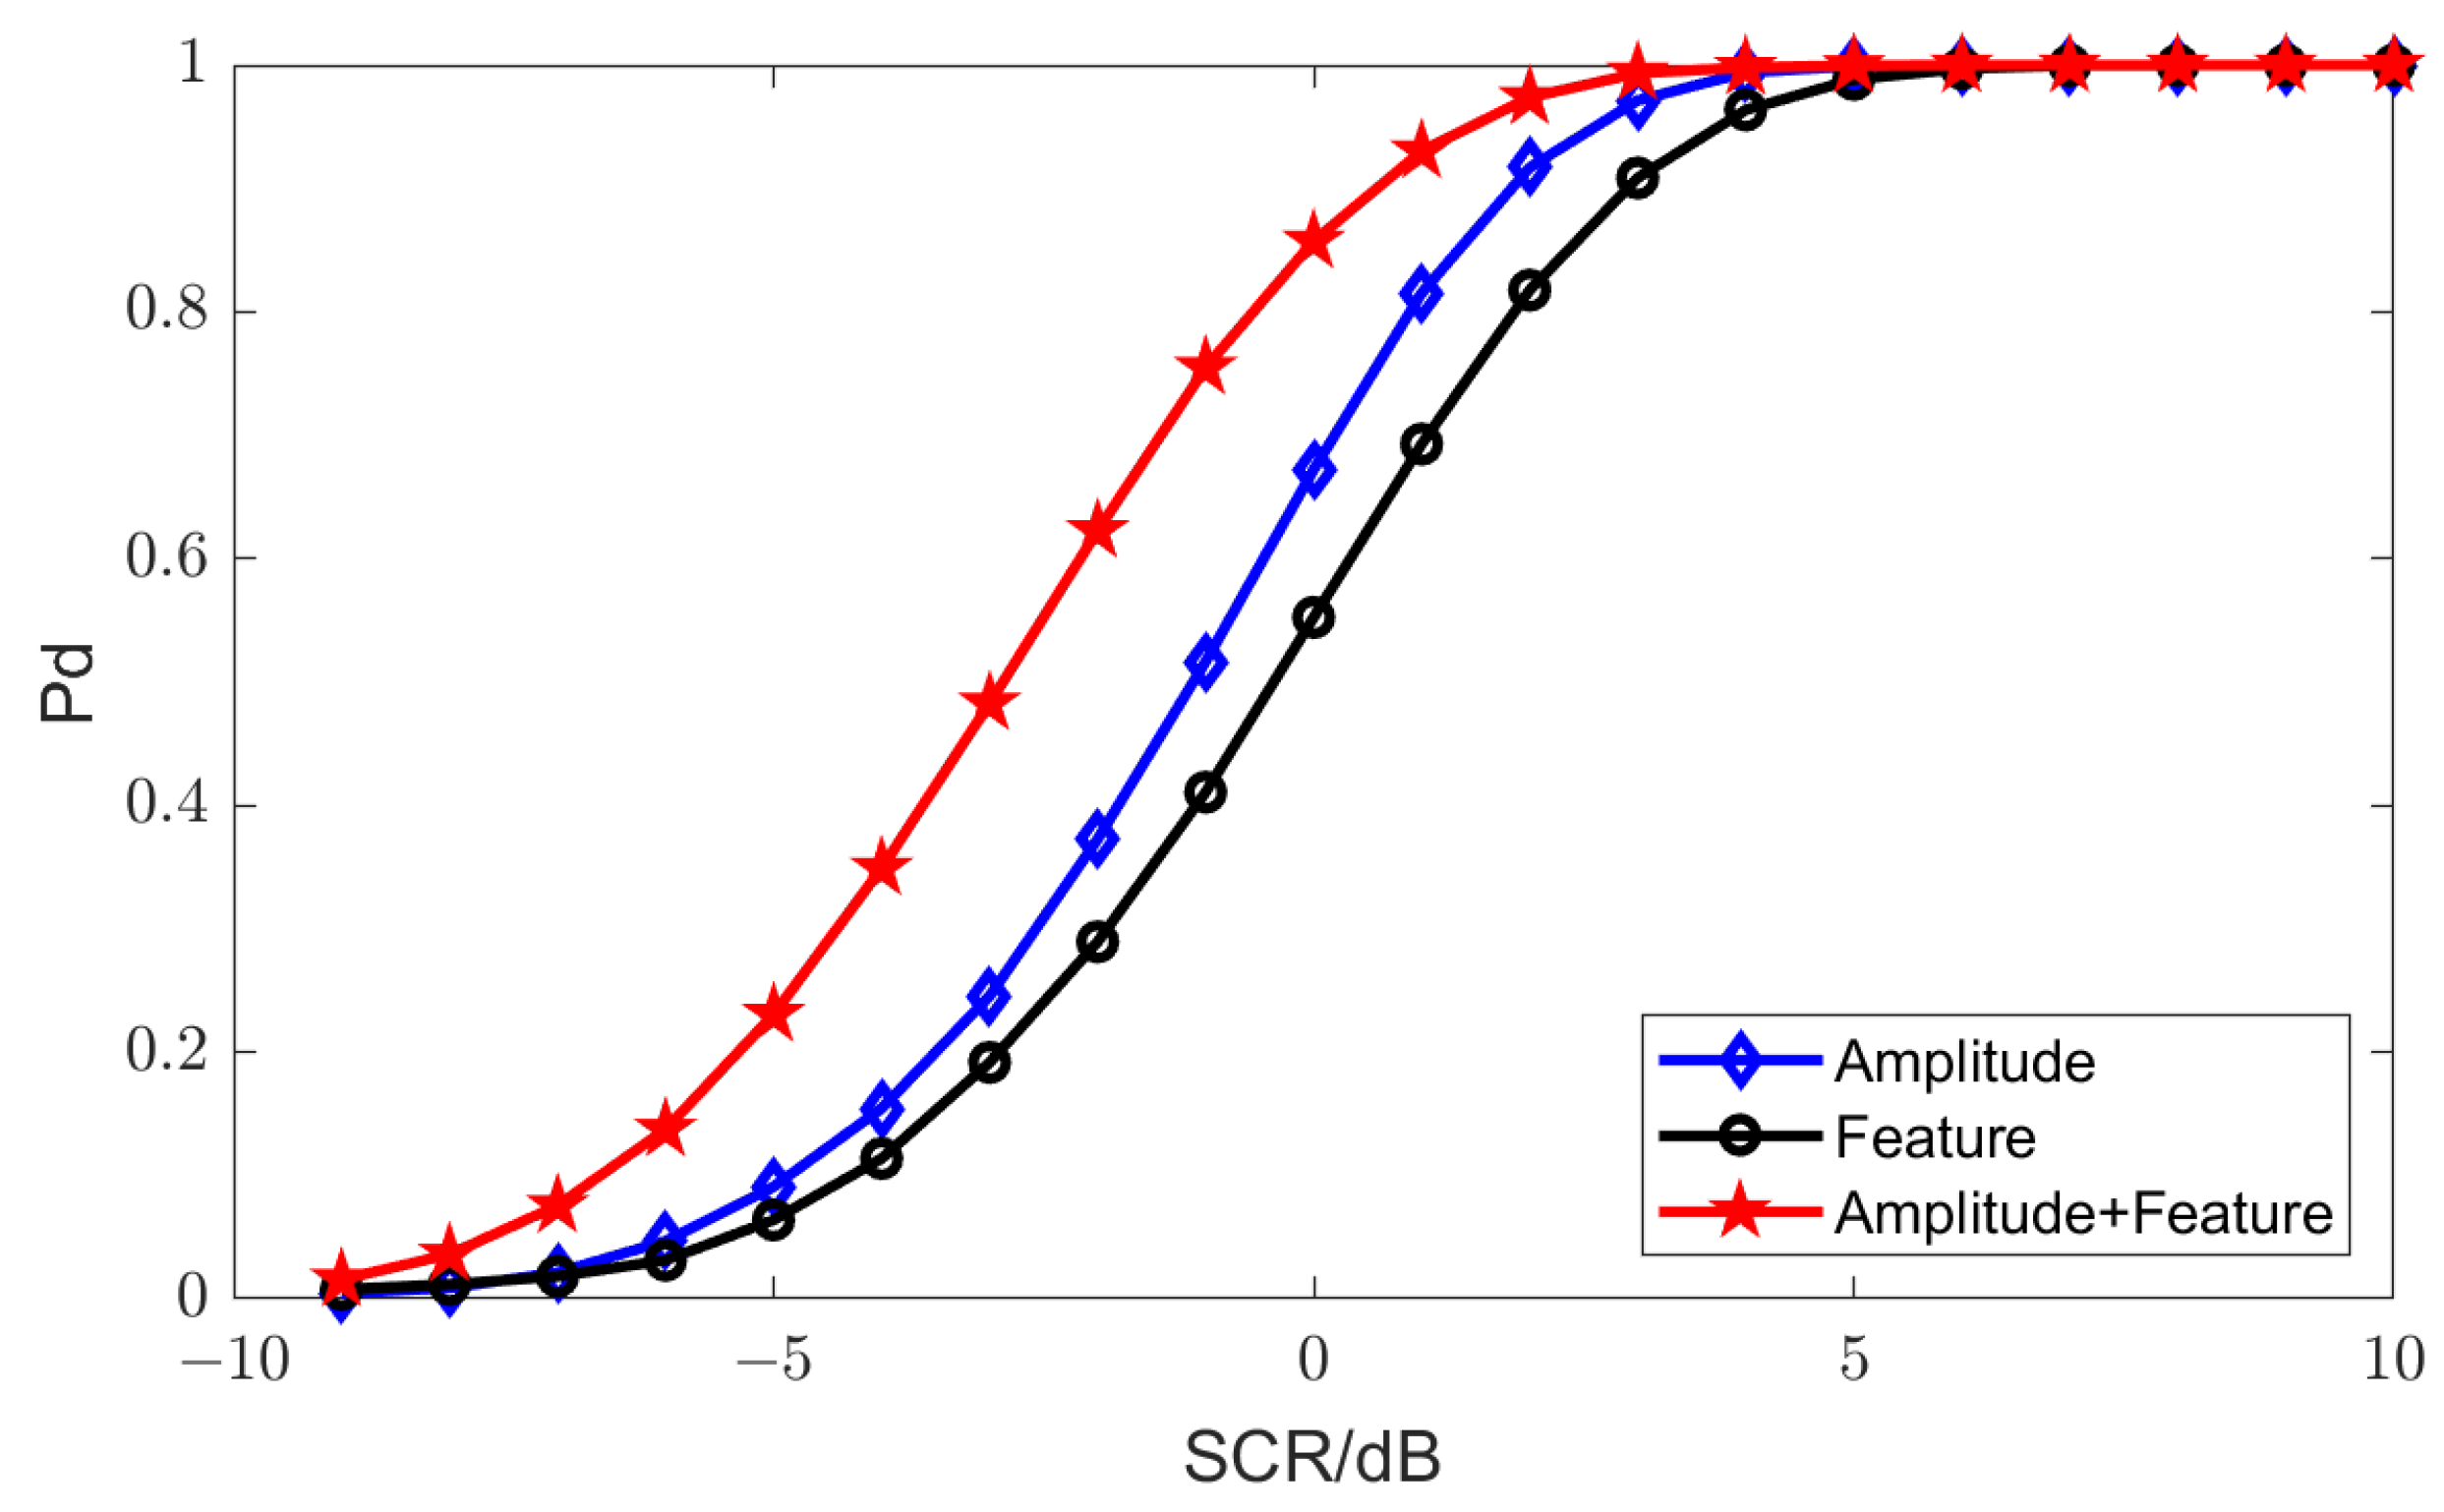
  • An attention-based network is designed to adaptively calculate range cells weights in the weight calculation branch. This AMN is pretrained on known target data to obtain the adaptive weights calculation ability. At the same time, both amplitude and feature information are used in the training process, which helps to obtain better calculate performance.
  • Numerous experiments are carried out to verify the effectiveness of the proposed method as compared with both popular energy-domain detection methods and existing feature-domain detection methods.
The remainder of this paper is organized as follows: Section 2 introduces background knowledge about polarimetric RET detection and the AMN. Section 3 describes the proposed detection method in detail. Section 4 shows experimental results to demonstrate the effectiveness of the proposed detection method. Finally, discussion and conclusions are given in Section 5 and Section 6.

2. Background

2.1. Polarimetric Range Extended Target Detection

Polarimetric RET detection can be modeled as a binary hypothesis problem [44]. Assuming that the detection window is a segment of the radar echo, the task is to detect the presence of the target in the detection window [45]. Specifically, we only consider the case that only one target is in the detection window here, and the noise is ignored because the ground clutter power is usually stronger than that of the noise [46,47]. In each range cell, the received signal, the clutter signal, and the target signal can be, respectively, represented as z n , c n , and s n , and the detection problem can be described as follows:
H 0 : z n = c n , n = 1 , 2 , . . . , N H 1 : z n = s n + c n , n = 1 , 2 , . . . , N ,
where n represents the index of the range cell. Each z n , c n , and s n is a vector composed of signals received by four polarization channels (HH, HV, VH, and VV). Assuming that the target is spatially distributed across all the N range cells in some fashion, each range cell could consist of the clutter plus target or clutter by itself. The following describes the detection process of the two categories of detection methods mentioned in Section 1.
When detecting in the energy domain, first, z n of four polarization channels is fused into z ^ n of one channel. Then, the energy of RET scattered on multiple range cells is accumulated, and a detection threshold T h is used to make the decisions:
exist target : n = 1 N w n z ^ n > T h no target : n = 1 N w n z ^ n T h ,
where w n represents the weight of the n -th range cell, and T h is related to the estimated clutter power. The values of w n and T h are calculated differently in different methods, and directly determine the detection performance.
When detecting in the feature domain, first, features are extracted from the received z n as f n , and w n f n over range cells is accumulated. Then, a hyperspherical classifier is found to classify targets and clutter in feature space. Detection result is determined by evaluating which side of the hypersphere the w n f n falls on:
exist target : d i s t ( n = 1 N w n f n h c ) > h r no target : d i s t ( n = 1 N w n f n h c ) h r ,
where d i s t ( x y ) means to calculate the distance between x and y, w n means the weight of the n -th range cell, h c is a vector that means the center of the hypersphere, and h r is a scalar that means the radius of the hypersphere. If w n f n falls within the hypersphere, it is judged that there is no target, and if it falls outside the hypersphere, it is judged that there is a target. The method used in this paper belongs to this category.

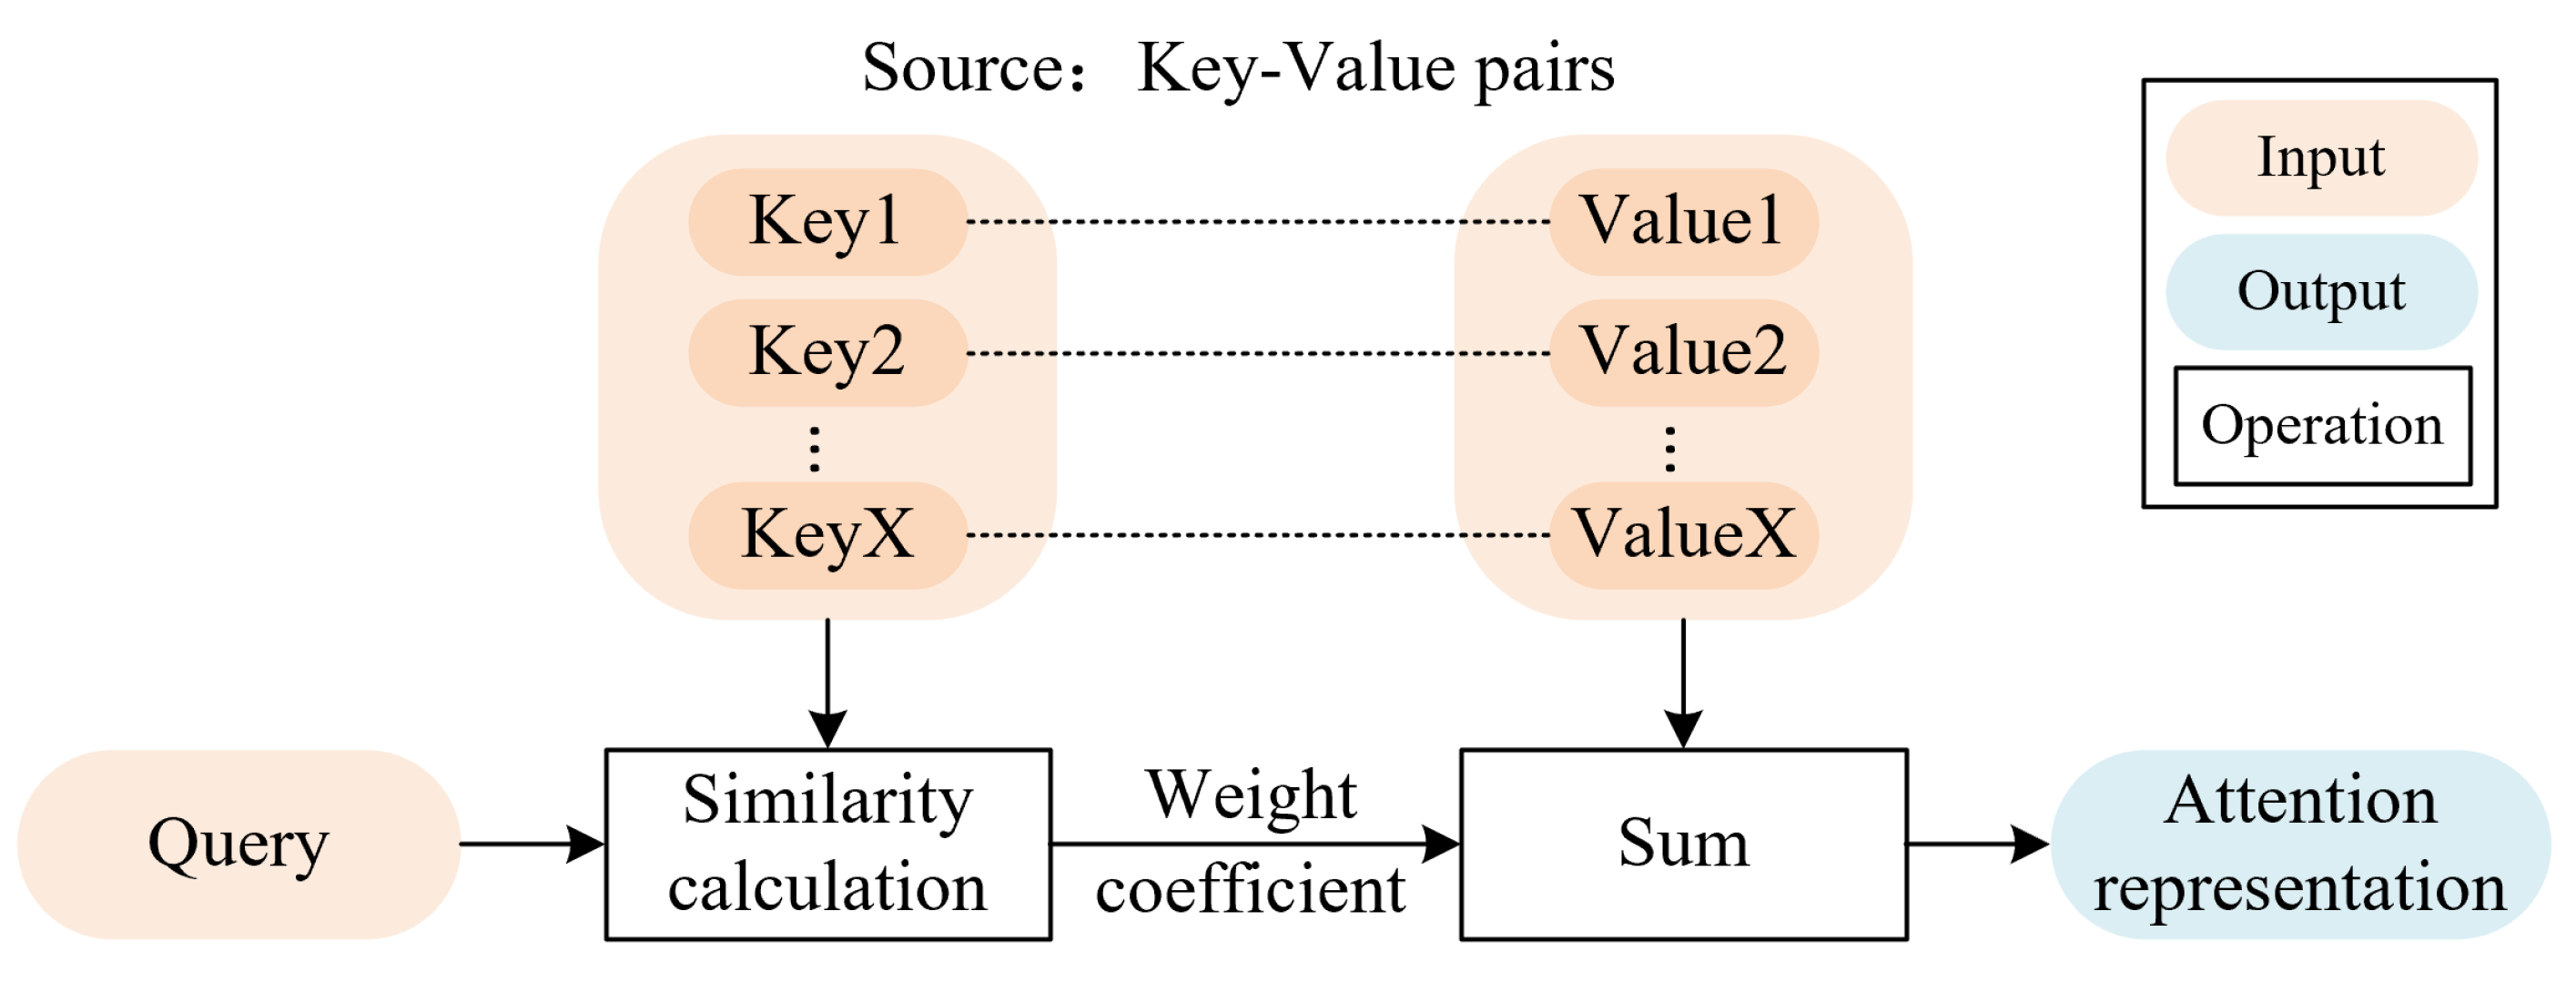
2.2. Attention Mechanism Network

The AMN originated from the study of human vision [48]. Human beings often selectively ignore some information according to their cognition and only focus on specific parts of the image to filter out valuable information. Inspired by this visual attention mechanism, researchers tried to simulate this information selection and weight calculation process, thus constructing the AMN. In recent years, the AMN has made important breakthroughs in the fields of natural language processing [49], image recognition [50], target detection [51,52], etc. [53,54,55], and its advantages in improving the effectiveness of information processing have been proven.
Figure 1 shows the structure of the AMN. The data source ( S o u r c e ) can be assumed to consist of a series of key-value pairs K e y V a l u e , and the attention mechanism maps the query ( Q u e r y ) to the attention representation ( A t t e n t i o n ) through S o u r c e [56]:
A t t e n t i o n ( Q u e r y , S o u r c e ) = i = 1 n p s i m i l a r i t y ( Q u e r y , K e y i ) · V a l u e i ,
where n p represents the number of key–value pairs. Q u e r y . K e y and V a l u e can be abbreviated as Q , K , and V . The computation of the attention representation mainly includes three steps:
(1)
Calculate the similarity between the Q and each K , and find the weight. The commonly used calculation similarity functions include dot product similarity, stitching similarity, cosine similarity, etc. We use dot product similarity here:
f dot Q , K i = QK i T .
(2)
Use softmax to normalize the weight to find the weight coefficient:
a i = softmax f dot Q , K i = e f dot Q , K i j = 1 n e f dot Q , K j ,
where softmax ( ) represents the softmax function which converts a vector of numbers into a vector of probabilities, where the probabilities of each value are proportional to the relative scale of each value in the vector. f dot Q , K represents dot product similarity between Q and K as shown in (5).
(3)
Use weight coefficient to sum V to obtain the final attention representation:
Z = Attention Q , K , V = i = 1 n p a i V i .
The information selection and weight calculation process of the AMN are consistent with the idea of weighting range cells. Therefore, in this paper, we use the AMN to calculate range cells weights in feature extraction.

3. Methods

3.1. Structure and Composition

3.1.1. Overall Structure

In this paper, we propose a feature-domain RET detection method via adaptive range weighted feature extraction. In the method, we first extract polarimetric features and calculate weights of range cells to obtain FDS, and then use a classifier in the feature domain to determine whether a target exists. The peculiarity of this method lies in the design of obtaining FDS, which includes two sub-steps: extracting features of range cells and adaptively calculating weights for range cells. In particular, the adaptive range cells weights calculation is realized through the AMN, which is pretrained on known data with supervision weights. The overall structure of our proposed detection method is shown in Figure 2, which mainly includes four modules.

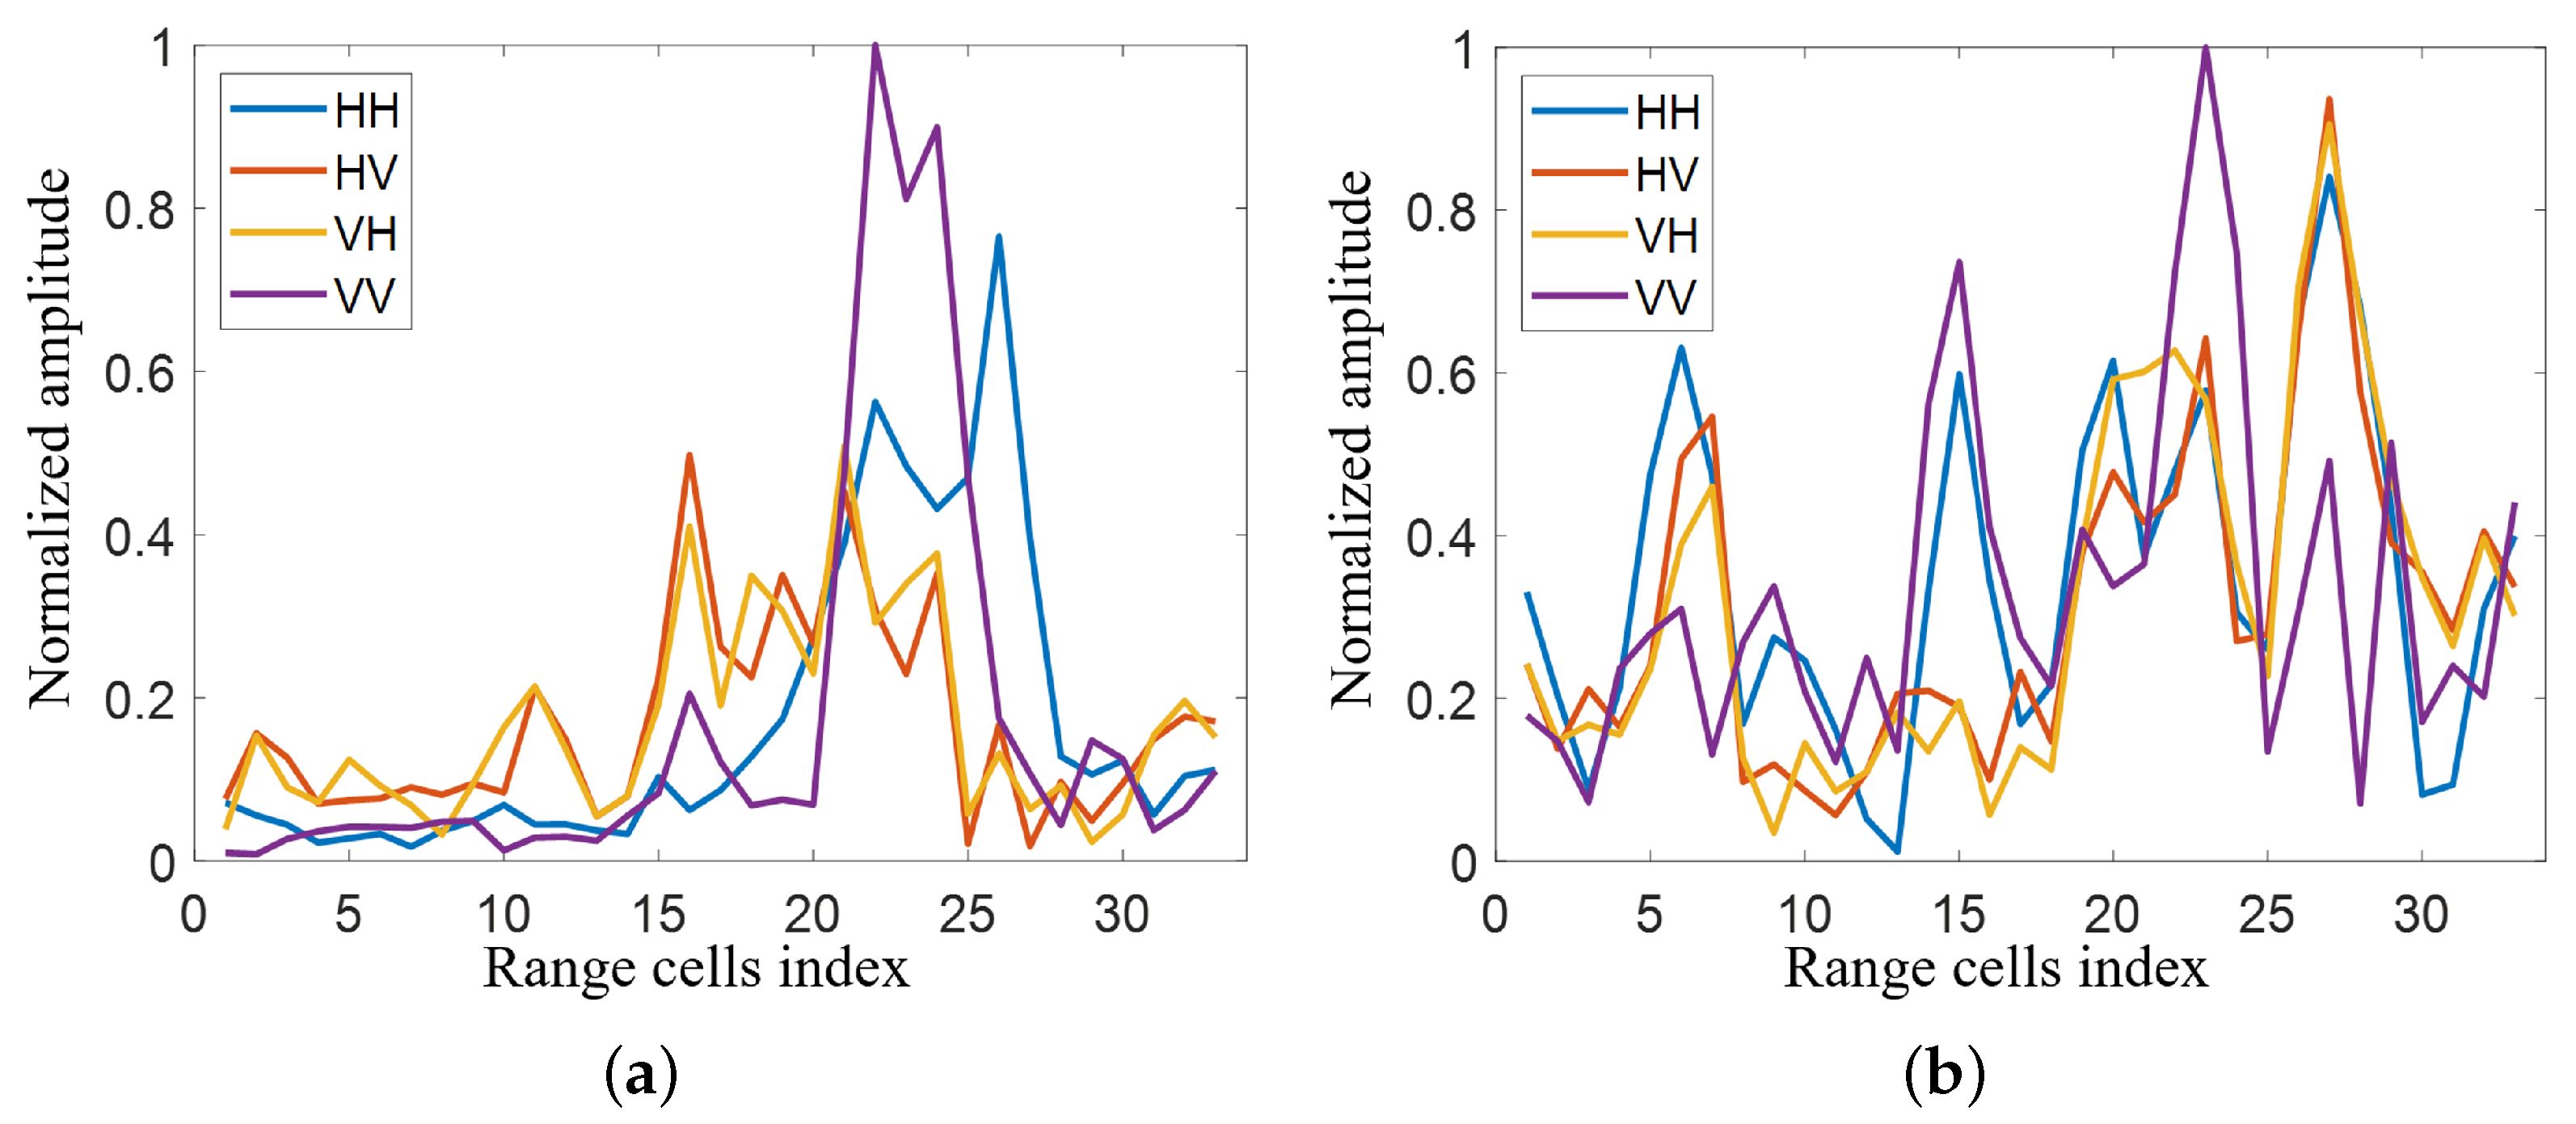
3.1.2. Range Cells Feature Extraction Module

This module extracts three kinds of polarimetric features for each range cell, including Freeman decomposition features, Pauli decomposition features, and Krogager decomposition features. Below are brief descriptions of these features:
(1)
Freeman decomposition features
Freeman decomposition [41] decomposes the total scattering of echo into three components: surface scattering P s , double-bounce scattering P d , and volume scattering P v . The calculation formula is
P s = f s 1 + | β | 2 , P d = f d 1 + | α | 2 , P v = 8 f v 3 ,
where f s , f d , and f v are the surface, double-bounce, and volume scattering contributions. α and β are two coefficients.
(2)
Pauli decomposition features
Pauli decomposition [42] decomposes the total scattering of echo into three components: single-bounce scattering α , double-bounce scattering β , and volume scattering γ . The calculation formula is
α = 1 2 S H H + S V V , β = 1 2 S H H S V V , γ = 2 S H V ,
where S H H , S V V , and S H V are elements on the polarization scattering matrix.
(3)
Krogager decomposition features
The Krogager decomposition [38] decomposes the total scattering of echo into three components: sphere scattering k s , dihedral scattering k d , and helix scattering k h . The calculation formula is
k s = | S H V | , k d = min ( | S H H | , | S V V | ) , k h = abs ( | S H H | | S V V | ) .
This module extracts M (here, M = 9 ) features of each range cell. For features with complex values, we take the modulus. Finally, for a sample containing N distance cells, we generate a feature matrix F pol R M × N .

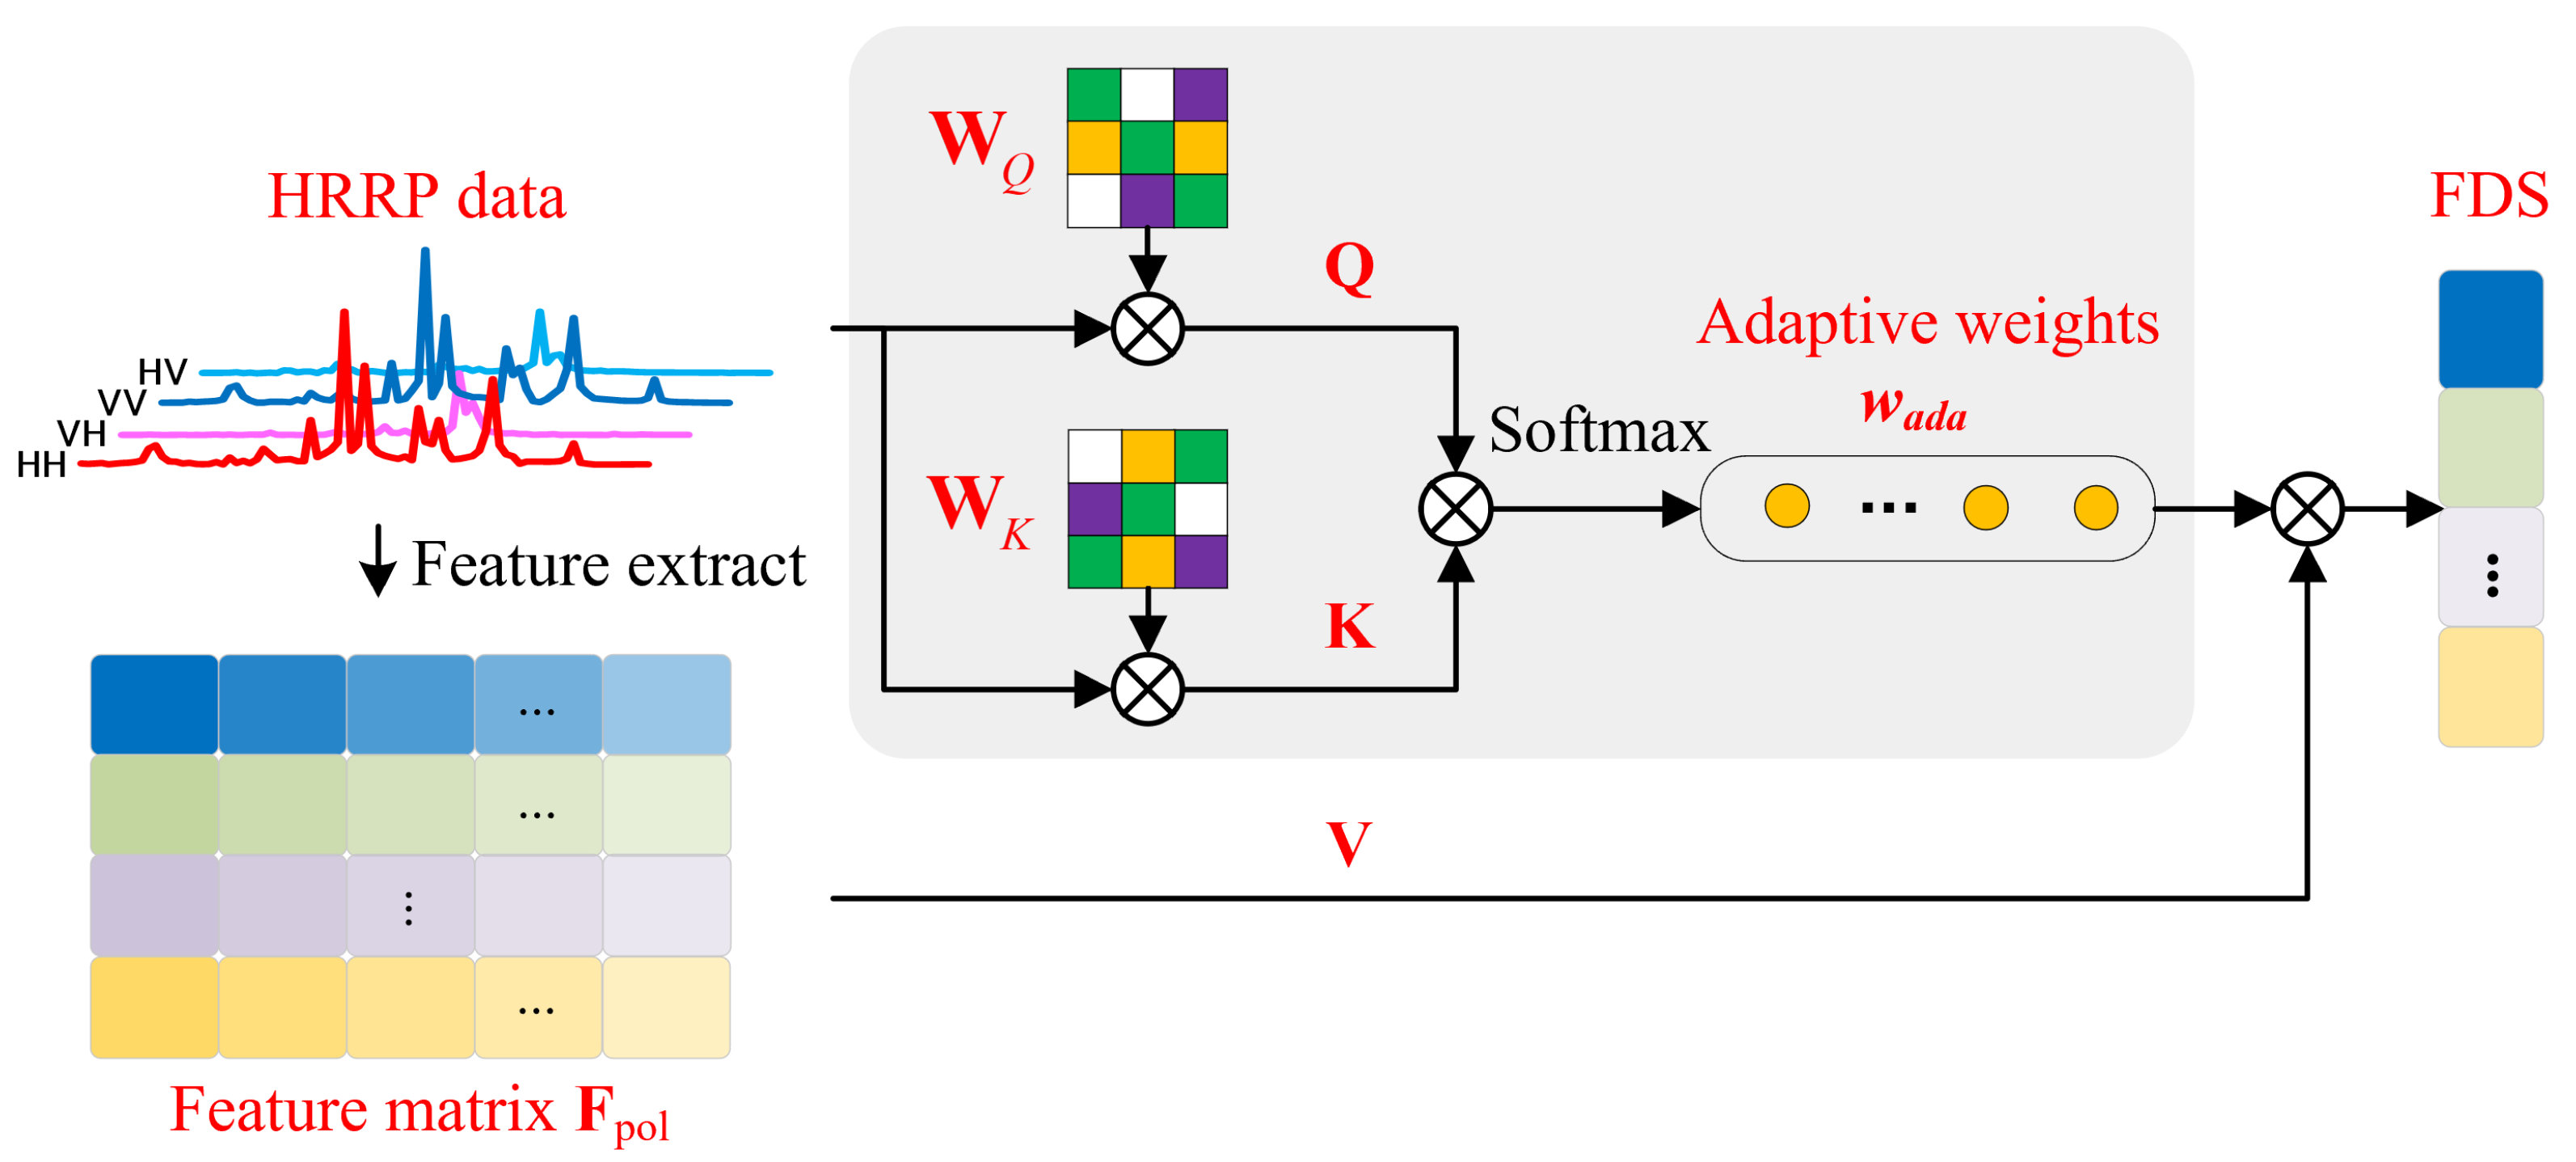
3.1.3. Adaptive Range Cells Weights Calculation Module

This module adaptively calculates range cells weights, which is realized by the AMN, as shown in Figure 3. Based on the background knowledge introduced in Section 2.2, we use the feature matrix F pol as V , and multiply the input polarimetric HRRP with learnable parameters W Q and W K to obtain Q and K . Through this design, we can obtain the adaptive weights w a d a directly from the polarimetric HRRP. The formula is
w a d a = Softmax f dot W Q X , W K X = e f dot W Q X , W K X j = 1 n e f dot W Q X , W K X ,
where X represents the input polarimetric HRRP. Softmax · represents the softmax function. f dot · , · represents dot product similarity, as shown in (5).
It should be noted that the sizes of W Q and W K are related to the size of input HRRPs. In order to adapt to the length of the input data, W Q and W K need to be set as a square matrix whose side length is equal to the number of range cells in the input HRRPs.

3.1.4. Supervision Weights Generation Module
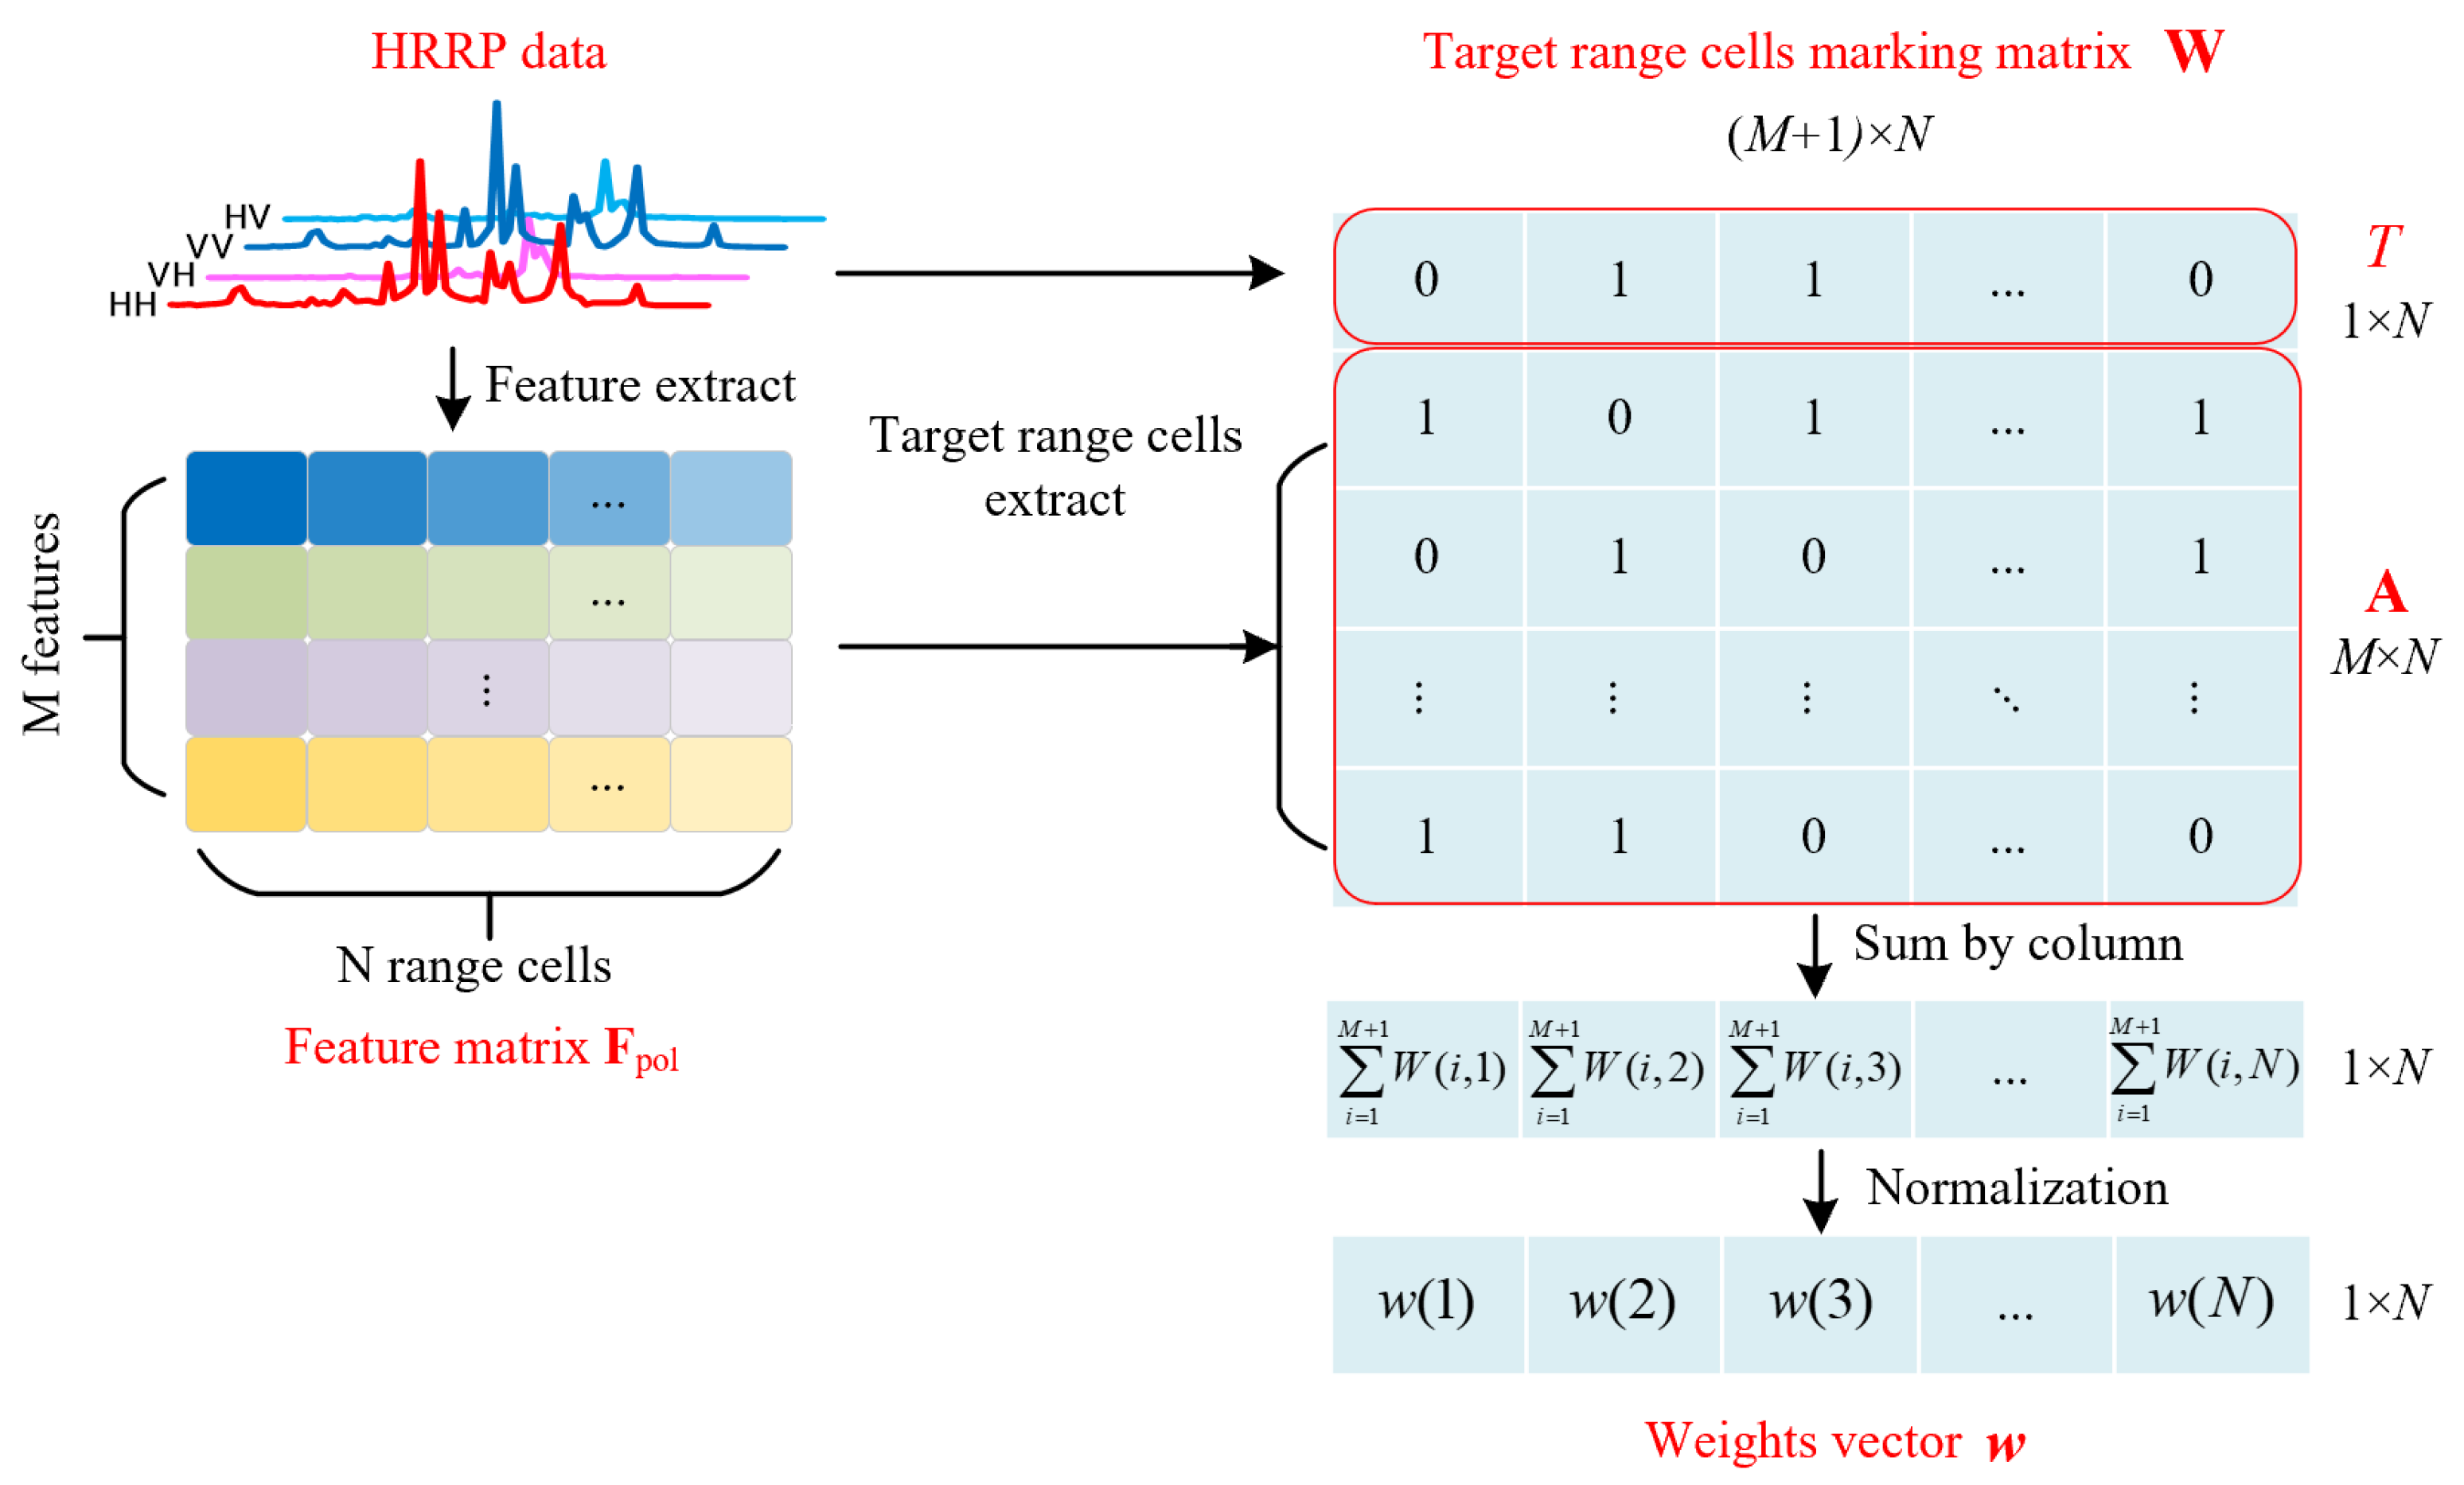
The supervision weights generation module is designed to facilitate the training of the adaptive range cells weights calculation module. As the real weights cannot be obtained directly, this module is used to provide the necessary supervision weights for the training process, as shown in Figure 4. It should be noted that the supervision weights are calculated on training data with known target positions, which ensures that the results are accurate enough to be used as supervision information.
In this module, we calculate range cells contributions to the detection task to obtain supervision weights. In the process, each range cell is marked as high contribution and low contribution through amplitude and feature information, respectively. Then, we comprehensively consider these two factors to obtain the range cell’s total contribution, and this total contribution is used as the supervision weights. The specific calculation process mainly includes the following three steps:
(1)
According to the amplitude, we calculate the amplitude-based marking vector T. Specifically, we use the polarimetric whitening filter (PWF) to process the four polarization channels into one single channel. Then, we consider the range cells where the target locates as high contribution (marked with 1), and the other range cells as low contribution (marked with 0). These markers together constitute the amplitude-based marker vector T R 1 × N .
(2)
According to the polarimetric features, we calculate the feature-based marking matrix A . Specifically, each feature value in feature matrix F pol is compared with this feature’s upper and lower quantiles which are calculated on clutter data in advance. If the feature value is between these two quantiles, the corresponding range cell is considered as low contribution and marked with 0, or the range cell is considered as high contribution and marked with 1. These markers together constitute the feature-based marking matrix A R M × N . The formula is
A ( t , n ) = 0 , F e a t dn < F pol ( t , n ) < F e a t up 1 , others ,
where t = 1 , 2 , . . . , M represents the sequence number of the feature, n represents the index of the range cell, F e a t dn and F e a t up represent the lower and upper quantiles of the t - th feature, and F pol ( t , n ) represents the value of the t - th feature of the n - th range cell in the feature matrix F pol .
(3)
According to the frequency of each range cell marked as high contribution, we obtain supervision weights w s u p . Specifically, vector T and matrix A are combined to obtain the target range cells marking matrix W R ( M + 1 ) × N , and the W is summed by column and normalized to obtain the supervision weights w s u p R 1 × N . The formula is
w s u p n = i = 1 M + 1 W ( i , n ) j = 1 N i = 1 M + 1 W ( i , j ) ,
where w s u p n represents the supervision weight of the n -th range cell.
After obtaining the supervision weights, the adaptive range cells weights calculation module can be trained. During training, the object is to make the adaptive weights w a d a and the supervised weights w s u p as equal as possible, so mean square error is selected to be loss function L in the training process, as shown in the following formula:
L = i d x = 1 n u m w a d a i d x w s u p i d x 2 2 n u m ,
where n u m represents the number of samples, · 2 represents the calculation of 2-norm, and w a d a i d x and w s u p i d x represent the weights vector calculated by the adaptive range cells weights calculation module and the supervision weights generation module, respectively, for the i d x -th sample.
It should be noted that, although the polarimetric features can help to find high-contribution range cells other than those found by using the amplitude, in actual detection, low signal-to-clutter ratio (SCR) makes it difficult to obtain the target position, which will affect the effect of using the amplitude and polarimetric features at the same time. Therefore, we do not directly use features to calculate weights in real data detection in this paper. Instead, an AMN-based adaptive range cells weights calculation module pretrained on known data is designed to adaptively calculate weights on real data. In order to make the network robust to calculate weights under different SCRs, we obtain w s u p on known data with high SCR and use the same w s u p for data with different SCRs generated by the same target segment to train the AMN. By training with data of different SCRs, the adaptive range cells weights calculation module can mine intrinsic rules of data that do not change with SCR and calculate the weights for testing data with different SCRs more accurately.

3.1.5. Classification Module

The function of this module is inputting the FDS into a classifier to determine whether a target exists. In radar target detection, the target is usually unknown, and only clutter data can be used to construct classified hypersphere. Therefore, detection methods usually use one-class classifiers to this situation [57,58]. Currently, one-class support vector machine (OCSVM) is very popular in the field of radar detection [59,60,61,62], so we choose OCSVM to determine whether a target exists.
OCSVM is a boundary learning algorithm in the field of machine learning. It maps data to high-dimensional feature space, and finds a hypersphere that contains only positive samples in the space. Then, the hypersphere is used to distinguish negative samples. Constructing the OCSVM can boil down to [37]:
min ξ R L , b R 1 2 w 2 + 1 v L i ξ i s . t . w · φ z i b ξ i , ξ i 0 ,
where w and b are the weight parameters and offset of OCSVM, respectively. w means to take the norm of w. L is the number of training samples. ξ i is a slack variable corresponding to i - th feature vector z i . The parameter v indicates that v proportion of training samples are considered outliers, which can be considered as the false alarm rate in radar target detection. φ · is a nonlinear function that maps input space into a Hilbert space. We used Gaussian kernel as φ · in this paper, and the calculation formula is
φ z i = e z i 2 2 σ 2 ,
where σ is Gaussian root mean square width, which adjusts the smoothness. The above formula describes finding a hypersphere that is as small as possible that contains all clutter samples but does not include outliers.
In our method, OCSVM is trained on clutter features to obtain the hypersphere. For the sample to be tested, by judging the relative position of its FDS with the hypersphere, the target detection result can be obtained. This kind of method can realize detection without estimating the clutter distribution.

3.2. Training and Testing Procedure

For our proposed detection method, pretraining is required before being used for real data processing. Below, we will introduce the training and testing procedure, which can be divided into three steps:
(1)
First, the parameters of AMN in the adaptive range cells weights calculation module need to be trained in advance to have the ability to adaptively calculate range cells’ weights. The known target data and clutter data are used in the training to let the network learn to find the difference on the range cells between targets and clutter. The dataset used in this step is denoted as D t r amn .
(2)
Then, the classification module needs to be trained in advance to find the hypersphere that classifies clutter and targets. Since the targets are unknown in practice, here, we only use the set of clutter features for training. The dataset used in this step is denoted as D t r cls .
(3)
Finally, when detecting, the polarimetric HRRPs are input, and the FDSs are obtained through range cells feature extraction, weights calculation, and feature accumulation. The FDSs are input into the classification module to obtain the detection results. The dataset used in this step is denoted as D t e .
In summary, our method uses three datasets, two of which are used for training ( D t r amn and D t r cls ) and one for testing ( D t e ). The distribution of clutter in these data is assumed to be consistent.

4. Results

4.1. Experimental Settings

The data used in this paper are constructed on the basis of the Georgia Technology Research Institute (GTRI) dataset [63,64]. In the GTRI raw data, HRRP data of T-72 target’s full azimuth angles and different elevation angles are included. The range resolution is about 0.3 m. Since HRRP has a strong aspect sensitivity, we use data from two different elevation angles in GTRI to train and test, respectively. At each elevation angle, there are 85 HRRPs for different azimuth angles. Based on the GTRI dataset, the details of the three datasets, D t r amn , D t r cls , and D t e , we used are shown in Table 1.
For D t r amn , clutter is added to original data to generate data with SCR of −9–10 dB and 1 dB interval. For each SCR, 100 samples are generated by Monte Carlo. Thus, a total of 85 (number of target azimuth angles) × 20 (number of SCRs) × 100 (Monte Carlo times for each SCR) = 170,000 samples are obtained.
For D t r cls , from the view of radar target detection, to train a detector with a false alarm probability of p f a , at least 10 / p f a data are required to be more reliable. In this paper, the false alarm probability is set to 10 4 , and the required data are greater than 100,000. Considering the sizes of the other two datasets, nearly 170,000 clutter samples are used here.
For D t e , the target data come from a different elevation angle and the generation process is the same as for D t r amn . A total of 85 (number of target azimuth angles) × 20 (number of SCRs) × 100 (Monte Carlo times for each SCR) = 170,000 samples are obtained.
Some generated data are shown in Figure 5. Considering the detection of ground vehicle targets, we set the detection window to 10 m, and because the range resolution is about 0.3 m, we set the samples to have 33 range cells.
At the same time, since the sizes of the W Q and W K in the AMN depend on the size of HRRP, as mentioned in Section 3.1.3, we set the sizes of W Q and W K both to 33 × 33.

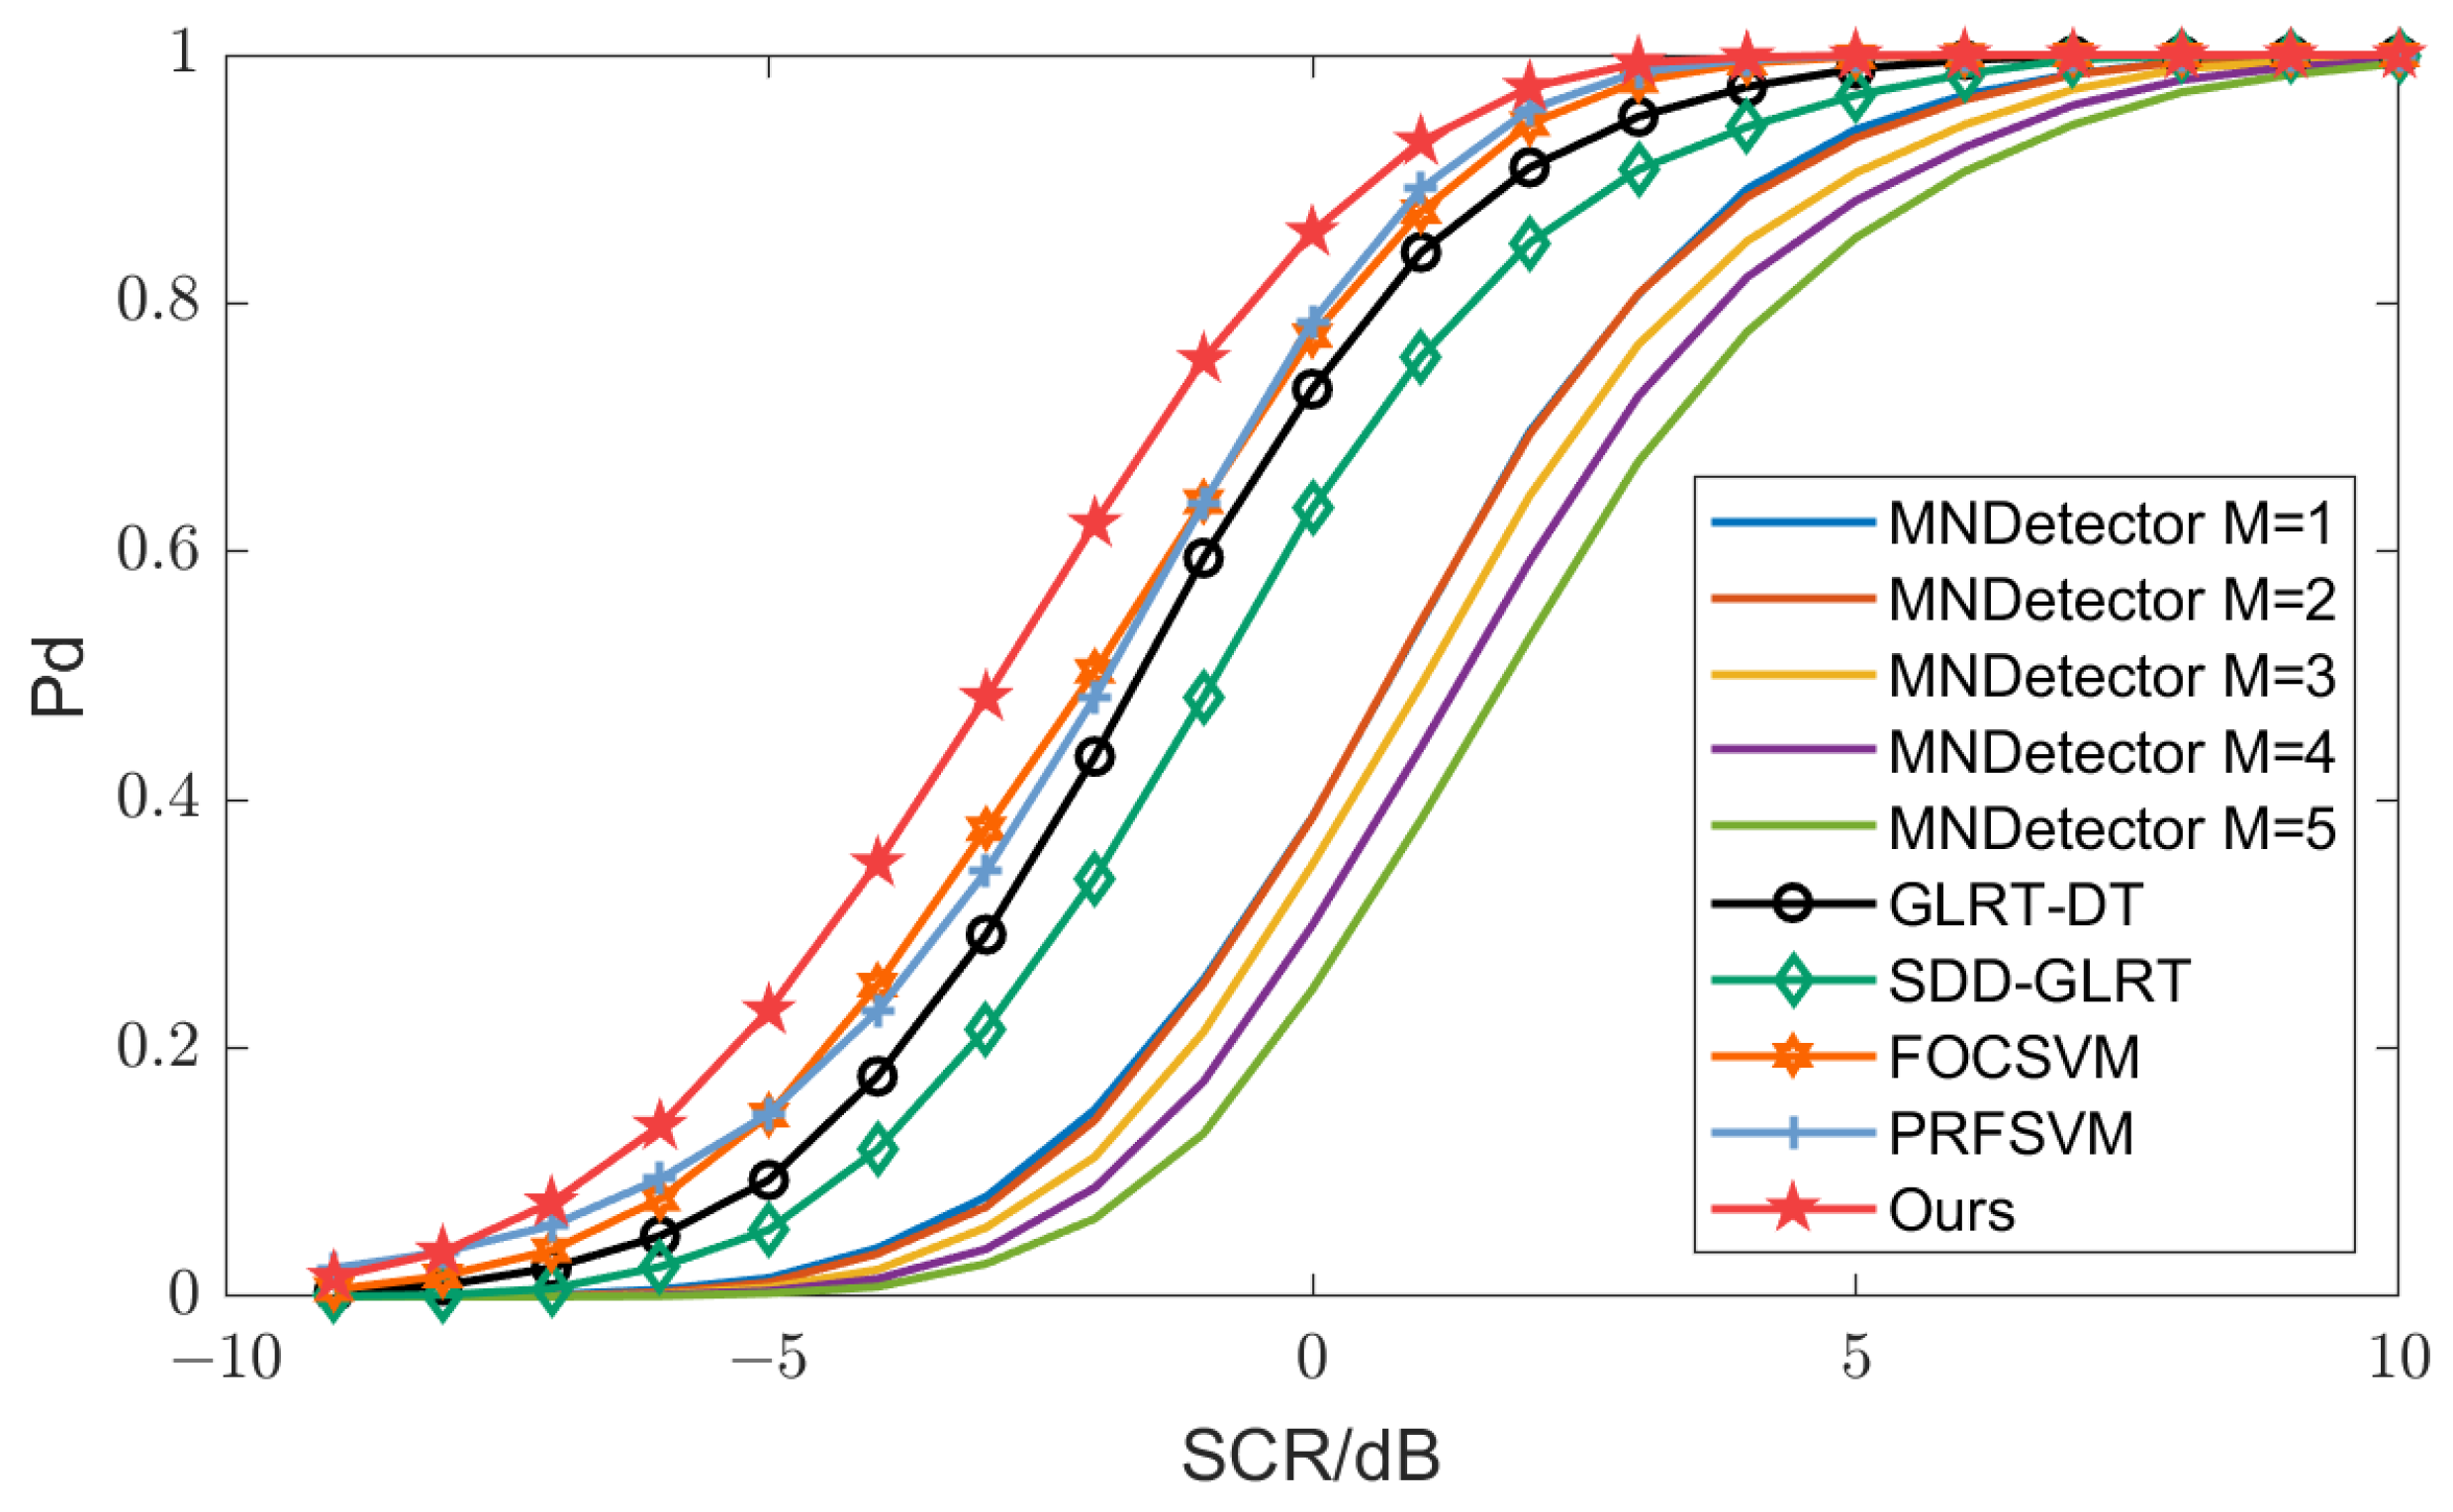
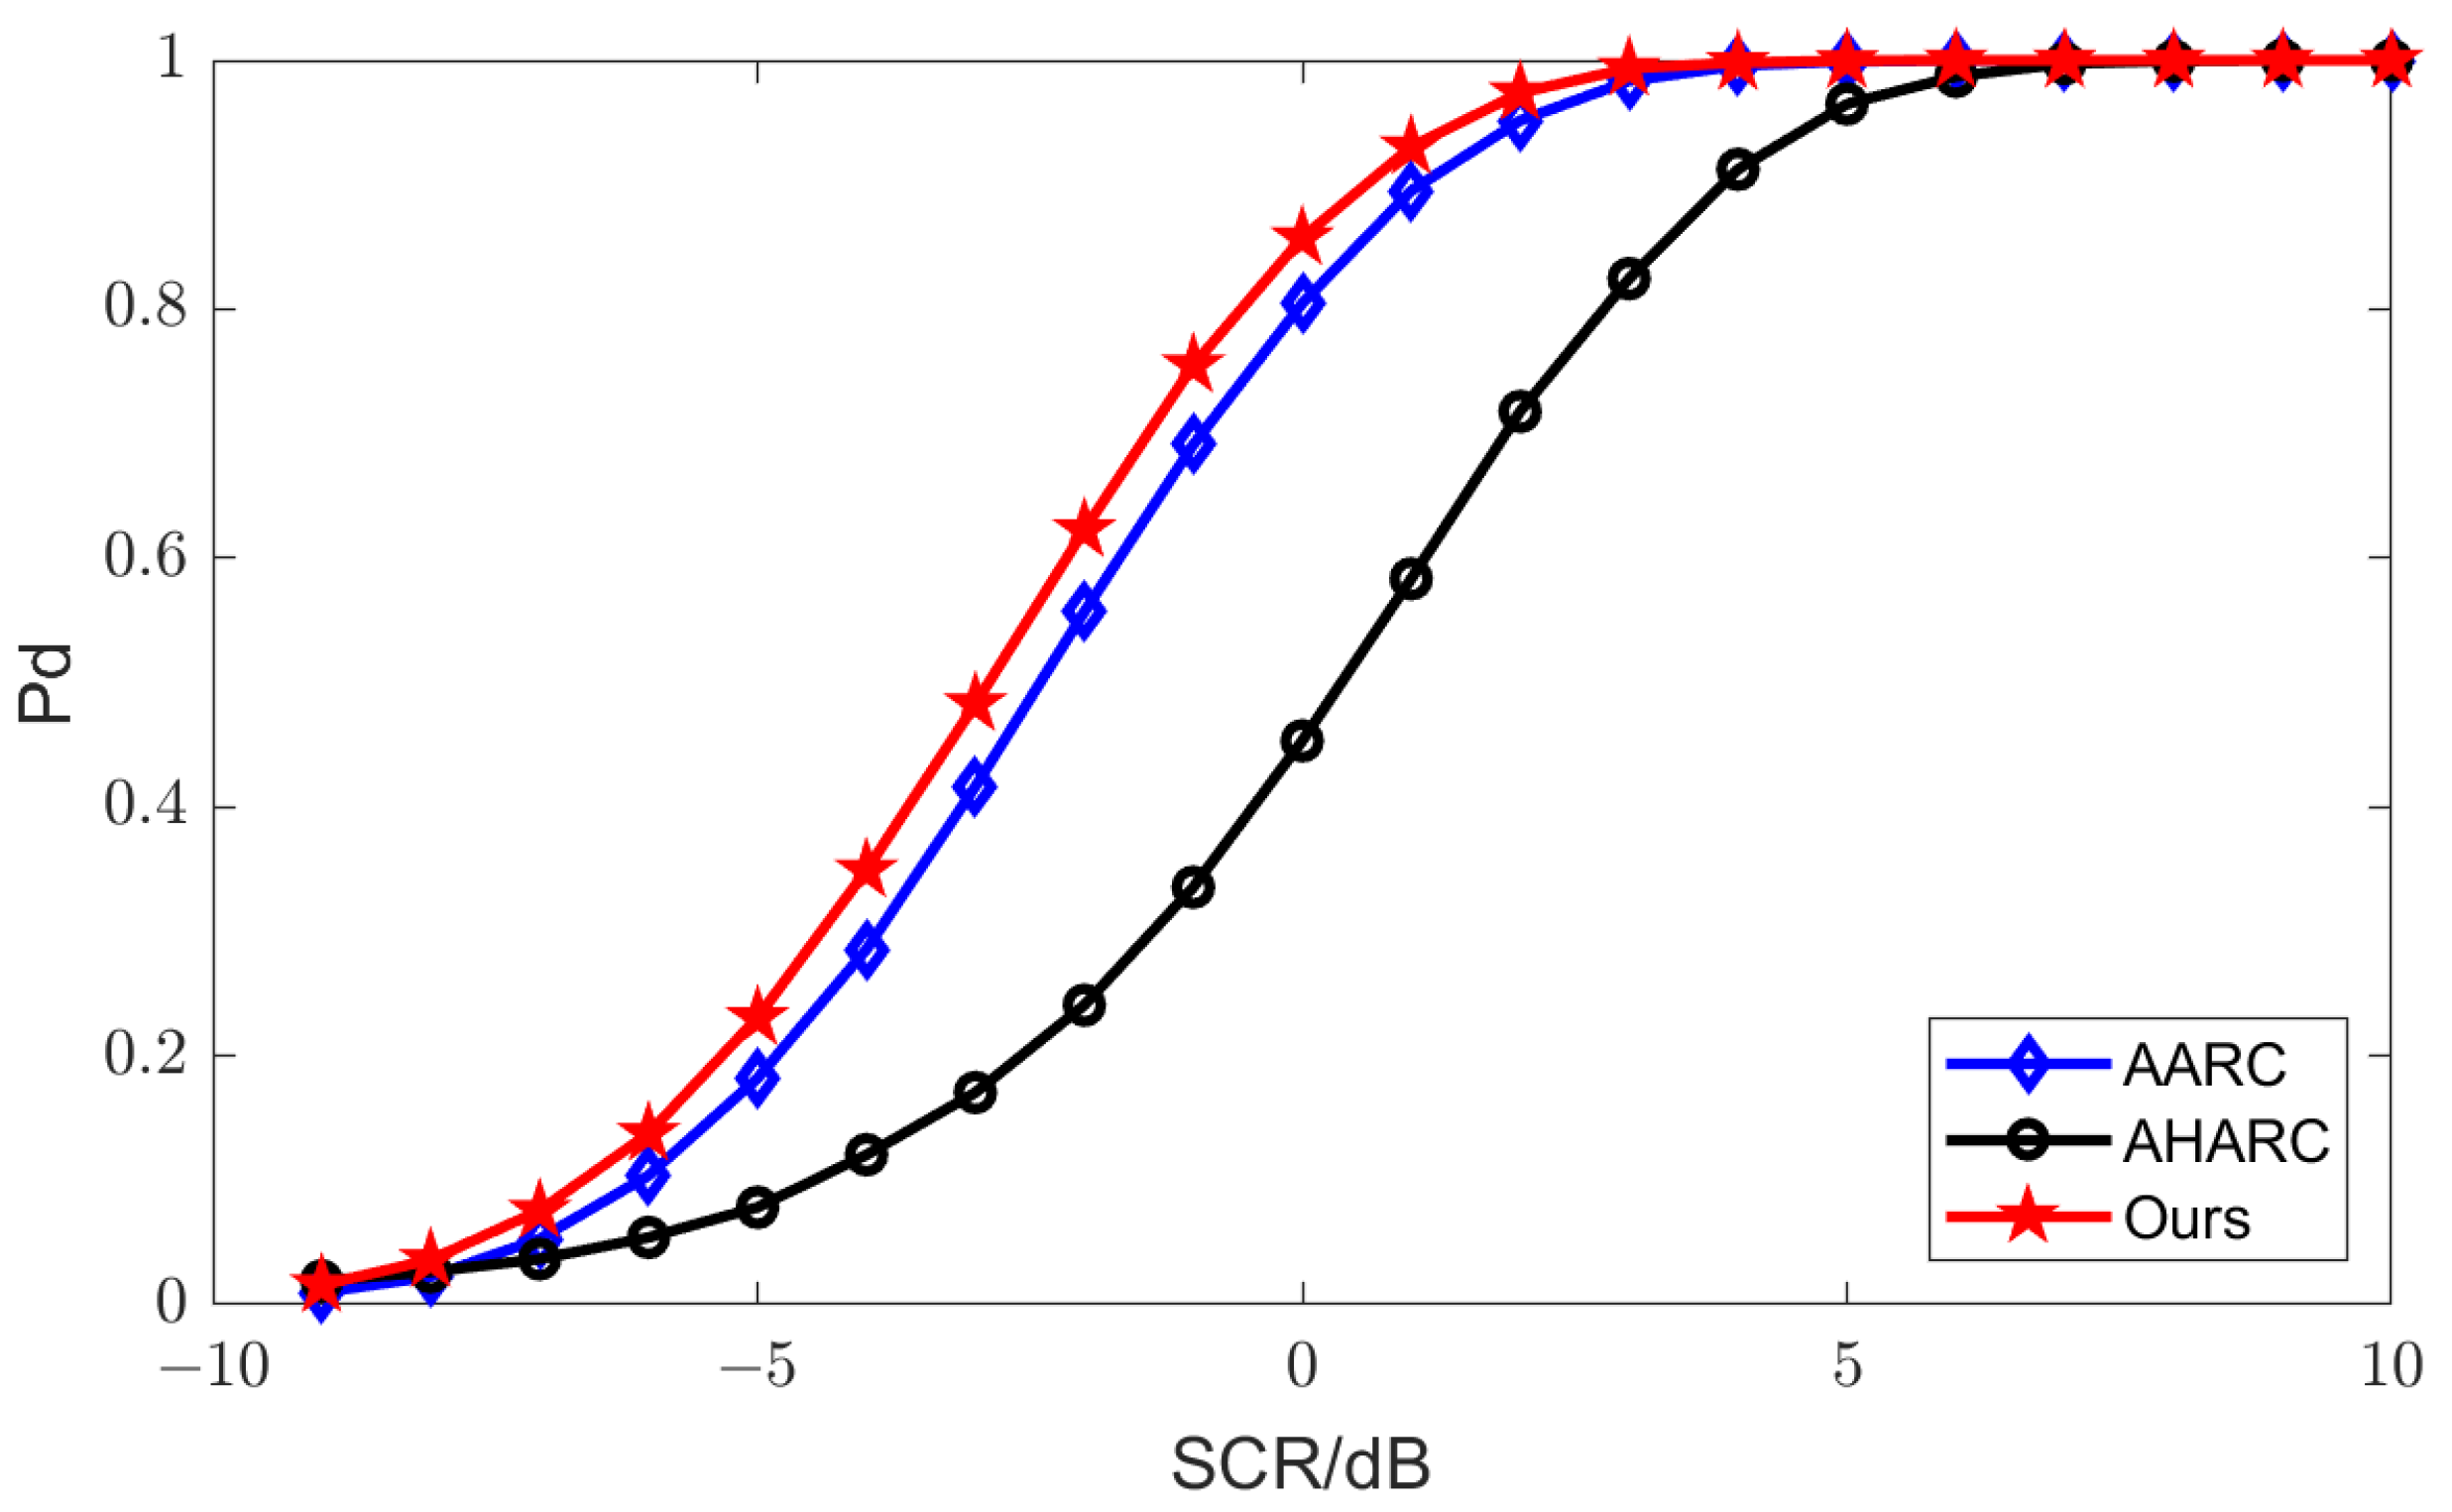
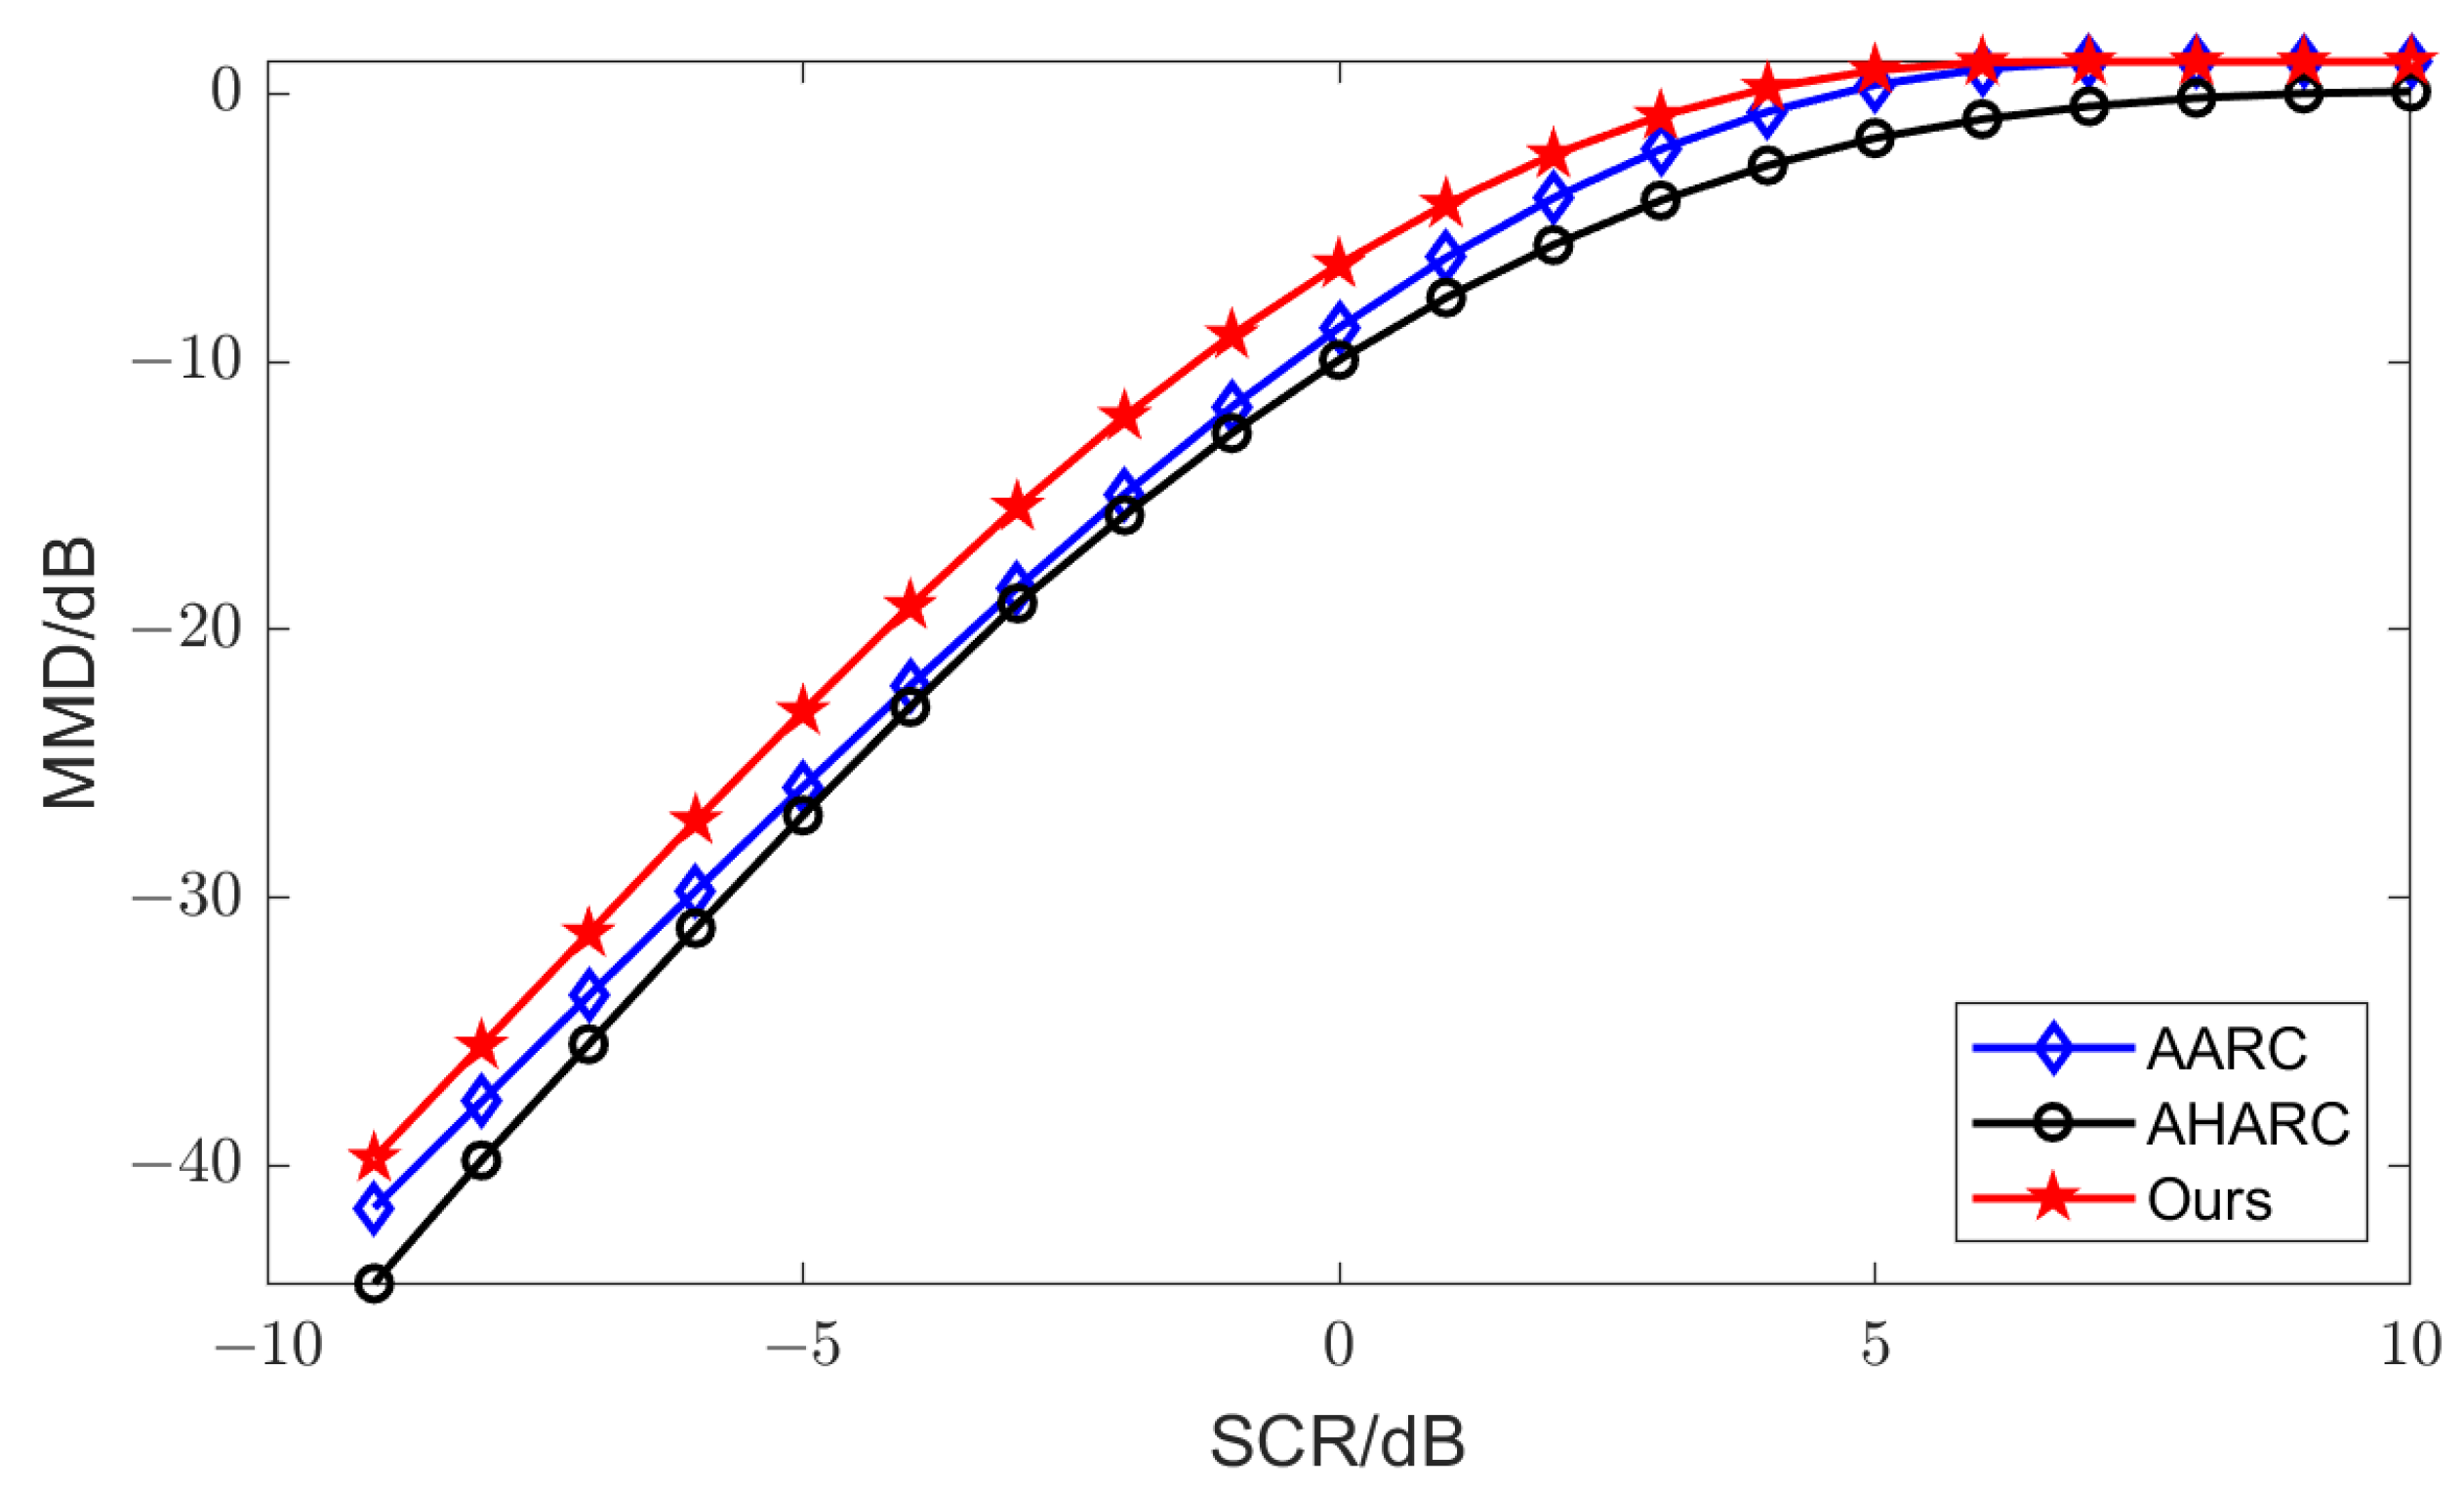
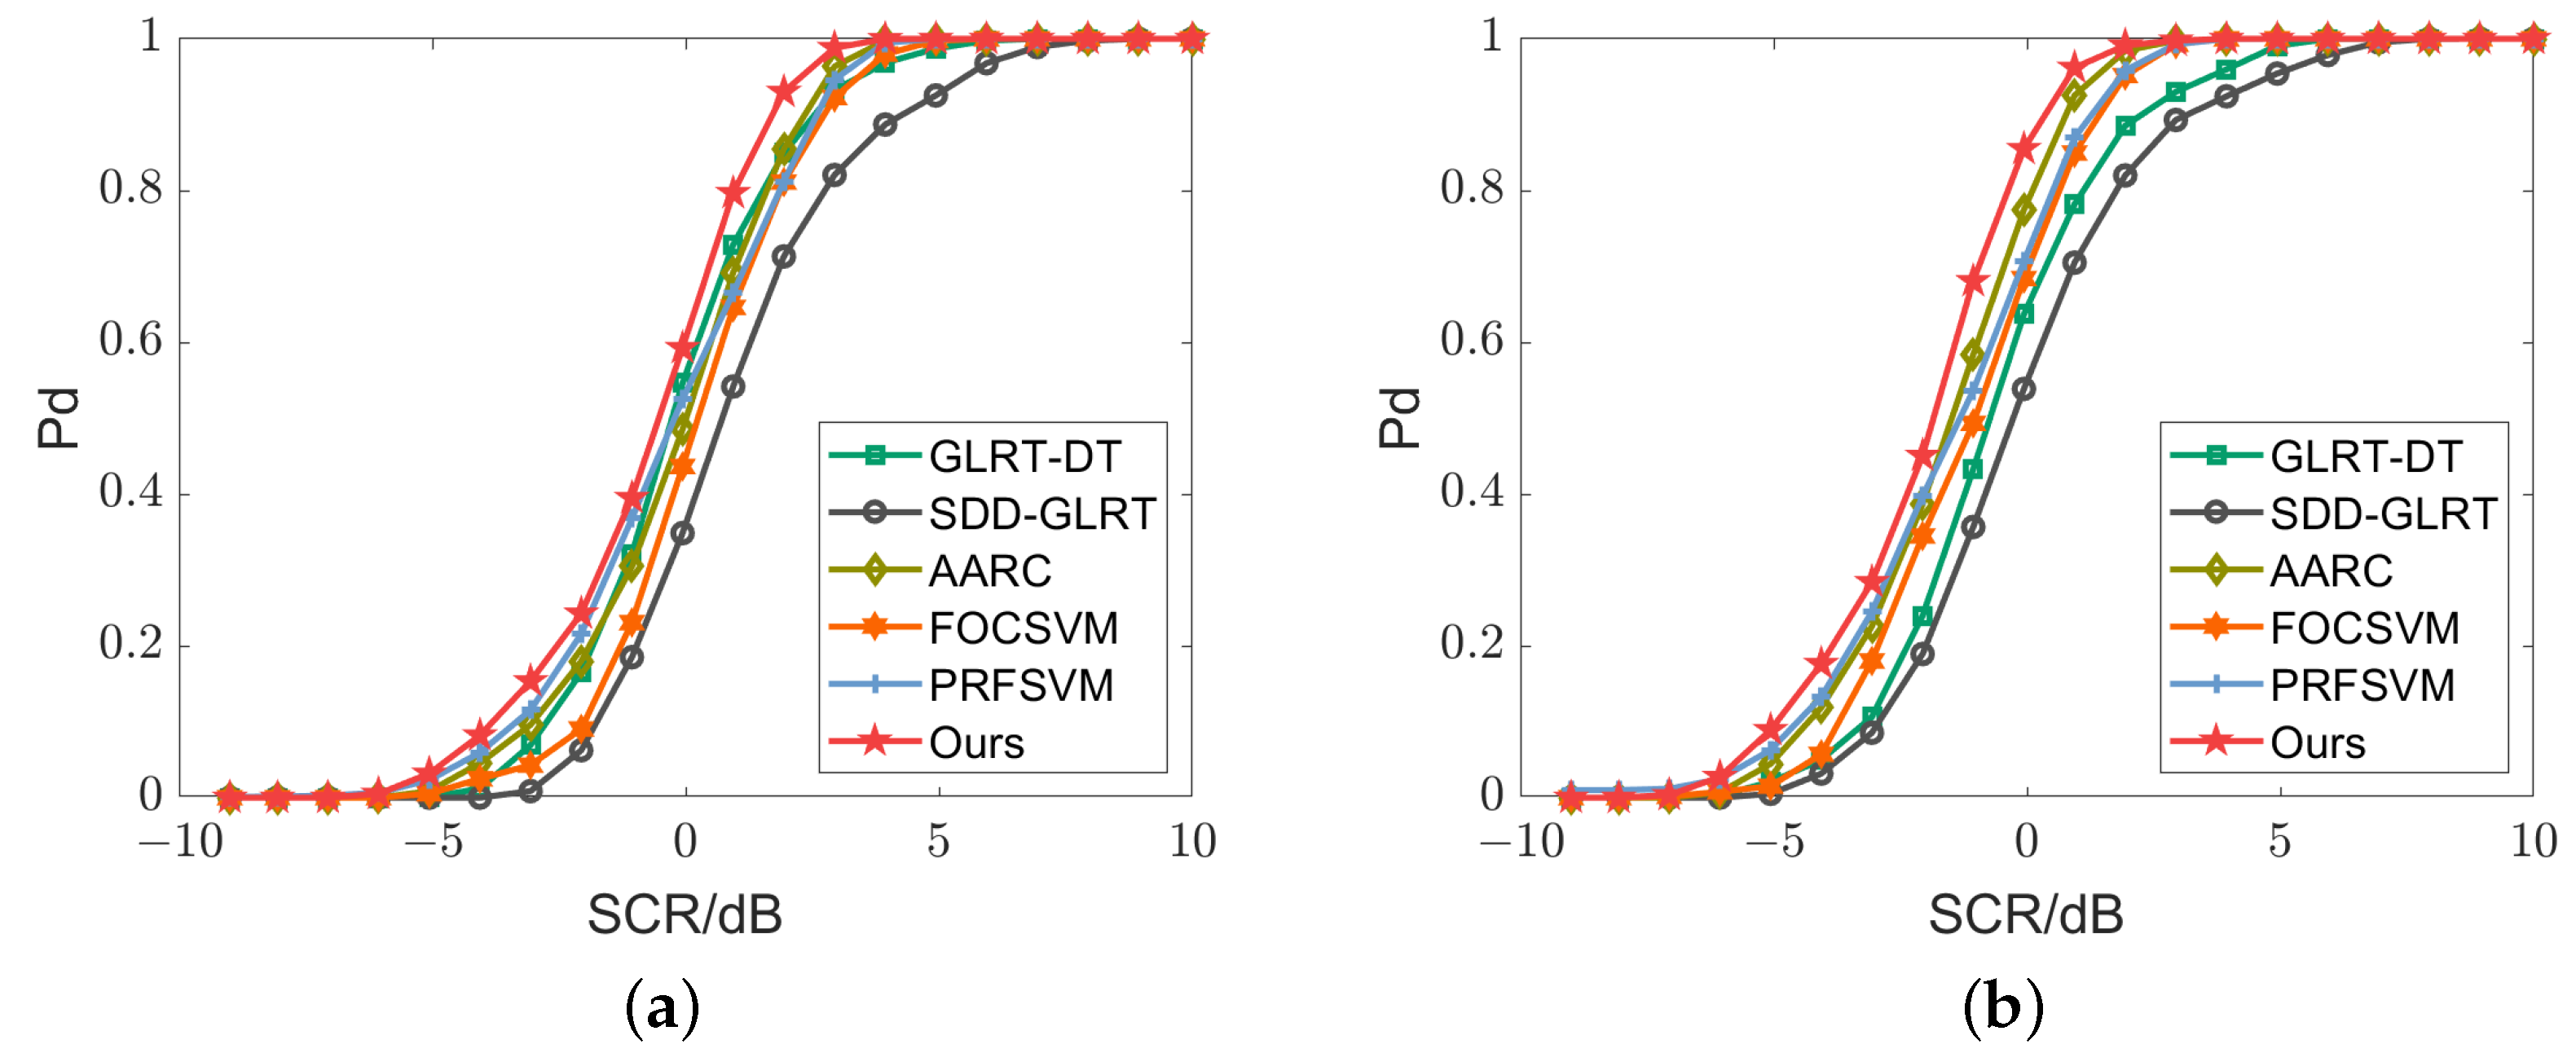
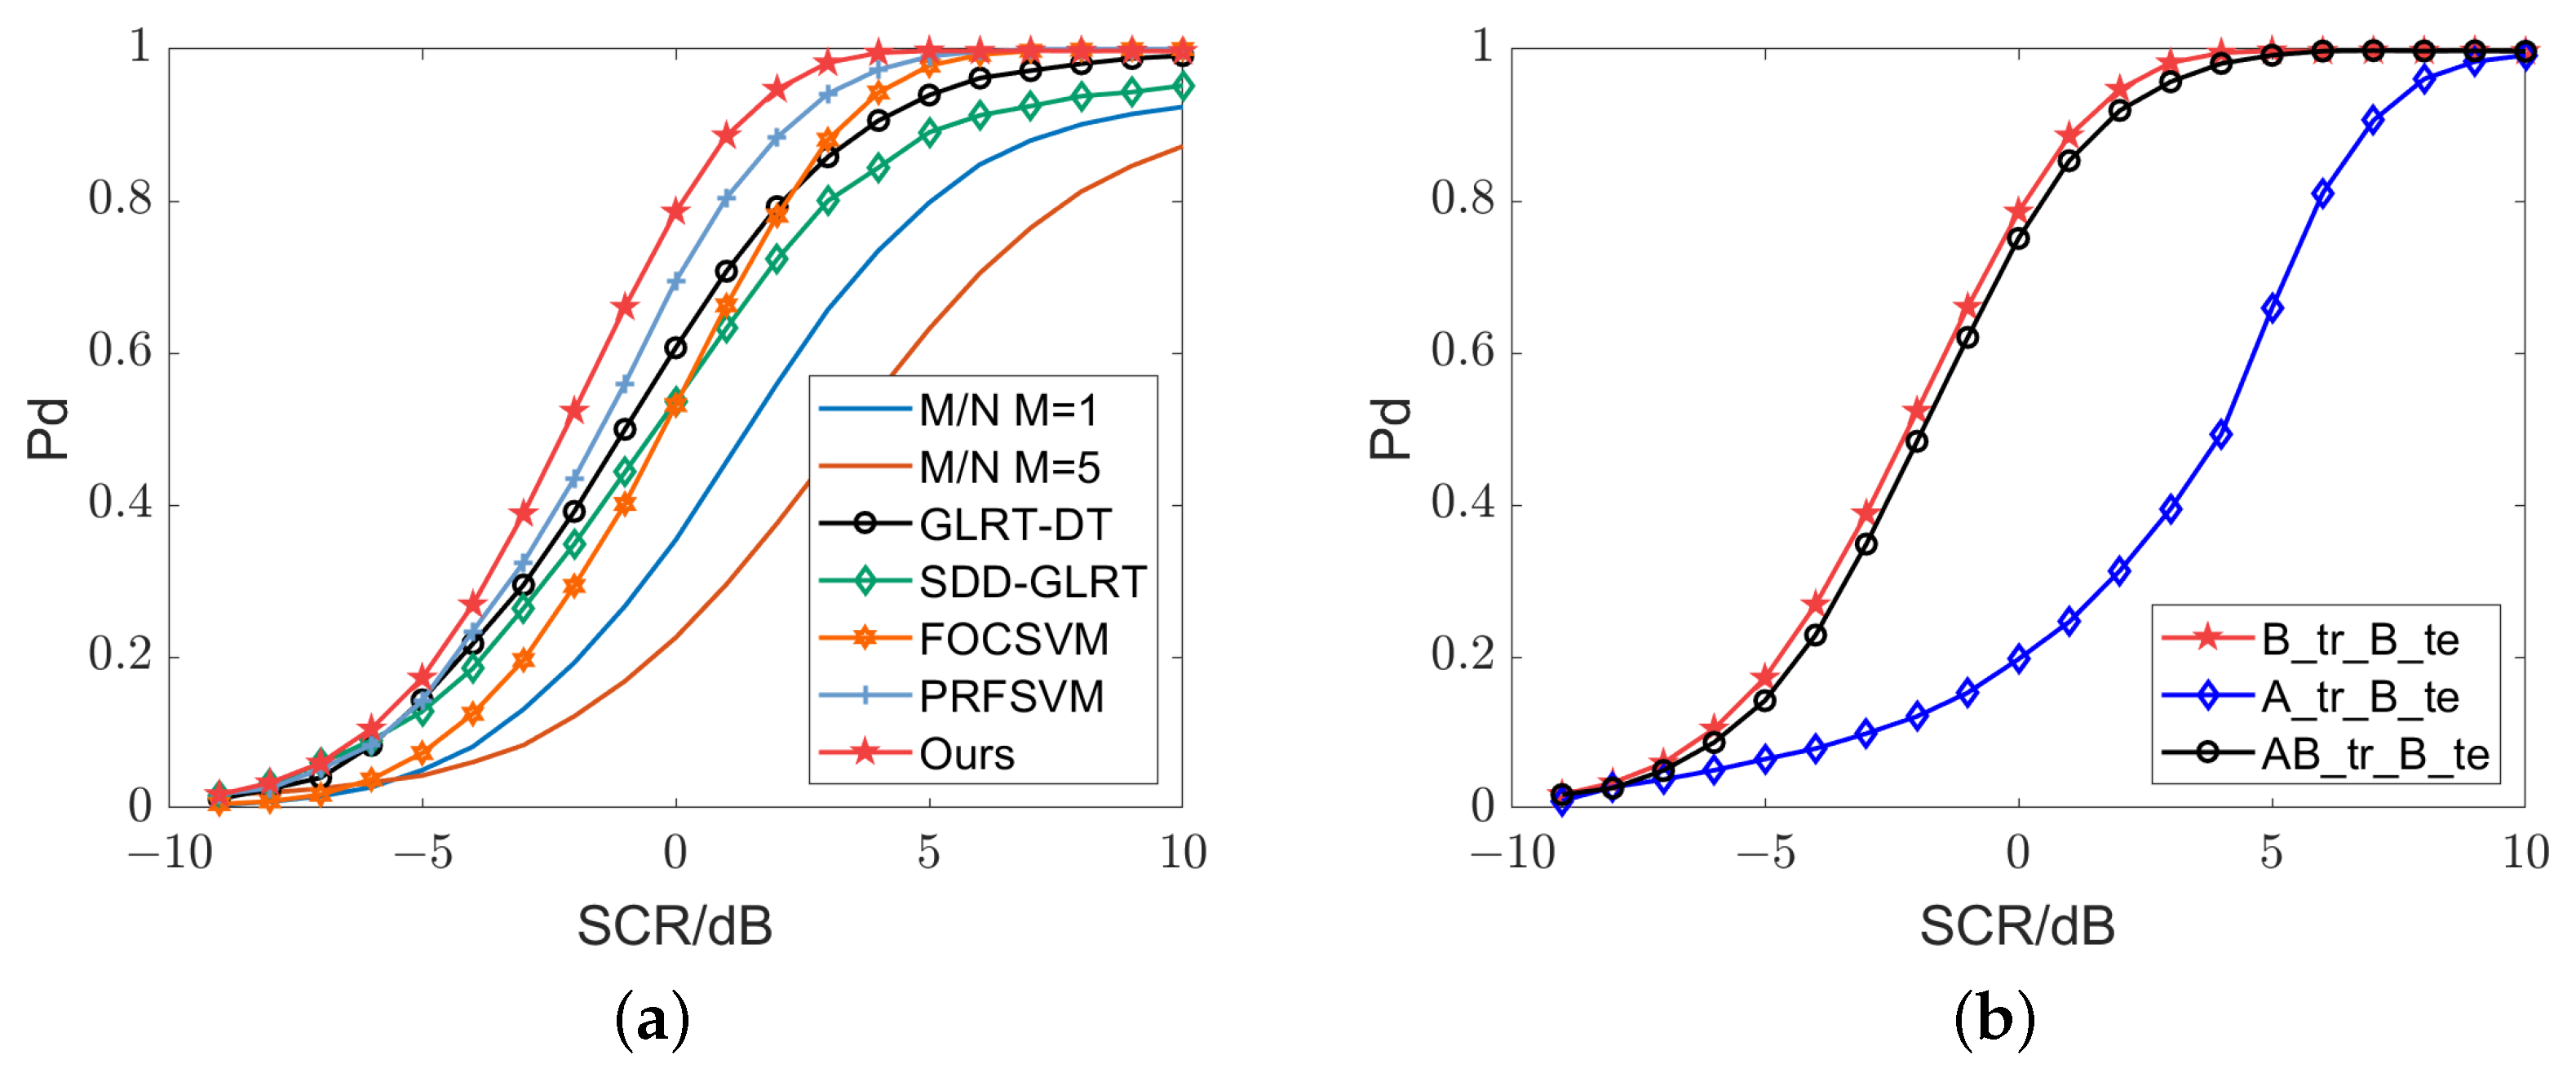
4.2. Comparison with Other Detection Methods

To verify the detection performance of the proposed method, we compared our proposed detection method with traditional popular detection methods such as M/N detector [65], SDD-GLRT [15], and GLRT-DT [18]. Because the detection performance of the M/N detector is related to the selection of the second threshold M and the value of M is usually obtained by experimental attempts, here, we selected the value of M from 1 to 5. For these methods, we used the PWF to fuse the multiple polarization channels into one channel first. Meanwhile, feature-domain detection methods proposed in [25,37] are also compared, which are referred to as FOCSVM and PRFSVM, respectively. The false alarm probability was set to 10 4 .
The detection probability (Pd) curve is shown in Figure 6. It is clear that the proposed method achieves the best performance, and the feature-domain detection methods achieve higher detection performance than the energy-domain detection methods, indicating that the mining and use of features are conducive to detection. In addition, the improvement effect is generally more obvious when the SCR is smaller than 2 dB: to achieve the detection probability of 90%, the SCR required by our method is about 0.5 dB, which is about 0.5 dB lower compared with the algorithm whose performance is second only to our method. The results show that the proposed method can better adapt to scenes with strong clutter.

4.3. Analysis on Module Settings

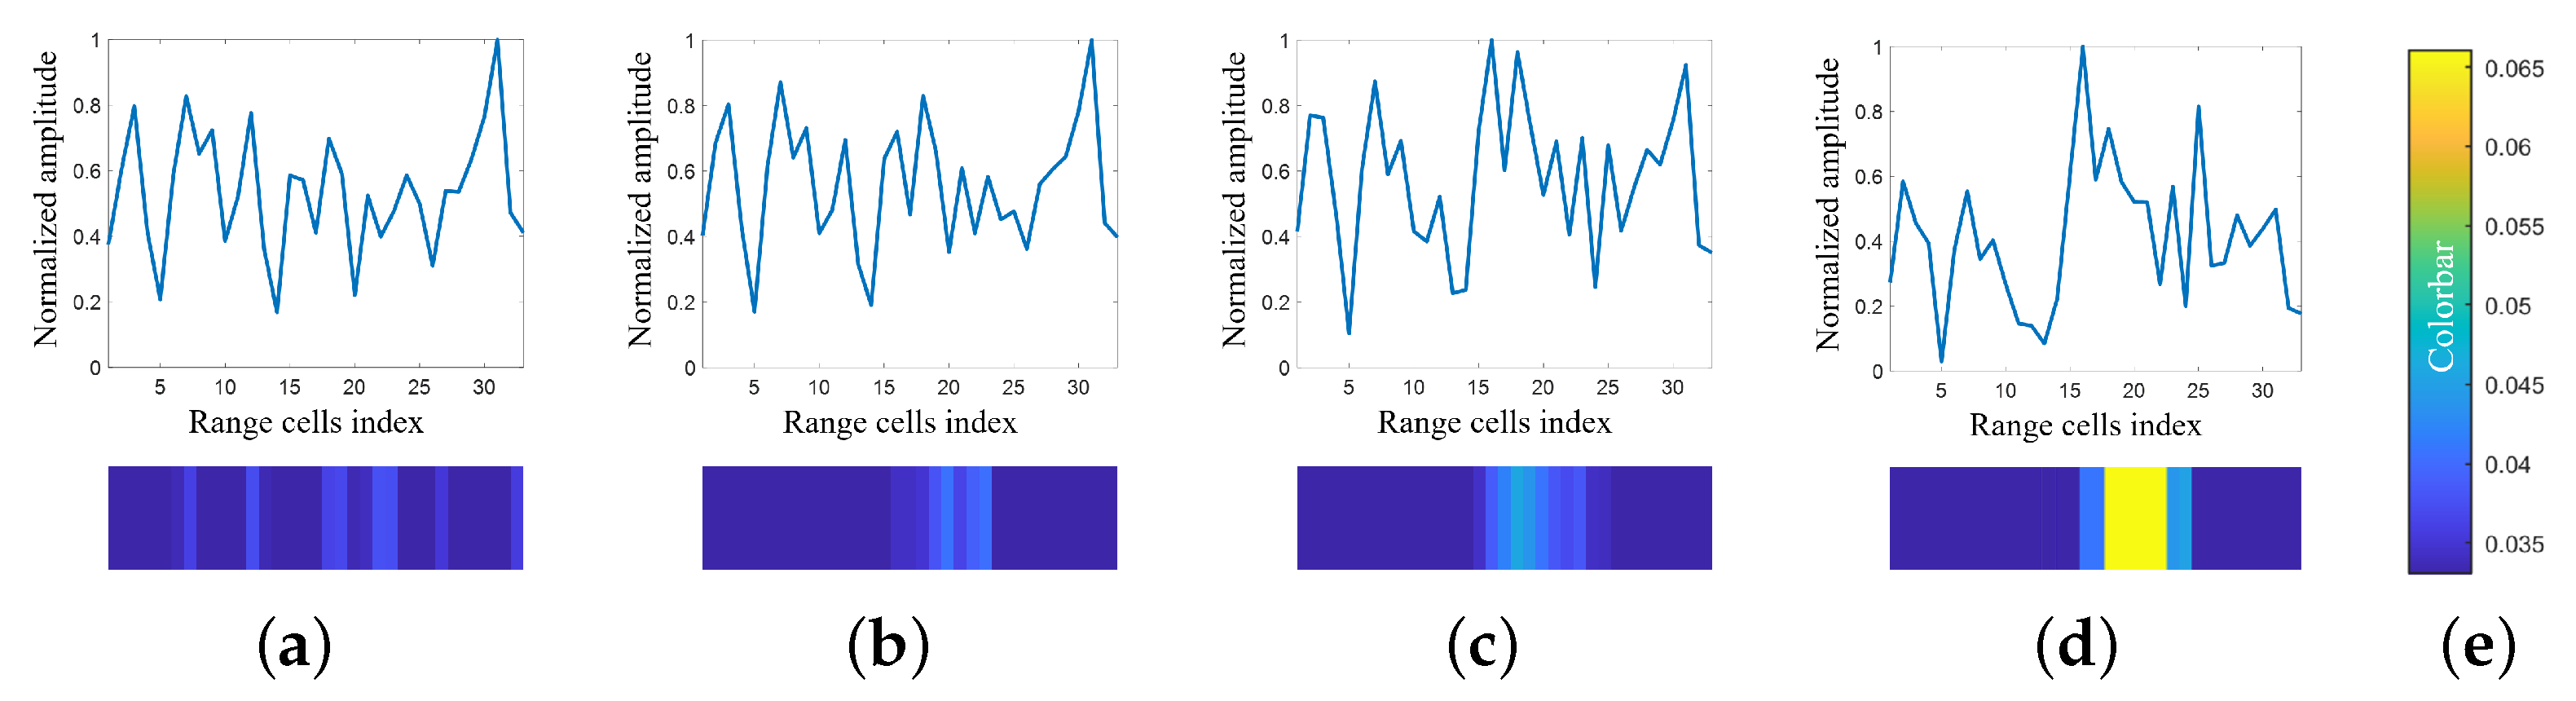
4.3.1. Analysis on the Adaptive Range Cells Weights Calculation Module

We further evaluated the effectiveness of the proposed adaptive range cells weights calculation module. Two comparison methods were set, which were averaging the features of all range cells (AARC) and averaging the features of high amplitude range cells (AHARC).
The detection probability curve is shown in Figure 7. The results show that the proposed method achieves a higher detection probability. At the same time, the detection performance of AHARC is worse than the other two methods, which shows that it is inappropriate to accumulate high-amplitude-range cells in feature-domain detection, because the range cells with low amplitude but with features obviously different from clutter are much more useful in detection. Our proposed method can take advantage of these range cells.
In addition, to obtain insight into the cause of this result, we further analyzed the adaptive weights and the separability between the clutter and the target.
(1)
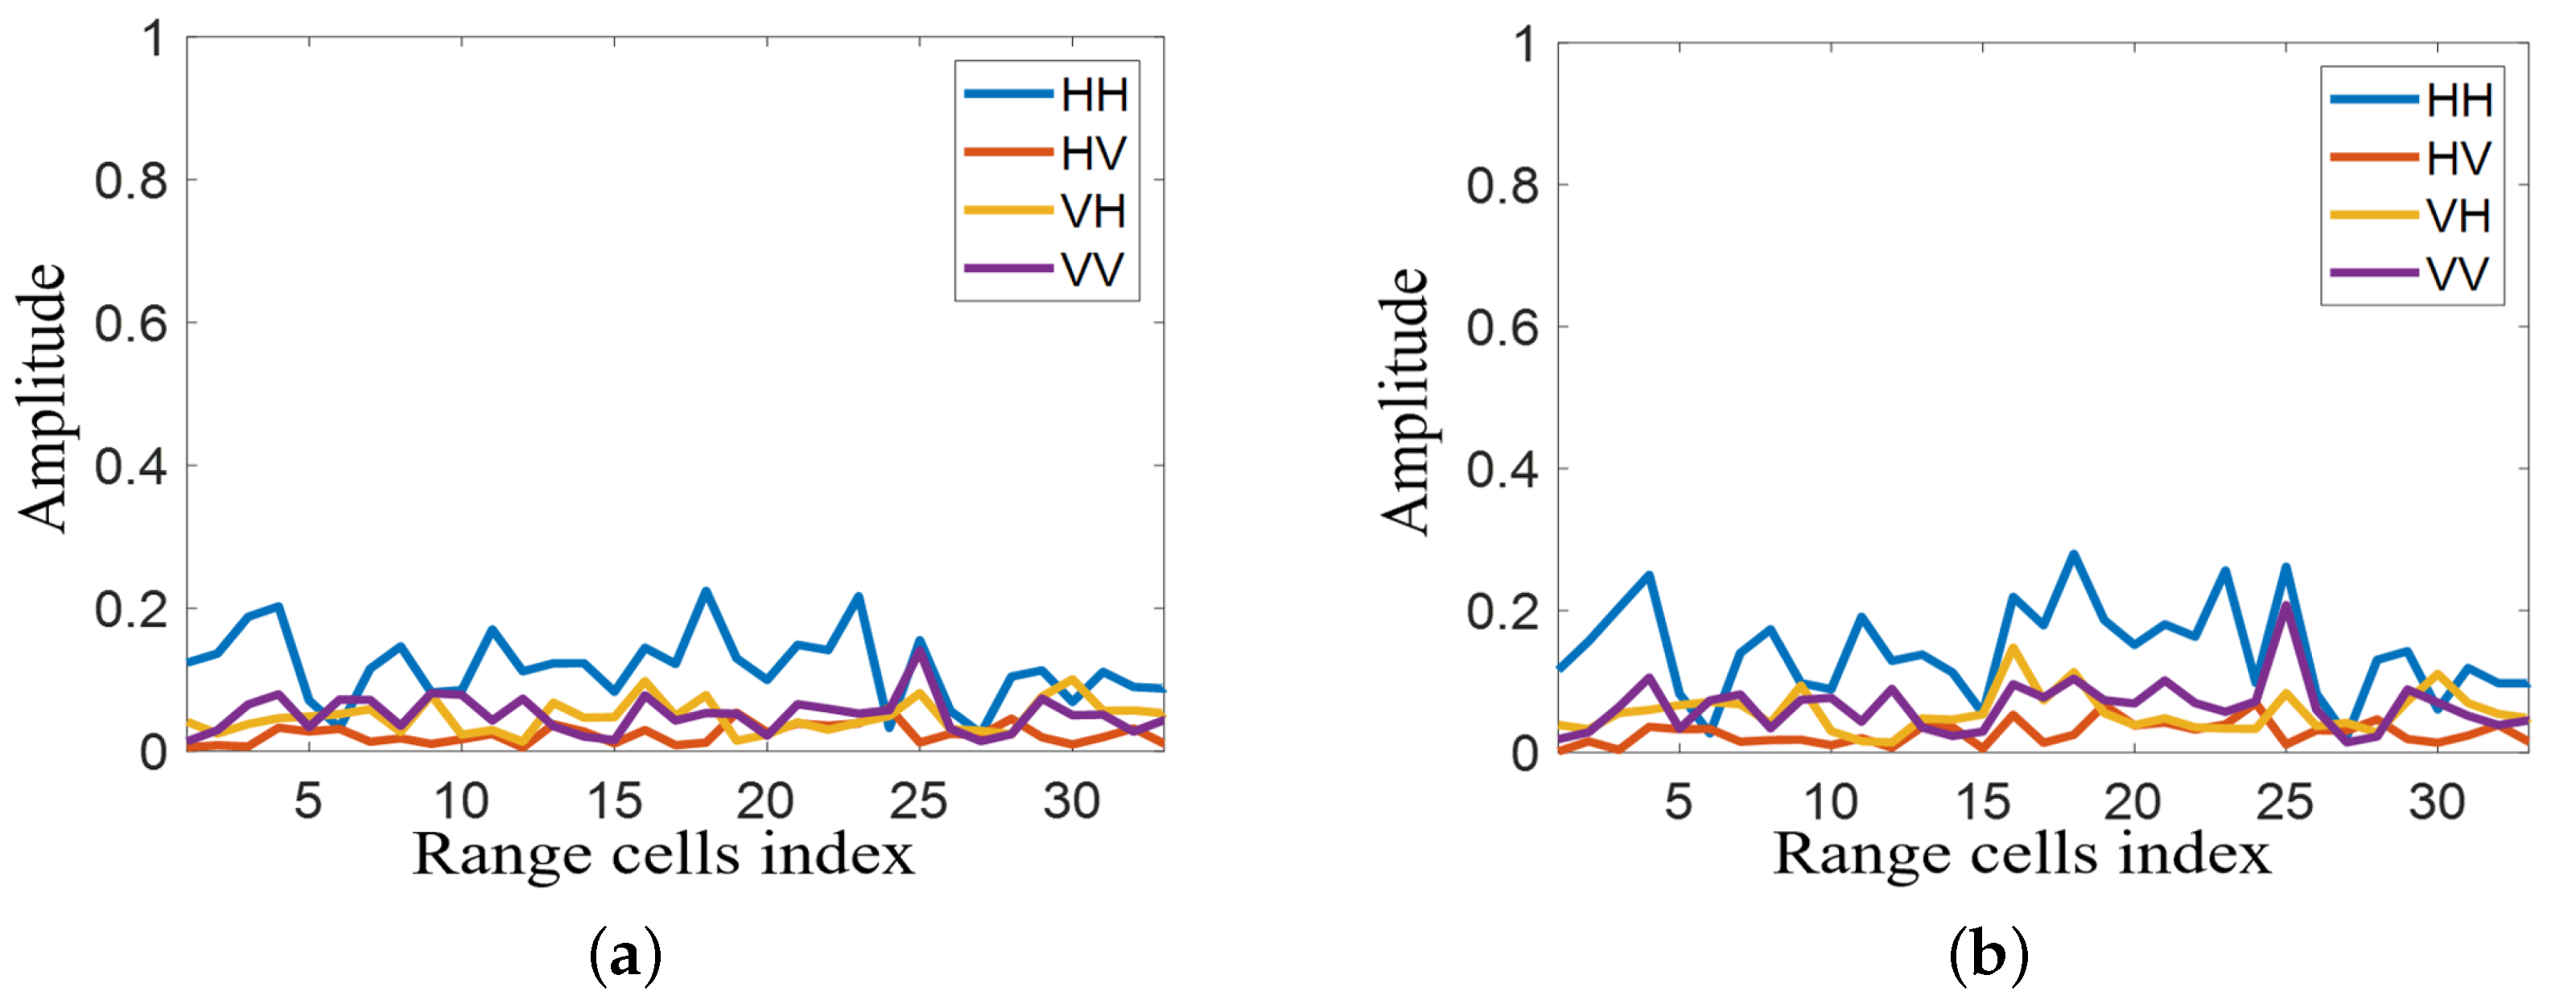
Visual analysis on adaptive weights
Figure 8 shows the visual analysis on adaptive weights. In the figure, the first line shows the HH channel of different samples, and the second line presents heat diagrams of their corresponding adaptive weights. The three target samples are generated by the same target segment.
From the figure, it is evident that when the SCR was low, the range cells occupied by the clutter had approximately the same amplitudes as the range cells containing the target. As such, it was difficult to differentiate between these two kinds of range cells based on their amplitude. However, in low-SCR conditions (−5 dB and 0 dB), our proposed method calculated weights which were close to that of a relatively high SCR (5 dB). Specifically, the 15 - th to 25 - th range cells were given higher weights. For clutter, the heat diagram shows that our proposed adaptive range cells weights calculation module did not find range cells that were obviously useful for detection. The result demonstrates that our proposed module can automatically identify range cells with target scattering centers under low-SCR conditions, thereby achieving better range cells weights calculating performance.
(2)
Separability analysis between clutter and target
In this paper, we propose to enhance the separability of targets and clutter FDS by giving different weights to range cells. To assess the performance of our proposed method, we analyzed the separability between clutter and target by computing the maximum mean discrepancy (MMD) [66]. The calculation formula is
M M D 2 X , Y = 1 n i = 1 n ϕ x i 1 m j = 1 m ϕ y j H 2 = 1 m 2 i = 1 m j = 1 m K x i , x j 1 m n i = 1 n j = 1 m K x i , y j + 1 n 2 i = 1 n j = 1 n K y i , y j ,
where ϕ · denotes an element of a set of functions in the unit ball of a reproducing kernel Hilbert space. X and Y represent two input sets, x i X , y i Y . In our calculations, X represents the set of clutter features and Y represents the set of target features with a specific SCR. K · , · denotes the Gaussian kernel function, and the calculation formula is
K x , y = e x y 2 2 σ 2 ,
where σ is Gaussian root mean square width which adjusts the smoothness. The detailed derivation process can be found in [67].
In Figure 9, the MMD curves are presented. The smaller the MMD value, the smaller the difference. It can be observed that our method improved the separability. It can also be seen that only accumulating the features of high-amplitude range cells is not beneficial to improve the separability between clutter and targets. Our method considers both amplitude and feature information to adaptively weight range cells, which can obtain more discriminative FDS.

4.3.2. Analysis on Supervision Weights Calculation Module

To evaluate whether the joint use of amplitude and polarimetric features can increase information utilization and enhance the weights calculation performance, we compared the detection performance of three methods that only uses amplitude information, only uses feature information, or jointly uses both. The distinction between these three methods lies in the information used for obtaining supervision weights.
As depicted in Figure 10, the proposed method achieves a higher detection probability. It is evident that training AMN using only amplitude or feature information is not optimal, and combining amplitude and feature information can improve detection performance.

4.4. Analysis on Different Target Models

To further analyze the applicability of our proposed method on different target models, we set up two target energy distributions for detection—targets with concentrated energy distribution and targets with dispersed energy distribution. Here, due to the limitation of data, we chose echo of frontal direction to simulate the target with relatively concentrated energy and echo of head-on direction to simulate the target with more dispersed energy, as shown in Figure 11.
In this experiment, due to the relatively high detection performance, the SDD-GLRT, GLRT-DT, FOCSVM, and PRFSVM introduced in Section 4.2 and the AARC introduced in Section 4.3.1 were selected as comparison methods. As shown in Figure 12, it can be observed that the proposed method achieved the highest detection probability. Moreover, comparing results under both energy distributions, it is evident that targets with relatively concentrated energy are more difficult to detect. This is because when the length of the detection window is fixed, fewer range cells are occupied by the target and, thus, the negative effects of clutter become more severe. The detection performance of AARC would degrade obviously, while our proposed method was able to tackle this issue effectively through adaptive weight calculation.

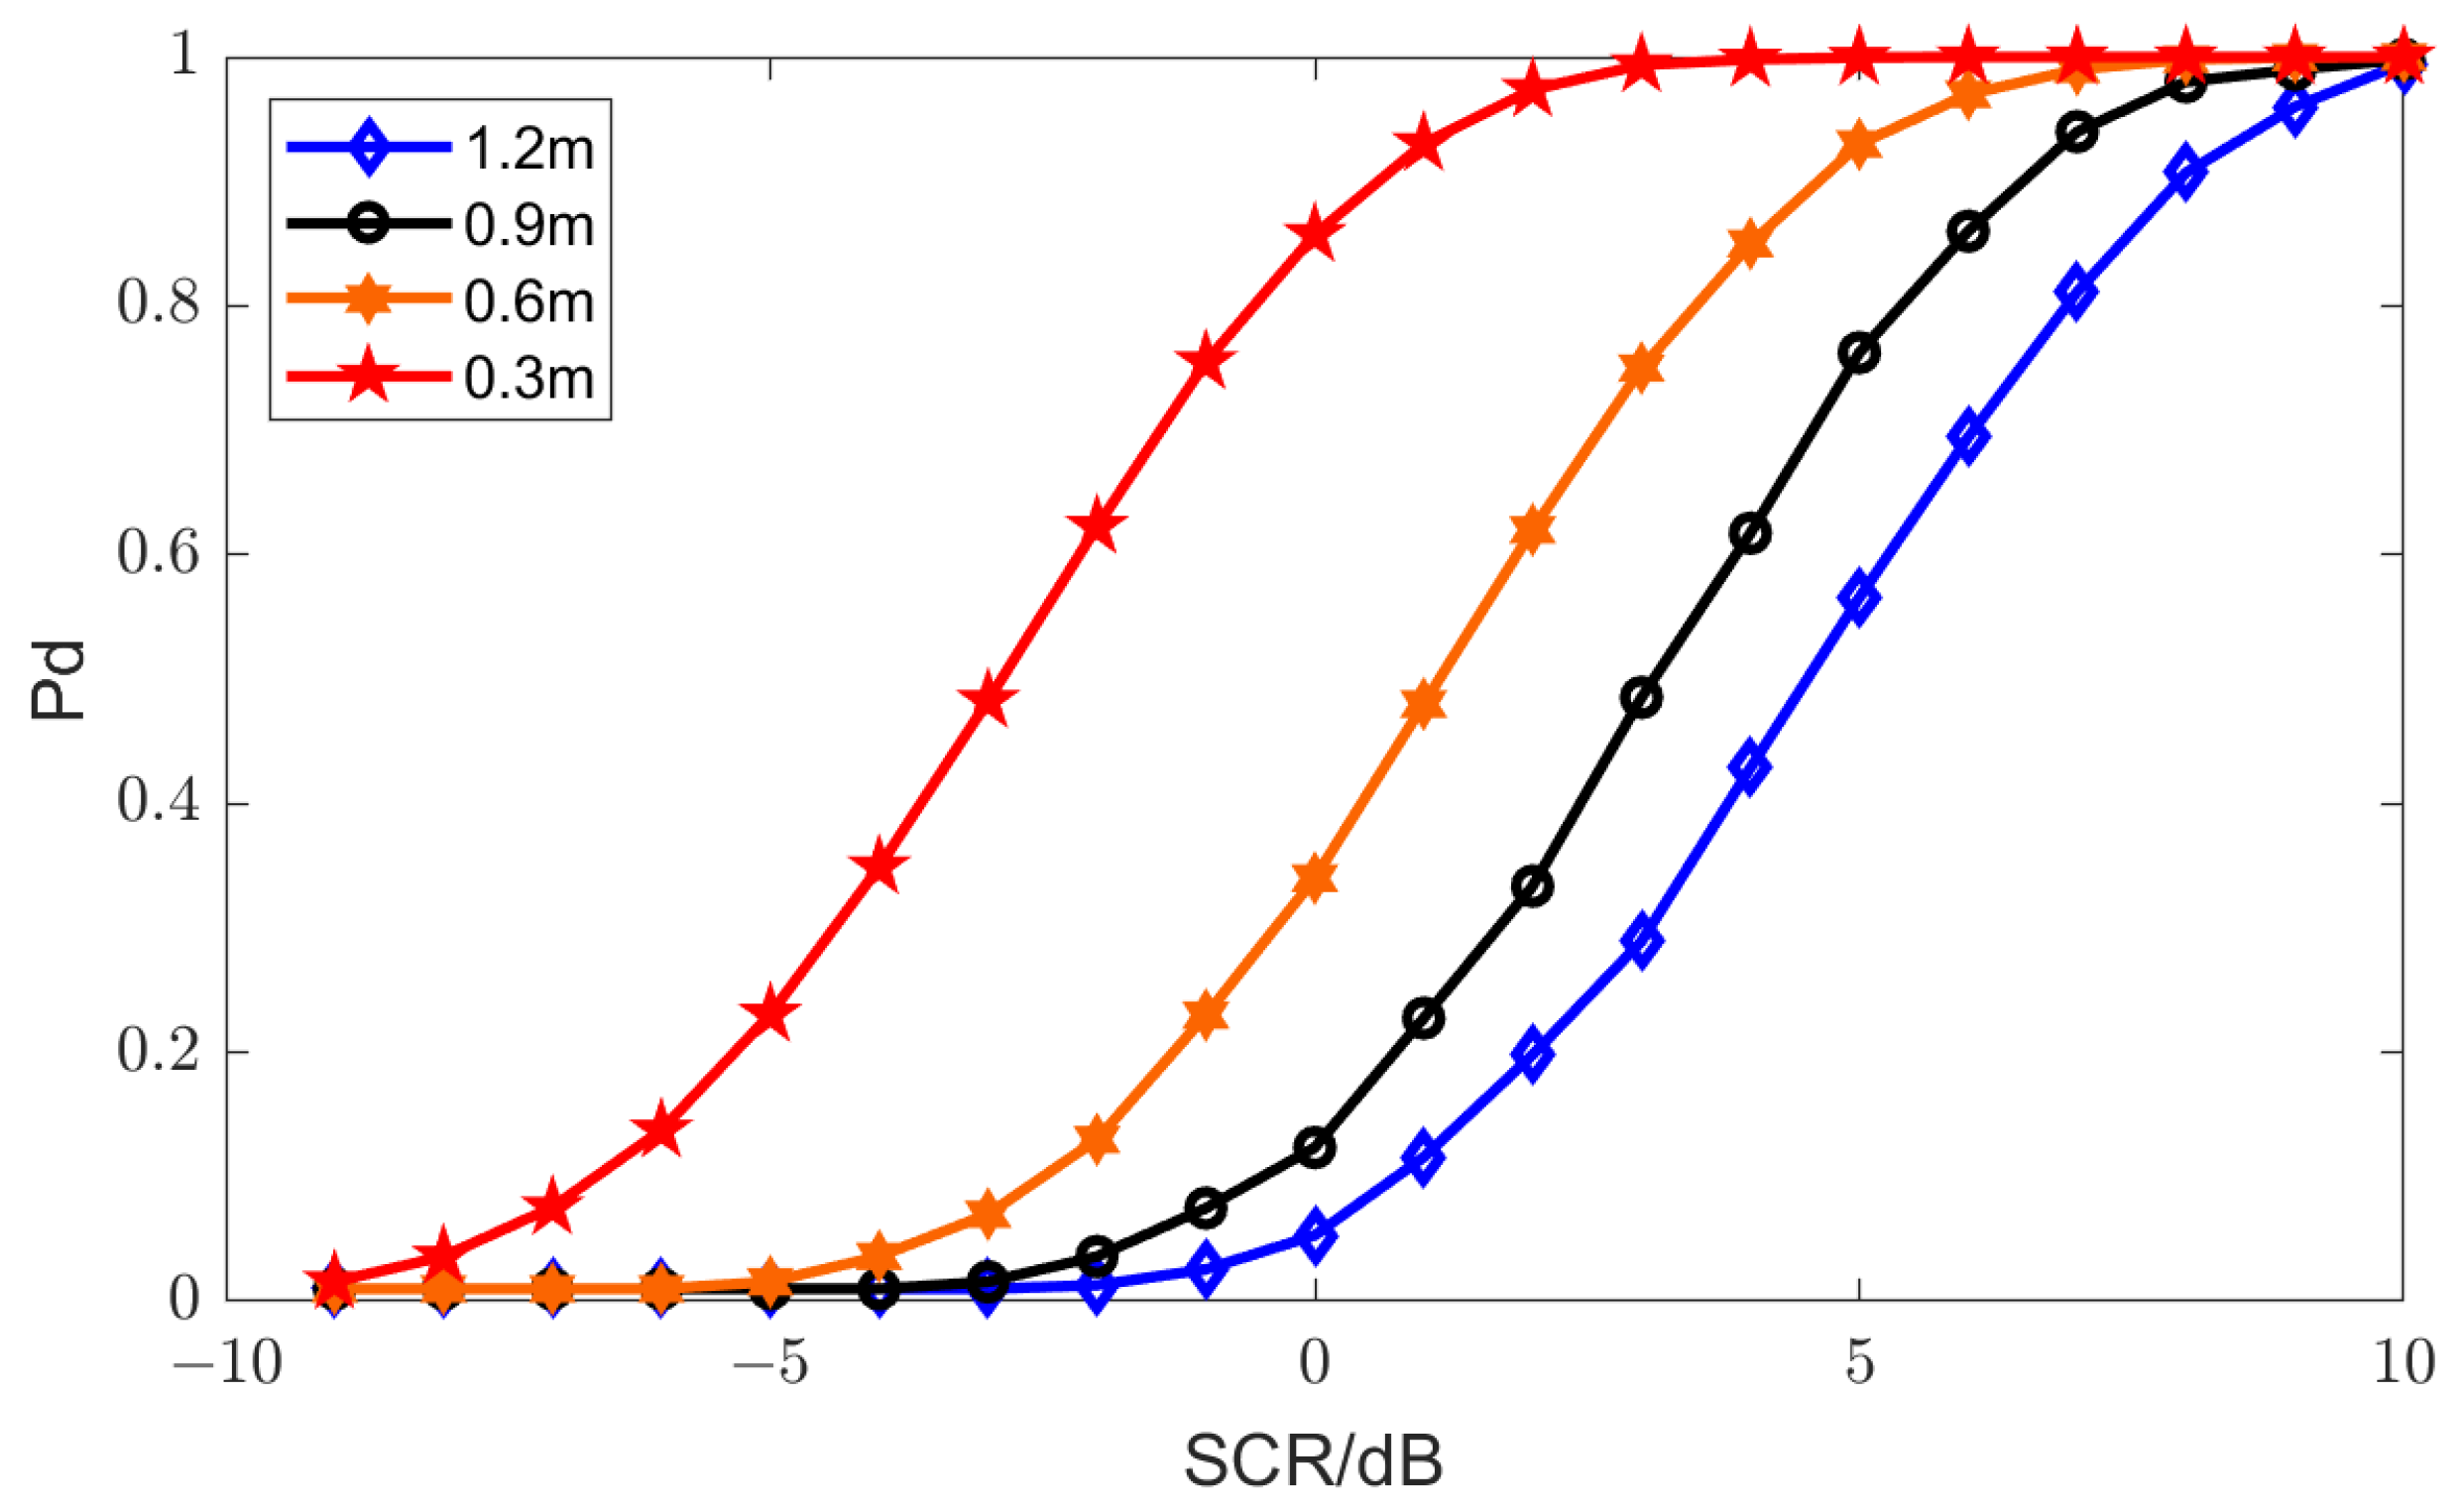
4.5. Analysis on Range Resolution

The influence of range resolution on detection performance was further analyzed. Specifically, based on the original echoes of the GTRI dataset, we obtained HRRP data with range resolutions of 0.3, 0.6, 0.9, and 1.2 m by changing the number of frequency-hopping sub-pulses. The detection results are shown in Figure 13. As shown, the higher the range resolution, the higher the detection probability. This result is expected because the key point that our proposed method can improve the detection probability is to weight the range cells. When the range resolution increases, multiple range cells that cannot be resolved under low-resolution conditions can be resolved and be weighted separately, thereby improving the detection performance.

5. Discussion

The advantages of our method: In the present study, we propose a novel polarimetric feature-domain RET detection method, which not only uses polarimetric features but also proposes a feature accumulation method with adaptive weighting. For energy-domain detection methods, extracting high-amplitude range cells and accumulating energy on them is beneficial to avoid the problem of collapsing loss, but for feature-domain detection methods, the amplitude is not strongly correlated with features. Accumulating only high-amplitude range cells will lose target weak scattering centers whose scattering characteristics are significantly different from clutter, leading to a drop in detection performance, which can be seen in Figure 7. We propose an AMN-based module to adaptively calculate weights of range cells from the perspective of jointly using energy and feature information, which can allow the range cells to participate better in accumulation. The above reasons together lead to the better detection performance of our proposed method, which can be seen in Figure 6.
Applicable conditions of our method: In order to see the adaptability of the proposed method to different clutter distributions, in addition to the clutter used in Section 4 (denoted as clutter A), we collected another kind of clutter data (denoted as clutter B) and conducted experiments. The experimental results of different detection methods under clutter B are shown in Figure 14a. It can be seen that the proposed method also achieves the best detection performance in the new clutter background. This shows that our proposed method is applicable to different clutter backgrounds, and theoretically, although we design it for ground targets, it is also suitable for sea target detection. However, sea clutter has its unique characteristics [68,69], such as strong time variability, and the distribution of training and testing data may be different. Therefore, we additionally design experiments (as shown in Table 2) to see the performance when the training and testing clutter distributions are different. The results are shown in Figure 14b. When the training and testing data are different, the detection performance will drop. This is expected since our approach is data-driven. Despite the influence, we can train the detector with various clutter distributions, and as long as the clutter to be tested is learned, good detection performance can be achieved. As shown in the black line with circle markers (AB_tr_B_te) in Figure 14b, training on various clutter can facilitate this problem.
Outlook: Although our proposed method is proposed for the problem of target detection in one-dimensional (1D) radar using polarimetric features, it is also applicable to other feature-domain detectors that extract features on range cells and even to two-dimensional (2D) radar images. The proposed method can be adapted to 2D radar images by extending the dimension of the network and extracting high-contributing range cells along both the range and azimuth directions. Under 1D high-resolution radar, target information is scattered in multiple range cells, and adaptively assigning different weights to range cells is beneficial to improve detection performance. Two-dimensional radar images can achieve high resolution from both distance and azimuth [70], and assigning different weights to pixels in the image may improve detection performance compared to 1D. In addition, we will study modeling the RET detection problem as an anomaly detection problem on a data flow and try other algorithms such as unsupervised drift detection in the future.

6. Conclusions

A novel RET detection method that extracts polarimetric features and adaptively assigns different weights for range cells during obtaining FDS is established. Polarimetric features that reflect scattering properties are used to detect targets, and adaptive weighting further increases the separability between targets and clutter. The proposed method was compared with both traditional popular energy-domain detection methods and existing feature-domain detection methods on ground target polarimetric HRRPs with azimuth angles of 0–360° and achieved the highest detection probability. Moreover, we analyzed the situation when the target model was different, and found that in the two cases of targets with concentrated energy distribution and with dispersed energy distribution, there are performance improvements for both. Further work will focus on situations when the training clutter is different from that in real data processing to further increase the robustness to clutter distribution changes.

Author Contributions

Conceptualization, M.Y. and L.Z.; methodology, Y.W. and M.Y.; software, M.Y. and C.H.; validation, M.Y., L.Z. and C.H.; formal analysis, Y.W.; writing—original draft preparation, M.Y.; writing—review and editing, L.Z. and Y.W.; supervision, L.Z. All authors have read and agreed to the published version of the manuscript.

Funding

This research was funded by the National Key R&D Program of China (Grant Nos. 2018YFE0202102, 2018YFE0202103), Natural Science Foundation of Chongqing, China (Grant No. cstc2020jcyj-msxmX0812), and Shandong Provincial Natural Science Foundation (Grant No. ZR2021 MF134).

Data Availability Statement

The HRRPs used for the experiments are the publicly available GTRI 3D Turntable Data. The descriptions and archive for the dataset can be found at https://www.sdms.afrl.af.mil/index.php?collection=gtri, accessed on 17 January 2023.

Conflicts of Interest

The authors declare no conflict of interest.

Abbreviations

The following abbreviations are used in this manuscript:
AMNAttention mechanism network
FDSFeature-domain detection statistics
GTRIGeorgia Technology Research Institute
HRRPHigh-resolution range profile
MMDMaximum mean discrepancy
OCSVMOne-class support vector machine
PdDetection probability
PWFPolarimetric whitening filter
RETRange extended target
SCRSignal-to-clutter ratio
1DOne-dimensional
2DTwo-dimensional

References

  1. Wang, J.; Liu, Z.; Xie, R.; Ran, L. Radar HRRP Target Recognition Based on Dynamic Learning with Limited Training Data. Remote Sens. 2021, 13, 750. [Google Scholar] [CrossRef]
  2. Jiang, Y.; Wang, Y.; Li, Y.; Chen, X. Eigenvalue-based ground target detection in high-resolution range profiles. IET Radar Sonar Navig. 2020, 14, 1747–1756. [Google Scholar] [CrossRef]
  3. Chen, W.; Zhang, L.; Xi, Y.; Wang, Y.; Li, Y. Polarimetric HRRP Target Recognition Based on Convlstm. In Proceedings of the IGARSS 2019—2019 IEEE International Geoscience and Remote Sensing Symposium, Yokohama, Japan, 28 July–2 August 2019; pp. 334–337. [Google Scholar] [CrossRef]
  4. Fei, C.; Liu, T.; Lampropoulos, G.A.; Anastassopoulos, V. Markov Chain CFAR Detection for Polarimetric Data Using Data Fusion. IEEE Trans. Geosci. Remote Sens. 2012, 50, 397–408. [Google Scholar] [CrossRef]
  5. Chen, X.; Hou, K.; Chang, S.; Liu, Q.; Ren, W. Detection of range-spread targets based on order statistics. Digit. Signal Process. 2023, 133, 103803. [Google Scholar] [CrossRef]
  6. Gao, C.; Yan, J.; Peng, X.; Liu, H. Signal structure information-based target detection with a fully convolutional network. Inf. Sci. 2021, 576, 345–354. [Google Scholar] [CrossRef]
  7. Xu, L.; Feng, D.; Zhang, R.; Wang, X. High-Resolution Range Profile Deception Method Based on Phase-Switched Screen. IEEE Antennas Wirel. Propag. Lett. 2016, 15, 1665–1668. [Google Scholar] [CrossRef]
  8. Novak, L.; Burl, M.; Irving, W. Optimal polarimetric processing for enhanced target detection. IEEE Trans. Aerosp. Electron. Syst. 1993, 29, 234–244. [Google Scholar] [CrossRef]
  9. Novak, L.; Burl, M. Optimal speckle reduction in polarimetric SAR imagery. IEEE Trans. Aerosp. Electron. Syst. 1990, 26, 293–305. [Google Scholar] [CrossRef]
  10. Boerner, W.M.; Kostinski, A.; James, B. On The Concept of The Polarimetric Matched Filter in High Resolution Radar Imaging: An Alternative for Speckle Reduction. In Proceedings of the International Geoscience and Remote Sensing Symposium, ‘Remote Sensing: Moving Toward the 21st Century’, Edinburgh, UK, 12–16 September 1988; Volume 1, pp. 69–72. [Google Scholar] [CrossRef]
  11. Velotto, D.; Nunziata, F.; Migliaccio, M.; Lehner, S. Dual-Polarimetric TerraSAR-X SAR Data for Target at Sea Observation. IEEE Geosci. Remote Sens. Lett. 2013, 10, 1114–1118. [Google Scholar] [CrossRef]
  12. Marino, A. A Notch Filter for Ship Detection With Polarimetric SAR Data. IEEE J. Sel. Top. Appl. Earth Obs. Remote Sens. 2013, 6, 1219–1232. [Google Scholar] [CrossRef] [Green Version]
  13. Van Der Spek, G. Detection of a Distributed Target. IEEE Trans. Aerosp. Electron. Syst. 1971, AES-7, 922–931. [Google Scholar] [CrossRef]
  14. Kelly, E. An Adaptive Detection Algorithm. IEEE Trans. Aerosp. Electron. Syst. 1986, AES-22, 115–127. [Google Scholar] [CrossRef] [Green Version]
  15. Gerlach, K.; Steiner, M.; Lin, F. Detection of a spatially distributed target in white noise. IEEE Signal Process. Lett. 1997, 4, 198–200. [Google Scholar] [CrossRef] [Green Version]
  16. Chen, X.; Gai, J.; Liang, Z.; Liu, Q.; Long, T. Adaptive Double Threshold Detection Method for Range-Spread Targets. IEEE Signal Process. Lett. 2022, 29, 254–258. [Google Scholar] [CrossRef]
  17. Ren, Z.; Yi, W.; Zhao, W.; Kong, L. Range-Spread Target Detection Based on Adaptive Scattering Centers Estimation. IEEE Trans. Geosci. Remote Sens. 2023, 61, 1–14. [Google Scholar] [CrossRef]
  18. Long, T.; Zheng, L.; Li, Y.; Yang, X. Improved Double Threshold Detector for Spatially Distributed Target. IEICE Trans. Commun. 2012, E95.B, 1475–1478. [Google Scholar] [CrossRef]
  19. Gerlach, K.; Steiner, M. Adaptive detection of range distributed targets. IEEE Trans. Signal Process. 1999, 47, 1844–1851. [Google Scholar] [CrossRef]
  20. Du, L.; Liu, X.; Li, B.; Xu, S. HRRP Clutter Rejection Via One-Class Classifier With Hausdorff Distance. IEEE Trans. Aerosp. Electron. Syst. 2020, 56, 2517–2526. [Google Scholar] [CrossRef]
  21. Diao, P.S.; Alves, T.; Poussot, B.; Azarian, S. A review of Radar Detection Fundamentals. IEEE Aerosp. Electron. Syst. Mag. 2022; Early access. [Google Scholar] [CrossRef]
  22. Li, X.; Sun, Z.; Yeo, T.S.; Zhang, T.; Yi, W.; Cui, G.; Kong, L. STGRFT for Detection of Maneuvering Weak Target With Multiple Motion Models. IEEE Trans. Signal Process. 2019, 67, 1902–1917. [Google Scholar] [CrossRef]
  23. Yuan, Y.; Zhu, H.; Wang, Q.; Yuan, W.; Yuan, N. Correlation feature-based detector for range distributed target in sea clutter. EURASIP J. Adv. Signal Process. 2018, 2018, 25. [Google Scholar] [CrossRef] [Green Version]
  24. Li, X.; Cui, G.; Kong, L.; Yi, W. Fast Non-Searching Method for Maneuvering Target Detection and Motion Parameters Estimation. IEEE Trans. Signal Process. 2016, 64, 2232–2244. [Google Scholar] [CrossRef]
  25. Li, H.; Cui, X.; Chen, S. PolSAR Ship Detection with Optimal Polarimetric Rotation Domain Features and SVM. Remote Sens. 2021, 13, 3932. [Google Scholar] [CrossRef]
  26. Yamaguchi, Y.; Moriyama, T.; Ishido, M.; Yamada, H. Four-component scattering model for polarimetric SAR image decomposition. IEEE Trans. Geosci. Remote Sens. 2005, 43, 1699–1706. [Google Scholar] [CrossRef]
  27. Touzi, R.; Charbonneau, F.; Hawkins, R.; Murnaghan, K.; Kavoun, X. Ship-sea contrast optimization when using polarimetric SARs. In Proceedings of the IGARSS 2001. Scanning the Present and Resolving the Future. Proceedings. IEEE 2001 International Geoscience and Remote Sensing Symposium (Cat. No.01CH37217), Sydney, NSW, Australia, 9–13 July 2001; Volume 1, pp. 426–428. [Google Scholar] [CrossRef]
  28. Shi, X.; Yang, C.; Wang, X.; Dong, S. Dual-Polarimetric Persymmetric Adaptive Subspace Detector for Range-Spread Targets in Heavy-Tailed Non-Gaussian Clutter. IEEE Geosci. Remote Sens. Lett. 2023, 20, 1–5. [Google Scholar] [CrossRef]
  29. Xu, S.; Ma, Y.; Bai, X. Small Target Detection Method in Sea Clutter Based on Interframe Multi-feature Iteration. In Proceedings of the 2021 IEEE 6th International Conference on Signal and Image Processing (ICSIP), Nanjing, China, 22–24 October 2021; pp. 82–87. [Google Scholar] [CrossRef]
  30. Sugimoto, M.; Ouchi, K.; Nakamura, Y. On the novel use of model-based decomposition in SAR polarimetry for target detection on the sea. Remote Sens. Lett. 2013, 4, 843–852. [Google Scholar] [CrossRef]
  31. Chen, S.W.; Wang, X.S.; Xiao, S.P.; Sato, M. Target Scattering Mechanism in Polarimetric Synthetic Aperture Radar; Springer: Singapore, 2018. [Google Scholar] [CrossRef]
  32. Yang, X.; Wen, G.; Ma, C.; Hui, B.; Ding, B.; Zhang, Y. CFAR Detection of Moving Range-Spread Target in White Gaussian Noise Using Waveform Contrast. IEEE Geosci. Remote Sens. Lett. 2016, 13, 282–286. [Google Scholar] [CrossRef]
  33. Shui, P.-L.; Liu, H.-W.; Bao, Z. Range-Spread Target Detection Based on Cross Time-Frequency Distribution Features of Two Adjacent Received Signals. IEEE Trans. Signal Process. 2009, 57, 3733–3745. [Google Scholar] [CrossRef]
  34. Shi, Y.; Xie, X.; Li, D. Range Distributed Floating Target Detection in Sea Clutter via Feature-Based Detector. IEEE Geosci. Remote Sens. Lett. 2016, 13, 1847–1850. [Google Scholar] [CrossRef]
  35. Xu, S.; Shi, X.; Xue, J.; Shui, P. Maneuvering range-spread target detection in white Gaussian noise using multiple-pulse combined waveform contrast. In Proceedings of the 2017 IEEE International Conference on Signal Processing, Communications and Computing (ICSPCC), Xiamen, China, 22–25 October 2017; pp. 1–5. [Google Scholar] [CrossRef]
  36. Xu, X.K. Low Observable Targets Detection by Joint Fractal Properties of Sea Clutter: An Experimental Study of IPIX OHGR Datasets. IEEE Trans. Antennas Propag. 2010, 58, 1425–1429. [Google Scholar] [CrossRef]
  37. Xu, S.; Zhu, J.; Shui, P.; Xia, X. Floating Small Target Detection in Sea Clutter by One-Class SVM based on Three Detection Features. In Proceedings of the 2019 International Applied Computational Electromagnetics Society Symposium—China (ACES), Nanjing, China, 8–11 August 2019; pp. 1–2. [Google Scholar] [CrossRef]
  38. Gaglione, D.; Clemente, C.; Pallotta, L.; Proudler, I.; De Maio, A.; Soraghan, J.J. Krogager decomposition and Pseudo-Zernike moments for polarimetric distributed ATR. In Proceedings of the 2014 Sensor Signal Processing for Defence (SSPD), Edinburgh, UK, 8–9 September 2014; pp. 1–5. [Google Scholar] [CrossRef]
  39. Rogers, G.W.; Rais, H.; Cameron, W.L. Polarimetric SAR Signature Detection Using the Cameron Decomposition. IEEE Trans. Geosci. Remote Sens. 2014, 52, 690–700. [Google Scholar] [CrossRef]
  40. Erith, M.; Alfonso, Z.; Erik, L. A Multi-Sensor Approach to Separate Palm Oil Plantations from Forest Cover Using NDFI and a Modified Pauli Decomposition Technique. In Proceedings of the IGARSS 2020—2020 IEEE International Geoscience and Remote Sensing Symposium, Waikoloa, HI, USA, 26 September–2 October 2020; pp. 4481–4484. [Google Scholar] [CrossRef]
  41. Freeman, A.; Durden, S. A three-component scattering model for polarimetric SAR data. IEEE Trans. Geosci. Remote Sens. 1998, 36, 963–973. [Google Scholar] [CrossRef] [Green Version]
  42. Cloude, S.; Pottier, E. A review of target decomposition theorems in radar polarimetry. IEEE Trans. Geosci. Remote Sens. 1996, 34, 498–518. [Google Scholar] [CrossRef]
  43. Carretero-Moya, J.; De Maio, A.; Gismero-Menoyo, J.; Asensio-Lopez, A. Experimental Performance Analysis of Distributed Target Coherent Radar Detectors. IEEE Trans. Aerosp. Electron. Syst. 2012, 48, 2216–2238. [Google Scholar] [CrossRef]
  44. Liang, Z.; Gai, J.; Chen, X.; Ma, T.; Liu, Q. A Method for Threshold Setting and False Alarm Probability Evaluation for Radar Detectors. Signal Process. 2023, 207, 108930. [Google Scholar] [CrossRef]
  45. Yan, J.; Liu, H.; Pu, W.; Bao, Z. Exact Fisher Information Matrix With State-Dependent Probability of Detection. IEEE Trans. Aerosp. Electron. Syst. 2017, 53, 1555–1561. [Google Scholar] [CrossRef]
  46. Shi, C.; Wang, F.; Sellathurai, M.; Zhou, J.; Salous, S. Low Probability of Intercept-Based Optimal Power Allocation Scheme for an Integrated Multistatic Radar and Communication System. IEEE Syst. J. 2020, 14, 983–994. [Google Scholar] [CrossRef] [Green Version]
  47. Zhao, Y.; Qin, J.; Yin, B. Adaptive targets detection in polarimetric high resolution radar. In Proceedings of the 2011 IEEE CIE International Conference on Radar, Chengdu, China, 24–27 October 2011; pp. 1374–1377. [Google Scholar] [CrossRef]
  48. Xu, K.; Ba, J.; Kiros, R.; Cho, K.; Courville, A.C.; Salakhutdinov, R.; Zemel, R.S.; Bengio, Y. Show, Attend and Tell: Neural Image Caption Generation with Visual Attention. arXiv 2015. [Google Scholar] [CrossRef]
  49. Vaswani, A.; Shazeer, N.; Parmar, N.; Uszkoreit, J.; Jones, L.; Gomez, A.N.; Kaiser, L.; Polosukhin, I. Attention Is All You Need. arXiv 2017. [Google Scholar] [CrossRef]
  50. Mnih, V.; Heess, N.M.O.; Graves, A.; Kavukcuoglu, K. Recurrent Models of Visual Attention. arXiv 2014. [Google Scholar] [CrossRef]
  51. Tang, L.; Tang, W.; Qu, X.; Han, Y.; Wang, W.; Zhao, B. A Scale-Aware Pyramid Network for Multi-Scale Object Detection in SAR Images. Remote Sens. 2022, 14, 973. [Google Scholar] [CrossRef]
  52. Piao, Z.; Wang, J.; Tang, L.; Zhao, B.; Wang, W. AccLoc: Anchor-Free and two-stage detector for accurate object localization. Pattern Recognit. 2022, 126, 108523. [Google Scholar] [CrossRef]
  53. Bu, Y.; Wang, X.; Zhang, B.; Guo, S.; Cui, G. Multidomain Fusion Method for Human Head Movement Recognition. IEEE Trans. Instrum. Meas. 2023, 72, 1–8. [Google Scholar] [CrossRef]
  54. Dubey, A.; Santra, A.; Fuchs, J.; Lübke, M.; Weigel, R.; Lurz, F. HARadNet: Anchor-free target detection for radar point clouds using hierarchical attention and multi-task learning. Mach. Learn. Appl. 2022, 8, 100275. [Google Scholar] [CrossRef]
  55. Li, H.; Cui, G.; Guo, S.; Kong, L.; Yang, X. Human Target Detection Based on FCN for Through-the-Wall Radar Imaging. IEEE Geosci. Remote Sens. Lett. 2021, 18, 1565–1569. [Google Scholar] [CrossRef]
  56. Chaudhari, S.; Mithal, V.; Polatkan, G.; Ramanath, R. An Attentive Survey of Attention Models. ACM Trans. Intell. Syst. Technol. 2021, 12, 1–32. [Google Scholar] [CrossRef]
  57. Li, Y.; Xie, P.; Tang, Z.; Jiang, T.; Qi, P. SVM-Based Sea-Surface Small Target Detection: A False-Alarm-Rate-Controllable Approach. IEEE Geosci. Remote Sens. Lett. 2019, 16, 1225–1229. [Google Scholar] [CrossRef] [Green Version]
  58. Wang, W.; Song, W.; Li, Z.; Zhao, B.; Zhao, B. A Novel Filter-Based Anomaly Detection Framework for Hyperspectral Imagery. IEEE Access 2021, 9, 124033–124043. [Google Scholar] [CrossRef]
  59. Wang, J.; Li, G.; Zhao, Z.; Jiao, J.; Ding, S.; Wang, K.; Duan, M. Space Target Anomaly Detection Based on Gaussian Mixture Model and Micro-Doppler Features. IEEE Trans. Geosci. Remote Sens. 2022, 60, 1–11. [Google Scholar] [CrossRef]
  60. Chen, S.; Luo, F.; Luo, X. Multiview Feature-Based Sea Surface Small Target Detection in Short Observation Time. IEEE Geosci. Remote Sens. Lett. 2021, 18, 1189–1193. [Google Scholar] [CrossRef]
  61. Qin, J.; Qu, H.; Chen, H.; Chen, W. Joint Detection of Airplane Targets Based on Sar Images and Optical Images. In Proceedings of the IGARSS 2019 - 2019 IEEE International Geoscience and Remote Sensing Symposium, Yokohama, Japan, 28 July–2 August 2019; pp. 1366–1369. [Google Scholar] [CrossRef]
  62. Will, C.; Vaishnav, P.; Chakraborty, A.; Santra, A. Human Target Detection, Tracking, and Classification Using 24-GHz FMCW Radar. IEEE Sensors J. 2019, 19, 7283–7299. [Google Scholar] [CrossRef]
  63. Mishra, A.K.; Mulgrew, B. Multipolar SAR ATR: Experiments with the GTRI dataset. In Proceedings of the 2008 IEEE Radar Conference, Rome, Italy, 26–30 May 2008; pp. 1–5. [Google Scholar] [CrossRef]
  64. Wu, K.; Xu, X. A Fast ISAR Tomography Technique for Fully Polarimetric 3-D Imaging of Man-Made Targets. IEEE Trans. Geosci. Remote Sens. 2022, 60, 1–12. [Google Scholar] [CrossRef]
  65. Hughes, P. A High-Resolution Radar Detection Strategy. IEEE Trans. Aerosp. Electron. Syst. 1983, AES-19, 663–667. [Google Scholar] [CrossRef]
  66. Huang, Z.; Pan, Z.; Lei, B. What, Where, and How to Transfer in SAR Target Recognition Based on Deep CNNs. IEEE Trans. Geosci. Remote Sens. 2020, 58, 2324–2336. [Google Scholar] [CrossRef] [Green Version]
  67. Gretton, A.; Borgwardt, K.M.; Rasch, M.J.; Schölkopf, B.; Smola, A. A kernel two-sample test. J. Mach. Learn. Res. 2012, 13, 723–773. [Google Scholar]
  68. Mao, D.; Zhang, Y.; Zhang, Y.; Pei, J.; Huang, Y.; Yang, J. An Efficient Anti-Interference Imaging Technology for Marine Radar. IEEE Trans. Geosci. Remote Sens. 2022, 60, 1–13. [Google Scholar] [CrossRef]
  69. Carretero-Moya, J.; Gismero-Menoyo, J.; Blanco-del Campo, A.; Asensio-Lopez, A. Statistical Analysis of a High-Resolution Sea-Clutter Database. IEEE Trans. Geosci. Remote Sens. 2010, 48, 2024–2037. [Google Scholar] [CrossRef]
  70. Zhang, Y.; Luo, J.; Li, J.; Mao, D.; Zhang, Y.; Huang, Y.; Yang, J. Fast Inverse-Scattering Reconstruction for Airborne High-Squint Radar Imagery Based on Doppler Centroid Compensation. IEEE Trans. Geosci. Remote Sens. 2022, 60, 1–17. [Google Scholar] [CrossRef]
Figure 1. The structure of the AMN.
Remotesensing 15 02929 g001
Figure 2. Overall structure of our proposed detection method. The symbol ⊗ represents accumulating features of range cells. (a) Range cells feature extraction module: extracting multiple polarimetric features for each range cell. (b) Adaptive range cells weights calculation module: adaptively calculating range cells weights, which are used for adaptive range weighted feature extraction. (c) Supervision weights generation module: generating supervision weights of known data, which are used for pretraining the adaptive range cells weights calculation module. (d) Classification module: using a classifier in the feature domain to determine whether a target exists.
Remotesensing 15 02929 g002
Figure 3. Structure of the adaptive range cells weights calculation module, and the process of adaptive range weighted feature extraction. The symbol ⊗ represents matrix product.
Remotesensing 15 02929 g003
Figure 4. Framework of the supervision weights generation module. In W, 1 means marked as high contribution and 0 means marked as low contribution.
Remotesensing 15 02929 g004
Figure 5. Generated HRRP data with different SCRs. (a) SCR = −5dB; (b) SCR = 0dB; (c) SCR = 5dB; (d) SCR = 10dB.
Remotesensing 15 02929 g005aRemotesensing 15 02929 g005b
Figure 6. Detection probability curves compared with other detection methods.
Remotesensing 15 02929 g006
Figure 7. Detection probability curves of three feature accumulation methods.
Remotesensing 15 02929 g007
Figure 8. HRRPs of clutter and targets with different SCRs and heat diagrams of adaptive weights. (a) Clutter; (b) SCR = −5dB; (c) SCR = 0dB; (d) SCR = 5dB; (e) colorbar. In the heat diagrams, the values of weights of the range cells are normalized, and the color display settings are the same for all heat diagrams. The colder colors correspond to lower weights and warmer colors indicate higher weights.
Remotesensing 15 02929 g008
Figure 9. MMD curves of three feature accumulation methods.
Remotesensing 15 02929 g009
Figure 10. Detection probability curves of three methods using different dimensional information.
Remotesensing 15 02929 g010
Figure 11. Targets with different energy distributions. (a) Target with concentrated energy distribution; (b) target with dispersed energy distribution.
Remotesensing 15 02929 g011
Figure 12. Detection performance of targets with different energy distributions. (a) Target with concentrated energy distribution; (b) target with dispersed energy distribution.
Remotesensing 15 02929 g012
Figure 13. Detection probability curves of different range resolutions.
Remotesensing 15 02929 g013
Figure 14. Detection probability curves. (a) Under clutter B; (b) training and testing clutter distributions are different.
Remotesensing 15 02929 g014
Table 1. Data statement.
Training DataTesting Data
D tr amn D tr cls D te
Data compositionTarget samples with different SCRsClutter samplesTarget samples with different SCRs
Role in the methodTraining AMNTraining OCSVMTesting the performance
Target elevation angles27.99°-29.99°
Target azimuth angles0–360° (interval 4.25°)-0–360° (interval 4.25°)
SCRs−9–10 dB (interval 1 dB)-−9–10 dB (interval 1 dB)
Monte Carlo times for each SCR100-100
Total170,000 a168,000170,000 a
a 170,000 = 85 × 20 × 100, i.e., number of target azimuth angles × number of SCRs × Monte Carlo times for each SCR.
Table 2. Experimental settings when the testing clutter distribution is different from the training data.
CaseTraining Clutter DistributionTesting Clutter Distribution
B_tr_B_teBB
A_tr_B_teAB
AB_tr_B_teA and BB
Disclaimer/Publisher’s Note: The statements, opinions and data contained in all publications are solely those of the individual author(s) and contributor(s) and not of MDPI and/or the editor(s). MDPI and/or the editor(s) disclaim responsibility for any injury to people or property resulting from any ideas, methods, instructions or products referred to in the content.

