Article

Integration of DInSAR-PS-Stacking and SBAS-PS-InSAR Methods to Monitor Mining-Related Surface Subsidence

1
College of Information Engineering, Inner Mongolia University of Technology, Hohhot 010051, China
2
Inner Mongolia Key Laboratory of Radar Technology and Application, Hohhot 010051, China
3
Inner Mongolia Mypattern Technology Co., Ltd., Hohhot 010000, China
4
China Coal Pingshuo Group Co., Ltd., Shuozhou 036006, China
*
Author to whom correspondence should be addressed.
Remote Sens. 2023, 15(10), 2691; https://doi.org/10.3390/rs15102691
Submission received: 20 April 2023 / Revised: 19 May 2023 / Accepted: 19 May 2023 / Published: 22 May 2023
(This article belongs to the Special Issue Mapping and Monitoring of Geohazards with Remote Sensing Technologies)

Abstract

:
Over-exploitation of coal mines leads to surface subsidence, surface cracks, collapses, landslides, and other geological disasters. Taking a mining area in Nalintaohai Town, Ejin Horo Banner, Ordos City, Inner Mongolia Autonomous Region, as an example, Sentinel-1A data from January 2018 to October 2019 were used as the data source in this study. Based on the high interference coherence of the permanent scatterer (PS) over a long period of time, the problem of the manual selection of ground control points (GCPs) affecting the monitoring results during refinement and re-flattening is solved. A DInSAR-PS-Stacking method combining the PS three-threshold method (the coherence coefficient threshold, amplitude dispersion index threshold, and deformation velocity interval) is proposed as a means to select ground control points for refinement and re-flattening, as well as a means to obtain time-series deformation by weighted stacking processing. A SBAS-PS-InSAR method combining the PS three-threshold method to select PS points as GCPs for refinement and re-flattening is also proposed. The surface deformation results monitored by the DInSAR-PS-Stacking and SBAS-PS-InSAR methods are analyzed and verified. The results show that the subsidence location, range, distribution, and space–time subsidence law of surface deformation results obtained by DInSAR-PS-Stacking, SBAS-PS-InSAR, and GPS methods are basically the same. The deformation results obtained by these two InSAR methods have a good correlation with the GPS monitoring results, and the MAE and RMSE are within the acceptable range. The error showed that the edge of the subsidence basin was small and that the center was large. Both methods were found to be able to effectively monitor the coal mine, but there were also shortcomings. DInSAR-PS-Stacking has a strong ability to monitor the settlement center. SBAS-PS-InSAR performed well in monitoring slow and small deformations, but its monitoring of the settlement center was insufficient. Considering the advantages of these two InSAR methods, we proposed fusing the time-series deformation results obtained using these two InSAR methods to allow for more reliable deformation results and to carry out settlement analysis. The results showed that the automatic two-threshold (deformation threshold and average coherence threshold) fusion was effective for monitoring and analysis, and the deformation monitoring results are in good agreement with the actual situation. The deformation information obtained by the comparison, and fusion of multiple methods can allow for better monitoring and analysis of the mining area surface deformation, and can also provide a scientific reference for mining subsidence control and early disaster warning.

1. Introduction

Coal mine resources play an important role in China’s energy resources. The large-scale exploitation of coal mine resources has promoted the development of China’s economy, but it has also caused some ecological environment and surface subsidence problems [1,2,3,4]. Land subsidence caused by coal mining is a destructive disaster that often occurs in mining areas and is one of the most severe geological disasters in China [1,5]. Large-scale underground coal mining can cause the formation of underground cavities, which can lead to the loss of support for rocks and soils, resulting in ground subsidence and sinking. During the subsidence process, substances such as groundwater, sediment, and coal seams are squeezed and displaced, causing the appearance of depressions and funnel-shaped pits on the surface, known as ground subsidence funnels [6]. Coal mining can also cause changes in geological stress, resulting in the formation of cracks and faults in rock layers, which may trigger ground fissures. These cracks may expand and lead to geological disasters such as ground collapse [7,8]. The large-scale mining of underground coal mines can lead to the occurrence of surface subsidence funnels, ground cracks, and collapses in mining areas, which cause certain safety hazards and affect the local ecological environment and the safety of the surrounding residents. Identifying the causes and risks of surface subsidence by means of monitoring and analyzing the surface deformation of mining areas is of great significance for protecting residents and the safety of their properties, as well as mining subsidence disaster warnings, control, and management [9,10].
Interferometric synthetic aperture radar technology (InSAR) is a new all-weather, all-time Earth observation method [11,12,13,14,15,16]. With the rapid development of differential interferometric synthetic aperture radar (DInSAR) technology, radar line-of-sight deformation can be obtained up to the millimeter level [17,18]. DInSAR technology has been used to monitor mining subsidence and related research [19]. Berardino et al. proposed small baseline subset InSAR (SBAS) technology, which uses small baseline combinations for measurement, and uses the singular value decomposition (SVD) method to calculate multiple small baseline combinations to effectively obtain deformation information on time series [20,21,22,23]. Stacking-InSAR technology is one of the relatively simple time-series InSAR technologies. Specifically, it refers to the linear superposition and weighted average of multiple unwrapped differential interferometry pairs during the study period, which obtains more accurate deformation information [24,25,26,27,28]. Ferretti et al. proposed persistent scatterer InSAR (PS-InSAR) technology. In the long time series of SAR images, the points with high coherence and stability are selected as PS point targets, and then the phase characteristics of these target points are analyzed, and the corresponding atmospheric phases are separated to obtain relatively accurate surface subsidence information [29,30,31,32]. Guo Shanchuan et al. used DInSAR technology to effectively monitor and verify the mining area of the Loess Plateau with complex and dangerous terrain [33]. Xia Yuanping et al. combined DInSAR and GIS technology to identify illegal underground mining in the Shanxi Yangquan mining area and provided technical support for monitoring underground mining [34]. Li Da et al. used SBAS-InSAR technology to monitor and analyze the time-series deformation of the Yulin mining area [35]. Ma Fei et al. introduced SBAS-InSAR technology to the Ningdong mining area for monitoring, and compared the subsidence value of ground monitoring points in the Shigouyi coal mine with GPS monitoring values, revealing the effectiveness of SBAS-InSAR technology for mining area subsidence monitoring [36].
The InSAR method has achieved remarkable results in monitoring mining deformation, and different methods show their own advantages. Researchers in China and abroad have carried out relevant research on comparisons between and combinations of various InSAR methods for mining area deformation monitoring and analysis [28,37,38,39]. For example, Wei Jicheng et al. [40] combined DInSAR and PS-InSAR technology to effectively monitor mining subsidence in the Ordos area in the north of the Shendong mining area, revealing the space–time evolution process of surface deformation in this area. Depin Ou et al. [41] combined DInSAR and pixel offset tracking methods to monitor coal mine deformation. The selection of ground control points (GCP) used for refinement and re-flattening in InSAR processing is crucial for deformation inversion. Some scholars have used the PS points obtained by PS-InSAR as ground control points in the SBAS-InSAR method to monitor surface deformation [42,43] and compared this with the traditional time-series InSAR method to verify its feasibility and improve the deformation accuracy. As mentioned above, combining the advantages of various InSAR methods can allow for more effective monitoring of the deformation of mining areas.
The limitations of some InSAR technologies should be considered, for example, SBAS-InSAR is insufficient in monitoring the subsidence center of large subsidence and areas with poor coherence, but it is better for monitoring small deformations. In this study, a mining area in Nalintaohai Town, Ejin Horo Banner, Ordos City, Inner Mongolia Autonomous Region, was selected as the study area, and Sentinel-1A data were used as the data source. The improved DInSAR-PS-Stacking and SBAS-PS-InSAR methods are proposed as a means to improve the inversion accuracy by combining the PS three-threshold method (coherence coefficient threshold, amplitude deviation index threshold, and deformation velocity interval) to select ground control points. The time-series deformation results obtained from the DInSAR-PS-Stacking and SBAS-PS-InSAR methods were compared, verified, and analyzed. The ground displacement time series were fused using the OTSU (Otsu 2007, named after the author) [44] automatic extraction method with two thresholds (the deformation and the average coherence threshold). The deformation analysis and subsidence rule of the mining area were studied in relation to the time-series deformation results after fusion. The fusion of multiple InSAR methods can allow us to overcome the shortcomings of individual deformation monitoring methods and obtain more complete and accurate deformation results. This study provides a scientific basis and technical support for mining subsidence prevention and sustainable development.

2. Materials and Methods
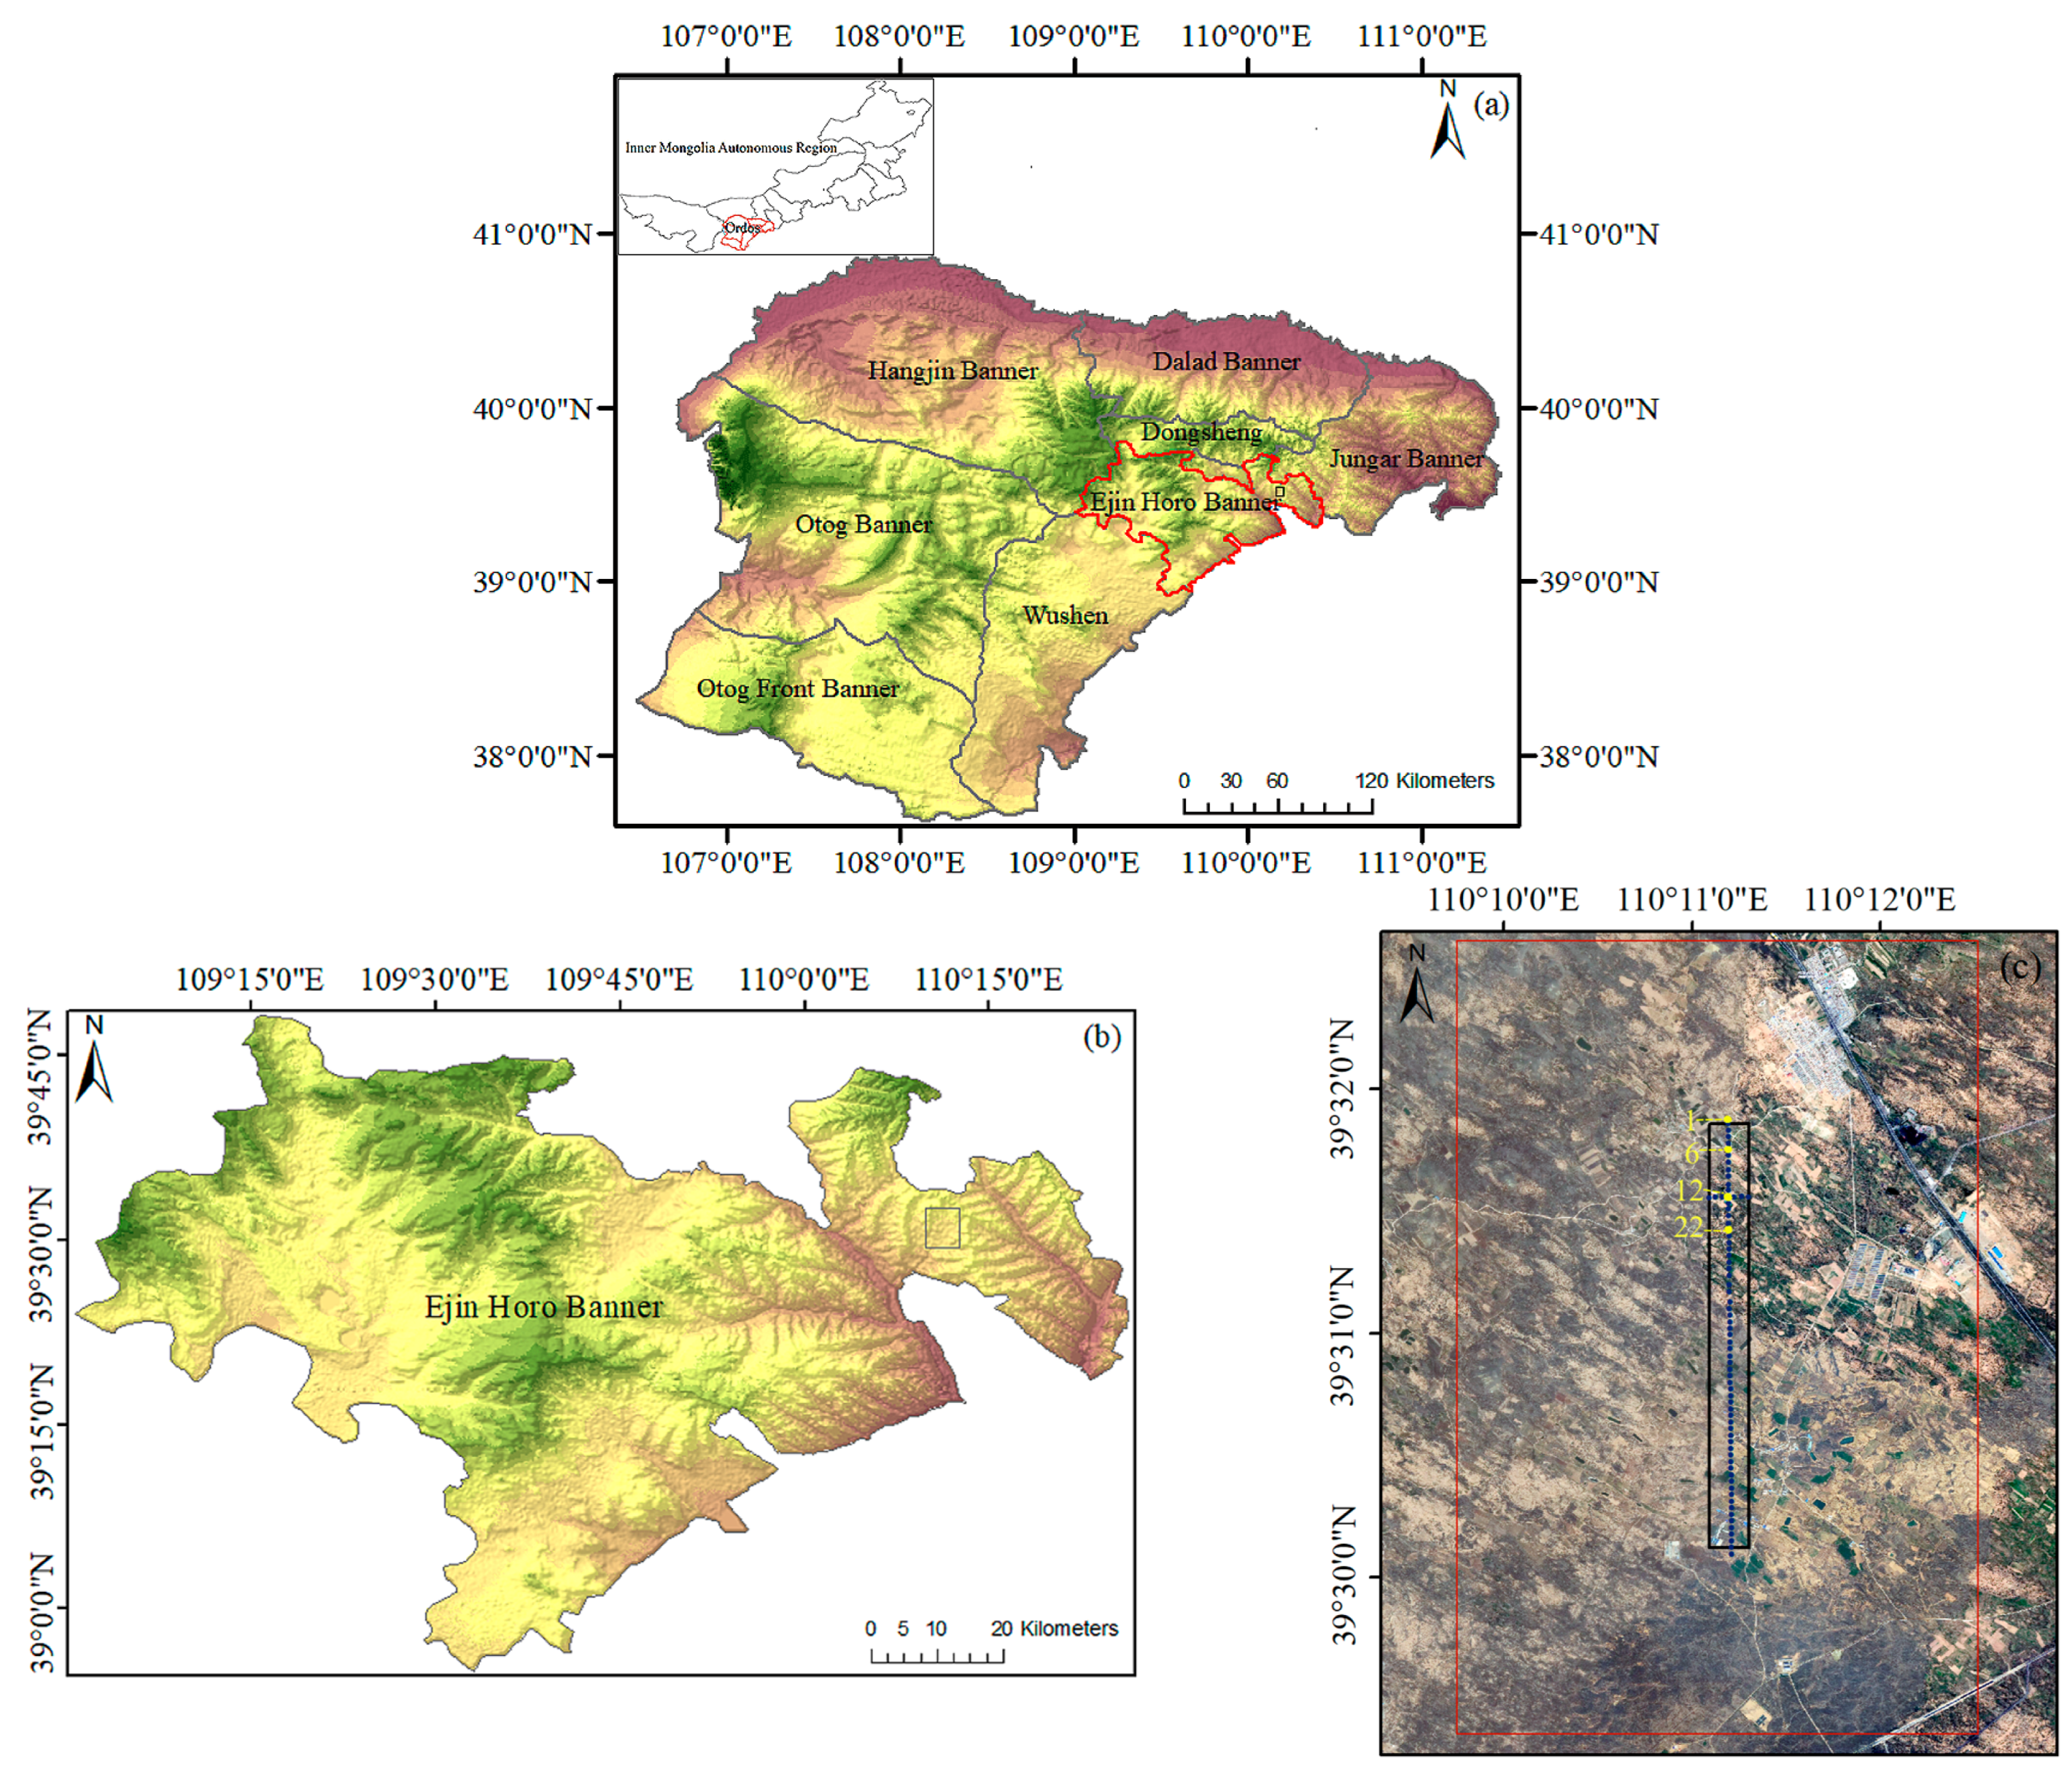
2.1. Study Area

The object of this study is a coal mine in Nalintaohai Town, Ejin Horo Banner, Ordos, Inner Mongolia Autonomous Region. Located at the north end of the Loess Plateau, the landform has been severely cut after long-term rain erosion, forming a standard beam and hilly platform, and its surface vegetation mostly consists of semi-barren areas. The coal mine is in the local village, the terrain is high in the north and low in the south, where it is relatively flat. The coal mine is close to the traffic line, and the traffic is relatively convenient. The location belongs to the temperate continental monsoon climate, and the temperature changes significantly in the four seasons of the year, with a large temperature difference. The annual average precipitation is low, and the precipitation is mostly concentrated between July and August, and the climate is dry. Its geographical location and scope are shown in Figure 1.
The geological structure of the working face is simple: the elevation of the coal seam floor is 1060~1075 m, the ground elevation is 1193.8~1260 m, the thickness of the overlying bedrock of the 4-2 coal seam is 120~140 m, and the thickness of the loose layer is 20~45 m. The mining period was from 1 January 2018 to 30 September 2019.

2.2. Data

The experimental data involved in this study are as follows: (1) Sentinel-1A provided C-band synthetic aperture radar data [45], and the satellite revisit period was 12 days/time. The data obtained in this study were 52 scenes of Sentinel-1 A satellite image data from 6 January November 2018 to 4 October 2019. Based on these data, the target area was analyzed, and these data types were SLC. The data was downloaded from the ASF Data Search (URL: https://search.asf.alaska.edu/, accessed on 8 February 2023). (2) SRTM DEM, which are released by NASA of the United States, with a ground resolution of 30 m [46]. POD precise orbit ephemerides were provided by ESA. The main parameters are shown in Table 1 and Table 2.

2.3. Methods

The deformation monitoring and analysis of the mining areas based on InSAR proposed in this study are divided into seven main steps:
(1)
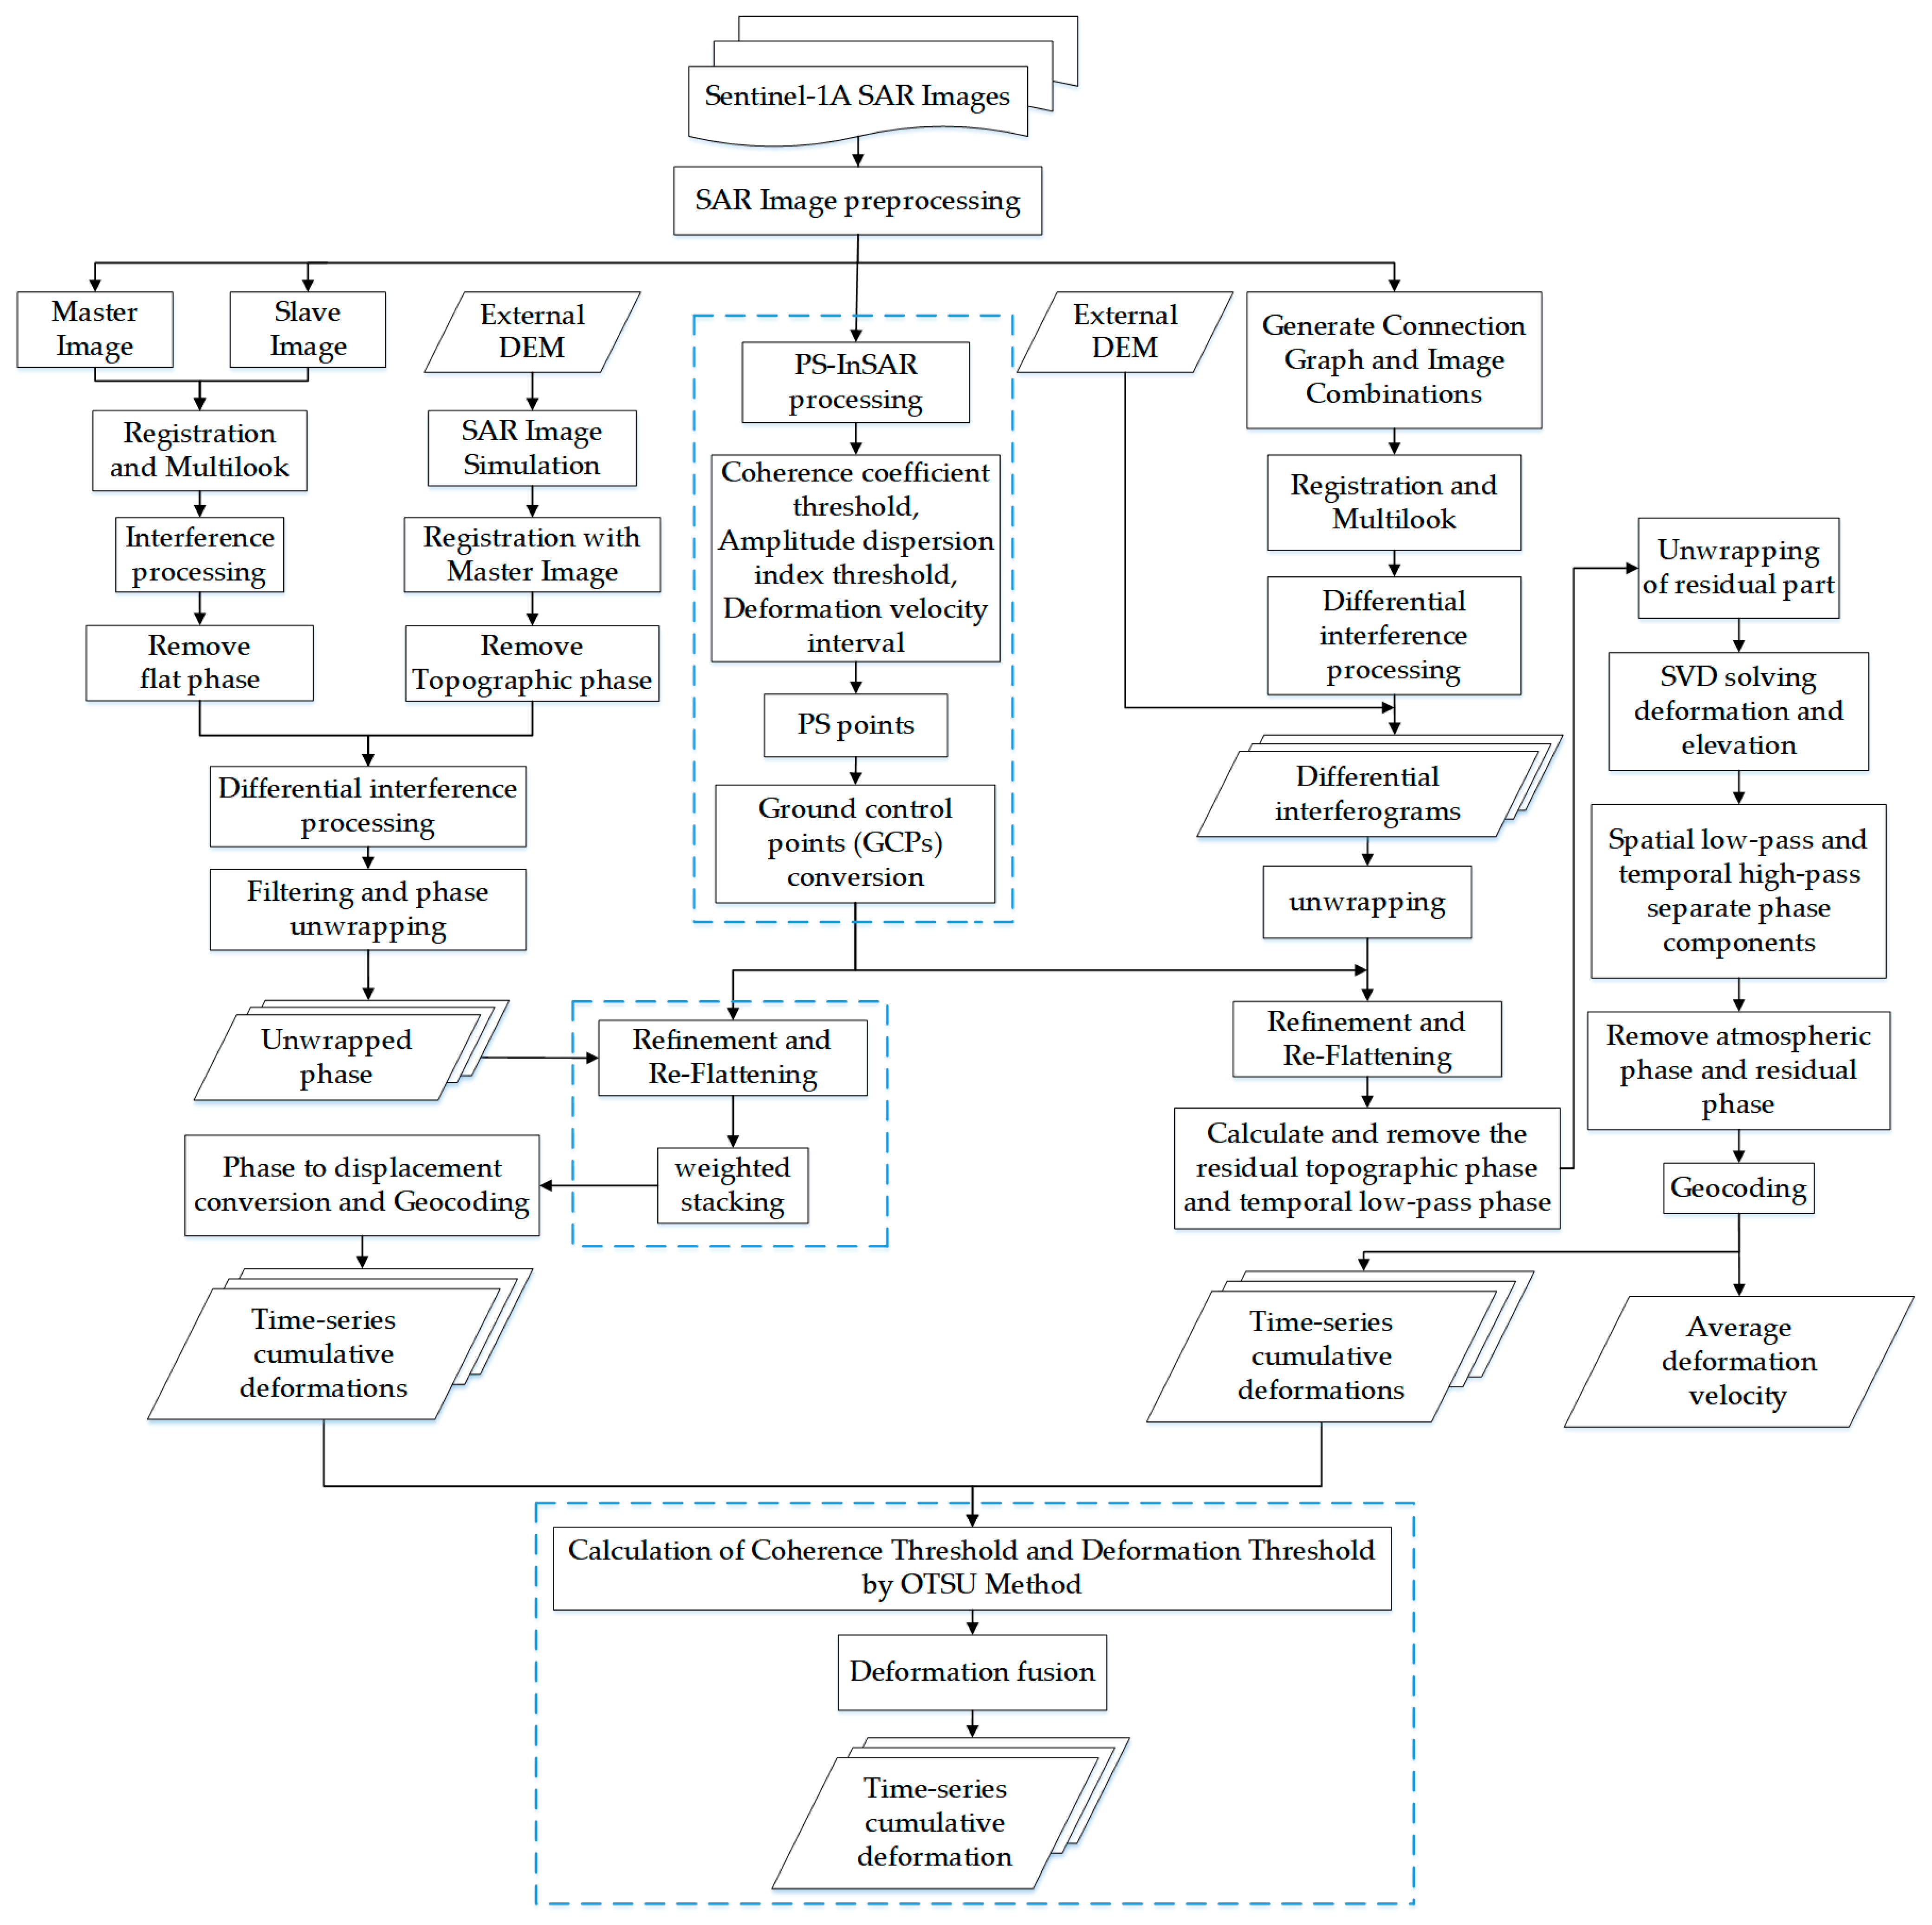
Data preprocessing. Select the required 52 Sentinel-1A image data, DEM data, and orbit data. Data clipping and baseline estimations are performed according to the scope of the study area.
(2)
Ground control points (GCPs) screening. The obtained 52 Sentinel-1A SAR image data are processed using the PS-InSAR three-threshold method (the coherence coefficient threshold, amplitude dispersion index threshold, and deformation velocity interval) to obtain stable and qualified PS points as ground control points.
(3)
DInSAR-PS-Stacking processing. The GCPs selected using the PS-InSAR three-threshold method are used for the refinement and re-flattening step of DInSAR-PS-Stacking processing, and then the cumulative time-series deformation phase information is obtained by weighted stacking; finally, the time-series cumulative deformation results are obtained.
(4)
SBAS-PS-InSAR processing. The GCPs selected using the PS-InSAR three-threshold method are used for the orbit refinement and re-leveling steps of SBAS-InSAR processing, and then the time-series deformation information is obtained by deformation inversion.
(5)
Comparative verification and analysis. The deformation information monitored by the DInSAR-PS-Stacking and SBAS-PS-InSAR methods are compared and analyzed according to comparative validation and the deformation results.
(6)
DInSAR-PS-Stacking and SBAS-PS-InSAR fusion. The time-series deformation information of these two methods is fused using the two-threshold method (OTSU method sets the average coherence threshold and deformation threshold), and the time-series deformation information after fusion is obtained for complementary advantages.
(7)
Deformation analysis after fusion. The settlement analysis of the fused deformation results obtained by the DInSAR-PS-Stacking and SBAS-PS-InSAR methods provides a scientific reference for coal mining subsidence control and disaster warning.
The technical flow of the data processing is shown in Figure 2.

2.3.1. Ground Control Point Screening

The ground control points (GCPs) were used for refinement and re-flattening to estimate and remove the residual constant phase and residual phase ramp after unwrapping to improve the accuracy of deformation monitoring. The GCPs should be located in a flat terrain, with no phase jump, and far away from the deformation zone. Manual selection of the GCPs causes large errors. Therefore, we propose a method based on permanent scatterers (PS) to determine the GCPs. Firstly, the PS point targets with high coherence coefficients were identified using the coherence coefficient threshold method. Then, the amplitude deviation index threshold was set to further screen the PS points with strong, stable scattering as the target. Finally, a deformation velocity interval was set to select the final PS points [47].
(1)
Coherence coefficient method
The coherence coefficient is an important index used to measure the interference quality of interference image pairs. It is mainly used to describe the similarity between the master and slave images in the same area [48]. The expression of the coherence coefficient is:
γ = i = 1 m j = 1 n M ( i , j ) S ( i , j ) i = 1 m j = 1 n M ( i , j ) 2 i = 1 m j = 1 n S ( i , j ) 2
where M is the master image, S is the slave image, and is the conjugate multiplication. After calculating the value of each pixel, the average value γ ¯ of each pixel in the time series is obtained:
γ ¯ = 1 N i = 1 N γ i
In general cases, the larger the γ value, the more stable the pixel, the lower the noise, and the better the interference phase quality. The coherence threshold is set, and when the γ ¯ value of a pixel point is greater than that of the threshold, it is determined to be an effective PS point [49].
(2)
Amplitude dispersion index method
Ferretti et al. proposed that the stability of the interference phase can be measured by the time series of the amplitude information in the pixel [50]. R and I represent the real and imaginary parts of the image, respectively. If there is Gaussian noise with the standard deviation of σ n , the amplitude value A obeys the Rice distribution [51]:
f A ( a ) = a σ n 2 I 0 a g σ n 2 e a 2 + g 2 2 σ n 2 , a > 0
In the above formula, g is the target reflection, and g > 0 , I 0 is a Bessel function. When the signal-to-noise ratio g / σ n is small, the Rice distribution evolves into the Rayleigh distribution. In the high-SNR target ( g / σ n > 4 ), the distribution tends towards a Gaussian distribution [42]. Therefore, when σ n g , the phase dispersion index can be estimated by the amplitude dispersion index:
σ v σ n I g σ A m A D A = σ A μ A
In the above formula, σ v is the phase dispersion index; σ n I is the standard deviation of the imaginary part; μ A and σ A are the mean and standard deviation of the time series amplitude, respectively; and D A is the amplitude dispersion index.
This method selects stable PS points by comprehensively considering the coherence coefficient, amplitude deviation index, and deformation velocity via PS-InSAR processing. Firstly, the pixels with high coherence were selected as PS points by the coherence coefficient method. The coherence threshold was set to 0.95, and the pixels with a coherence higher than that of the threshold were selected as PS points. Secondly, the PS points with a stable phase were further selected by the amplitude dispersion method, and the amplitude dispersion index threshold was set to 0.40. The PS points were selected if the amplitude dispersion index was lower than that of the threshold. Finally, the PS points were determined by the deformation velocity interval, and the deformation velocity interval was set to be [−1 mm/a, 1 mm/a]. Based on the three-threshold method described above, a total of 21 eligible PS points were selected as ground control points (GCPs) for refinement and re-flattening, so as to obtain more accurate surface deformation monitoring results.

2.3.2. DInSAR-PS-Stacking Processing

We selected multiple SAR images at different times in the same area from 6 January 2018 to 4 October 2019. Using the DInSAR-PS-Stacking method, we first preprocessed them by registration and multi-look processing (range/azimuth = 5:1). Then, the two–two interference processing was performed to generate the time-series interferogram, which was processed using the external DEM data to obtain the time-series differential interferogram, and then processed by filtering (Goldstein filtering), phase unwrapping (minimum cost flow method (MCF)), and other data processing steps. The GCPs obtained using the PS-InSAR three-threshold method was used for refinement and re-flattening, and then weighted stacking, phase-to-displacement conversion, and geocoding were performed [52,53] to obtain the accumulated time-series surface deformation information.
The interference phase φ is expressed as:
φ = φ f l a t + φ t o p o + φ d e f + φ a t m + φ n o i s e + φ o r b i t
In the above formula: φ f l a t is the flat phase, which can be removed by accurate calculation of the baseline length; φ t o p o is the topographic phase, which can be removed by the DEM data simulation; φ a t m and φ n o i s e are the atmospheric delay and noise phase, respectively, which can be reduced by filtering; φ o r b i t is the phase caused by the orbit error, which can be eliminated using precise orbit data of the image pair; and φ d e f is the deformation phase.
The deformation variable calculated by the deformation phase is expressed as:
Δ r = λ 4 π φ d e f
In the above formula, Δ r is the deformation variable of the ground target in the direction of the radar line-of-sight (LOS); λ is the working wavelength of the radar sensor, 5.6 cm; and φ d e f is the phase of the LOS surface deformation.
In this study, the PS points were selected using the PS-InSAR three-threshold method for conversion into GCPs for refinement and re-flattening so as to remove orbit errors and residual phases and to improve inversion accuracy. The unwrapping phases after refinement and re-flattening were stacked to reduce errors. The cumulative time-series subsidence maps of the study area were obtained by phase-to-displacement conversion, geocoding, and clipping.

2.3.3. SBAS-PS-InSAR Processing

SBAS-InSAR technology is one of the branches of time-series InSAR technology [54]. The SBAS-PS-InSAR method is an improvement of the SBAS-InSAR method. According to the spatio-temporal baseline threshold, all the SAR images from the same area are divided into several small baseline sets. The least squares method solves the deformation phase of each set. All the small baseline sets are connected, and the least squares solution, in the sense of the minimum norm of the deformation phase, is obtained by singular value decomposition (SVD) [55].
Basic principle: N + 1 SAR images are selected according to the time sequence, and one scene is selected as the super master image, which is registered and resampled with other N SAR images [56]. According to the space–time baseline threshold, M differential interference pairs are obtained, where M is:
N + 1 2 M N + 1 2 N
Assuming that the j t h j = 1 , 2 , M interferogram is at time t A and t B ( t B > t A ) , the phase value of the pixel ( x , y ) can be expressed as Equation (8).
δ φ j ( i , j ) = φ ( t B , x , y ) φ ( t A , x , y ) 4 π λ [ d ( t B , x , y ) d ( t A , x , y ) ] + φ topo ( x , y ) + φ o r b + φ r e s ( x , y )
In the above formula, d ( t A , x , y ) and d ( t B , x , y ) are the LOS directional variables of the pixel at time t A and t B relative to the initial time; φ topo ( x , y ) is the topographic phase error caused by elevation data; φ o r b is the orbit error phase; and φ r e s ( x , y ) is the residual phase.
The topographic phase and flat phase were removed using external DEM data and geometric imaging relationships. Then, the required deformation phase information was obtained by filtering and phase unwrapping; the stable PS points obtained using the PS-InSAR three-threshold method were used as GCPs for refinement and re-flattening to further correct the deformation phase and improve the subsequent in-version accuracy. If d ( t 0 , x , y ) = 0 , the corresponding time-series phase is:
φ ( t i , x , y ) 4 π λ d ( t i , x , y )
The temporal deformation phase sequence of the pixel to be solved can be expressed as:
φ = [ φ ( t 1 ) , φ ( t N ) ] T
δ φ = [ δ φ ( t 1 ) , δ φ ( t N ) ] T
The primary image and the secondary image sequences arranged in chronological order are represented by sets I E = [ I E 1 I E M ] and I S = [ I S 1 I S M ] , respectively, and satisfy I E j > I S j ( j = 1 , 2 , , M ) . Then, all the differential phases can be expressed as:
δ φ j = φ ( t I E j ) φ ( t I S j ) , ( j = 1 , 2 , , M )
Converting it to a matrix form, it can be expressed as:
A φ = δ φ
In the above formula, A is the coefficient matrix. When all the interference pairs belong to a subset, the rank of A is N ( M N ) , which can be obtained by the least square method:
φ ^ = A + δ φ , A + = ( A T A ) 1 A T
In actual processing, A is mostly a non-full rank matrix and A T A is a singular matrix, so there are numerous solutions, which are solved by SVD.
A = U S V T
Finally, the phase-change velocity V is solved. After the phase-change velocity is solved, the cumulative deformation can be calculated by integrating the phase-change rate in the corresponding time period [57], so as to obtain the time-series deformation.
The SBAS-PS-InSAR method selected one of the images as the super primary image, and the remaining images were secondary images. The connection graph was determined using the spatio-temporal baseline threshold, and the deformation monitoring accuracy was improved with the reduction in the spatio-temporal baseline [58]. The spatio-temporal baseline thresholds were set to 2% and 70 days of the maximum critical baseline, respectively, and the image interference pairs were generated according to the principle of a small baseline set. The interference processing included the removal of the flat phase and topographic phase, the generation of a differential interferogram, Goldstein filtering, and minimum cost flow method (MCF) phase un-wrapping. The PS-InSAR three-threshold method was used to automatically select the PS points for the GCPs for refinement and re-flattening, to estimate and remove the residual constant phase and phase ramp after unwrapping, and to reduce orbit errors and improve the inversion accuracy. Then, we estimated and removed the residual terrain phase and time low-pass phase and performed secondary phase unwrapping on the residual part. The average deformation velocity and elevation topography were inverted. Then, the phase time series was filtered by atmospheric space–time filtering to filter out the atmospheric delay phase [59]. Finally, phase-to-displacement conversion, geocoding, and clipping were used to obtain the cumulative time-series deformation sequence of the study area.

2.3.4. DInSAR-PS-Stacking and SBAS-PS-InSAR Fusion

The cumulative time-series deformations monitored by the DInSAR-PS-Stacking and SBAS-PS-InSAR methods were compared and analyzed, and the monitoring ability and the advantages and disadvantages of these two methods for surface deformation in the goaf of the working face were studied. The SBAS-InSAR method performs poorly in areas with large subsidence gradients and poor coherence, but it can achieve higher accuracy in subsidence edge regions. On the contrary, the DInSAR method performs well in subsidence central areas and can achieve higher accuracy, but its accuracy is relatively low in subsidence edge regions [60,61]. In this study, the DInSAR-PS-Stacking method can obtain the cumulative subsidence in the center area with a large motion gradient, and SBAS-PS-InSAR can more accurately monitor slow and small deformations. Therefore, OTSU threshold segmentation is used to automatically extract double thresholds (coherence coefficient threshold and deformation threshold) to fuse the simultaneous cumulative time-series deformations obtained by the DInSAR-PS-Stacking and SBAS-PS-InSAR methods.
Firstly, the coherence maps were obtained using Formula (1) in the coherence coefficient method, and then the multi-temporal average coherence maps were obtained using Formula (2).
Secondly, OTSU was used to automatically obtain the threshold of the time series average coherence map. If the coherence is less than the threshold, the cumulative deformation result of DInSAR-PS-Stacking is fused, and the cumulative deformation result of fused SBAS-PS-InSAR with coherence greater than or equal to the threshold is fused.
Thirdly, on this basis, the OTSU method is used to extract the deformation threshold of the cumulative deformation results monitored by DInSAR-PS-Stacking. When the cumulative deformation is less than the threshold, it is the settlement center deformation with a large settlement gradient, and it is fused with the cumulative deformation map after the fusion in the previous step; finally, the cumulative time series deformation results after the fusion is obtained.
The problems of SBAS-PS-InSAR monitoring having an insufficient subsidence center and DInSAR-PS-Stacking monitoring having poor subsidence edge accuracy are solved, and the subsidence of the working face goaf is further studied and analyzed.

3. Results and Analysis

3.1. Analysis of Refinement and Re-Flattening Results

In this study, the above DInSAR-PS-Stacking and SBAS-PS-InSAR methods were used to process 52 scenes of SAR image data covering a coal mine in Nalintaohai Town, Yijinhuoluo Banner, Ordos City, Inner Mongolia Autonomous Region, from 6 January 2018 to 4 October 2019. Refinement and re-flattening are important steps in InSAR technology, which play an important role in improving the accuracy and reliability of measurement. It is necessary to select ground control points for refinement and re-flattening to determine the position and elevation information of satellite orbit and terrain for improving measurement accuracy and eliminating the influence of non-surface deformation factors. The ground control points are selected in areas with high coherence, flat terrain, no phase jump and deformation stripes. The stable PS points selected by the PS-InSAR three-threshold method basically meet the selection requirements of ground control points. The PS points obtained by the PS-InSAR three-threshold method are used as ground control points for refinement and re-flattening. We selected the representative results of differential interference and unwrapping. Figure 3 shows the differential interferogram after refinement and re-flattening and the phase diagram after unwrapping. It can be seen that the effect after processing is very good, and the root mean square error is within 15 or even 10. The results of other differential interference and unwrapping after refinement and re-flattening are also better, and the root mean square errors basically satisfy the requirements. The differential interferogram and phase unwrapping diagram after refinement and re-flattening are relatively smooth, with less noise, no obvious slope or step-like phase deviation, and the deformation area can be clearly seen and is more consistent. The differential interferogram and phase unwrapping diagram after data processing at different times have a more obvious deformation area, the positions are relatively close, and there is a certain repeatability and space–time continuity. Through the PS-InSAR three-threshold method, the stable PS points are selected as ground control points for refinement and re-flattening, which can correct the satellite orbit and phase offset and effectively eliminate the influence of orbit phase. This method basically meets the selection requirements of ground control points and meets the research needs of deformation monitoring.

3.2. Monitoring and Analysis of DInSAR-PS-Stacking and SBAS-PS-InSAR

In this study, the DInSAR-PS-Stacking and SBAS-PS-InSAR methods were combined and compared to monitor the surface subsidence of a mining area in Nalintaohai Town, Yijinhuoluo Banner, Ordos City, Inner Mongolia Autonomous Region, from 6 January 2018 to 4 October 2019. After that, the monitoring deformation results were verified and analyzed. The proposed method improved the inaccuracy of mining area monitoring using the single-InSAR method, improved the accuracy and integrity of deformation monitoring in the mining area, reduced the atmospheric error, improved the monitoring effect, and was conducive to the efficient identification of goaf in the mining area. Figure 4 shows the average annual displacement velocity of the coal mines monitored using SBAS-PS-InSAR. Figure 5 shows the comparison of the monitoring results of the DInSAR-PS-Stacking and SBAS-PS-InSAR methods in the same period.
Coal mining often produces large subsidence in a short time, which can lead to loss of coherence. SBAS-PS-InSAR cannot select high-coherence points in the mining subsidence center, which leads to loss of information.
It can be noticed from the surface subsidence results shown in Figure 4 and Figure 5 that from 6 January 2018 to 4 October 2019, both the DInSAR-PS-Stacking and SBAS-PS-InSAR methods monitored obvious subsidence funnels, which extended around the center of the subsidence funnel and were gradually distributed as strip. The subsidence range gradually extends from north to south along the working face, which is consistent with the advancement of mining progress. In the mining face area, there was basically no settlement at the beginning. With the advancement of mining progress, the settlement gradually increased, and then gradually stabilized. The subsidence change in the mining face is closely related to the advancement of mining progress. The position and spatio-temporal changes in the monitored mining subsidence basin were basically the same, which were highly consistent with the actual mining area. These two methods reveal that the ground subsidence in the mining area of the coal mining working face is gradually increasing, and the coal mine has been mined in large quantities, resulting in large-scale ground subsidence. As the mining intensity increased, the subsidence range spread around the center of the subsidence funnel. For the mining area, the maximum cumulative subsidence monitored by the DInSAR-PS-Stacking and SBAS-PS-InSAR methods was −131.4 mm and −96.2 mm, respectively. The annual average maximum subsidence velocity obtained by SBAS-PS-InSAR method was −59.3 mm/year. Overall, the two methods used to monitor coal mine surface subsidence locations, scope, distribution, and temporal and spatial subsidence laws showed a high degree of agreement. However, the specific analysis showed that: (1) in the same time period, the monitored cumulative subsidence using DInSAR-PS-Stacking is larger than that of SBAS-PS-InSAR, and that (2) in the area with a large subsidence gradient (such as the subsidence center) and poor coherence, DInSAR-PS-Stacking was able to monitor the subsidence information, while SBAS-PS-InSAR technology failed to effectively monitor the subsidence information, causing the obtained cumulative time-series subsidence map to be lacking.
Through the cumulative time-series subsidence map obtained using the DInSAR-PS-Stacking and SBAS-PS-InSAR monitoring methods, the time-series analysis and comparative verification of the selected four subsidence points were carried out. The location of the deformation monitoring point is shown in Figure 1c. Point 1 is at the starting position of the mining face and also at the edge of the settlement. Point 6, point 12, and point 22 are located in the larger settlement area. The large settlement area of the mining face in the mining area is more significant, and the settlement in most areas is larger considering the SBAS-PS-InSAR monitoring results are partially missing and the location of the GPS monitoring points. These four points can be used as a representation of the subsidence of the mining face, which can better reflect the deformation of the mining face and the surrounding ground. Choosing these points can make people better understand the subsidence near the mining face.
As shown in Figure 6, in the goaf of the coal mine’s working face, it can be seen that the four characteristic subsidence points monitored using these two methods were basically the same for the overall subsidence trend. The DInSAR-PS-Stacking and SBAS-PS-InSAR methods both accurately monitor the temporal subsidence trends of the ground surface, which are consistent with GPS measurements. The settlement curves of the three show similar trends. However, the DInSAR-PS-Stacking method detects a greater amount of subsidence compared with the SBAS-PS-InSAR method. Taking Figure 6d as an example, the time-series settlement plot of this point shows the following information: from 6 January 2018 to 29 July 2018, the settlement was relatively small and changed slowly, with a slight downward trend. A significant settlement change occurred between 29 July 2018 and 27 September 2018. After 27 September 2018, although settlement still occurred, the settlement trend became relatively flat. In summary, this point experienced two different settlement stages during the observation period, with relatively slow settlement changes in the early and late stages and a significant change in the middle stage. The time series subsidence trend of Figure 6d is related to the mining progress. In Figure 6, it can be seen that the time series change basically shows a sinking trend. The time series settlement trend is basically that the settlement in the early and late stages is small and gentle, and the settlement in the middle stage is obviously larger, but the large settlement inflection point in the middle stage of each figure is different. The time of this inflection point is related to the degree of mining advancement.
The settlement point in Figure 6a is at the edge of the settlement, and the settlement points in Figure 6b–d are close to the large settlement center. In Figure 6a, the time series subsidence monitored by the SBAS-PS-InSAR method is closer to the GPS-measured time series subsidence. The time-series subsidence monitored by the DInSAR-PS-InSAR method in Figure 6b–d is closer to the GPS-measured time-series subsidence. In contrast, the SBAS-PS-InSAR method is more suitable for monitoring the slow and small deformation of the edge of the mining area, and its monitoring settlement is closer to the GPS-measured results. The DInSAR-PS-Stacking method is more suitable for monitoring the deformation of the large subsidence area in the mining area, and its monitoring subsidence and subsidence trend are closer to the GPS-measured results. Combining or fusing the DInSAR-PS-Stacking method and the SBAS-PS-InSAR method can better monitor the surface subsidence of the mining area and improve the monitoring accuracy and ability.
This paper compares and analyzes the correlation between the monitoring results of the DInSAR-PS-Stacking and SBAS-PS-InSAR methods and GPS monitoring results at four subsidence feature points. Pearson correlation coefficient is used to measure the strength of the linear relationship between the two, with a higher coefficient (closer to 1) indicating a more consistent subsidence trend. Figure 7 shows a comparison with the correlation diagrams of settlement curves measured by DInSAR-PS-Stacking, SBAS-PS-InSAR, and GPS. The time-series subsidence results monitored by the DInSAR-PS-Stacking and SBAS-PS-InSAR methods were compared with GPS monitoring results, and indicators such as Pearson correlation coefficient, mean absolute error (MAE), and root-mean-square error (RMSE) were calculated, verified, and analyzed. Table 3 shows the comparison and verification of the DInSAR-PS-Stacking time series settlement results and the GPS monitoring results. Table 4 shows the comparison and verification of the SBAS-PS-InSAR time series settlement results and the GPS monitoring results.
There are differences between the monitoring results of the DInSAR-PS-Stacking and SBAS-PS-InSAR methods. Considering Figure 7 and Table 3 and Table 4, an analysis and verification were carried out. The color bands in the correlation map in Figure 7 indicate better correlation with narrower bands. Based on Figure 7 and Pearson correlation coefficients, both InSAR methods show good correlation with GPS monitoring results, indicating that the subsidence trend detected by these two InSAR methods is consistent with GPS measurements. By comparing Table 3 and Table 4, the Pearson correlation coefficient between the time-series subsidence results monitored by the DInSAR-PS-Stacking method and GPS monitoring results is higher than that of the SBAS-PS-InSAR method, approaching 1. This suggests that the monitoring results of the DInSAR-PS-Stacking method are more consistent with the GPS monitoring results, indicating higher reliability and accuracy. Combining Table 3 and Table 4 with Figure 6, at point 1, the absolute error, mean absolute error (MAE), and root mean square error (RMSE) between the time-series subsidence results monitored by the SBAS-PS-InSAR method and GPS monitoring results are smaller than those of the DInSAR-PS-Stacking method. At points 6, 12, and 22, the absolute error, MAE, and RMSE between the time-series subsidence results monitored by the DInSAR-PS-Stacking method and GPS monitoring results are smaller than those of the SBAS-PS-InSAR method. In comparison, the monitoring results of the SBAS-PS-InSAR method have smaller errors in the subsidence marginal area, while the monitoring results of the DInSAR-PS-Stacking method show smaller errors in the large subsidence area. The errors of the surface deformation monitoring results of these two InSAR methods are within an acceptable range, indicating that the monitoring results of these two InSAR methods represent the same deformation field of the mining area. These results indicate that the surface subsidence monitoring results of the DInSAR-PS-Stacking and SBAS-PS-InSAR methods are effective and reliable.
In summary:
(1)
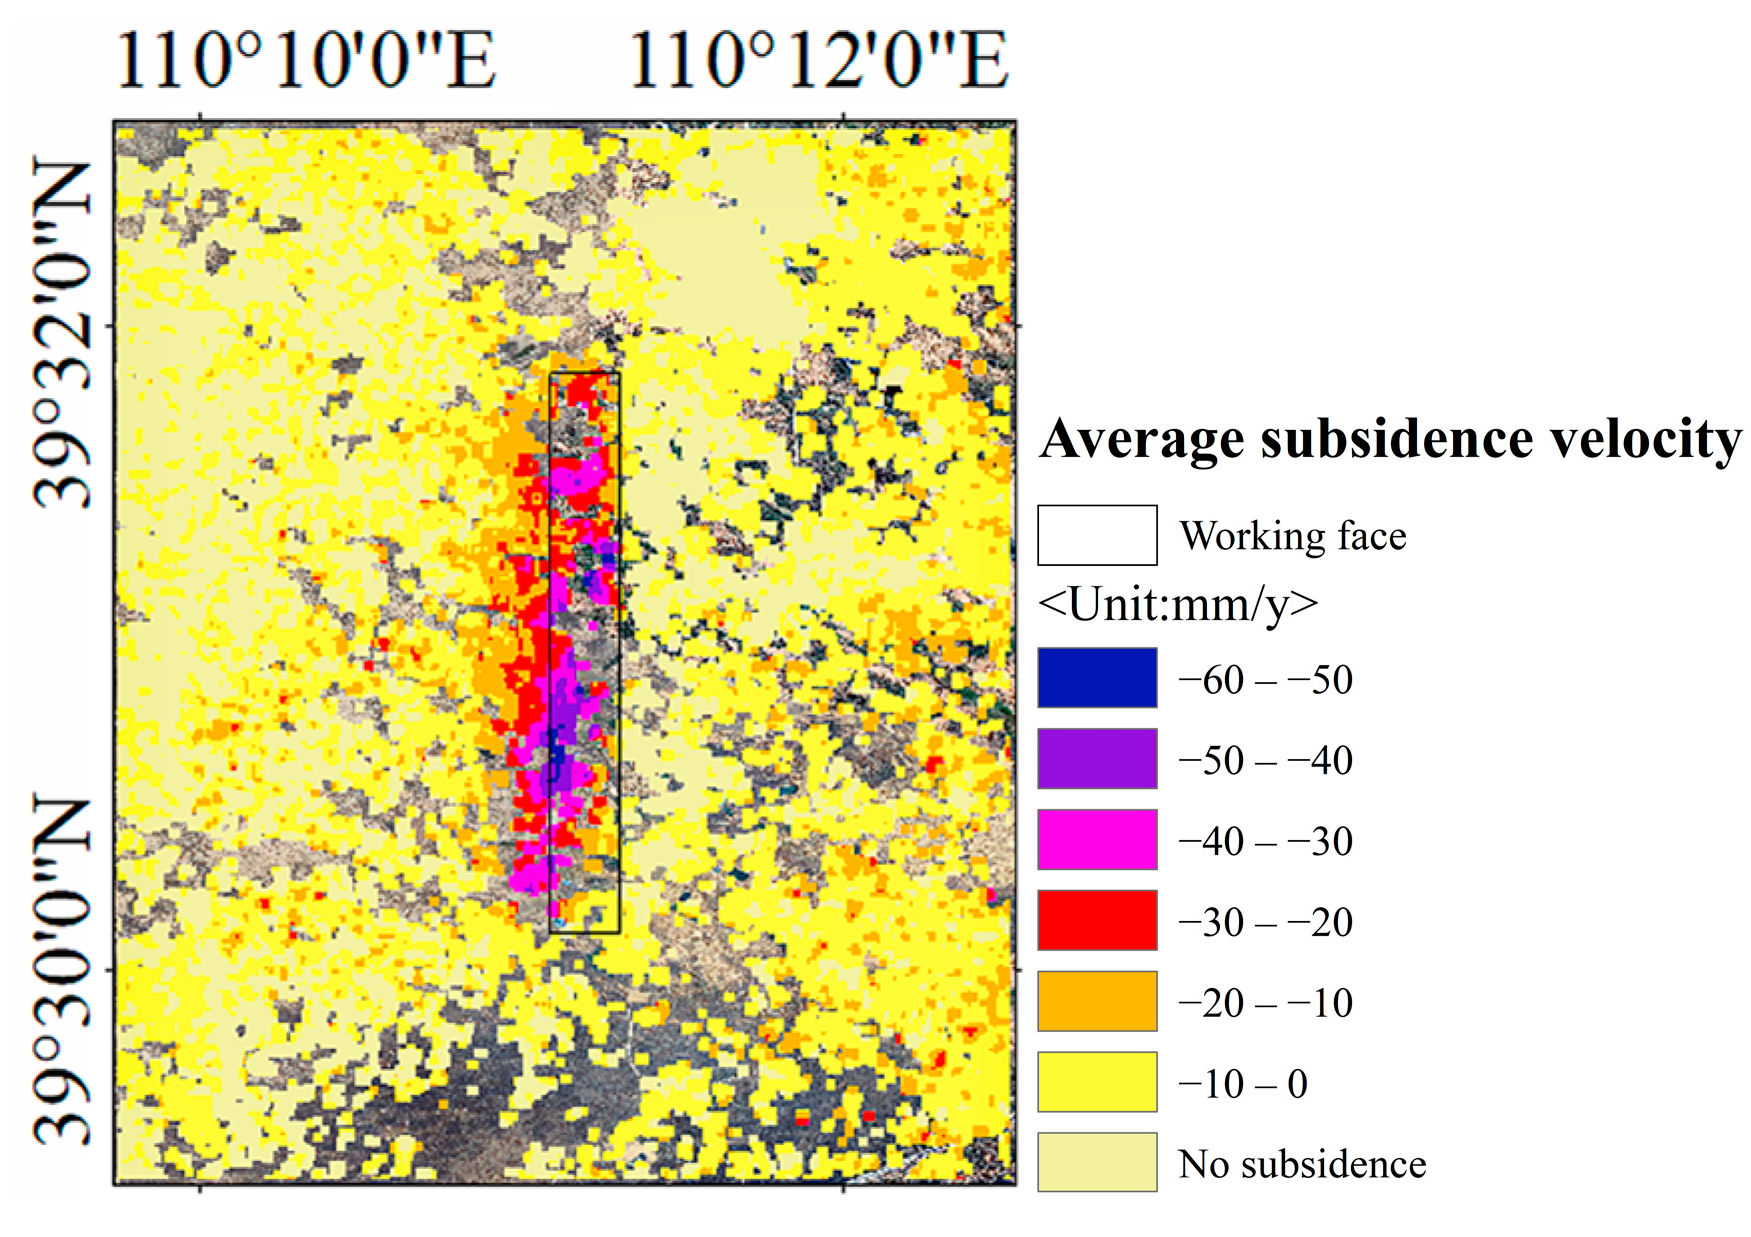
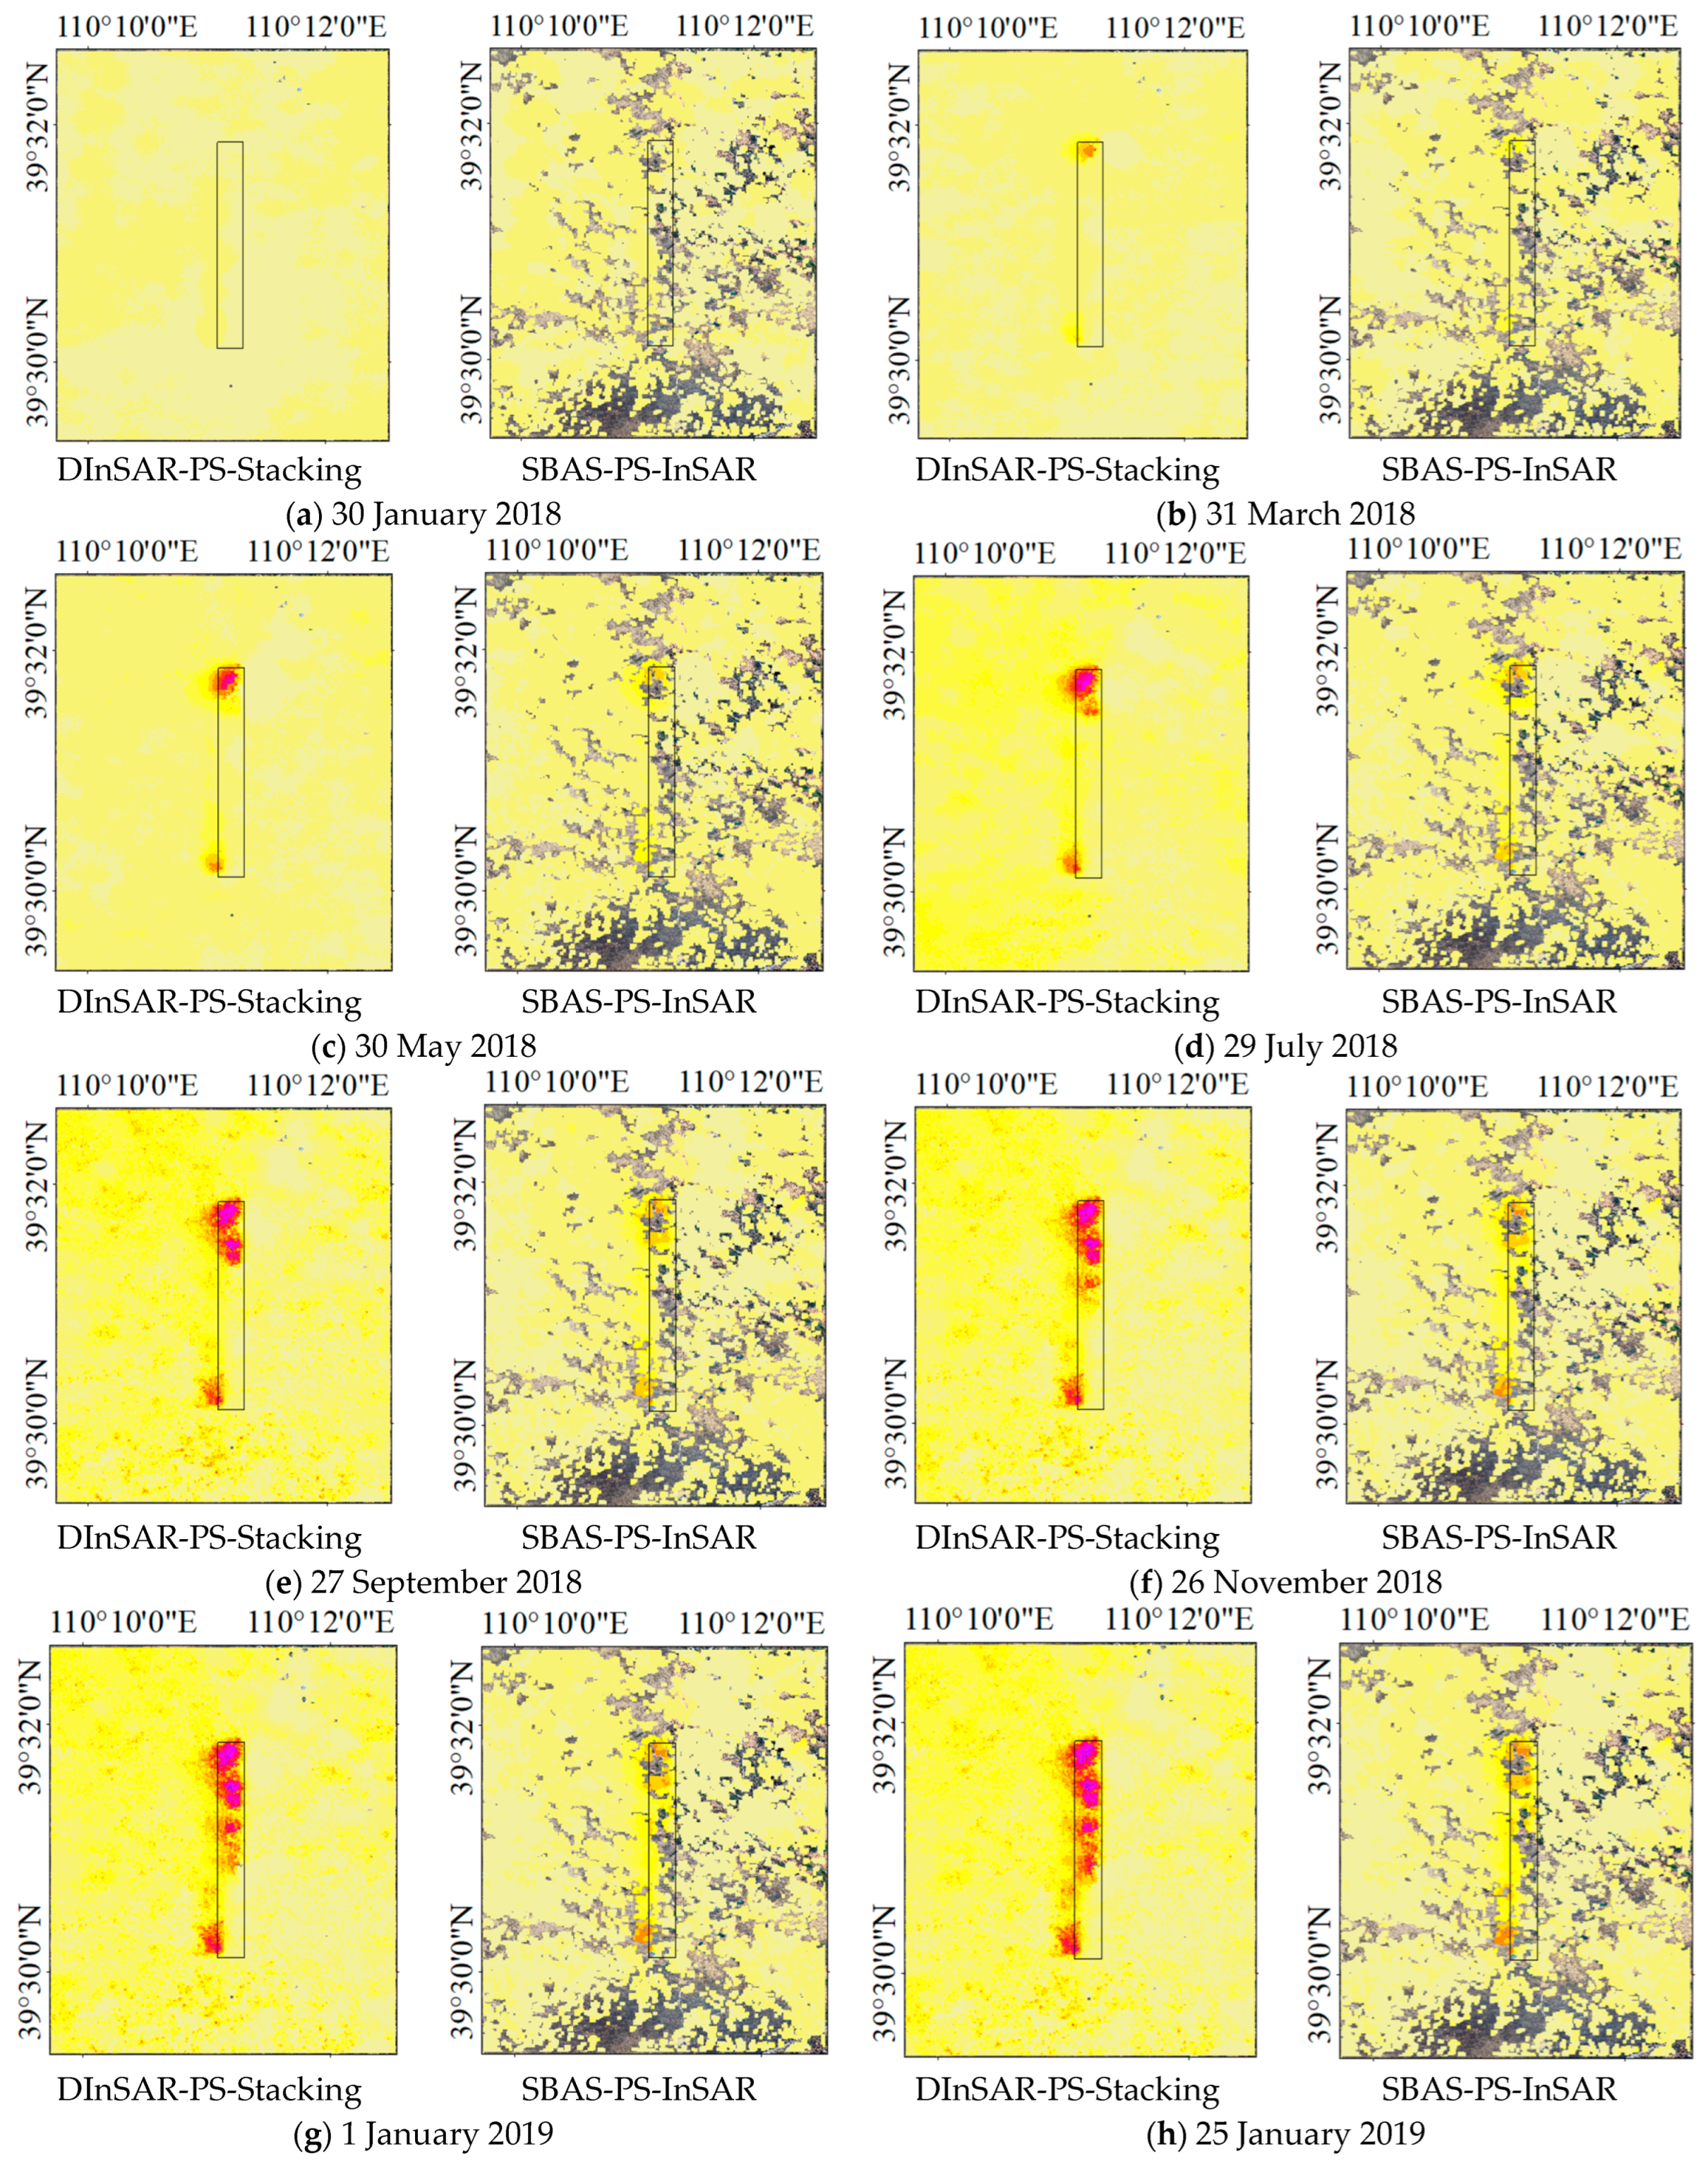
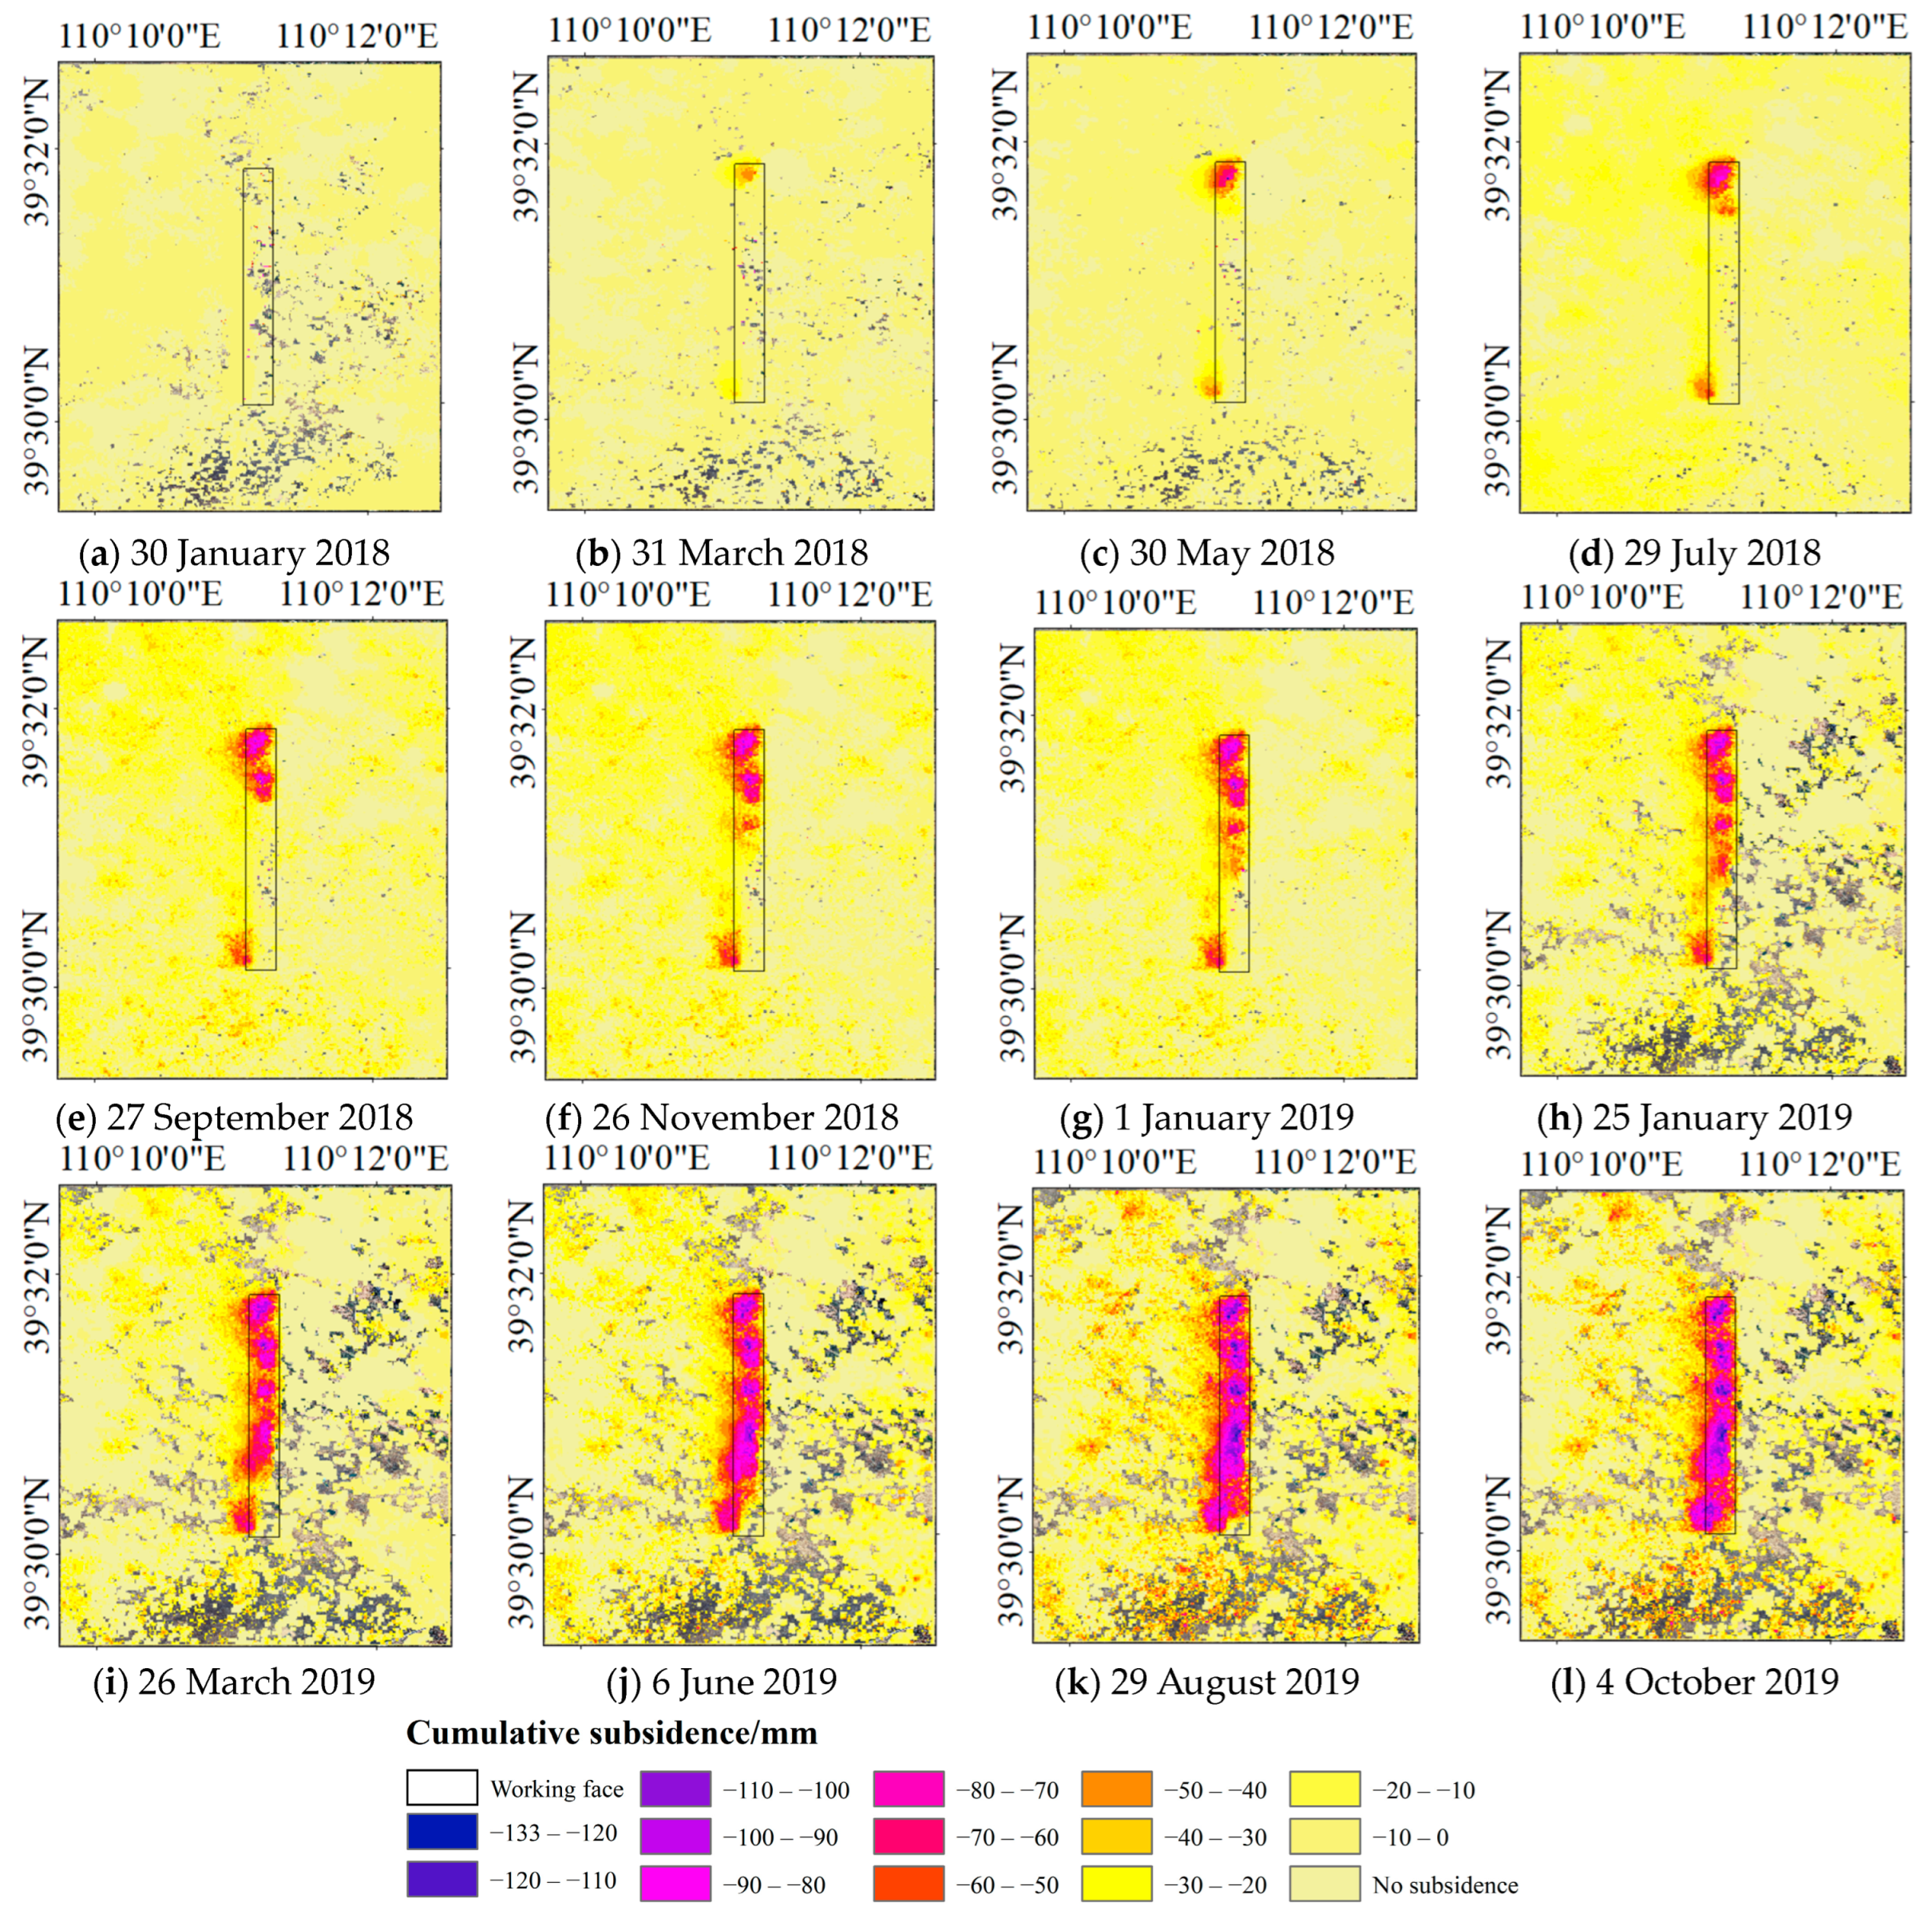
The DInSAR-PS-Stacking and SBAS-PS-InSAR methods can accurately locate and detect the change trend of mining subsidence, which is in good agreement with the mining process of the coal mining face. The surface subsidence was found to gradually increase with the mining of the working face. The location, range, distribution, and space–time subsidence laws of the surface subsidence of the coal mine monitored by the two InSAR methods had good consistency.
(2)
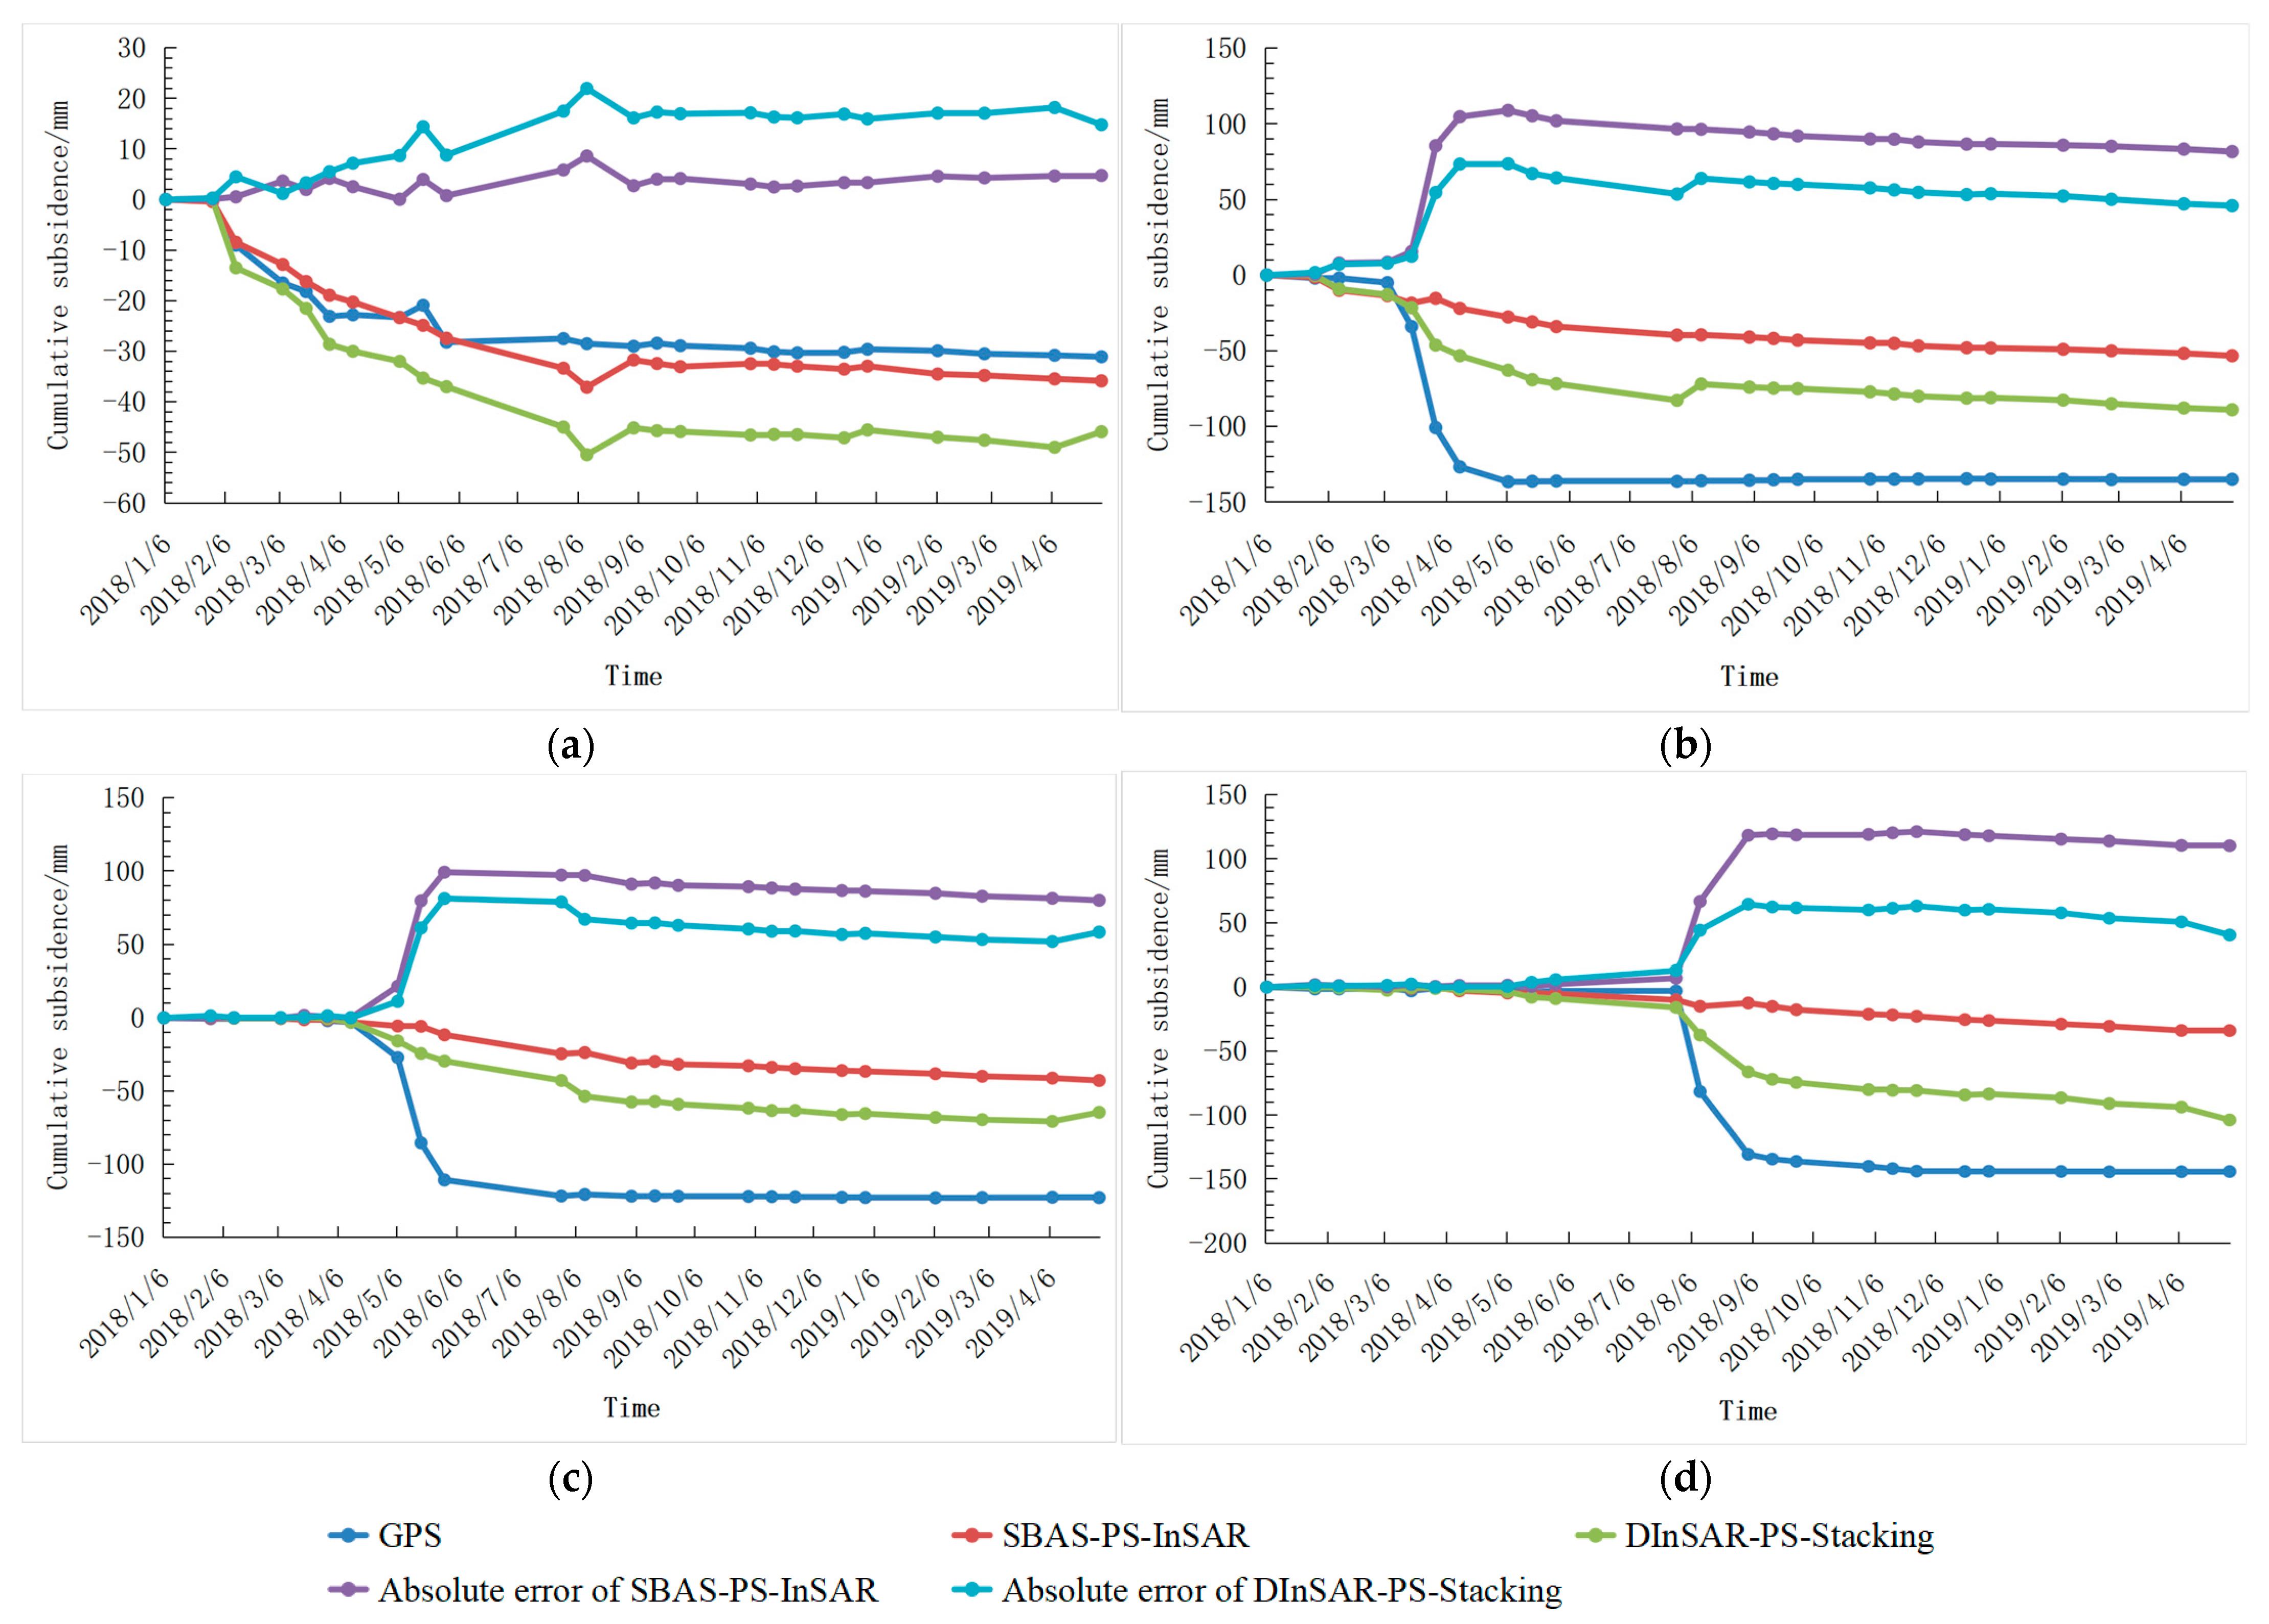
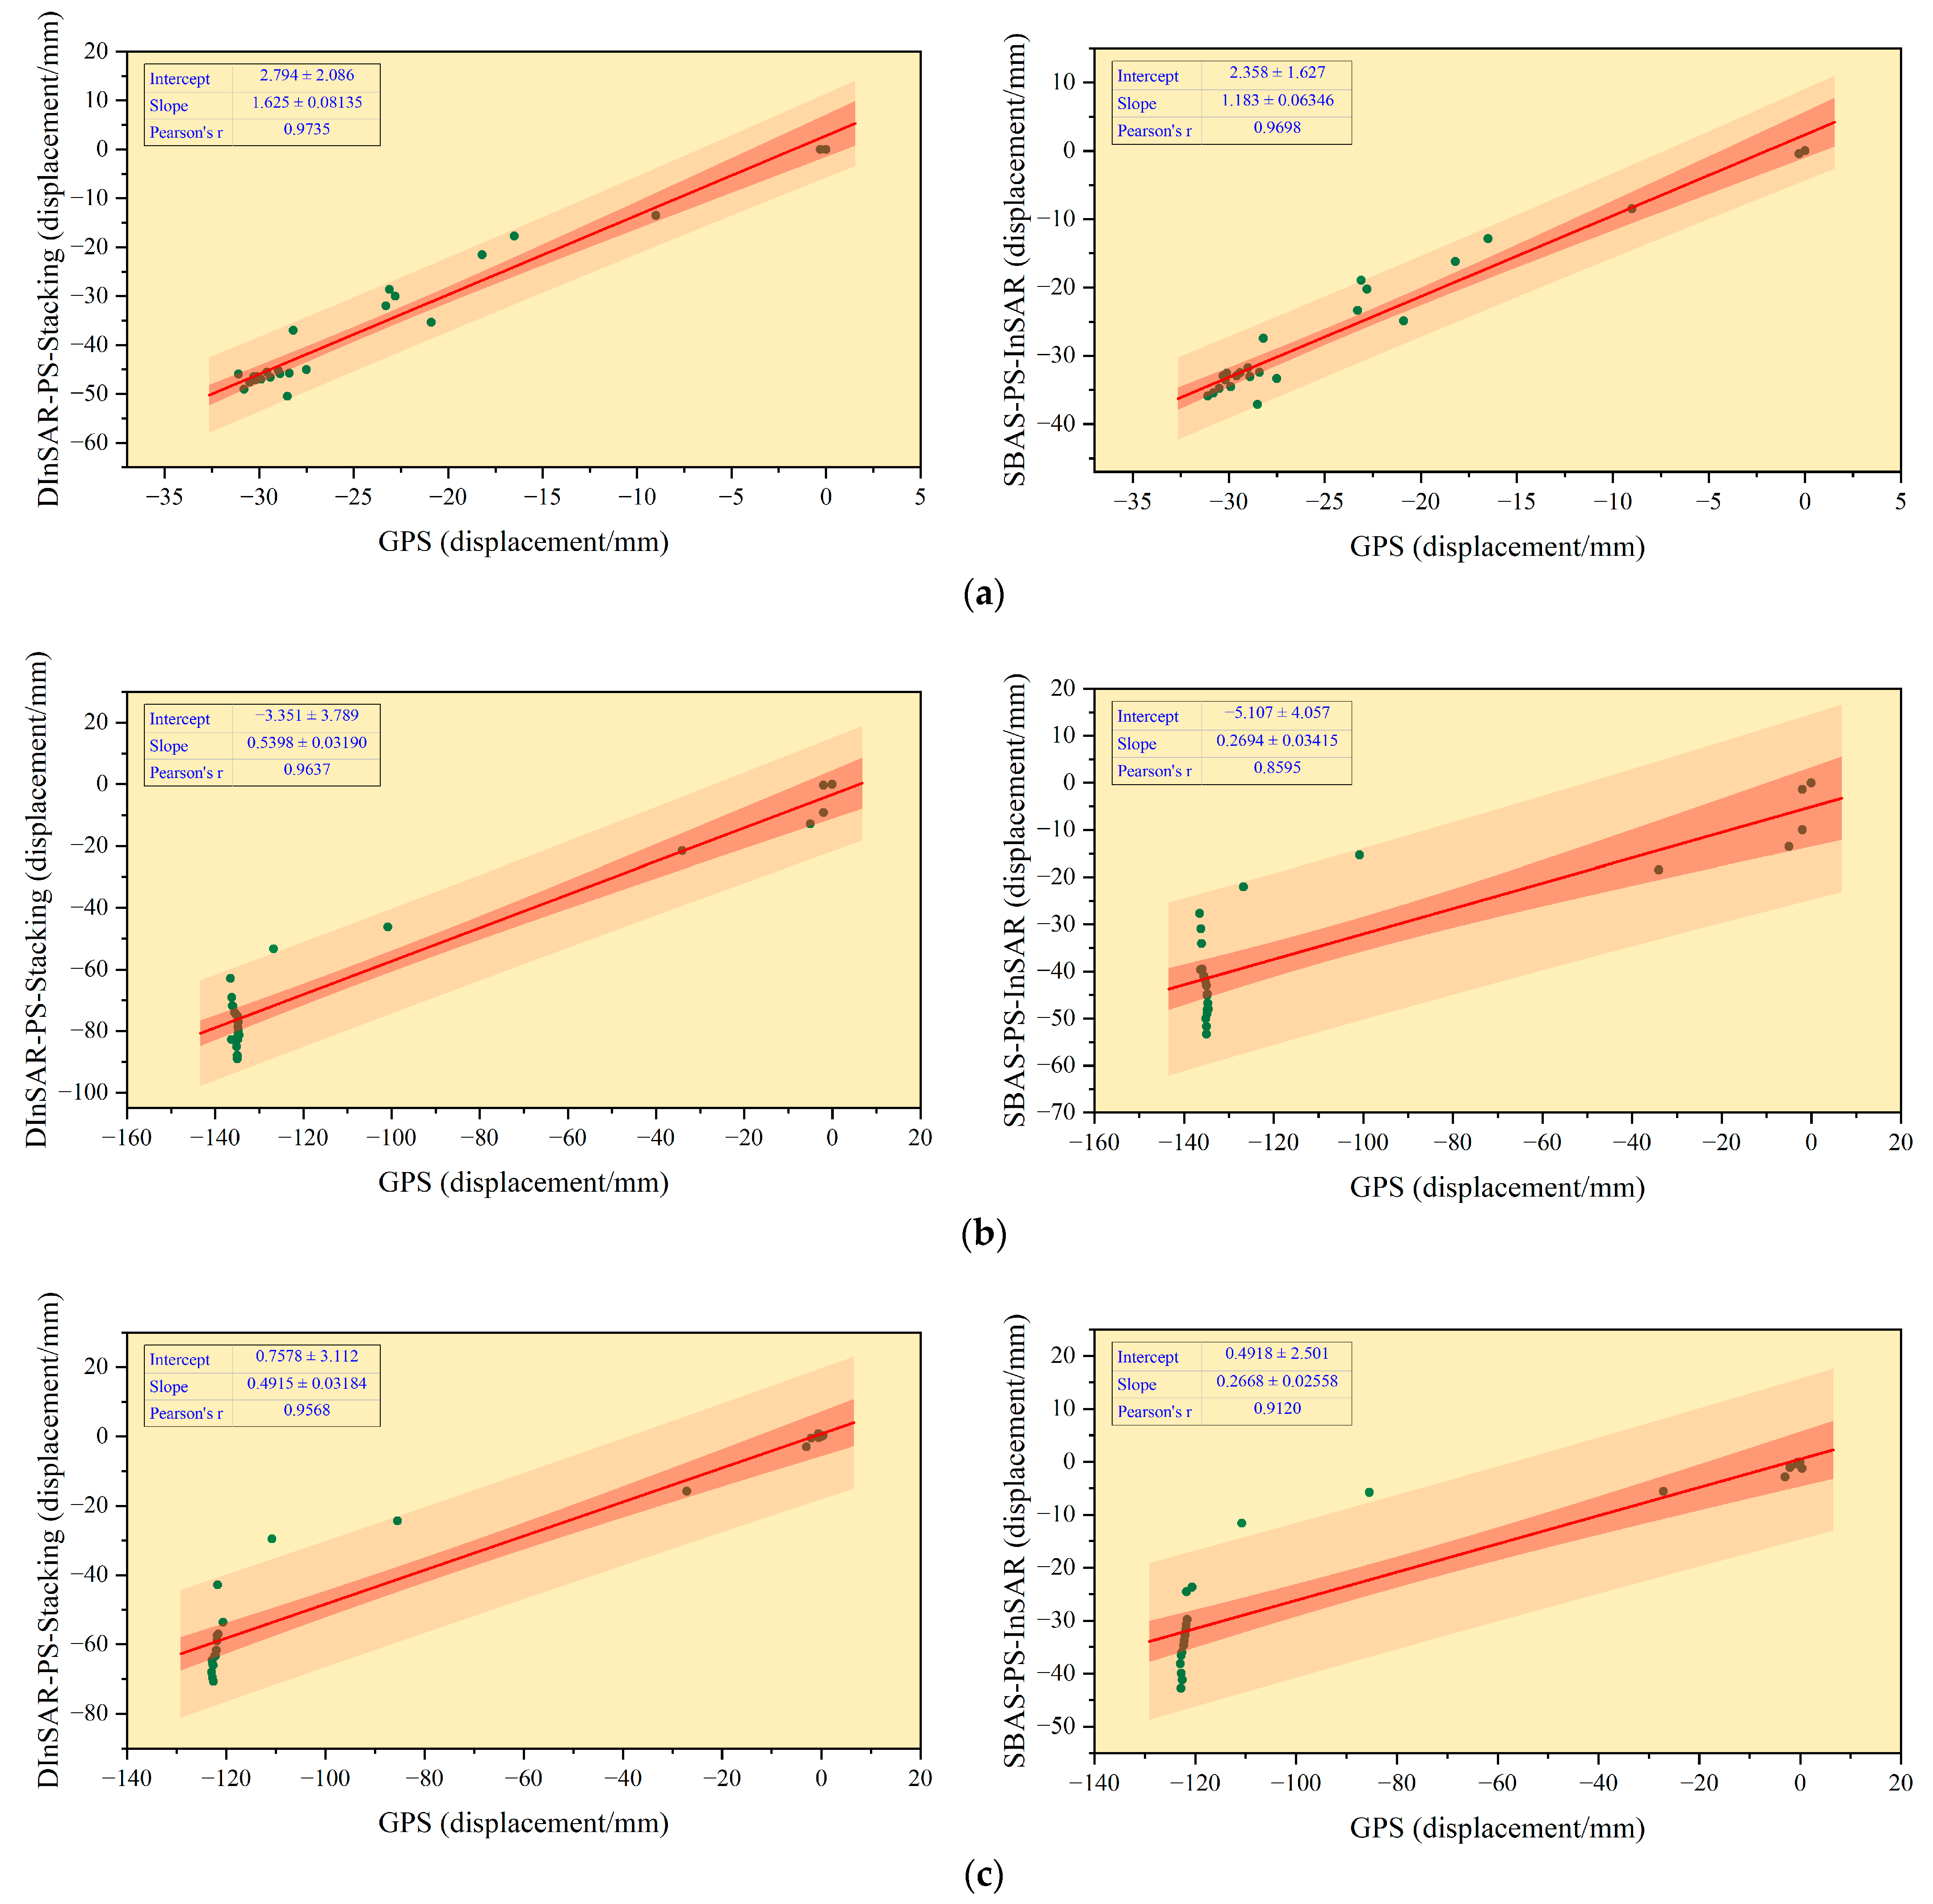
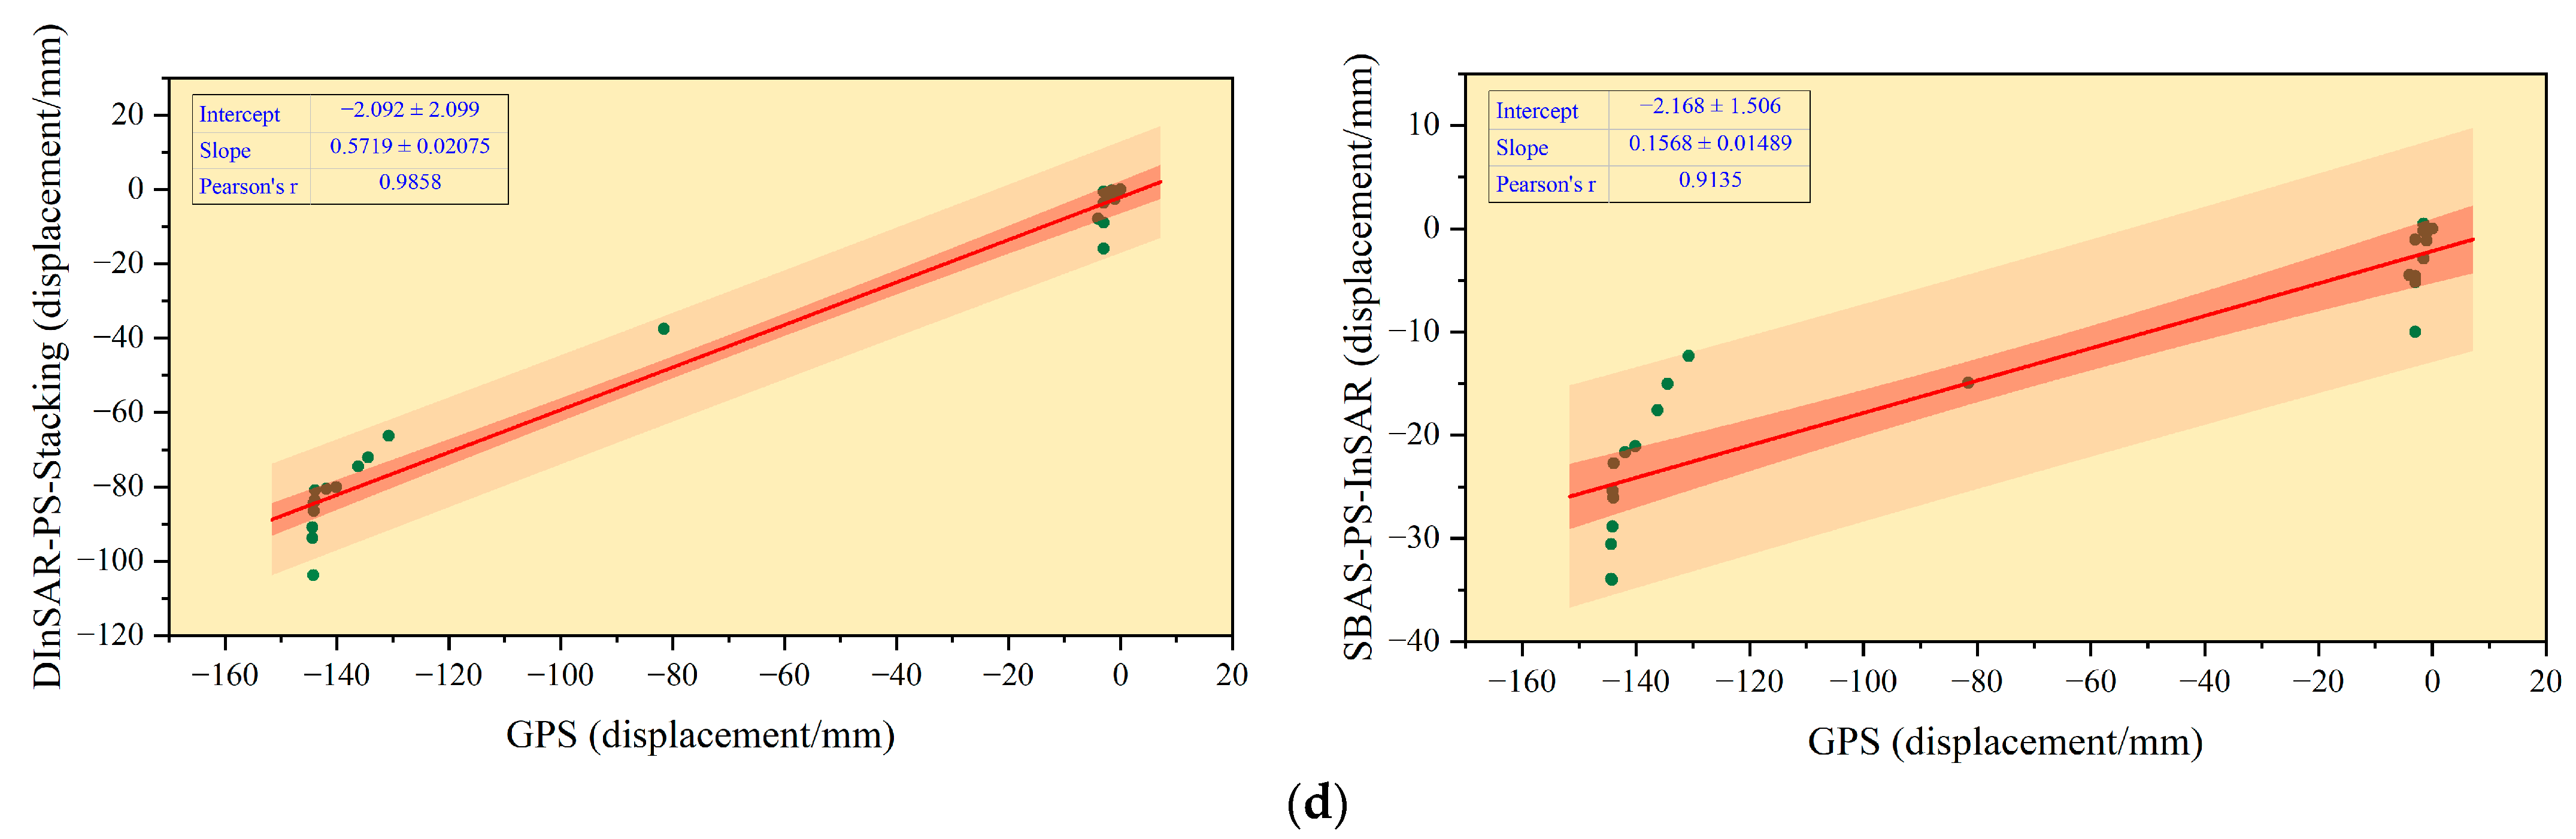
The point subsidence results obtained by these two InSAR techniques are well correlated with GPS monitoring results. The settlement trend of each point is basically the same, and the monitoring results are effective and reliable. The time series settlement errors monitored by these two InSAR methods show that the settlement edge is small and the large settlement area is large.
(3)
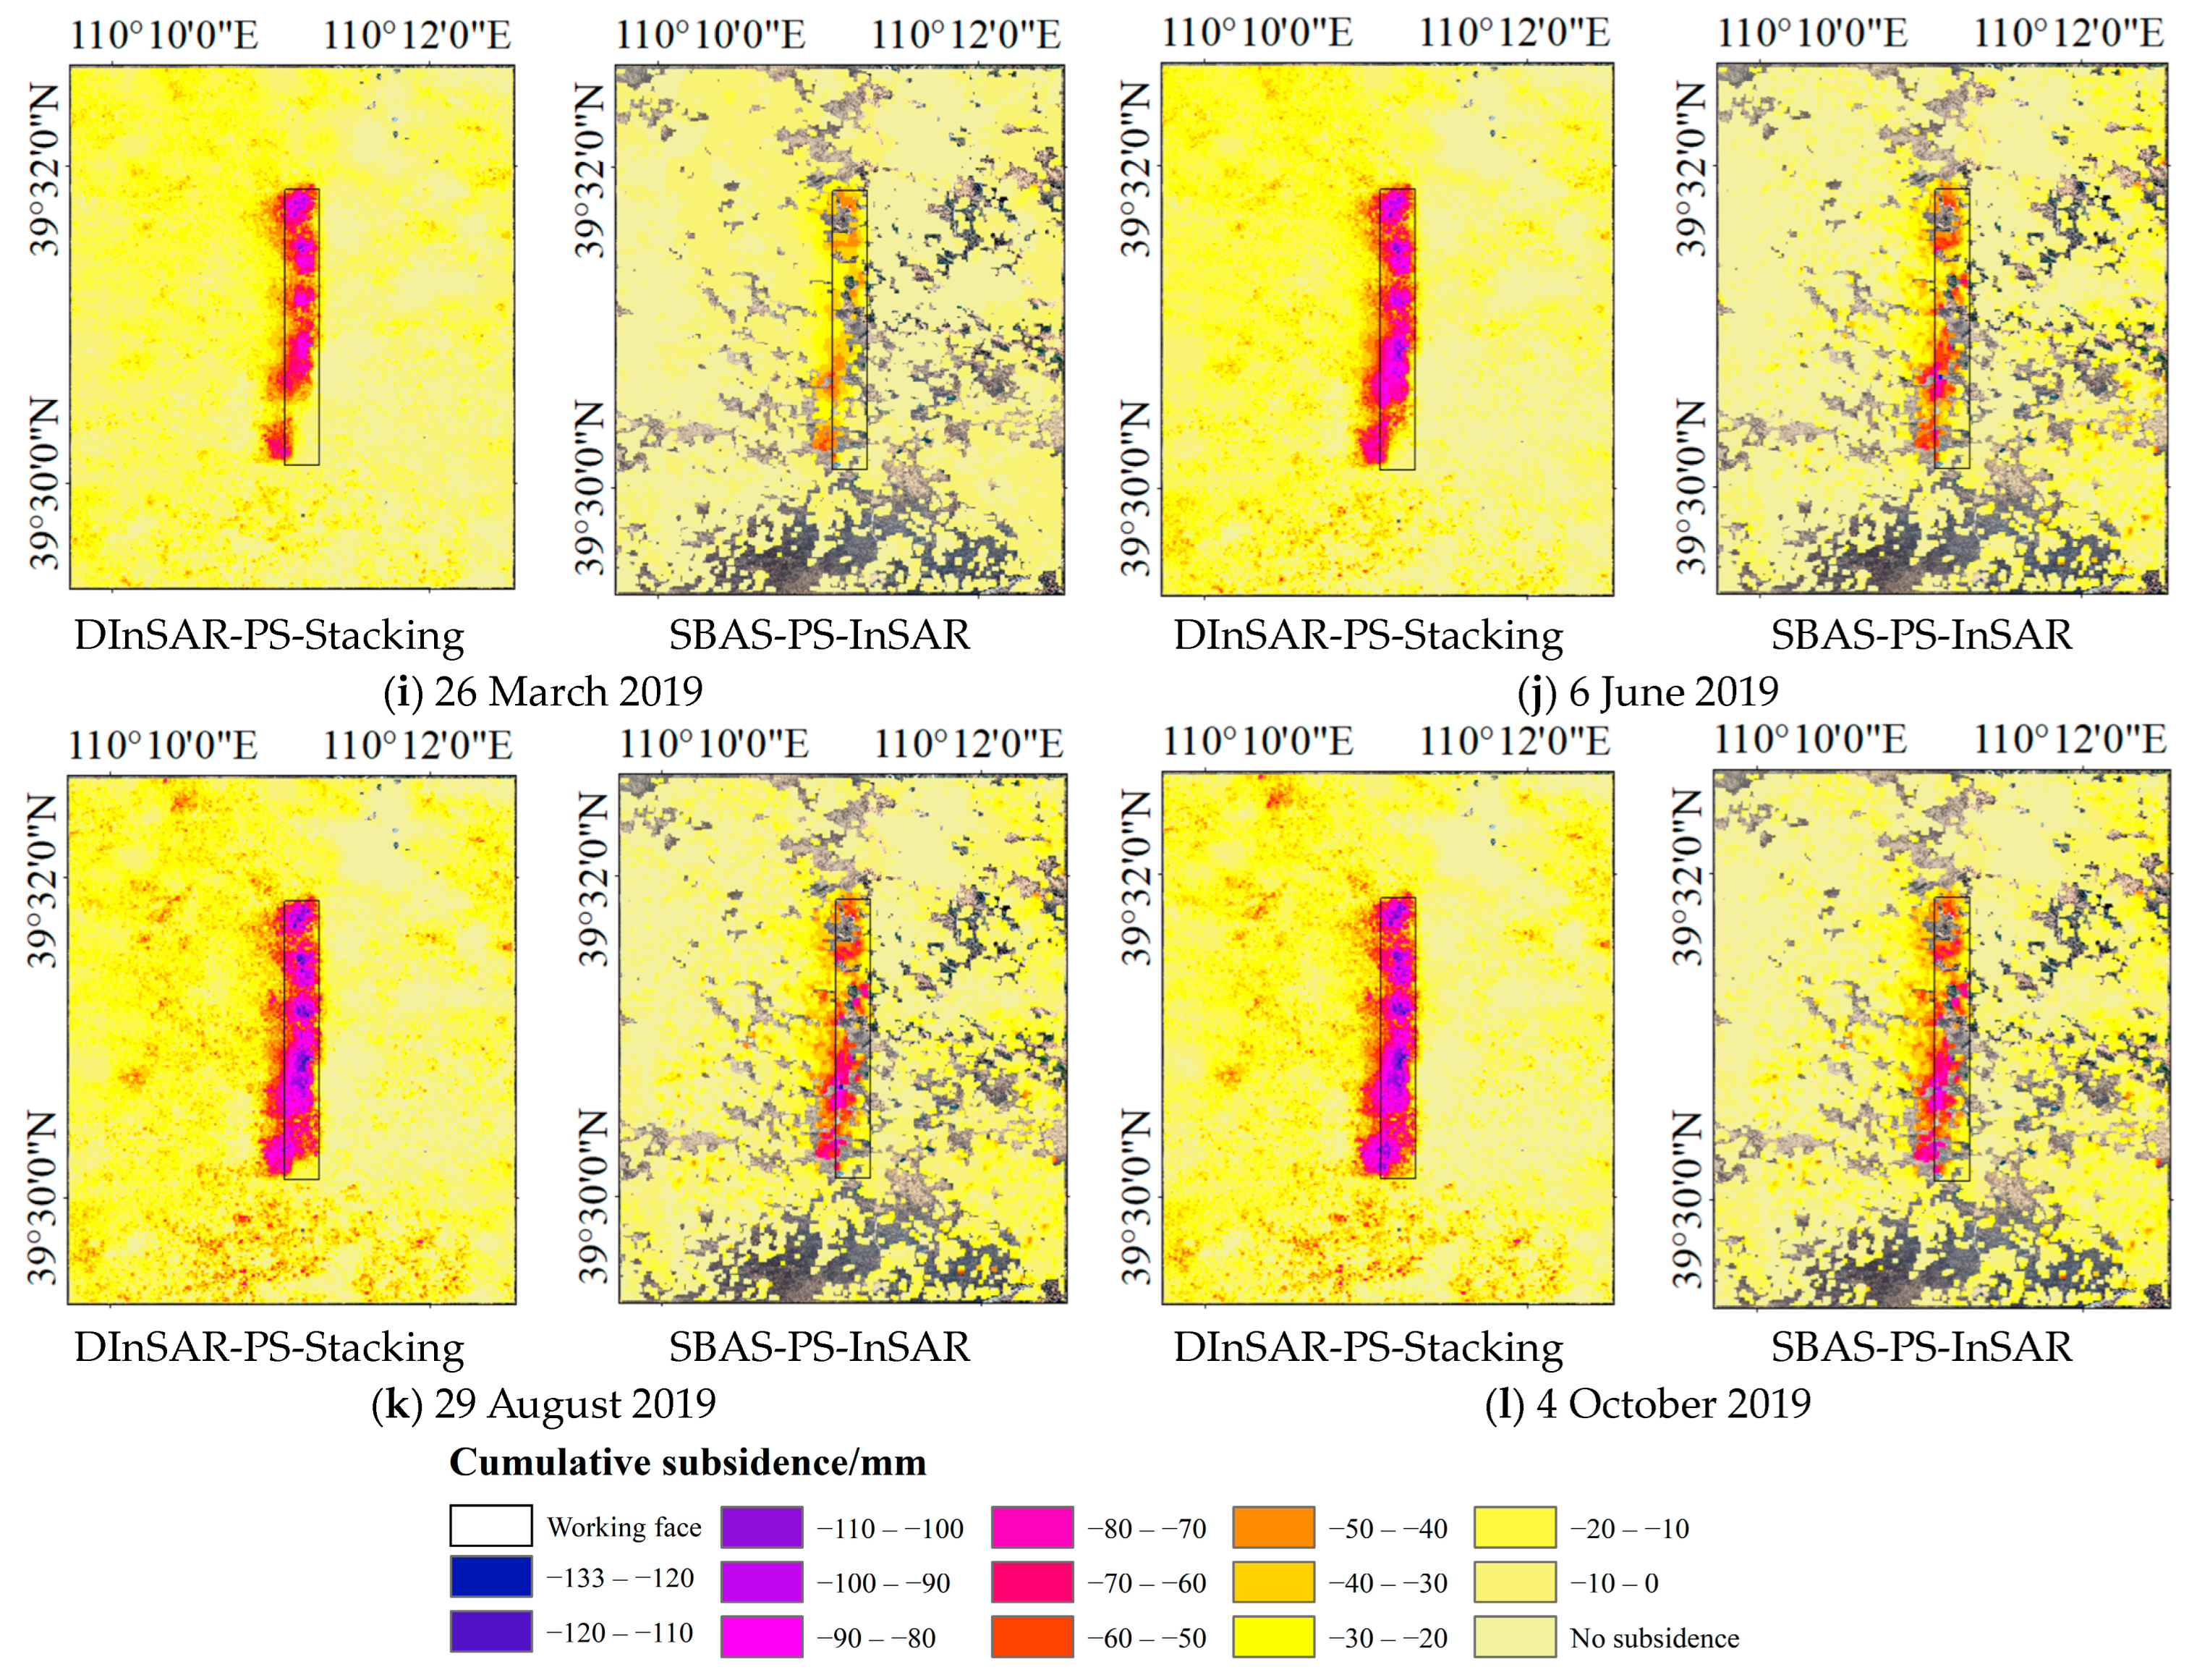
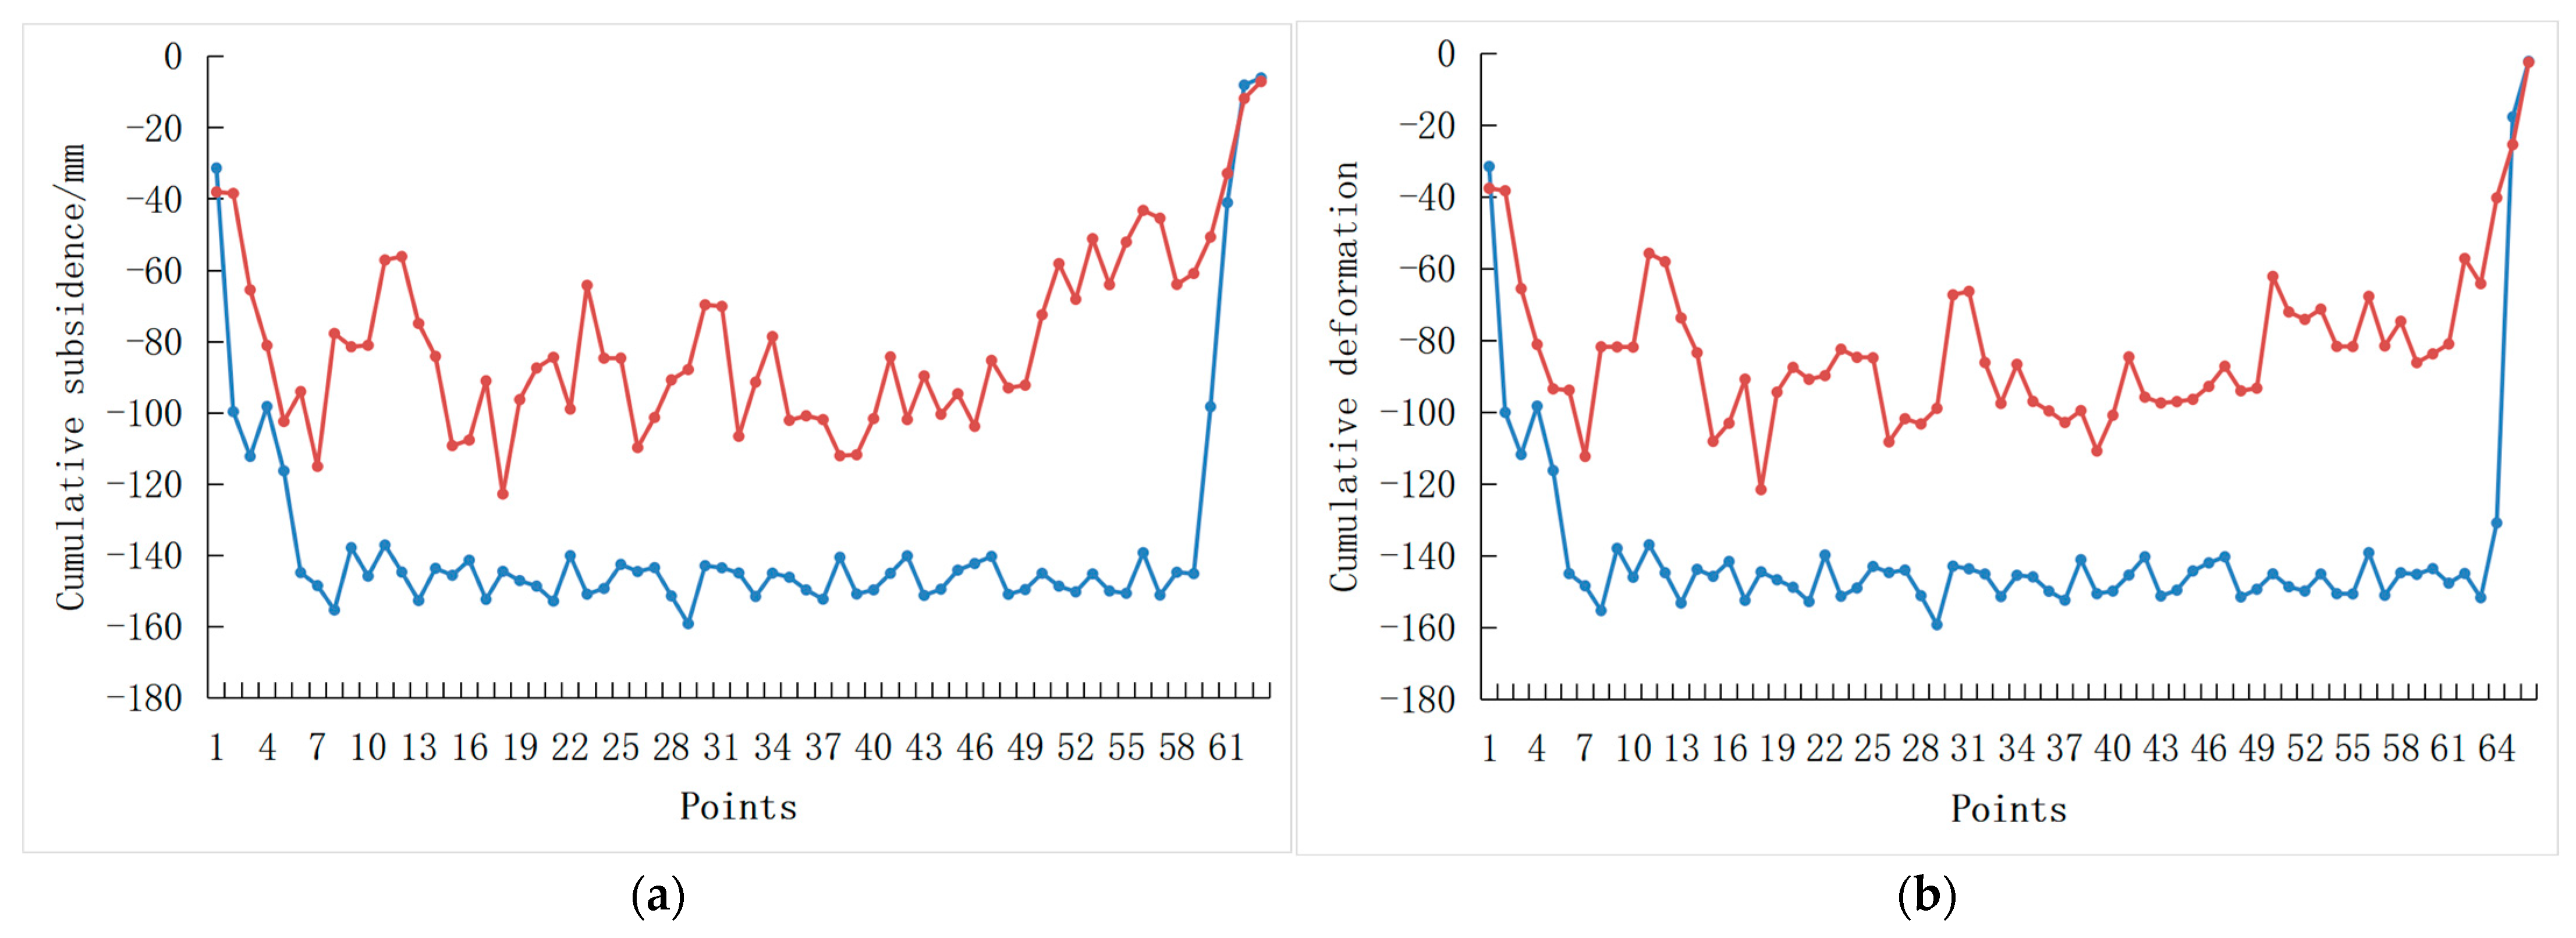
Underground coal mining leads to surface subsidence, which makes radar images partially incoherent. Especially in the area with large settlement, the settlement gradient was large and the decoherence was substantial. For the large subsidence area of the goaf, DInSAR-PS-Stacking was found to be more effective than SBAS-PS-InSAR according to the monitoring results. The SBAS-PS-InSAR method is more effective for monitoring slow and small deformations.

3.3. Deformation Fusion Monitoring and Analysis of DInSAR-PS-Stacking and SBAS-PS-InSAR

Comparison analysis of monitoring mining area subsidence using the DInSAR-PS-Stacking and SBAS-PS-InSAR methods. The DInSAR-PS-Stacking method performs better in areas with large subsidence, while the SBAS-PS-InSAR method is more effective in monitoring slow and small subsidence in the outer regions. Therefore, the cumulative subsidence maps obtained from the DInSAR-PS-Stacking and SBAS-PS-InSAR technologies are fused. The fused cumulative subsidence map combines the advantages of monitoring large subsidence areas using the DInSAR-PS-Stacking method and slow subsidence areas using the SBAS-PS-InSAR method. The fused cumulative subsidence map, as shown in Figure 8, is combined with the working face and goaf zone shown in Figure 1c. Overall, the fusion of these two InSAR methods is effective, especially in the subsidence area of the working face and goaf zone where the obvious subsidence trend can be observed, and the missing phenomenon is not serious. The fusion of these two InSAR methods compensates for the deformation loss of the large subsidence area in the mining area monitored by the SBAS-PS-InSAR method, and the slow subsidence edge can be effectively monitored using the SBAS-PS-InSAR method. The mining area is less affected by factors such as climate and roads, and the subsidence basin is mainly caused by underground coal mining. As the mining operation progresses, subsidence gradually occurs in the area of the working face, which spreads to the surrounding areas and deepens gradually, eventually becoming stable. This subsidence gradually forms a subsidence basin that eventually matches the actual location of the mining face. By fusing the DInSAR-PS-Stacking and SBAS-PS-InSAR methods to monitor mining area subsidence, their respective advantages can be fully utilized to complement each other, thereby improving the ability and effectiveness of monitoring mining area surface deformation.
The fusion monitoring results of DInSAR-PS-Stacking method and SBAS-PS-InSAR method are compared with GPS subsidence monitoring results. The distribution of GPS subsidence monitoring points is shown in Figure 1c, and there are 66 monitoring points from north to south. Figure 9 compares the fused cumulative subsidence results from the two InSAR methods with the GPS measurement monitoring results. In Figure 9, it is possible to observe the settlement of monitoring points oriented from north to south on the mining working face very well.
From Figure 9, it can be observed that there are obvious subsidence basins in the mining face from north to south, and the subsidence trend is basically the same. The settlement changes in the middle and front sections of Figure 9a,b are consistent. The settlement of the rear section in Figure 9b is larger than that in Figure 9a, and the position of the last inflection point in Figure 9b is later than that in Figure 9a. This indicates that most areas in the northern part of the mining working face had stabilized subsidence trends by 29 August 2019, while the southernmost part continued to subside until 4 October 2019, before stabilizing. The subsidence of the goaf area of the working face is mainly caused by large-scale coal mining. As the coal mining progresses, the subsidence basin becomes increasingly apparent, and the subsidence volume and subsidence area gradually increase, with steep and uneven subsidence edges. The average absolute errors of the cumulative subsidence at each point on the two subsidence curves in Figure 9a,b are 55.8 mm and 56.1 mm, respectively, and the root mean square errors are 60.8 mm and 59.3 mm, respectively. This method can effectively monitor subsidence and is consistent with the actual situation.
The mining of underground coal mines can cause movement in the surrounding and overlying strata of the goaf, resulting in deformation and destruction of the surface. The surface deformation information obtained by combining the two methods was analyzed, and the distribution of subsidence in the goaf of the mining face and its surroundings can be clearly seen. Combined with the above analysis, the mining face subsidence range and the coincidence level with the working face became more obvious, and the surface continued to sink; according to this trend, in the future, the area will continue to settle. The ground cracks were generally parallel to the boundary of the mined-out area. In the edge area of the subsidence funnel, the ground surface was greatly affected by tensile deformation, resulting in cracks. As shown in Figure 9, the edge of the subsidence funnel is slightly steep, and there is a high possibility of surface cracking. Therefore, preventive measures should be taken before these conditions deteriorate. During the coal mining process, more preventive measures should be taken to prevent large-scale collapse.

4. Discussion

The experimental results show that both the DInSAR-PS-Stacking and SBAS-PS-InSAR methods combine the PS-InSAR three-threshold selection method (the coherence coefficient threshold, amplitude dispersion index threshold, and deformation velocity interval) to select ground control points for orbit refinement and reinterferometric processing, solving the problem of manually selecting ground control points (GCPs) that affect monitoring results during orbit refinement and reinterferometric processing. They can effectively correct satellite orbits and phase offsets, reduce the influence of orbit errors, and improve deformation monitoring effectiveness.
Both the DInSAR-PS-Stacking and SBAS-PS-InSAR methods can be used as effective methods for real-time monitoring of subsidence caused by coal mining. Both methods can accurately monitor the location, extent, and spatio-temporal distribution of coal mining subsidence, with good correlation and consistency. The spatio-temporal subsidence trends monitored by both methods are consistent with the mining progress. It can be seen from Figure 6, Table 3 and Table 4, that the deformation error of the DInSAR-PS-Stacking and SBAS-PS-InSAR methods is smaller in the edge region of the subsidence basin and larger in the area with significant subsidence. In the edge region with less subsidence, both methods can reflect the spatio-temporal subsidence trends well, with SBAS-PS-InSAR having higher monitoring accuracy. In areas with greater subsidence, the DInSAR-PS-Stacking method can better monitor the spatio-temporal subsidence trends, with a subsidence monitoring error smaller than that of SBAS-PS-InSAR. However, the deformation results monitored by the SBAS-PS-InSAR method have some missing information, with slightly inferior monitoring capabilities in the subsidence center and the area with significant subsidence. Nevertheless, the SBAS-PS-InSAR method has higher monitoring accuracy in areas with smaller subsidence and is suitable for slow and small deformation monitoring.
In order to better monitor the surface deformation of the mining area, the above characteristics of DInSAR-PS-InSAR and SBAS-PS-InSAR for monitoring the surface deformation of the mining area are considered. The double thresholds (deformation threshold and average coherence threshold and deformation threshold) are extracted by OTSU threshold segmentation to fuse the simultaneous time-series deformation results monitored by the two InSAR methods. The fused deformation results combine the advantages of DInSAR-PS-InSAR’s effective monitoring of significant subsidence in large deformation areas and SBAS-PS-InSAR’s effective monitoring of slow and small subsidence in the subsidence edge area, thereby improving the accuracy and completeness of mining area surface deformation monitoring. By comparing and fusing the DInSAR-PS-Stacking and SBAS-PS-InSAR methods, mining area surface deformation can be monitored more effectively, and the problem of incomplete monitoring in some areas can be avoided. The comparison and fusion of these methods can quickly and effectively obtain the deformation distribution of the mining area and more accurate mining area deformation information, achieving more effective monitoring of mining area surface deformation. The results of the space–time analysis show that subsidence will continue to occur in this area, which needs to be further studied to form an integrated research system for subsidence monitoring and prediction in mining areas. This will help to provide early warnings before disasters occur and will also provide auxiliary decision support for safe production in mining areas.
The deformation results of the mining area monitored by this research method are good, but the monitoring accuracy is still affected by some error factors. In a follow-up study, DEM data with higher precision and sourced from closer to the mining period can be considered, and the atmospheric delay error can be corrected by using external meteorological data (such as GACOS data [62]) to improve the monitoring accuracy. Subsequently, the phase filtering and phase unwrapping algorithms can be optimized for the study area to improve the monitoring accuracy. This study has scientific guiding significance for rational mining planning, accident prevention and control, and disaster prediction.

5. Conclusions

Taking a mining area in the Inner Mongolia Autonomous Region of China as the research area, this study used the DInSAR-PS-Stacking and SBAS-PS-InSAR methods to monitor the surface deformation of the mining area and compared and analyzed the deformation results monitored by the DInSAR-PS-Stacking and SBAS-PS-InSAR methods. The deformation results monitored by the two InSAR methods were fused and the fused deformation results were analyzed. The following conclusions are drawn:
(1)
Both the DInSAR-PS-Stacking and SBAS-PS-InSAR methods can monitor the surface deformation of the mining area in real time and effectively, and can accurately monitor the location, range, and spatial and temporal distribution of coal mine subsidence.
(2)
There is a subsidence basin gradually expanding from north to south in the coal mining face, and the edge is steep, which can easily produce surface cracks. The change trend of the subsidence basin is obvious and consistent with the mining situation of the working face. Large-scale mining of underground coal mines is the main factor causing surface subsidence.
(3)
The DInSAR-PS-Stacking and SBAS-PS-InSAR methods are compared to better monitor the surface deformation of the mining area, effectively obtain the subsidence distribution of the mining area, and analyze the deformation of the coal mine goaf. The two InSAR methods have small deformation errors at the edge of the subsidence basin and large deformation errors in the large subsidence area. In contrast, the SBAS-PS-InSAR method performs better in monitoring slow and small deformation in the edge area of the subsidence basin. The DInSAR-PS-Stacking method is more effective in monitoring large deformation in large subsidence areas.
(4)
The surface deformation results monitored by the DInSAR-PS-Stacking and SBAS-PS-InSAR methods are fused, and the fused deformation monitoring results are better. The fused method improves the inaccuracy of the traditional single InSAR method used to monitor the mining area, reduces the error, and improves the accuracy and integrity of the mining area deformation monitoring. Furthermore, the fused method provides more comprehensive deformation information for the comprehensive management of mining subsidence and realizes the effective monitoring of surface deformation in mining areas.

Author Contributions

Conceptualization, Y.C. and X.D.; methodology, Y.C. and X.D.; data curation, Y.C., X.D., P.H. and W.S.; formal analysis, Y.C. and X.D.; investigation, Y.C., Y.Q. and X.L. (Xiujuan Li); visualization, Y.C. and X.D.; writing—original draft, Y.C. and X.D.; writing—review and editing, P.H., W.X. and W.T.; project administration, Y.C., P.H. and X.L. (Xiaolong Liu). All authors have read and agreed to the published version of the manuscript.

Funding

This research was funded by the National Natural Science Foundation of China, grant number 52064039; the Natural Science Foundation of Inner Mongolia Autonomous Region, grant numbers 2020ZD18 and 2021MS06004; the Science and technology planning project of Inner Mongolia Autonomous Region, grant numbers 2020GG0073 and 2019GG139; the Major Project of Science and Technology of Inner Mongolia Autonomous Region, grant number 2019ZD022; the Basic scientific research business expenses of colleges and universities directly under Inner Mongolia Autonomous Region, grant number JY20220134; the Scientific research project of Inner Mongolia University of Technology, grant numbers BS201945 and DC2000001249; and the Equipment Engineering Special Project of natural disaster prevention and control, grant number TC210H00L-49.

Data Availability Statement

Not applicable.

Acknowledgments

Many thanks to Inner Mongolia Key Laboratory of Radar Technology and Application for the great support. Thanks to anonymous reviewers for their constructive comments to improve the quality of this paper.

Conflicts of Interest

The authors declare no conflict of interest.

References

  1. Song, S.; Zhao, M.; Zhu, C.; Wang, F.; Cao, C.; Li, H.; Ma, M. Identification of the potential critical slip surface for fractured rock slope using the FLOYD algorithm. Remote Sens. 2022, 14, 1284. [Google Scholar] [CrossRef]
  2. Meng, X. Application of InSAR Technology in Deformation Monitoring of Hancheng Mining Area. Master’s Thesis, Xi’An University of Science and Technology, Xi’an, China, 2019. [Google Scholar]
  3. Dong, M.; Zhang, F.; Lv, J.; Hu, M.; Li, Z. Study on deformation and failure law of soft-hard rock interbedding toppling slope base on similar test. Bull. Eng. Geol. Environ. 2020, 79, 4625–4637. [Google Scholar] [CrossRef]
  4. Tao, Z.; Geng, Q.; Zhu, C.; He, M.; Cai, H.; Pang, S.; Meng, X. The mechanical mechanisms of large-scale toppling failure for counter-inclined rock slopes. J. Geophys. Eng. 2019, 16, 541–558. [Google Scholar] [CrossRef]
  5. Dong, M.; Zhang, F.; Hu, M.; Liu, C. Study on the influence of anchorage angle on the anchorage effect of soft-hard interbedded toppling deformed rock mass. KSCE J. Civ. Eng. 2020, 24, 2382–2392. [Google Scholar] [CrossRef]
  6. Ma, S.; Qiu, H.; Yang, D.; Wang, J.; Zhu, Y.; Tang, B.; Sun, K.; Cao, M. Surface multi-hazard effect of underground coal mining. Landslides 2023, 20, 39–52. [Google Scholar] [CrossRef]
  7. Yang, D.; Qiu, H.; Ma, S.; Liu, Z.; Du, C.; Zhu, Y.; Cao, M. Slow surface subsidence and its impact on shallow loess landslides in a coal mining area. Catena 2022, 209, 105830. [Google Scholar] [CrossRef]
  8. Ma, S.; Qiu, H.; Zhu, Y.; Yang, D.; Tang, B.; Wang, D.; Wang, L.; Cao, M. Topographic Changes, Surface Deformation and Movement Process before, during and after a Rotational Landslide. Remote Sens. 2023, 15, 662. [Google Scholar] [CrossRef]
  9. Deng, Y. Monitoring and Forecasting of Surface subsidence in Mining Area Based on InSAR Technology. Master’s Thesis, East China University of Technology, Nanchang, China, 2017. [Google Scholar]
  10. Zhang, X.; Zhu, C.; He, M.; Dong, M.; Zhang, G.; Zhang, F. Failure mechanism and long short-term memory neural network model for landslide risk prediction. Remote Sens. 2022, 14, 166. [Google Scholar] [CrossRef]
  11. Bamler, R.; Hartl, P. Synthetic aperture radar interferometry. Inverse Probl. 1998, 14, R1. [Google Scholar] [CrossRef]
  12. Massonnet, D.; Feigl, K.L. Radar interferometry and its application to changes in the Earth’s surface. Rev. Geophys. 1998, 36, 441–500. [Google Scholar] [CrossRef]
  13. Hooper, A. A multi-temporal InSAR method incorporating both persistent scatterer and small baseline approaches. Geophys. Res. Lett. 2008, 35, L16302. [Google Scholar] [CrossRef]
  14. Osmanoğlu, B.; Sunar, F.; Wdowinski, S.; Cabral-Cano, E. Time series analysis of InSAR data: Methods and trends. ISPRS J. Photogramm. Remote Sens. 2016, 115, 90–102. [Google Scholar] [CrossRef]
  15. Ma, C.; Cheng, X.; Yang, Y.; Zhang, X.; Guo, Z.; Zou, Y. Investigation on Mining Subsidence Based on Multi-Temporal InSAR and Time-Series Analysis of the Small Baseline Subset—Case Study of Working Faces 22201-1/2 in Bu’ertai Mine, Shendong Coalfield, China. Remote Sens. 2016, 8, 951. [Google Scholar] [CrossRef]
  16. Zhu, J.; Li, Z.; Hu, J. Research progress and methods of InSAR for deformation monitoring. Acta Geod. Cartogr. Sin. 2017, 46, 1717. [Google Scholar]
  17. Gabriel, A.K.; Goldstein, R.M.; Zebker, H.A. Mapping small elevation changes over large areas: Differential radar interferometry. J. Geophys. Res. Solid Earth 1989, 94, 9183–9191. [Google Scholar] [CrossRef]
  18. Xiao, Y.; Zhao, P.; Fan, Z.; Chen, G. Applicantion of TerraSAR-X Data for Subsidence Monitoring in Huainan Mining Area. Remote Sens. Technol. Appl. 2017, 32, 95–103. [Google Scholar]
  19. Pawluszek-Filipiak, K.; Borkowski, A. Mining-induced tremors in the light of deformations estimated by satellite SAR interferometry in the Upper Silesian Coal Basin, Poland. Procedia Comput. Sci. 2021, 181, 685–692. [Google Scholar] [CrossRef]
  20. Berardino, P.; Fornaro, G.; Lanari, R.; Sansosti, E. A new algorithm for surface deformation monitoring based on small baseline differential SAR interferograms. IEEE Trans. Geosci. Remote Sens. 2002, 40, 2375–2383. [Google Scholar] [CrossRef]
  21. Lanari, R.; Mora, O.; Manunta, M.; Mallorquí, J.J.; Berardino, P.; Sansosti, E. A small-baseline approach for investigating deformations on full-resolution differential SAR interferograms. IEEE Trans. Geosci. Remote Sens. 2004, 42, 1377–1386. [Google Scholar] [CrossRef]
  22. Darvishi, M.; Destouni, G.; Aminjafari, S.; Jaramillo, F. Multi-Sensor InSAR Assessment of Ground Deformations around Lake Mead and Its Relation to Water Level Changes. Remote Sens. 2021, 13, 406. [Google Scholar] [CrossRef]
  23. Li, S.; Xu, W.; Li, Z. Review of the SBAS InSAR Time-series algorithms, applications, and challenges. Geod. Geodyn. 2022, 13, 114–126. [Google Scholar] [CrossRef]
  24. Sandwell, D.T.; Price, E.J. Phase gradient approach to stacking interferograms. J. Geophys. Res. Solid Earth 1998, 103, 30183–30204. [Google Scholar] [CrossRef]
  25. Dai, K.; Liu, G.; Li, Z.; Ma, D.; Wang, X.; Zhang, B.; Tang, J.; Li, G. Monitoring Highway Stability in Permafrost Regions with X-band Temporary Scatterers Stacking InSAR. Sensors 2018, 18, 1876. [Google Scholar] [CrossRef] [PubMed]
  26. Liu, B.; Ge, D.; Wang, S.; Li, M.; Zhang, L.; Wang, Y.; Wu, Q. Combining Application of TOPS and ScanSAR InSAR In Large-Scale Geohazards Identification. Geomat. Inf. Sci. Wuhan Univ. 2020, 45, 1756–1762. [Google Scholar]
  27. Dong, J.; Ma, Z.; Liang, J.; Liu, B.; Zhao, C.; Zeng, S.; Yan, S.; Ma, X. A comparative study of the identification of hidden landslide hazards based on time series InSAR techniques. Remote Sens. Nat. Resour. 2022, 34, 73–81. [Google Scholar]
  28. Xu, Y.; Li, T.; Tang, X.; Zhang, X.; Fan, H.; Wang, Y. Research on the Applicability of DInSAR, Stacking-InSAR and SBAS-InSAR for Mining Region Subsidence Detection in the Datong Coalfield. Remote Sens. 2022, 14, 3314. [Google Scholar] [CrossRef]
  29. Ferretti, A.; Prati, C.; Rocca, F. Permanent scatterers in SAR interferometry. IEEE Trans. Geosci. Remote Sens. 2001, 39, 8–20. [Google Scholar] [CrossRef]
  30. Li, D.; Liao, M.; Wang, Y. Progress of Permanent Scatterer Interferometry. Geomat. Inf. Sci. Wuhan Univ. 2004, 29, 664–668. [Google Scholar]
  31. Hooper, A.; Zebker, H.; Segall, P.; Kampes, B. A new method for measuring deformation on volcanoes and other natural terrains using InSAR persistent scatterers. Geophys. Res. Lett. 2004, 31, L23611. [Google Scholar] [CrossRef]
  32. Hooper, A.; Segall, P.; Zebker, H. Persistent scatterer interferometric synthetic aperture radar for crustal deformation analysis, with application to Volcán Alcedo, Galápagos. J. Geophys. Res. Solid Earth 2007, 112, B07407. [Google Scholar] [CrossRef]
  33. Guo, S.; Hou, H.; Zhang, S.; Xu, Y.; Yang, Y. Surface deformation monitoring of the mining area in Loess Plateau based on D-InSAR. Sci. Surv. Mapp. 2017, 42, 207–212. [Google Scholar]
  34. Xia, Y.; Wang, Y.; Du, S.; Liu, X.; Zhou, H. Integration of D-InSAR and GIS technology for identifying illegal underground mining in Yangquan District, Shanxi Province, China. Environ. Earth Sci. 2018, 77, 319. [Google Scholar] [CrossRef]
  35. Li, D.; Deng, K.; Gao, X.; Niu, H. Monitoring and Analysis of Surface in Mining Area Based on SBAS-InSAR. Geomat. Inf. Sci. Wuhan Univ. 2018, 43, 1531–1537. [Google Scholar]
  36. Ma, F. Research on InSAR Monitoring and Prediction Method of Mining Subsidence. Ph.D. Thesis, Chang’an University, Xi’an, China, 2020. [Google Scholar]
  37. Pawluszek-Filipiak, K.; Borkowski, A. Integration of DInSAR and SBAS Techniques to Determine Mining-Related Deformations Using Sentinel-1 Data: The Case Study of Rydułtowy Mine in Poland. Remote Sens. 2020, 12, 242. [Google Scholar] [CrossRef]
  38. Zhang, P.; Guo, Z.; Guo, S.; Xia, J. Land Subsidence Monitoring Method in Regions of Variable Radar Reflection Characteristics by Integrating PS-InSAR and SBAS-InSAR Techniques. Remote Sens. 2022, 14, 3265. [Google Scholar] [CrossRef]
  39. Zhang, L.; Dai, K.; Deng, J.; Ge, D.; Liang, R.; Li, W.; Xu, Q. Identifying Potential Landslides by Stacking-InSAR in Southwestern China and Its Performance Comparison with SBAS-InSAR. Remote Sens. 2021, 13, 3662. [Google Scholar] [CrossRef]
  40. Wei, J.; Zhang, H.; Bai, Z.; Wang, S. Integrated Monitoring Method of the Mining subsidence of Shendong Mining Area based on D-InSAR and PS-InSAR Technology. Met. Mine 2019, 10, 55–60. [Google Scholar]
  41. Ou, D.; Tan, K.; Du, Q.; Chen, Y.; Ding, J. Decision Fusion of D-InSAR and Pixel Offset Tracking for Coal Mining Deformation Monitoring. Remote Sens. 2018, 10, 1055. [Google Scholar] [CrossRef]
  42. Luo, X.; Xiang, X.; Lyu, Y. PS corrrection of InSAR time series deformation monitoring for a certain collapse in Longli County. Remote Sens. Nat. Resour. 2022, 34, 82–87. [Google Scholar]
  43. Wang, S.; Lu, X.; Liu, X.; Fu, S. A SBAS InSAR time series ground deformation extraction approach considering permanent scatterers. Bull. Surv. Mapp. 2019, 2, 58–62+70. [Google Scholar]
  44. Otsu, N. A threshold selection method from gray-level histograms. IEEE Trans. Syst. Man Cybern. 1979, 9, 62–66. [Google Scholar] [CrossRef]
  45. Snoeij, P.; Attema, E.; Davidson, M.; Duesmann, B.; Floury, N.; Levrini, G.; Rommen, B.; Rosich, B. The Sentinel-1 radar mission: Status and performance. In Proceedings of the 2009 International Radar Conference Surveillance for a Safer World (RADAR 2009), Bordeaux, France, 12–16 October 2009. [Google Scholar]
  46. Li, P.; Li, Z.; Shi, C.; Liu, J. Quality evaluation of 1 arc second version SRTM DEM in China. Bull. Surv. Mapp. 2016, 9, 24–28. [Google Scholar]
  47. Nie, Y.; Xiong, J.; Cheng, P.; Luo, Y. SBAS surface deformation monitoring with PS feature points. Bull. Surv. Mapp. 2022, 4, 91–95. [Google Scholar]
  48. Pan, J.; Deng, F.; Xu, Z.; Xiang, Q.; Tu, W.; Fu, Z. Time series InSAR surface deformation monitoring in extremely difficult area based on track refining control points selection. Chin. J. Geol. Hazard Control 2021, 32, 98–104. [Google Scholar]
  49. Li, N.; Wu, J. Research on methods of high coherent target extraction in urban area based on PSINSAR technology. Int. Arch. Photogramm. Remote Sens. Spat. Inf. Sci. 2018, 42, 901–908. [Google Scholar] [CrossRef]
  50. Ferretti, A.; Prati, C.; Rocca, F. Analysis of Permanent Scatterers in SAR interferometry. In Proceedings of the (IGARSS 2000) IEEE 2000 International Geoscience and Remote Sensing Symposium—Taking the Pulse of the Planet: The Role of Remote Sensing in Managing the Environment, Honolulu, HI, USA, 24–28 July 2000; IEEE: Piscataway, NJ, USA, 2000; Volume 2, pp. 761–763. [Google Scholar]
  51. Mao, Q. Research on Ground Deformation Detection Based on SBAS-InSAR Technology. Master’s Thesis, Xidian University, Xi’an, China, 2019. [Google Scholar]
  52. Li, D.; Hou, X. A case study of how to measure surface deformation using Sentinel-1A data. Bull. Surv. Mapp. 2020, 3, 118–122. [Google Scholar]
  53. Tong, Y.; Huang, Y.; Chen, Y.; Tan, K.; Ou, D.; Han, F. Surface subsidence monitoring and spatio-temporal analysis in mining area based on D-InSAR. Sci. Surv. Mapp. 2020, 45, 67–73. [Google Scholar]
  54. Cao, F.; Liao, W. Application of SBAS technology in ground subsidence monitoring of mining area. Bull. Surv. Mapp. 2020, 3, 156–158+163. [Google Scholar]
  55. Wang, J. Study on the Key Technology and Applications of the Small Baseline Subset Time Series in SAR Technology for Surface Deformation Inversion. Ph.D. Thesis, University of Chinese Academy of Sciences, Beijing, China, 2019. [Google Scholar]
  56. Wang, Z.; Ren, J.; You, H.; Liu, J.; Wang, L. Application of InSAR technology combined with probability integral method in deformation monitoring of mining area periphery. Sci. Surv. Mapp. 2022, 47, 84–94. [Google Scholar]
  57. An, B.; Luo, H.; Ding, H.; Zhang, Z.; Wang, W.; Shi, X.; Ke, F.; Wang, M. Monitoring of Surface Deformation in Xining based on SBAS-InSAR. Remote Sens. Technol. Appl. 2021, 36, 838–846. [Google Scholar]
  58. Du, Q.; Li, G.; Zhou, Y.; Chai, M.; Chen, D.; Qi, S.; Wu, G. Deformation Monitoring in an Alpine Mining Area in the Tianshan Mountains Based on SBAS-InSAR Technology. Adv. Mater. Sci. Eng. 2021, 2021, 9988017. [Google Scholar] [CrossRef]
  59. Huang, J.; Guo, Y.; Luo, W. Monitoring land subsidence in Wuhan city based on Sentinel-1. Bull. Surv. Mapp. 2021, 9, 53–58. [Google Scholar]
  60. Chen, Y.; Yu, S.; Tao, Q.; Liu, G.; Wang, L.; Wang, F. Accuracy Verification and Correction of D-InSAR and SBAS-InSAR in Monitoring Mining Surface Subsidence. Remote Sens. 2021, 13, 4365. [Google Scholar] [CrossRef]
  61. Liu, X.; Tao, Q.; Niu, C.; Li, B.; Zhang, Y.; Ren, Y. Comparative analysis and verification of DInSAR and SBAS InSAR in mining subsidence monitoring. Prog. Geophys. 2022, 37, 1825–1833. [Google Scholar]
  62. Li, Z.; Cao, Y.; Wei, J.; Duan, M.; Wu, L.; Hou, J.; Zhu, J. Time-series InSAR ground deformation monitoring: Atmospheric delay modeling and estimating. Earth-Sci. Rev. 2019, 192, 258–284. [Google Scholar] [CrossRef]
Figure 1. Geographical location and scope of the mining area: (a) location of the mining area, (b) regional location of mining area, (c) and location of the working face and monitoring points.
Remotesensing 15 02691 g001
Figure 2. Technical flow chart.
Remotesensing 15 02691 g002
Figure 3. Differential interferogram and unwrapped phase diagram after refinement and re-flattening.
Remotesensing 15 02691 g003aRemotesensing 15 02691 g003b
Figure 4. The average subsidence velocity of the mining area monitored using SBAS-PS-InSAR.
Remotesensing 15 02691 g004
Figure 5. Comparison of the cumulative subsidence monitored using DInSAR-PS-Stacking and SBAS-PS-InSAR in the same period.
Remotesensing 15 02691 g005aRemotesensing 15 02691 g005b
Figure 6. Results and comparison of time-series subsidence points monitored using DInSAR-PS-Stacking and SBAS-PS-InSAR: (a) point 1, (b) point 6, (c) point 12, and (d) point 22.
Remotesensing 15 02691 g006
Figure 7. Comparing the correlation diagrams of settlement curves measured by DInSAR-PS-Stacking, SBAS-PS-InSAR, and GPS: (a) point 1, (b) point 6, (c) point 11, and (d) point 22.
Remotesensing 15 02691 g007aRemotesensing 15 02691 g007b
Figure 8. The cumulative subsidence maps after the fusion of DInSAR-PS-Stacking and SBAS-PS-InSAR.
Remotesensing 15 02691 g008
Figure 9. Comparison between the fusion results of the two InSAR methods and GPS monitoring results: (a) 29 August 2019 and (b) 4 October 2019.
Remotesensing 15 02691 g009
Table 1. The parameters of the Sentinel-1A images.
NoImage DataOrbitNoImage DataOrbitNoImage DataOrbit
16 January 20180200331922 August 20180233583726 March 2019026508
230 January 2018020383203 September 2018023533387 April 2019026683
311 February 20180205582115 September 20180237083919 April 2019026858
423 February 20180207332227 September 2018023883401 May 2019027033
57 March 2018020908239 October 20180240584113 May 2019027208
619 March 20180210832421 October 2018024233426 June 2019027558
731 March 2018021258252 November 20180244084318 June 2019027733
812 April 20180214332614 November 20180245834430 June 2019027908
924 April 20180216082726 November 20180247584512 July 2019028083
106 May 2018021783288 December 20180249334624 July 2019028258
1118 May 20180219582920 December 2018025108475 August 2019028433
1230 May 2018022133301 January 20190252834817 August 2019028608
1311 June 20180223083113 January 20190254584929 August 2019028783
1423 June 20180224833225 January 20190256335010 September 2019028958
155 July 2018022658336 February 20190258085122 September 2019029133
1617 July 20180228333418 February 2019025983524 October 2019029308
1729 July 2018023008352 March 2019026158
1810 August 20180231833614 March 2019026333
Table 2. Main parameters of the Sentinel-1A data used in this study.
ParameterValue
Pass directionAscending
Beam modeIW
PolarizationVV
Wave bandC
Wavelength/cm5.6
Number of images52
Monitored period6 January 2018–4 October 2019
Table 3. Comparison and verification of DInSAR-PS-Stacking time series settlement results and GPS monitoring results.
Monitoring PointsCorrelation Coefficient (Pearson)Mean Absolute Error (MAE)/mmRoot Mean Square Error (RMSE)/mm
10.973512.213.9
60.963747.252.2
120.956841.951.0
220.985832.142.3
Table 4. Comparison and verification of SBAS-PS-InSAR time-series settlement results and GPS monitoring results.
Monitoring PointsCorrelation Coefficient (Pearson)Mean Absolute Error (MAE)/mmRoot Mean Square Error (RMSE)/mm
10.96983.23.8
60.859574.582.6
120.912059.972.4
220.913562.083.9
Disclaimer/Publisher’s Note: The statements, opinions and data contained in all publications are solely those of the individual author(s) and contributor(s) and not of MDPI and/or the editor(s). MDPI and/or the editor(s) disclaim responsibility for any injury to people or property resulting from any ideas, methods, instructions or products referred to in the content.

