


Landslides Triggered by the 2016 Heavy Rainfall Event in Sanming, Fujian Province: Distribution Pattern Analysis and Spatio-Temporal Susceptibility Assessment


Abstract
:
1. Introduction
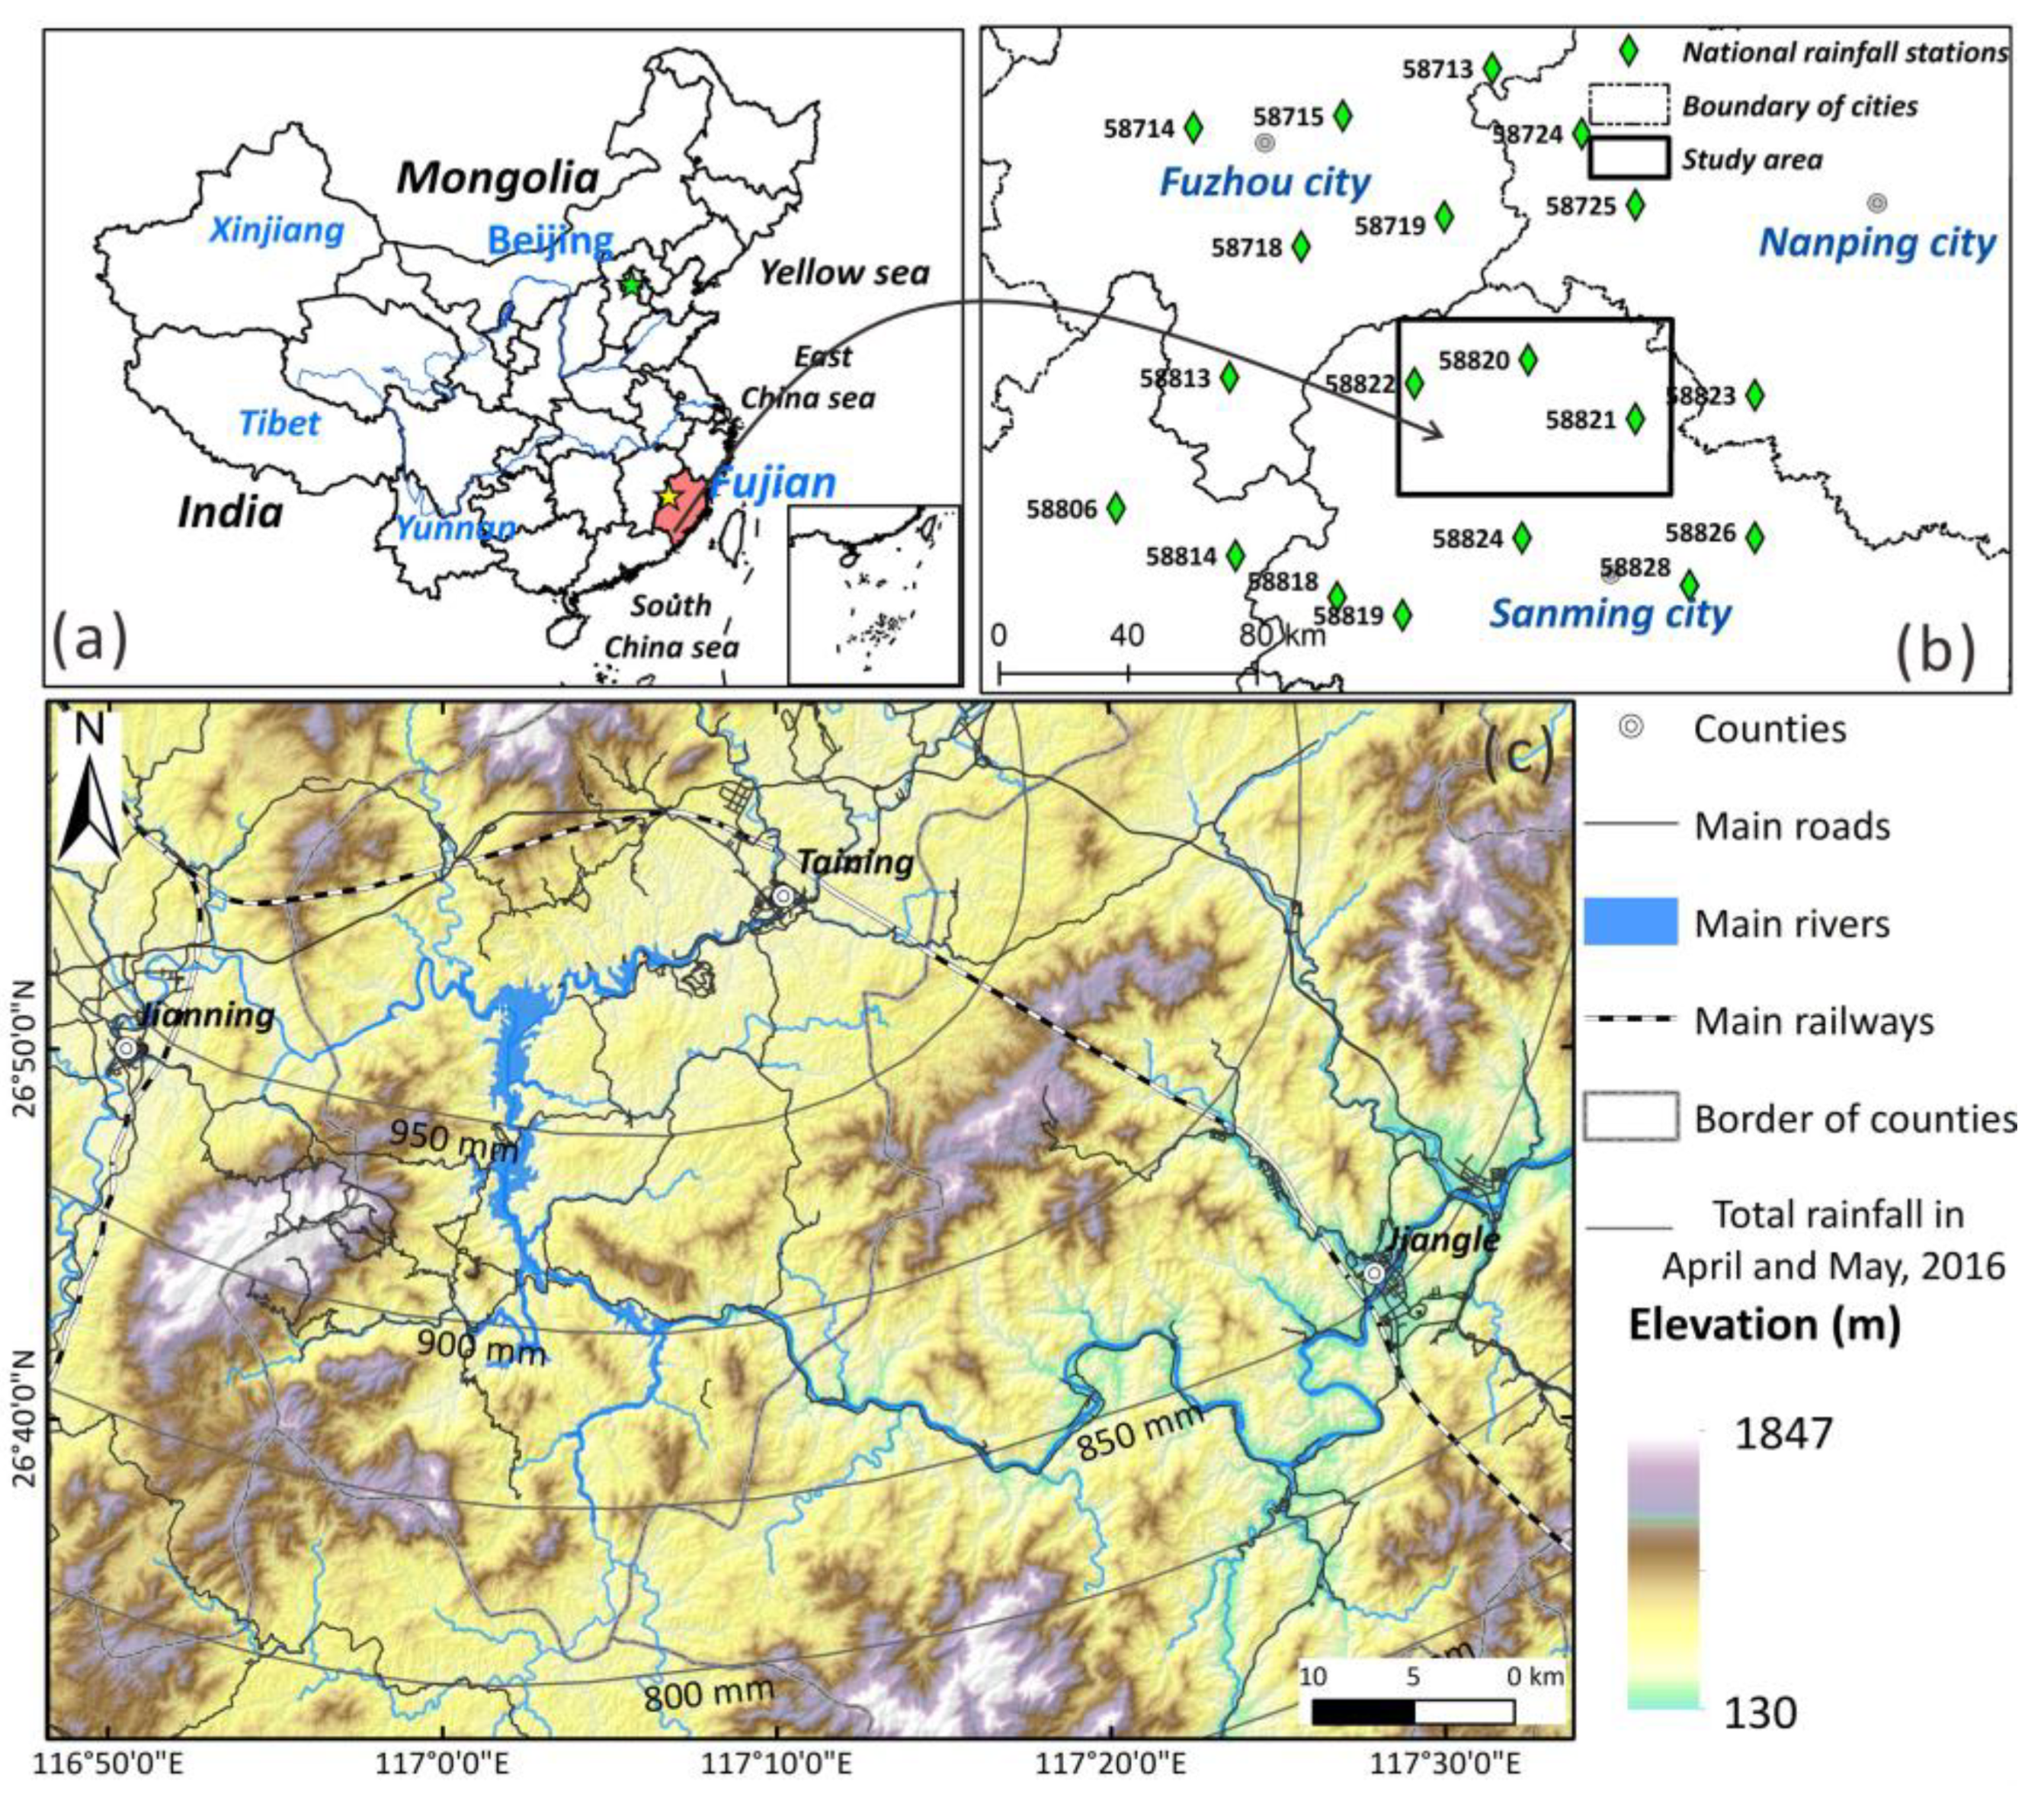
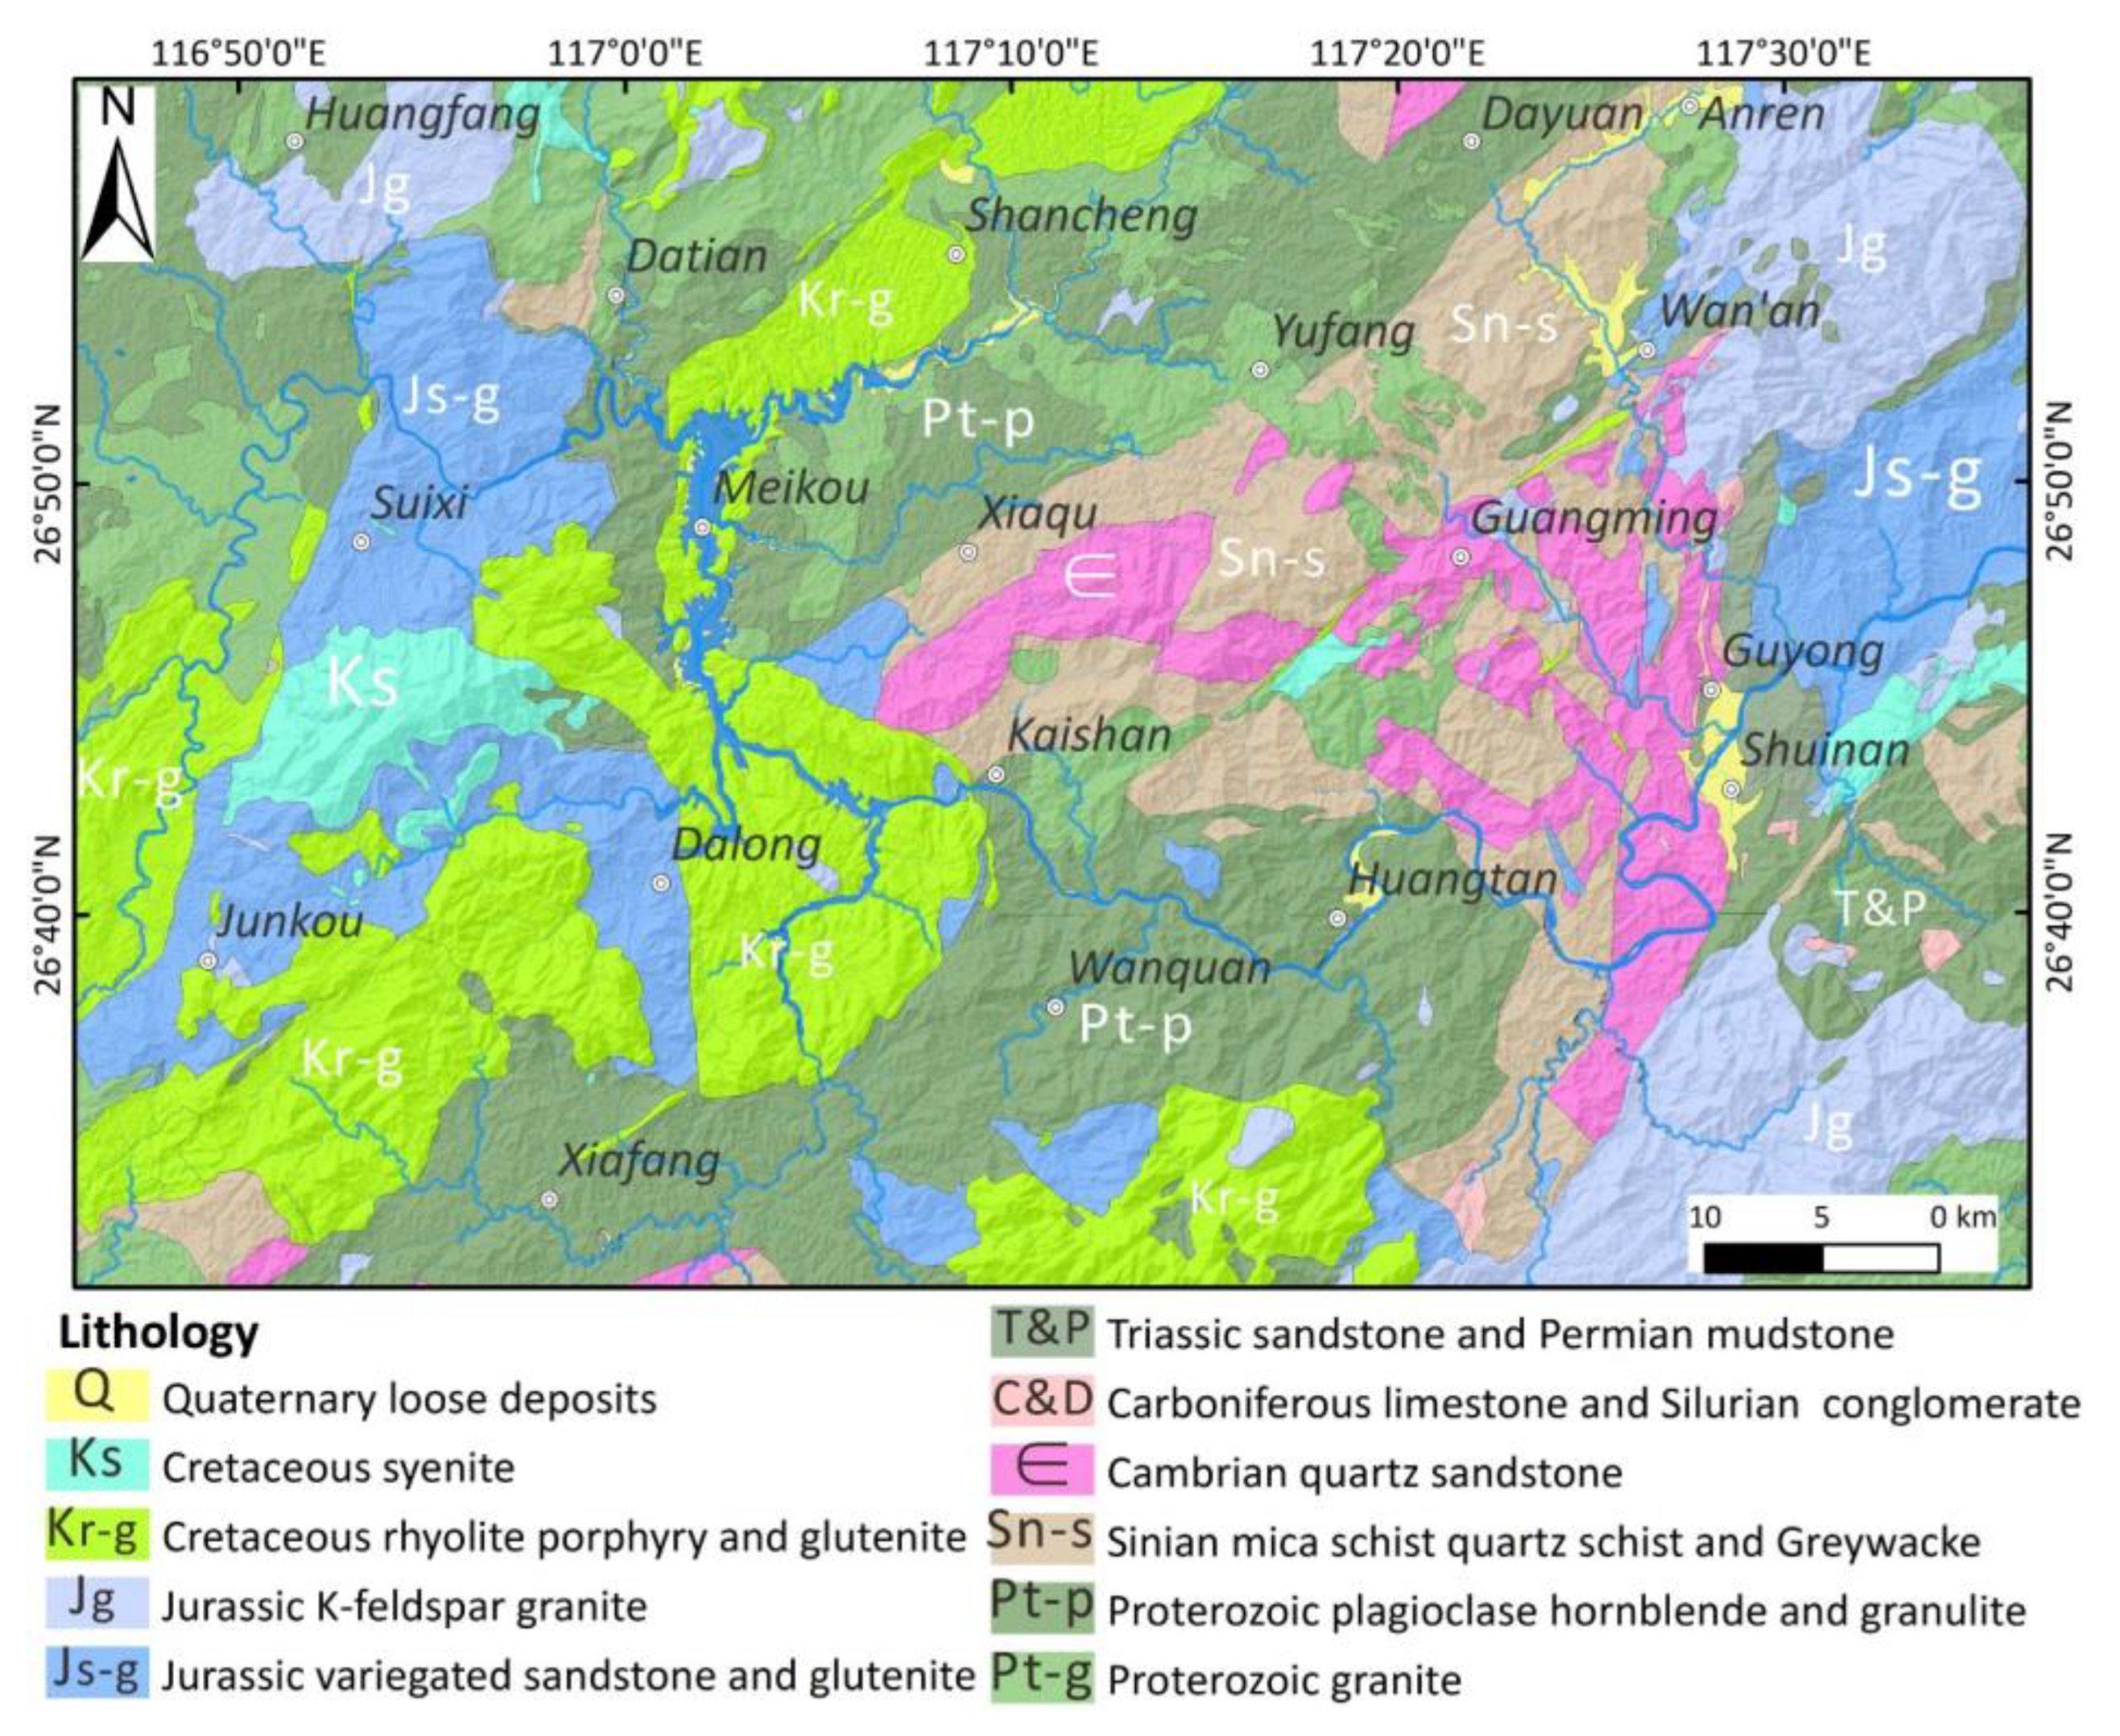
2. Study Area
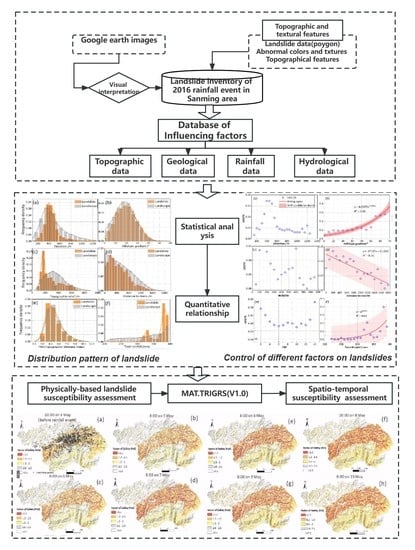
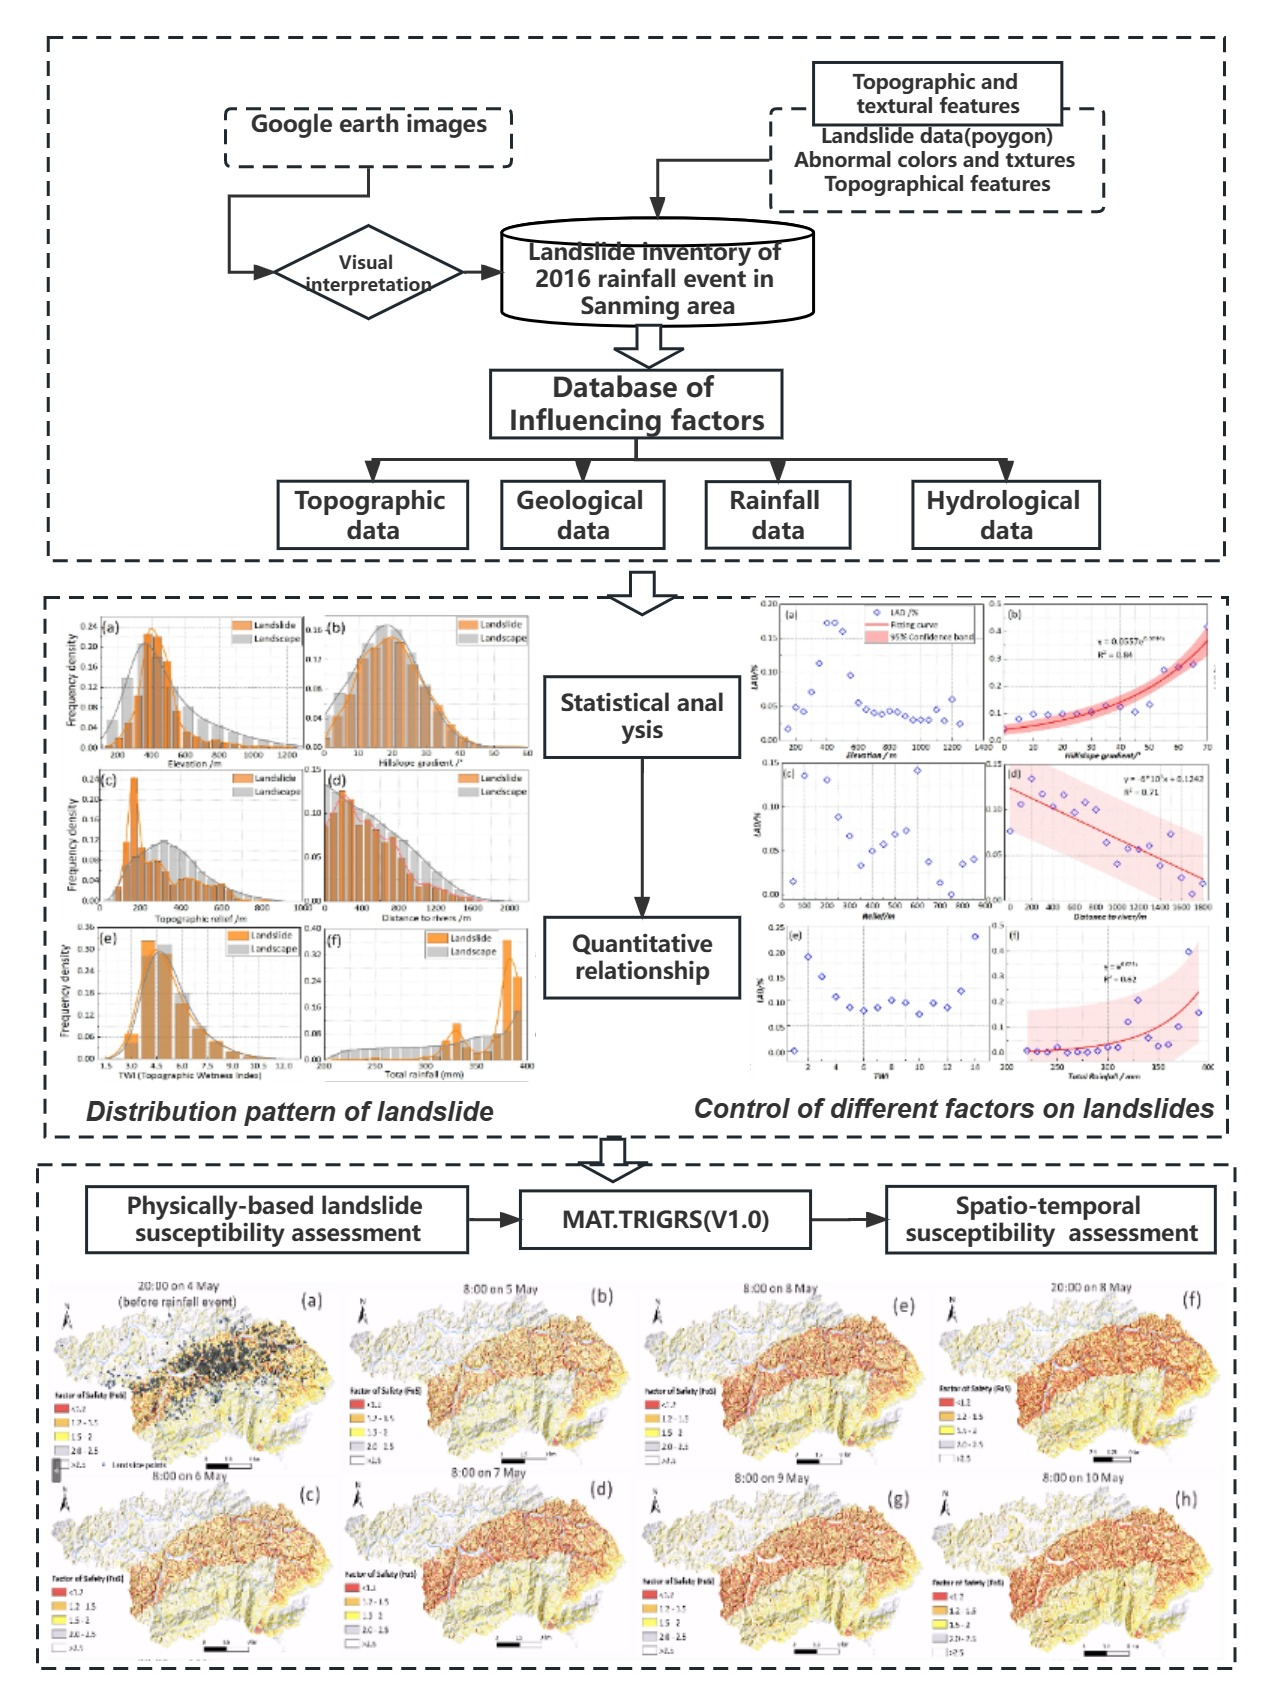
3. Data and Methods
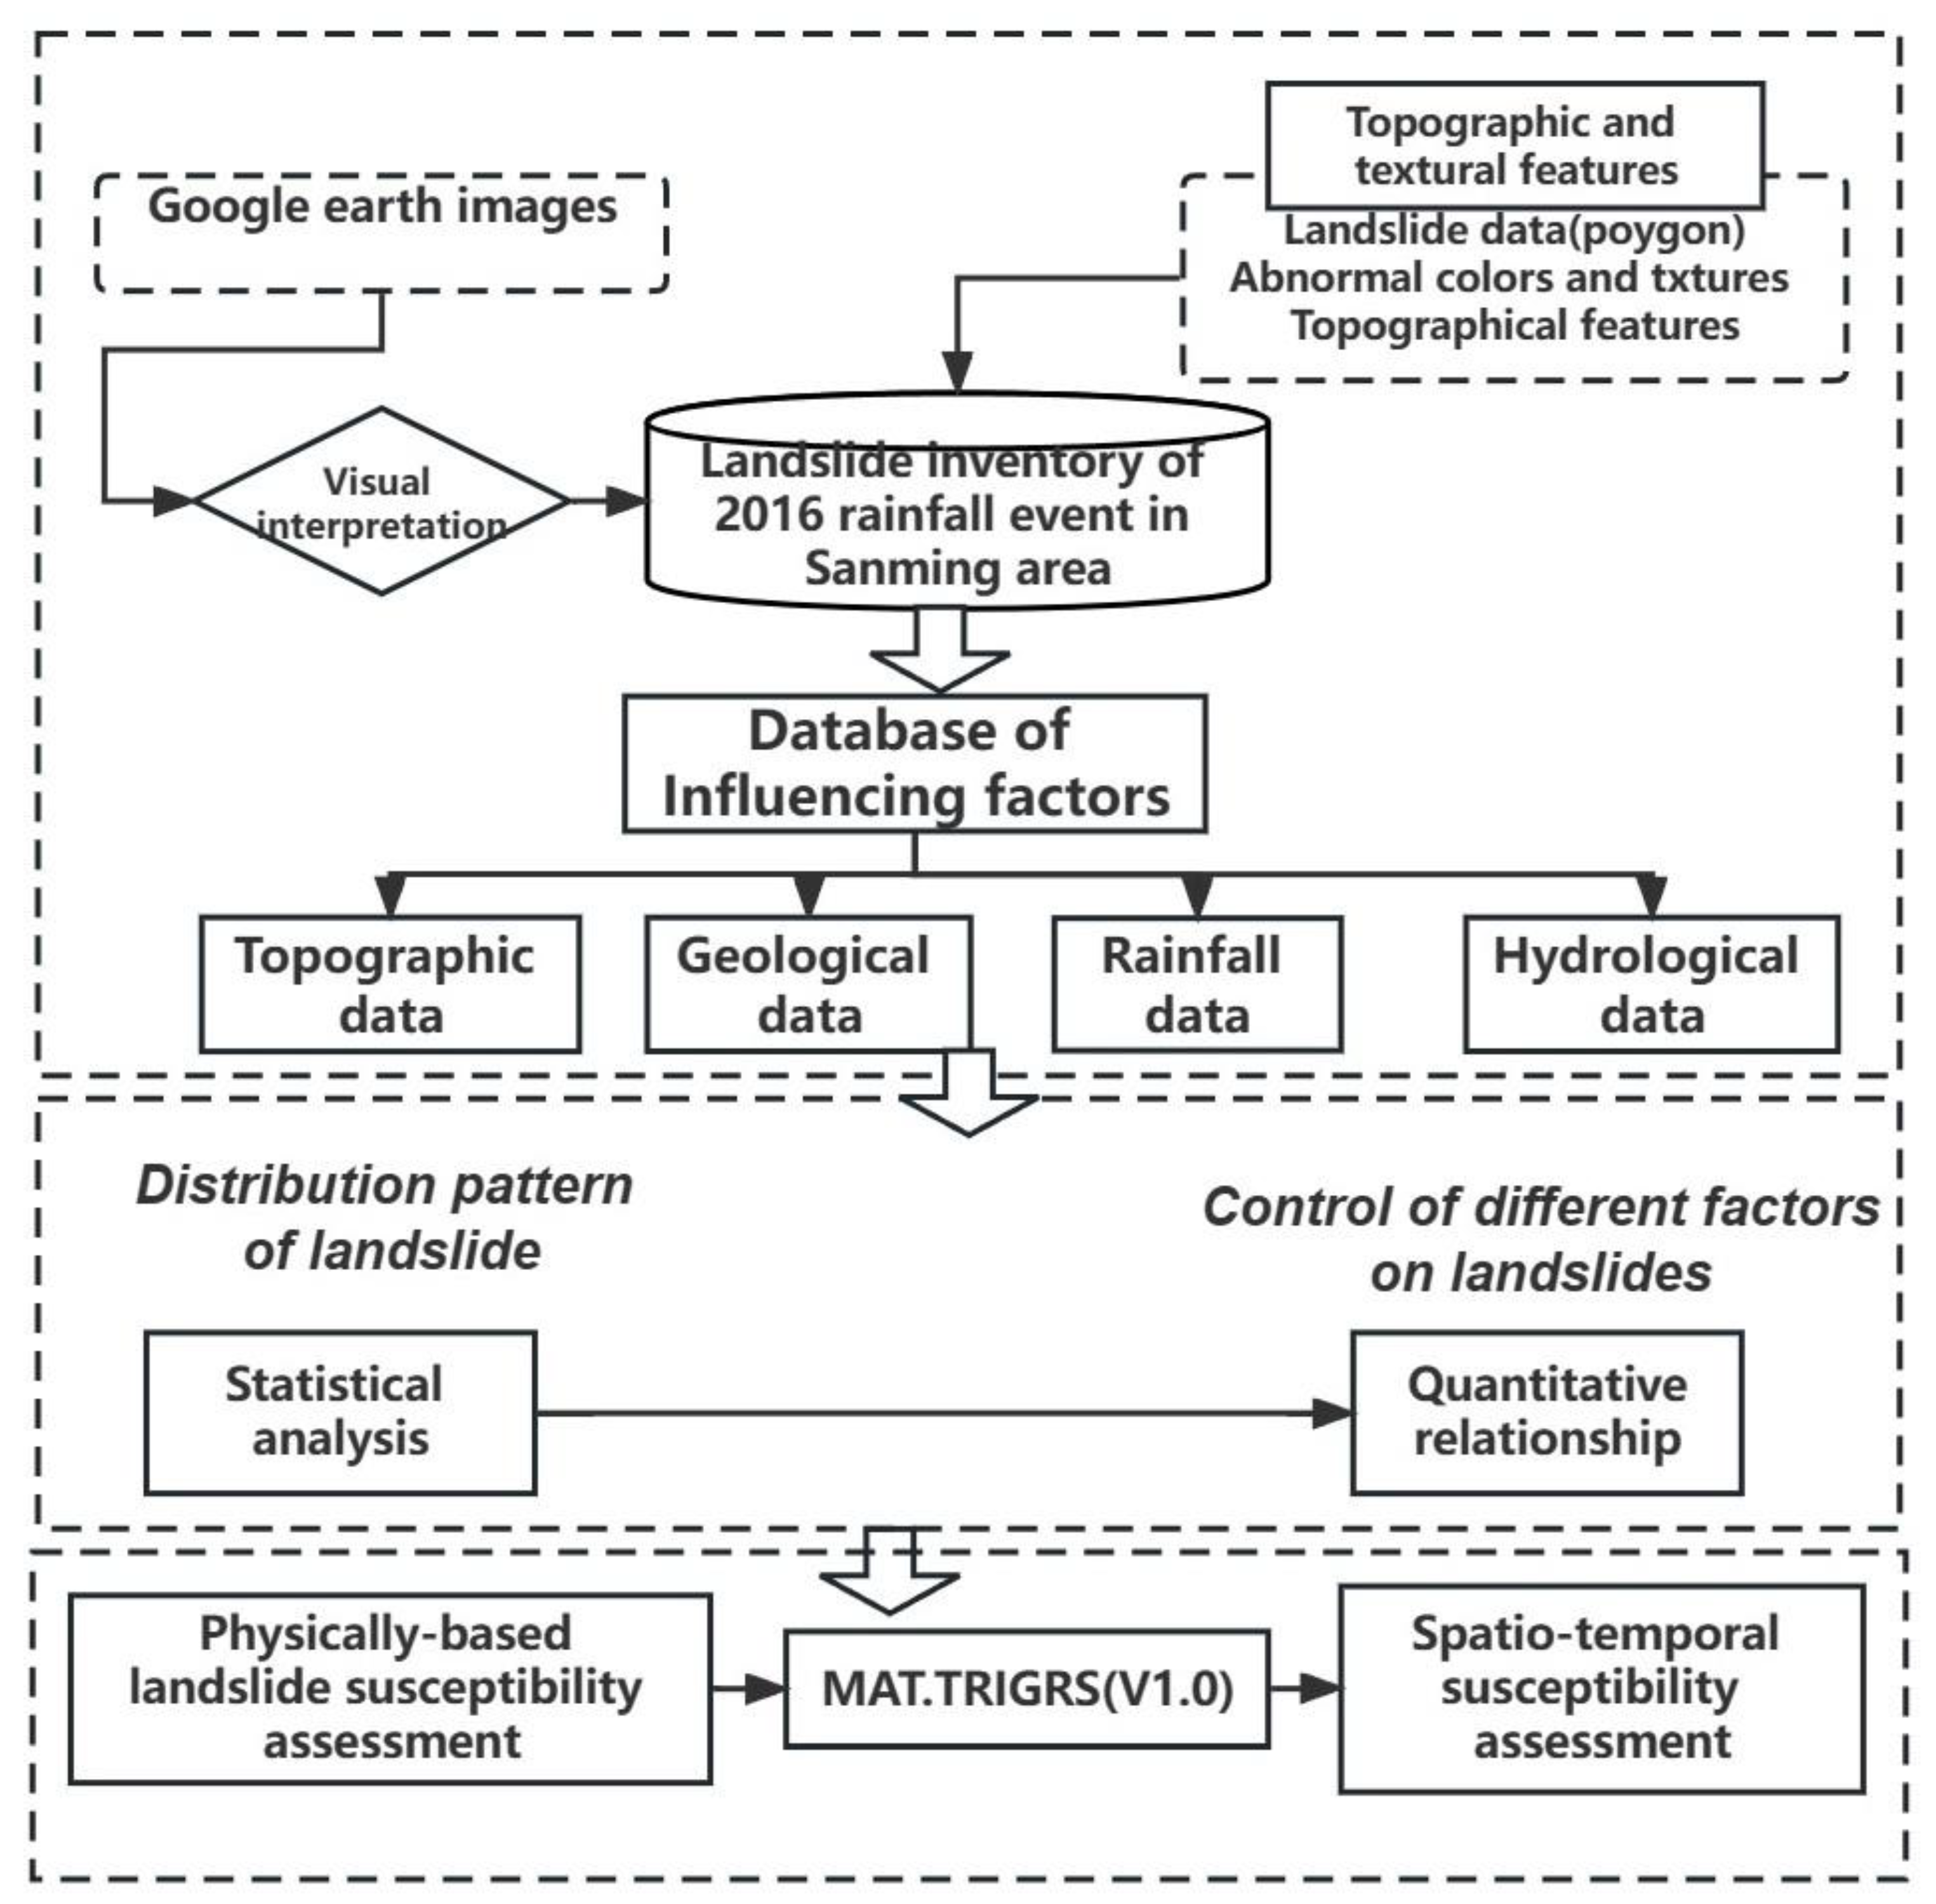
3.1. Landslide Mapping
3.2. Rainfall Data
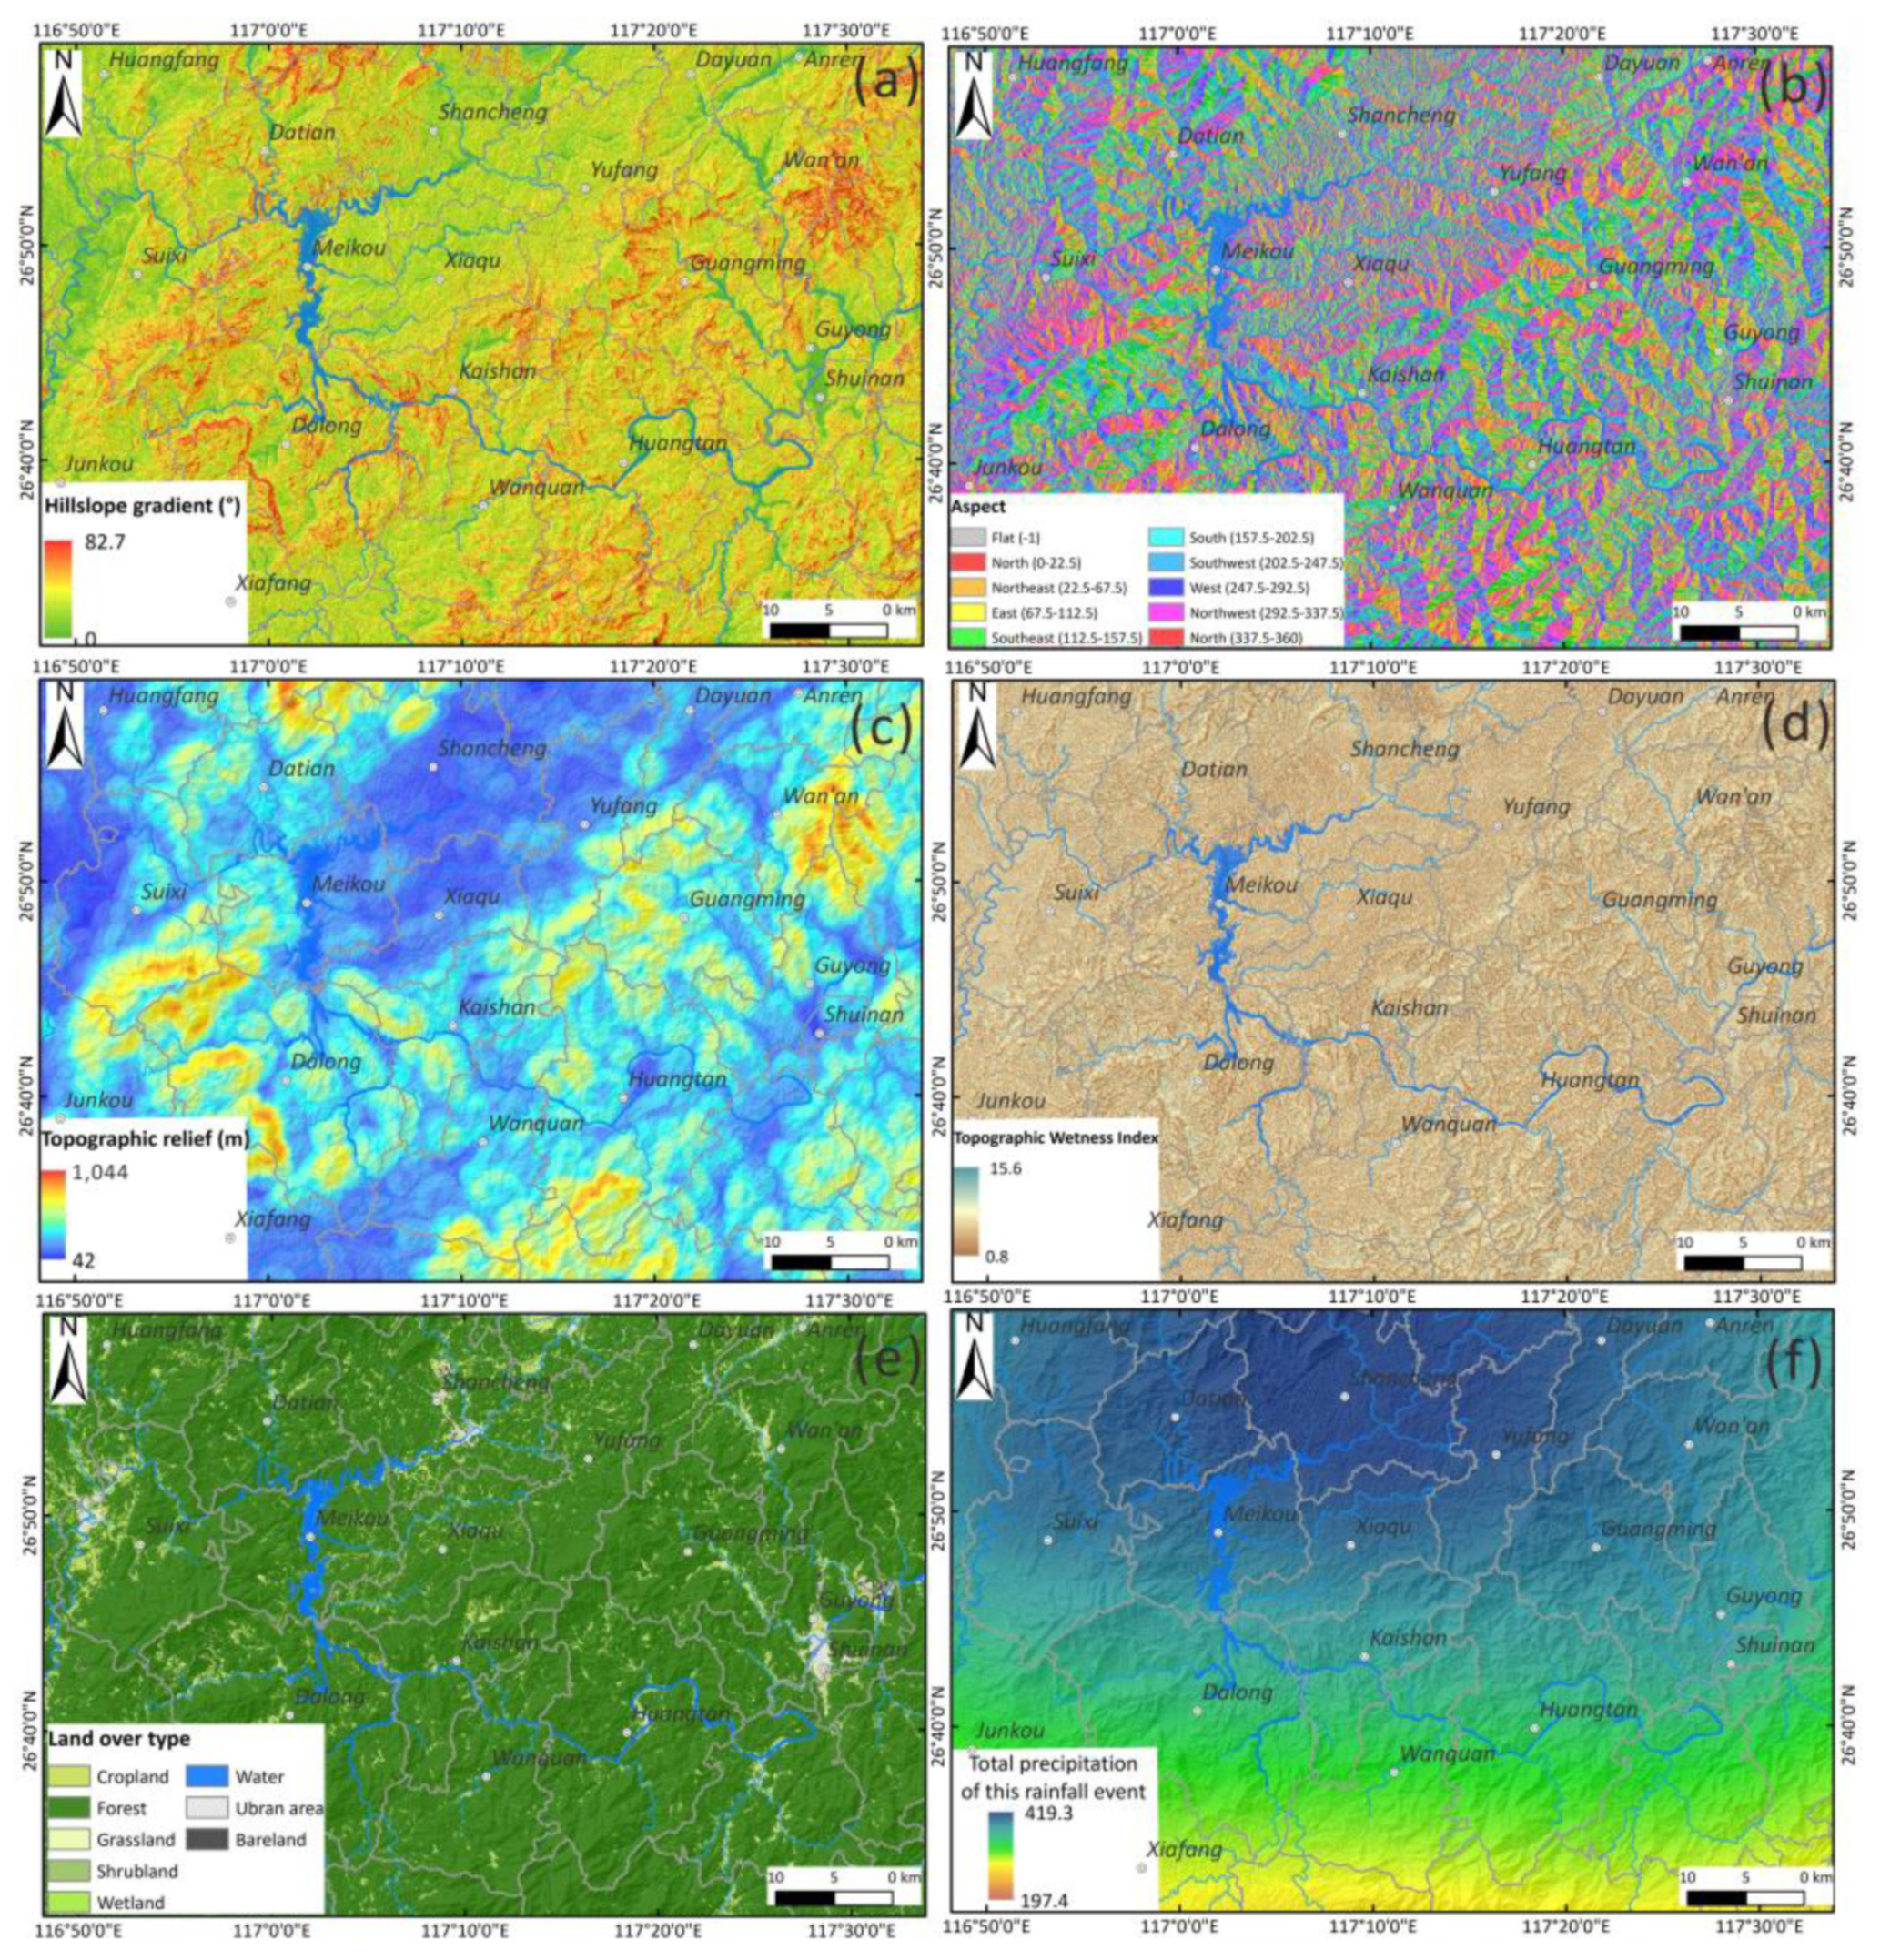
3.3. Data of Other Influencing Factors
3.4. TRIGRS Modelling
4. Results
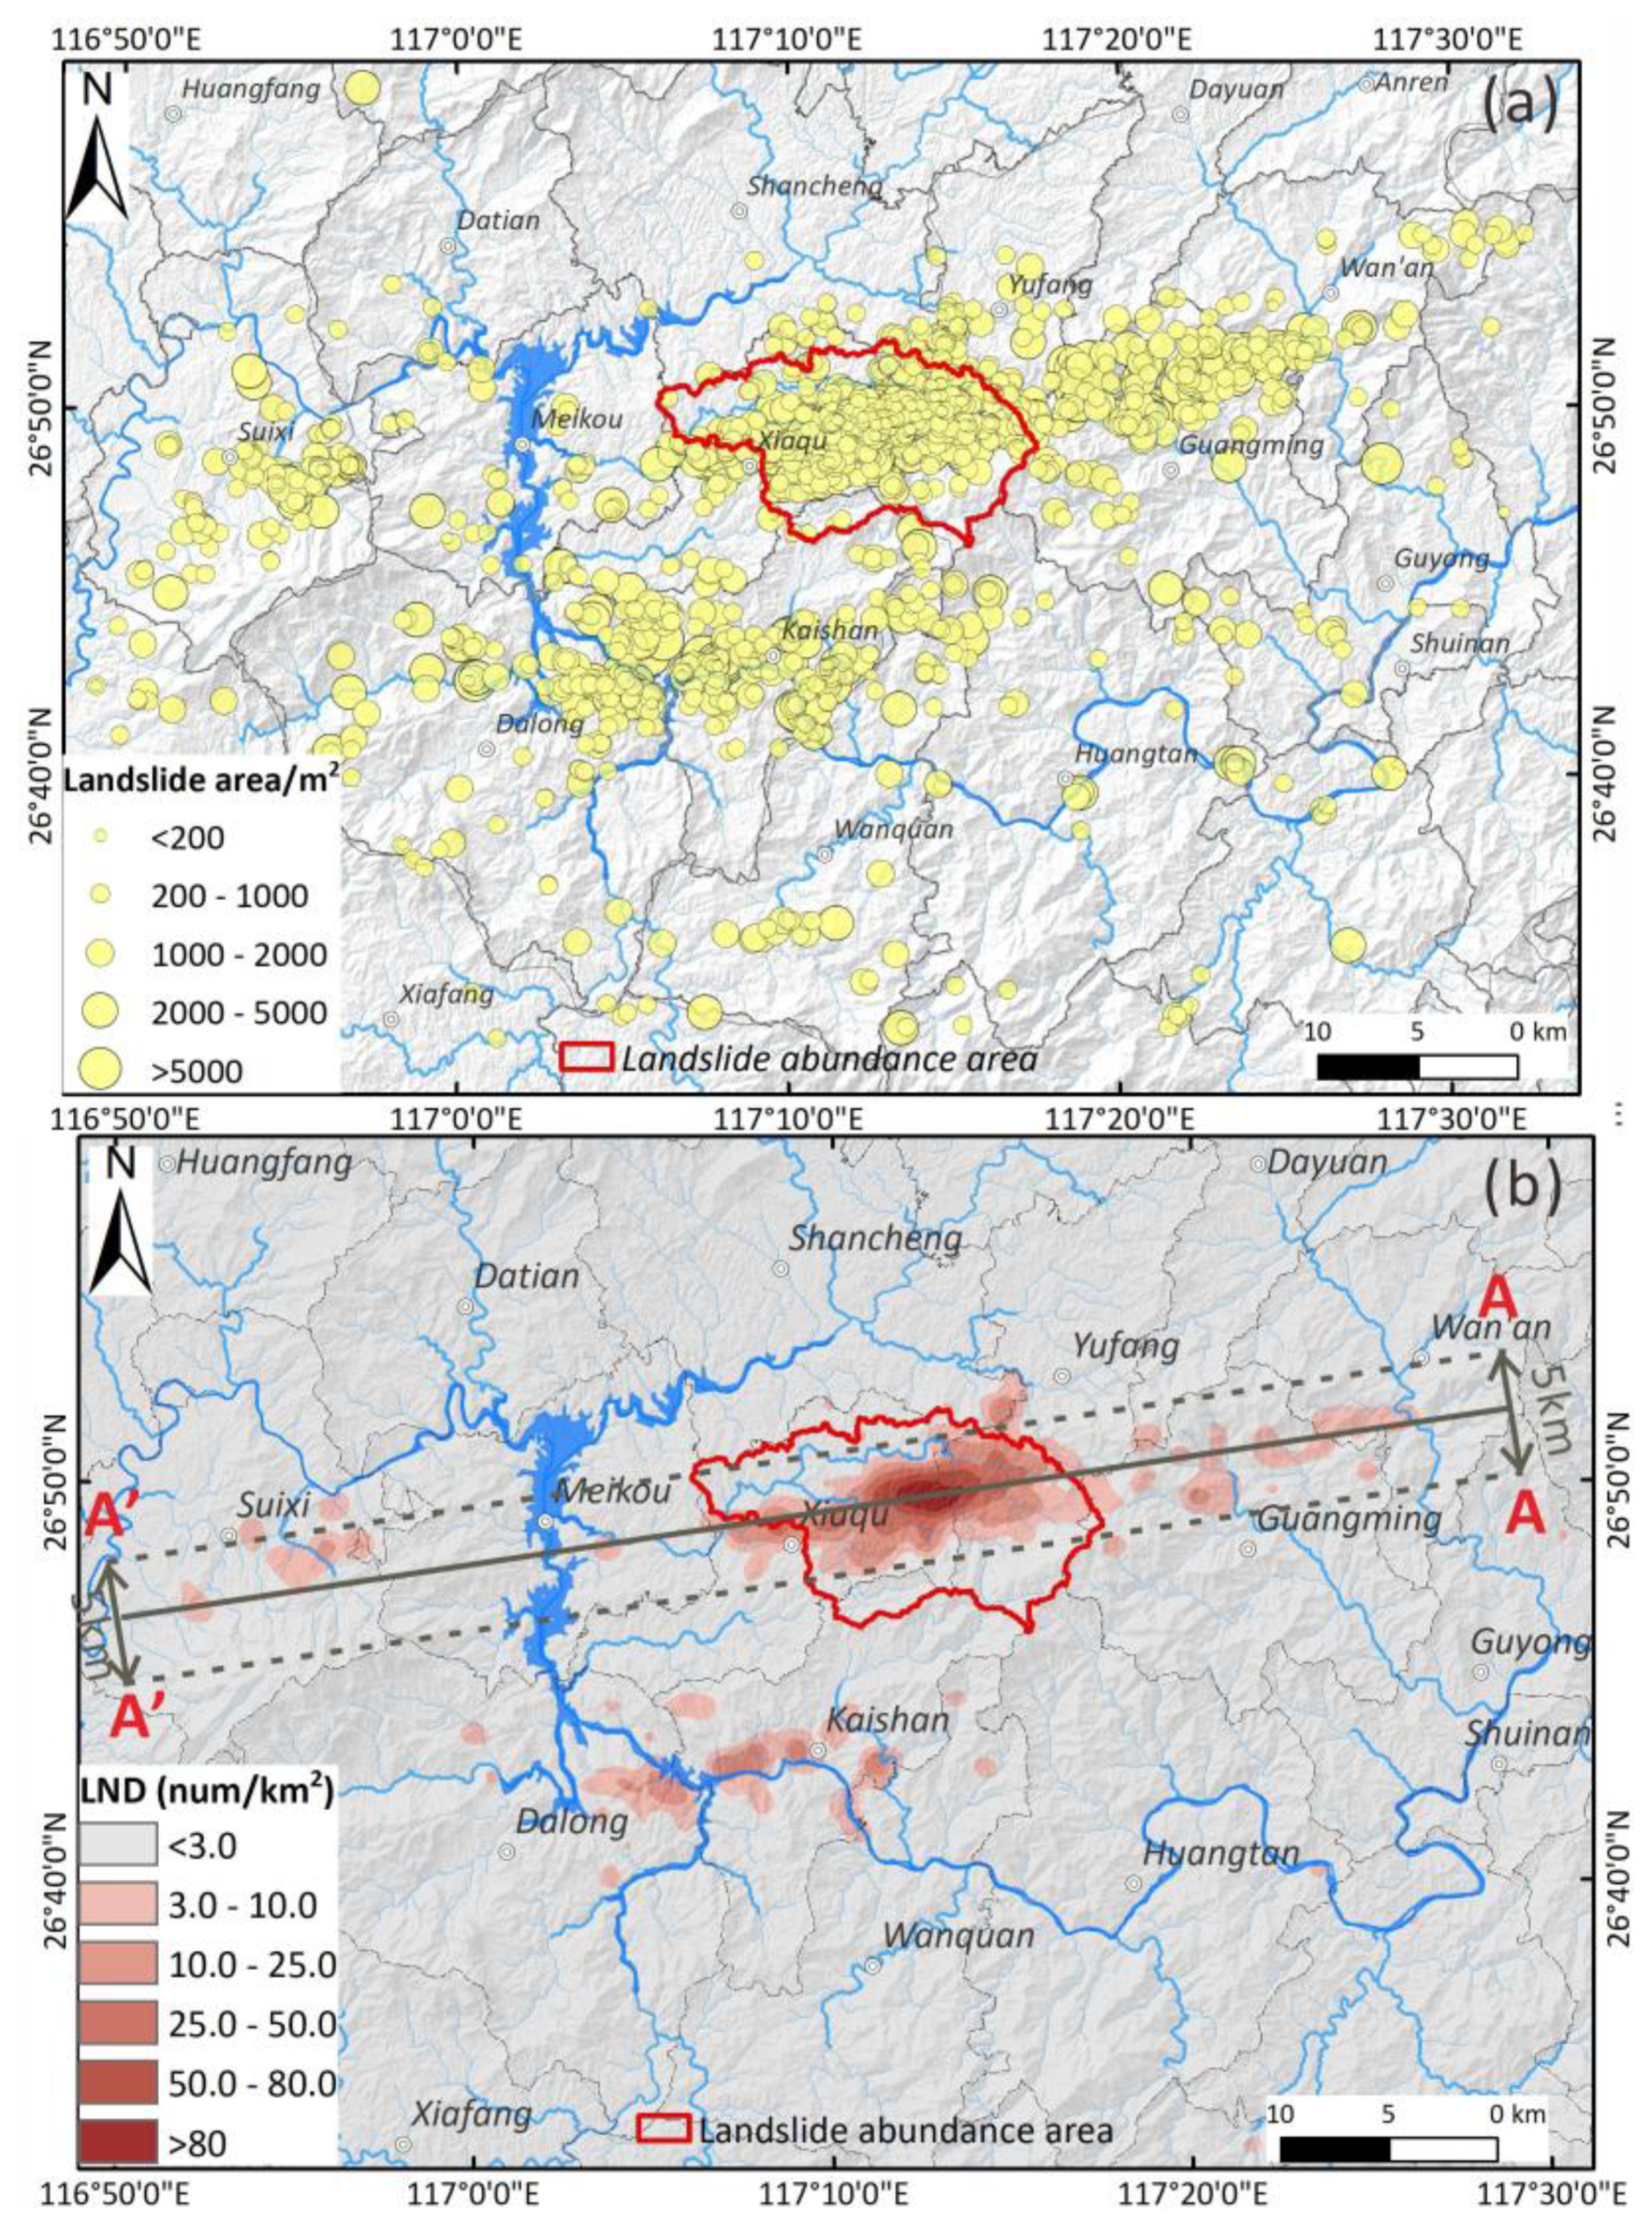
4.1. Basic Characteristics of Rainfall-Induced Landslides
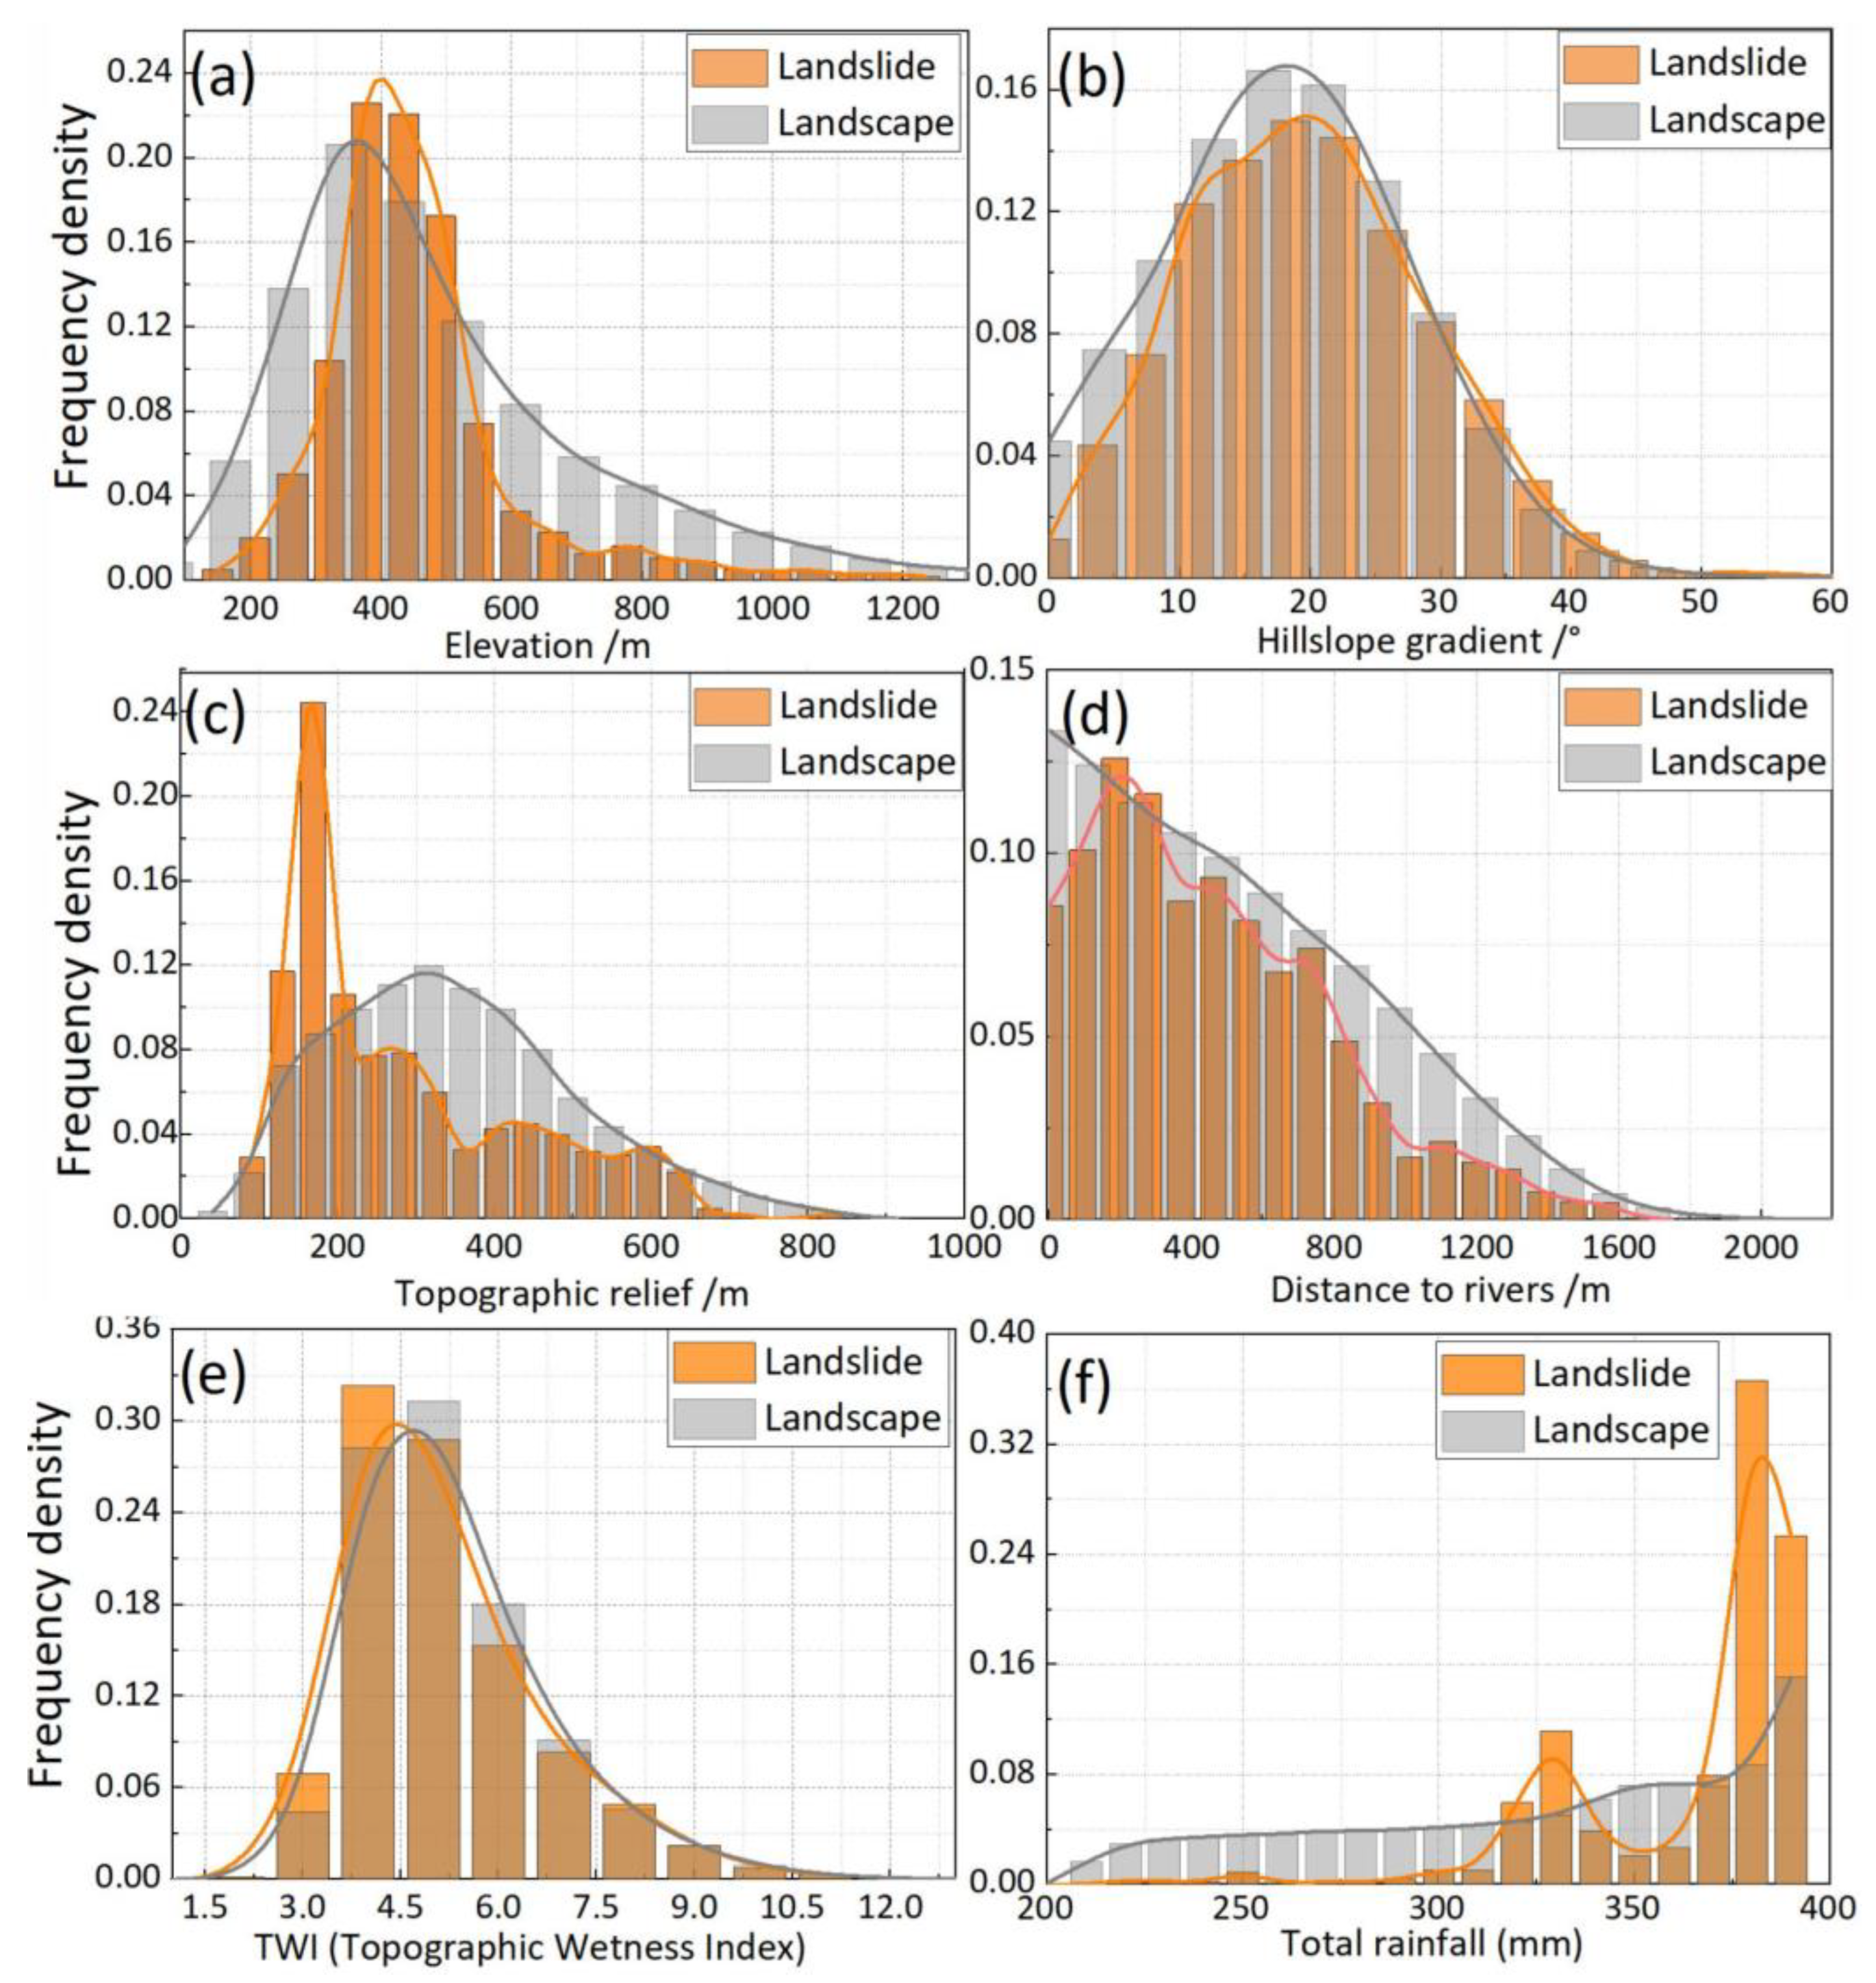
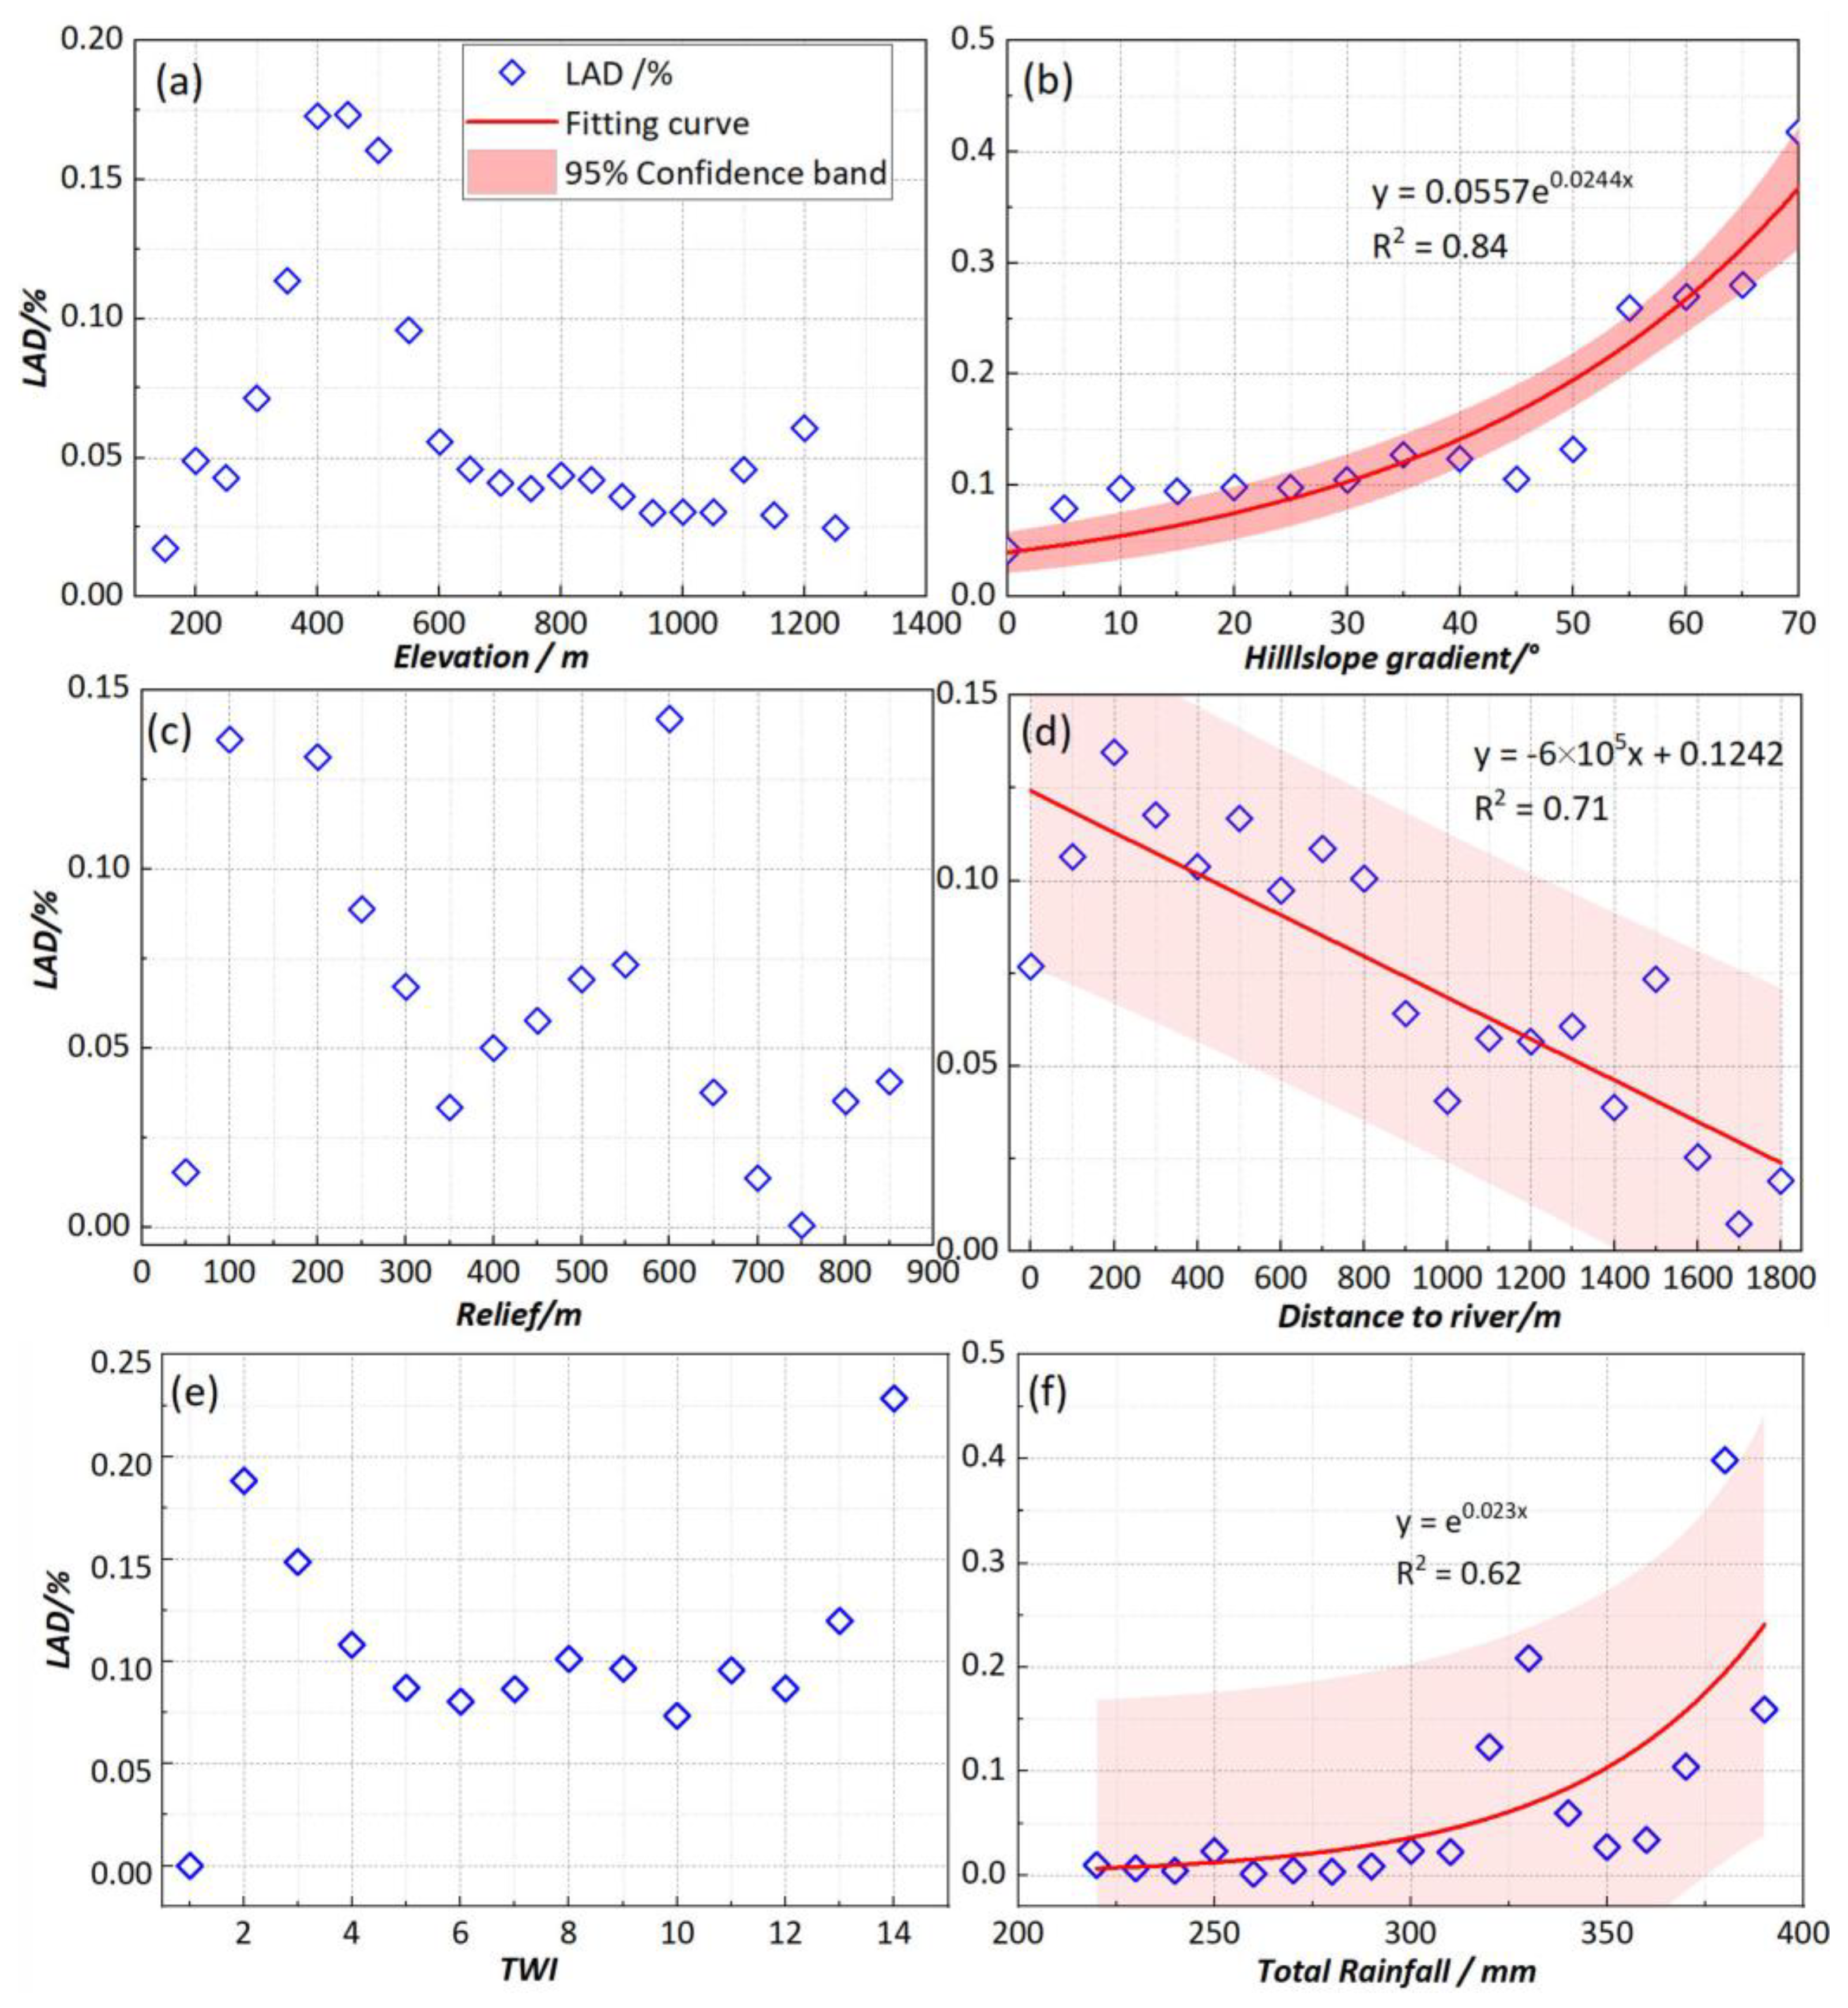
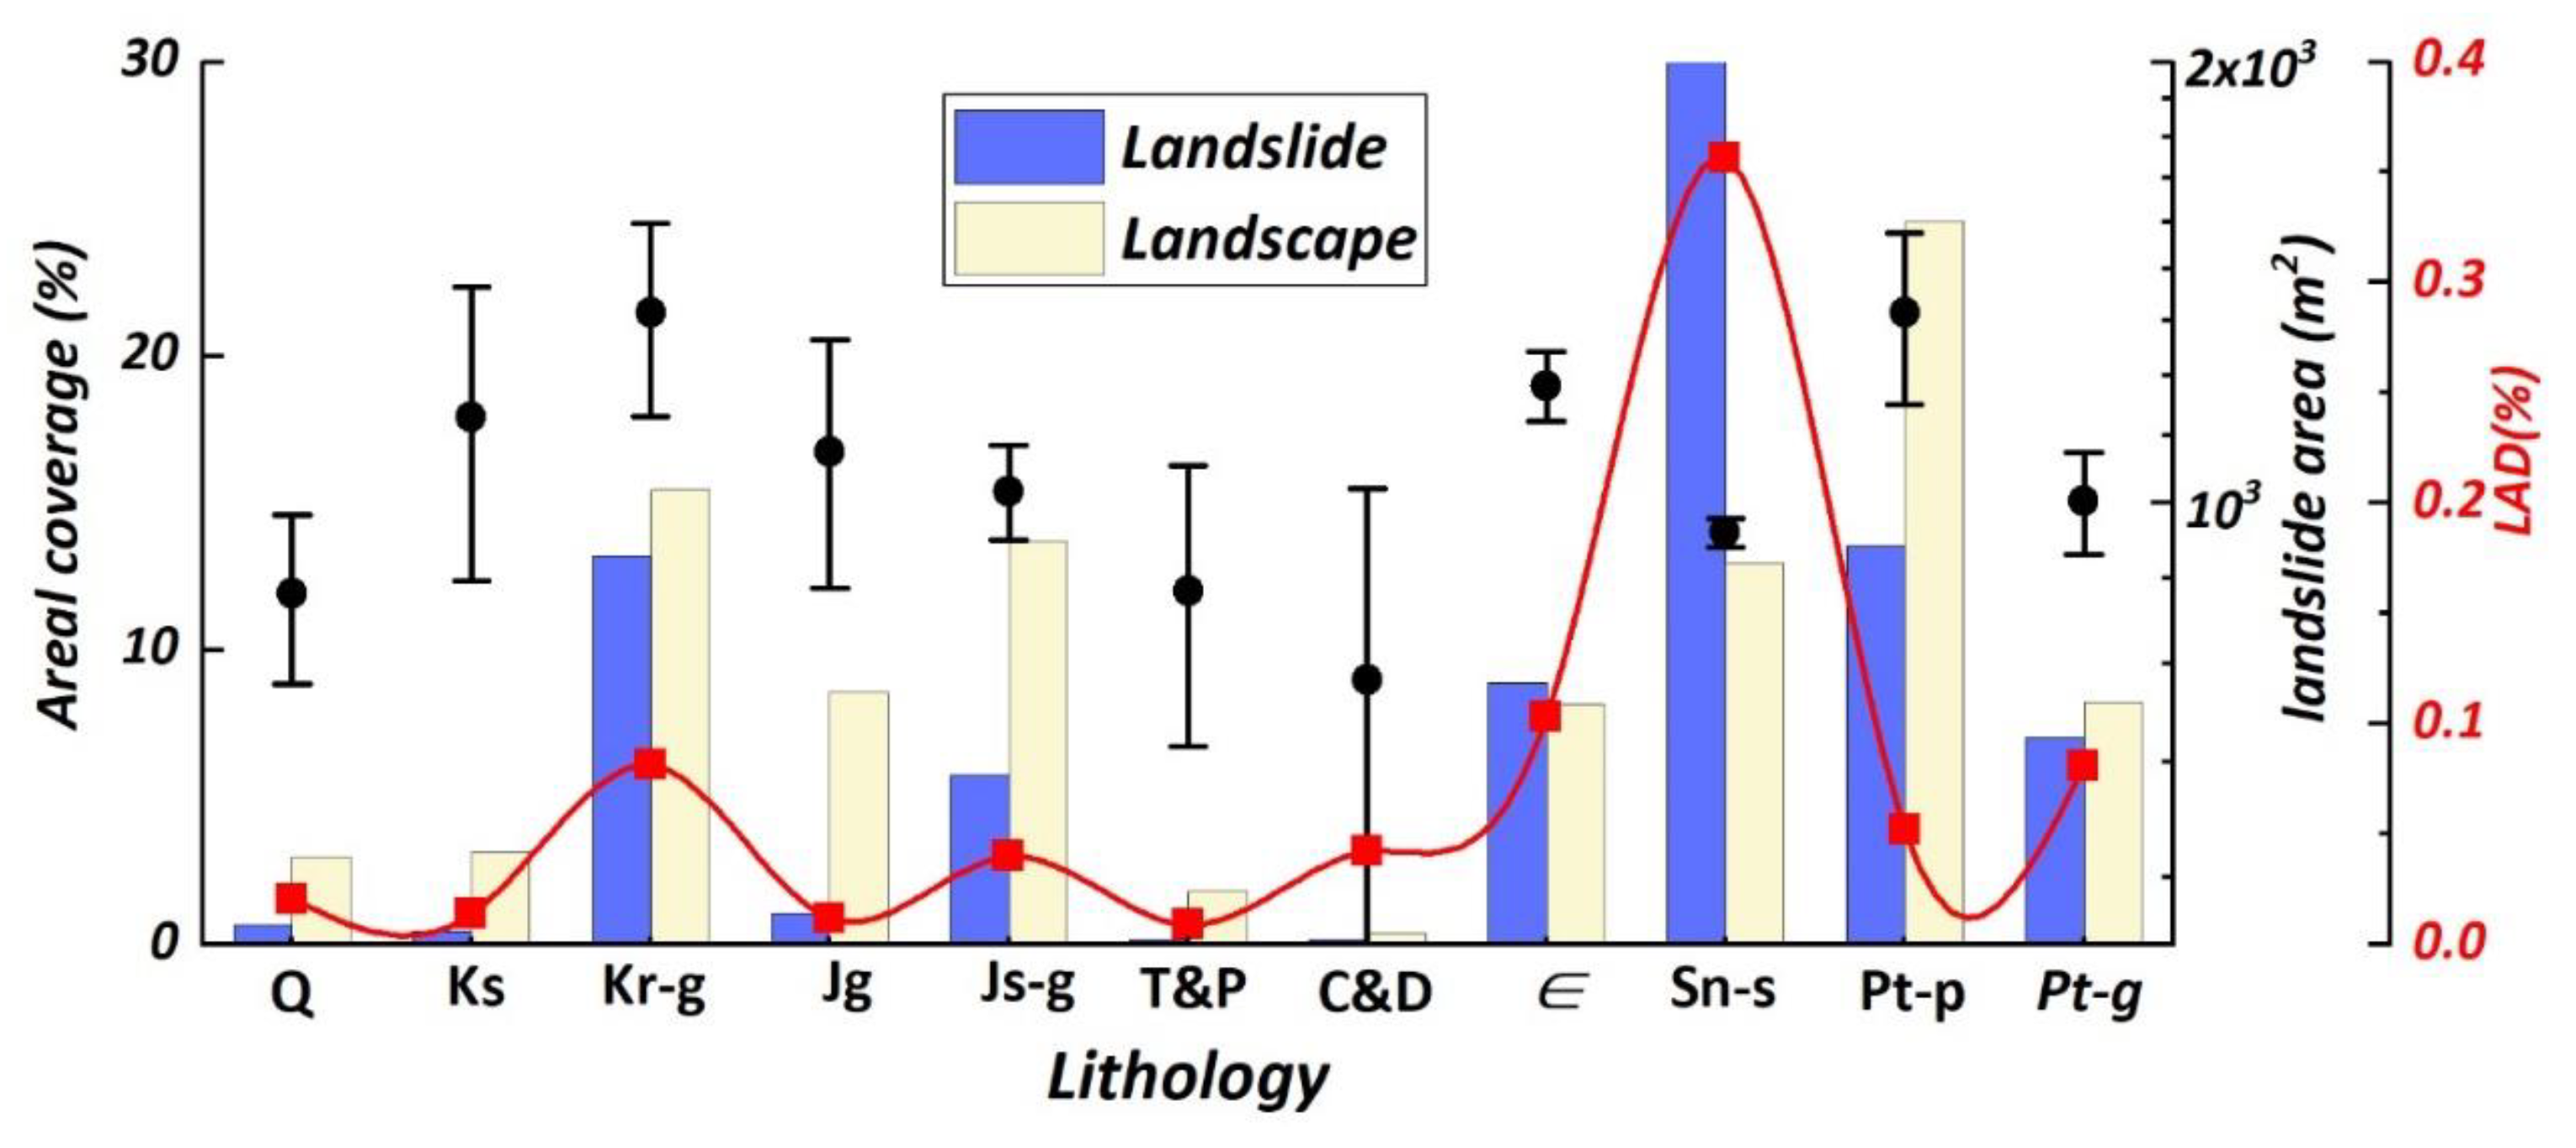
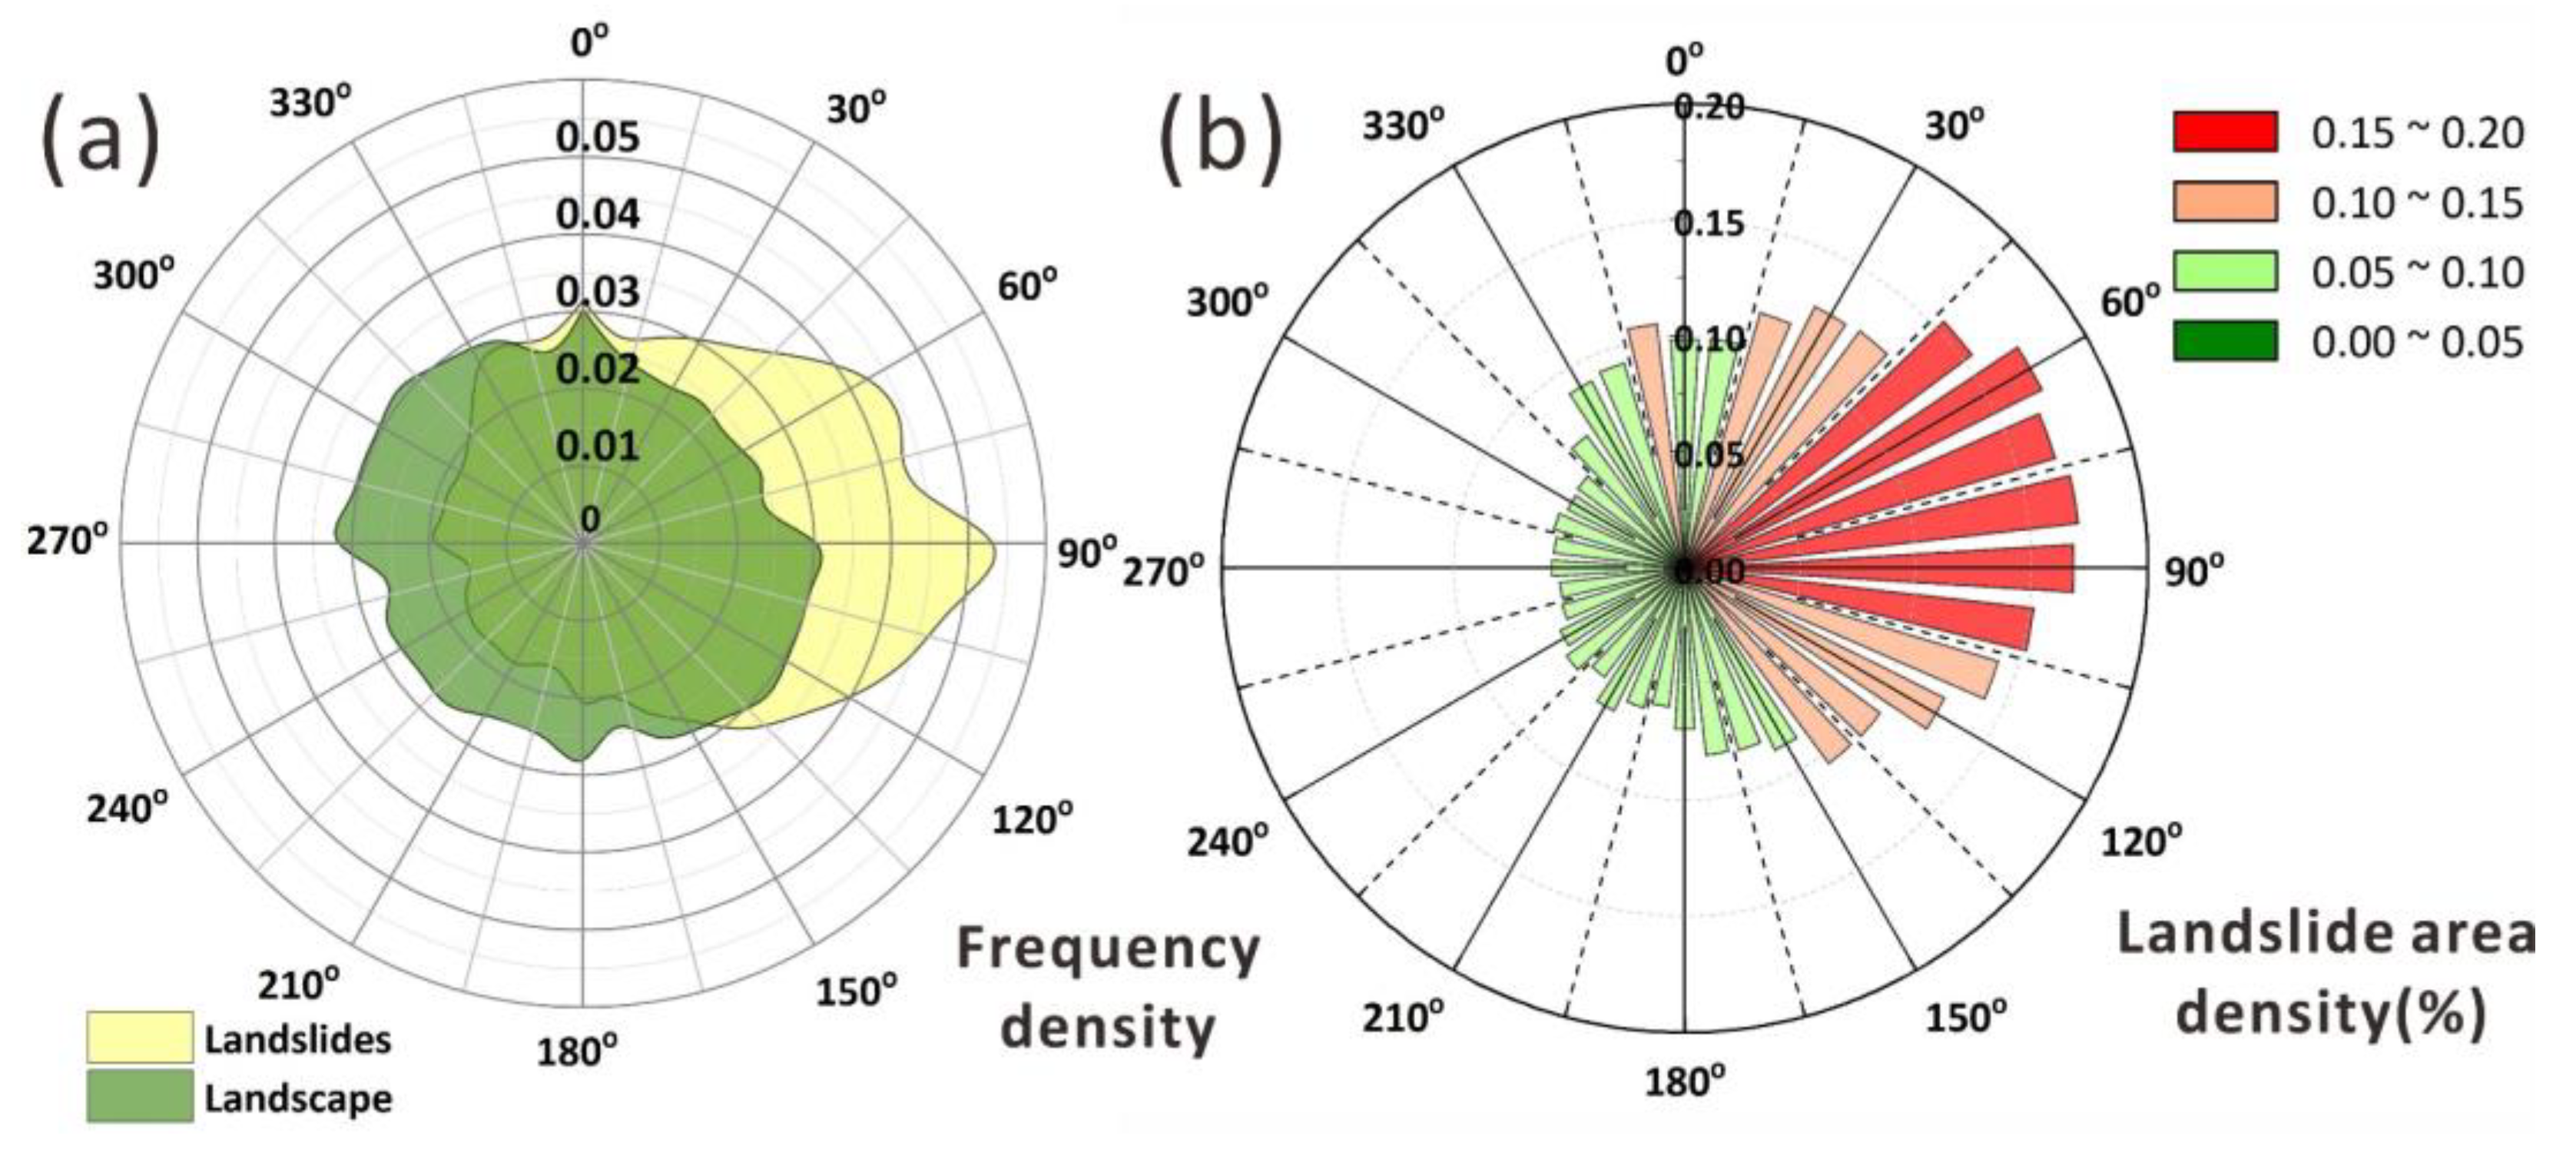
4.2. Correlation between Landslides and Influencing Factors
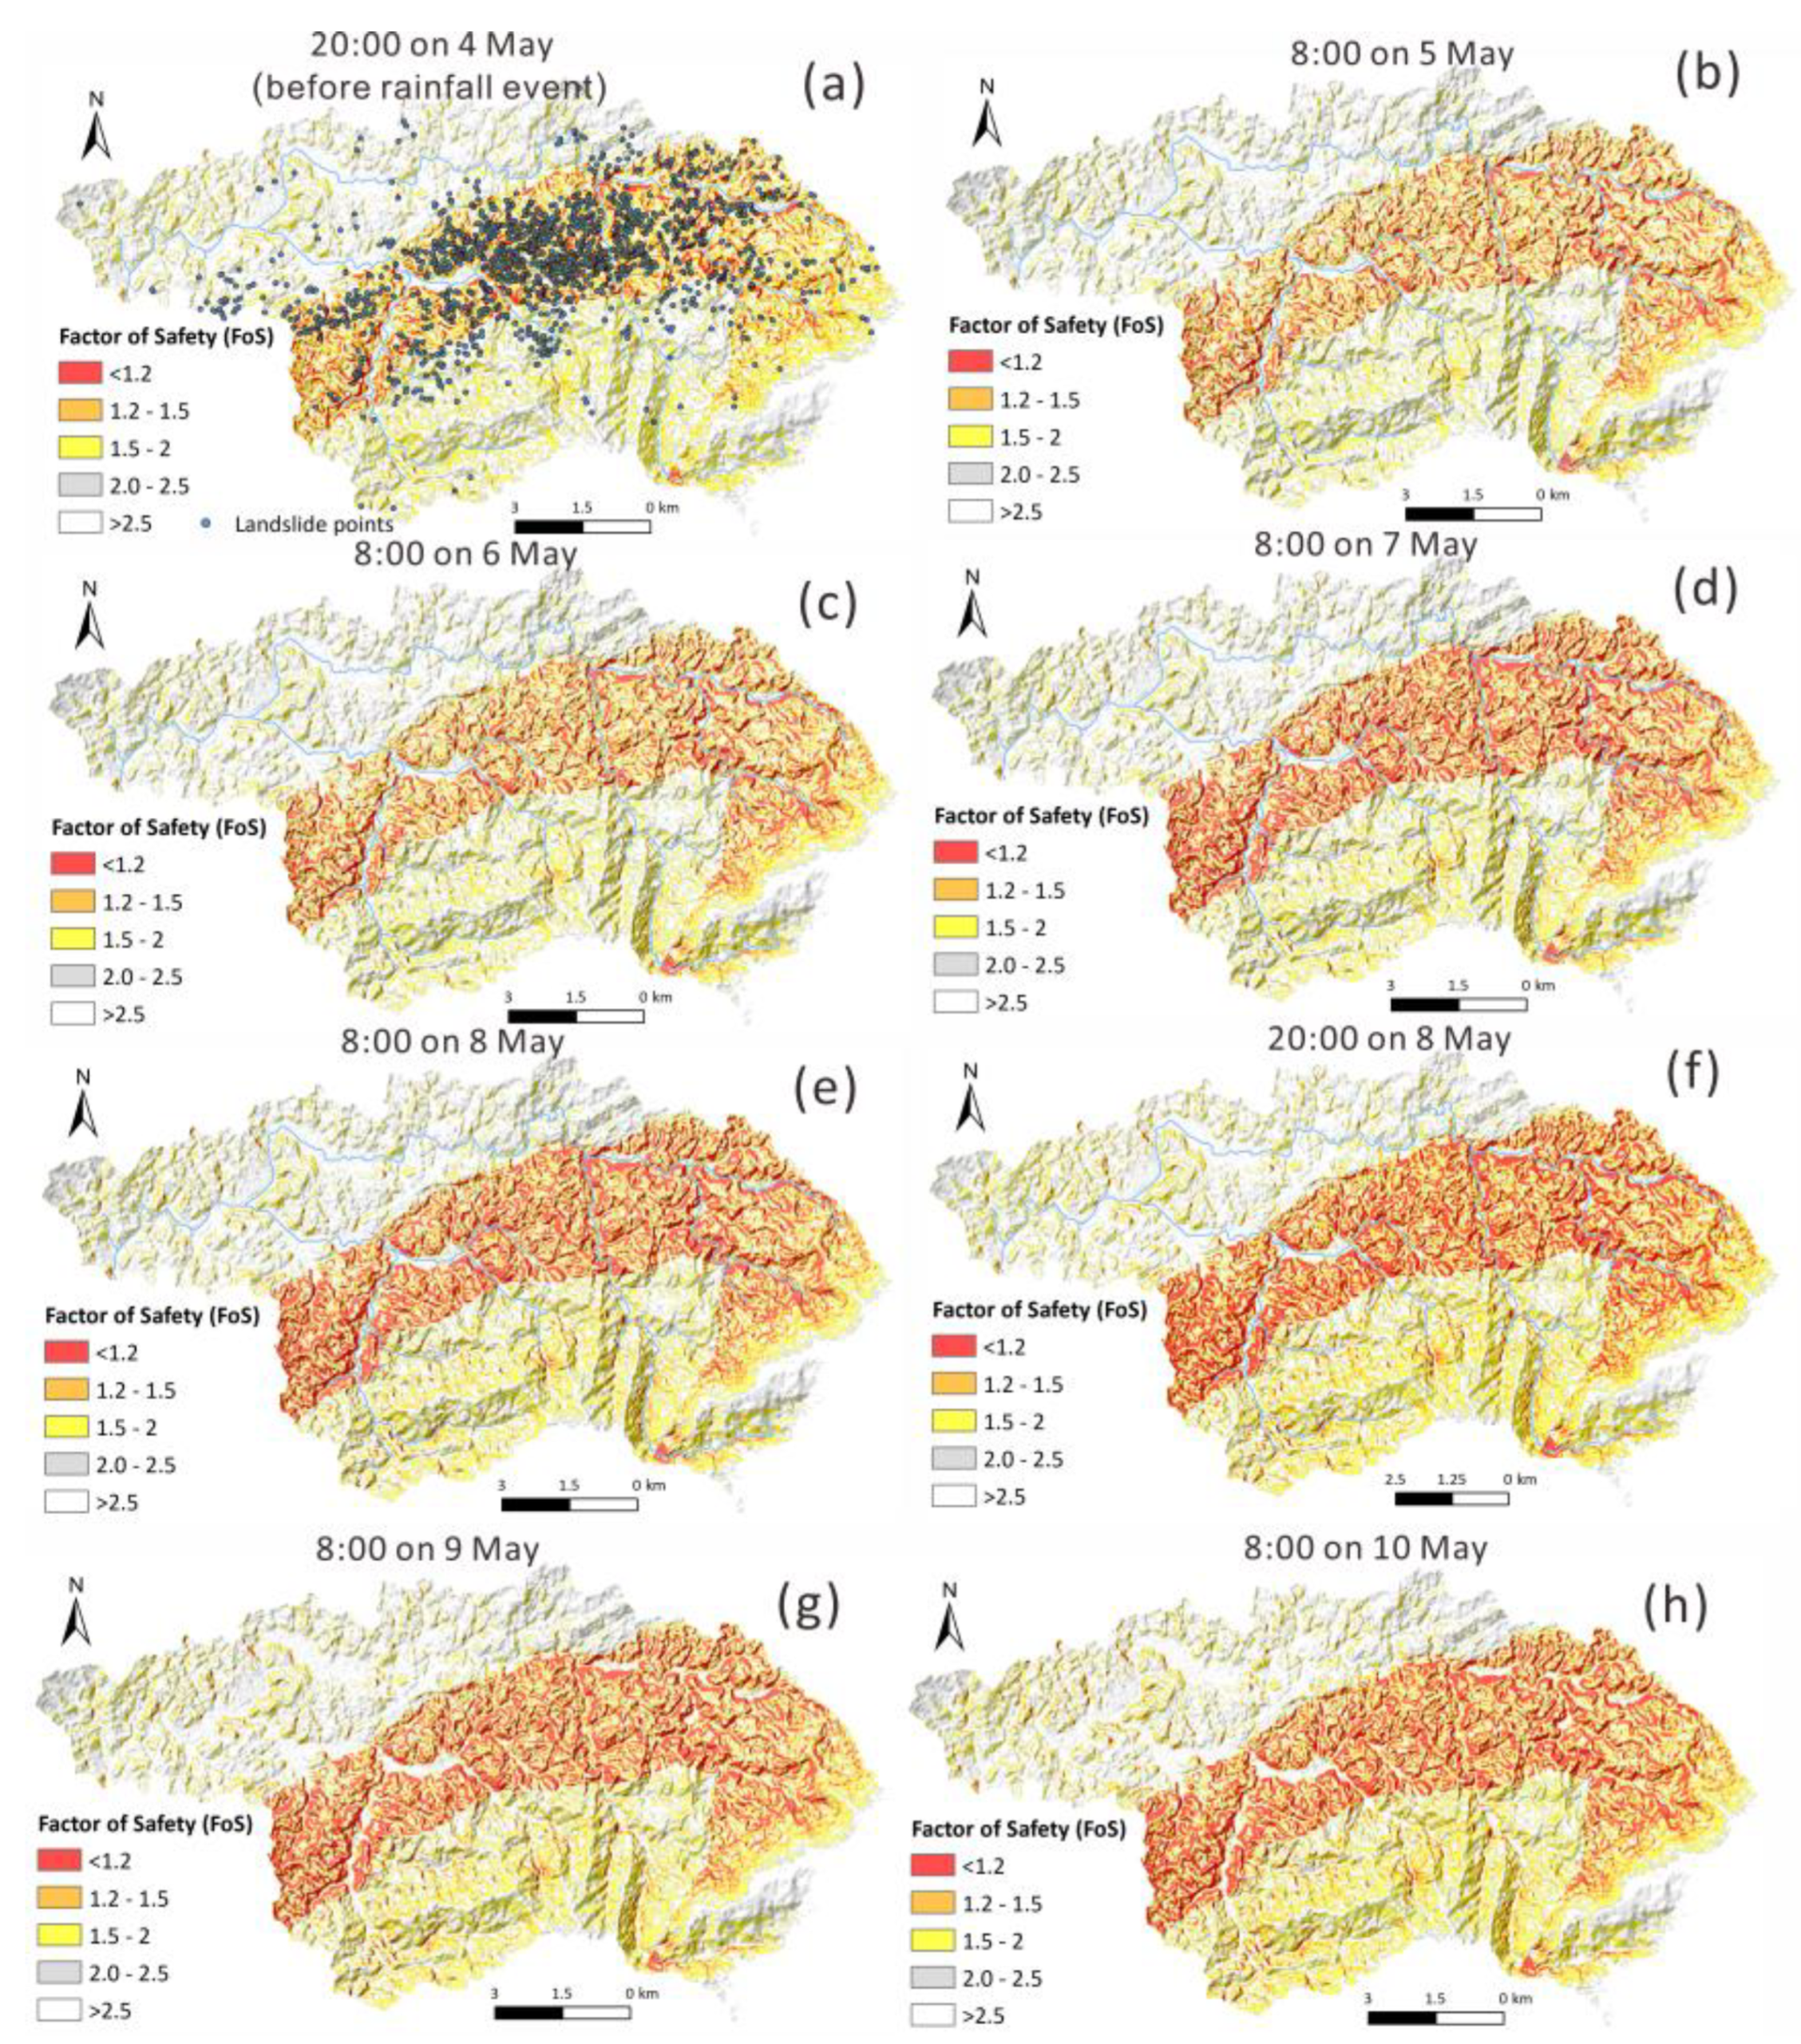
4.3. Spatio-Temporal Susceptibility Assessment
5. Discussion
6. Conclusions
Supplementary Materials
Author Contributions
Funding
Data Availability Statement
Acknowledgments
Conflicts of Interest
References
- Salciarini, D.; Godt, J.W.; Savage, W.Z.; Conversini, P.; Baum, R.L.; Michael, J.A. Modeling regional initiation of rainfall-induced shallow landslides in the eastern Umbria Region of central Italy. Landslides 2006, 3, 181–194. [Google Scholar] [CrossRef]
- Montrasio, L.; Valentino, R.; Losi, G.L. Rainfall-induced shallow landslides: A model for the triggering mechanism of some case studies in Northern Italy. Landslides 2009, 6, 241–251. [Google Scholar] [CrossRef]
- Bordoni, M.; Vivaldi, V.; Lucchelli, L.; Ciabatta, L.; Brocca, L.; Galve, J.; Meisina, C. Development of a data-driven model for spatial and temporal shallow landslide probability of occurrence at catchment scale. Landslides 2020, 18, 1209–1229. [Google Scholar] [CrossRef]
- Bălteanu, D.; Chendeş, V.; Sima, M.; Enciu, P. A country-wide spatial assessment of landslide susceptibility in Romania. Geomorphology 2010, 124, 102–112. [Google Scholar] [CrossRef]
- Brunetti, M.; Peruccacci, S.; Rossi, M.; Luciani, S.; Valigi, D.; Guzzetti, F. Rainfall thresholds for the possible occurrence of landslides in Italy. Nat. Hazards Earth Syst. Sci. 2010, 10, 447–458. [Google Scholar] [CrossRef]
- Petley, D. Global patterns of loss of life from landslides. Geology 2012, 40, 927–930. [Google Scholar] [CrossRef]
- Wang, L.; Xiao, T.; Liu, S.; Zhang, W.; Yang, B.; Chen, L. Quantification of model uncertainty and variability for landslide displacement prediction based on Monte Carlo simulation. Gondwana Res. 2023. [Google Scholar] [CrossRef]
- Ma, T.; Li, C.; Lu, Z.; Bao, Q. Rainfall intensity–duration thresholds for the initiation of landslides in Zhejiang Province, China. Geomorphology 2015, 245, 193–206. [Google Scholar] [CrossRef]
- Ma, S.; Shao, X.; Xu, C. Characterizing the Distribution Pattern and a Physically Based Susceptibility Assessment of Shallow Landslides Triggered by the 2019 Heavy Rainfall Event in Longchuan County, Guangdong Province, China. Remote Sens. 2022, 14, 4257. [Google Scholar] [CrossRef]
- Marc, O.; Gosset, M.; Saito, H.; Uchida, T.; Malet, J.-P. Spatial patterns of storm-Induced landslides and their relation to rainfall anomaly maps. Geophys. Res. Lett. 2019, 46, 11167–11177. [Google Scholar] [CrossRef]
- Broeckx, J.; Vanmaercke, M.; Duchateau, R.; Poesen, J. A data-based landslide susceptibility map of Africa. Earth-Sci. Rev. 2018, 185, 102–121. [Google Scholar] [CrossRef]
- Bălteanu, D.; Micu, M.; Jurchescu, M.; Malet, J.-P.; Sima, M.; Kucsicsa, G.; Dumitrică, C.; Petrea, D.; Mărgărint, M.C.; Bilaşco, Ş.; et al. National-scale landslide susceptibility map of Romania in a European methodological framework. Geomorphology 2020, 371, 107432. [Google Scholar] [CrossRef]
- Dai, L.; Scaringi, G.; Fan, X.; Yunus, A.P.; Liu-Zeng, J.; Xu, Q.; Huang, R. Coseismic Debris Remains in the Orogen Despite a Decade of Enhanced Landsliding. Geophys. Res. Lett. 2021, 48, e2021GL095850. [Google Scholar] [CrossRef]
- Xiong, J.; Chen, M.; Tang, C. Long-term changes in the landslide sediment supply capacity for debris flow occurrence in Wenchuan County, China. Catena 2021, 203, 105340. [Google Scholar] [CrossRef]
- Kirschbaum, D.; Stanley, T. Satellite-based assessment of rainfall-triggered landslide hazard for situational awareness. Earth’s Future 2018, 6, 505–523. [Google Scholar] [CrossRef]
- Emberson, R.; Kirschbaum, D.; Amatya, P.M.; Tanyas, H.; Marc, O. Insights from the topographic characteristics of a large global catalog of rainfall-induced landslide event inventories. Nat. Hazards Earth Syst. Sci. 2022, 22, 1129–1149. [Google Scholar] [CrossRef]
- Marc, O.; Stumpf, A.; Malet, J.P.; Gosset, M.; Uchida, T.; Chiang, S.-H. Initial insights from a global database of rainfall-induced landslide inventories: The weak influence of slope and strong influence of total storm rainfall. Earth Surf. Dyn. 2018, 6, 903–922. [Google Scholar] [CrossRef]
- Chang, K.-t.; Chiang, S.-h.; Chen, Y.-C.; Mondini, A. Modeling the spatial occurrence of shallow landslides triggered by typhoons. Geomorphology 2014, 208, 137–148. [Google Scholar] [CrossRef]
- Hirota, K.; Konagai, K.; Sassa, K.; Dang, K.; Yoshinaga, Y.; Wakita, E.K. Landslides triggered by the West Japan Heavy Rain of July 2018, and geological and geomorphological features of soaked mountain slopes. Landslides 2019, 16, 189–194. [Google Scholar] [CrossRef]
- Bessette-Kirton, E.; Cerovski-Darriau, C.; Schulz, W.; Coe, J.; Kean, J.; Godt, J.; Thomas, M.; Hughes, K. Landslides triggered by Hurricane Maria: Assessment of an extreme event in Puerto Rico. GSA Today 2019, 29, 4–10. [Google Scholar] [CrossRef]
- Van Westen, C.J.; Zhang, J. Landslides and Floods Triggered by Hurricane Maria (18 September 2017) in Dominica, Digital or Visual Products, UNITAR-UNOSAT. Available online: https://www.unitar.org/unosat/node/44/2762 (accessed on 5 April 2023).
- Saadatkhah, N.; Kassim, A.; Lee, L.M.; Rahnamarad, J. Spatiotemporal regional modeling of rainfall-induced slope failure in Hulu Kelang, Malaysia. Environ. Earth Sci. 2015, 73, 8425–8441. [Google Scholar] [CrossRef]
- Chen, Y.-l.; Chen, D.-h.; Li, Z.-c.; Huang, J.-b. Preliminary studies on the dynamic prediction method of rainfall-triggered landslide. J. Mt. Sci. 2016, 13, 1735–1745. [Google Scholar] [CrossRef]
- Merghadi, A.; Yunus, A.P.; Dou, J.; Whiteley, J.; ThaiPham, B.; Bui, D.T.; Avtar, R.; Abderrahmane, B. Machine learning methods for landslide susceptibility studies: A comparative overview of algorithm performance. Earth-Sci. Rev. 2020, 207, 103225. [Google Scholar] [CrossRef]
- Guo, Z.; Torra, O.; Hürlimann, M.; Abancó, C.; Medina, V. FSLAM: A QGIS plugin for fast regional susceptibility assessment of rainfall-induced landslides. Environ. Model. Softw. 2022, 150, 105354. [Google Scholar] [CrossRef]
- Melillo, M.; Brunetti, M.T.; Peruccacci, S.; Gariano, S.L.; Roccati, A.; Guzzetti, F. A tool for the automatic calculation of rainfall thresholds for landslide occurrence. Environ. Model. Softw. 2018, 105, 230–243. [Google Scholar] [CrossRef]
- Guzzetti, F.; Gariano, S.L.; Peruccacci, S.; Brunetti, M.T.; Marchesini, I.; Rossi, M.; Melillo, M. Geographical landslide early warning systems. Earth-Sci. Rev. 2020, 200, 102973. [Google Scholar] [CrossRef]
- Guzzetti, F.; Peruccacci, S.; Rossi, M.; Stark, C. Rainfall thresholds for the initiation of landslides in Central and Southern Europe. Meteorol. Atmos. Phys. 2007, 98, 239–267. [Google Scholar] [CrossRef]
- Reichenbach, P.; Rossi, M.; Malamud, B.D.; Mihir, M.; Guzzetti, F. A review of statistically-based landslide susceptibility models. Earth-Sci. Rev. 2018, 180, 60–91. [Google Scholar] [CrossRef]
- Baumann, V.; Bonadonna, C.; Cuomo, S.; Moscariello, M.; Biass, S.; Pistolesi, M.; Gattuso, A. Mapping the susceptibility of rain-triggered lahars at Vulcano island (Italy) combining field characterization, geotechnical analysis, and numerical modelling. Nat. Hazards Earth Syst. Sci. 2019, 19, 2421–2449. [Google Scholar] [CrossRef]
- Tran, T.V.; Lee, G.; An, H.; Kim, M. Comparing the performance of TRIGRS and TiVaSS in spatial and temporal prediction of rainfall-induced shallow landslides. Environ. Earth Sci. 2017, 76, 315. [Google Scholar] [CrossRef]
- Hong, Y.; Adler, R.; Huffman, G. Evaluation of the potential of NASA multi-satellite precipitation analysis in global landslide hazard assessment. Geophys. Res. Lett. 2006, 332. [Google Scholar] [CrossRef]
- Nowicki Jessee, M.A.; Hamburger, M.W.; Allstadt, K.; Wald, D.J.; Robeson, S.M.; Tanyas, H.; Hearne, M.; Thompson, E.M. A global empirical model for near-real-time assessment of seismically induced landslides. J. Geophys. Res. Earth Surf. 2019, 123, 1835–1859. [Google Scholar] [CrossRef]
- Fell, R.; Corominas, J.; Bonnard, C.; Cascini, L.; Leroi, E.; Savage, W. Guidelines for landslide susceptibility, hazard and risk zoning for land use planning. Eng. Geol. 2008, 102, 85–98. [Google Scholar] [CrossRef]
- Sarkar, S.; Roy, A.K.; Raha, P. Deterministic approach for susceptibility assessment of shallow debris slide in the Darjeeling Himalayas, India. Catena 2016, 142, 36–46. [Google Scholar] [CrossRef]
- Schiliro, L.; Montrasio, L.; Scarascia Mugnozza, G. Prediction of shallow landslide occurrence: Validation of a physically-based approach through a real case study. Sci. Total Environ. 2016, 569–570, 134–144. [Google Scholar] [CrossRef]
- Montgomery, D.R.; Dietrich, W.E.; Torres, R.; Anderson, S.P.; Heffner, J.T.; Loague, K. Hydrologic response of a steep, unchanneled valley to natural and applied rainfall. Water Resour. Res. 1997, 33, 91–109. [Google Scholar] [CrossRef]
- Pack, R.; Tarboton, D.; Goodwin, C.N. SINMAP 2.0—A Stability Index Approach to Terrain Stability Hazard Mapping, User’s Manual. Produced in ArcView Avenue and C++ for Forest Renewal B.C. under Research Contract No: PA97537-0RE. Available online: https://digitalcommons.usu.edu/cee_facpub/16/ (accessed on 21 May 2023).
- Montrasio, L.; Valentino, R.; Meisina, C. Soil saturation and stability analysis of a test site slope using the shallow landslide instability prediction (SLIP) model. Geotech. Geol. Eng. 2018, 36, 2331–2342. [Google Scholar] [CrossRef]
- Zhang, K.; Xue, X.; Hong, Y.; Gourley, J.J.; Lu, N.; Wan, Z.; Hong, Z.; Wooten, R. iCRESTRIGRS: A coupled modeling system for cascading flood–landslide disaster forecasting. Hydrol. Earth Syst. Sci. 2016, 20, 5035–5048. [Google Scholar] [CrossRef]
- Rossi, G.; Catani, F.; Leoni, L.; Segoni, S.; Tofani, V. HIRESSS: A physically based slope stability simulator for HPC applications. Nat. Hazards Earth Syst. Sci. 2013, 13, 151–166. [Google Scholar] [CrossRef]
- Salvatici, T.; Tofani, V.; Rossi, G.; D’Ambrosio, M.; Tacconi Stefanelli, C.; Masi, E.B.; Rosi, A.; Pazzi, V.; Vannocci, P.; Petrolo, M.; et al. Application of a physically based model to forecast shallow landslides at a regional scale. Nat. Hazards Earth Syst. Sci. 2018, 18, 1919–1935. [Google Scholar] [CrossRef]
- Baum, R.L.; Godt, J.W.; Savage, W.Z. Estimating the timing and location of shallow rainfall-induced landslides using a model for transient, unsaturated infiltration. J. Geophys. Res. F Earth Surf. 2010, 115. [Google Scholar] [CrossRef]
- He, J.; Qiu, H.; Qu, F.; Hu, S.; Yang, D.; Shen, Y.; Zhang, Y.; Sun, H.; Cao, M. Prediction of spatiotemporal stability and rainfall threshold of shallow landslides using the TRIGRS and Scoops3D models. Catena 2021, 197, 104999. [Google Scholar] [CrossRef]
- Lee, J.H.; Park, H.J. Assessment of shallow landslide susceptibility using the transient infiltration flow model and GIS-based probabilistic approach. Landslides 2015, 13, 885–903. [Google Scholar] [CrossRef]
- Saadatkhah, N.; Kassim, A.; Lee, L.M. Hulu Kelang, Malaysia regional mapping of rainfall-induced landslides using TRIGRS model. Arab. J. Geosci. 2014, 8, 3183–3194. [Google Scholar] [CrossRef]
- Sato, H.; Harp, E. Interpretation of earthquake-induced landslides triggered by the 12 May 2008, M7.9 Wenchuan earthquake in the Beichuan area, Sichuan Province, China using satellite imagery and Google Earth. Landslides 2009, 6, 153–159. [Google Scholar] [CrossRef]
- Tian, Y.; Owen, L.A.; Xu, C.; Ma, S.; Li, K.; Xu, X.; Figueiredo, P.M.; Kang, W.; Guo, P.; Wang, S.; et al. Landslide development within 3 years after the 2015 Mw 7.8 Gorkha earthquake, Nepal. Landslides 2020, 17, 1251–1267. [Google Scholar] [CrossRef]
- Gong, P.; Liu, H.; Zhang, M.; Li, C.; Wang, J.; Huang, H.; Clinton, N.; Ji, L.; Li, W.; Bai, Y.; et al. Stable classification with limited sample: Transferring a 30-m resolution sample set collected in 2015 to mapping 10-m resolution global land cover in 2017. Sci. Bull. 2019, 64, 370–373. [Google Scholar] [CrossRef]
- Baum, R.L.; Savage, W.Z.; Godt, J.W. TRIGRS—A Fortran Program for Transient Rainfall Infiltration and Grid-Based Regional Slope-Stability Analysis, Version 2.0; US Geological Survey (USGS): Reston, VA, USA, 2008.
- Alvioli, M.; Baum, R.L. Parallelization of the TRIGRS model for rainfall-induced landslides using the message passing interface. Environ. Model. Softw. 2016, 81, 122–135. [Google Scholar] [CrossRef]
- Weidner, L.; Oommen, T.; Escobar-Wolf, R.; Sajinkumar, K.S.; Samuel, R.A. Regional-scale back-analysis using TRIGRS: An approach to advance landslide hazard modeling and prediction in sparse data regions. Landslides 2018, 15, 2343–2356. [Google Scholar] [CrossRef]
- Tran, T.V.; Alvioli, M.; Lee, G.; An, H.U. Three-dimensional, time-dependent modeling of rainfall-induced landslides over a digital landscape: A case study. Landslides 2018, 15, 1071–1084. [Google Scholar] [CrossRef]
- Iverson, R.M. Landslide triggering by rain infiltration. Water Resour. Res. 2000, 36, 1897–1910. [Google Scholar] [CrossRef]
- Godt, J.; Baum, R.L.; Savage, W.Z.; Salciarini, D.; Schulz, W.; Harp, E.L. Transient deterministic shallow landslide modeling: Requirements for susceptibility and hazard assessments in a GIS framework. Eng. Geol. 2008, 102, 214–226. [Google Scholar] [CrossRef]
- Ma, S.; Shao, X.; Xu, C.; He, X.; Zhang, P. MAT.TRIGRS (V1.0): A new open-source tool for predicting spatiotemporal distribution of rainfall-induced landslides. Nat. Hazards Res. 2021, 1, 161–170. [Google Scholar] [CrossRef]
- Harp, E.; Michael, J.; Laprade, W. Shallow landslide hazard map of Seattle, Washington. Rev. Eng. Geol. 2008, 20, 67–82. [Google Scholar] [CrossRef]
- Vieira, B.C.; Fernandes, N.F.; Augusto Filho, O.; Martins, T.D.; Montgomery, D.R. Assessing shallow landslide hazards using the TRIGRS and SHALSTAB models, Serra do Mar, Brazil. Environ. Earth Sci. 2018, 77, 260. [Google Scholar] [CrossRef]
- Saulnier, G.-M.; Beven, K.; Obled, C. Including spatially variable soil depths in TOPMODEL. J. Hydrol. 1997, 202, 158–172. [Google Scholar] [CrossRef]
- Bai, H.; Feng, W.; Yi, X.; Fang, H.; Wu, Y.; Deng, P.; Dai, H.; Hu, R. Group-occurring landslides and debris flows caused by the continuous heavy rainfall in June 2019 in Mibei Village, Longchuan County, Guangdong Province, China. Nat. Hazards 2021, 108, 3181–3201. [Google Scholar] [CrossRef]
- Xu, Y. Research on Evolvement Process and Failure Mechanism of Pseudo-Soil Slope under Heavy Rainfall Action; China University of Geosciences: Wuhan, China, 2014. [Google Scholar]
- Zhao, Y. Study on the Disaster Mechanism and Susceptibility Prediction Evaluation of the “7•9” Mass Debris Flow in Xiyan Village, Pucheng County, Fujian Province; Chengdu University of Technology: Chengdu, China, 2021. [Google Scholar]
- Ministry of Water Resources of the People’s Republic of China. Standrad for Engineering Classification of Rock Masses GB/T 50218-2014; Standards Press of China: Beijing, China, 2014. [Google Scholar] [CrossRef]
- Park, D.W.; Nikhil, N.V.; Lee, S.R. Landslide and debris flow susceptibility zonation using TRIGRS for the 2011 Seoul landslide event. Nat. Hazards Earth Syst. Sci. 2013, 1, 2547–2587. [Google Scholar] [CrossRef]
- Qi, T.; Zhao, Y.; Meng, X.; Chen, G.; Dijkstra, T. AI-Based Susceptibility Analysis of Shallow Landslides Induced by Heavy Rainfall in Tianshui, China. Remote Sens. 2021, 13, 1819. [Google Scholar] [CrossRef]
- Saito, H.; Korup, O.; Uchida, T.; Hayashi, S.; Oguchi, T. Rainfall conditions, typhoon frequency, and contemporary landslide erosion in Japan. Geology 2014, 42, 999–1002. [Google Scholar] [CrossRef]
- Abancó, C.; Bennett, G.L.; Matthews, A.J.; Matera, M.A.M.; Tan, F.J. The role of geomorphology, rainfall and soil moisture in the occurrence of landslides triggered by 2018 Typhoon Mangkhut in the Philippines. Nat. Hazards Earth Syst. Sci. 2021, 21, 1531–1550. [Google Scholar] [CrossRef]
- Marin, R.; García, E.; Aristizábal, E. Effect of basin morphometric parameters on physically-based rainfall thresholds for shallow landslides. Eng. Geol. 2020, 278, 105855. [Google Scholar] [CrossRef]
- Yang, H.; Yang, T.; Zhang, S.; Zhao, F.; Hu, K.; Jiang, Y. Rainfall-induced landslides and debris flows in Mengdong Town, Yunnan Province, China. Landslides 2020, 17, 931–941. [Google Scholar] [CrossRef]
- Hong, Y.; Hiura, H.; Shino, K.; Sassa, K.; Suemine, A.; Fukuoka, H.; Wang, G. The influence of intense rainfall on the activity of large-scale crystalline schist landslides in Shikoku Island, Japan. Landslides 2005, 2, 97–105. [Google Scholar] [CrossRef]
- Hong, Y.; Hiura, H.; Shino, K.; Sassa, K.; Fukuoka, H. Quantitative assessment on the influence of heavy rainfall on the crystalline schist landslide by monitoring system -case study on Zentoku landslide, Japan. Landslides 2005, 2, 31–41. [Google Scholar] [CrossRef]
- Martha, T.R.; Roy, P.; Govindharaj, K.B.; Kumar, K.V.; Diwakar, P.G.; Dadhwal, V.K. Landslides triggered by the June 2013 extreme rainfall event in parts of Uttarakhand state, India. Landslides 2015, 12, 135–146. [Google Scholar] [CrossRef]
- Chen, Y.-C.; Chang, K.-t.; Wang, S.F.; Huang, J.-C.; Yu, C.-K.; Tu, J.-Y.; Chu, H.-J.; Liu, C.-C. Controls of preferential orientation of earthquake- and rainfall-triggered landslides in Taiwan’s orogenic mountain belt. Earth Surf. Process. Landf. 2019, 44, 1661–1674. [Google Scholar] [CrossRef]
- Rosso, R.; Rulli, M.C.; Vannucchi, G. A physically based model for the hydrologic control on shallow landsliding. Water Resour. Res. 2006, 42. [Google Scholar] [CrossRef]
- Carrara, A.; Crosta, G.; Frattini, P. Comparing models of debris-flow susceptibility in the alpine environment. Geomorphology 2008, 94, 353–378. [Google Scholar] [CrossRef]
- Westen, C.J. Landslide hazard and risk zonation-why is it still so difficult? Bull. Eng. Geol. Environ. 2005, 64, 5–23. [Google Scholar] [CrossRef]
- Wu, S.-J.; Hsiao, Y.-H.; Yeh, K.-C.; Yang, S.-H. A probabilistic model for evaluating the reliability of rainfall thresholds for shallow landslides based on uncertainties in rainfall characteristics and soil properties. Nat. Hazards 2017, 87, 469–513. [Google Scholar] [CrossRef]
- Smolíková, J.; Blahut, J.; Vilímek, V. Analysis of rainfall preceding debris flows on the Smědavská hora Mt., Jizerské hory Mts., Czech Republic. Landslides 2016, 13, 683–696. [Google Scholar] [CrossRef]
- Yan, Y.; Hu, S.; Zhou, K.; Jin, W.; Ma, N.; Zeng, C. Hazard characteristics and causes of the “7.22” 2021 debris flow in Shenshuicao gully, Qilian Mountains, NW China. Landslides 2023, 20, 111–125. [Google Scholar] [CrossRef]
- Chung, J.; Lee, Y.; Kim, J.; Jung, C.; Kim, S. Soil Moisture Content Estimation Based on Sentinel-1 SAR Imagery Using an Artificial Neural Network and Hydrological Components. Remote Sens. 2022, 14, 465. [Google Scholar] [CrossRef]
- Kohler, M.A.; Linsley, R. Predicting the Runoff from Storm Rainfall; Research Paper No.34; Weather Bureau, US Department of Commerce: Washington, DC, USA, 1951.
- Cantarino, I.; Carrion, M.A.; Goerlich, F.; Martinez Ibañez, V. A ROC analysis-based classification method for landslide susceptibility maps. Landslides 2018, 16, 265–282. [Google Scholar] [CrossRef]
- Swets, J.A. Measuring the accuracy of diagnostic systems. Science 1988, 240, 1285–1293. [Google Scholar] [CrossRef] [PubMed]


Disclaimer/Publisher’s Note: The statements, opinions and data contained in all publications are solely those of the individual author(s) and contributor(s) and not of MDPI and/or the editor(s). MDPI and/or the editor(s) disclaim responsibility for any injury to people or property resulting from any ideas, methods, instructions or products referred to in the content. |
© 2023 by the authors. Licensee MDPI, Basel, Switzerland. This article is an open access article distributed under the terms and conditions of the Creative Commons Attribution (CC BY) license (https://creativecommons.org/licenses/by/4.0/).
Share and Cite
Ma, S.; Shao, X.; Xu, C. Landslides Triggered by the 2016 Heavy Rainfall Event in Sanming, Fujian Province: Distribution Pattern Analysis and Spatio-Temporal Susceptibility Assessment. Remote Sens. 2023, 15, 2738. https://doi.org/10.3390/rs15112738
Ma S, Shao X, Xu C. Landslides Triggered by the 2016 Heavy Rainfall Event in Sanming, Fujian Province: Distribution Pattern Analysis and Spatio-Temporal Susceptibility Assessment. Remote Sensing. 2023; 15(11):2738. https://doi.org/10.3390/rs15112738
Chicago/Turabian StyleMa, Siyuan, Xiaoyi Shao, and Chong Xu. 2023. "Landslides Triggered by the 2016 Heavy Rainfall Event in Sanming, Fujian Province: Distribution Pattern Analysis and Spatio-Temporal Susceptibility Assessment" Remote Sensing 15, no. 11: 2738. https://doi.org/10.3390/rs15112738