
EGMStream, a Desktop App for EGMS Data Downstream

Earth Science Department, University of Firenze, 50121 Firenze, Italy
*
Author to whom correspondence should be addressed.
Remote Sens. 2023, 15(10), 2581; https://doi.org/10.3390/rs15102581
Submission received: 3 April 2023
/
Revised: 28 April 2023
/
Accepted: 12 May 2023
/
Published: 15 May 2023
(This article belongs to the Special Issue Mapping and Monitoring of Geohazards with Remote Sensing Technologies)
Abstract
:The recent release of European Ground Motion Service (EGMS) products implemented under the responsibility of the Copernicus Land Monitoring Service (CLMS) guarantees free and accessible Europe-wide ground motion data for ground deformation analysis at the local and regional scales. The need for value-adding services and tools for optimal dissemination of radar data from the Copernicus Sentinel-1 satellite mission urges the scientific community to find efficient solutions. A desktop R-based application with a user-friendly interface capable of automatically downloading and transforming EGMS products delivered as large .csv tiles, equivalent to a radar burst into geospatial databases, is presented here. EGMStream is a self-contained desktop app that enables users to systematically store, customize, and convert ground movement data into geospatial databases, burst per burst or for an area of interest directly selectable on the app interface.
1. Introduction
Copernicus is the Earth Observation Programme of the European Union, managed by the European Commission and implemented in partnership with the European Member States; the ESA (European Space Agency); the EUMETSAT (European Organization for the Exploitation of Meteorological Satellites); the ECMWF (European Centre for Medium-Range Weather Forecasts); and European Union (EU) agencies, such as the Environmental European Agency (EEA); and the Mercator Ocean. The program aims to have the planet and its environment benefit all European citizens by using in situ data collected from different sources, such as Earth Observation satellites. The program is divided into different services: (i) Copernicus Atmosphere Monitoring Service (CAMS); (ii) Copernicus Marine Service (or Copernicus Marine Environment Monitoring Service); (iii) Copernicus Land Monitoring Service (CLMS); (iv) Copernicus Climate Change Service (C3S); (v) Copernicus Service for Security; and (vi) Copernicus Emergency Management Services (EMS). The last addition in the CLMS program is the European Ground Motion Service (EGMS), launched in mid-2022 to provide consistent A-DInSAR (Advanced Differential Interferometric Synthetic Aperture Radar) data derived by satellite imagery in high resolution (Sentinel-1) at a continental scale and allow the ground motion analysis and monitoring [1]. At a national, or regional, scale, the ground motion service monitoring was sporadically adopted. In fact, starting from the first application launched in Italy in 2007 (Italian Special Plan of Remote Sensing of the Environment) and taking advantage of the ERS (European Remote Sensing), ENVISAT (Environmental Satellite), and partially the COSMO-SkyMed data [2,3], processed with the PSP (persistent scatterer pairs [4]), the PSInSAR [5,6], and the SqueeSAR [7] algorithms, other nations decided to develop the same service as Norway [8,9] and Germany in 2018 [10]. In addition, the Agency for Data Supply and Efficiency of Denmark is working on a WebGIS platform, not yet available for a full, free, and open to all user service based on the Sentinel-1 data processed providing InSAR data by the SqueeSAR algorithm data and information along LOS (Line of Sight) and GNSS (Global Navigation Satellite System)-calibrated velocity [11] and their components. Additionally, the Netherlands is implementing its GMS based on Sentinel-1 data at national level for investigating the height change obtained via A-DInSAR [1].
In Italy, taking advantage of the Sentinel-1 regularity of acquisition and coverage, in 2016, the Tuscany Region (central Italy) implemented the first continuous monitoring system according to the Prime Minister Decree 27 February 2004 [12,13]. Following the same approach, the northwestern Valle d’Aosta Region, in 2018, and the northeastern Veneto Region, in 2019, started with the near-real monitoring of the ground deformation [14]. These examples explain that the launch of the Sentinel-1 constellation opened the possibility to investigate several geohazards thanks to its short revisiting time, the worldwide coverage and the freely availability due to its scientific application purposes. Several examples can be found in the literature on landslide detection [15,16,17,18], characterization [19,20,21], and monitoring [22,23,24], subsidence phenomena analysis and monitoring [25,26,27,28,29], infrastructure monitoring [30,31,32,33], or mining instability analysis and monitoring [34,35,36,37].
On the same line, the EGMS was conceived following the direct request of many users for free InSAR data over Europe. The service is managed and being implemented under the responsibility of the EEA, and it is part of the CLMS portfolio. The EGMS provides an annual update of the ground motion over the whole European territory with the time series from February 2015 with full spatial resolution based on the Sentinel-1 radar data. The Sentinel-1 images are processed by four different algorithms [38] PSP-IFSAR [4,39,40], SqueeSAR [7], GSAR-GTSI [41,42], and PSI (Persistent Scatterer Interferometry), performed with an IWAP (Integrated Wide Area Processor) [43,44].
The processed data are available from November 2022 in visualization and download at three levels of processing [45], (i) basic (L2a), (ii) GNSS-calibrated (L2b), and (iii) Ortho (L3).
The basic data provides InSAR velocity and displacement information along the LoS (Line of Sight) with information about the geolocalization and quality measurements for every MP (Measurement Point). A time series is associated with each MP, while the velocity and displacement information are relative, thus referring to a stable virtual Reference Point chosen during processing of the Sentinel-1 SAR images stacks frame by frame. The L2a products are provided in full resolution as two discrete datasets referred to as the Sentinel-1 ascending (South to North) and descending (North to South) orbits. The basic product is a necessary first step to the more advanced products.
The calibrated data are an advanced product, considered the main EGMS product, consisting of a deformation map with LoS absolute velocity and displacement information corrected by a model derived from GNSS time series data across Europe. Since some isolated islands do not have GNSS data available, such as the L2b products, are calibrated, and “…are produced by harmonizing Basic products with respect to each other, and then adjusting the mean ground velocity to zero.” [22] The L2b products are provided in full resolution as two discrete ascending and descending datasets as the L2a.
The L3 data, named Ortho products, are the vertical and horizontal (East–West) components of velocity, completed for their time series, calculated from the L2b data. Differently to the previous products, the L3 data follow a regular grid since the L3 MP are synthetic points summarizing the L2b ascending and descending velocity in a cell of 100 m (coinciding to the Copernicus DEM). As for the L2a and L2b data, the time series, both for the vertical and horizontal components, are present in this level of product.
Prior to publication, all EGMS data underwent an extensive process quality control protocol involving the validation of several criteria, such as a suitable density of measurement points within the Corine Land Cover (CLC) categories and an appropriate displacement standard deviation [46]. This procedure of EGMS data velocity validation is still ongoing by an external consortium.
In this work, we introduce the R-based EGMStream tool developed with the Shiny package [47,48] and available as a desktop application for downloading, transforming, and exporting the EGMS products into customized geospatial databases storable in ESRI shapefiles or GeoPackage containers. The meaningfulness of such a value-adding service relies on offering an improved user experience for the management of A-DInSAR data covering Europe. In particular, the capability of cropping the EGMS products based on a personalized Area of Interest (AoI) is implemented within the EGMStream application. Within this framework, thanks to an easy-to-use interface, we foster the usage and the growth of the potential pool of users interested in the downstream applications of EGMS data and interferometric products.
2. Materials and Methods
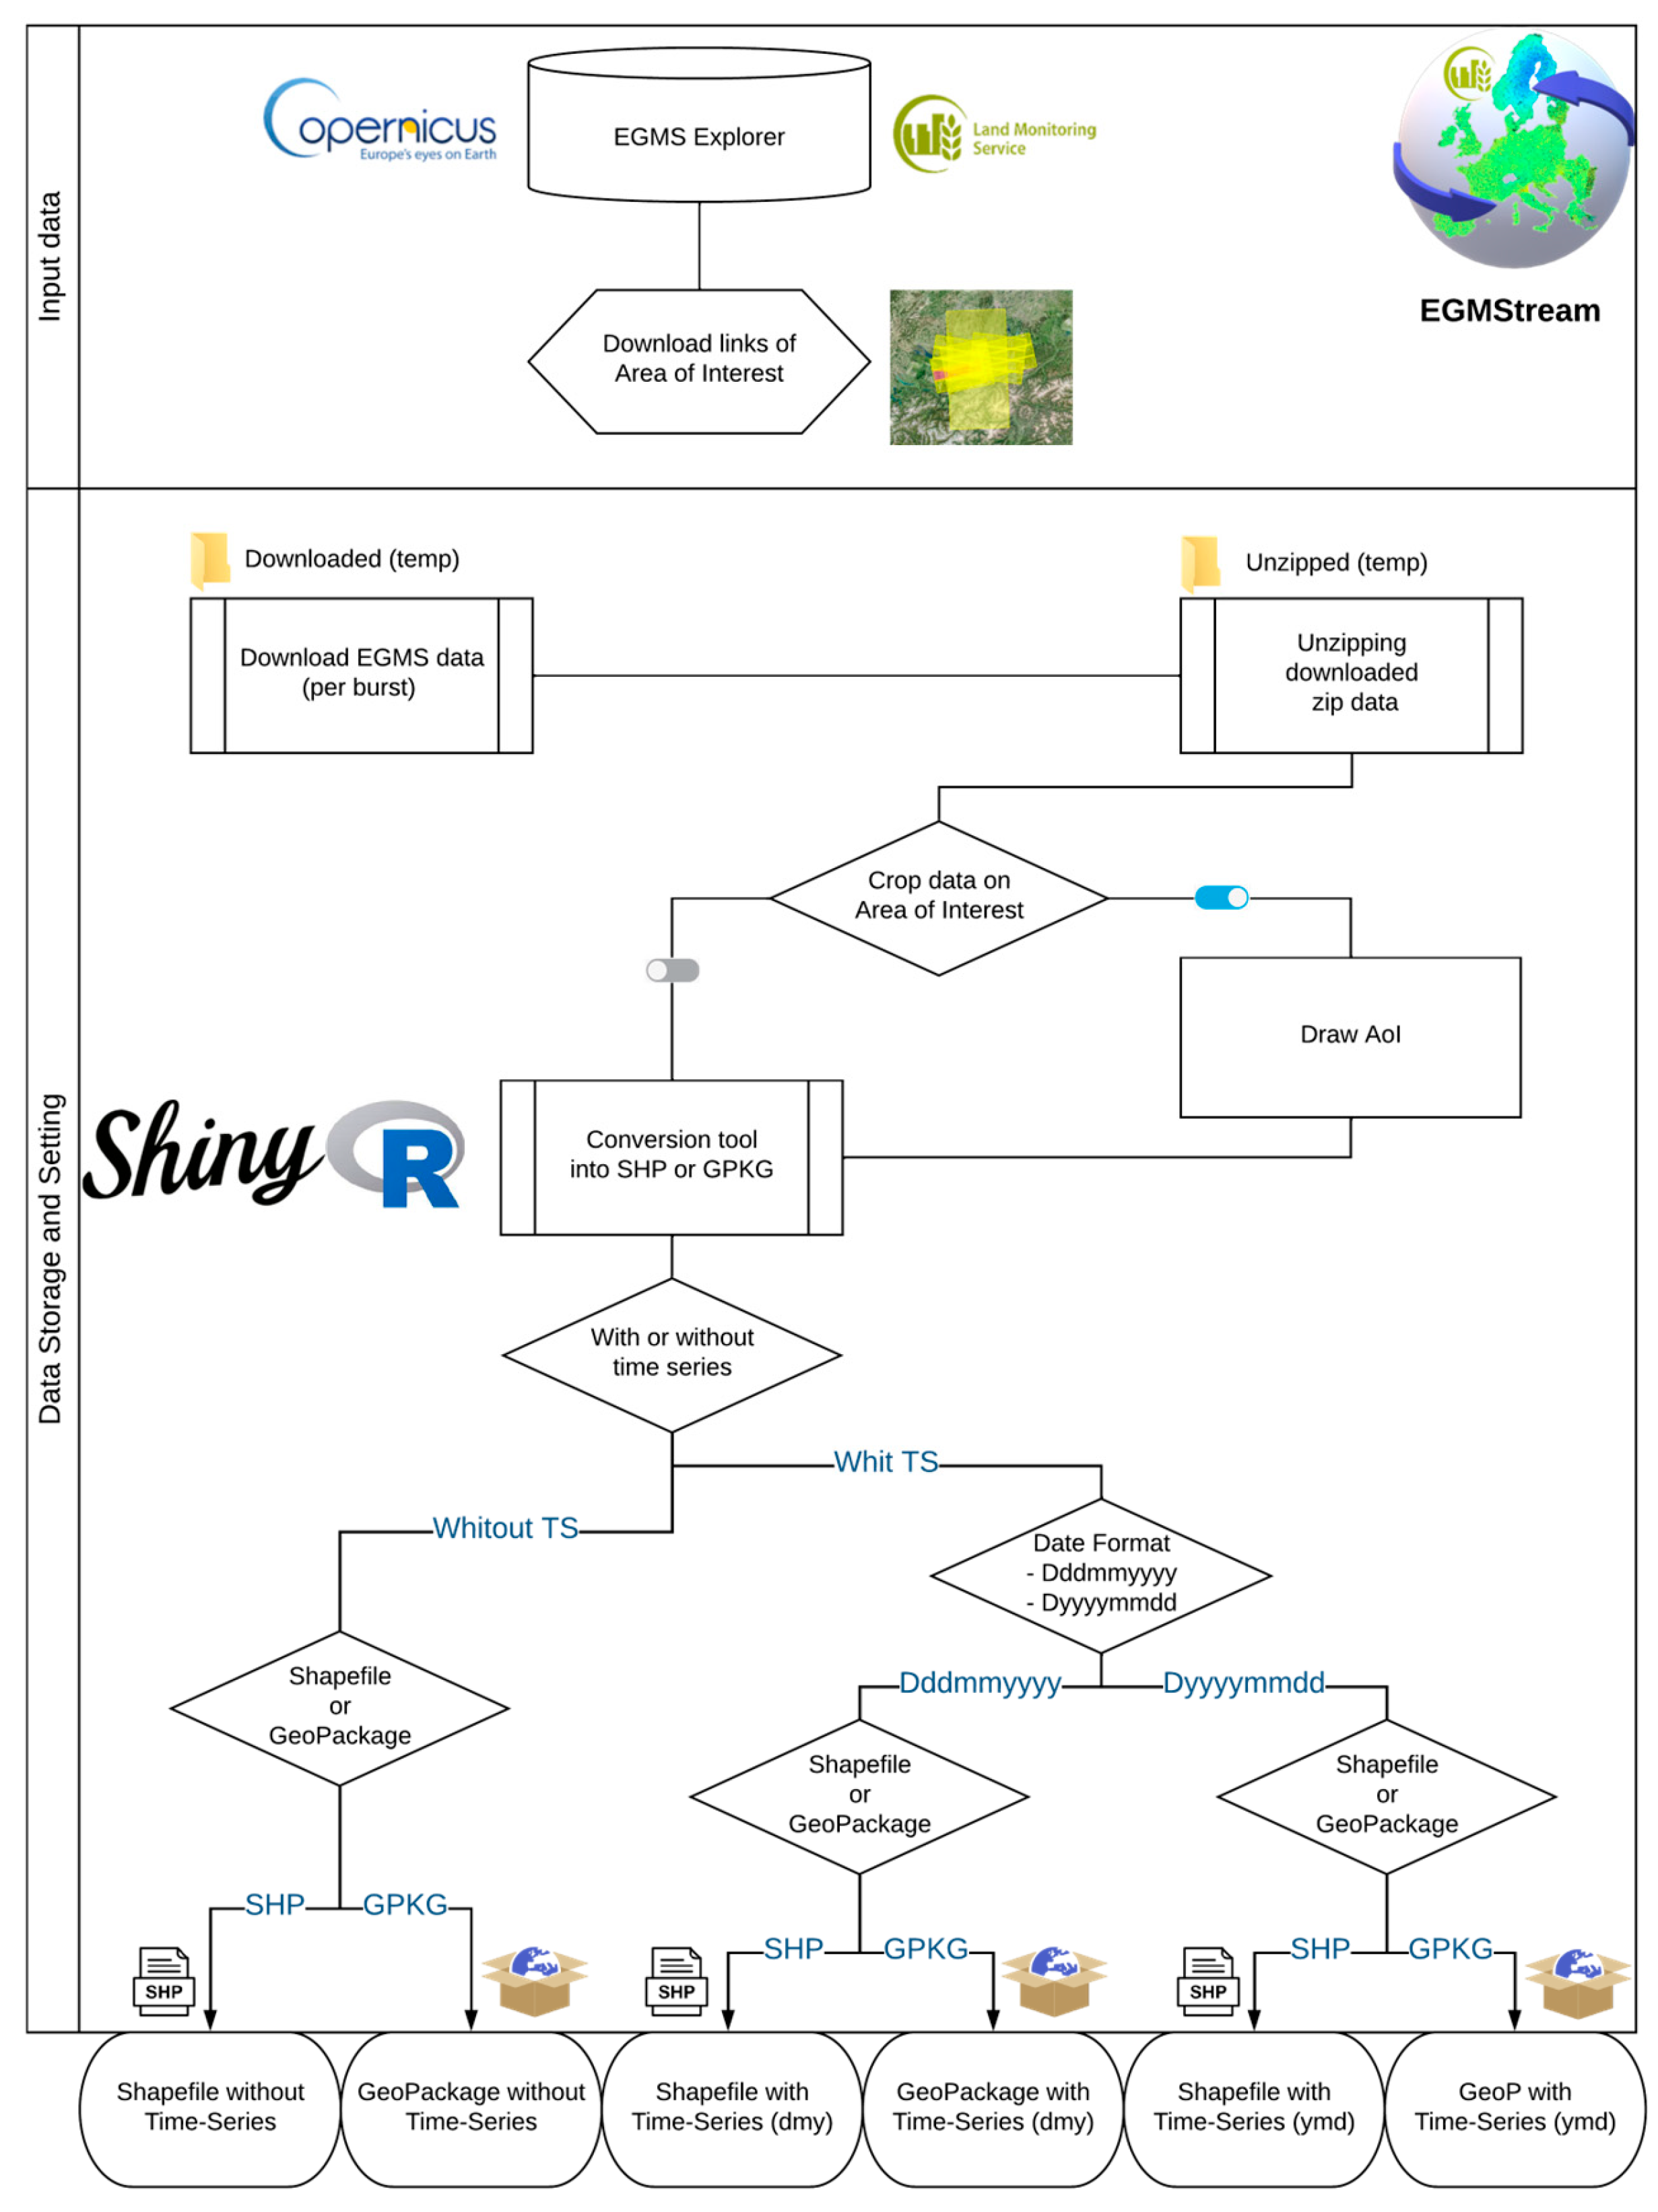
EGMStream is a free app that does not require any previous software installation or the use of a third-party server, being a self-contained R-based application, which can be deployed to the desktop. The presented data downstream approach follows a precise workflow to download and convert the EGMS data, indifferently from the level of processing, by using a list of links available for download directly from the EGMS viewer [49]. The underlying flowchart of EGMStream can be split into two main parts, the upload of the input data required for the application to run and the design of the geospatial database prior to the final conversion (Figure 1).
2.1. Input Data
The EGMStream app is designed to retrieve and manage EGMS ground deformation products at a pan-European level. The EGMS satellite-based land monitoring data are made available for download through the EGMS Product Archive and Dissemination System by accessing the EGMS Explorer [49].
Upon registration and authentication, users are enabled to locate and download multiple InSAR datasets (with a maximum of two simultaneously) related to a geographical territory. The only limit about the extension of the latter is a maximum width of 3 degrees. In addition, the EGMS Explorer system allows downloading the “Download links”, which is an ASCII file (.txt) containing hyperlinks corresponding to a list of products that is queried for bulk download. Multiple EGMS product levels can be listed within the single ASCII file, where the provided hyperlinks come with a security token that keeps the data valid for downloading for one hour. Moreover, the token is refreshed if a download is in progress, allowing the hyperlinks to remain valid for another hour after a given download finishes [50]. When the token expires, the app will appear frozen, requiring a further re-load by the desktop shortcut or by the start menu. Therefore, new valid download links are then required to correctly deploy the app.
The EGMStream application is conceived to be fed with an ASCII file (“download links” from the EGMS viewer) containing one or several download-links via upload control. The selected file will serve as the input for the successive operations concerning data download, eventual data cropping over the AoI, and setting of the database attributes prior to InSAR data conversion.
2.2. Data Storage Setting and Conversion
The EGMStream can unscramble encoded URLs with a timeout limit set to 1 h to ensure an appropriate time window for starting the download of server-intensive files. In the first instance, the resulting EGMS products are temporarily stored as zipped files within an automatically created folder named ‘Downloaded’. After this operation, EGMStream automatically proceed by unzipping the retrieved files and by creating the directory ‘Unzipped’ where the ground motion data are stored in the .csv format (standard download format from EGMS viewer). Both folders are automatically generated and then deleted at the end of the data conversion process. Pop-up notifications are extensively used within the app to inform the user about the processes achieved by the ongoing R session. In case the pop-up expires, all the processes made by the app are reported in the “Processing history” tab.
EGMStream’s main functionalities concern EGMS data cropping based on the user’s AoI and data conversion into geospatial databases. A major feature of the app regards the possibility to interactively draw a rectangular shape of the AoI through a map viewer panel created using the JavaScript ‘Leaflet’ library [51]. This functionality allows the user to manually derive the geographical area, which acts as a mask covering the underlying EGMS data products to be clipped. In the event that the AoI is on two different bursts (on the same track), the MP data will be merged into a unique shapefile or database. On the contrary, if the selected data overlay two or more tracks (which implies different acquisition dates from the satellite), the converted geodatabases will be kept separate and named after the track number. EGMStream ensures the possibility of choosing the folder location where the converted data will be saved locally. Moreover, several settings allow designing the data storage characteristics, which are selectable from the app interface. In particular, the geospatial database can be designed by the user by selecting:
- Inclusion (‘With’) or exemption (‘Without’) of the time series related columns;
- Two date formats, in case of time series inclusion;
- Shapefile or GeoPackage output data format.
Giving the possibility to exclude time series information would result in a lighter conversion process and a geospatial database with a reduced file size. This can be particularly helpful to adapt EGMS data to users whose need is to retrieve only ground deformation maps, requiring only mean velocity values of deformation. The default option is set to ‘With Time Series’.
When retained, date column names related to the time series information can be adjusted to the Dddmmyyyy format or the Dyyyymmdd format. In this case, there is no default option; therefore, the date format selection needs to be explicitly selected.
Once all the parameters are set, the downloaded .csv files can be converted into two of the most common file formats for geospatial data, namely shapefiles (i.e., .shp) or GeoPackage (i.e., .gpkg), with the last being the default option. Shapefile is a native ESRI (Environmental Systems Research Institute) proprietary format which comes with a mandatory part of file collections and is especially designed for use in Geographic Information Systems (GIS) software. On the other hand, GeoPackage is an open and platform-independent format for storing geospatial information within an SQLite database in a unique file that supports its direct use. The required and supported content of a GeoPackage is entirely defined in the Open Geospatial Consortium (OGC ®) standard document [52].
As a result of the selectable storage setting options, six different configurations are made available to convert EGMS products:
.shp without time series;
.gpkg without time series;
.shp with Dddmmyyyy time series format;
.gpkg with Dddmmyyyy time series format;
.shp with Dyyyymmdd time series format;
.gpkg with Dyyyymmdd time series format.
3. Results and Discussion
EGMStream is an open-source tool which is realized by using the Shiny R-package framework. To encourage distribution and make the program platform independent, EGMStream is shared as a Windows desktop application ready for immediate use without the need for installing any external software (i.e., R). To achieve this, the built framework uses R-Portable [53], while the app’s primary package dependencies are loaded when the application is run for the first time. The presented application is bundled into an executable installation (i.e., a setup wizard), which guarantees control over the destination location and allows creating a program’s desktop shortcut. The front-end interface of the app loads dynamically on the PC default web browser (tested on Google Chrome and Microsoft Edge) prior to installing EGMStream.
Leveraging on the Shiny’s reactive framework, the user-driven draw toolbar can be used to reshape the AoI multiple times within the same session, where only the last drawn element will be kept. Additionally, the drawn AoI can be interactively deleted from the application interface. Additionally, EGMStream is designed to overwrite the output results when the same instructions are repeated. It should be noted that EGMStream tackles the conversion of very large EGMS files by limiting the process to 500,000 rows at a time; consequently, the targeted downloaded file would be split into different converted geospatial databases (which are suitably labeled with a progressive numbering for reference).
The EGMStream’s current limit concerns the maximum amount of downloadable EGMS products within the same session. This amount varies according to the user’s internet connection velocity and to the dimension of the requested file for conversion. Based on tests performed with an Intel Core i7-4790QM at 3.60 GHz, 4 cores, 8 threads, 8 MB cache, 16 GB RAM, 250 GB SSD disk, and Windows 10, 64 bits, we recommend to feed EGMStream with less than 50 download links.
3.1. Example
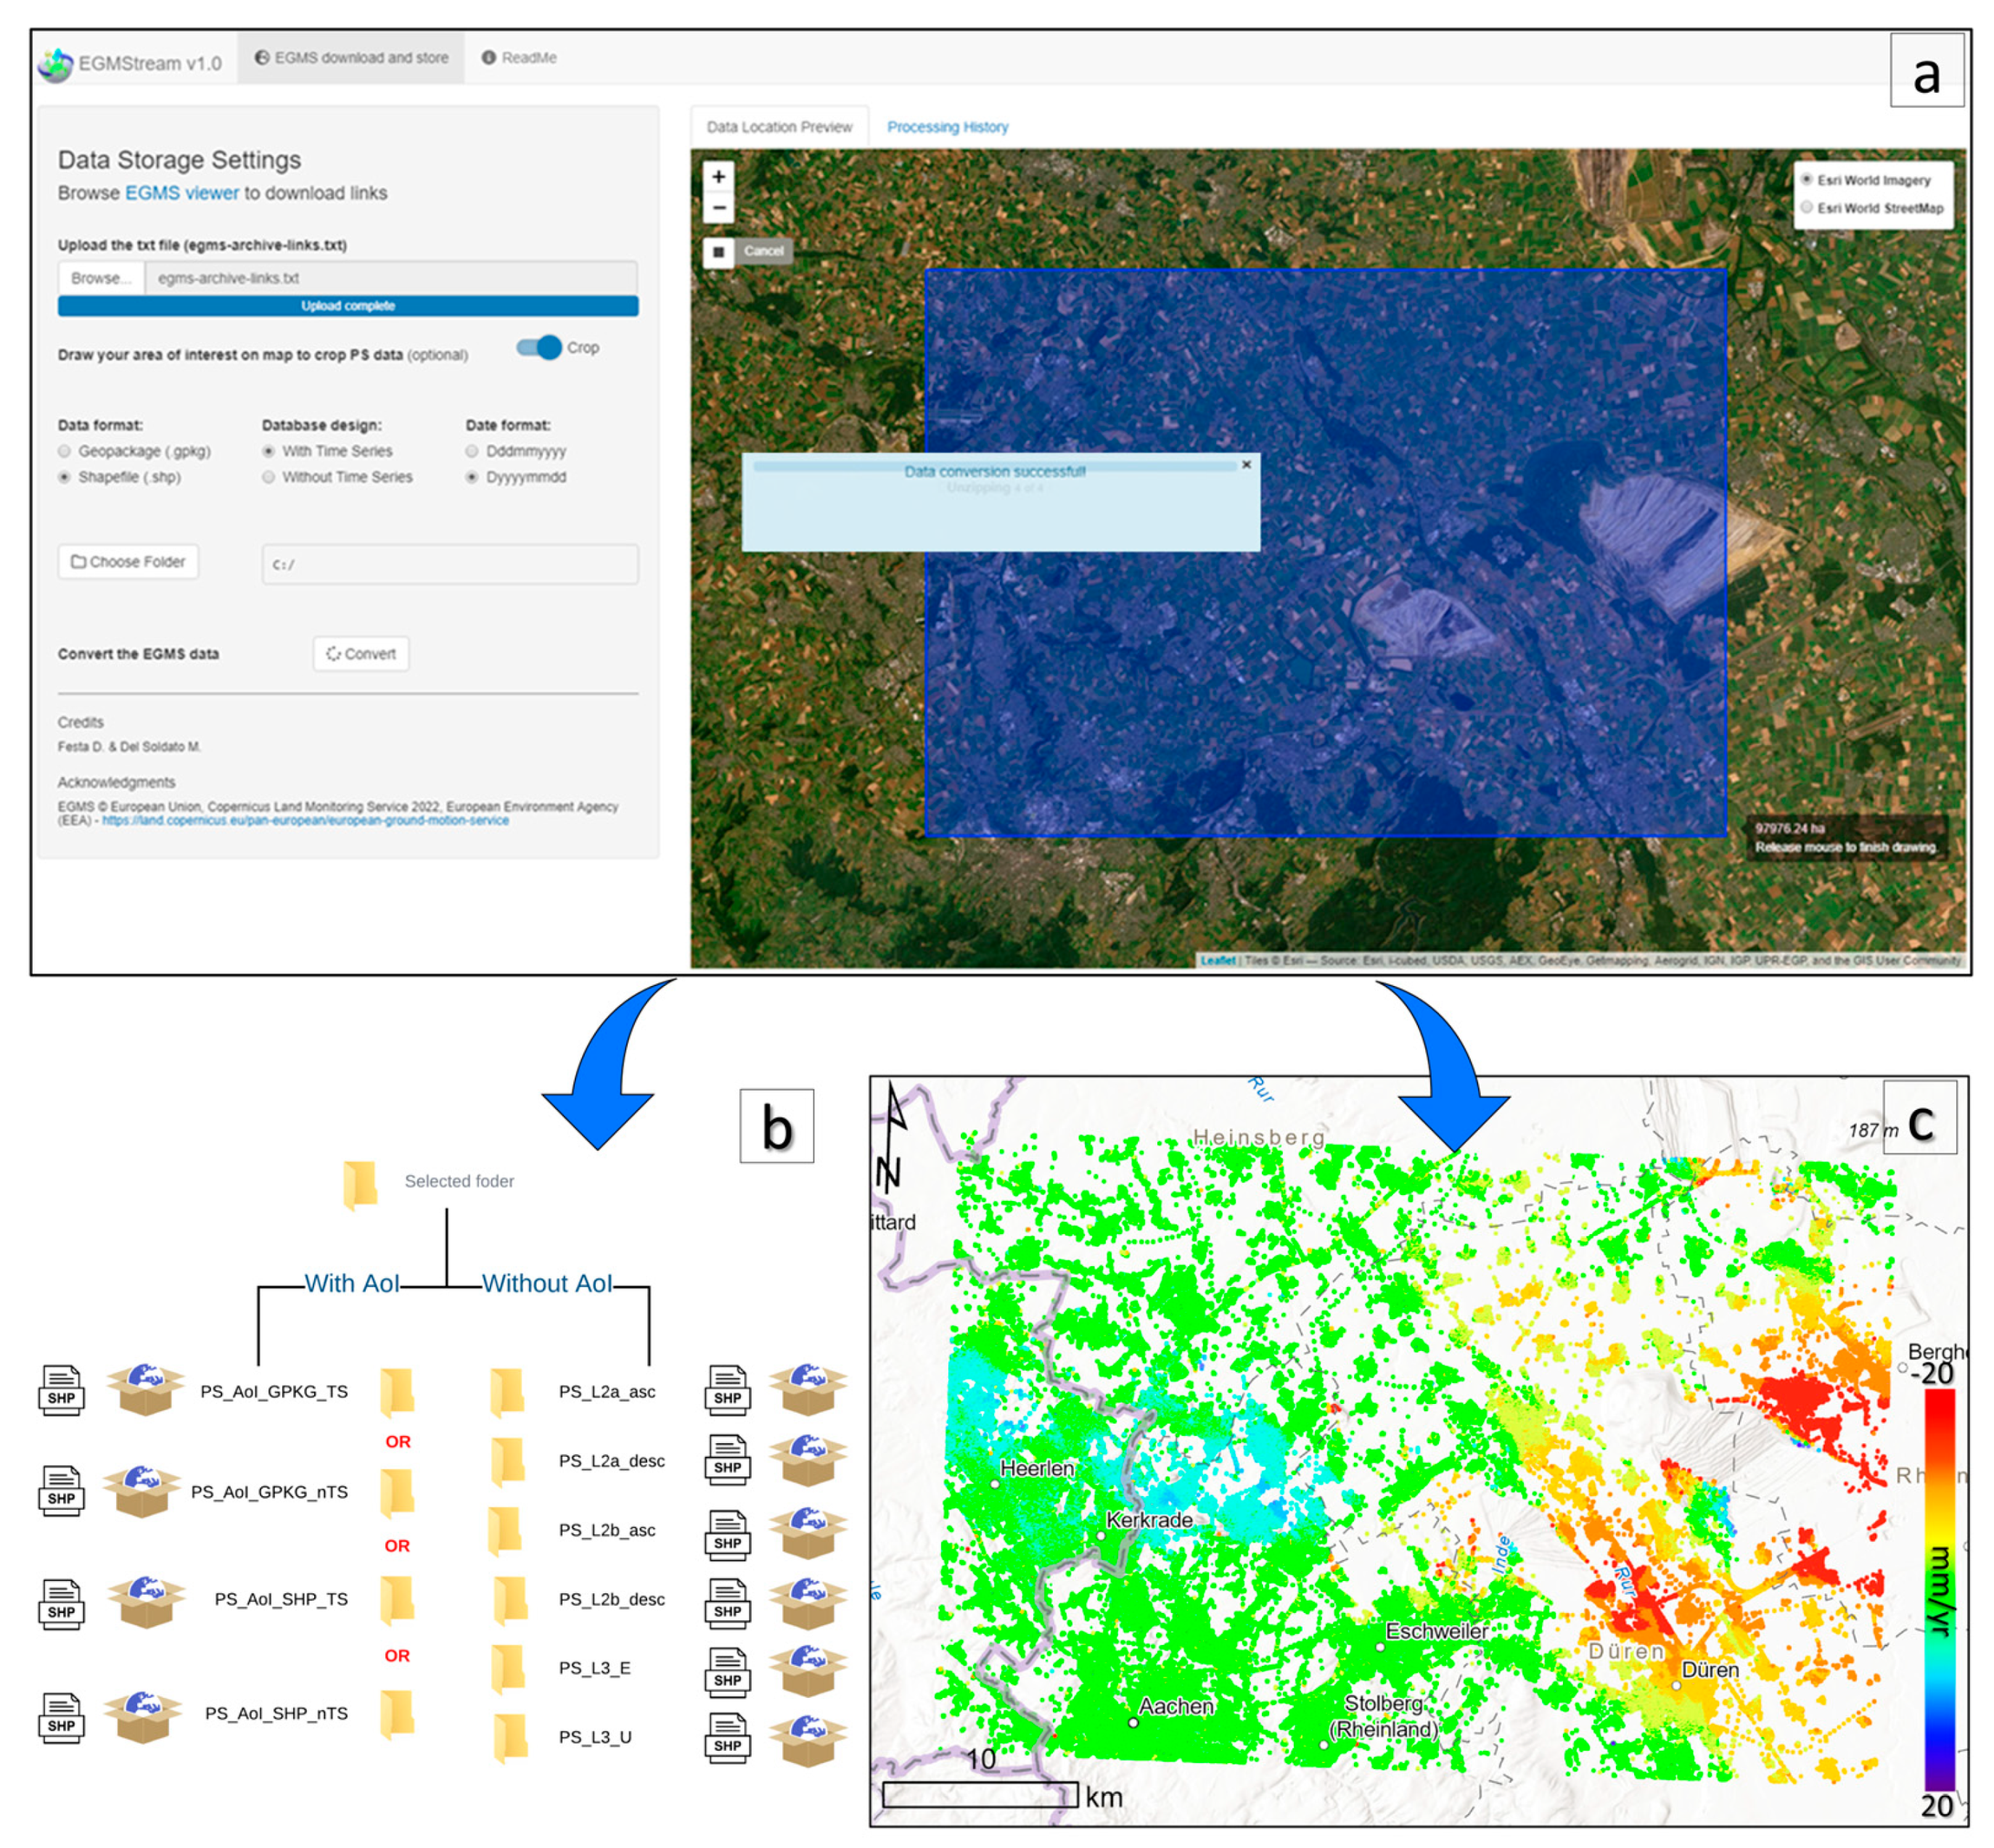
To demonstrate the added value of EGMStream for the rapid downstream and deployment of EGMS products, it briefly showcased the successful data conversion procedure of multiple levels of interferometric data covering part of the Rhenish coalfields of Germany, as shown in Figure 2. In particular, the converted database contains a geographical subset of the interferometric products overlaying the AoI drawn by the user.
EGMStream implements intuitive workflow routine tasks, such as (i) deployment of the ASCII input file obtained from the EGMS viewer; (ii) implementation of an arbitrary extraction mask to clip the input EGMS data to an AoI; (iii) data download-unzipping procedure; (iv) data conversion according to the specified storage settings; and (v) storage of converted data.
The output results, being vector data points, are stored following a precise framework; every level of EGMS data and every related acquisition geometry is stored within a dedicated folder (Figure 2b), enabling a direct reference to the queried products.
With the exploitation of the EGMStream functionalities, the downloaded and converted data result are particularly suited for visualization, data handling, and post-processing elaboration on GIS software (Figure 2c).
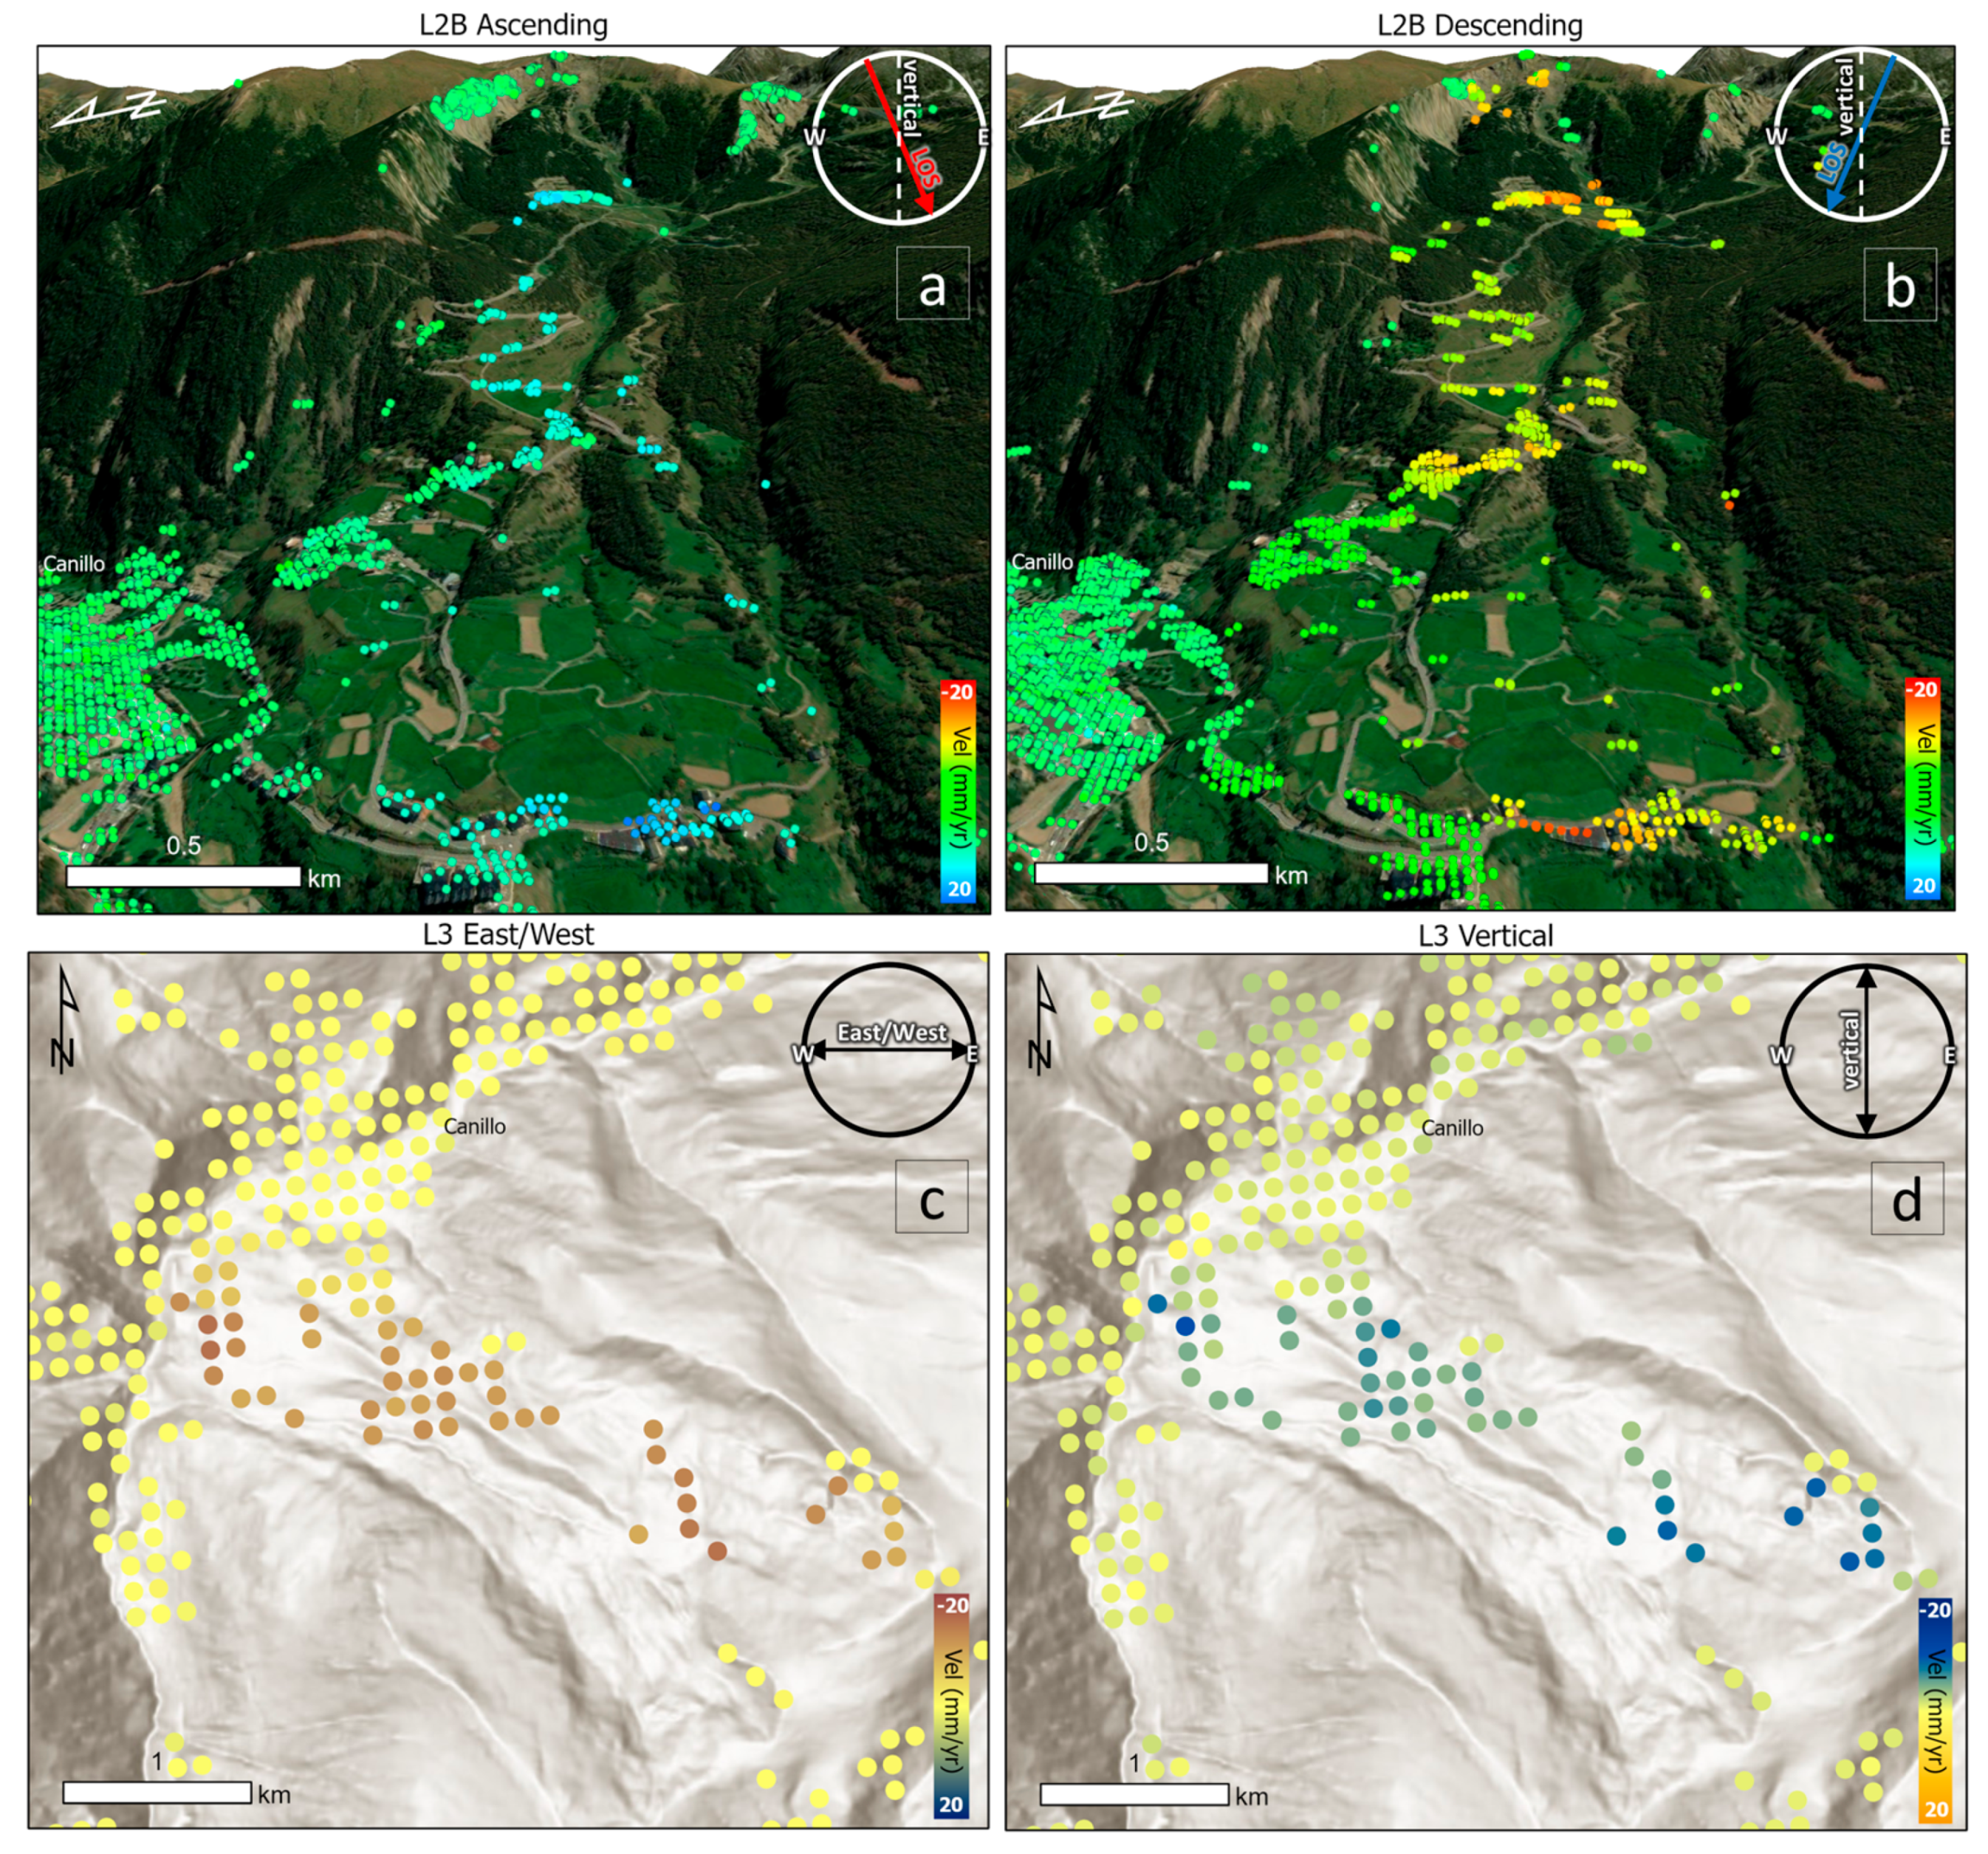
A deep understanding of the ongoing surface displacement can rely on the analysis of the spatial pattern of the various levels of EGMS data features. In Figure 3, a landslide is displayed, one of the most common geohazards that can be detected and analyzed via the available EGMS products (reference period: 2016–2021) and downloaded by the EGMStream tool for the area of interest. In particular, a joint use of the calibrated (Figure 3a,b) and ortho (Figure 3c,d) products enables the identification of clusters of points with comparable motion trends and deformation patterns (which can be identified according to the mean velocity). The displacement of the area of interest can be further evaluated by looking at the time series of every MP. Mapping and monitoring potentially risky and/or critical areas can greatly contribute to more resilient urban planning and prompt response from civil protection authorities.
3.2. Future Developments
The EGMS foresees an annual update of the three levels of data, and the EGMStream tool is already set to process the new data.
In addition, in a further version of the EGMStream tool, the authors would like to implement several functions, to among:
- The possibility to select the information column to extract with or without displacement data, which are now are automatically chosen by the developers of the tool;
- The possibility to visualize on the map the downloaded and cropped data with different options for color-scales;
- The possibility to execute preliminary post-processing operations over the downloaded EGMS data, e.g., data mining of relevant ground deformations visible within the AoI;
- Possibility to automatically check the free space on the root chosen by the user for alerting if there is not enough space for the conversion.
In addition to the above-mentioned ideas in the pipeline, every future suggestion from the scientific community or end-users will be considered.
4. Conclusions
EGMStream is an open-source, interactive, and user-friendly Shiny/R desktop application designed to enhance the downstream of EGMS products by enabling the user to seamlessly download, customize, convert, and store radar-based geospatial databases. Distributed as a self-contained application, EGMStream deployment is tied to an initial installation procedure on a local Windows PC. Leveraging the app´s intuitive interface, no prior knowledge is required to obtain reliable and handy results.
The development of EGMStream is still ongoing in order to guarantee a more personalized experience.
Author Contributions
Conceptualization and methodology, M.D.S.; software, D.F. and M.D.S.; validation, D.F.; writing—original draft preparation, D.F.; writing—review and editing, M.D.S.; visualization, D.F. supervision and project administration, M.D.S. All authors have read and agreed to the published version of the manuscript.
Funding
This research received no external funding.
Data Availability Statement
EGMStream v1.0 is freely available as a standalone desktop app at http://cpc.unifi.it/EGMStream_v1.zip. By clicking on the link the download of the zip file containing a Windows installer (i.e., EGMStream_installer.exe) will start. To remain updated about future releases or to receive further support, please contact the authors at egmstream@dst.unifi.it. The code is freely available and can be found within the installed folders.
Acknowledgments
This work was developed within the project EGMS RASTOOL (ECHO–UCPM-2021-PP (Prevention and preparedness in civil protection and marine pollution), Contract No. 101048474). We would like to thank Lorenzo Solari for the support in the data comprehension and in the testing of the tool. In addition, we would like to thank the Copernicus Land Monitoring Service (CLMS) to provide the European Ground Motion Services (EGMS) data to users.
Conflicts of Interest
The authors declare no conflict of interest.
References
- Crosetto, M.; Solari, L.; Mróz, M.; Balasis-Levinsen, J.; Casagli, N.; Frei, M.; Oyen, A.; Moldestad, D.A.; Bateson, L.; Guerrieri, L. The evolution of wide-area dinsar: From regional and national services to the European ground motion service. Remote Sens. 2020, 12, 2043. [Google Scholar] [CrossRef]
- Costantini, M.; Ferretti, A.; Minati, F.; Falco, S.; Trillo, F.; Colombo, D.; Novali, F.; Malvarosa, F.; Mammone, C.; Vecchioli, F. Analysis of surface deformations over the whole Italian territory by interferometric processing of ERS, Envisat and COSMO-SkyMed radar data. Remote Sens. Environ. 2017, 202, 250–275. [Google Scholar] [CrossRef]
- WebGIS of the PST-A Project. Available online: http://www.pcn.minambiente.it/viewer/ (accessed on 10 December 2022).
- Costantini, M.; Falco, S.; Malvarosa, F.; Minati, F. A new method for identification and analysis of persistent scatterers in series of SAR images. In Proceedings of the IGARSS 2008 Geoscience and Remote Sensing Symposium, Boston, MA, USA, 7–11 July 2008; IEEE International: Boston, MA, USA, 2008; pp. II-449–II-452. [Google Scholar]
- Ferretti, A.; Prati, C.; Rocca, F. Nonlinear subsidence rate estimation using permanent scatterers in differential SAR interferometry. IEEE Trans. Geosci. Remote Sens. 2000, 38, 2202–2212. [Google Scholar] [CrossRef]
- Ferretti, A.; Prati, C.; Rocca, F. Permanent scatterers in SAR interferometry. IEEE Trans. Geosci. Remote Sens. 2001, 39, 8–20. [Google Scholar] [CrossRef]
- Ferretti, A.; Fumagalli, A.; Novali, F.; Prati, C.; Rocca, F.; Rucci, A. A new algorithm for processing interferometric data-stacks: SqueeSAR. IEEE Trans. Geosci. Remote Sens. 2011, 49, 3460–3470. [Google Scholar] [CrossRef]
- Dehls, J.F.; Larsen, Y.; Marinkovic, P.; Lauknes, T.R.; Stødle, D.; Moldestad, D.A. INSAR. No: A National Insar Deformation Mapping/Monitoring Service In Norway—From Concept To Operations. In Proceedings of the IGARSS 2019–2019 IEEE International Geoscience and Remote Sensing Symposium, Yokohama, Japan, 28 July 2019–2 August 2019; pp. 5461–5464. [Google Scholar]
- InSAR Norway WebGIS. Available online: https://insar.ngu.no/ (accessed on 9 December 2022).
- Kalia, A.; Frei, M.; Lege, T. A Copernicus downstream-service for the nationwide monitoring of surface displacements in Germany. Remote Sens. Environ. 2017, 202, 234–249. [Google Scholar] [CrossRef]
- Bischoff, C.A.; Ferretti, A.; Novali, F.; Uttini, A.; Giannico, C.; Meloni, F. Nationwide deformation monitoring with SqueeSAR® using Sentinel-1 data. Proc. Int. Assoc. Hydrol. Sci. 2020, 382, 31–37. [Google Scholar] [CrossRef]
- Del Soldato, M.; Solari, L.; Raspini, F.; Bianchini, S.; Ciampalini, A.; Montalti, R.; Ferretti, A.; Pellegrineschi, V.; Casagli, N. Monitoring ground instabilities using SAR satellite data: A practical approach. ISPRS Int. J. Geo-Inf. 2019, 8, 307. [Google Scholar] [CrossRef]
- Raspini, F.; Bianchini, S.; Ciampalini, A.; Del Soldato, M.; Solari, L.; Novali, F.; Del Conte, S.; Rucci, A.; Ferretti, A.; Casagli, N. Continuous, semi-automatic monitoring of ground deformation using Sentinel-1 satellites. Sci. Rep. 2018, 8, 7253. [Google Scholar] [CrossRef]
- Confuorto, P.; Del Soldato, M.; Solari, L.; Festa, D.; Bianchini, S.; Raspini, F.; Casagli, N. Sentinel-1-based monitoring services at regional scale in Italy: State of the art and main findings. Int. J. Appl. Earth Obs. Geoinf. 2021, 102, 102448. [Google Scholar] [CrossRef]
- Barra, A.; Monserrat, O.; Mazzanti, P.; Esposito, C.; Crosetto, M.; Scarascia Mugnozza, G. First insights on the potential of Sentinel-1 for landslides detection. Geomat. Nat. Hazards Risk 2016, 7, 1874–1883. [Google Scholar] [CrossRef]
- Intrieri, E.; Raspini, F.; Fumagalli, A.; Lu, P.; Del Conte, S.; Farina, P.; Allievi, J.; Ferretti, A.; Casagli, N. The Maoxian landslide as seen from space: Detecting precursors of failure with Sentinel-1 data. Landslides 2018, 15, 123–133. [Google Scholar] [CrossRef]
- Mantovani, M.; Bossi, G.; Marcato, G.; Schenato, L.; Tedesco, G.; Titti, G.; Pasuto, A. New perspectives in landslide displacement detection using sentinel-1 datasets. Remote Sens. 2019, 11, 2135. [Google Scholar] [CrossRef]
- Kalia, A.C. Landslide activity detection based on Sentinel-1 PSI datasets of the Ground Motion Service Germany—The Trittenheim case study. Landslides 2023, 20, 209–221. [Google Scholar] [CrossRef]
- Lanari, R. From ERS-1 TO SENTINEL-1: A big data challenge for 25 years of DInSAR observations. In 2015 IEEE International Geoscience and Remote Sensing Symposium (IGARSS); IEEE: Milan, Italy, 2015; pp. 1460–1463. [Google Scholar]
- Mirmazloumi, S.M.; Wassie, Y.; Navarro, J.A.; Palamà, R.; Krishnakumar, V.; Barra, A.; Cuevas-González, M.; Crosetto, M.; CuMonserrat, O. Classification of ground deformation using sentinel-1 persistent scatterer interferometry time series. GIScience Remote Sens. 2022, 59, 374–392. [Google Scholar] [CrossRef]
- Confuorto, P.; Casagli, N.; Casu, F.; De Luca, C.; Del Soldato, M.; Festa, D.; Raspini, F. Sentinel-1 P-SBAS data for the update of the state of activity of national landslide inventory maps. Landslides 2023, 20, 1083–1097. [Google Scholar] [CrossRef]
- Dai, K.; Li, Z.; Tomás, R.; Liu, G.; Yu, B.; Wang, X.; Cheng, H.; Chen, J.; Stockamp, J. Monitoring activity at the Daguangbao mega-landslide (China) using Sentinel-1 TOPS time series interferometry. Remote. Sens. Environ. 2016, 186, 501–513. [Google Scholar] [CrossRef]
- Beladam, O.; Balz, T.; Mohamadi, B.; Abdalhak, M. Using ps-insar with sentinel-1 images for deformation monitoring in northeast Algeria. Geosciences 2019, 9, 315. [Google Scholar] [CrossRef]
- Raspini, F.; Bianchini, S.; Ciampalini, A.; Del Soldato, M.; Montalti, R.; Solari, L.; Tofani, V.; Casagli, N. Persistent Scatterers continuous streaming for landslide monitoring and mapping: The case of the Tuscany region (Italy). Landslides 2019, 16, 2033–2044. [Google Scholar] [CrossRef]
- Ferretti, A.; Colombo, D.; Fumagalli, A.; Novali, F.; Rucci, A. InSAR data for monitoring land subsidence: Time to think big. Proc. Int. Assoc. Hydrol. Sci. 2015, 372, 331–334. [Google Scholar] [CrossRef]
- Solari, L.; Del Soldato, M.; Bianchini, S.; Ciampalini, A.; Ezquerro, P.; Montalti, R.; Raspini, F.; Moretti, S. From ERS 1/2 to Sentinel-1: Subsidence monitoring in Italy in the last two decades. Front. Earth Sci. 2018, 6, 149. [Google Scholar] [CrossRef]
- Edalat, A.; Khodaparast, M.; Rajabi, A.M. Detecting Land Subsidence Due to Groundwater Withdrawal in Aliabad Plain, Iran, Using ESA Sentinel-1 Satellite Data. Nat. Resour. Res. 2019, 29, 1935–1950. [Google Scholar] [CrossRef]
- Hakim, W.L.; Achmad, A.R.; Eom, J.; Lee, C.-W. Land Subsidence Measurement of Jakarta Coastal Area Using Time Series Interferometry with Sentinel-1 SAR Data. J. Coast. Res. 2020, 102, 75–81. [Google Scholar] [CrossRef]
- Raspini, F.; Caleca, F.; Del Soldato, M.; Festa, D.; Confuorto, P.; Bianchini, S. Review of satellite radar interferometry for subsidence analysis. Earth-Sci. Rev. 2022, 235, 104239. [Google Scholar] [CrossRef]
- Luo, Q.; Li, J.; Zhang, Y. Monitoring Subsidence over the Planned Jakarta–Bandung (Indonesia) High-Speed Railway Using Sentinel-1 Multi-Temporal InSAR Data. Remote. Sens. 2022, 14, 4138. [Google Scholar] [CrossRef]
- Shami, S.; Azar, M.K.; Nilfouroushan, F.; Salimi, M.; Reshadi, M.A.M. Assessments of ground subsidence along the railway in the Kashan plain, Iran, using Sentinel-1 data and NSBAS algorithm. Int. J. Appl. Earth Obs. Geoinf. 2022, 112, 102898. [Google Scholar] [CrossRef]
- Bakon, M.; Czikhardt, R.; Papco, J.; Barlak, J.; Rovnak, M.; Adamisin, P.; Perissin, D. remotIO: A Sentinel-1 multi-temporal InSAR infrastructure monitoring service with automatic updates and data mining capabilities. Remote Sens. 2020, 12, 1892. [Google Scholar] [CrossRef]
- Ramirez, R.A.; Lee, G.J.; Choi, S.K.; Kwon, T.H.; Kim, Y.C.; Ryu, H.H.; Kim, S.; Bae, B.; Hyun, C. Monitoring of construction-induced urban ground deformations using Sentinel-1 PS-InSAR: The case study of tunneling in Dangjin, Korea. Int. J. Appl. Earth Obs. Geoinf. 2022, 108, 102721. [Google Scholar] [CrossRef]
- Nam, B.X.; Van Anh, T.; Bui, L.K.; Long, N.Q.; Le Thu Ha, T.; Goyal, R. Mining-Induced Land Subsidence Detection by Persistent Scatterer InSAR and Sentinel-1: Application to Phugiao Quarries, Vietnam. Lect. Notes Civ. Eng. 2021, 108, 18–38. [Google Scholar]
- Dang, V.K.; Nguyen, T.D.; Dao, N.H.; Duong, T.L.; Dinh, X.V.; Weber, C. Land subsidence induced by underground coal mining at Quang Ninh, Vietnam: Persistent scatterer interferometric synthetic aperture radar observation using Sentinel-1 data. Int. J. Remote Sens. 2021, 42, 3563–3582. [Google Scholar] [CrossRef]
- Mehrabi, A.; Derakhshani, R.; Nilfouroushan, F.; Rahnamarad, J.; Azarafza, M. Spatiotemporal subsidence over Pabdana coal mine Kerman Province, central Iran using time-series of Sentinel-1 remote sensing imagery. Epis. J. Int. Geosci. 2023, 46, 19–33. [Google Scholar] [CrossRef]
- Mura, J.C.; Gama, F.F.; Paradella, W.R.; de Oliveira, C.G.; Rodrigues, T.G. Ground displacements revealed by A-DInSAR analysis in the Germano iron mining complex before and after the Fundão Dam collapse using Sentinel-1 data. J. Appl. Remote Sens. 2021, 15, 034513. [Google Scholar] [CrossRef]
- Ferreti, A.; Passera, E.; Capes, R. Algorithm Theoretical Basis Document. Available online: https://land.copernicus.eu/user-corner/technical-library/egms-algorithm-theoretical-basis-document (accessed on 2 October 2022).
- Costantini, M.; Bignami, C.; Falco, S.; Malvarosa, F.; Moro, M.; Saroli, M.; Stramondo, S. New Results On Post-Seismic Deformations over L’aquila, Italy, by High Resolution Psp Sar Interferometry. In Proceedings of the IEEE International Geoscience and Remote Sensing Symposium (IGARSS), Melbourne, Australia, 21–26 July 2013; IEEE: Melbourne, Australia; pp. 1850–1852. [Google Scholar]
- Costantini, M.; Falco, S.; Malvarosa, F.; Minati, F.; Trillo, F.; Vecchioli, F. Persistent scatterer pair interferometry: Approach and application to COSMO-SkyMed SAR data. IEEE J. Sel. Top. Appl. Earth Obs. Remote Sens. 2014, 7, 2869–2879. [Google Scholar] [CrossRef]
- Sansosti, E.; Berardino, P.; Manunta, M.; Serafino, F.; Fornaro, G. Geometrical SAR image registration. IEEE Trans. Geosci. Remote Sens. 2006, 44, 2861–2870. [Google Scholar] [CrossRef]
- Prats-Iraola, P.; Scheiber, R.; Marotti, L.; Wollstadt, S.; Reigber, A. TOPS interferometry with TerraSAR-X. IEEE Trans. Geosci. Remote Sens. 2012, 50, 3179–3188. [Google Scholar] [CrossRef]
- Yagüe-Martínez, N.; Prats-Iraola, P.; Gonzalez, F.R.; Brcic, R.; Shau, R.; Geudtner, D.; Eineder, M.; Bamler, R. Interferometric processing of Sentinel-1 TOPS data. IEEE Trans. Geosci. Remote Sens. 2016, 54, 2220–2234. [Google Scholar] [CrossRef]
- Eineder, M. Efficient simulation of SAR interferograms of large areas and of rugged terrain. IEEE Trans. Geosci. Remote Sens. 2003, 41, 1415–1427. [Google Scholar] [CrossRef]
- Capes, R.; Passera, E. Product Description and Format Specification. Available online: https://land.copernicus.eu/user-corner/technical-library/egms-product-description-document (accessed on 2 October 2022).
- Solari, L.; Crosetto, M. Validation of the EGMS Product Portfolio. Available online: https://land.copernicus.eu/user-corner/technical-library/validation-approach-of-the-egms-product-portfolio (accessed on 2 October 2022).
- Racine, J.S. RStudio: A Platform-Independent IDE for R and Sweave. J. Appl. Econom. 2012, 27, 167–172. [Google Scholar] [CrossRef]
- Team, R.C.; R: A Language and Environment for Statistical Computing. R Foundation for Statistical Computing, Vienna, Austria. 2013. Available online: http://www.R-project.org/ (accessed on 2 October 2022).
- European Ground Motion Service Explorer. Available online: https://egms.land.copernicus.eu/ (accessed on 28 September 2022).
- Larsen, Y.; Marinkovic, P.; Dehls, J.; Stødle, D. End User Interface Manual. Available online: https://land.copernicus.eu/user-corner/technical-library/egms-end-user-interface-manual (accessed on 2 October 2022).
- Graul, C. LeafletR: Interactive Web-Maps Based on the Leaflet JavaScript Library. R-Package Version 0.4-0. 2016. Available online: https://github.com/chgrl/leafletR (accessed on 8 October 2022).
- Van Rees, E. Open geospatial consortium (OGC). Geoinformatics 2013, 16, 28. [Google Scholar]
- R-Portable Software. Available online: https://sourceforge.net/projects/rportable/ (accessed on 6 October 2022).
Figure 1.
EGMStream concept workflow.

Figure 2.
(a) Outline of the EGMStream app interface; (b) framework of EGMStream output products; and (c) visualization of the converted EGMS product via GIS platform.
Figure 2.
(a) Outline of the EGMStream app interface; (b) framework of EGMStream output products; and (c) visualization of the converted EGMS product via GIS platform.

Figure 3.
(a,b) Three-dimensional visualization of the calibrated ascending and descending EGMS products related to an ongoing slope displacement located near Canillo (Andorra); a more accurate picture of the deformation scenario can be obtained by consulting the EGMS (c,d) ortho data.
Figure 3.
(a,b) Three-dimensional visualization of the calibrated ascending and descending EGMS products related to an ongoing slope displacement located near Canillo (Andorra); a more accurate picture of the deformation scenario can be obtained by consulting the EGMS (c,d) ortho data.

Disclaimer/Publisher’s Note: The statements, opinions and data contained in all publications are solely those of the individual author(s) and contributor(s) and not of MDPI and/or the editor(s). MDPI and/or the editor(s) disclaim responsibility for any injury to people or property resulting from any ideas, methods, instructions or products referred to in the content. |
© 2023 by the authors. Licensee MDPI, Basel, Switzerland. This article is an open access article distributed under the terms and conditions of the Creative Commons Attribution (CC BY) license (https://creativecommons.org/licenses/by/4.0/).
Share and Cite
MDPI and ACS Style
Festa, D.; Del Soldato, M. EGMStream, a Desktop App for EGMS Data Downstream. Remote Sens. 2023, 15, 2581. https://doi.org/10.3390/rs15102581
AMA Style
Festa D, Del Soldato M. EGMStream, a Desktop App for EGMS Data Downstream. Remote Sensing. 2023; 15(10):2581. https://doi.org/10.3390/rs15102581
Chicago/Turabian StyleFesta, Davide, and Matteo Del Soldato. 2023. "EGMStream, a Desktop App for EGMS Data Downstream" Remote Sensing 15, no. 10: 2581. https://doi.org/10.3390/rs15102581
Note that from the first issue of 2016, this journal uses article numbers instead of page numbers. See further details here.