Technical Note

A High-Precision Remote Sensing Identification Method on Saline-Alkaline Areas Using Multi-Sources Data

1
Key Laboratory of Digital Earth Science, Aerospace Information Research Institute, Chinese Academy of Sciences (CAS), Beijing 100094, China
2
International Research Center of Big Data for Sustainable Development Goals, Beijing 100094, China
3
University of Chinese Academy of Sciences, Beijing 100049, China
4
Key Laboratory of the Earth Observation of Hainan Province, Hainan Aerospace Information Research Institute, Sanya 572029, China
5
College of Geoscience and Surveying Engineering, China University of Mining & Technology (Beijing), Beijing 100083, China
*
Author to whom correspondence should be addressed.
Remote Sens. 2023, 15(10), 2556; https://doi.org/10.3390/rs15102556
Submission received: 27 March 2023 / Revised: 10 May 2023 / Accepted: 11 May 2023 / Published: 13 May 2023
(This article belongs to the Special Issue Mapping and Monitoring of Geohazards with Remote Sensing Technologies)

Abstract

:
Soil salinization is a widespread and important environmental problem. We propose a high-precision remote sensing identification method for saline-alkaline areas using multi-source data, a method which is of some significance for improving ecological and environmental problems on a global scale which have been caused by soil salinization. Its principle is to identify saline-alkaline areas from remote sensing imagery by a decision tree model combining four spectral indices named NDSI34 (Normalized Difference Spectral Index of Band 3 and Band 4), NDSI25 (Normalized Difference Spectral Index of Band 2 and Band 5), NDSI237 (Normalized Difference Spectral Index of Band 3 and Band 4) and NDSInew (New Normalized Difference Salt Index) that can distinguish saline-alkaline areas from other features. In this method, the complementary information within the multi-source data is used to improve classification accuracy. The main steps of the method include multi-source data acquisition, adaptive feature fusion of multi-source data, feature identification and integrated expression of the saline-alkaline area from multi-source data, fine classification of the saline-alkaline area, and accuracy verification. Taking Minqin County, Gansu Province, China as the study area, we use the method to identify saline-alkaline areas based on GF-2, GF-6/WFV and DEM data. The results show that the overall accuracy of the method is 88.11%, which is 7.69% higher than that of the traditional methods, indicating that it could effectively identify the distribution of saline-alkaline areas, and thus provide a scientific technique for the quick identification of saline-alkaline areas in large regions.

Graphical Abstract

1. Introduction

Soil salinization is a major type of land degradation in arid and semi-arid areas [1,2], one which causes soil consolidation and crop yield decline, and thus results in huge losses in agricultural production. In addition, its mutual induction with soil desertification will cause more significant damage to the ecological environment and even cause serious geological disasters [3,4,5,6]. Soil salinization lasts for a long time, and the land encounters difficulties when it attempts to repair itself, which makes for a continuous impact on the human living environment and economic development [7,8,9]. More than 100 countries and 7% of land area on a global scale are affected by land salinization [10,11]. It has become a worldwide environmental issue of wide-ranging concern, thus leading many countries to pay high attention to the amelioration and development of saline-alkaline areas. China is one of the countries seriously affected by salinization [12]. Therefore, it is important to strengthen the dynamic monitoring of saline-alkaline areas to curb the source of land degradation, and to make rational use of land to improve the ecological environment.
The methods of saline-alkaline area monitoring can be currently divided into two types: instrument-measured soil data [13,14] and large-scale monitoring with remote sensing. With the development of spatial information technology, remote sensing has become the most widely used method in large-scale saline-alkaline area monitoring [5,15,16,17]. The methods for monitoring saline-alkaline areas based on remote sensing technology have mainly changed from visual interpretation to methods using computers to process image data and extract features [18].
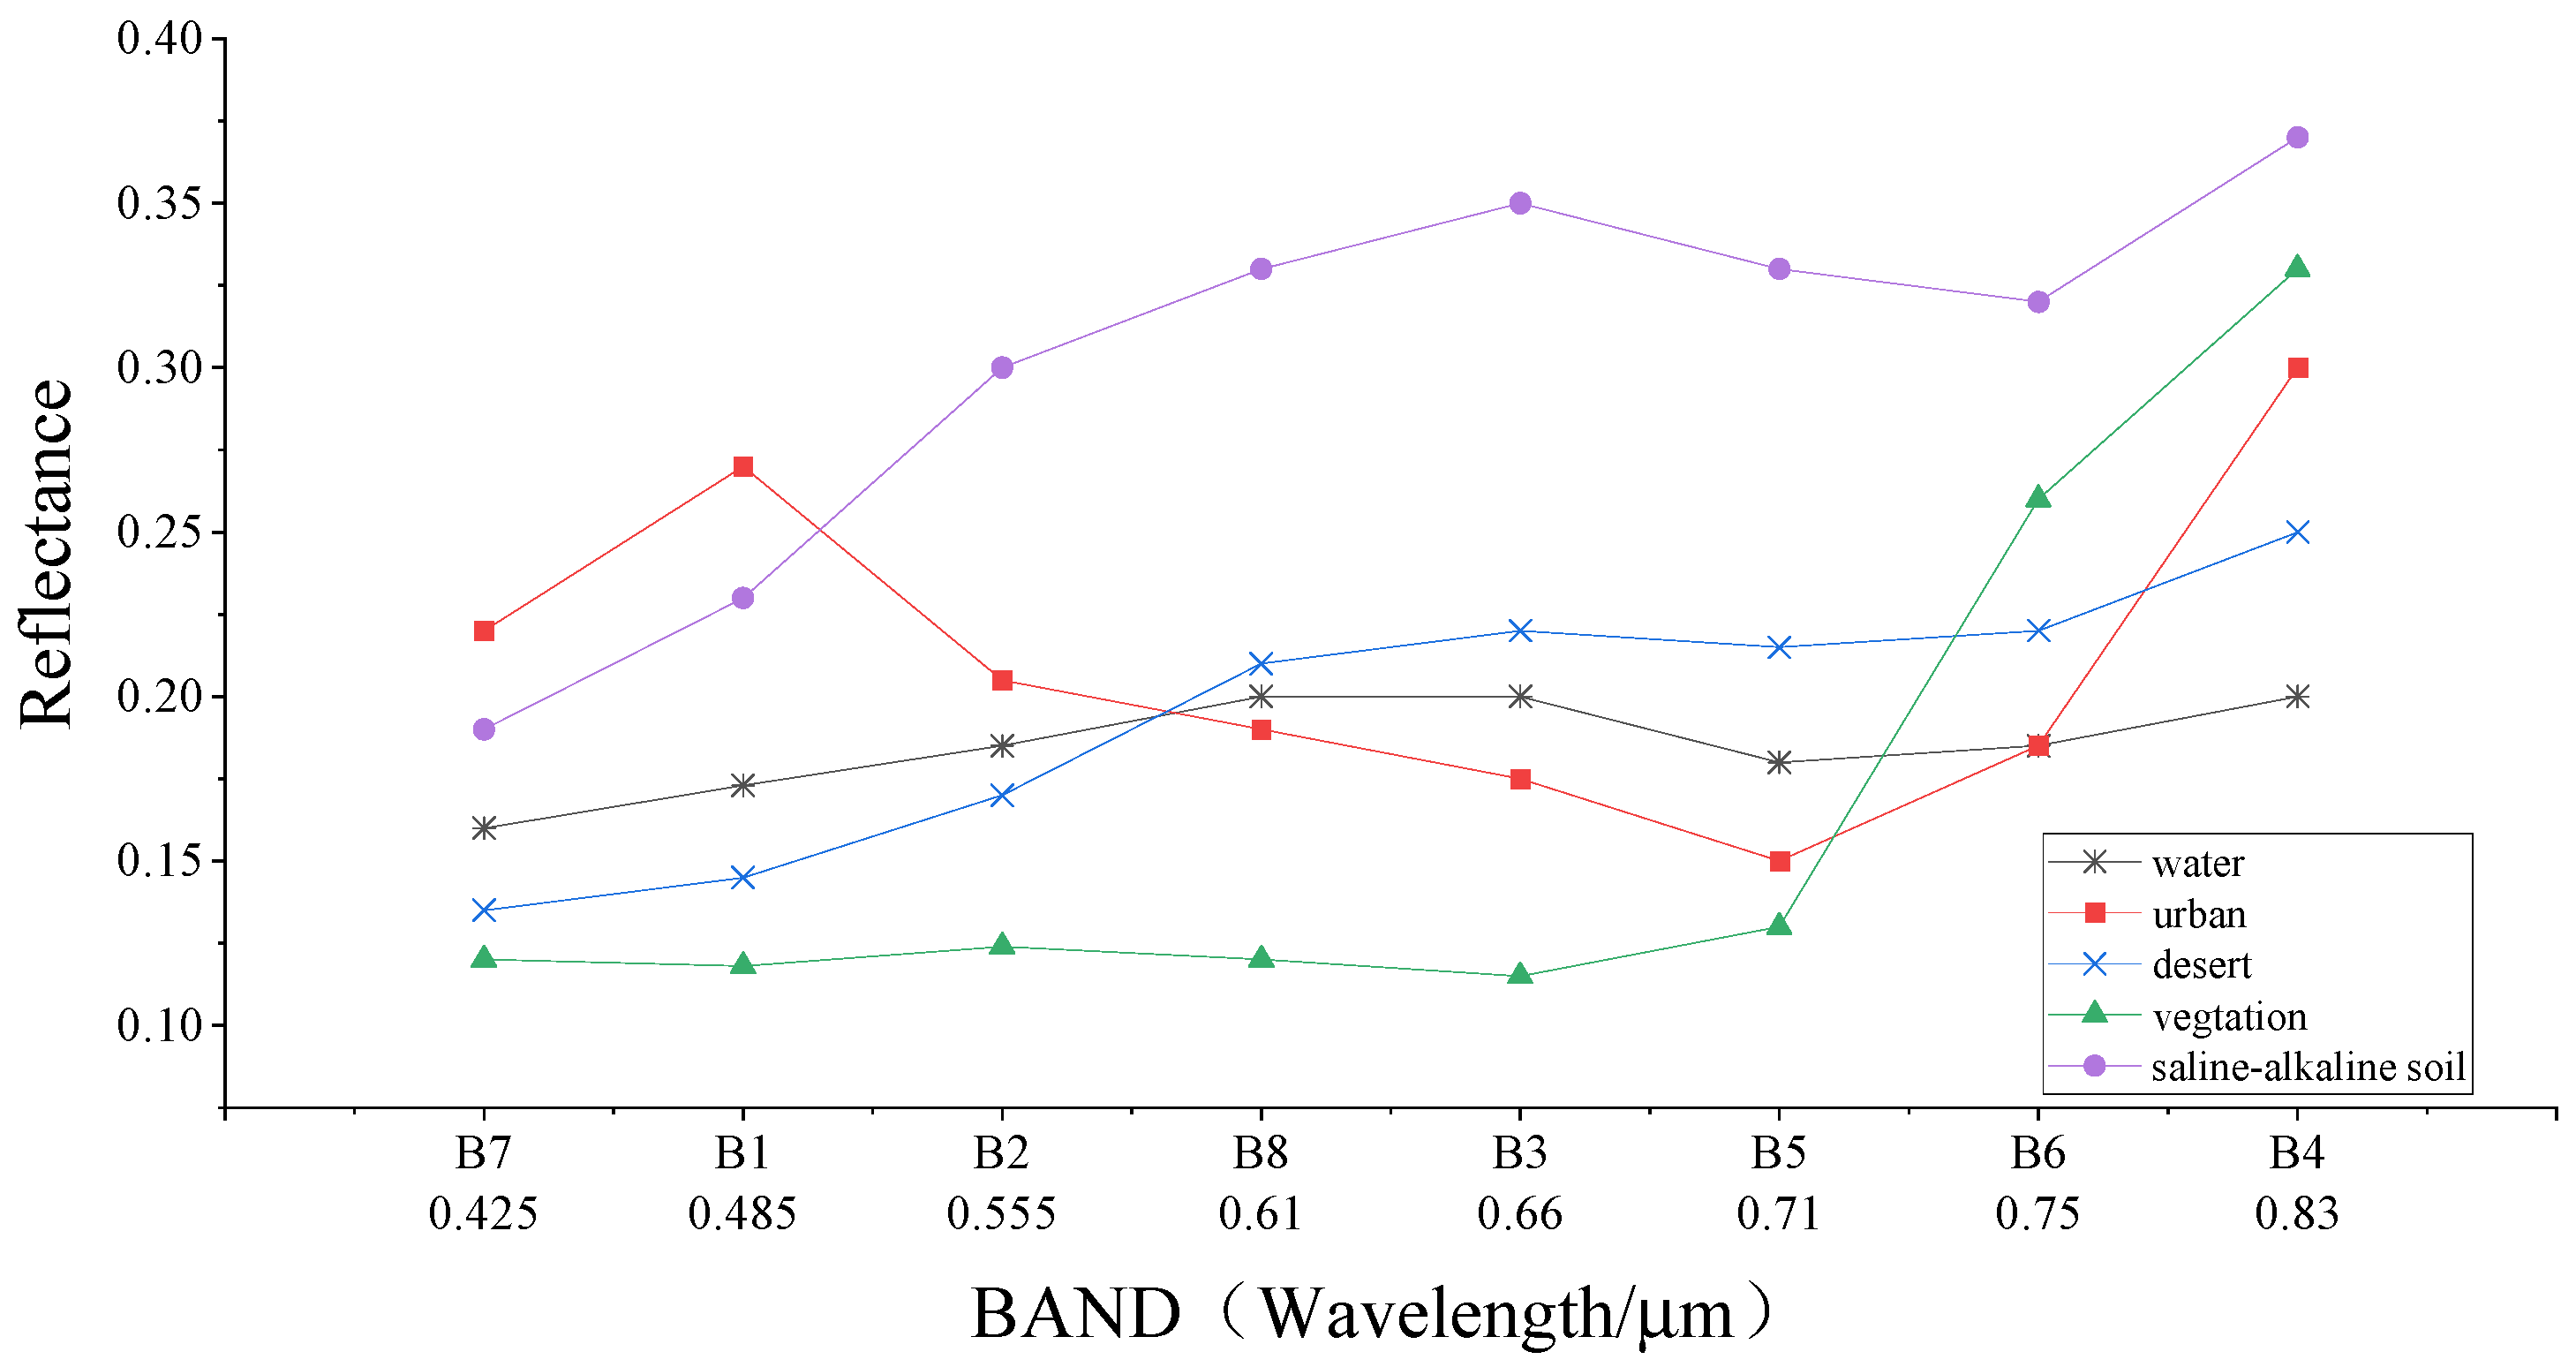
The exploration of saline-alkaline area identification methods based on spectral features has been a subject of frequent scholarly discussion. In 1992, Dwivedi [19] performed experimental research on the best remote sensing bands combination for saline-alkaline areas monitoring, and concluded that the combination of bands 1, 3, and 5 of Landsat TM remote sensing images contained the largest amount of information, while the accuracy of a saline-alkaline area being identified was not proportional to the amount of information in the remote sensing data. Farifteh [20] found that soil reflectance had a good response to the salinity of a soil surface layer when using hyperspectral data for soil salinization classification, and concluded that there was a linear relationship between soil salinization and its spectral reflectance. By correlating the spectral parameters from MODIS images with salinization levels, Bouaziz et al. [21] constructed a linear spectral unmixing (LSU) model to examine the status of soil salinization in semi-arid areas. Xiao Dong [22] et al. obtained reflectance and salinity data by field sampling to construct an inversion model and a correction model. Yanhua Fu [23] constructed a model indicating the relationship of spectral data and salt content, and of organic matter content and PH level.
Research efforts using indirect features are mainly used to verify the saline-alkaline soil distribution with the help of some other auxiliary information. For example, the growth condition of vegetation can be affected by salinity; thus, vegetation is a good indirect indicator of salinity [24]. Some salt-tolerant vegetation can also be one of the salinization signs. On the ecological scale, soil salinity can adversely limit species diversity and species’ ecological niches [25]. Salinity is especially associated with negative osmotic potential, which inhibits seed germination and debilitates cell turgidity [26]. R. L. Dehaan et al. [27] demonstrated that the growth and distribution of vegetation had a strong correlation with soil salinity. By developing the normalized difference vegetation index–salinity index (NDVI–SI) feature-space remote sensing model of soil salinization, Wang et al. [28] successfully monitored the change of saline soil in the Tarim Basin, Xinjiang.
Although these two methods have attained some achievements, how to effectively identify saline-alkaline areas with high accuracy is still the focus of present research.
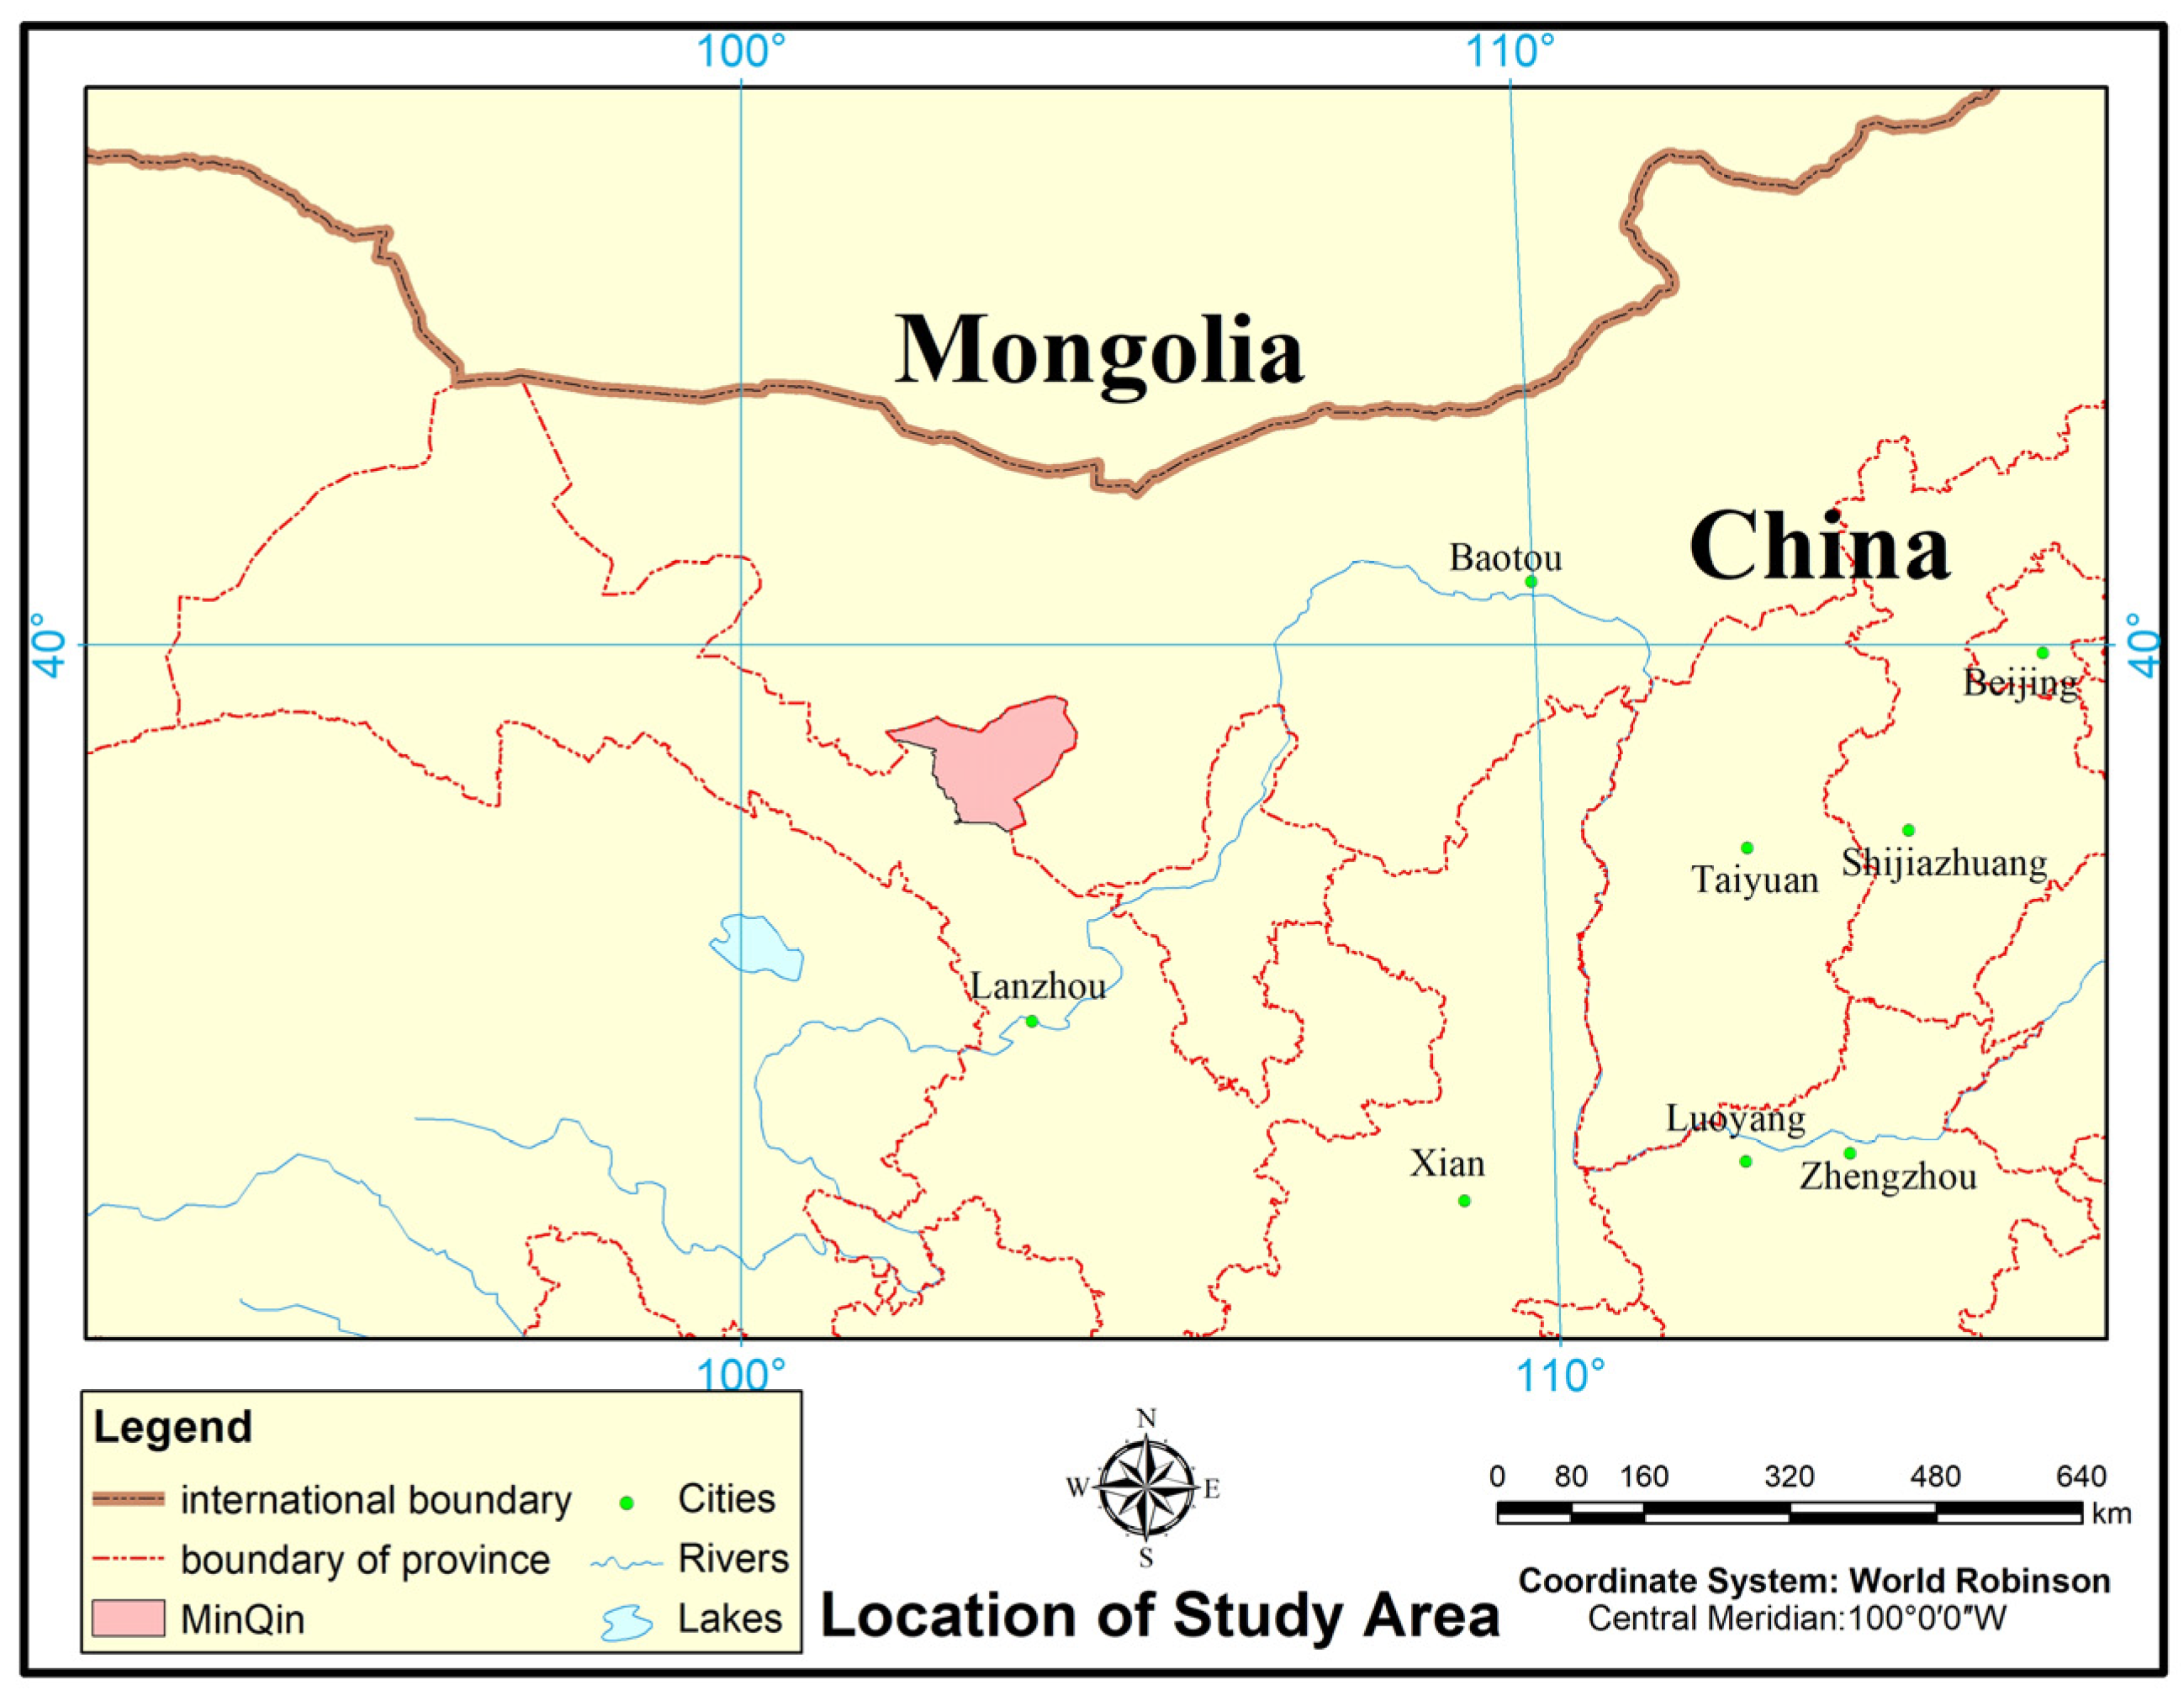
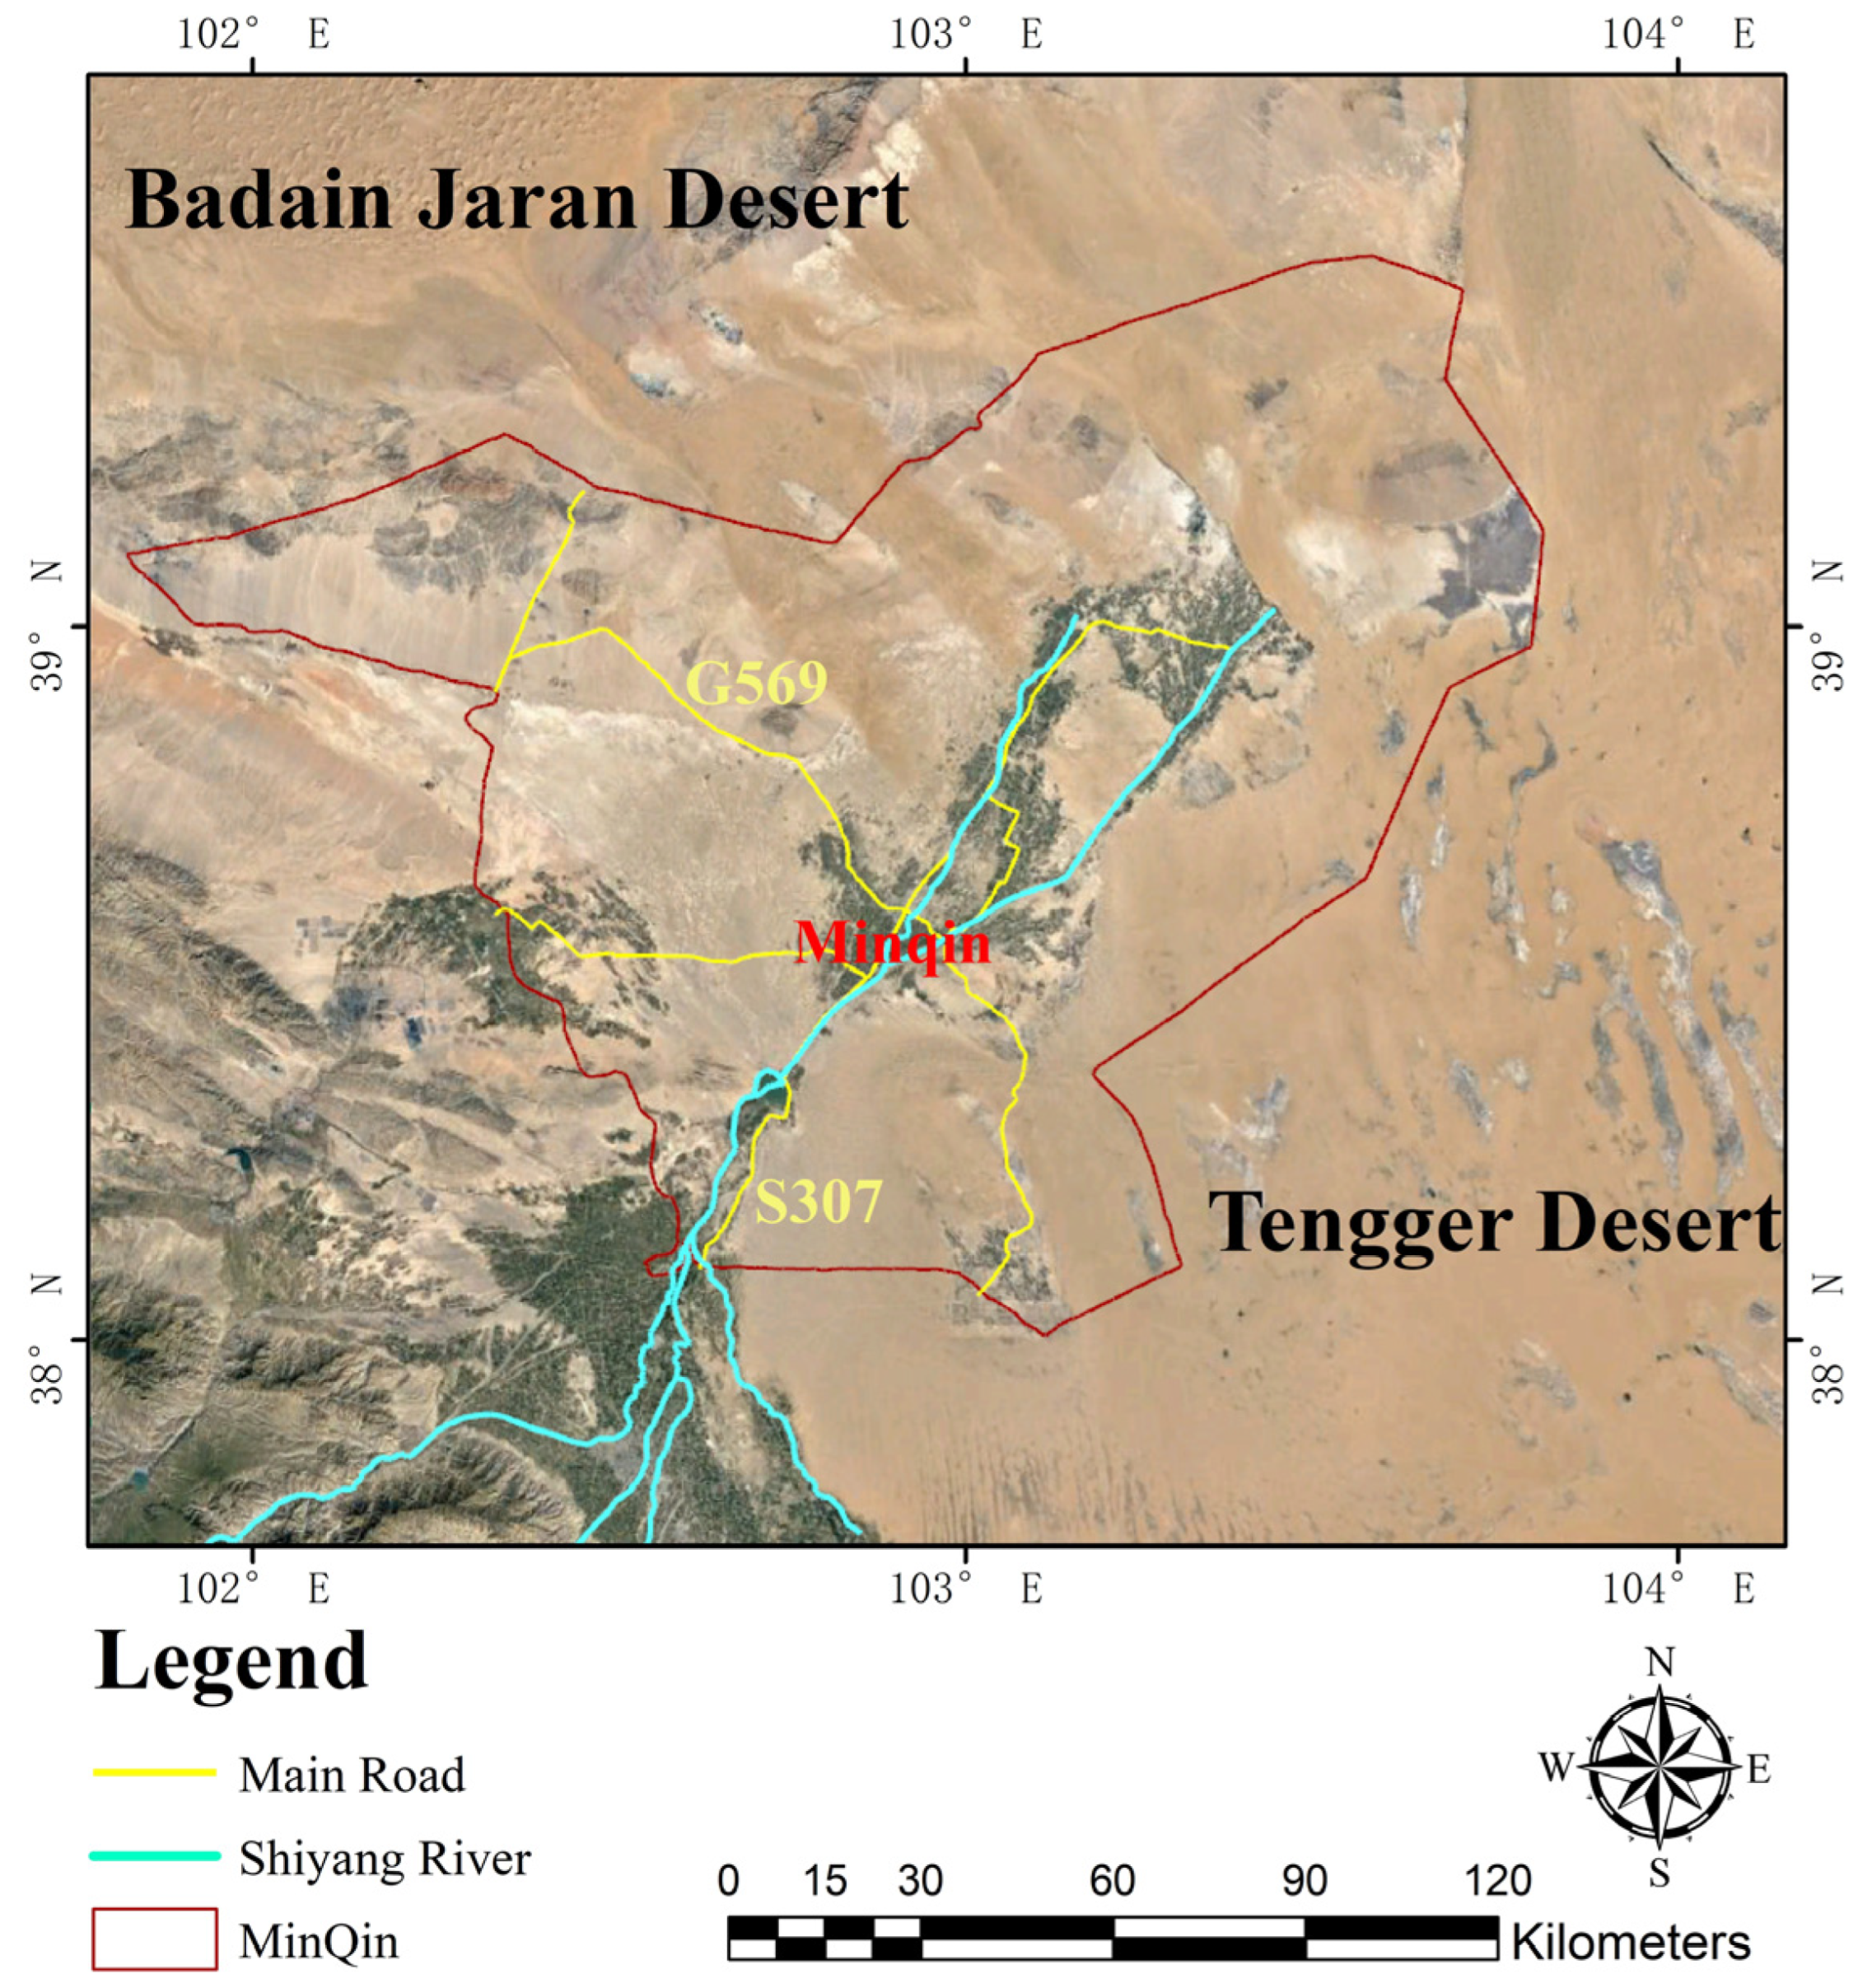
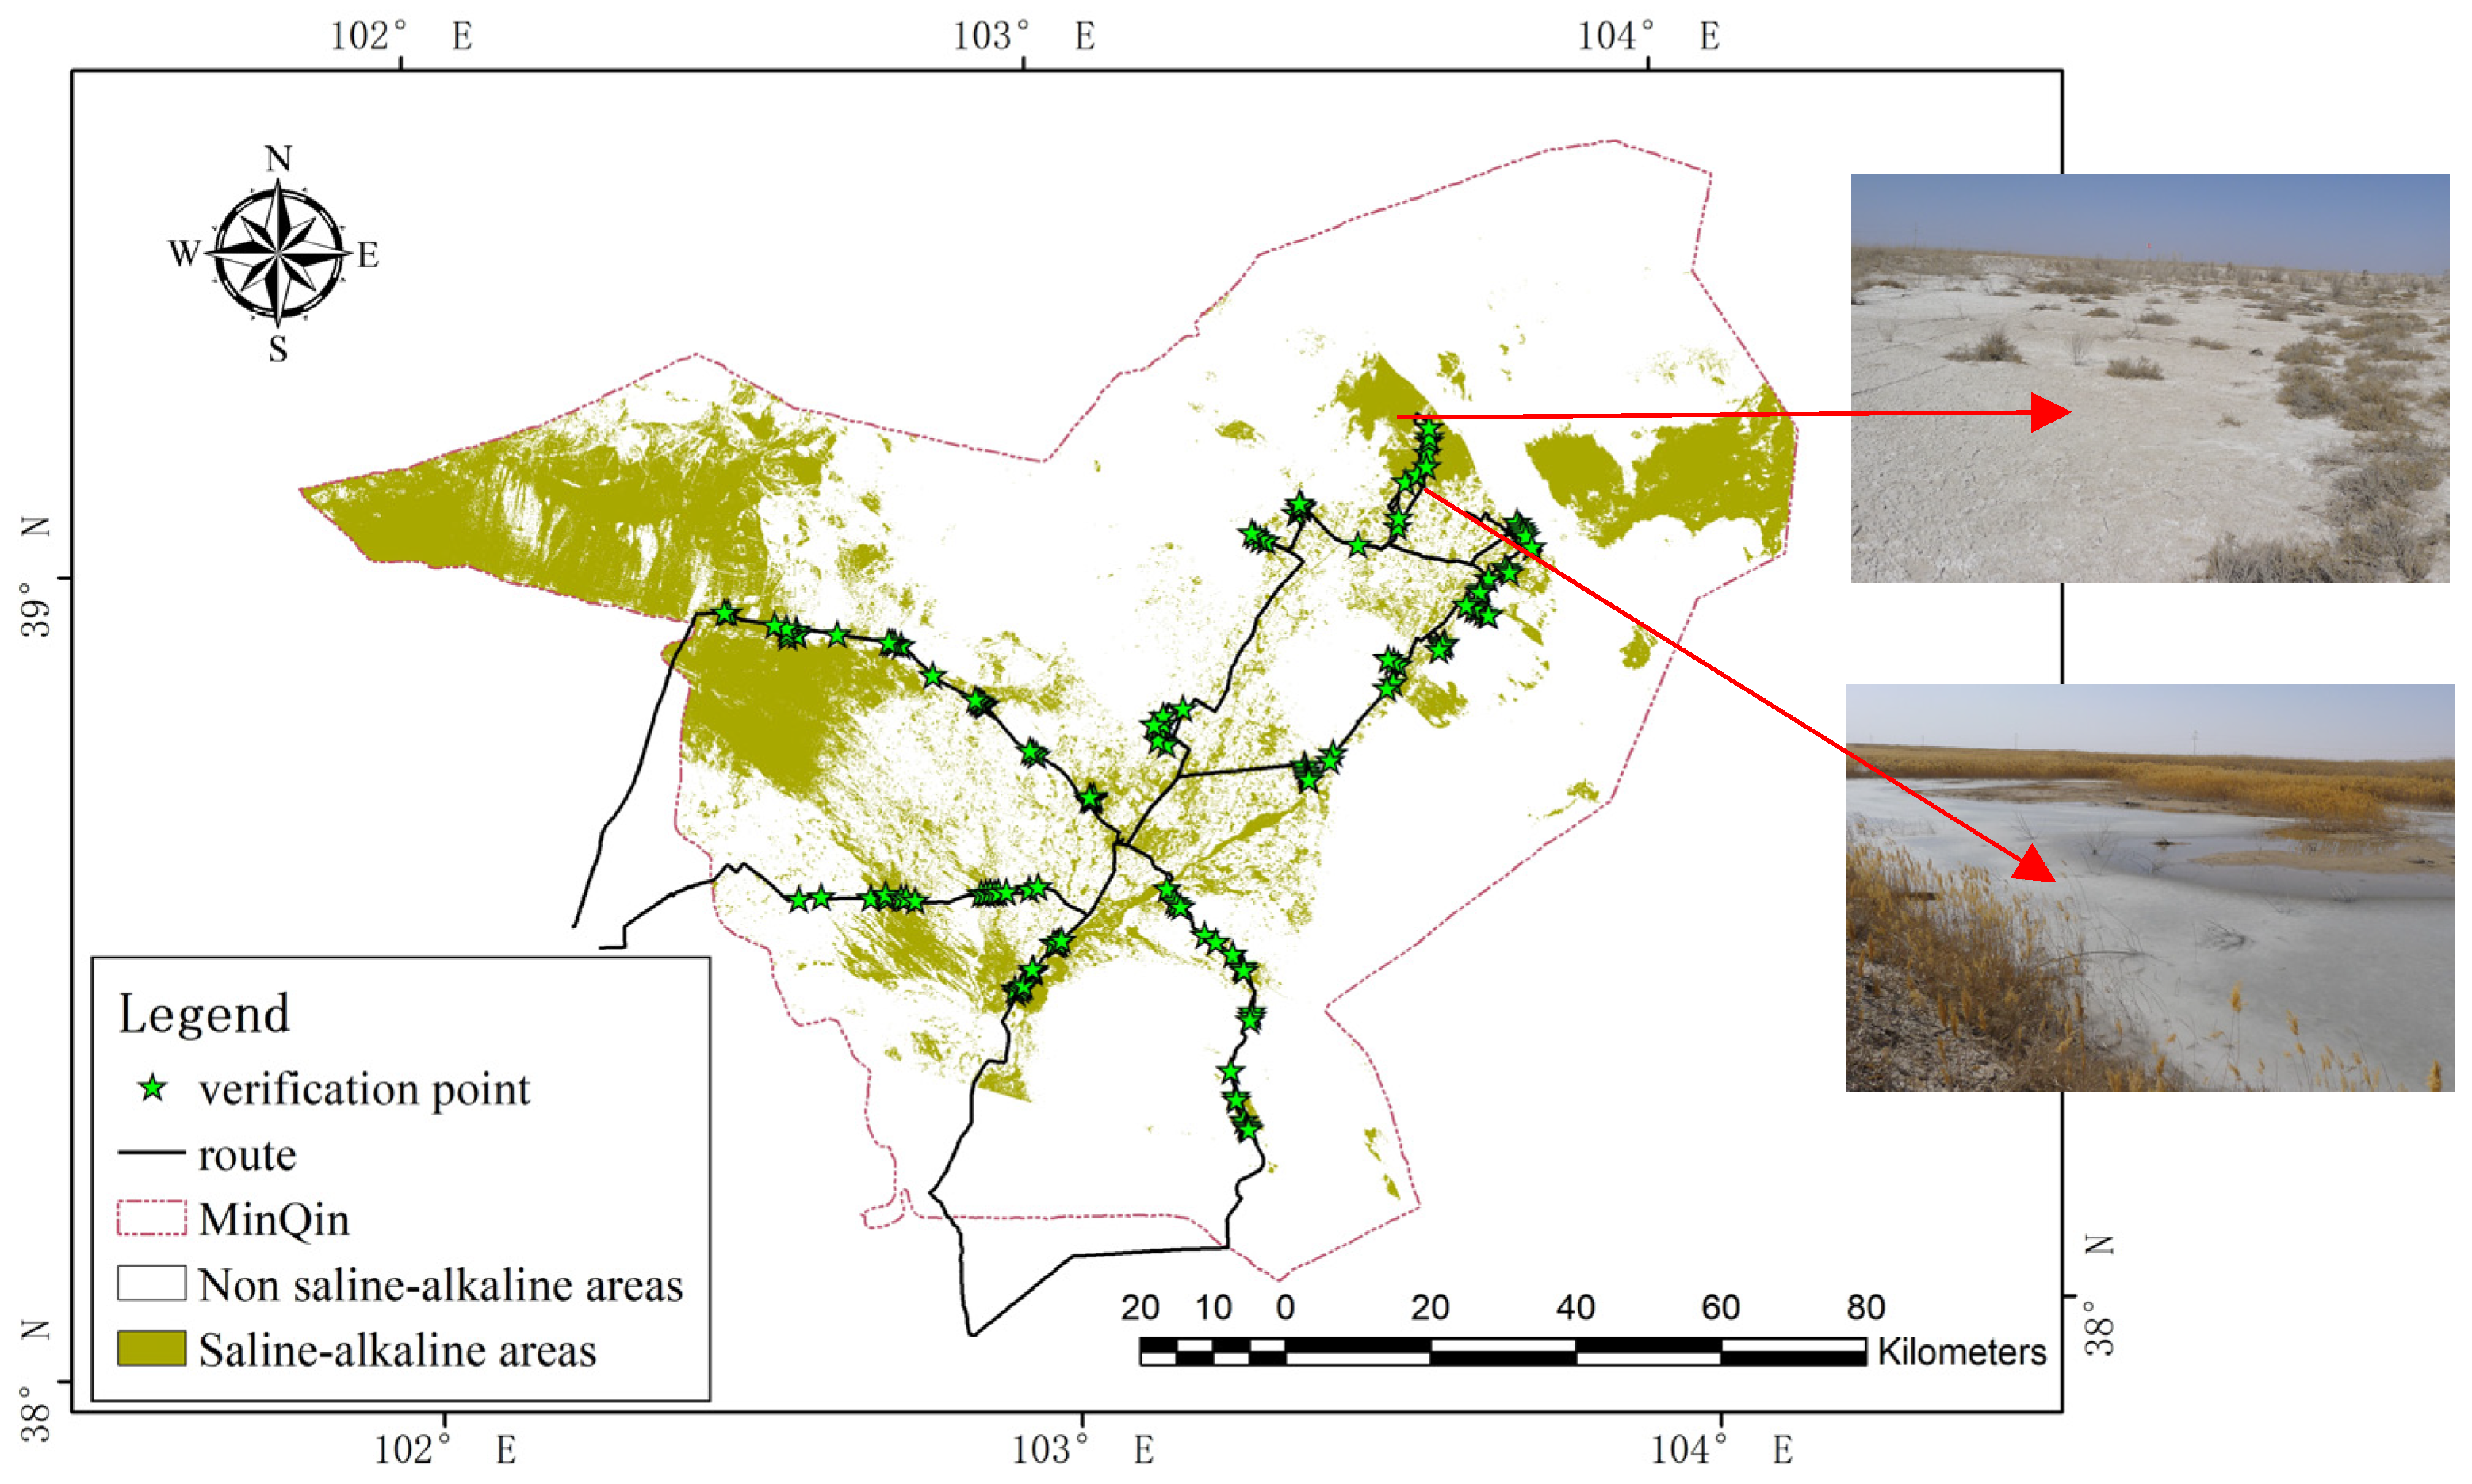
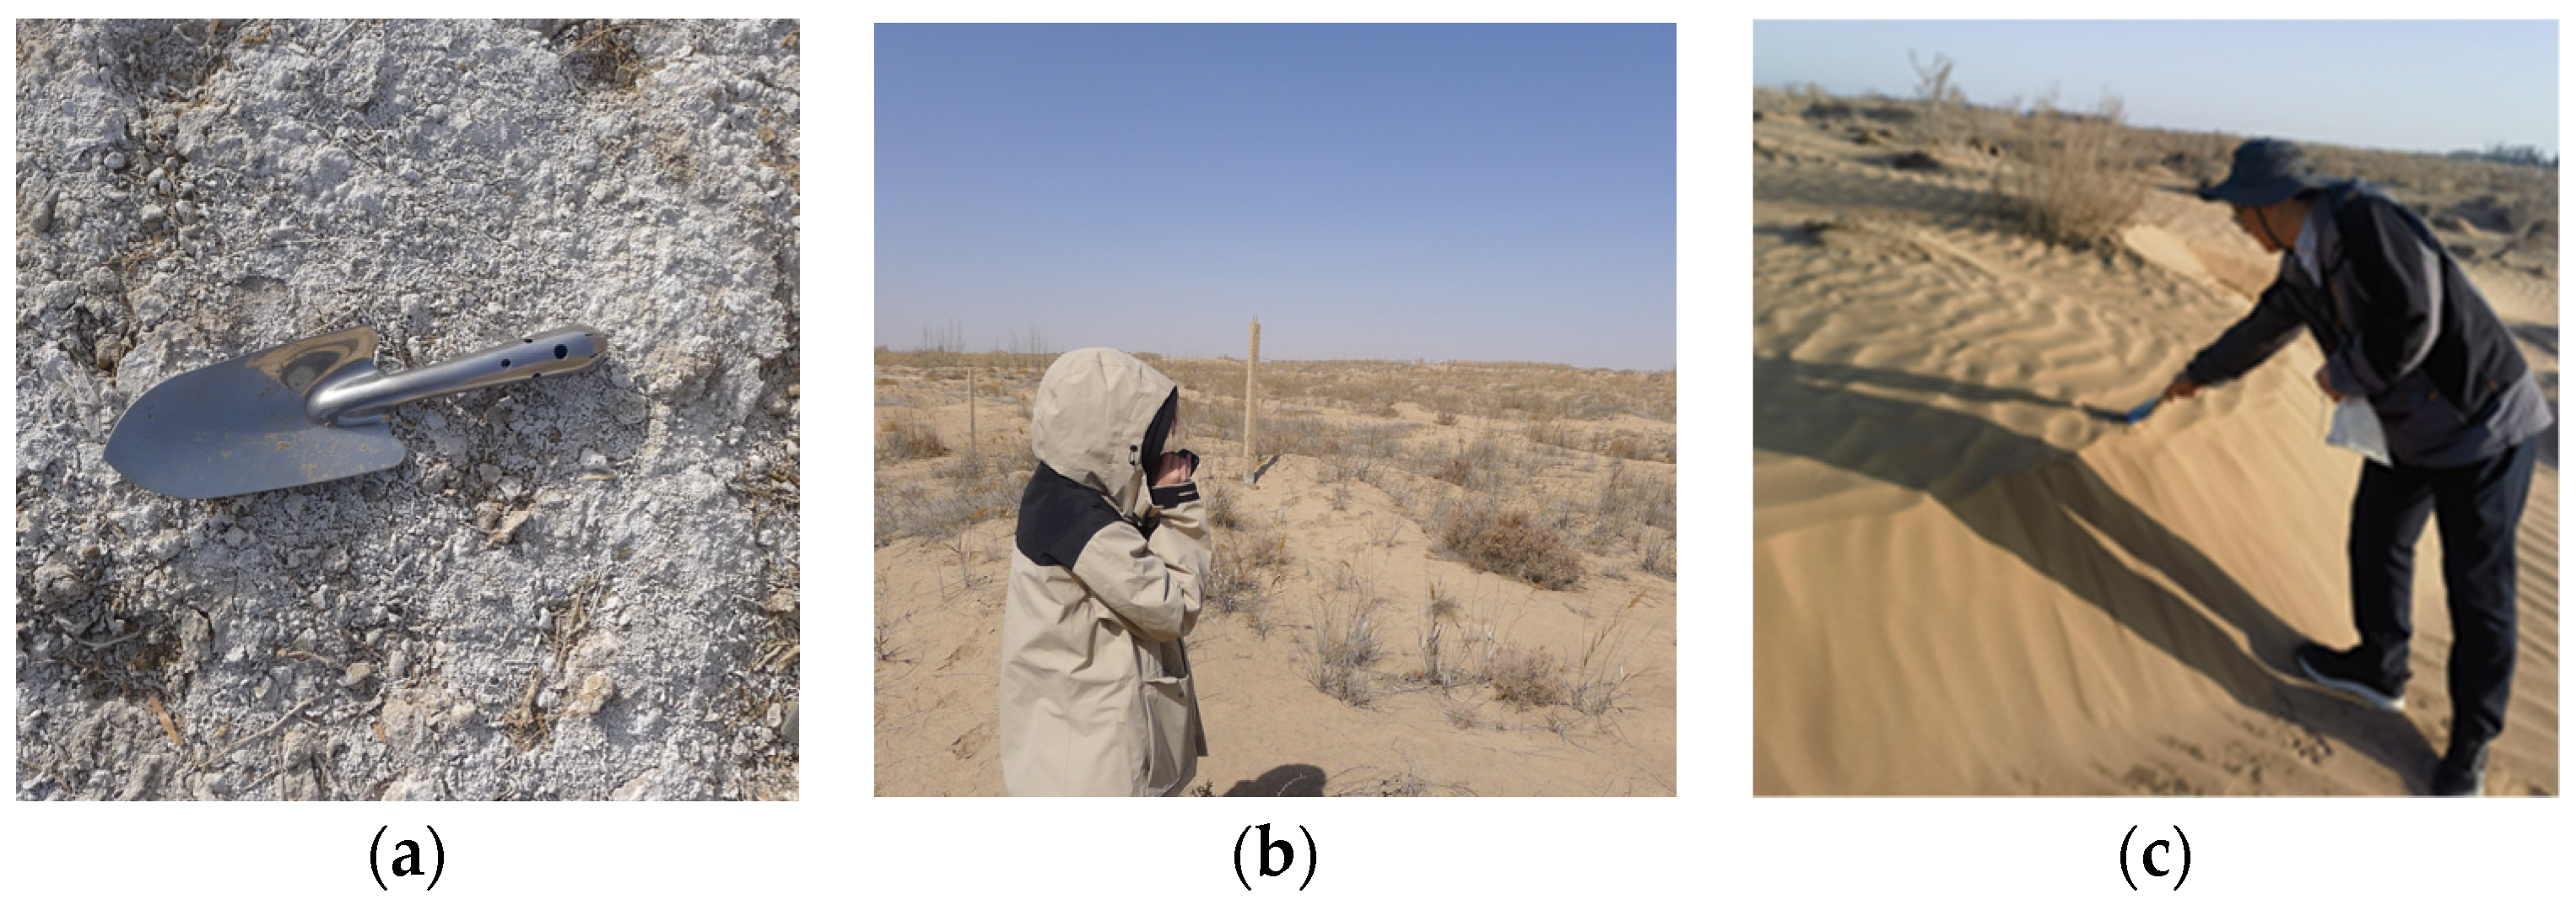
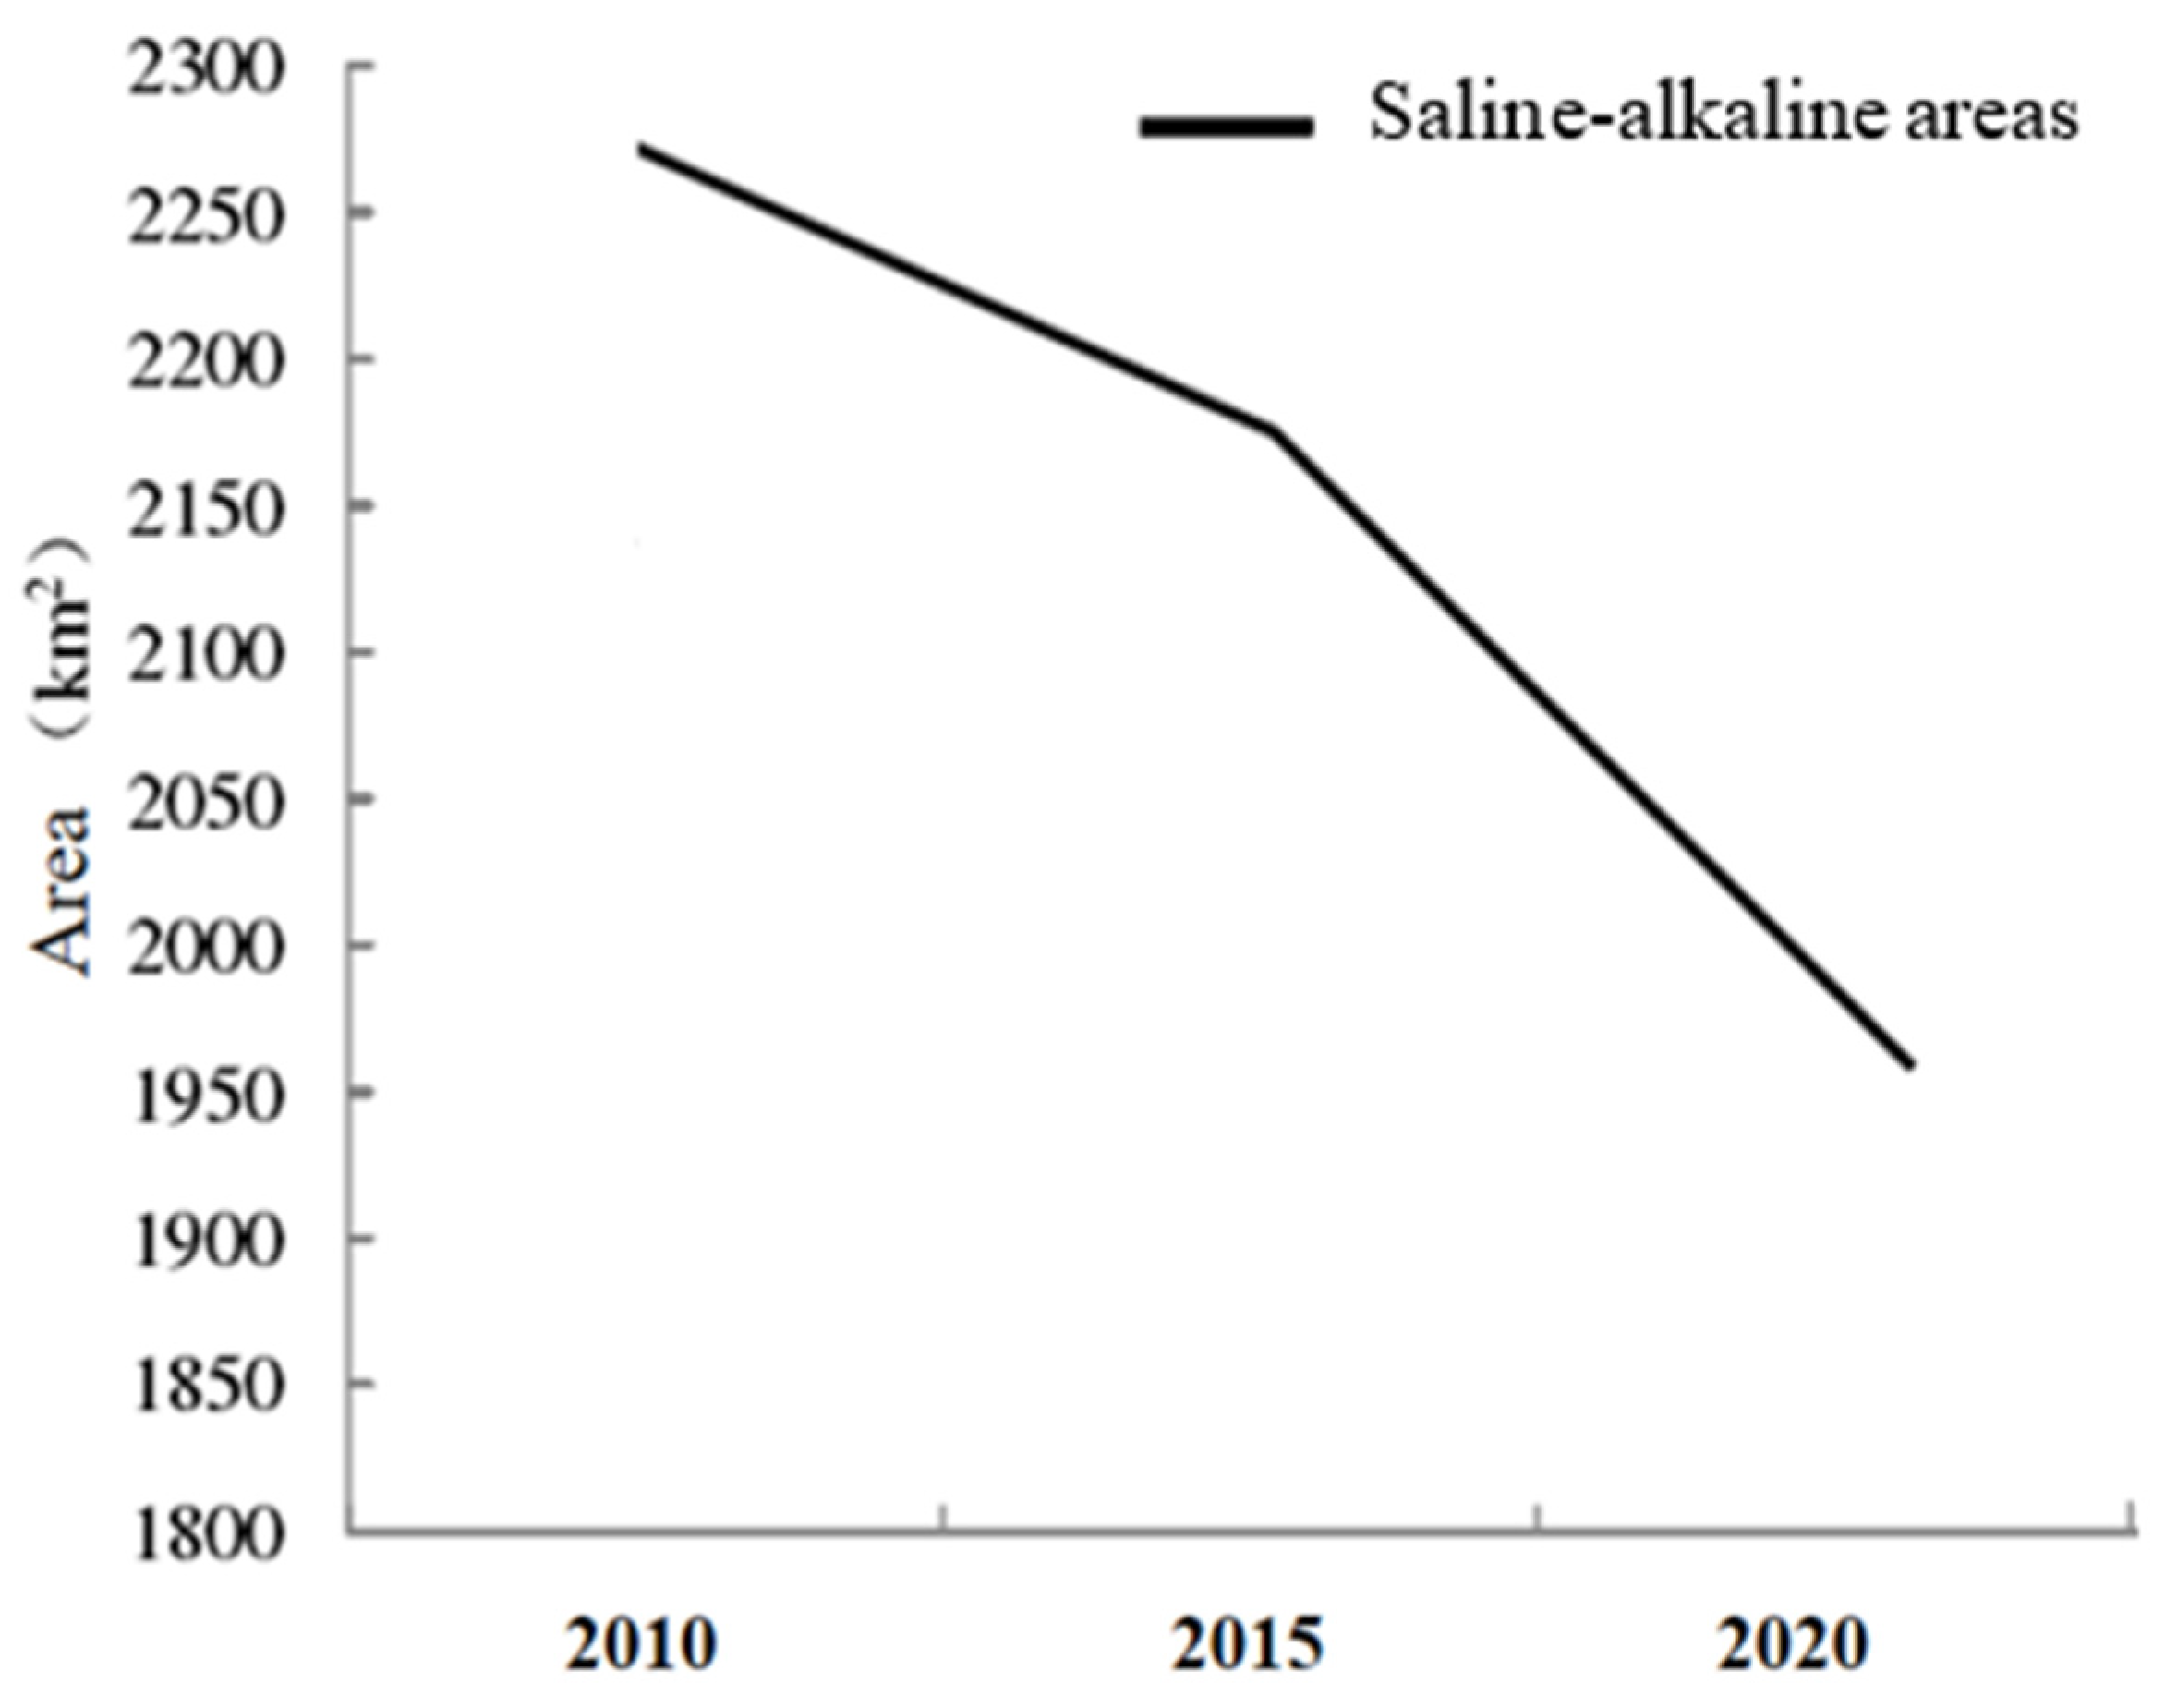
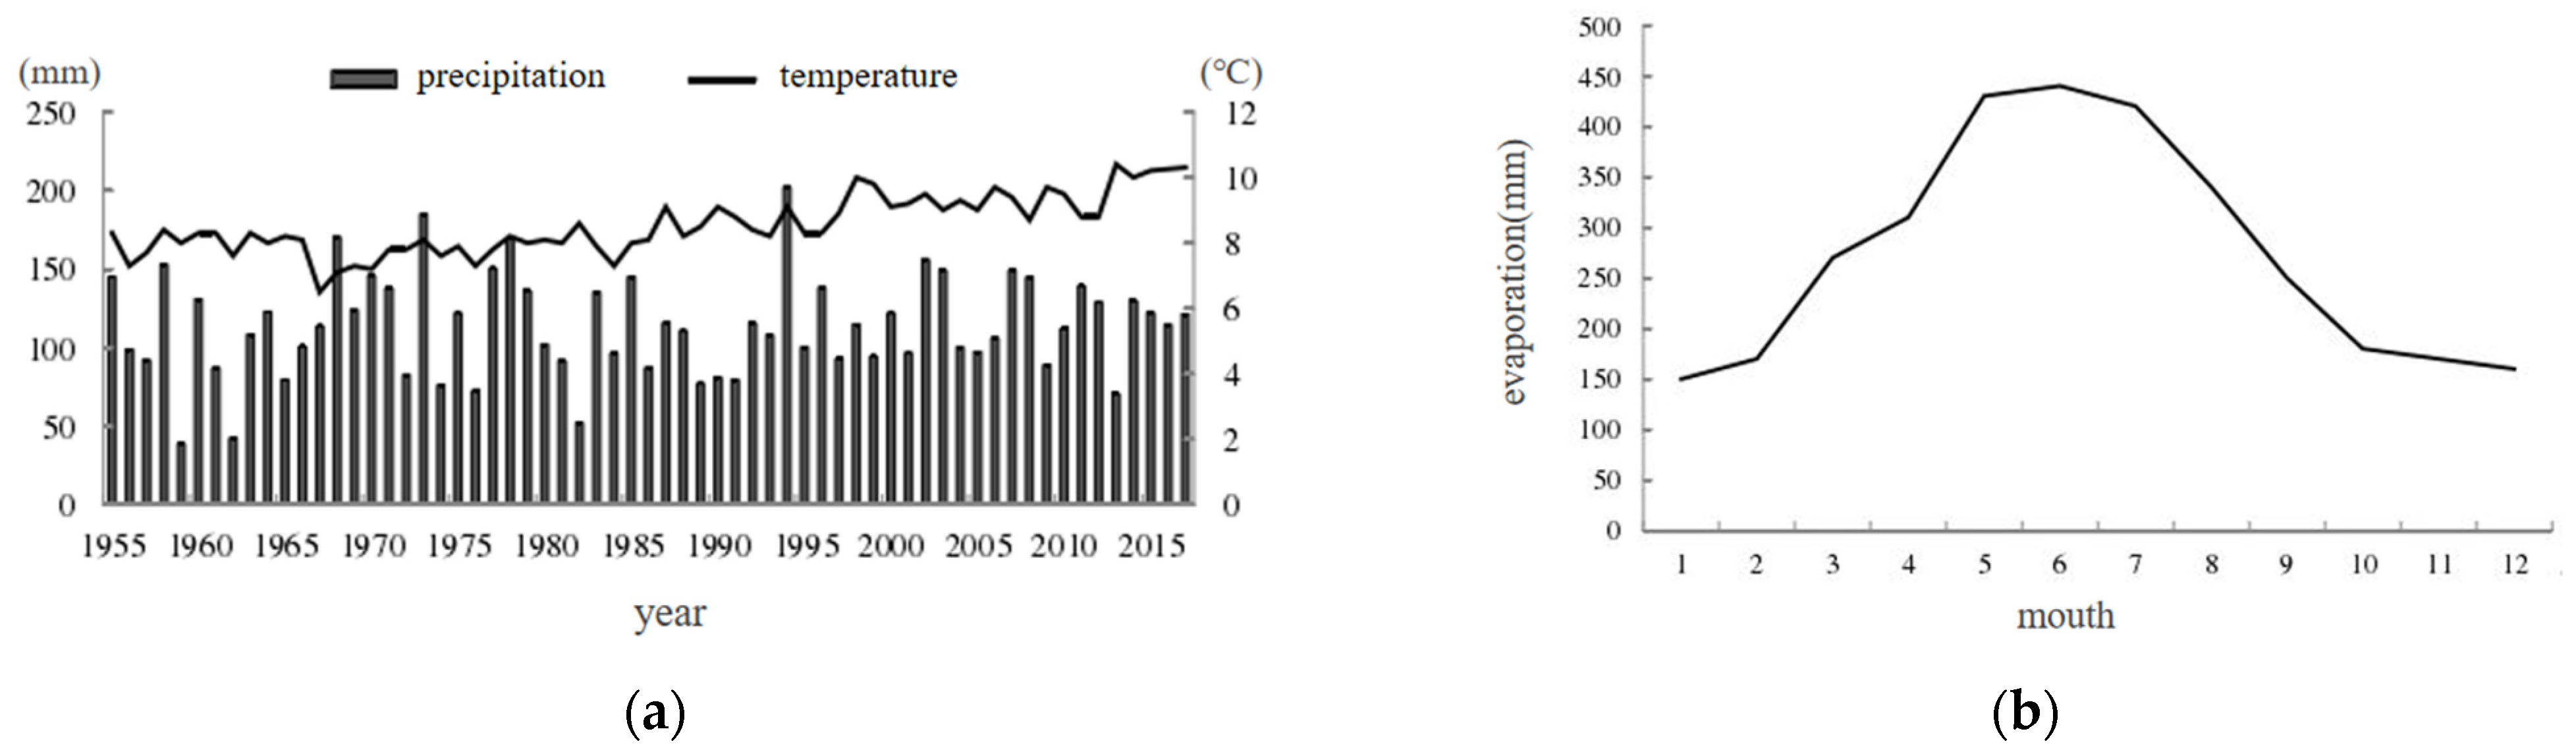
Minqin County in Gansu Province, China is located at the junction of the Tengger Desert and the Badain Jaran Desert [
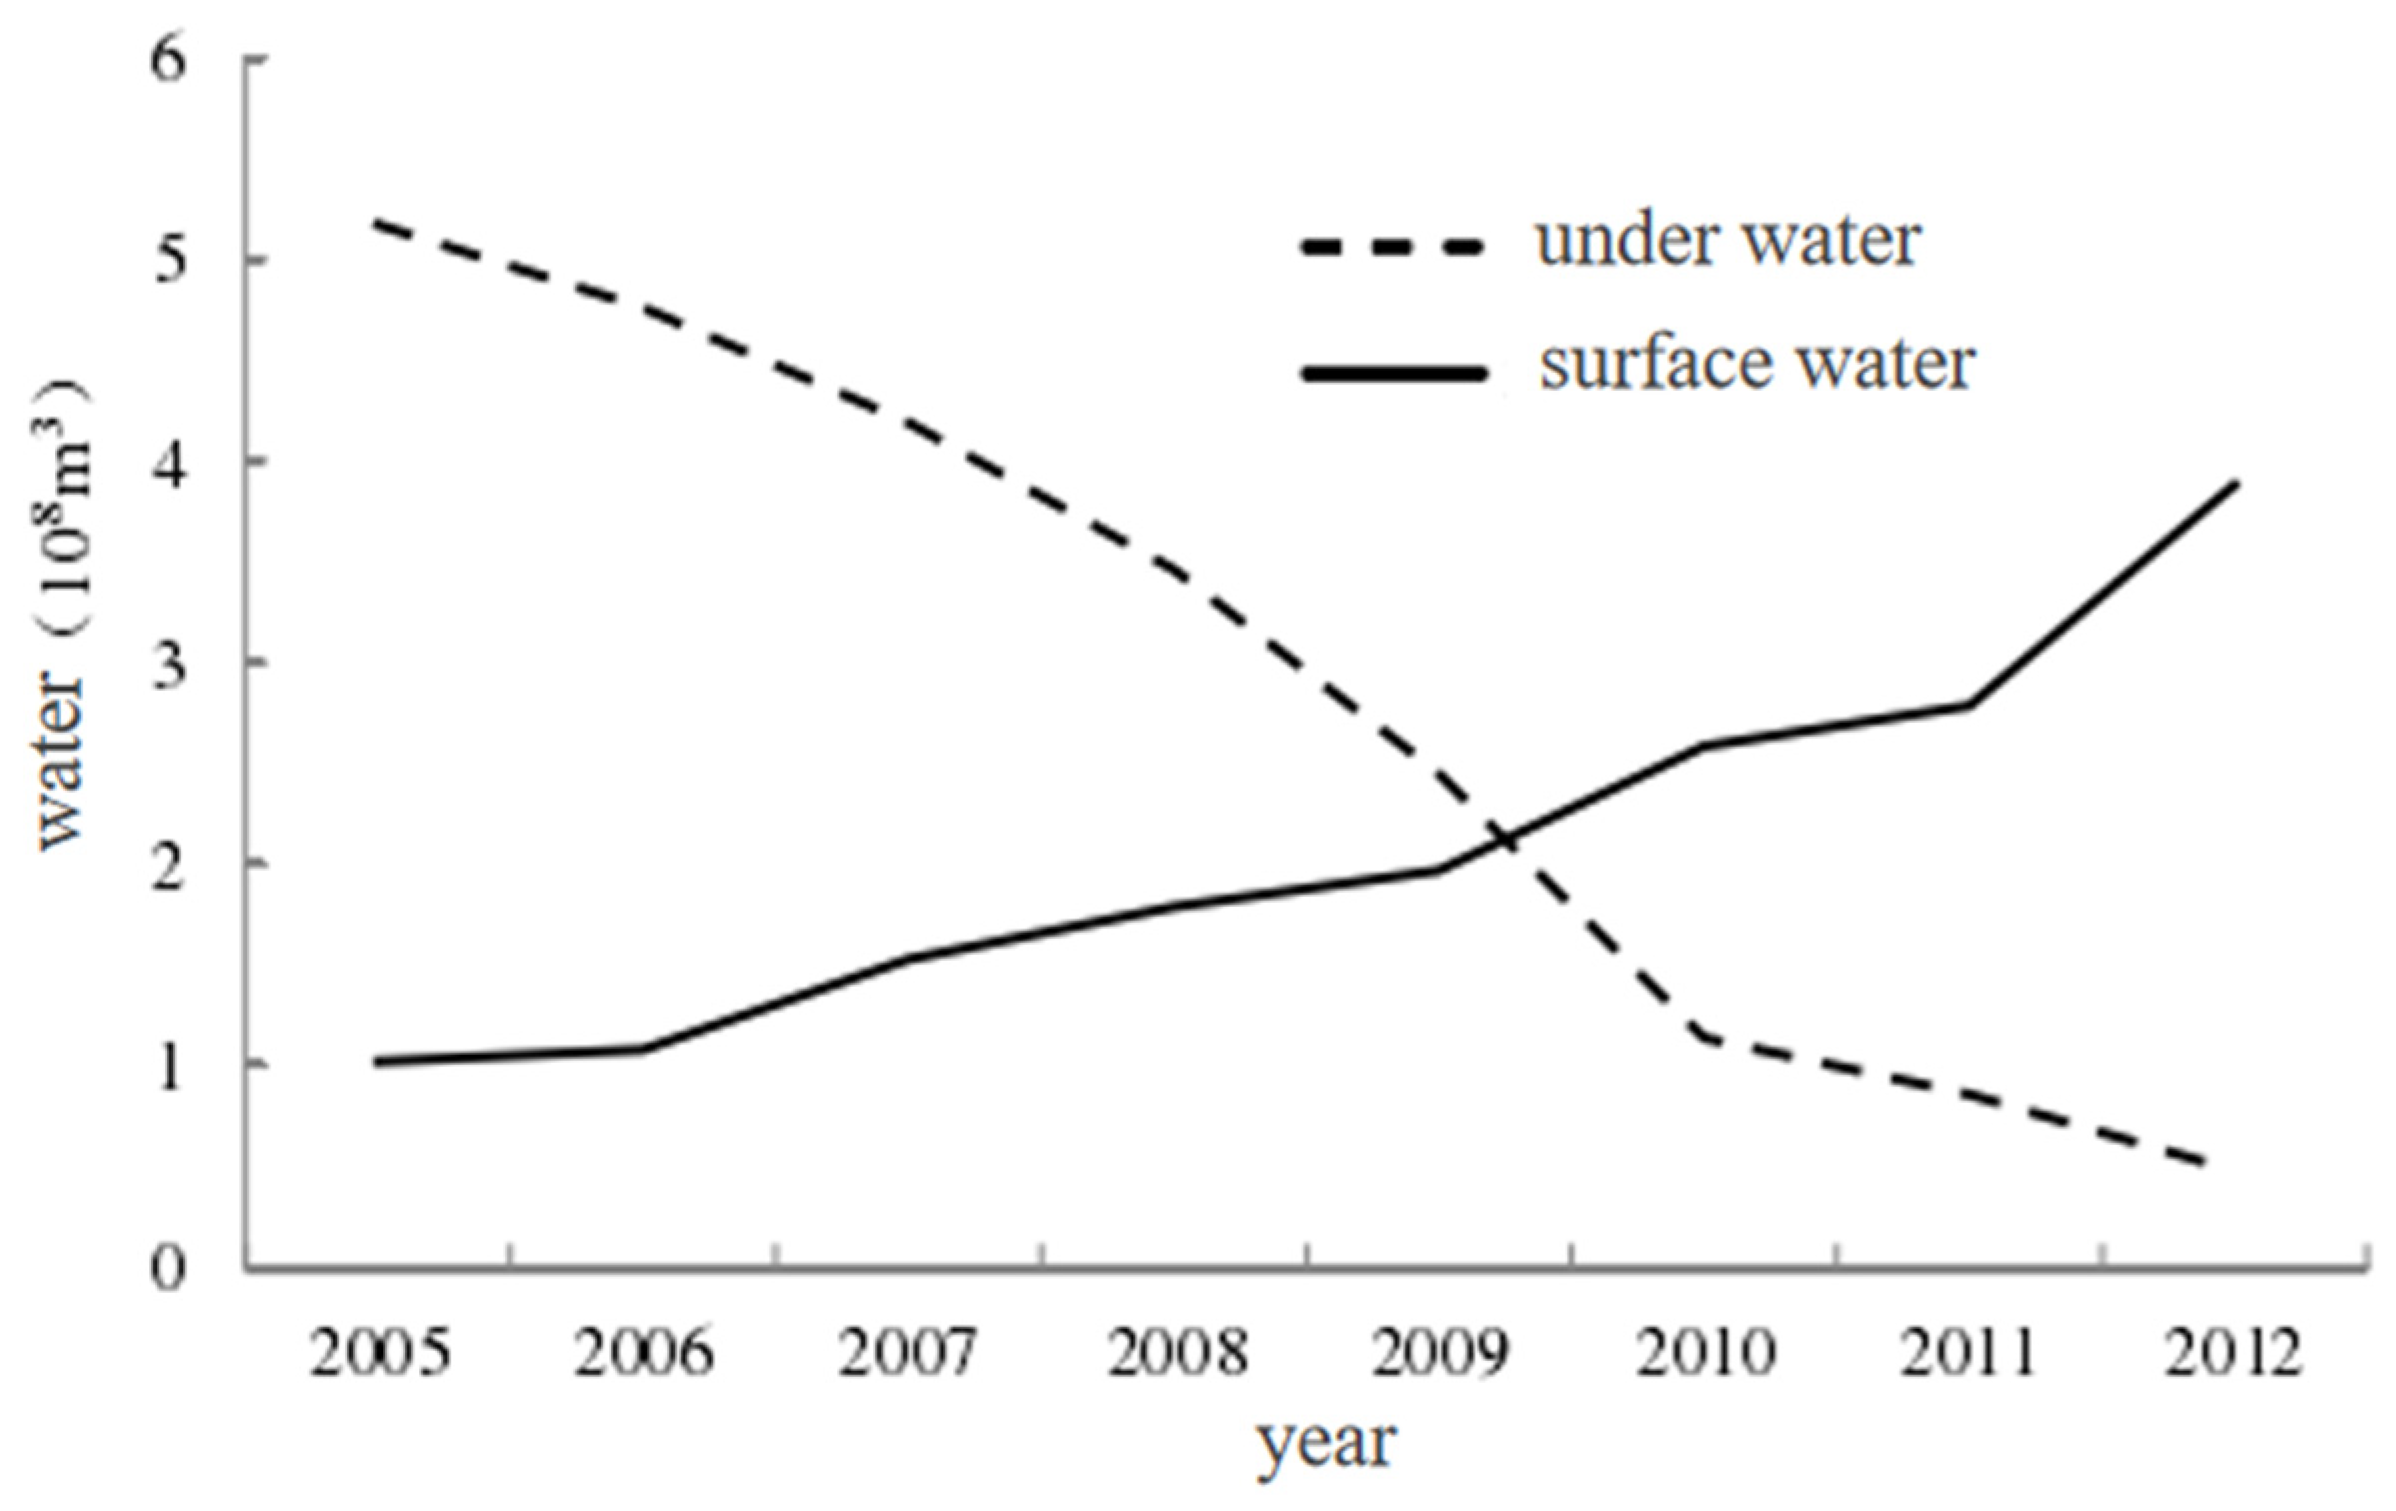
29], where land degrades seriously. Since the middle of the 20th century, Qingtu Lake, which is located in the deepest part of the two deserts, has gradually dried up. In the 1970s, Minqin County started to use a large amount of groundwater, which caused soil salinization. If it continues this seriously, it will eventually lead to the merger of the Tengger Desert and the Badain Jaran Desert, which will directly affect the geomorphology, climate, and human environment of the northwest region and even threaten the survival of local peoples [30].
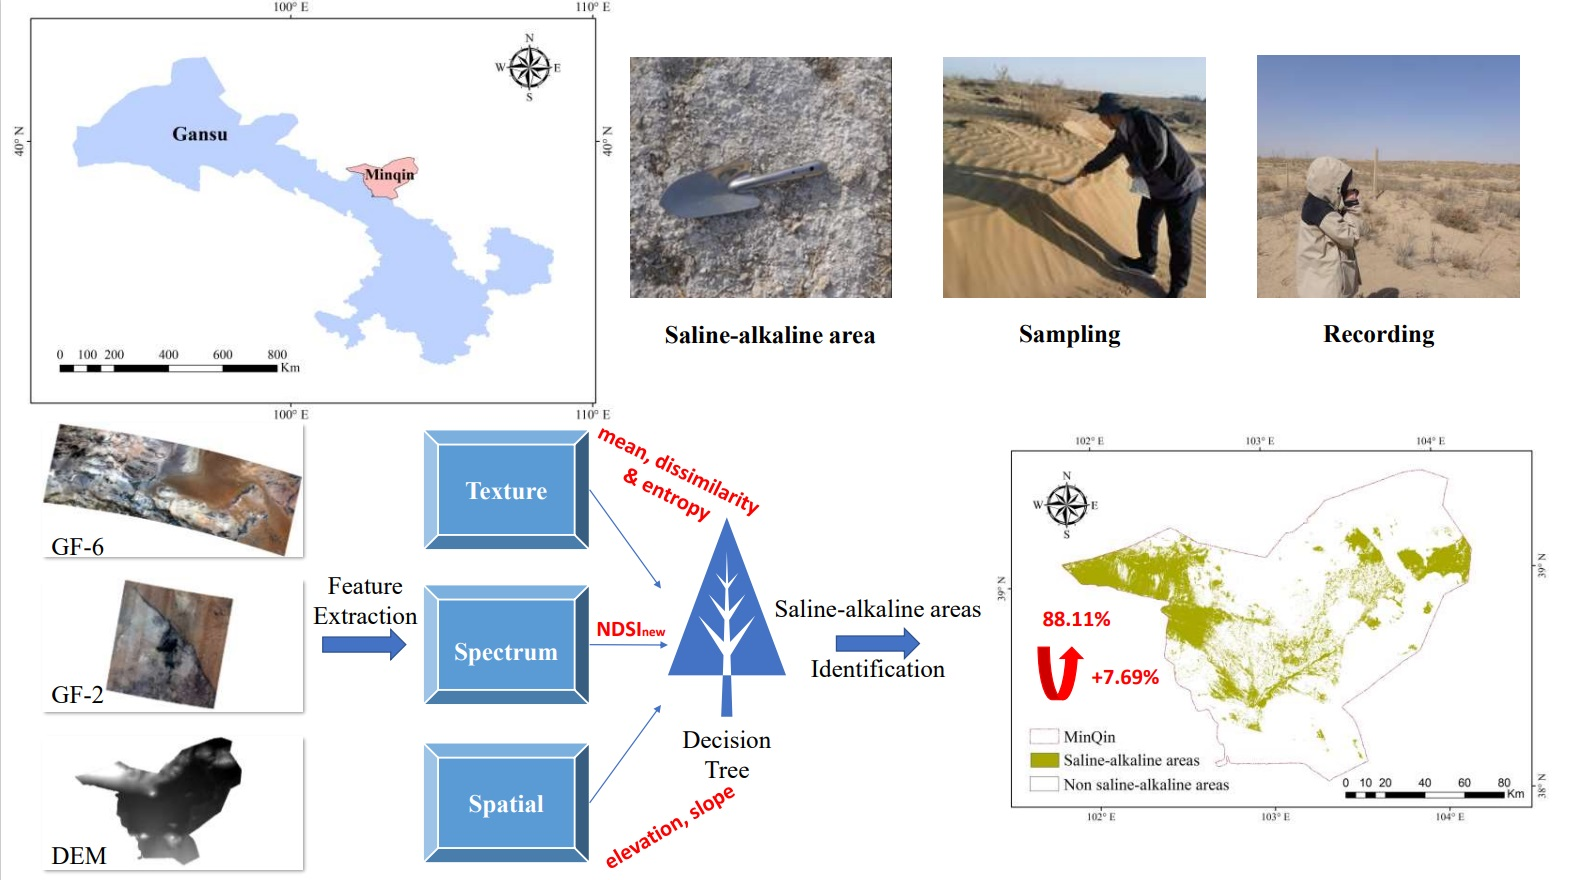
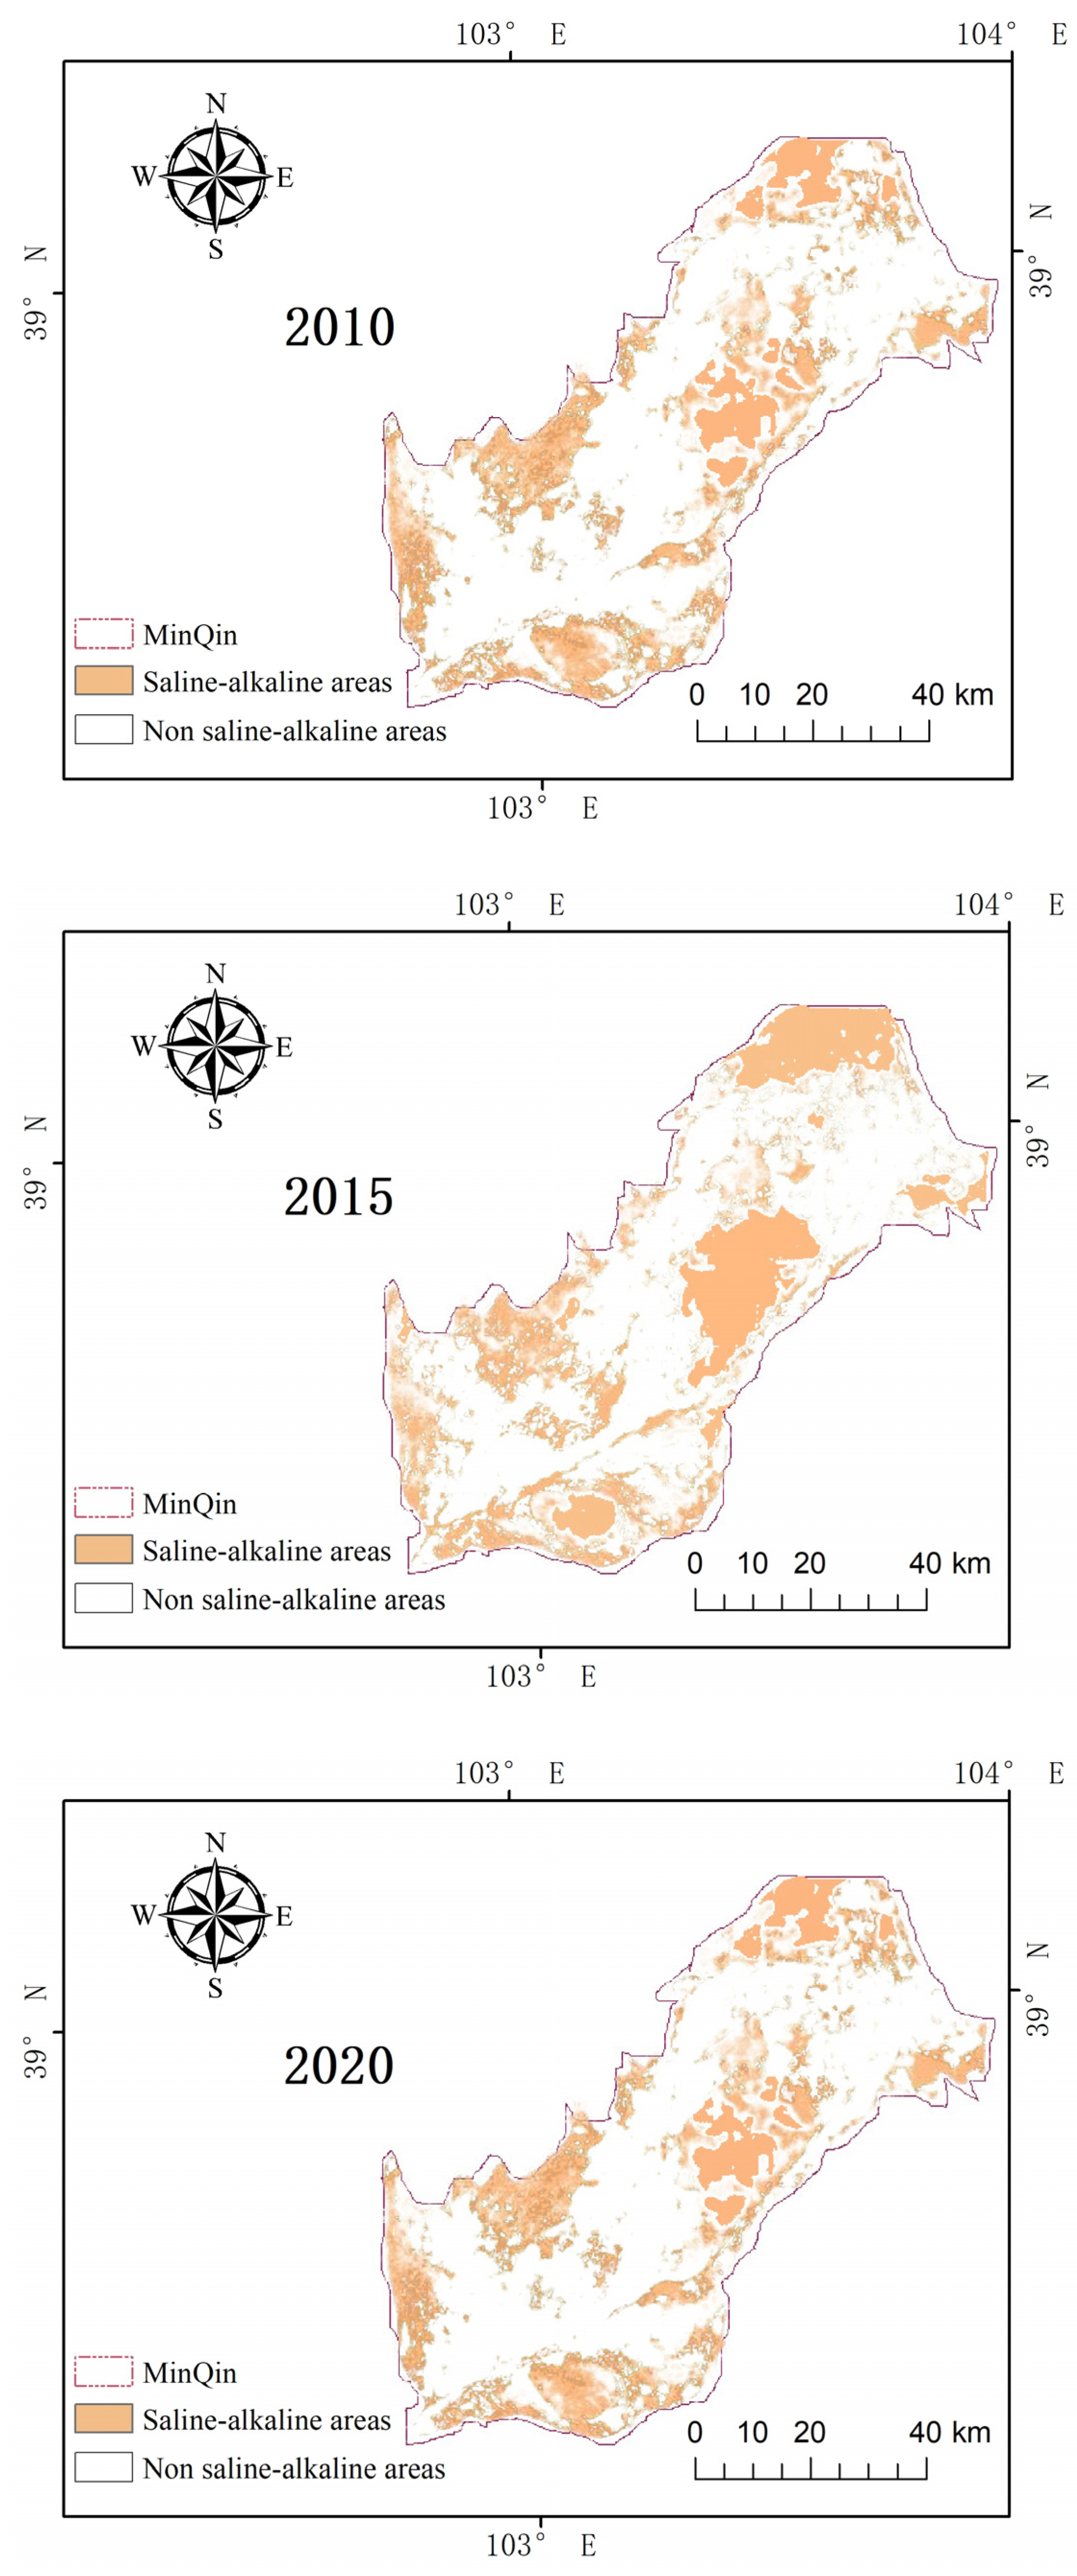
Although scholars have attained some achievements of quantitative monitoring of land cover using remote sensing, there is little research on the application of remote sensing data to the identification and monitoring of saline-alkaline areas at present. Traditional saline-alkaline area identification methods only rely on the selection of a single feature parameter, which is difficult to adapt to the optimal classification effect. To solve the problem of low accuracy of saline-alkaline area identification based on the traditional spectral indices, taking Minqin County as the study area, we propose a high-precision method of saline-alkaline area identification using multi-source data. By analyzing the trends and reasons of changes in saline-alkaline areas in the Minqin oasis, the objective of this paper is to provide a reference for the timely monitoring of saline-alkaline areas and ecological environment construction globally in arid areas.

2. Methodology and Experimental Application

2.1. Methodology

2.1.1. Identification Method of Saline-Alkaline Area

A decision tree [31] is a method for hierarchical processing of remote sensing images which is suitable for features with blurred boundaries and complex structures. Its main idea is to gradually mask and separate each feature as a layer from the imagery, avoiding any impact on the other features’ identification. Therefore, it is possible to integrate various effective feature quantities, thus improving the identification accuracy of saline-alkaline areas.
Firstly, we use GF-6/WVF (Chinese satellite GaoFen-6/Wide Field View) image data, combining GF-2(Chinese satellite GaoFen-2) image and Google Earth high-resolution image data to select different types of samples, and find the best spectral index of band combinations for saline-alkaline areas. Secondly, the GF-2 image data is used to extract textures. Elevation and slope from DEM (Digital Elevation Model) data are used as elevation features to build a decision tree model for saline-alkaline area identification. Finally, the accuracy of the classification results of the constructed decision tree model are verified in ArcGIS using the random scattering function combined with visual interpretation. The technical flowchart is shown in Figure 1.

2.1.2. Accuracy Evaluation Method

Evaluation of feature classification is an important part of remote sensing monitoring, attempting to determine whether the results are credible. The most commonly-used evaluation method is the error matrix method, also called the confusion matrix method [32].
In this paper, the confusion matrix is calculated by comparing each actual measured image element with the corresponding classified one [33]. Each column of the confusion matrix represents the actual measured information, and each row of the confusion matrix represents the classified information of the remote sensing data (Table 1).
User accuracy is the percentage of test points that fall on that category in that sub-category and are correctly classified as that category on the classification graph.
UA   ( User s   Accuracy ) = X n n C d n  
Producer accuracy is the probability that the ground truth reference data for the category is correctly classified in this classification.
PA ( Producer   accuracy ) = X n n T d n  
Overall accuracy is the percentage of check points of all correctly-classified land cover categories relative to the total number of check points.
OA ( Overall   accuracy ) = i = 1 n X i i A l l
The Kappa coefficient is a metric that indicates how much better the classification result is than random classification. The Kappa coefficient takes into account the difference between two kinds of consistency; one is the consistency between automatic classification and reference data, and the other is the consistency between sampling and reference classification. In general, the Kappa coefficient is between 0 and 1. A higher Kappa coefficient indicates a higher classification accuracy.
Kappa   = O A i = 1 n C d i × T d i A l l 1 i = 1 n C d i × T d i A l l
From 5 to 8 March 2023, we collected 143 samples for verification at a depth of 0 to 5 cm from the surface. They were recorded, associated with information such as number, location, depth, personnel, date, and then brought back to the laboratory.

2.2. Experimental Application

2.2.1. Study Area

Minqin County is located in the downstream region of the Shiyang River Basin in eastern Gansu Province, China, with an altitude of 1200–1500 m (Figure 2). Tengger Desert is in the east, and Badain Jaran Desert is in the north [34] (Figure 3).
As a temperate continental desert climate, the climate of the study area is characterized by cold winters and hot summers, and is dry, with little precipitation, as well as windy and sandy [35]. Its average annual temperature is 8.2 °C and the average annual precipitation is 115 mm [36]. The total area of oasis in this area is about 1352 km2, which only accounts for 9% of the total area of Minqin County [37]. Due to environmental characteristics such as high temperatures, low precipitation, and high evaporation, the water resources in Minqin are lacking, which leads to soil desertification [30].
The main soil types are Fragic Arenosol, Solonchak, Solonetz, Plaggic Anthrosol, and Irragric Anthrosol [38], the first of which can be classified as Arenosol with sand content exceeding one-half [39].

2.2.2. Data

GF-6/WFV images and GF-2/PMS images, as well as DEM, slope, and vector boundary data, are used in this paper (Table 2). In this experiment, seasons of the remote sensing images were selected as being from June to July, because plants grow more luxuriantly and there is no snow and ice cover in this period, and thus, it is favorable for the identification of saline-alkaline areas.
The GF-6/WFV data were pre-processed for radiometric calibration, atmospheric correction, orthorectification correction, and vector cropping to obtain eight-band surface reflectance data for the study area (Figure 4). The atmospheric correction was implemented by the FLAASH (fast line-of-sight atmospheric analysis of spectral hypercubes) atmospheric correction module (Table 3).
The GF-2/PMS image has MSS (Multispectral) and PAN (Panchromatic) data. They have been pre-processed for radiometric calibration, atmospheric correction, geometric correction, image fusion, etc. to obtain a four-band fused image with a spatial resolution of 1 m for the study area (Figure 5).
Image fusion is an image processing technique that resamples low-resolution multispectral images with a high-resolution pan image to generate a high-resolution multispectral image for remote sensing, enabling the processed image to have both high spatial resolution and multispectral characteristics. Here, we use the Gram–Schmidt pan sharpening (GS) fusion method (Figure 6). Its advantage is that it is not limited by the band, which is suitable for processing high spatial resolution images, and can better maintain the texture and spectral information.
The DEM data was cropped in ArcGIS using vector boundary files and then output to obtain the elevation data of the study area. Furthermore, slope was obtained from the cropped DEM in ArcGIS (Figure 7).

2.2.3. Feature Extraction

  • Spectral features
The main land cover types in the study area include desert, saline-alkaline area, vegetation, urban, and water. After pre-processing the GF-6/WFV images, the original spectral characteristics of each type in the study area were analyzed (Table 4, Figure 8).
From Figure 8, we can see that some spectral features of a saline-alkaline area and a desert are easily confused; more spectral indices are needed to improve the saline-alkaline areas’ classification accuracy.
The NDSI34 (Normalized Difference Spectral Index of Band 3 and Band 4) was constructed using band 3 (Red) and band 4 (NIR).
NDSI34 = (NIR − R)/(R + NIR)
The NDSI25 (Normalized Difference Spectral Index of Band 2 and Band 5) was constructed using band 2 (Green) and band 5 (Red edge1: Re1).
NDSI25 = (Re1 − G)/(Re1 + G)
The NDSI 237 (Normalized Difference Spectral Index of Band 2, Band 3 and Band 7) was constructed using bands 2 (Green), 3 (Red), and 7 (Violet).
NDSI237 = (R + G − V)/(R + G + V)
The final composite salinity index NDSInew (New Normalized Difference Salt Index) was constructed as:
NDSInew = NDSI25 + NDSI237 − NDSI34
The spectral indices are mainly selected depending on the spectral characteristics of each feature. For example, NDSI34 can sufficiently separate the vegetation in the image. The saline-alkaline area is associated with a large difference between the red edge1 band and the green band, therefore, NDSI25 can distinguish the saline-alkaline areas from other features. For reflectance of saline-alkaline soil in the red and green bands, which are significantly higher than those in the violet band, NDSI237 can sufficiently separate saline-alkaline soil from other features. Considering the three indices together, we finally construct the comprehensive index, NDSInew, by which the saline-alkaline areas can be well distinguished.
  • Texture features
When the spectra of the features are relatively similar, the spectral differentiability decreases and texture information can play an important role in distinguishing the features, raising the accuracy rates of classification [40].
Among the methods for computing image texture features, GLCM (grey-level co-occurrence matrix) is one of the most widely used statistical methods [41]. GLCM can describe the spatial distribution and structural characteristics of the image grayscale, which is advantageous in improving the classification of geological targets by using texture. There are eight main feature quantities commonly used for texture identification in remote sensing images: mean, variance, homogeneity, contrast, dissimilarity, entropy, angular second moment, and correlation.
We used the GLCM method to extract textures from GF-2 images and calculated eight textures on four bands with a 3 × 3 window (Figure 9). After that, we selected mean, dissimilarity and entropy as the parameters for classification.
  • Elevation features
Height and slope information from DEM are introduced to carry out reclassification in ArcGIS. As shown in Figure 10, there are some differences in elevation among features. For example, vegetation and urban types are generally flatter.

3. Results and Discussion

3.1. Classification and Verification

Based on multi-source data, the results of saline-alkaline area identification map in the study area using a decision tree classification method combining spectral features (NDSInew), texture features (mean, dissimilarity and entropy), and elevation features (height and slope) is shown in Figure 11.
Through random distribution and considering the accessibility of each site, we travelled to Minqin County for a field survey (Figure 12). The land types of verification points were investigated and labeled, and 143 verification samples were obtained.
The samples were established and verified by confusion matrix, using producer accuracy, user accuracy, total accuracy and Kappa coefficient. The results are shown in Table 5, and indicate that the accuracy of the proposed saline-alkaline area identification method is 88.11%.
Shown in Figure 13, the saline-alkaline area in Minqin County is 3385.17 km2, accounting for 20.4% of the total area of Minqin County.
From its spatial distribution in Figure 11, the soil salinization in the northwest is the most serious, with a large area of saline-alkaline area implicated, followed by the eastern region, and finally the Minqin oasis area, where the saline-alkaline area is small, scattered, and distributed on both sides of the oasis.

3.2. Comparison of the Results of Different Indices

Based on the same data, the traditional salinity index NDSIold = (NIR − R)/(R + NIR) was used for salinity identification, and its accuracy was verified to be 80.42%. The comparison of the salinity identification results between these two methods is shown in Figure 14.
From these results, we can see that the accuracy of the new salinity index NDSInew is improved by 7.69% compared with the traditional salinity index NDSIold, indicating the effectiveness of the new spectral index in the identification of saline-alkaline areas.

3.3. Analysis of Saline-Alkaline Area Change

Three Landsat8 OLI remote sensing images were downloaded from https://www.gscloud.cn, accessed on 28 December 2022, in July and August (Table 6).
The remote sensing data were pre-processed with ENVI.
The results of the saline-alkaline area identification in 2010, 2015 and 2020 (Figure 15) were statistically analyzed in ArcGIS to classify the total areas of saline-alkaline land. The saline-alkaline areas in 2010, 2015 and 2020 were 2276.21 km2, 2186.28 km2 and 1922.93 km2, respectively (Figure 16). From this, we can see that the saline-alkaline area decreased 353.28 km2 from 2010 to 2020.
There are many natural and human factors affecting the saline-alkaline area changes in the Minqin oasis:
(1) Climate change has brought many problems to the soil environment, such as a series of biological changes in the soil’s physical composition (water content), chemical composition (various salt ion contents), and plant species. Climatic warming can not only cause microorganisms to rapidly decompose soil organic matter and soil nutrients’ rapid decrement, but it can also cause soil moisture to evaporate, accelerating the upward movement of salt, and causing soil salinization.
According to the statistics of the Minqin meteorological station, Minqin has little rainfall but a high level of evaporation (Figure 17). Combined with the temperature rises, these promote the salinization of the soil.
Coupled with the weathering effect of rocks, a large amount of salt is released in the soil’s parent material of the northwestern remnant hills, and then carried to the lowlands through precipitation, resulting in serious salinization in the northwest [42].
(2) Historically, Minqin has been one of the important salt-producing areas, with many salt ponds [34]. With the gradual depletion of the Shiyang River, Minqin started to seek groundwater instead (Figure 18). Due to the adjustment of agricultural structure, water resources were redistributed spatially, salt was transferred with water, and the overuse of irrigation water also led to the transformation of some depressions at the edge of the oasis into saline-alkaline areas [43].
(3) In 2007, the government implemented the “Key Control Plan of Shiyang River Basin” and began to transfer water to Minqin County at the lower reaches of the Shiyang River [44]. The surface water runoff into Minqin County has increased year by year (Figure 18). Since then, the soil salinization in Minqin has been improved to a certain extent.
Some studies [45,46,47] on saline-alkaline area identification in Minqin County are shown in Table 7. However, all only considered salinization as a type of desertification and did not conduct in-depth research on the fine classification of saline-alkaline areas. From this, it can be concluded that there are few studies on saline-alkaline area identification in Minqin County. At the same time, there have been precedents for the decision tree classification methods for land classification in this region, which proves the applicability of the method in Minqin.

4. Conclusions

We use multi-source data for saline identification in Minqin County and draw the following conclusions:
(1) The proposed method is effective in saline identification.
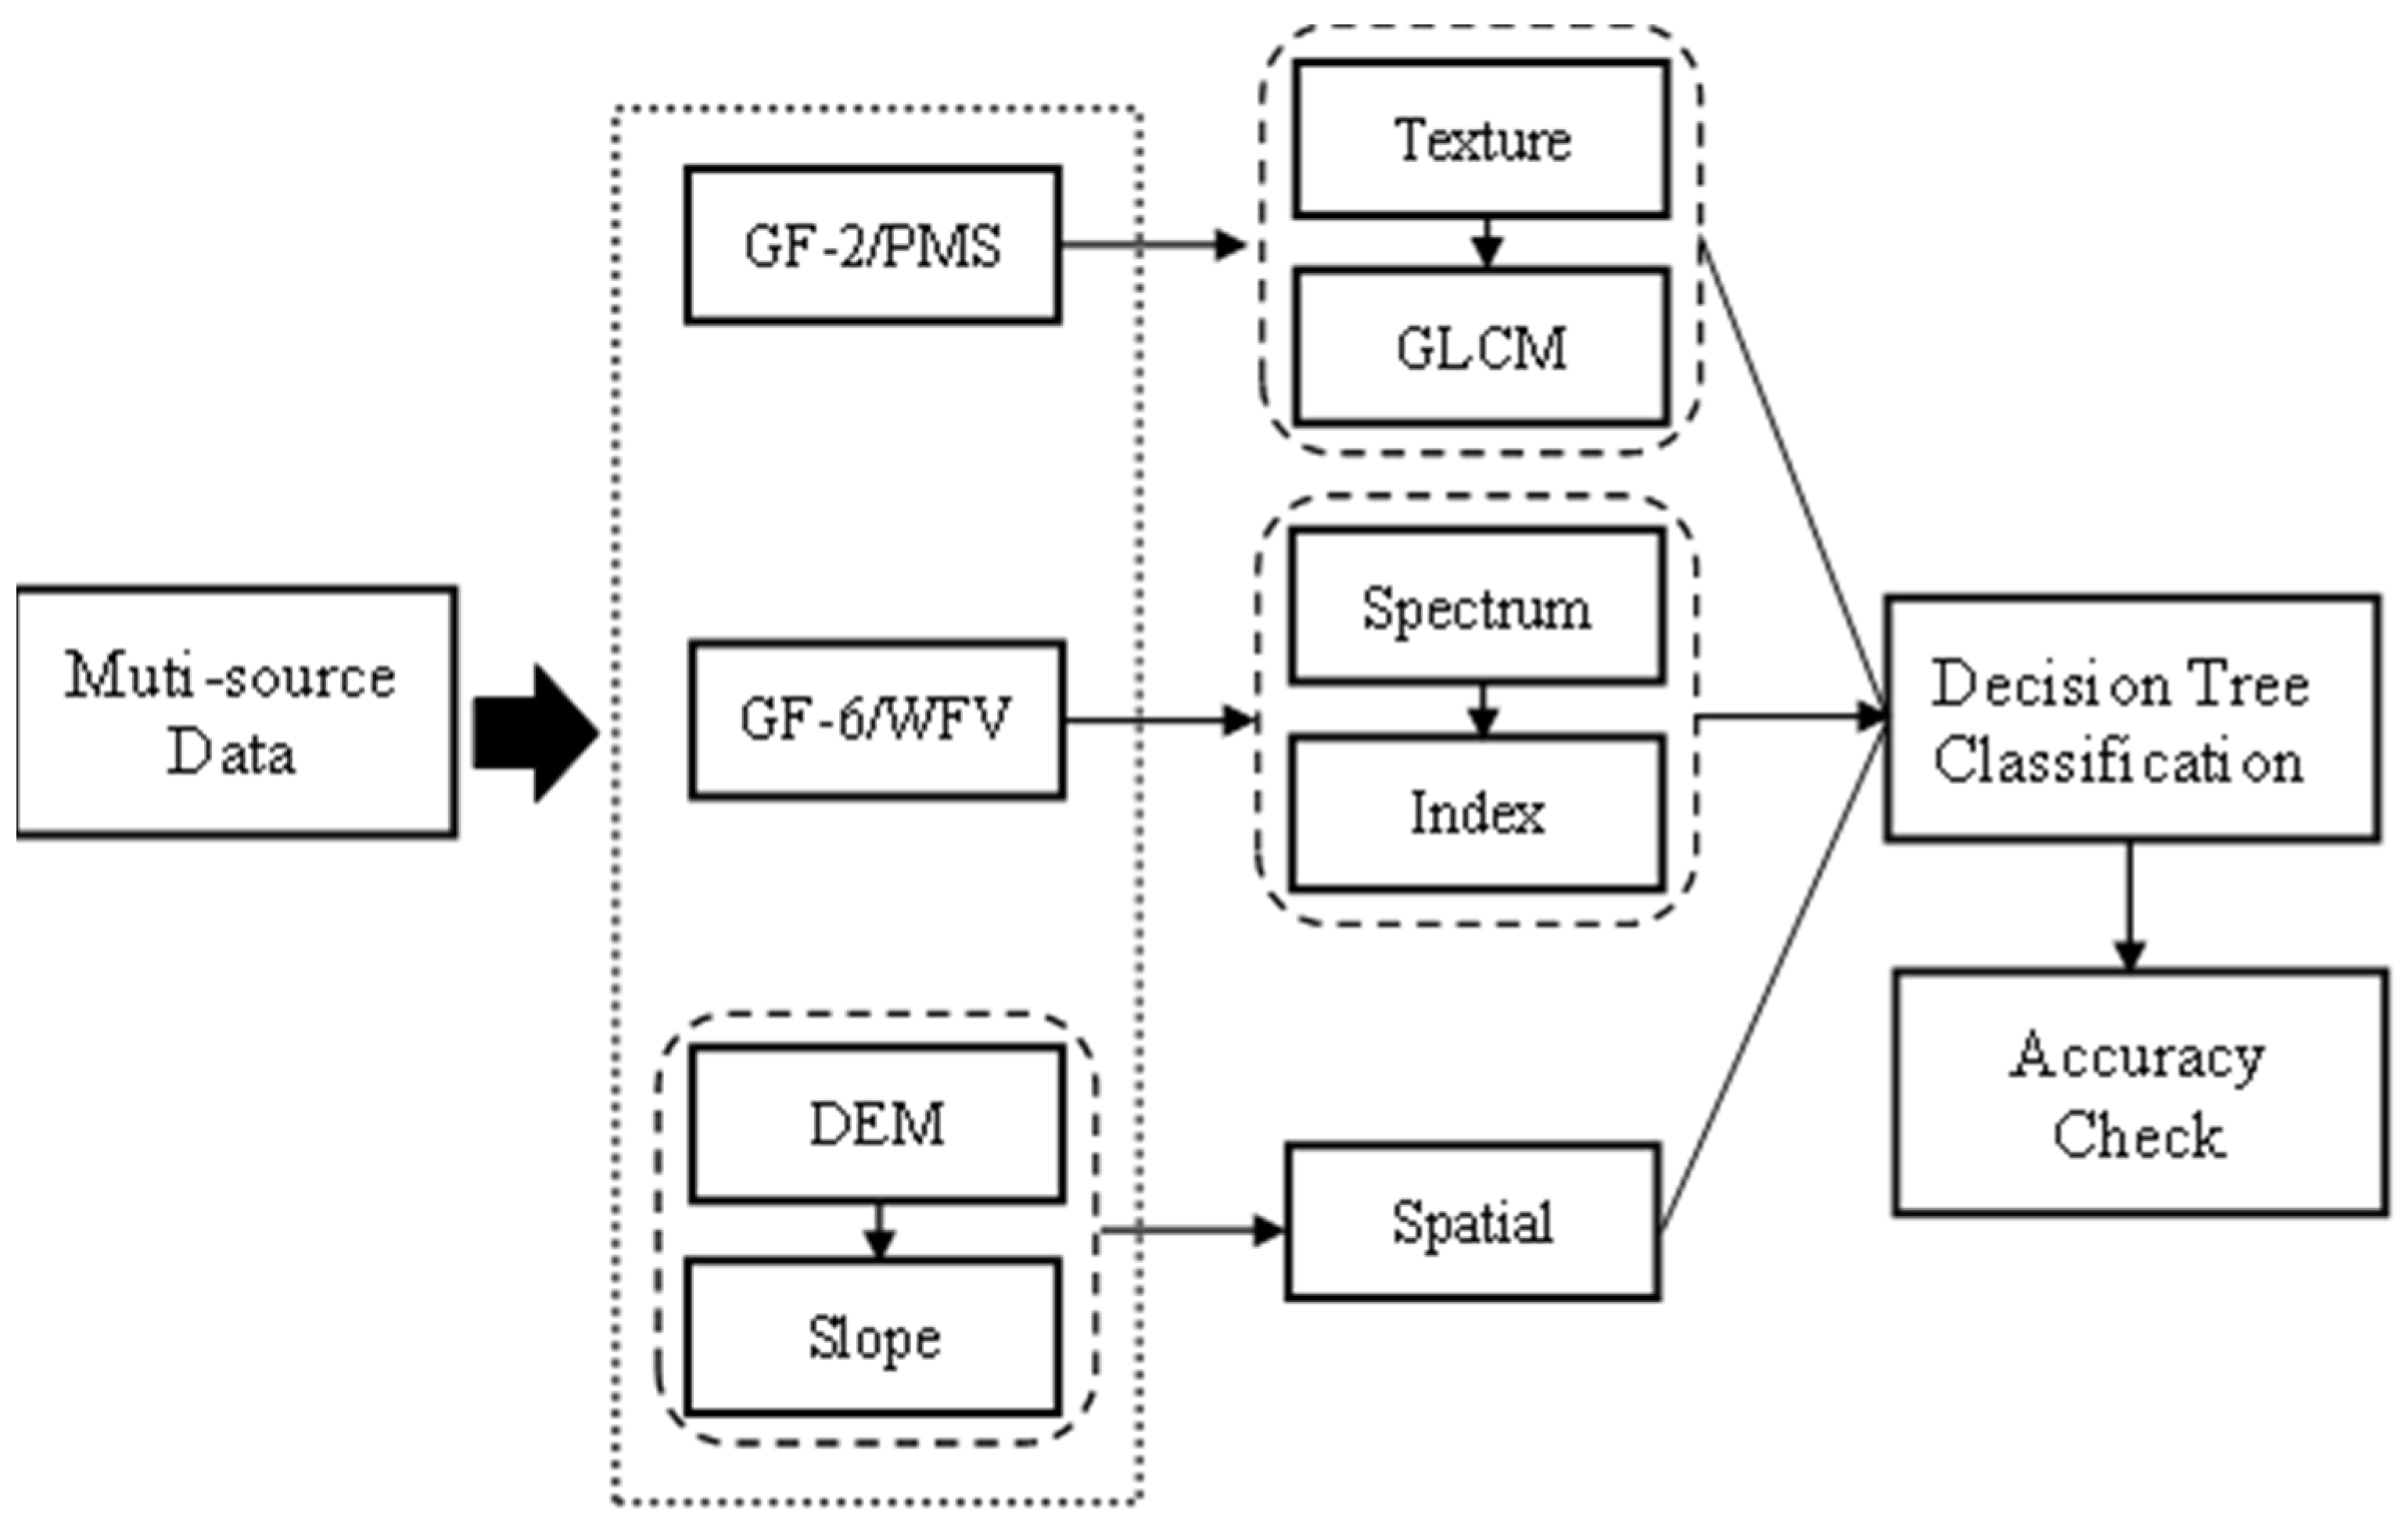
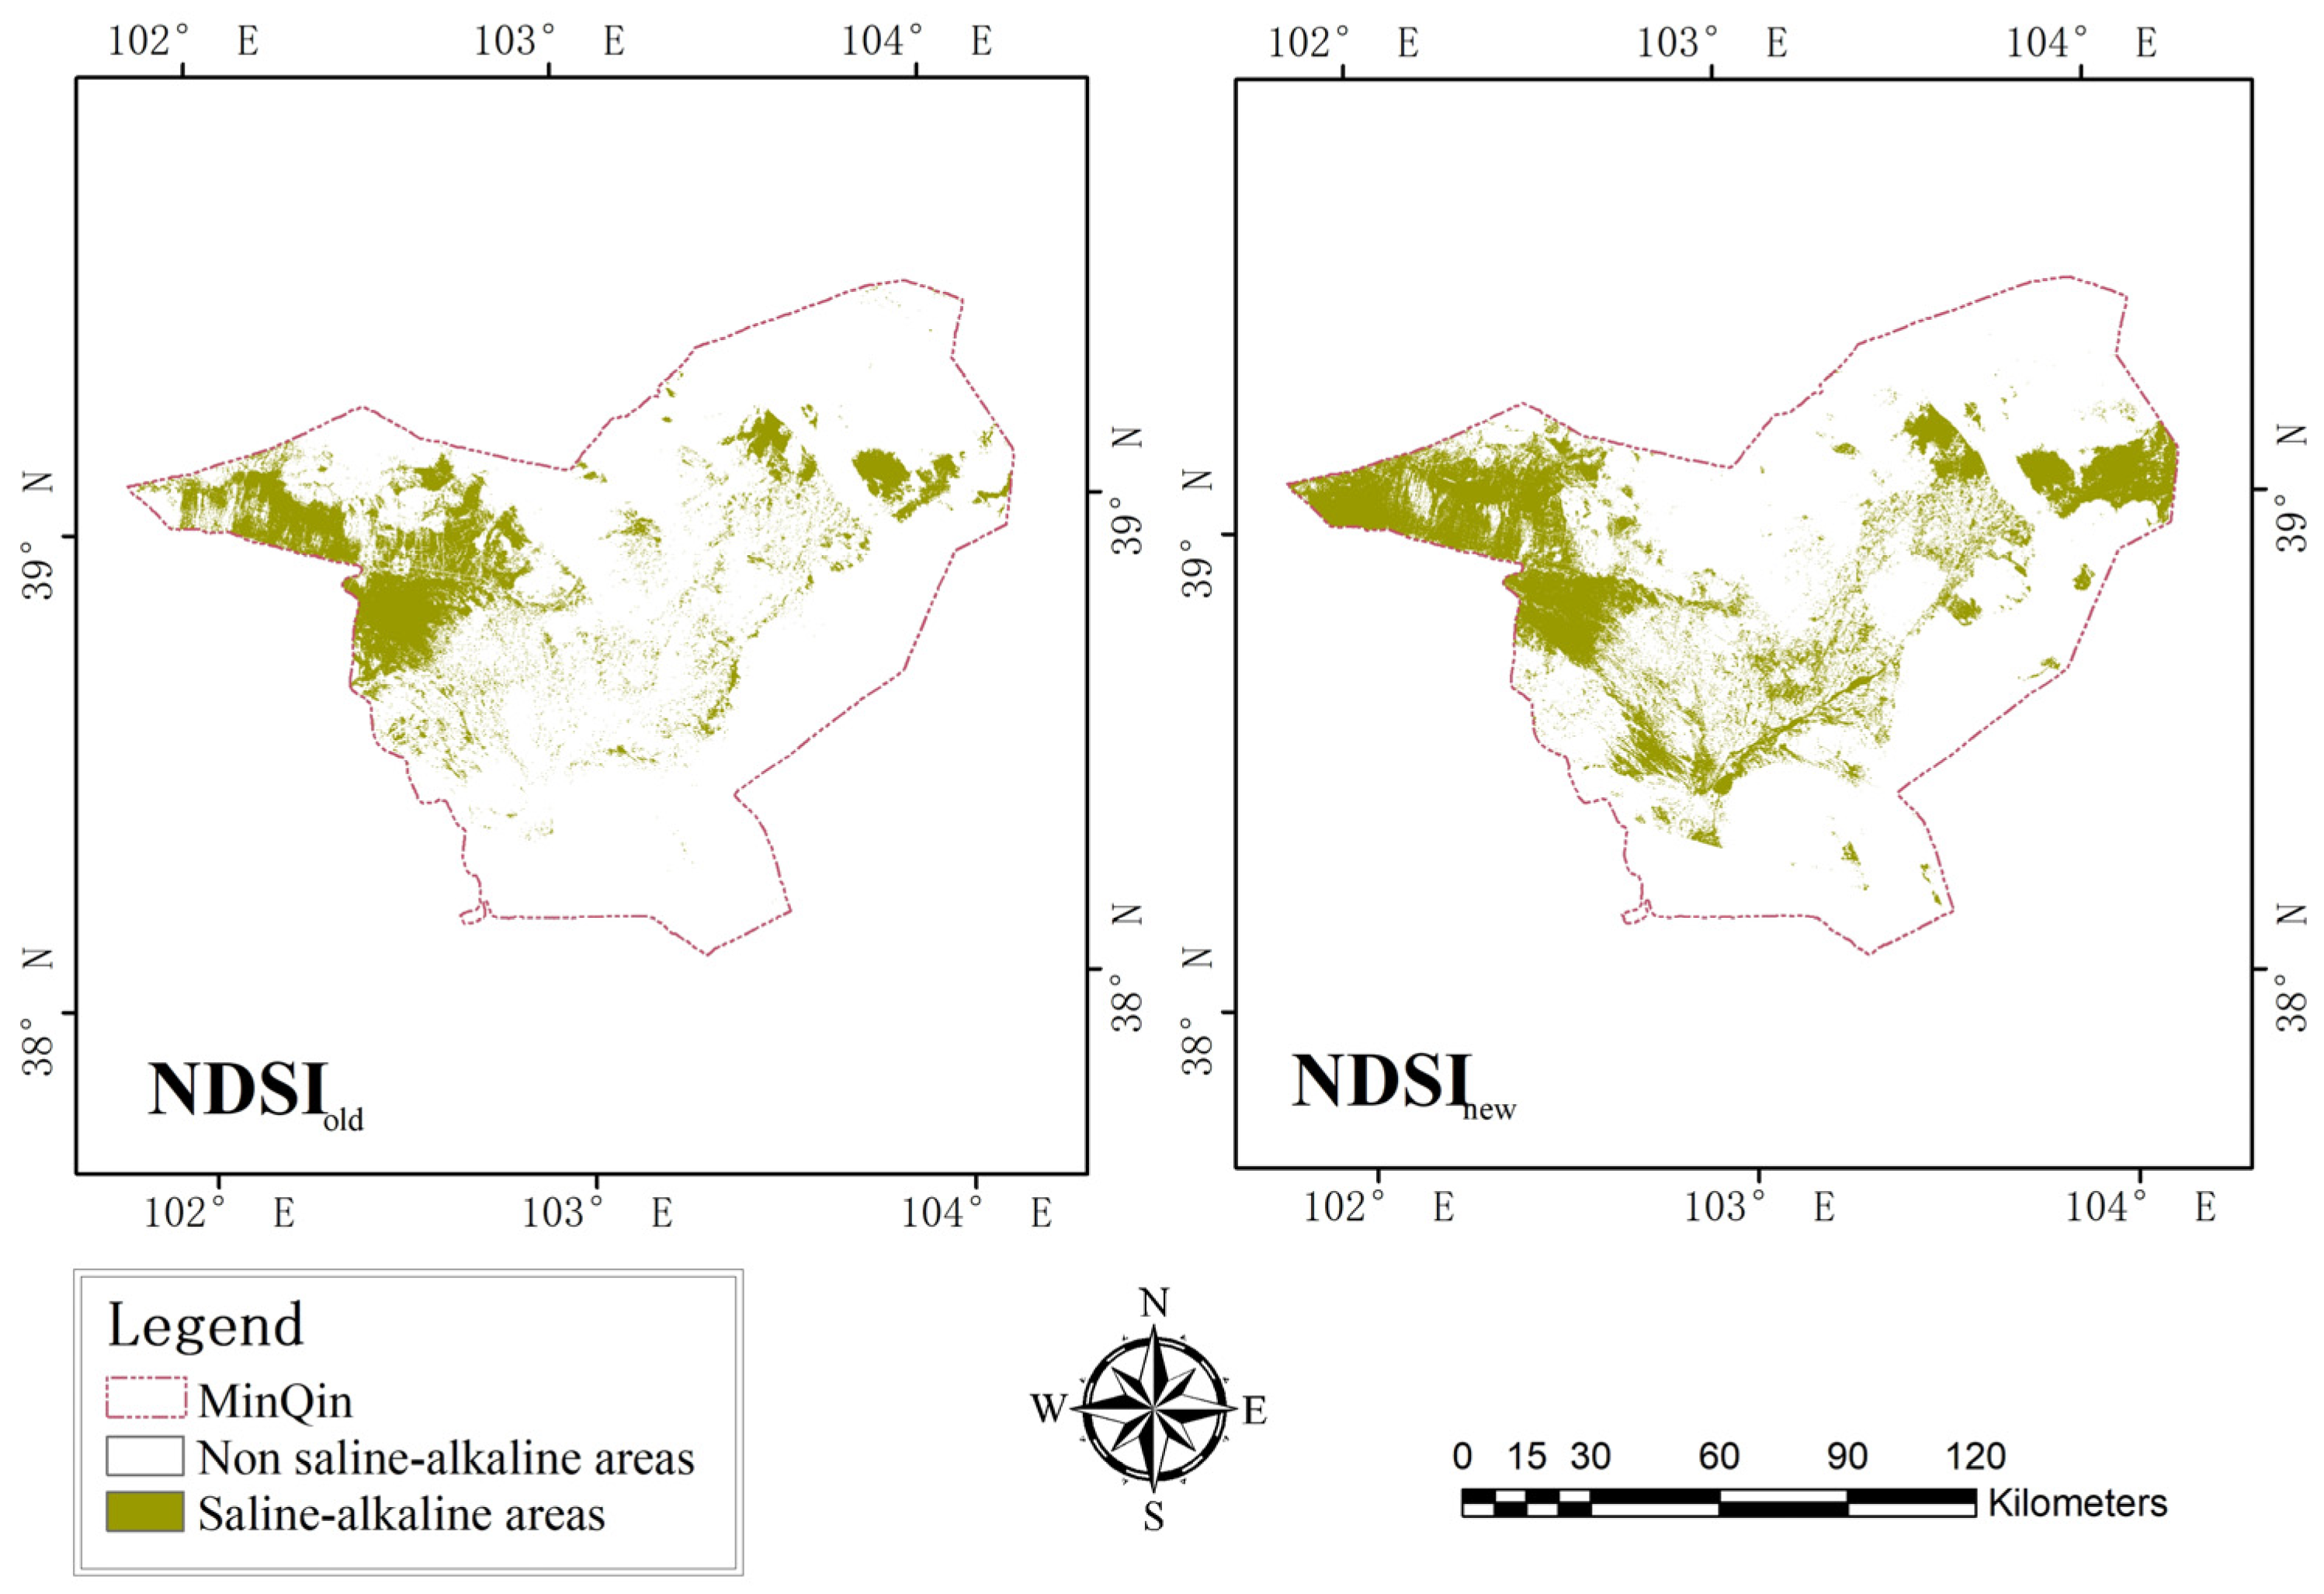
Based on multi-source data, we use a decision tree classification method to extract saline-alkaline areas by constructing three features: spectral indexes, textures, elevations, and slopes. The results show that the accuracy of saline-alkaline area identification is 88.11%, which is 7.69% greater than the traditional salinity indices, indicating the effectiveness of the proposed method.
(2) The multi-source data can help to identify features and improve accuracy.
GF-6 data are beneficial to the improvement of the accuracy of saline-alkaline area identification. In which, band 3 and band 7 are important to the saline-alkaline area identification in the study area.
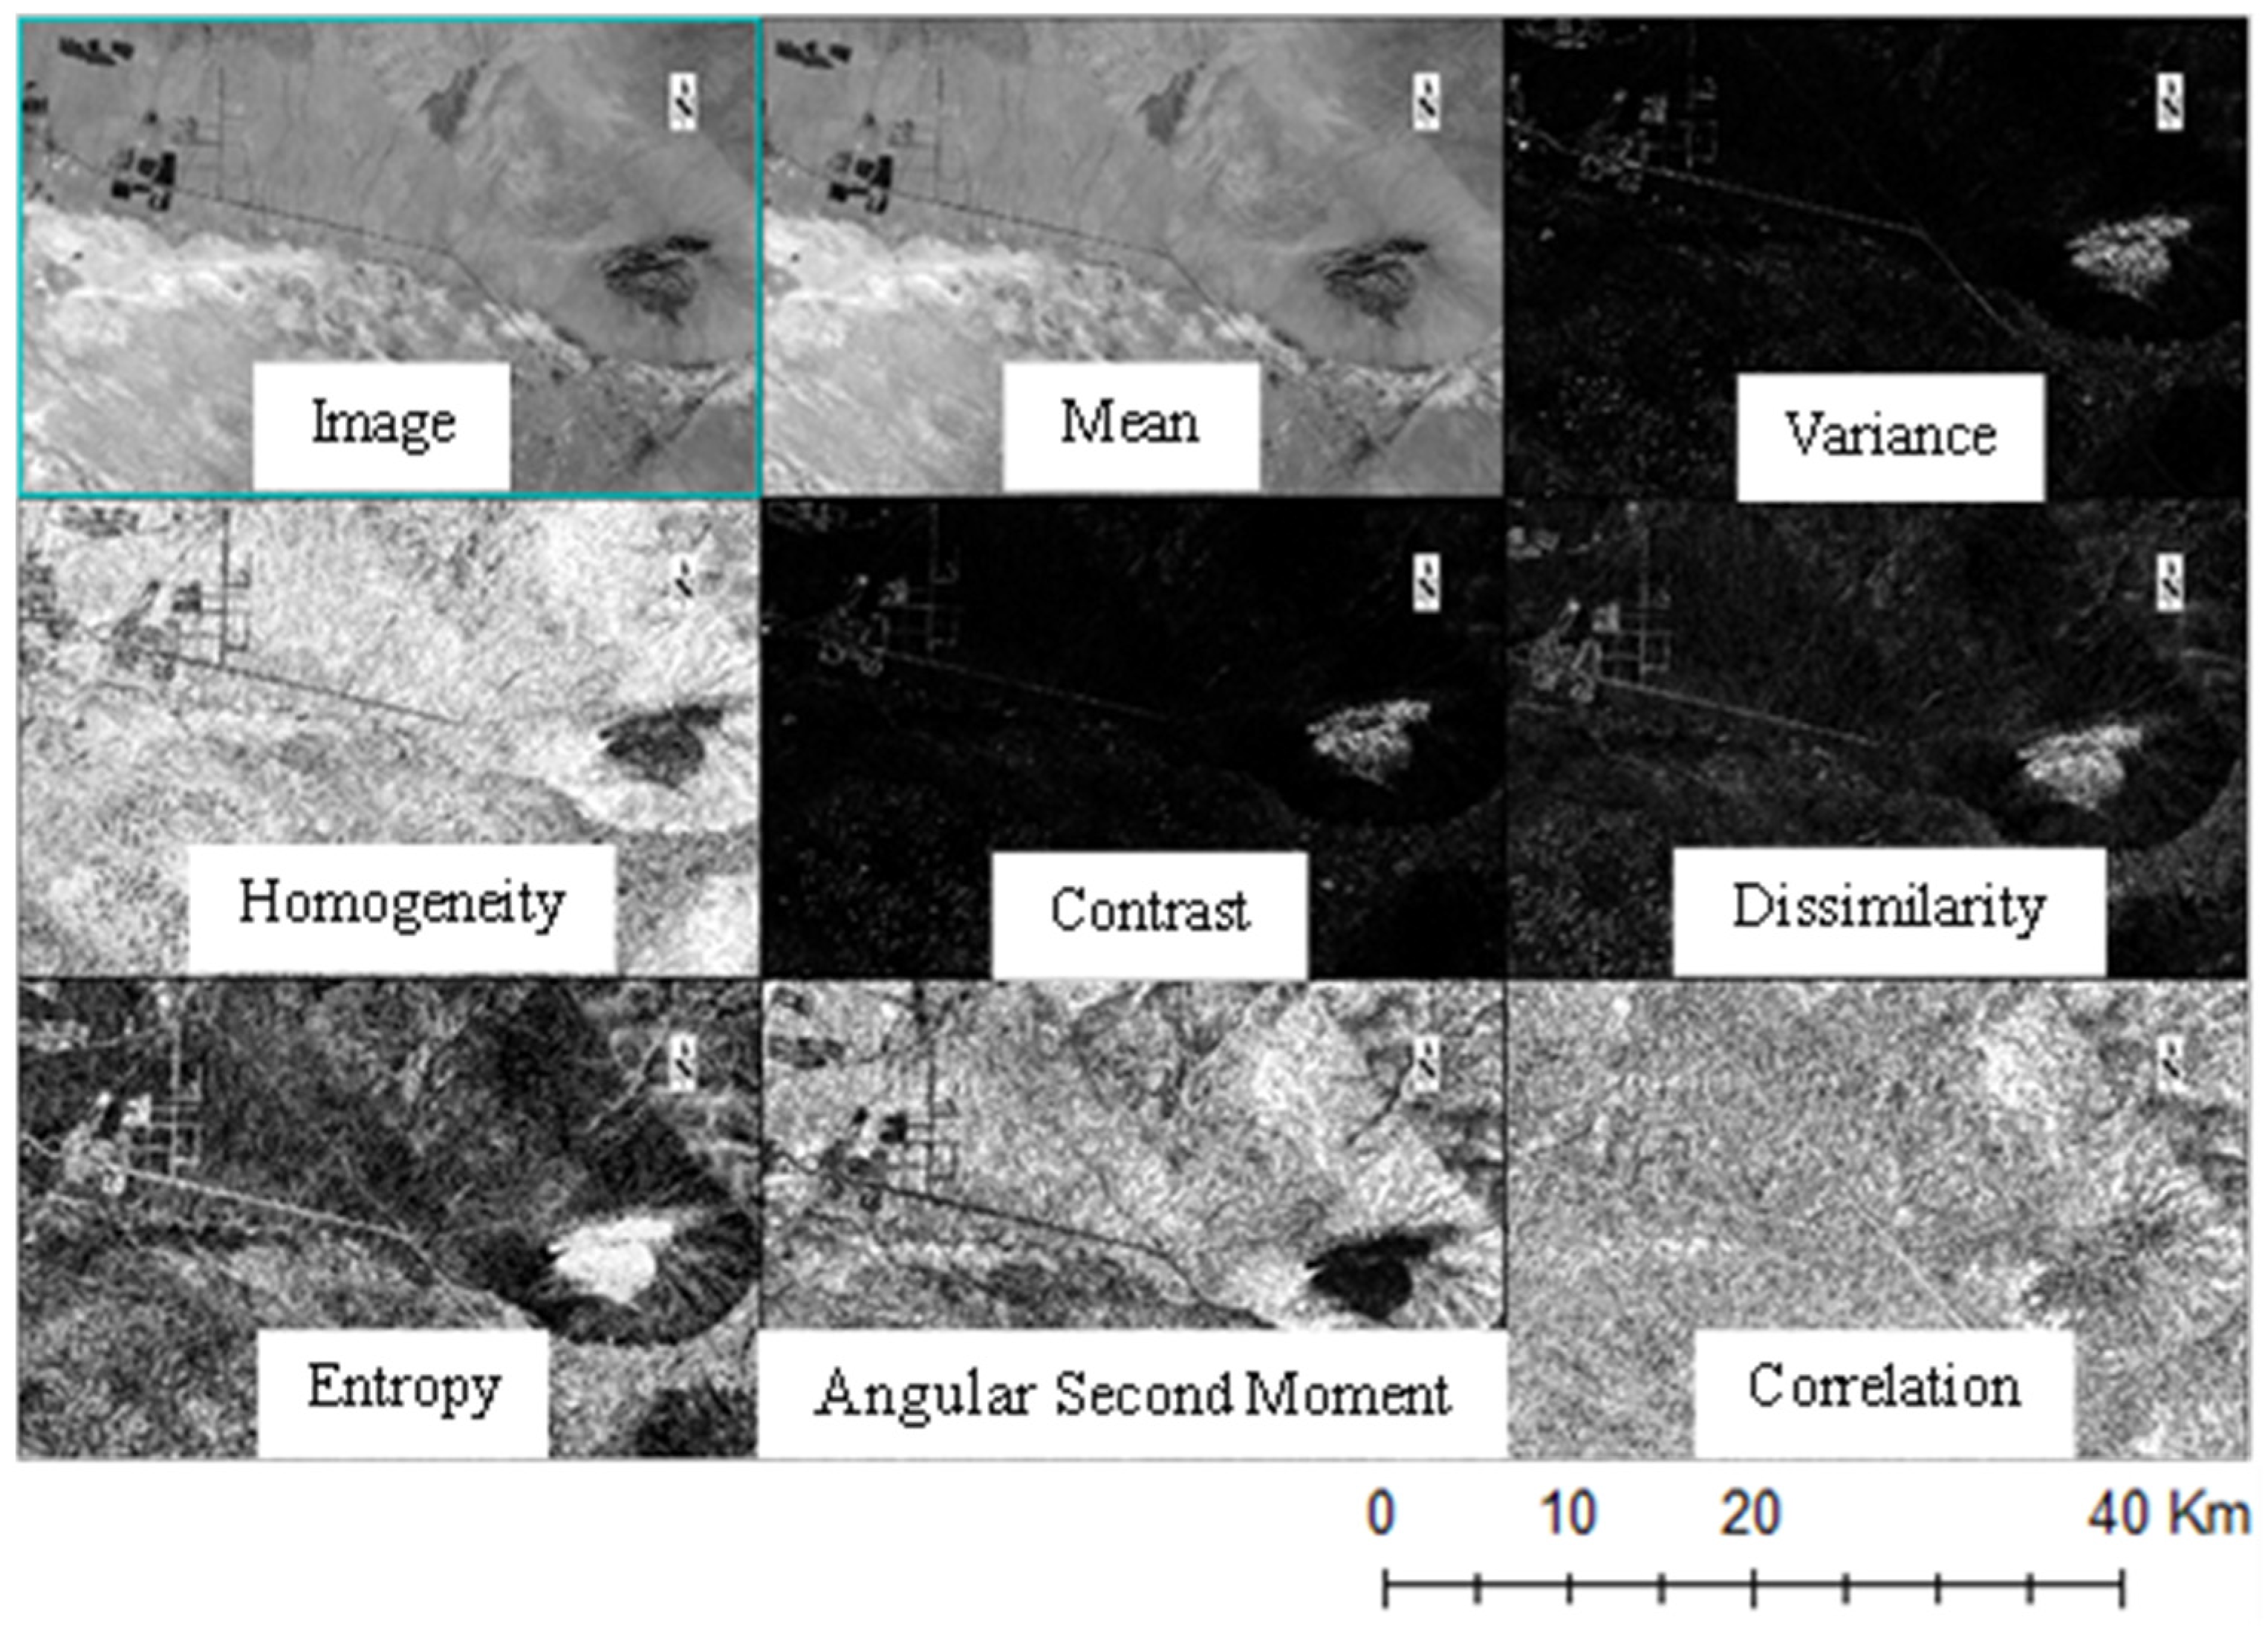
High spatial resolution of GF-2 data can provide rich texture information, thus reducing the mistakes of distinguishing or misclassifying between features due to “different features with the same spectrum” or “different features with the same spectrum”.
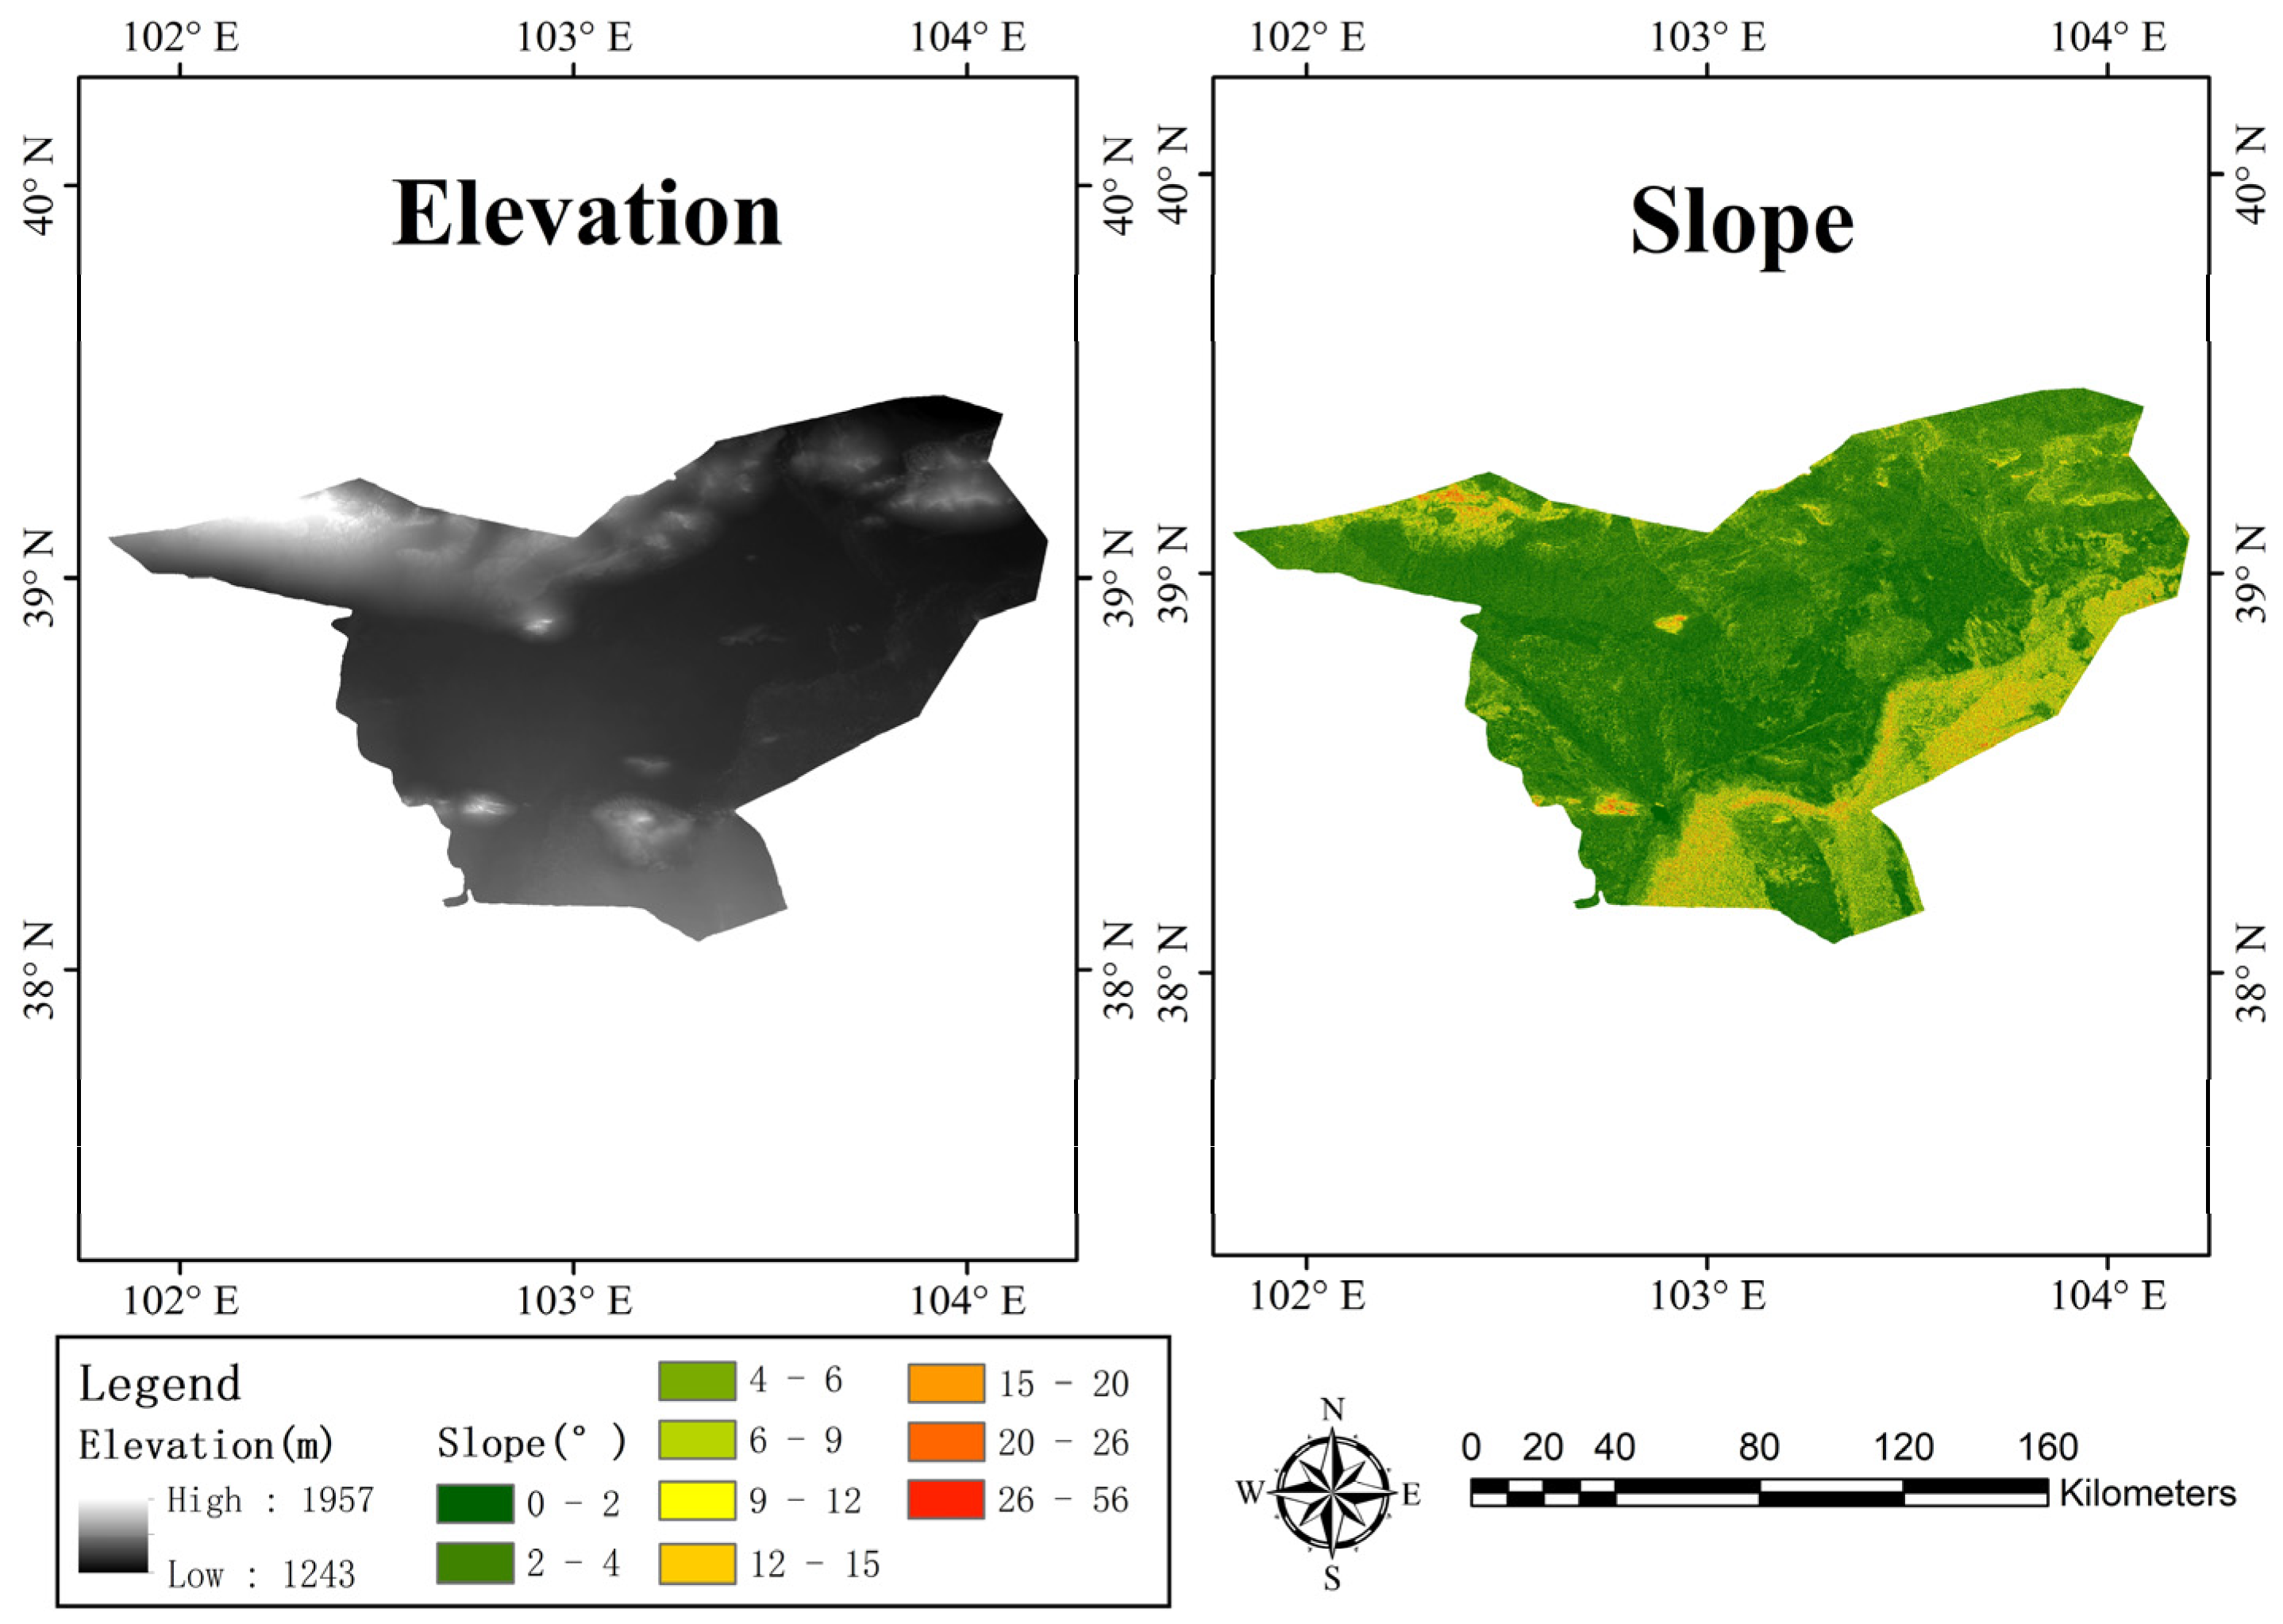
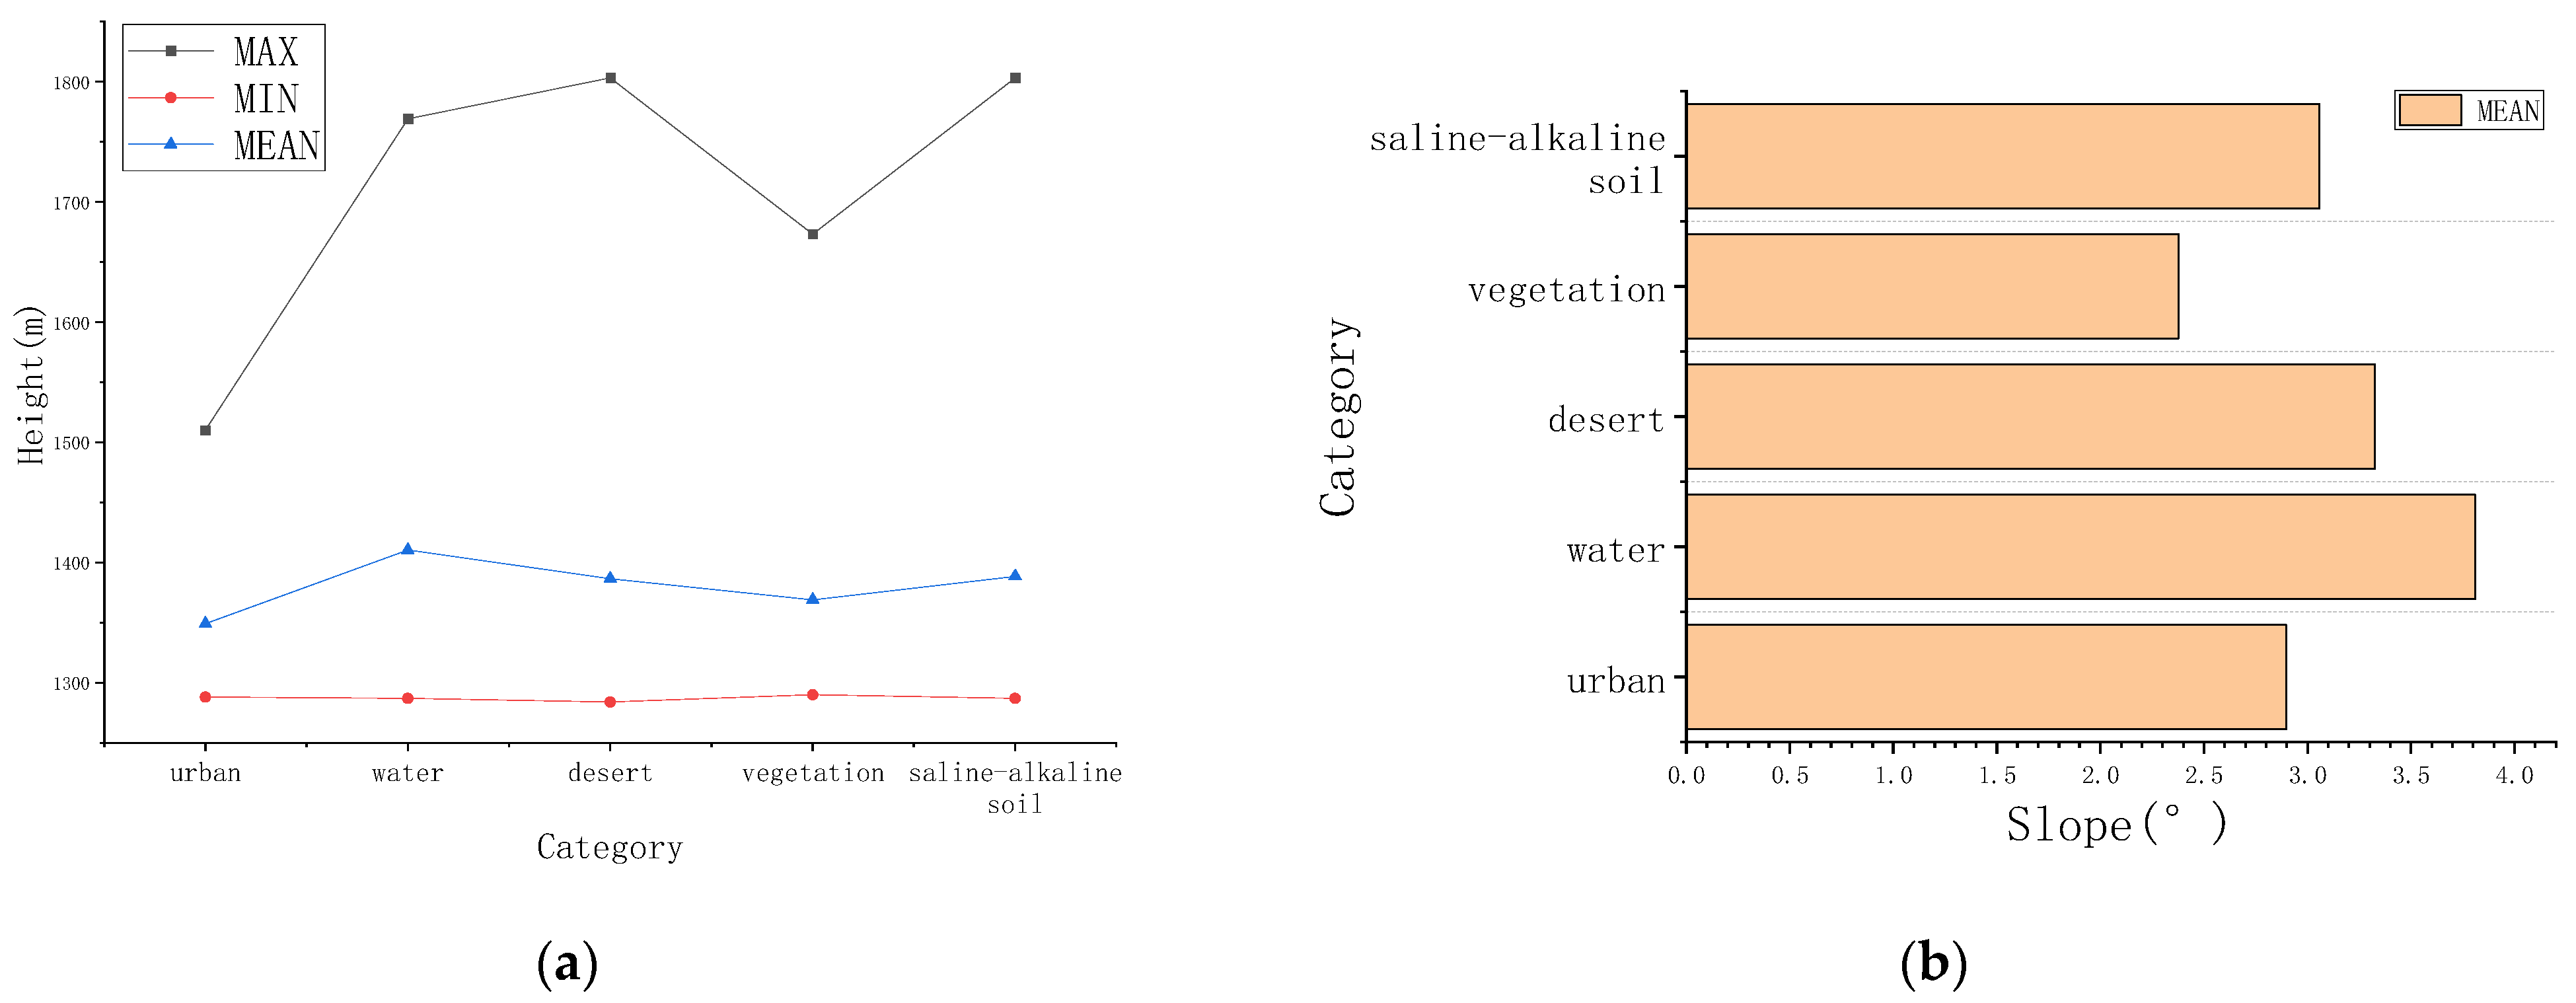
The height and slope from DEM can quantify the topography of the study area, which is also helpful for identifying features and improving the classification accuracy.
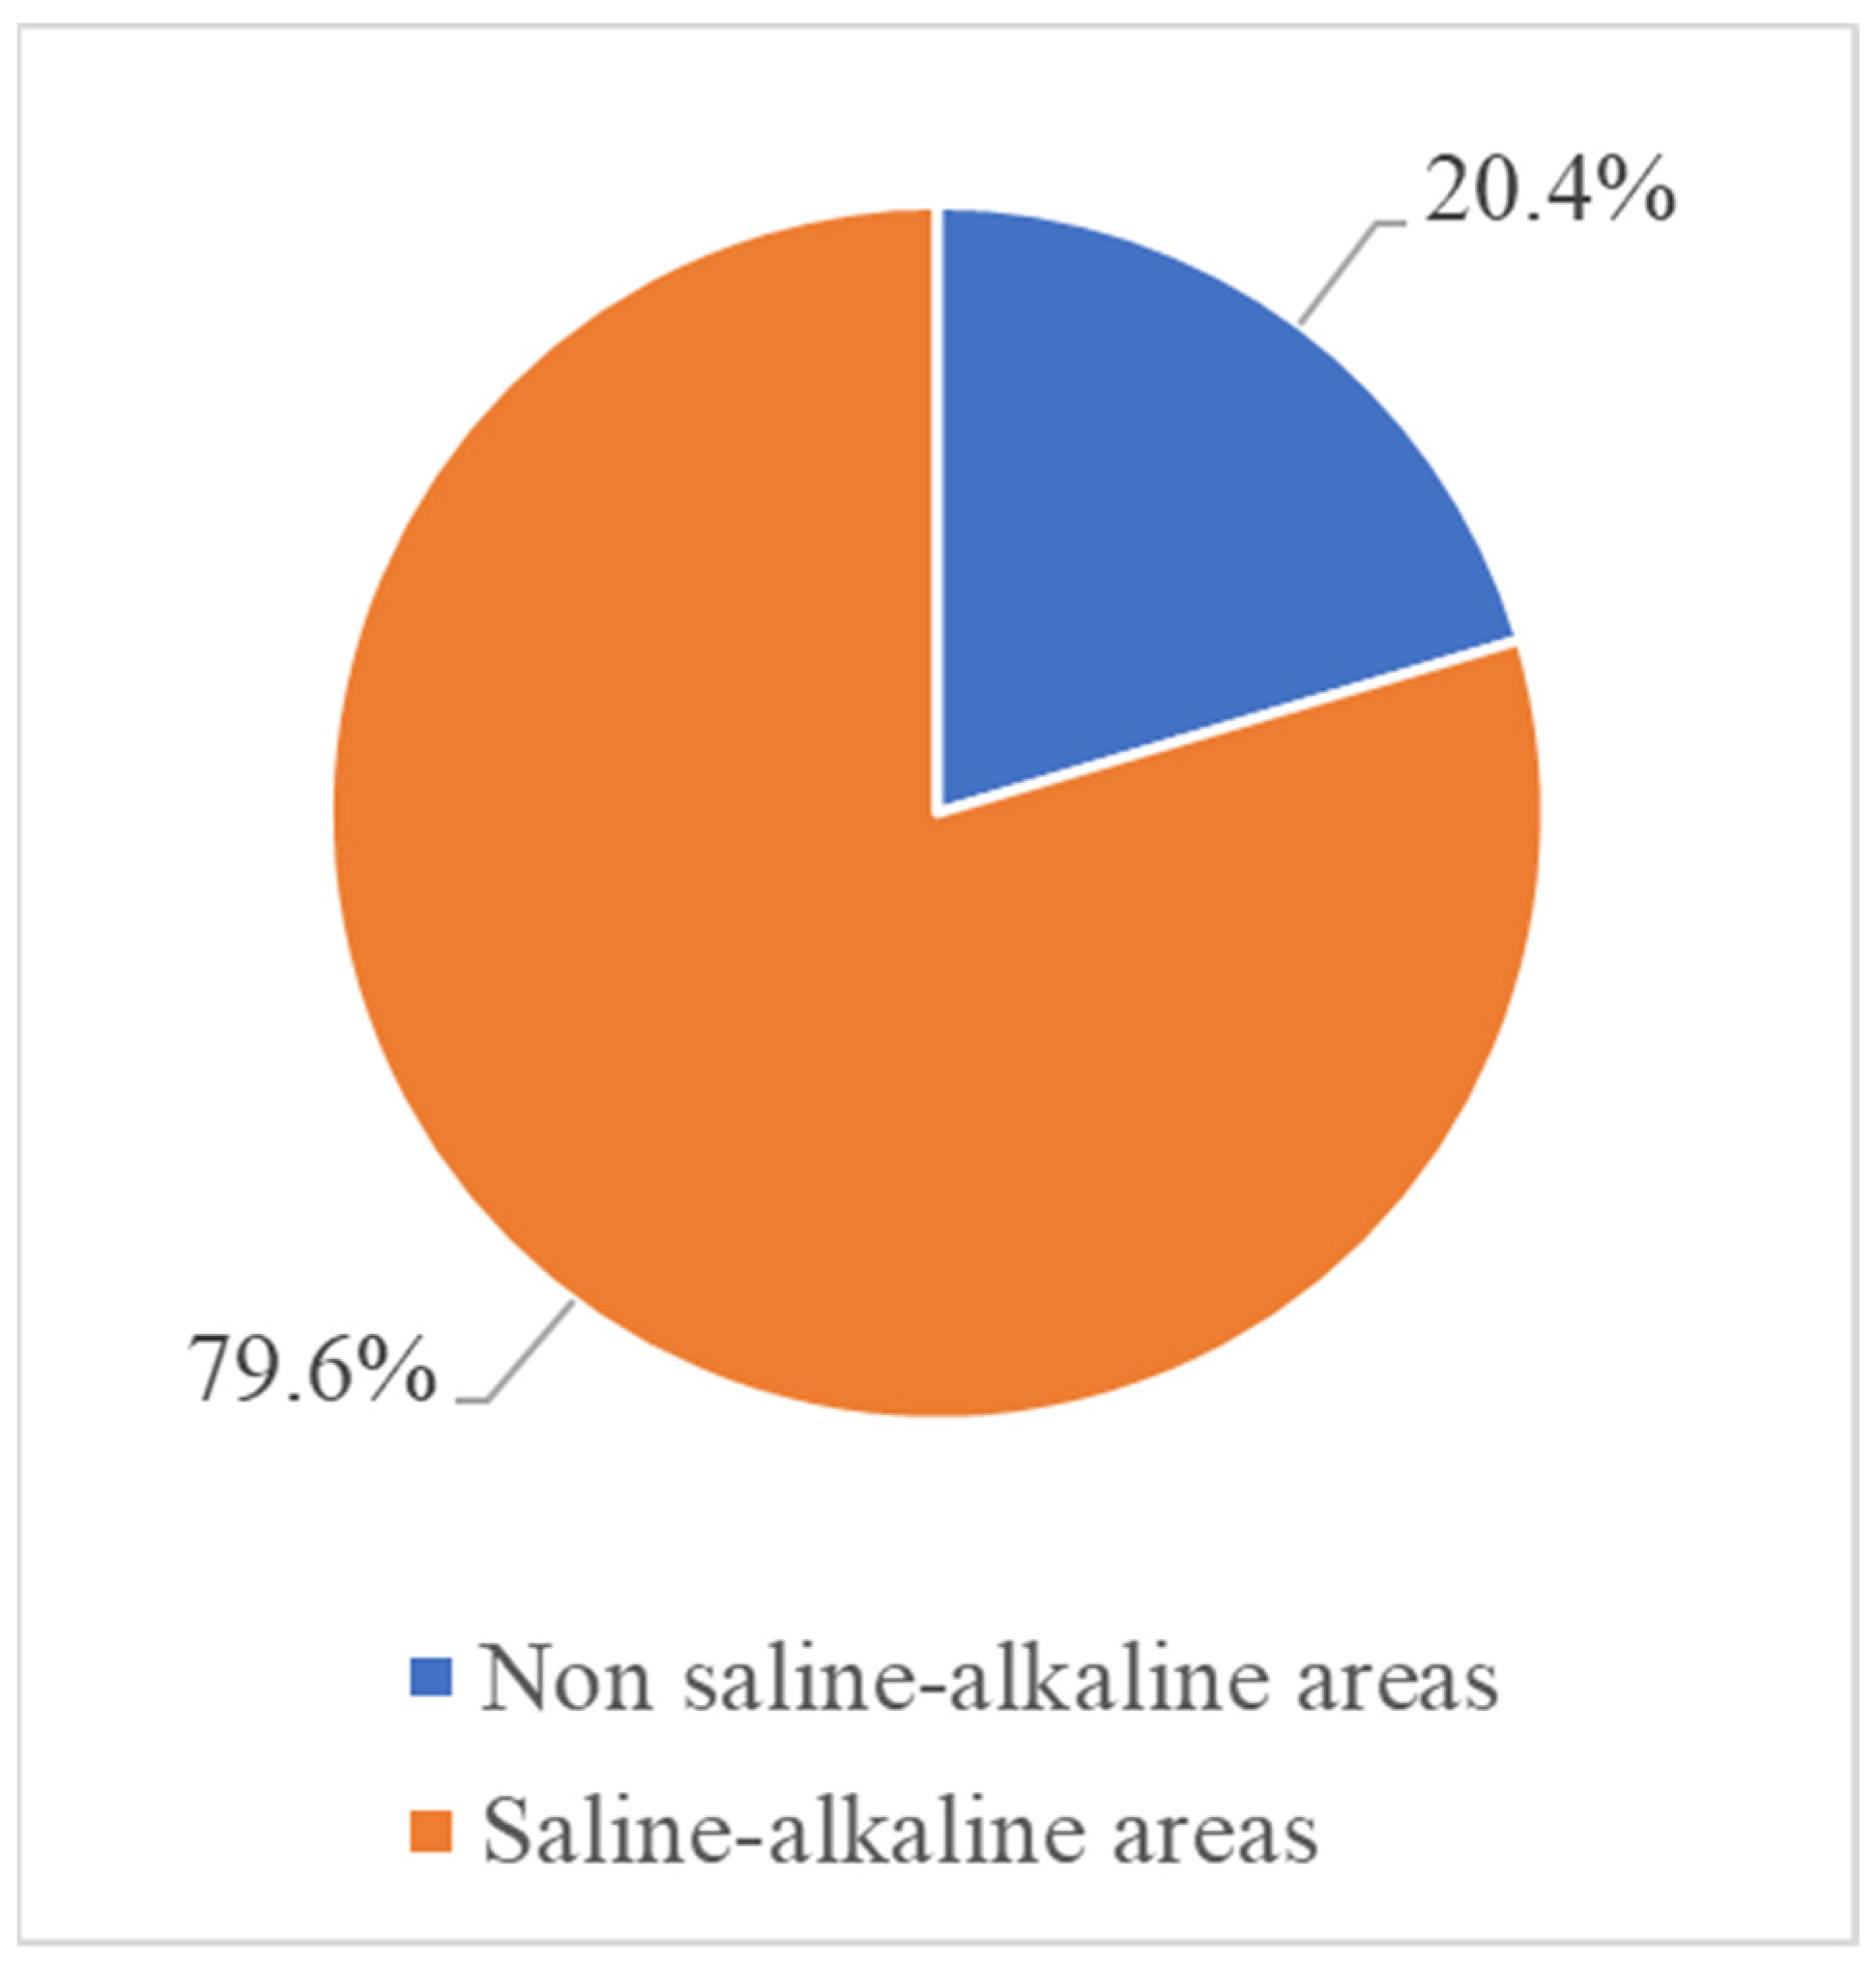
(3) Monitoring and prevention of unused land in the study area are necessary.
With 20.4% of the land considered to be within a saline-alkaline area, soil salinization in Minqin County is a serious concern, especially in the northwestern areas. Therefore, we should strengthen the monitoring and prevention of unused land to prevent further soil salinization.
In summary, based on the previous studies, we proposed a high-precision saline-alkaline area identification method based on multi-source data. The results demonstrate the effectiveness of the method, thus solving the current problem of low accuracy of saline-alkaline area identification, a solution which may be applied to large-scale saline-alkaline area monitoring in the future. Meanwhile, it should be noted that, although the decision tree classification method achieved better classification results in this study, the significance of selected feature variables and grading criteria need to be further studied and improved to make the discriminative rules and classification results more realistic. Therefore, the research on the identification and classification of soil salinization in arid zones needs to be further developed.

Author Contributions

Conceptualization, J.Y. and Q.W.; methodology, J.Y.; validation, J.Y. and D.C.; formal analysis, J.Y. and D.C.; investigation, J.Y. and W.X.; resources, Q.W. and B.Y.; data curation, J.Y. and D.C.; writing—original draft preparation, J.Y.; writing—review and editing, Q.W.; visualization, J.Y. and W.X.; supervision, Q.W.; project administration, Q.W.; funding acquisition, Q.W. All authors have read and agreed to the published version of the manuscript.

Funding

This research was funded in part by the National Key R&D Program of China (grant No. 2021YFB3900503), the National Natural Science Foundation of China (grant number 42071312), the Hainan Hundred Special Project (grant number 31, JTT [2018]), the Innovative Research Program of the Foundation of China (grant number 42071312), the Innovative Research Program of the International Research Center of Big Data for Sustainable Development Goals (grant number CBAS2022IRP03), the National Key R&D Program (grant number CBAS2022IRP03), the National Key R&D Program (grant number 2021YFB3900503), the Special Project of Strategic Leading Science and Technology of the Chinese Academy of Sciences (grant number XDA19090139), the Second Tibetan Plateau Scientific Expedition and Research (STEP) (grant number 2019QZKK0806), and the Hainan Provincial Department of Science and Technology (grant number ZDKJ2019006).

Data Availability Statement

Not applicable.

Acknowledgments

Thanks are due for the GF data provided by CRESDA and AIRCAS.

Conflicts of Interest

The authors declare no conflict of interest.

References

  1. Dennis, L.C. Climate change impacts on soil salinity in agricultural areas. Eur. J. Soil Sci. 2020, 72, 842–862. [Google Scholar]
  2. Ivushkin, K.; Bartholomeus, H.; Bregt, A.K.; Pulatov, A.; Franceschini, M.H.D.; Kramer, H.; Loo, E.N.V.; Roman, V.J.; Finkers, R. UAV based soil salinity assessment of cropland. Geoderma 2018, 338, 501–512. [Google Scholar] [CrossRef]
  3. Wu, D.; Jia, K.; Zhang, X.; Zhang, J.; Abd El Hamid, H.T. Remote Sensing Inversion for Simulation of Soil Salinization Based on Hyperspectral Data and Ground Analysis in Yinchuan, China. Nat. Resour. Res. 2021, 30, 4641–4656. [Google Scholar] [CrossRef]
  4. Bani, A.; Daghari, I.; Hatira, A.; Chaabane, A.; Daghari, H. Sustainable management of a cropping system under salt stress conditions (Korba, Cap-Bon, Tunisia). Environ. Sci. Pollut. Res. Int. 2021, 28, 46469–46476. [Google Scholar] [CrossRef] [PubMed]
  5. Masoud, A.; Koike, K. Arid land salinization detected by remotely-sensed landcover changes: A case study in the Siwa region, NW Egypt. J. Arid Environ. 2006, 66, 151–167. [Google Scholar] [CrossRef]
  6. Arruda, G.P.D.; Demattê, J.A.M.; Chagas, C.D.S.; Fiorio, P.R.; Souza, A.; Fongaro, C.T. Digital soil mapping using reference area and artificial neural networks. Sci. Agric. 2015, 73, 266–273. [Google Scholar] [CrossRef]
  7. Sheng, J.; Ma, L.; Jiang, P.; Li, B.; Huang, F.; Wu, H. Digital soil mapping to enable classification of salt-affected soils in desert agro-ecological zones. Agric. Water Manag. 2010, 97, 1944–1951. [Google Scholar] [CrossRef]
  8. Peng, J.; Biswas, A.; Jiang, Q.; Zhao, R.; Hu, J.; Hu, B.; Shi, Z. Estimating soil salinity from remote sensing and terrain data in southern Xinjiang Province, China. Geoderma 2019, 337, 1309–1319. [Google Scholar] [CrossRef]
  9. Sidike, A.; Zhao, S.; Wen, Y. Estimating soil salinity in Pingluo County of China using QuickBird data and soil reflectance spectra. Int. J. Appl. Earth Obs. Geoinf. 2014, 26, 156–175. [Google Scholar] [CrossRef]
  10. Dong, F.; Tang, Y.; Xing, X.; Liu, Z.; Xing, L. Formation and Evolution of Soil Salinization in Shouguang City Based on PMS and OLI/TM Sensors. Water 2019, 11, 345. [Google Scholar] [CrossRef]
  11. Fathizad, H.; Ardakani, M.A.H.; Sodaiezadeh, H.; Kerry, R.; Taghizadeh-Mehrjardi, R. Investigation of the spatial and temporal variation of soil salinity using random forests in the central desert of Iran. Geoderma 2020, 365, 114233. [Google Scholar] [CrossRef]
  12. Wang, J.; Huang, X.; Zhong, T.; Chen, Z. Review on Sustainable Utilization of Salt-affected Land. Acta Geol. Sin. 2011, 66, 673–684. [Google Scholar]
  13. Liu, L.; Zhang, J.; Zhang, K.; Jia, L.; Dou, L.; Nie, A. Effect of drip irrigation on the rapid growth and soil improvement of saline alkali ponies in coastal saline lands. China Rural Water Conserv. Hydropower 2021, 12, 209–215. [Google Scholar]
  14. Cao, Y.; Bai, Y.; Li, J.; Chen, X.; Shen, G. Study on the spatial distribution characteristics of soil salinity in mudflats in the Yangtze River Delta. Soil Crops 2022, 11, 31–40. [Google Scholar]
  15. Periasamy, S.; Shanmugam, R.S. Multispectral and Microwave Remote Sensing Models to Survey Soil Moisture and Salinity. Land Degrad. Dev. 2017, 28, 1412–1415. [Google Scholar] [CrossRef]
  16. Metternicht, G.I.; Categorical, F. A comparison between crisp and fuzzy class boundary modelling for mapping salt-affected soils using Landsat TM data and a classification based on anion ratios. Ecol. Model. 2003, 168, 371–389. [Google Scholar] [CrossRef]
  17. Mulder, V.L.; Bruin, S.D.; Schaepman, M.E.; Mayr, T.R. The use of remote sensing in soil and terrain mapping: A review. Geoderma 2011, 162, 1–19. [Google Scholar] [CrossRef]
  18. Wang, X.L.; Hou, X.Y. Changes in normalized vegetation index (NDVI) in coastal areas of China from 1982–2014 and its effect on response of extreme climate. Geogr. Stud. 2019, 38, 807–821. [Google Scholar]
  19. Dwivedi, R.S.; Rao, B.R.M. The selection of the best possible Landsat TM band combination for delineating salt-affected soils. Int. J. Remote Sens. 1992, 13, 2051–2058. [Google Scholar] [CrossRef]
  20. Farifteh, J.; Farshad, A.; George, R.J. Assessing salt-affected soils using remote sensing, solute modelling, and geophysics. Geoderma 2006, 130, 191–206. [Google Scholar] [CrossRef]
  21. Bouaziz, M.; Matschullat, J.; Gloaguen, R. Improved remote sensing detection of soil salinity from a semi-arid climate in northeast Brazil. Comptes Rendus Geosci. 2011, 343, 795–803. [Google Scholar] [CrossRef]
  22. Xiao, D.; Wan, L.; Sun, X. Remote sensing retrieval of saline and alkaline land based on reflectance spectroscopy and RV-MELM in Zhenlai County. Opt. Laser Technol. 2021, 139, 106909. [Google Scholar] [CrossRef]
  23. Fu, Y.; Wan, L.; Xiao, D.; Le, B. Remote sensing inversion of saline and alkaline land based on reflectance spectroscopy and D-TELM algorithm in Wuyuan areas. Infrared Phys. Technol. 2020, 109, 103367. [Google Scholar] [CrossRef]
  24. Yang, Z.; Zhao, J.; Wen, Y. Study on vegetation and soil salinity response in Qingtu Lake area. Agric. Res. Arid Areas 2020, 38, 231–237. [Google Scholar]
  25. Ashilenje, D.S.; Amombo, E.; Hirich, A.; Kouisni, L.; Devkota, K.P.; El Mouttaqi, A.; Nilahyane, A. Crop Species Mechanisms and Ecosystem Services for Sustainable Forage Cropping Systems in Salt-Affected Arid Regions. Front. Plant Sci. 2022, 13, 1518. [Google Scholar] [CrossRef] [PubMed]
  26. Patel, P.R.; Kajal, S.S.; Patel, V.R.; Patel, V.J.; Khristi, S.M. Impact of salt stress on nutrient uptake and growth of cowpea. Braz. J. Plant Physiol. 2010, 22, 43–48. [Google Scholar] [CrossRef]
  27. Dehaan, R.L.; Taylor, G.R. Field-derived spectra of salinized soils and vegetation as indicators of irrigation induced soil salinization. Remote Sens. Environ. 2002, 80, 406–417. [Google Scholar] [CrossRef]
  28. Wang, F.; Ding, J.; Wu, M. Remote sensing monitoring models of soil salinization based on NDVI-SI feature space. Trans. Chin. Soc. Agric. Eng. 2010, 26, 168–173. [Google Scholar]
  29. Yang, J.; Zhao, J.; Zhu, G.; Wang, Y.; Ma, X.; Wang, J.; Guo, H.; Zhang, Y. Soil salinization in the oasis areas of downstream inland rivers—Case Study: Minqin oasis. Quat. Int. 2020, 537, 69–78. [Google Scholar] [CrossRef]
  30. Niu, Z.Y.; Ding, J.L. Soil salinization information extraction method based on gf-1 image. Arid Land Geogr. 2016, 39, 171–181. [Google Scholar]
  31. Shan, J.; Yue, C. Research on decision tree classification method based on spectral features—A case study of northeastern Kunming city. J. Northwest For. Acad. 2010, 25, 222–226. [Google Scholar]
  32. Yang, X. Overview of performance metrics of classification learning algorithms. Comput. Sci. 2021, 48, 209–219. [Google Scholar]
  33. Barranco, C.I.; Carrillo, G.R.M. Techniques to Deal with Off-Diagonal Elements in Confusion Matrices. Mathematics 2021, 9, 3233. [Google Scholar] [CrossRef]
  34. Sun, L.Q.; Zhang, F.H.; Yang, S.W. Historical change and evolution of sandy land in Minqin County (during 1991–2015). Mapp. Spat. Geogr. Inf. 2018, 41, 106–109. [Google Scholar]
  35. Zhang, Z.; Li, Z.; Li, Q.; Hao, R. Analysis of dynamic changes of vegetation cover in Minqin Oasis from 2013-2015 based on GF-1 remote sensing images. J. Southwest For. Univ. (Nat. Sci.) 2017, 37, 163–170. [Google Scholar]
  36. Li, W.; Lv, S.; Dong, Z.; Fan, G.; Chen, L. Temporal and spatial variation characteristics of precipitation around Badain Jardan Desert. J. Desert Res. 2015, 35, 94–105. [Google Scholar]
  37. Lu, H.; Jie, Y.; Zhang, W.; Wei, J. Analysis of spatial and temporal changes of oasis in Minqin County from 1986–2015. Arid Zone Res. 2017, 34, 1410–1417. [Google Scholar]
  38. Qian, T.; Tsunekawa, A.; Masunaga, T.; Wang,, T. Analysis of the Spatial Variation of Soil Salinity and Its Causal Factors in China’s Minqin Oasis. Math. Probl. Eng. 2017, 2017, 1–9. [Google Scholar]
  39. Chen, L.; Li, C.; Feng, Q.; Wei, Y.; Zhao, Y.; Zhu, M.; Ravinesh, C.D. Direct and indirect impacts of ionic components of saline water on irrigated soil chemical and microbial processes. Catena 2019, 172, 581–589. [Google Scholar] [CrossRef]
  40. Yang, Y.; Tian, Q.; Jim, Y.; Tao, B.; Xu, K. Effects of spatial resolution and texture features on multispectral remote sensing classification. J. Geoinf. Sci. 2018, 20, 99–107. [Google Scholar]
  41. Verma, H.; Vidyarthi, A.; Chitre, A.V.; Wanjale, K.H.; Anusha, M.; Majrashi, A.; Hinga, S.K. Local Binary Patterns Based on Neighbor Center Difference Image for Color Texture Classification with Machine Learning Techniques. Wirel. Commun. Mob. Comput. 2022, 2022. [Google Scholar] [CrossRef]
  42. Wang, X.; Ren, T.; Dong, P. Research on climate change trend prediction technology in Minqin County. Gansu Sci. Technol. Vert. 2017, 46, 29–31+22. [Google Scholar]
  43. Ma, J.; Chen, J.; Yang, X.; Zhang, X. The impact of land use change on social resilience of rural communities in arid zones: The case of Minqin Oasis. Resour. Sci. 2021, 43, 1615–1627. [Google Scholar]
  44. Gansu Water Resources and hydropower Survey and Design Institute. Key Governance Planning of Shiyang River Basin. 2007. Available online: http://www.ndrc.gov.cn/fggz/fzzlgh/gjjzxgh/200806/P020191104623858217901.pdf (accessed on 27 December 2022).
  45. Yao, A.; Che, T.; Jiang, L.; Feng, Y. Remote sensing classification of desertification in minqin county of gansu area unused study. J. Res. For. Sci. 2014, 27, 195–200. [Google Scholar]
  46. Chen, X.; Gao, B.; Wang, X.; Zhang, C. Status and dynamics of land desertification in Minqin County, Gansu Province. J. Desert Res. 2014, 34, 970–974. [Google Scholar]
  47. Ma, J.; Shan, L.; Sun, X.; Zhao, X.; Yan, H.; Zhang, Y.; Hu, S.; Zeng, X. Minqin county even the analysis of characteristics of the ancient city of national nature reserve of land desertification. J. Gansu Agric. Univ. 2019, 54, 99–107. [Google Scholar]
Figure 1. Technical flowchart (GLCM: grey-level co-occurrence matrix).
Remotesensing 15 02556 g001
Figure 2. Location map of the study area.
Remotesensing 15 02556 g002
Figure 3. Map of Minqin.
Remotesensing 15 02556 g003
Figure 4. GF6 pre-processing flow chart.
Remotesensing 15 02556 g004
Figure 5. GF2 pre-processing process.
Remotesensing 15 02556 g005
Figure 6. Comparison of image fusion: (a) image of PAN; (b) image of MSS; and (c) sharpened MSS.
Remotesensing 15 02556 g006
Figure 7. DEM with slope.
Remotesensing 15 02556 g007
Figure 8. Spectra of features in the study area. (Bands are arranged by increasing wavelength).
Remotesensing 15 02556 g008
Figure 9. Textures.
Figure 9. Textures.
Remotesensing 15 02556 g009
Figure 10. Elevation characteristics: (a) height of features; and (b) slope of features.
Remotesensing 15 02556 g010
Figure 11. Saline-alkaline areas: map and sample points.
Remotesensing 15 02556 g011
Figure 12. Field survey: (a) saline-alkaline areas; (b) handheld GPS recording; and (c) sampling.
Remotesensing 15 02556 g012
Figure 13. Percentage of saline-alkaline area in Minqin County.
Remotesensing 15 02556 g013
Figure 14. Comparison of the identification results of different indices.
Remotesensing 15 02556 g014
Figure 15. Saline-alkaline areas identified in the Minqin oasis in 2010, 2015, and 2020.
Remotesensing 15 02556 g015
Figure 16. Change of saline-alkaline areas in the Minqin oasis.
Remotesensing 15 02556 g016
Figure 17. Climate in Minqin county: (a) curve of annual average temperature and precipitation; and (b) annual average monthly potential evaporation.
Remotesensing 15 02556 g017
Figure 18. Changes of surface water inflow in Minqin County from 2005 to 2012.
Remotesensing 15 02556 g018
Table 1. Example of confusion matrix.
Classified DataTruth Data
Class 1Class 2Class nTotal
Class 1X11X12 X1nCd1 = j = 1 n X 1 j
Class 2X21X22 X2nCd2 = j = 1 n X 2 j
Class nXn1Xn2 XnnCdn = j = 1 n X n j
TotalTd1 = i = 1 n X i 1 Td2 = i = 1 n X i 2 Tdn = i = 1 n X i n All = i = 1 , j = 1 n X i j
Various land type: Class 1, Class 2, …, Class n.
Table 2. Data sources for identification.
DataDateSpatial ResolutionParameter
GF-6/WFV2022.6.1316 mSpectra
GF-2/PMS2022.7.131 m(PAN)/4 m(MSS)Texture
SRTM_DEM 30 mElevation
Slope
Vector boundary2020 Zone
Table 3. Parameters of the FLAASH atmospheric correction module.
Atmospheric ModelAerosol ModelAerosol RetrievalInitial VisibilitySpectral Response Function
Mid-Latitude SummerRuralNone40 kmgf6_wfv.sli
Table 4. GF-6/WFV band.
BandWavelength/μmNameSpatial
Resolution/m
Scan Width/km
B010.45~0.52Blue16800
B020.52~0.59Green
B030.63~0.69Red
B040.77~0.89NIR
B050.69~0.73Red edge1
B060.73~0.77Red edge2
B070.40~0.45Violet
B080.59~0.63Yellow
Table 5. Confusion matrix of saline-alkaline area identification.
Classified DataChecked Data
Non-Saline-Alkaline AreaSaline-Alkaline AreaTotalUA
Non-saline-alkaline area6446894.12%
Saline-alkaline area13627582.67%
Total7766143
PA83.12%93.94%
OA88.11%
Kappa0.76
Table 6. Data sources for analysis.
DateSatelliteSensorNumber
2010.7.25Landsat 8OIL131/33
2015.7.22
2020.8.2
Table 7. Comparison of studies on the identification of saline-alkaline areas in Minqin County.
Order NumberContentsDateArticles
1Classification of unused land2016Yao, A. et al., 2014 [45]
2Dynamic monitoring of land desertification2004–2009Chen, X. et al., 2014 [46]
3Analysis of land desertification characteristics2012–2013Ma, J. et al., 2019 [47]
Disclaimer/Publisher’s Note: The statements, opinions and data contained in all publications are solely those of the individual author(s) and contributor(s) and not of MDPI and/or the editor(s). MDPI and/or the editor(s) disclaim responsibility for any injury to people or property resulting from any ideas, methods, instructions or products referred to in the content.

