
Regional Variability of Raindrop Size Distribution from a Network of Disdrometers over Complex Terrain in Southern China
Abstract
:1. Introduction
2. Study Area, Data and Methodology
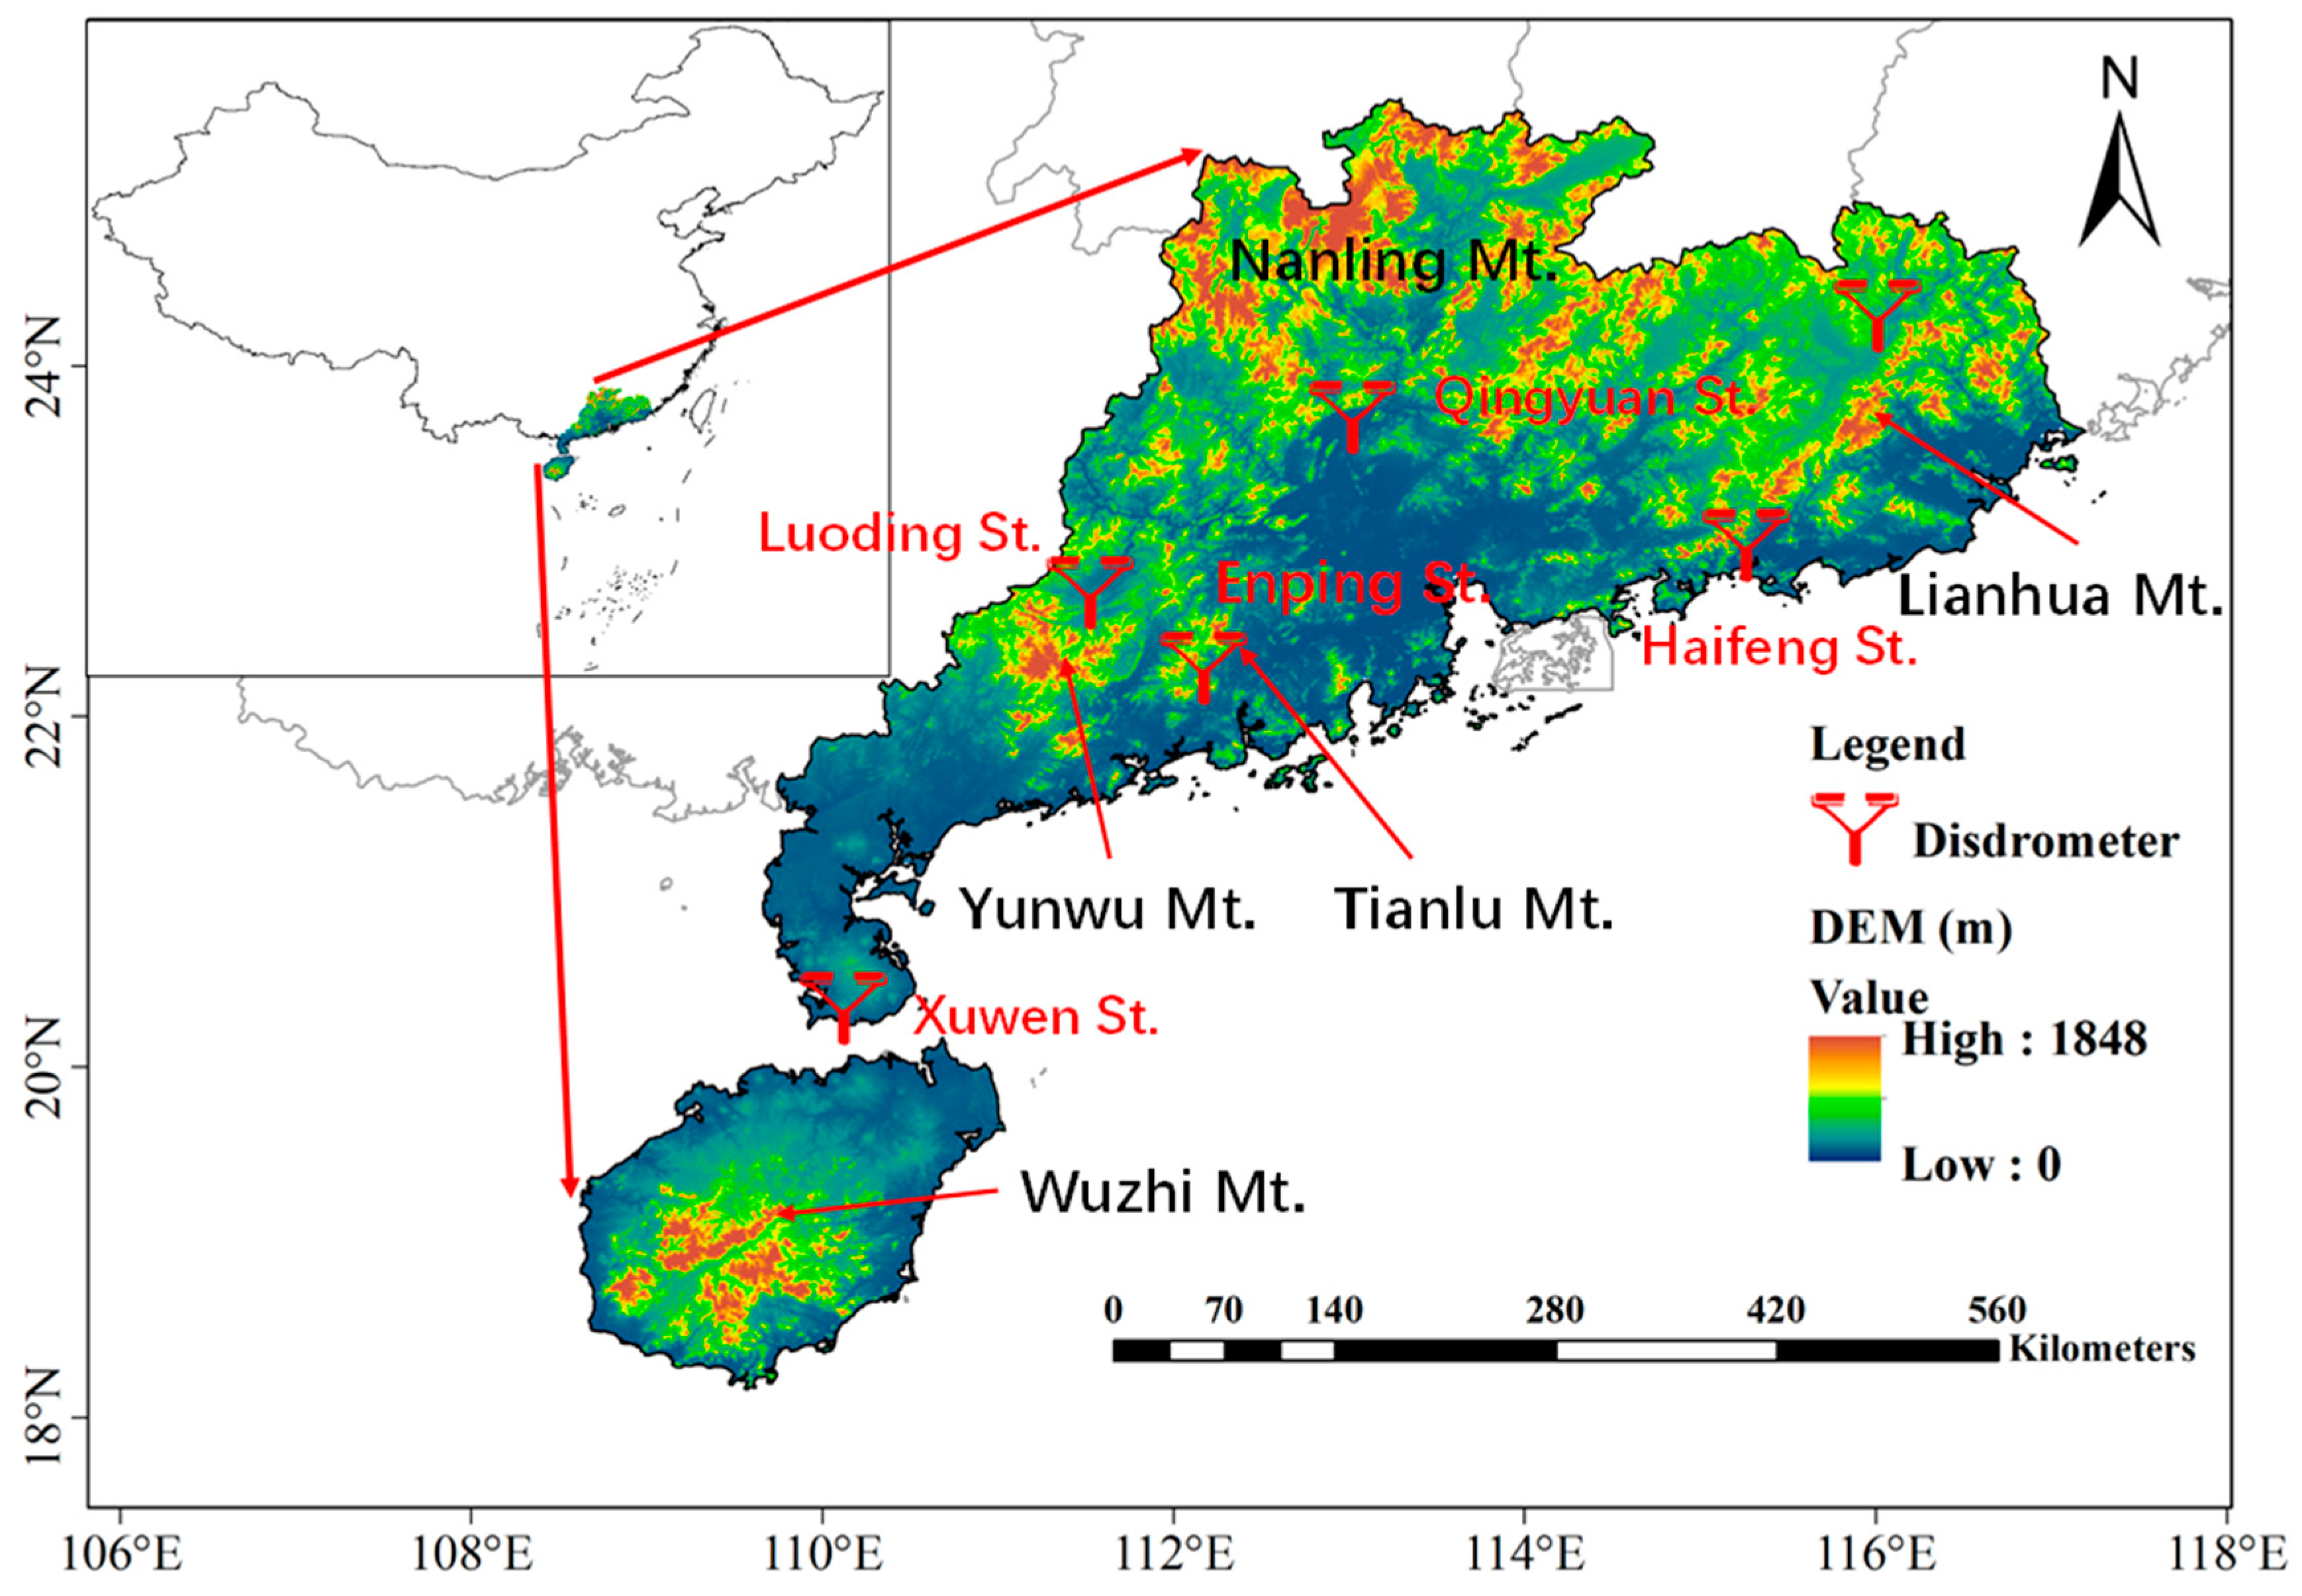
2.1. Study Area
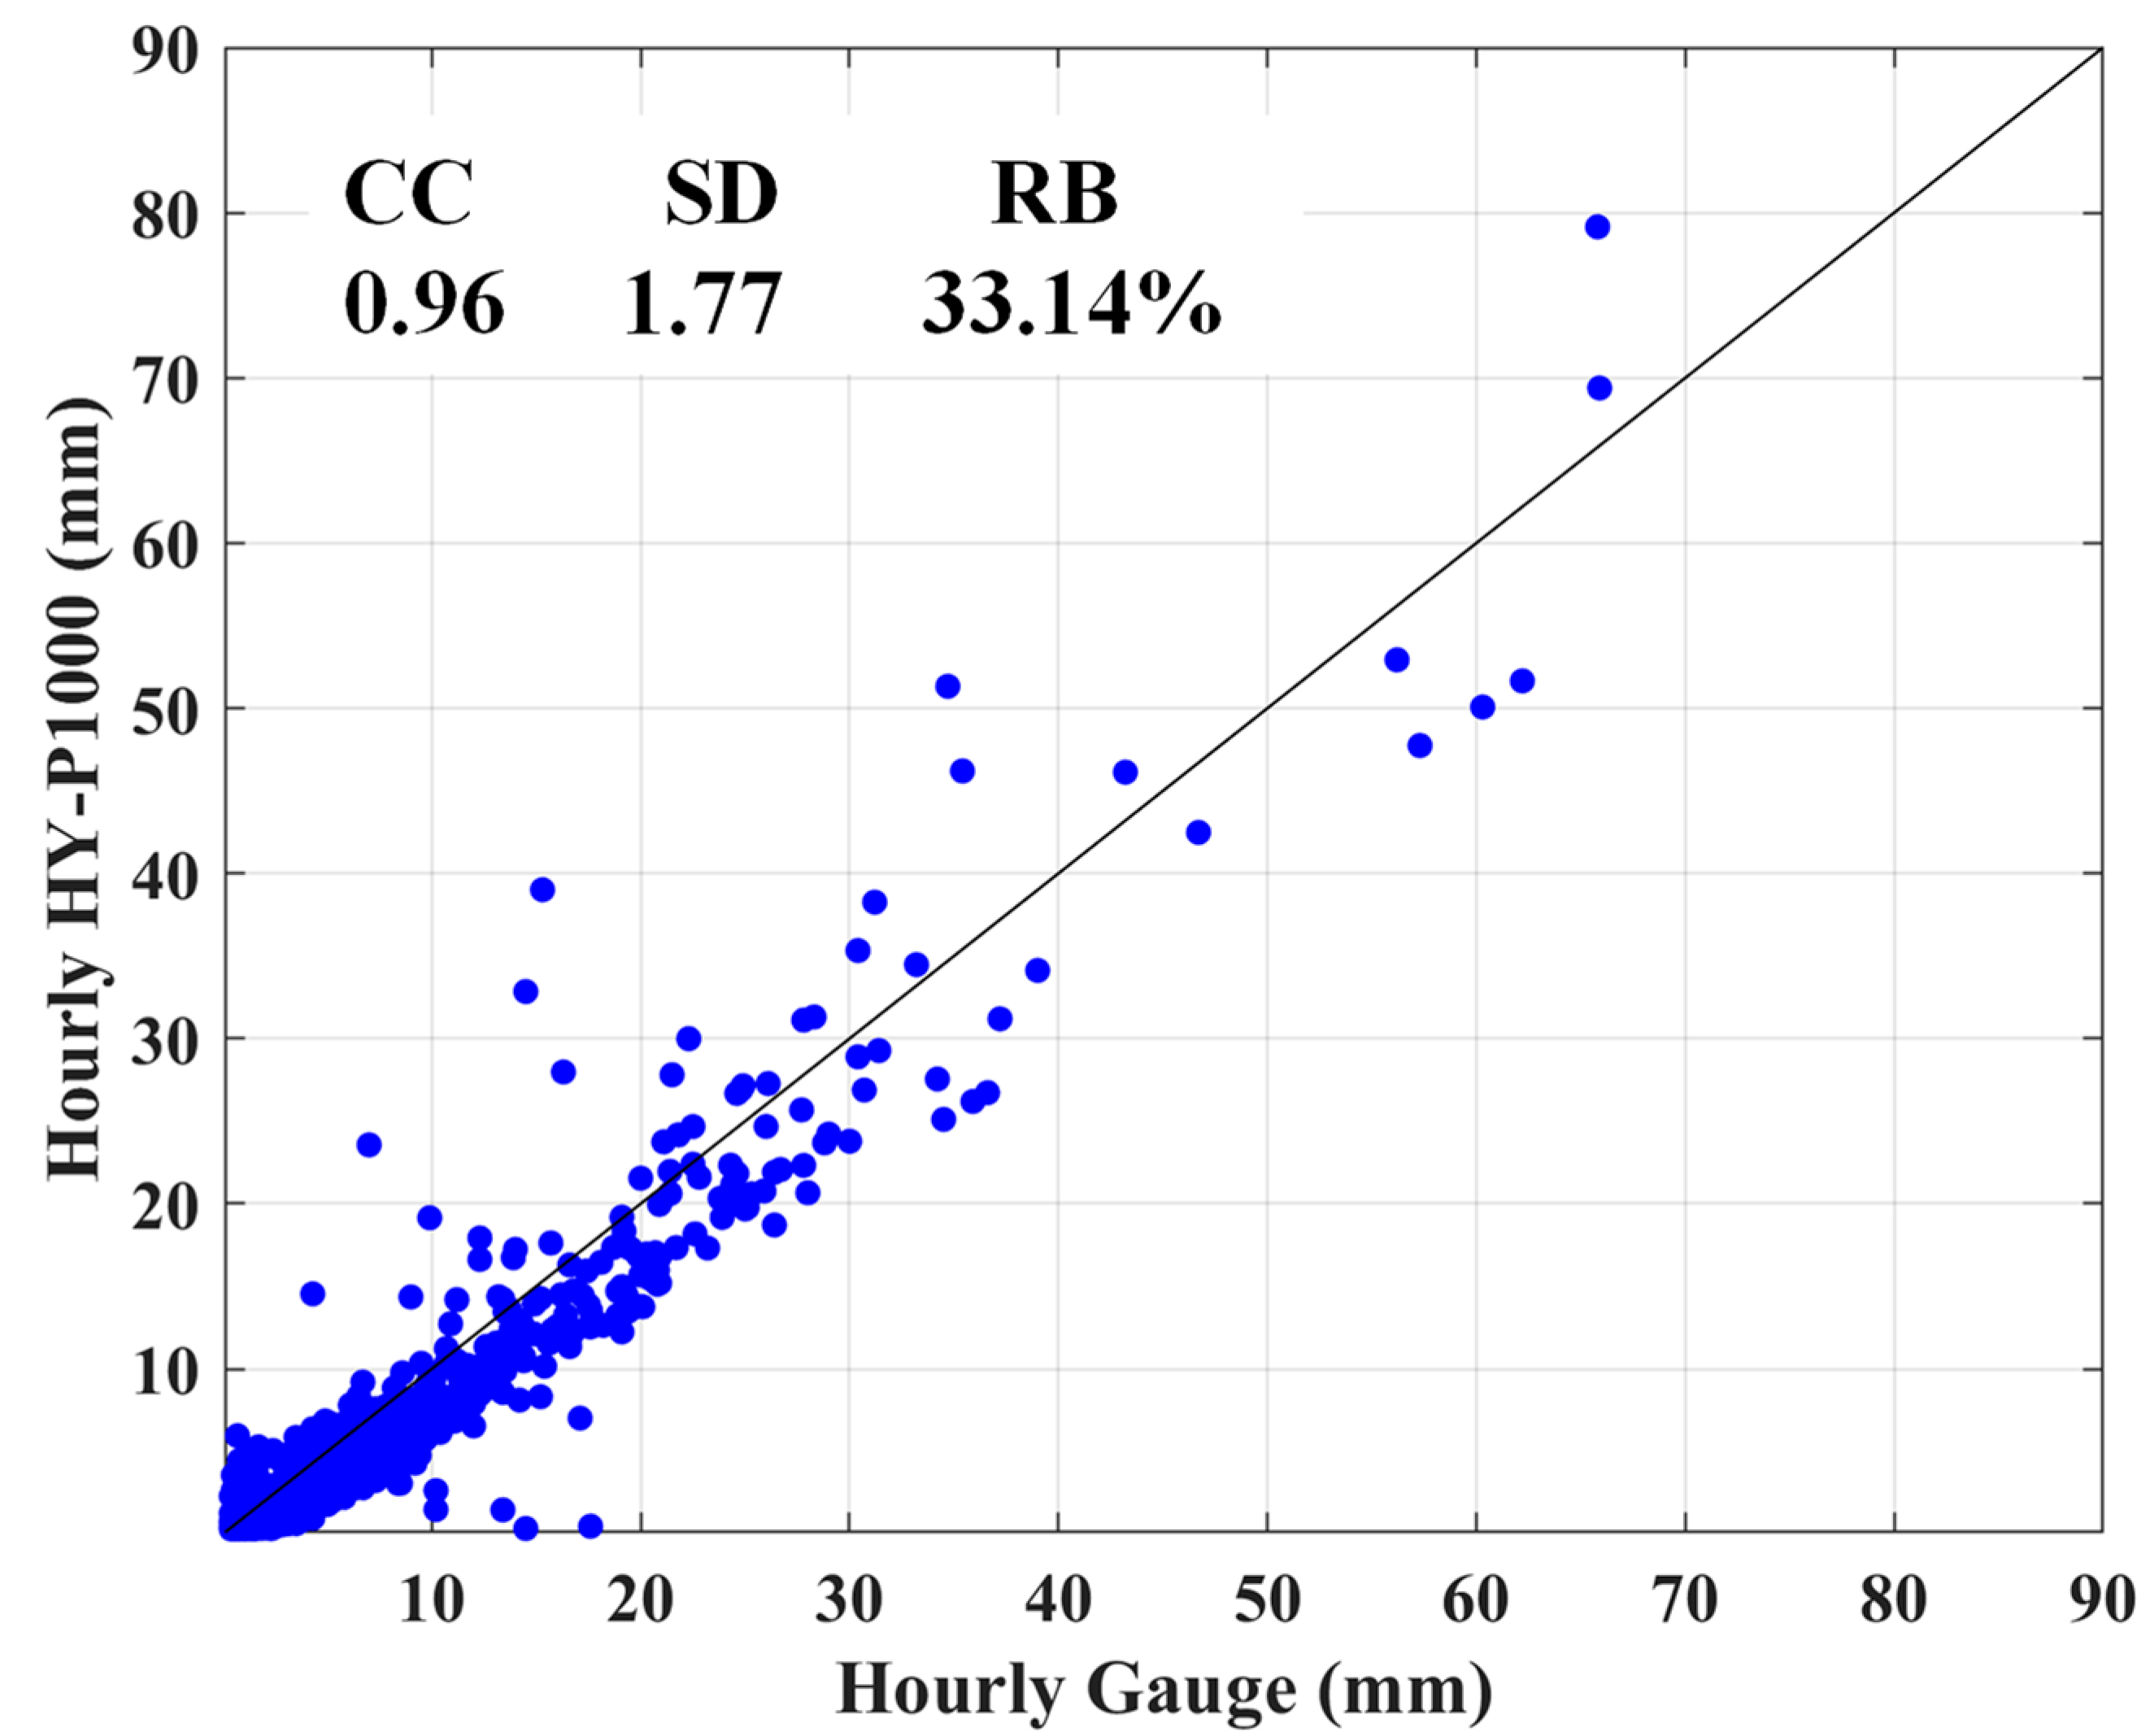
2.2. Data and Methodology
2.3. Separation of Rainfall
3. Results
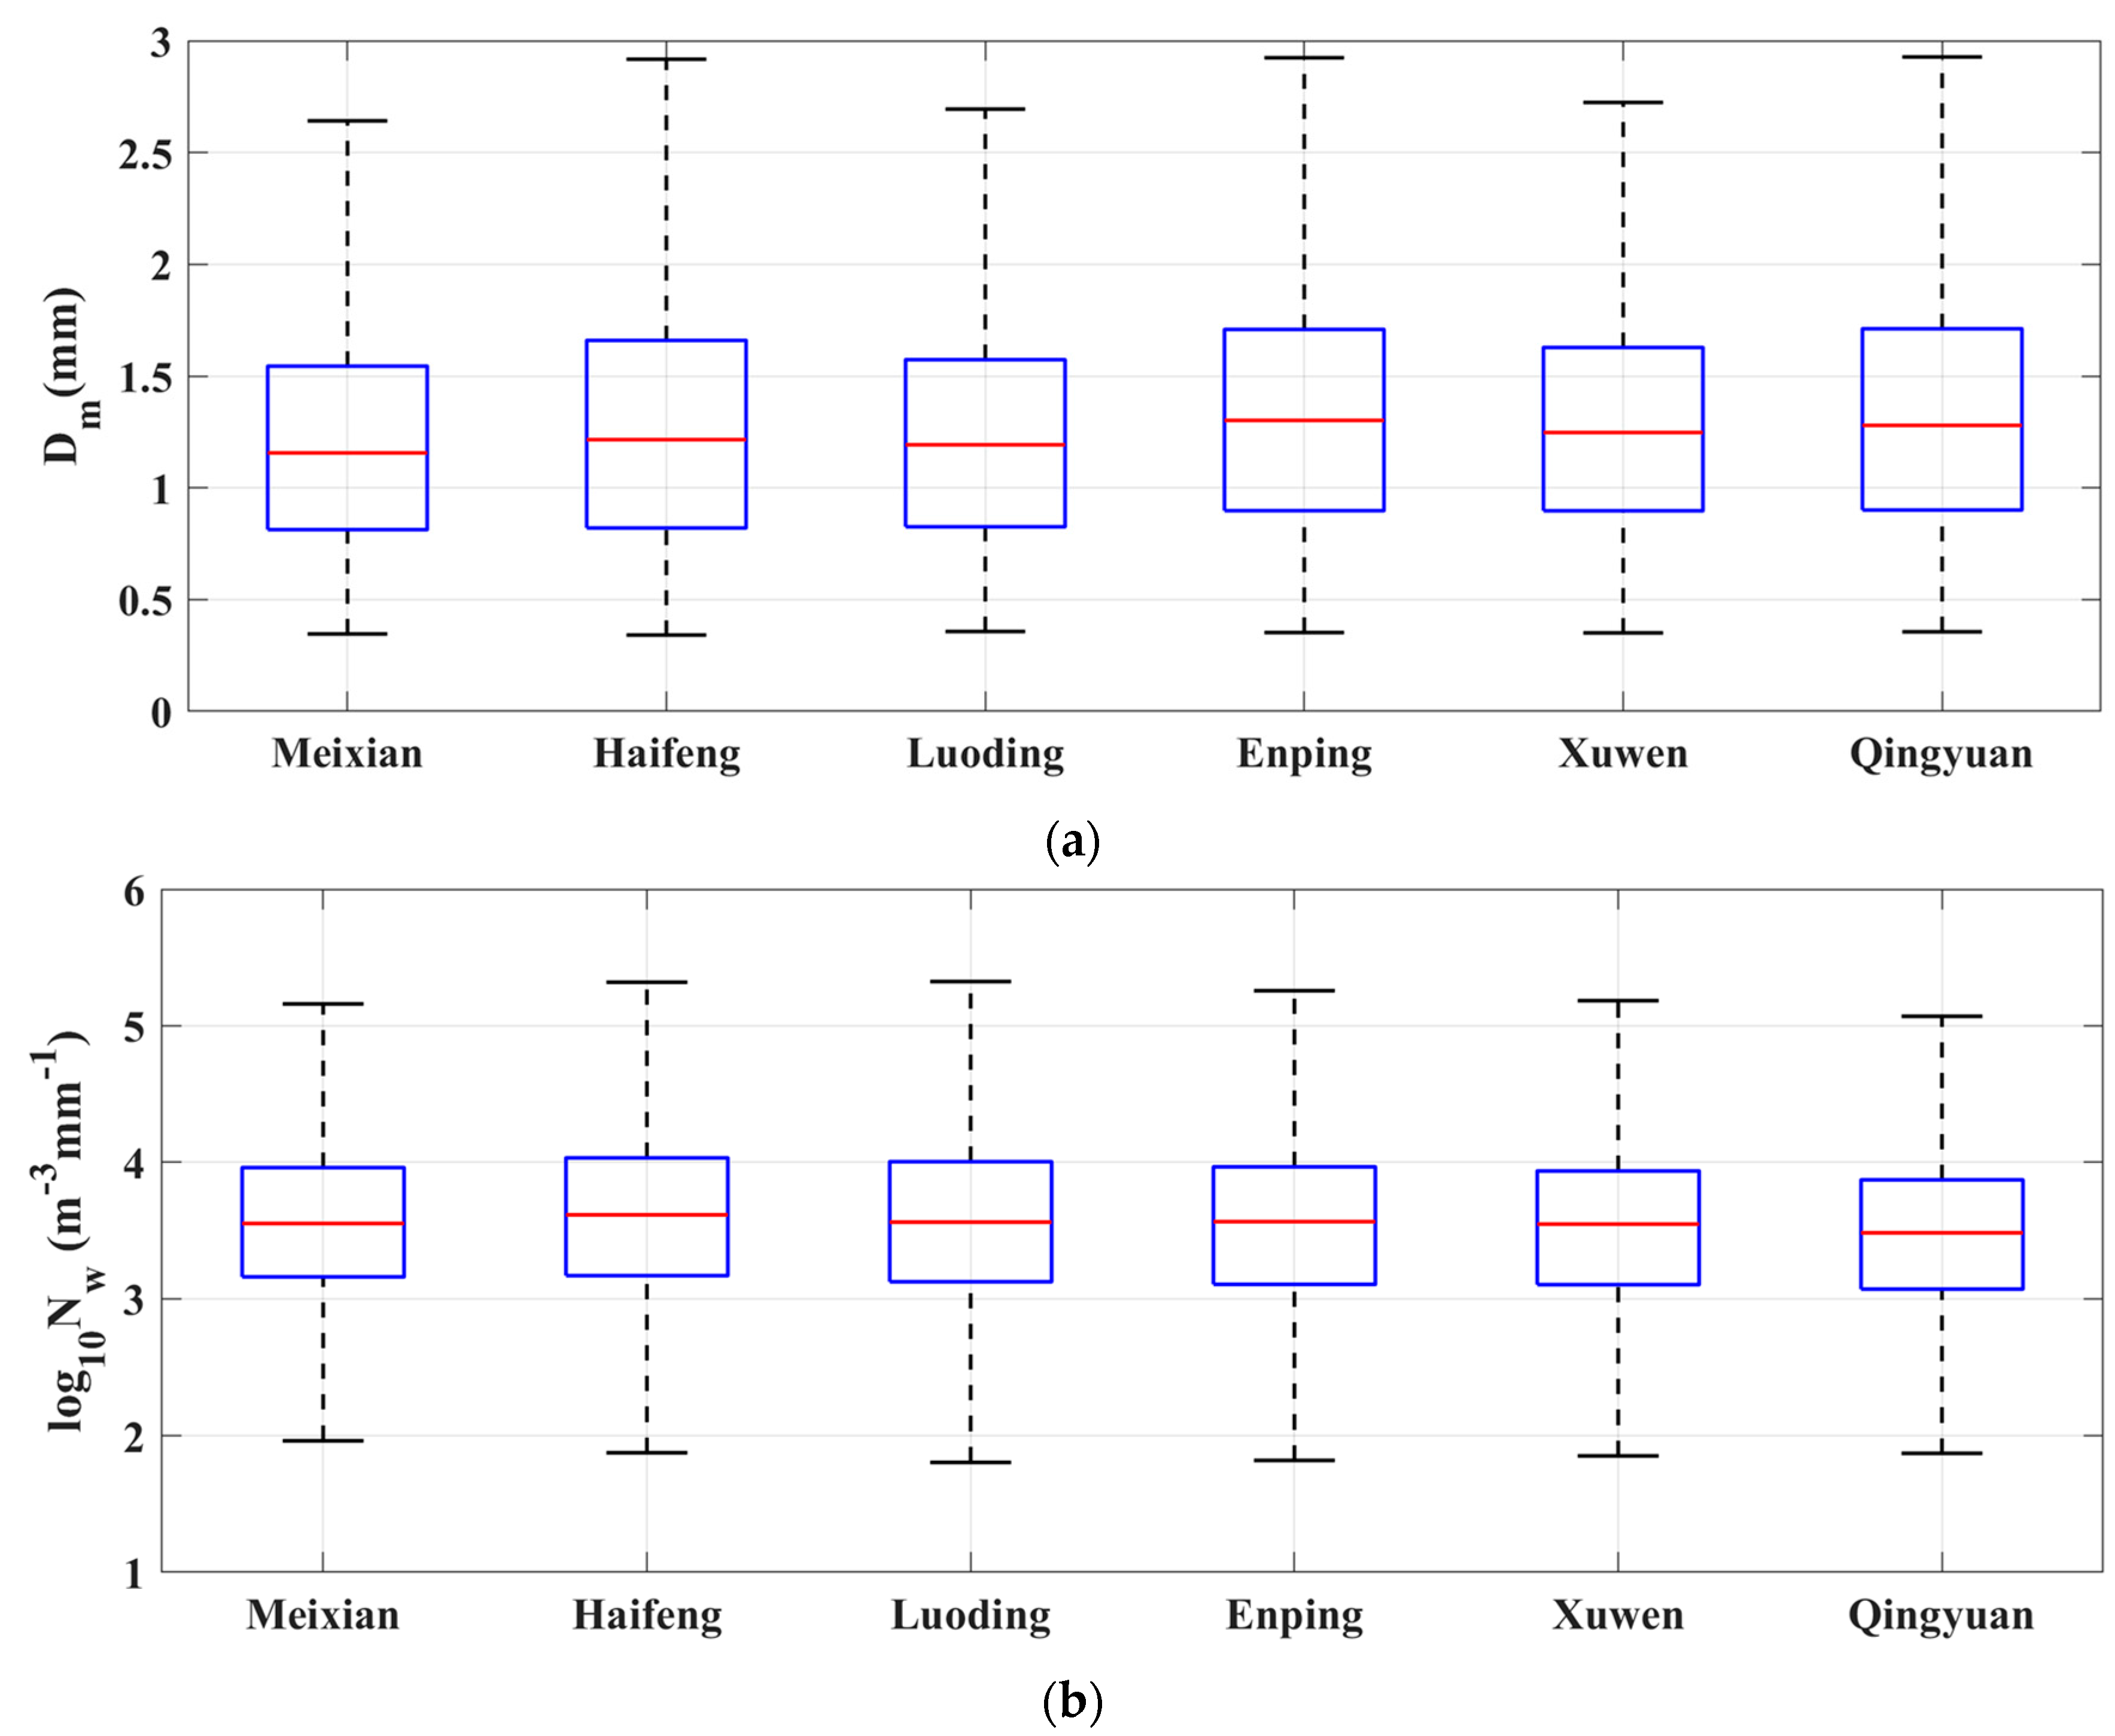
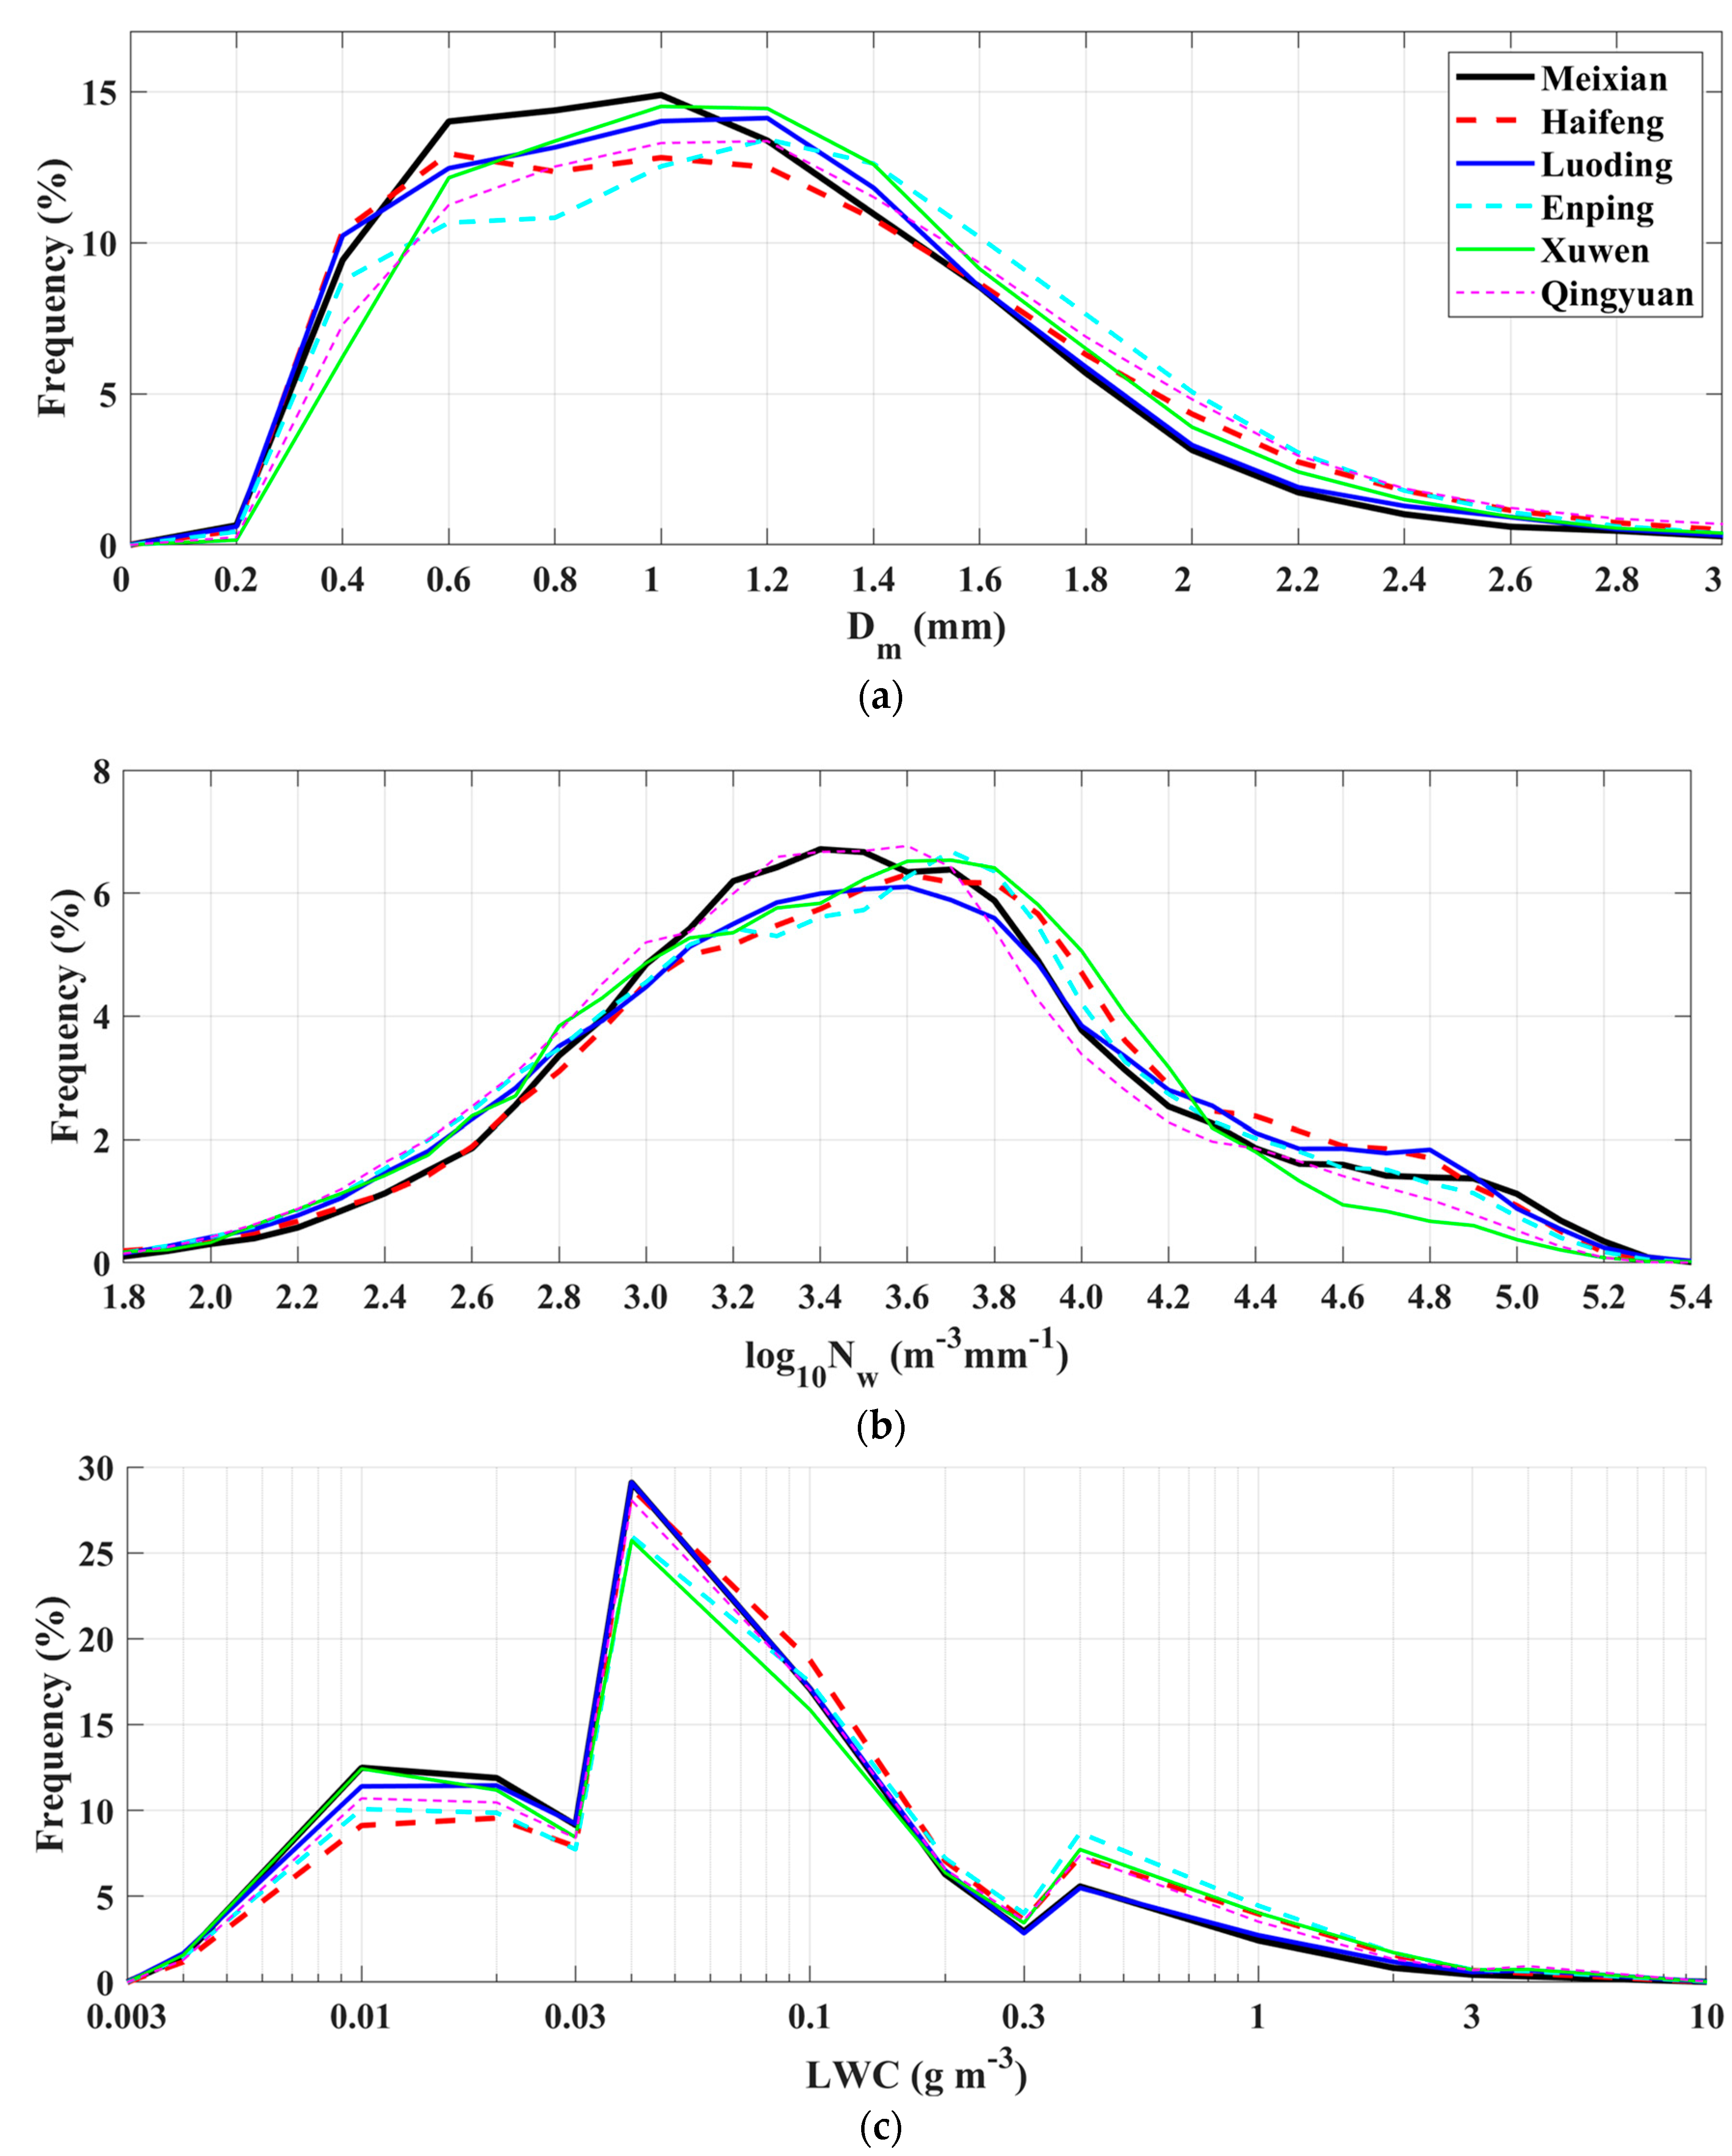
3.1. DSD Parameter Distributions
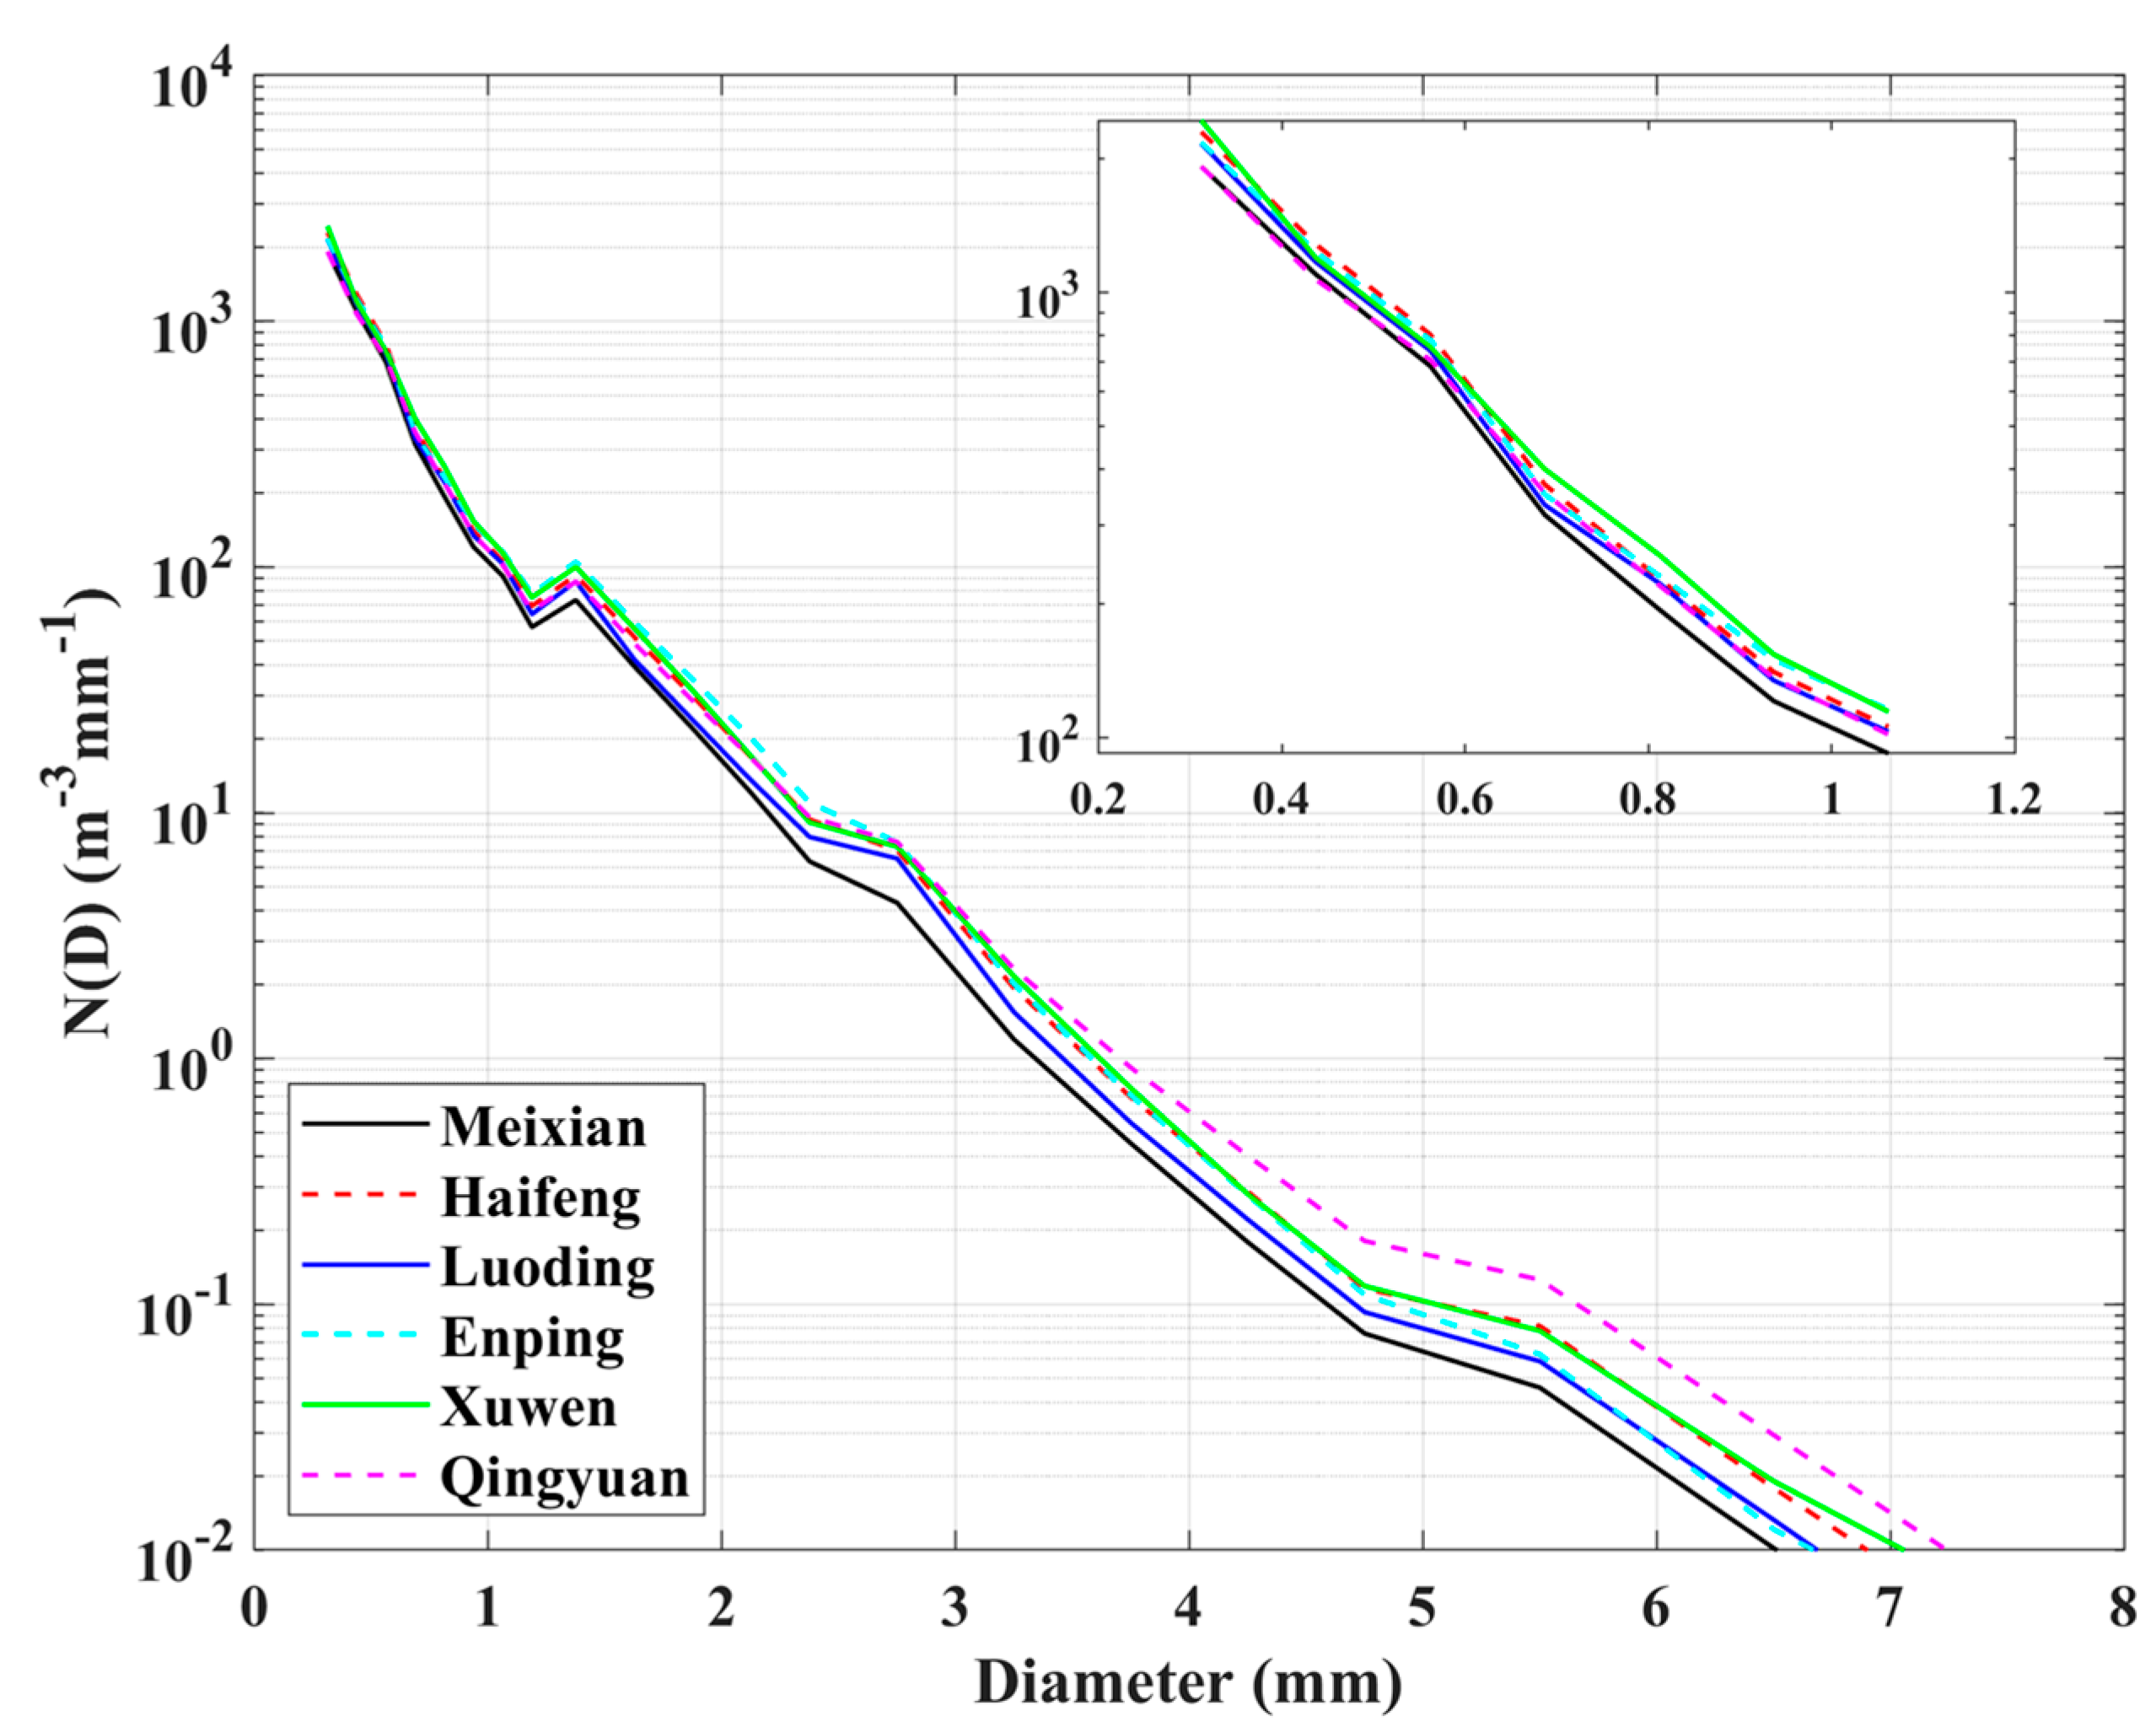
3.2. Averaged Drop Size Distributions
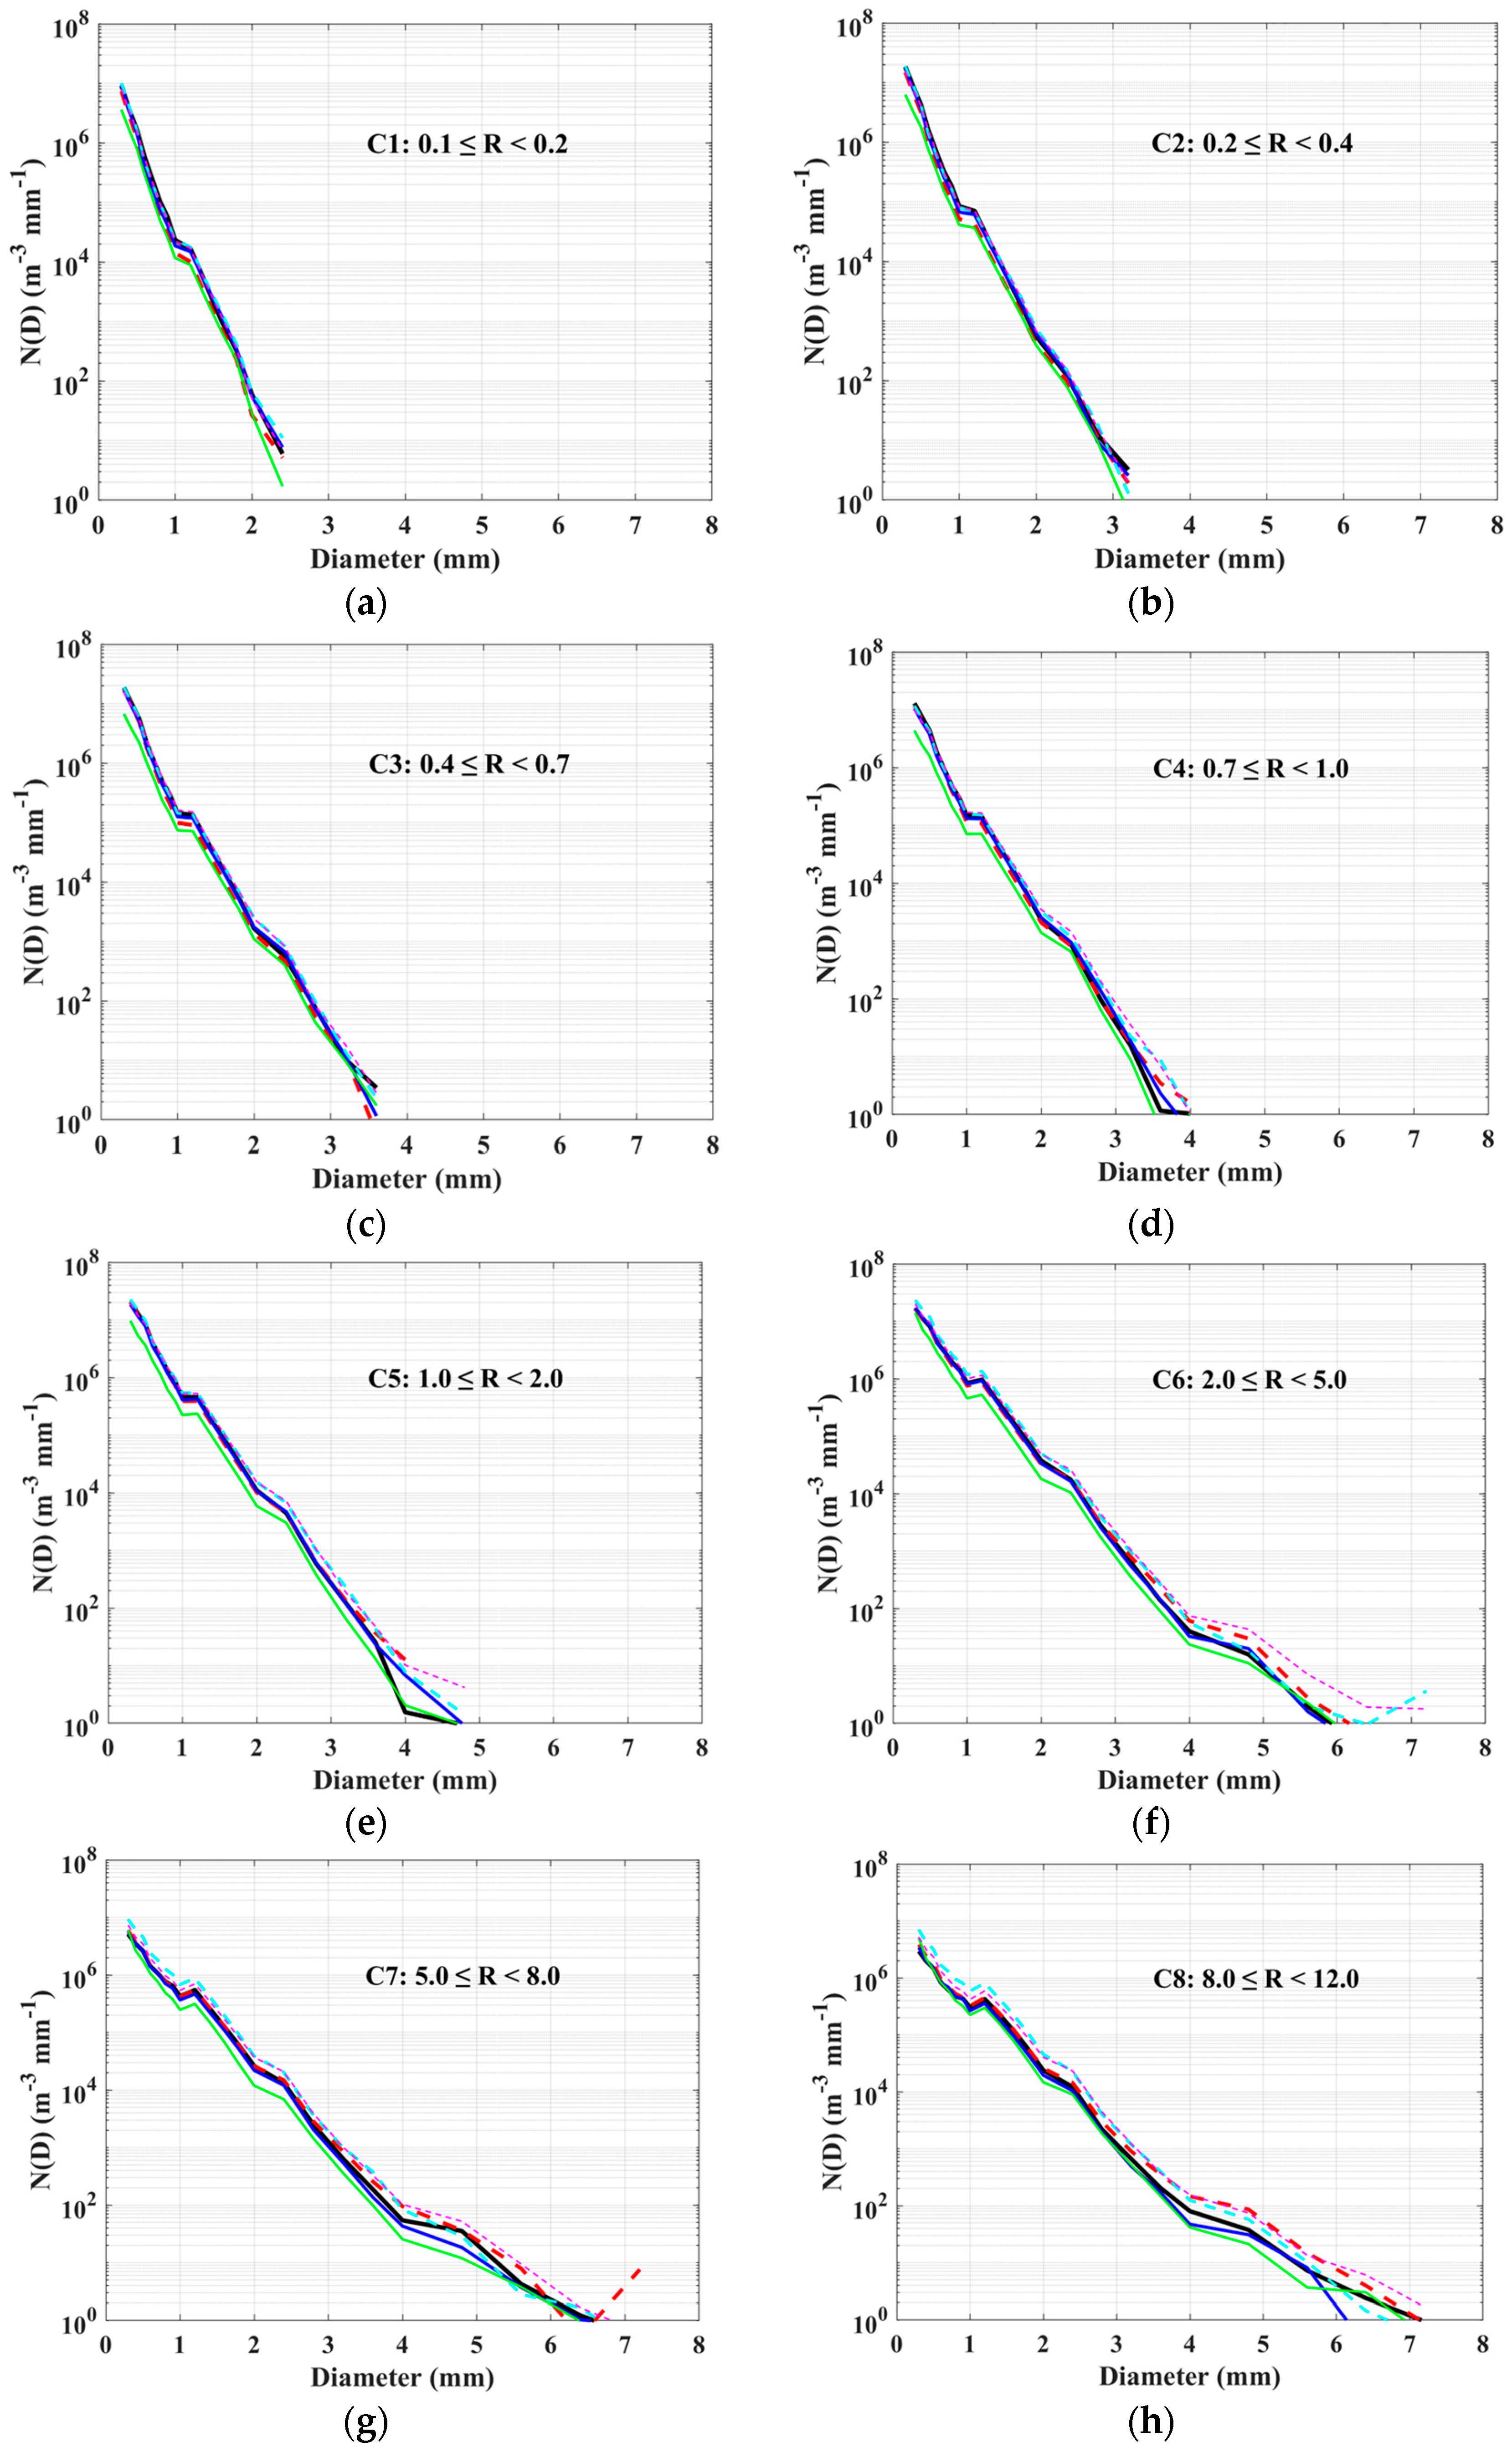
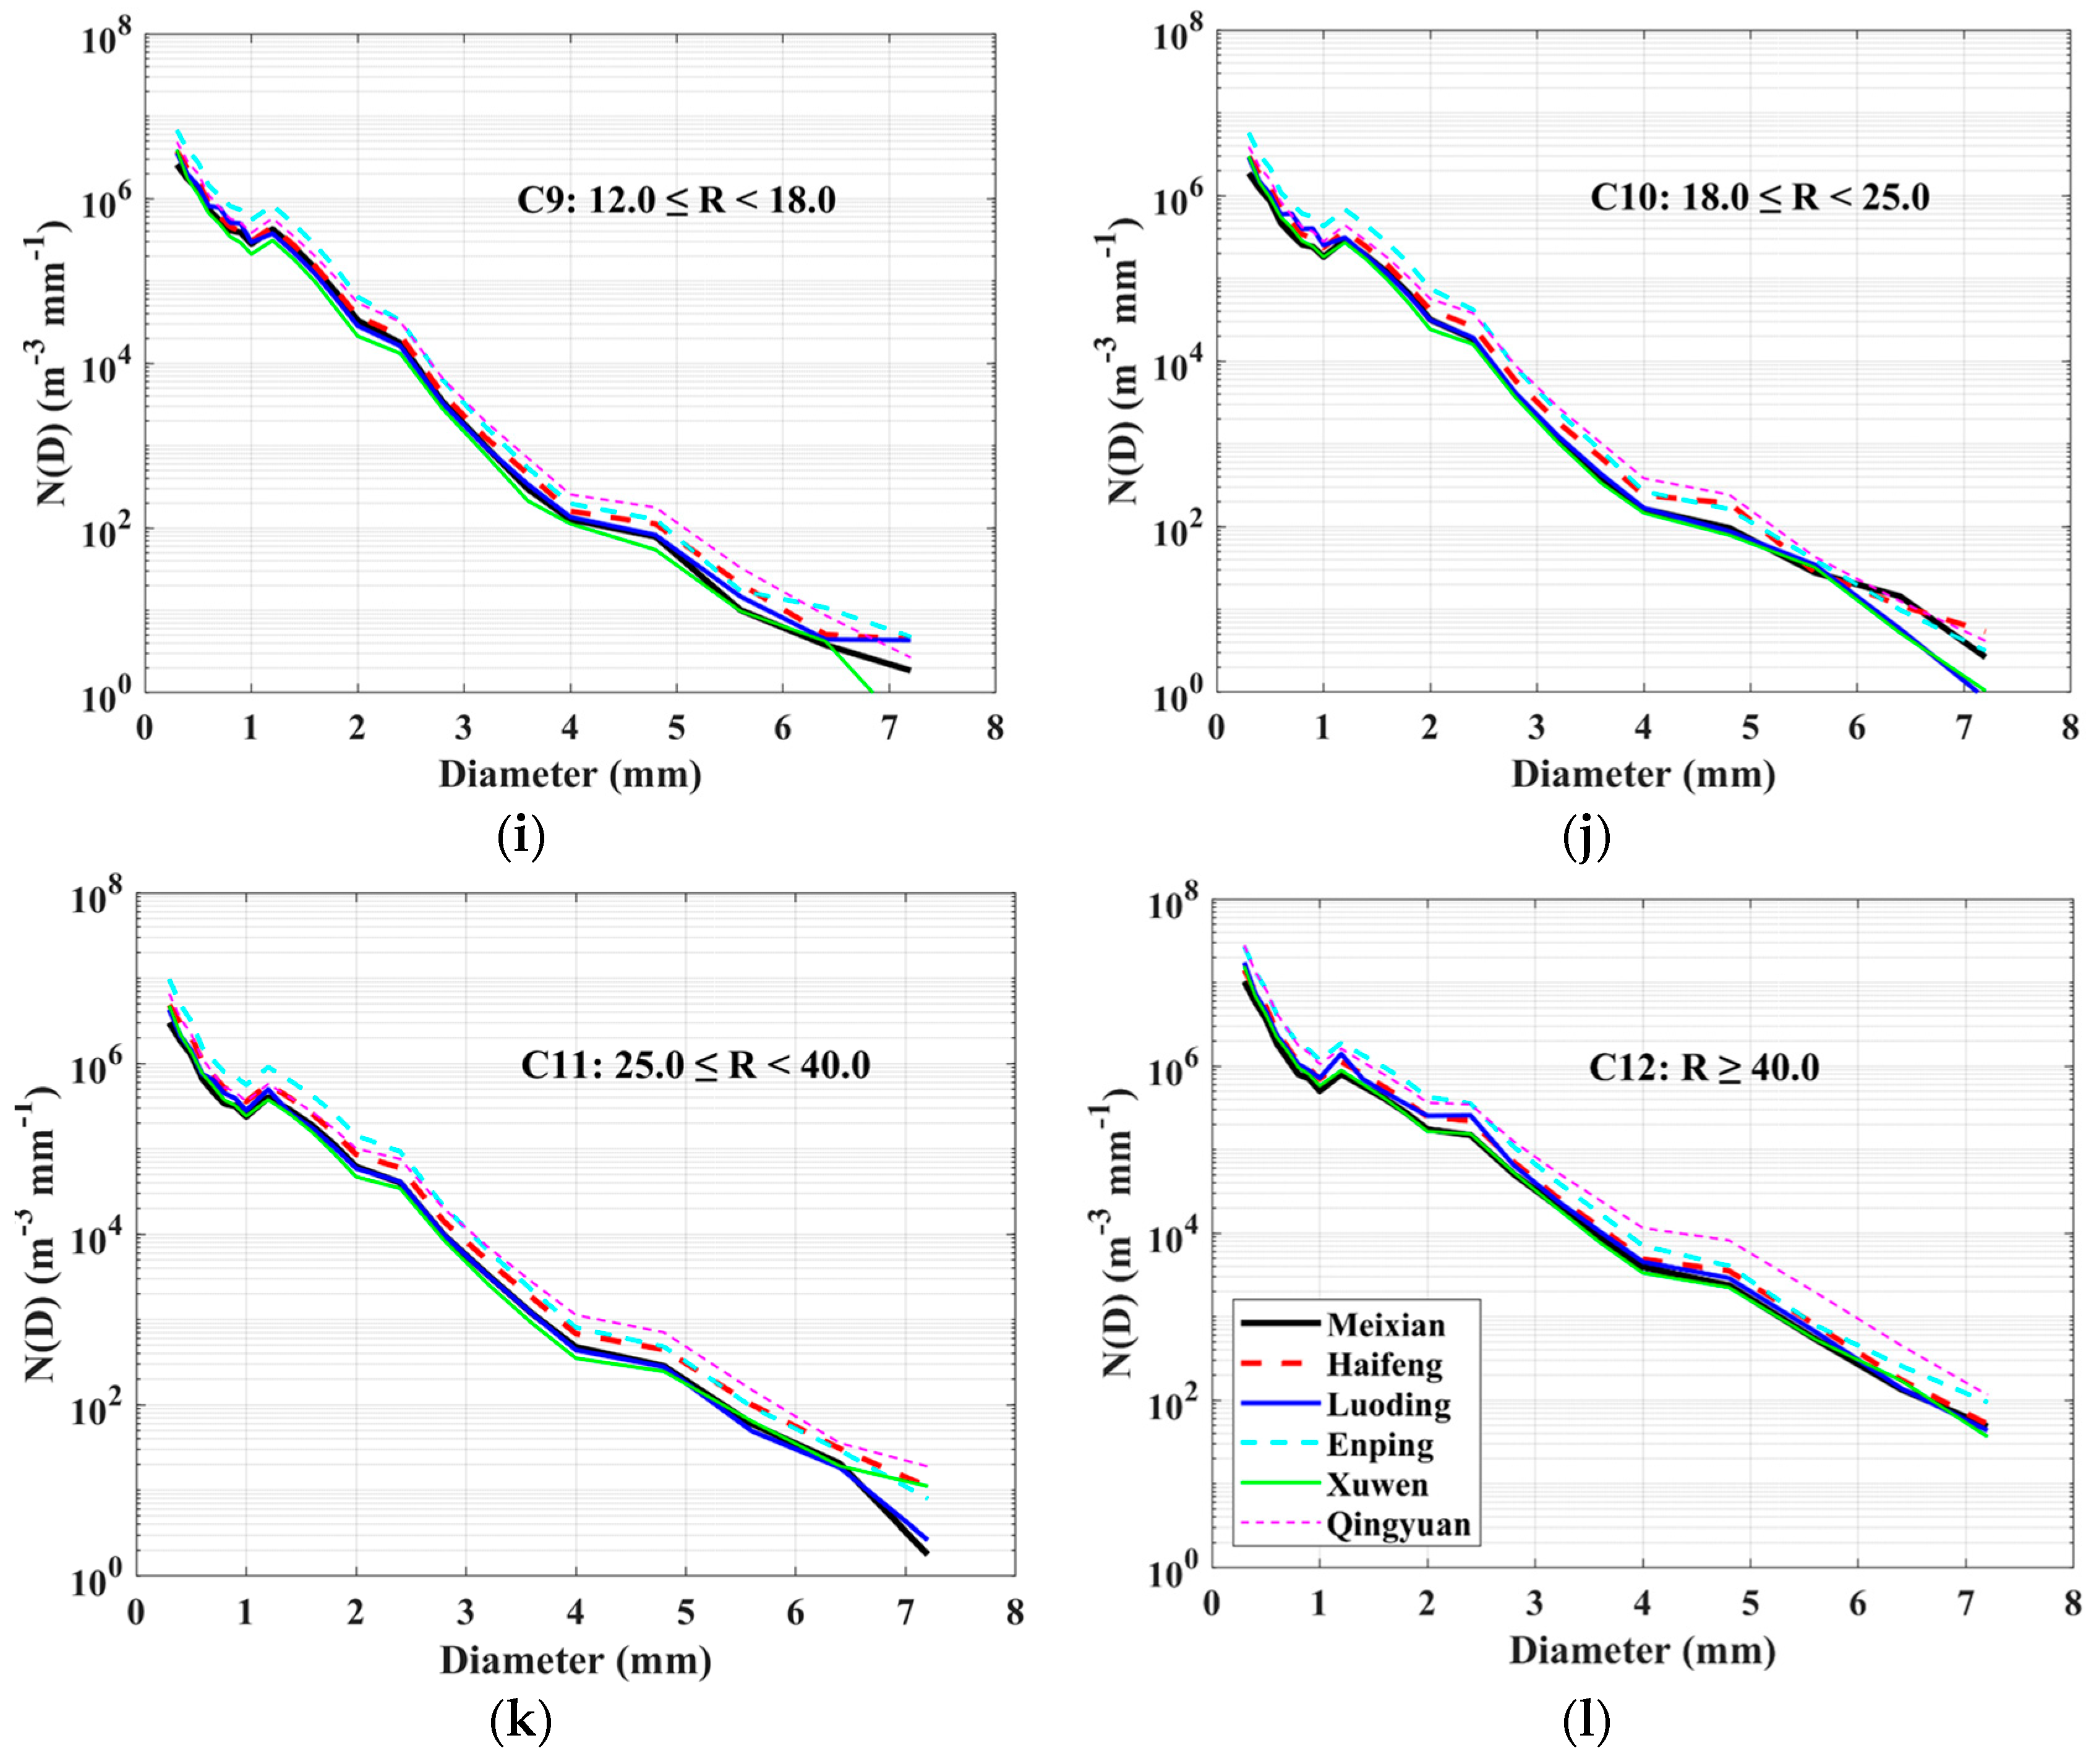
3.3. DSD in Different Rainfall Rate Classes
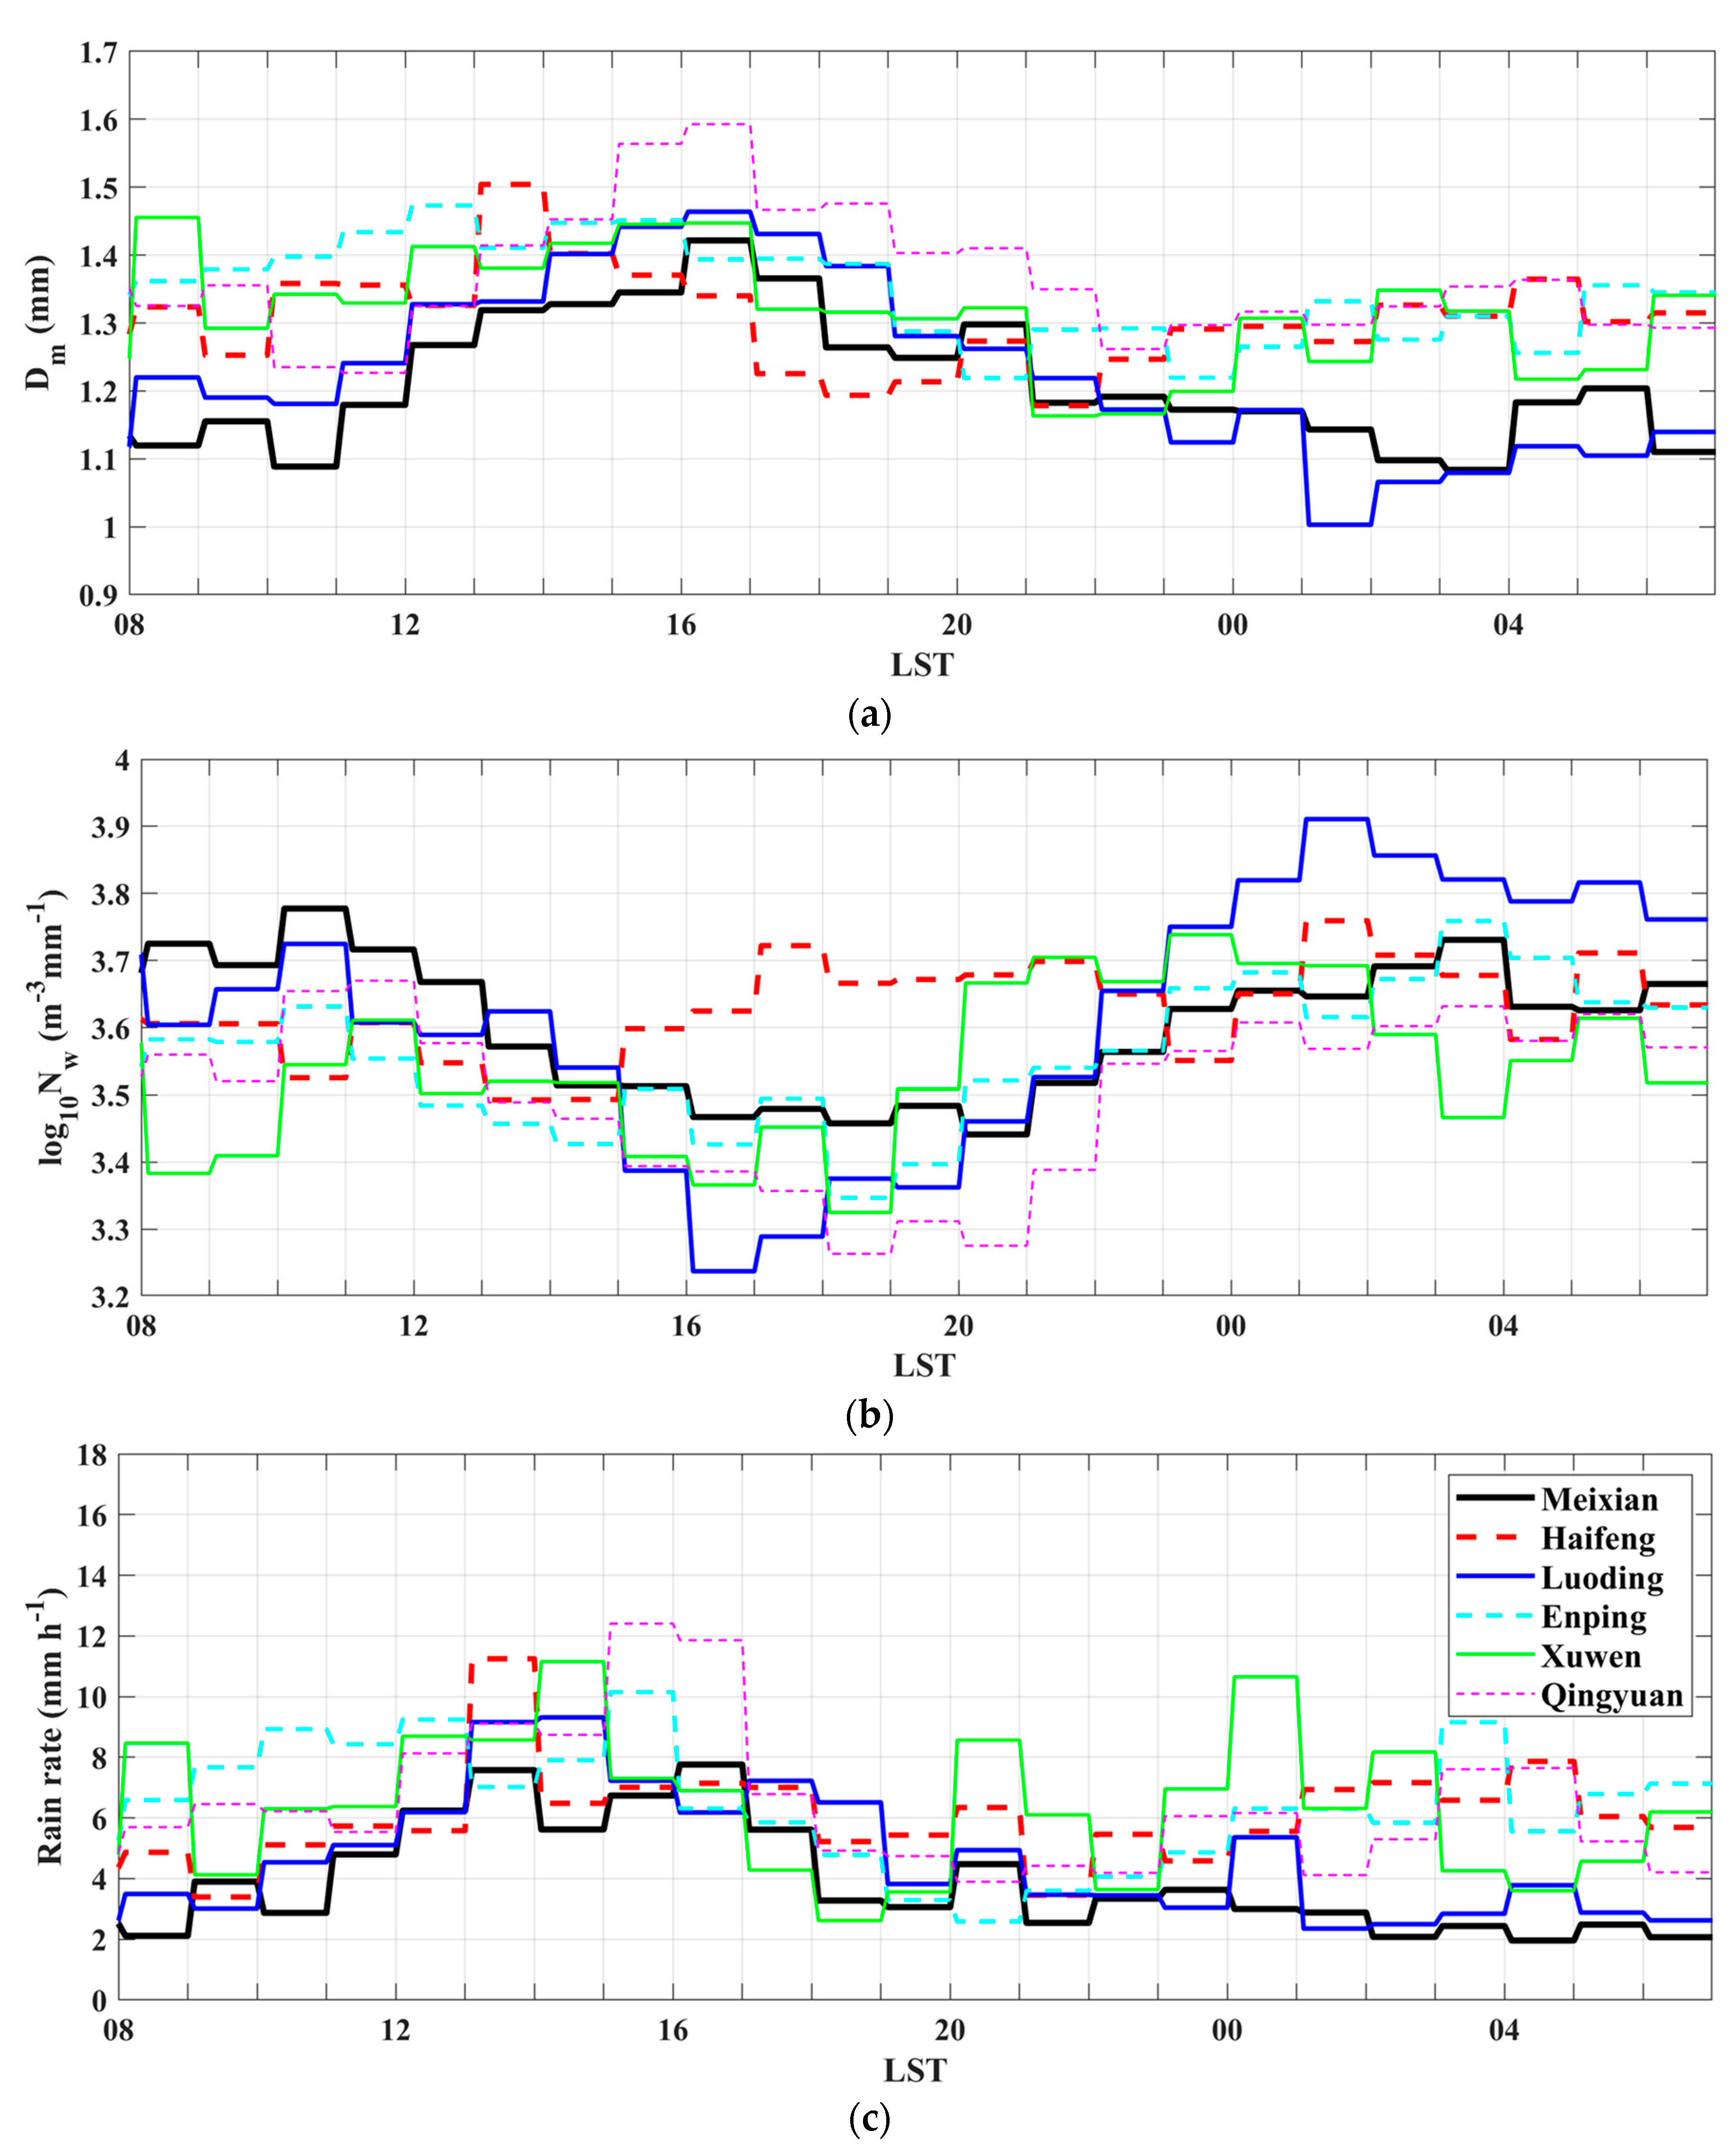
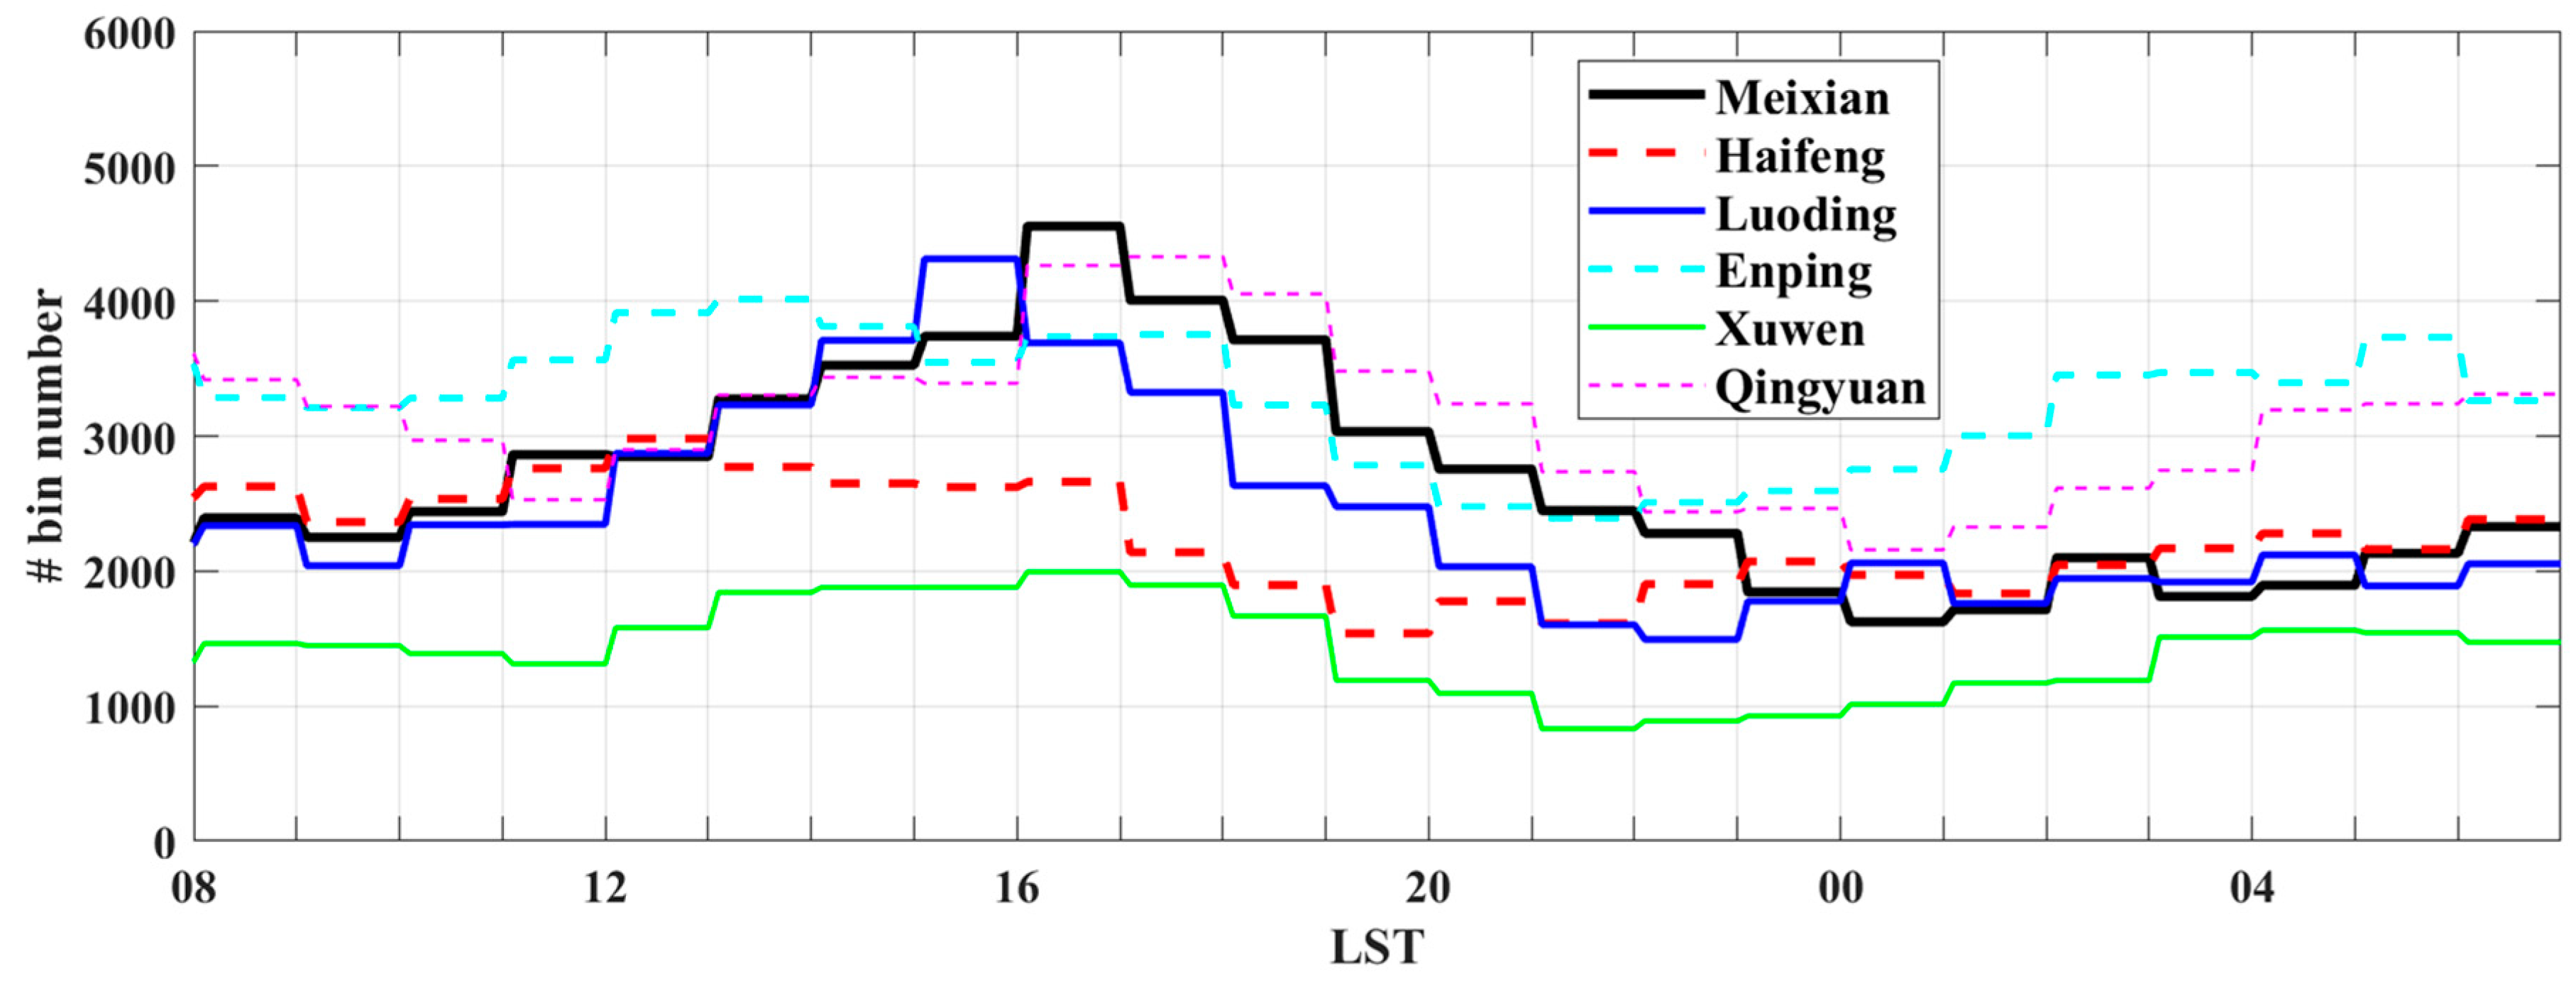
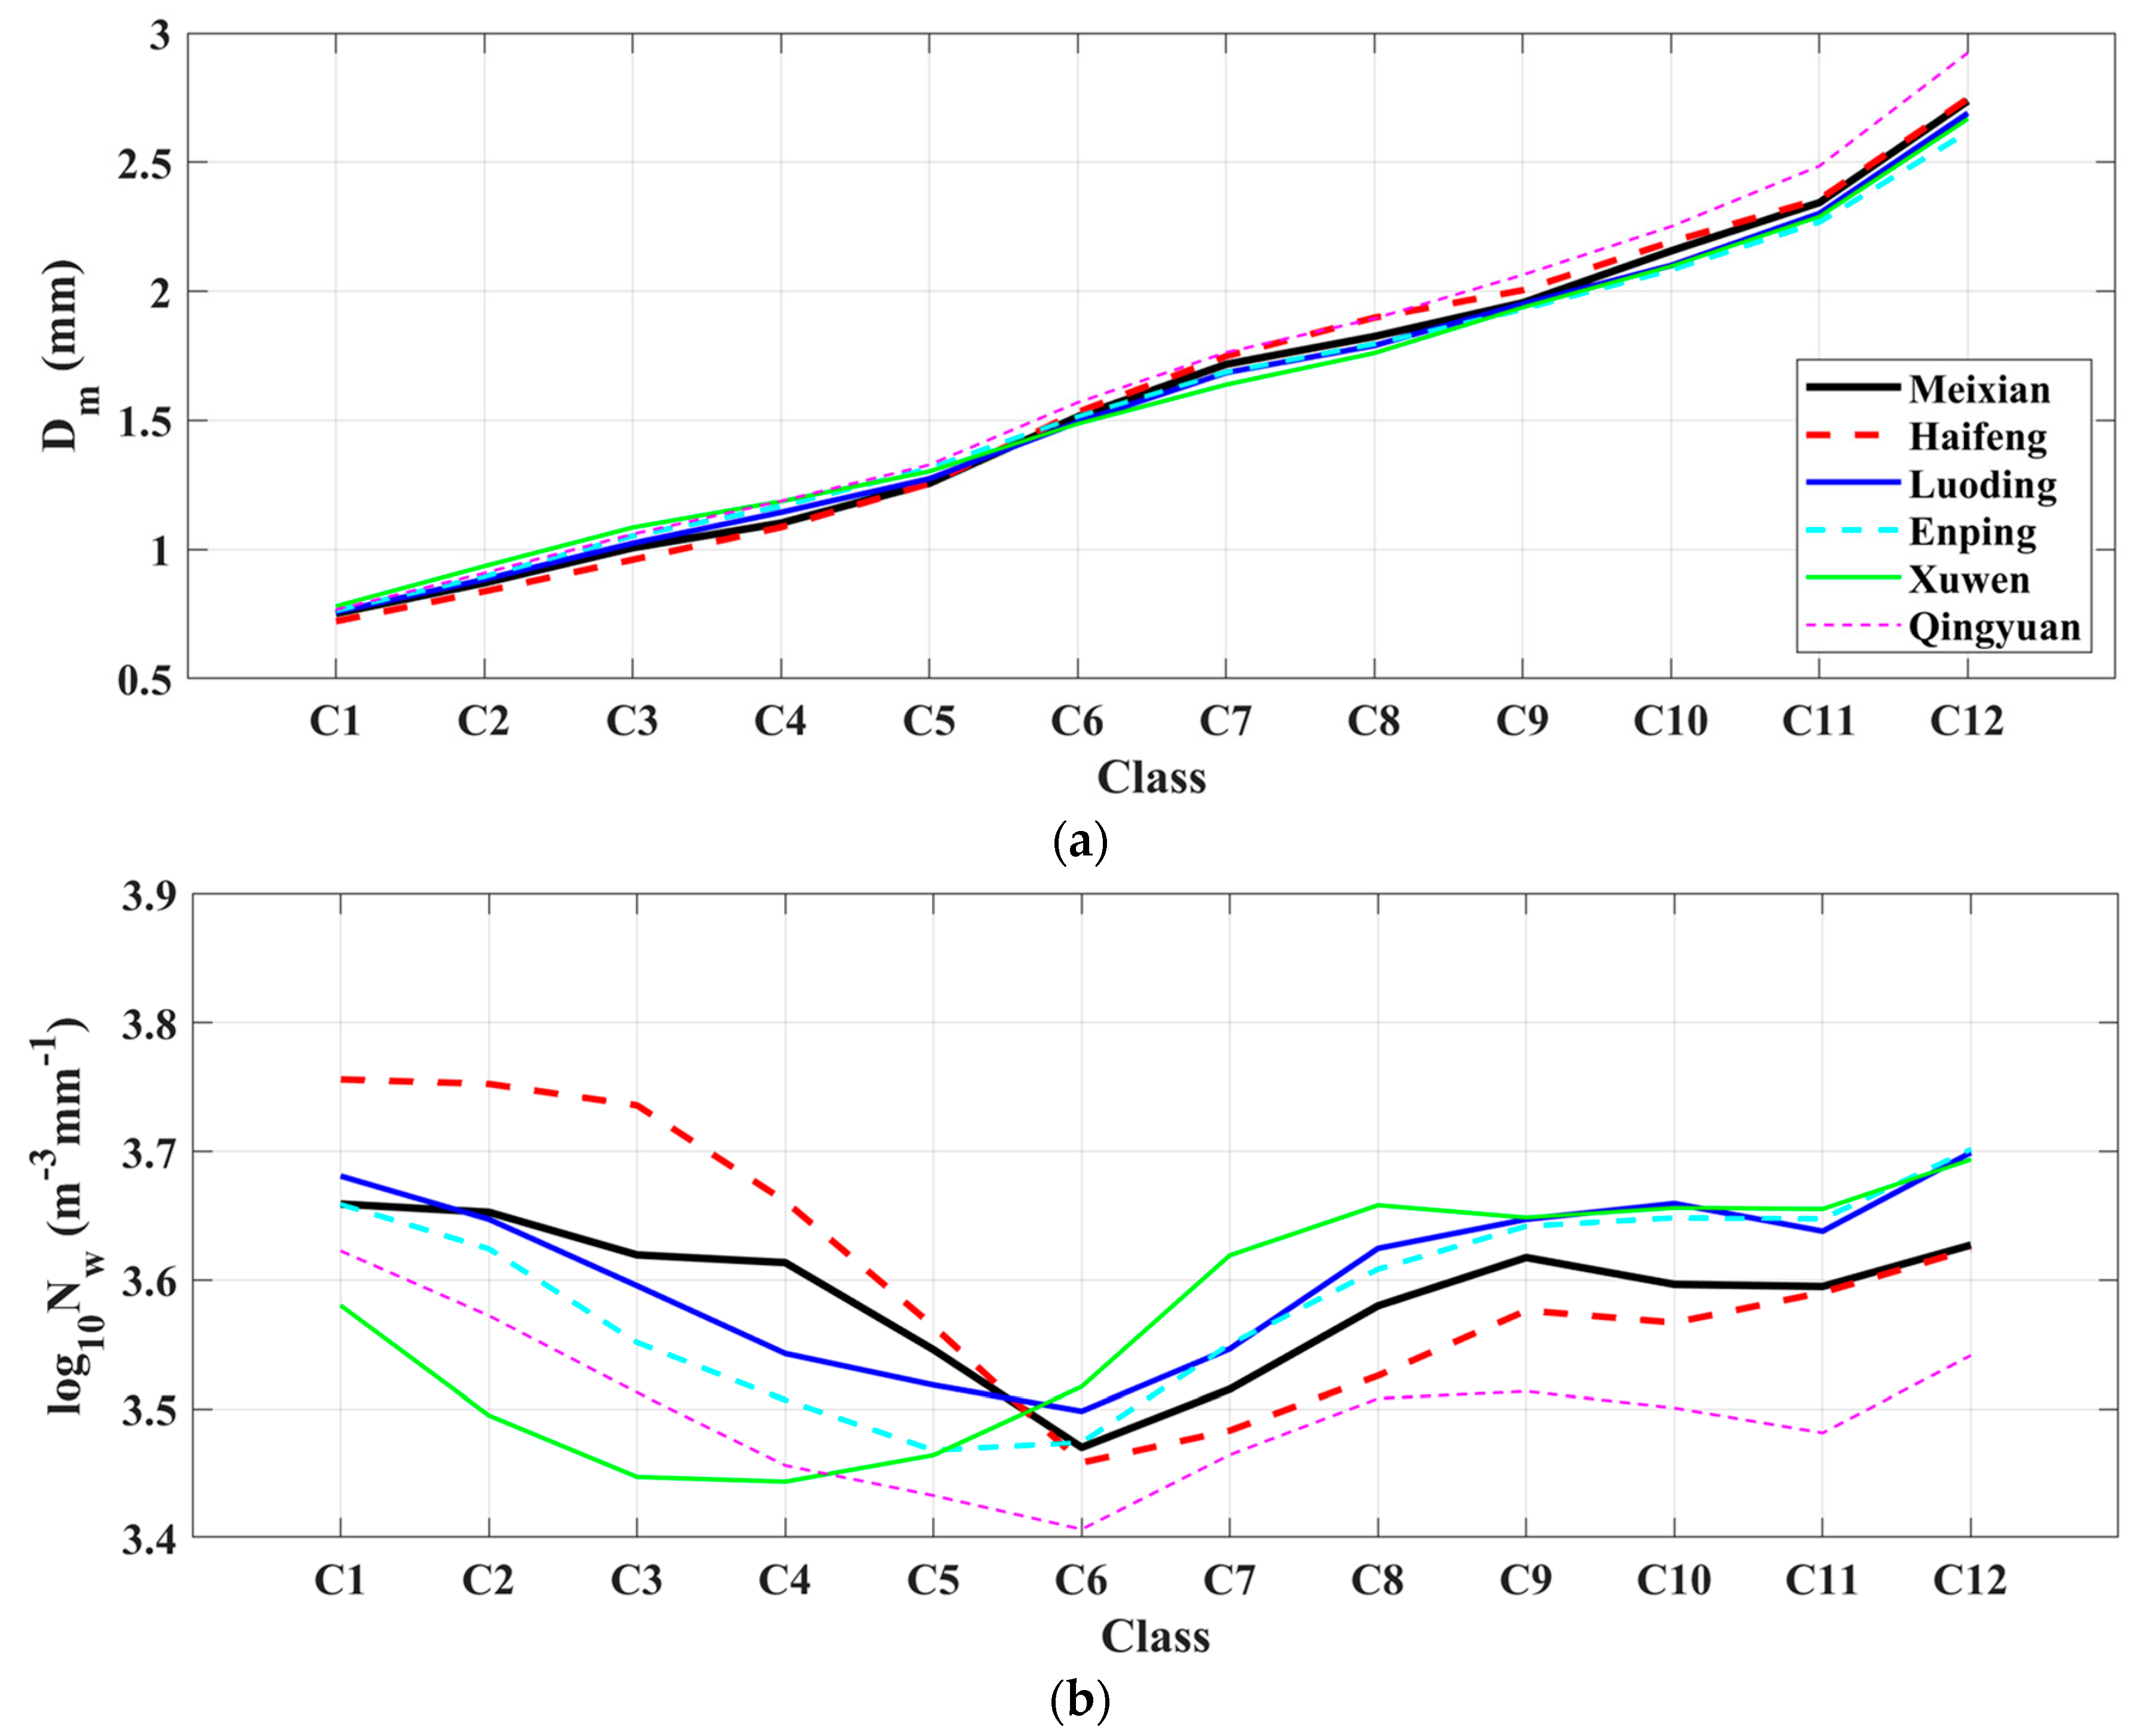
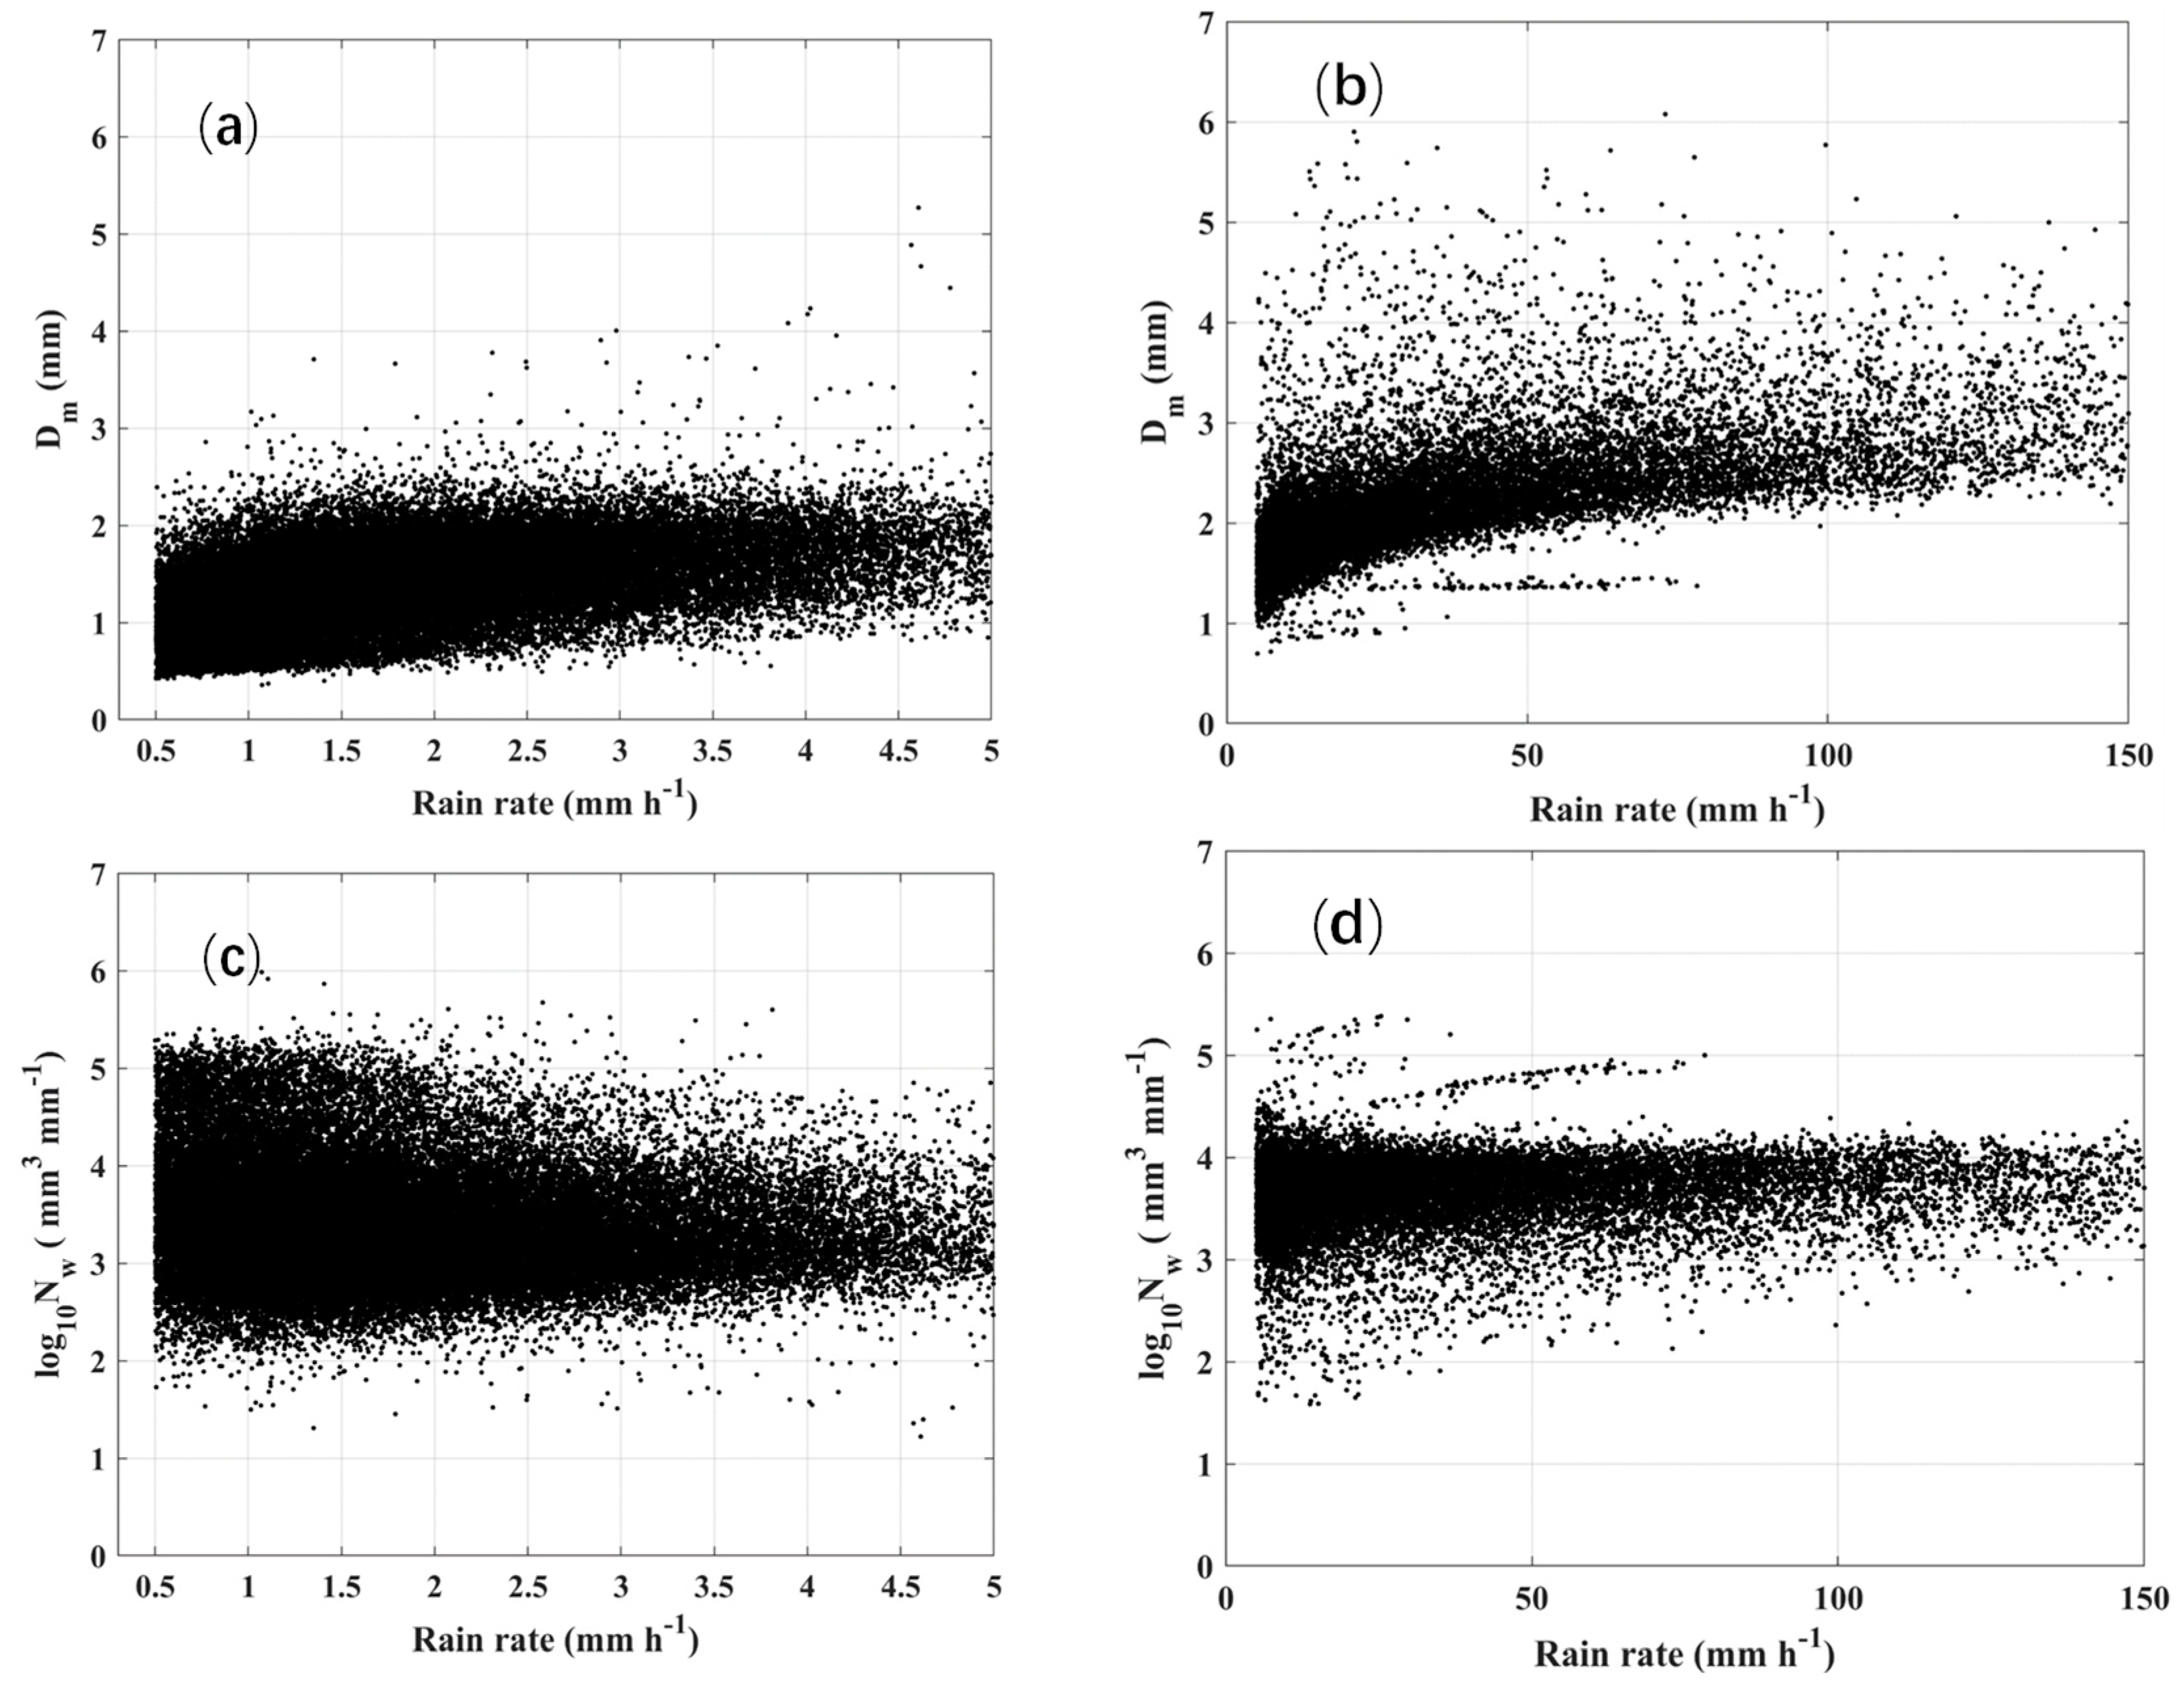
3.4. Distributions of Dm and Nw
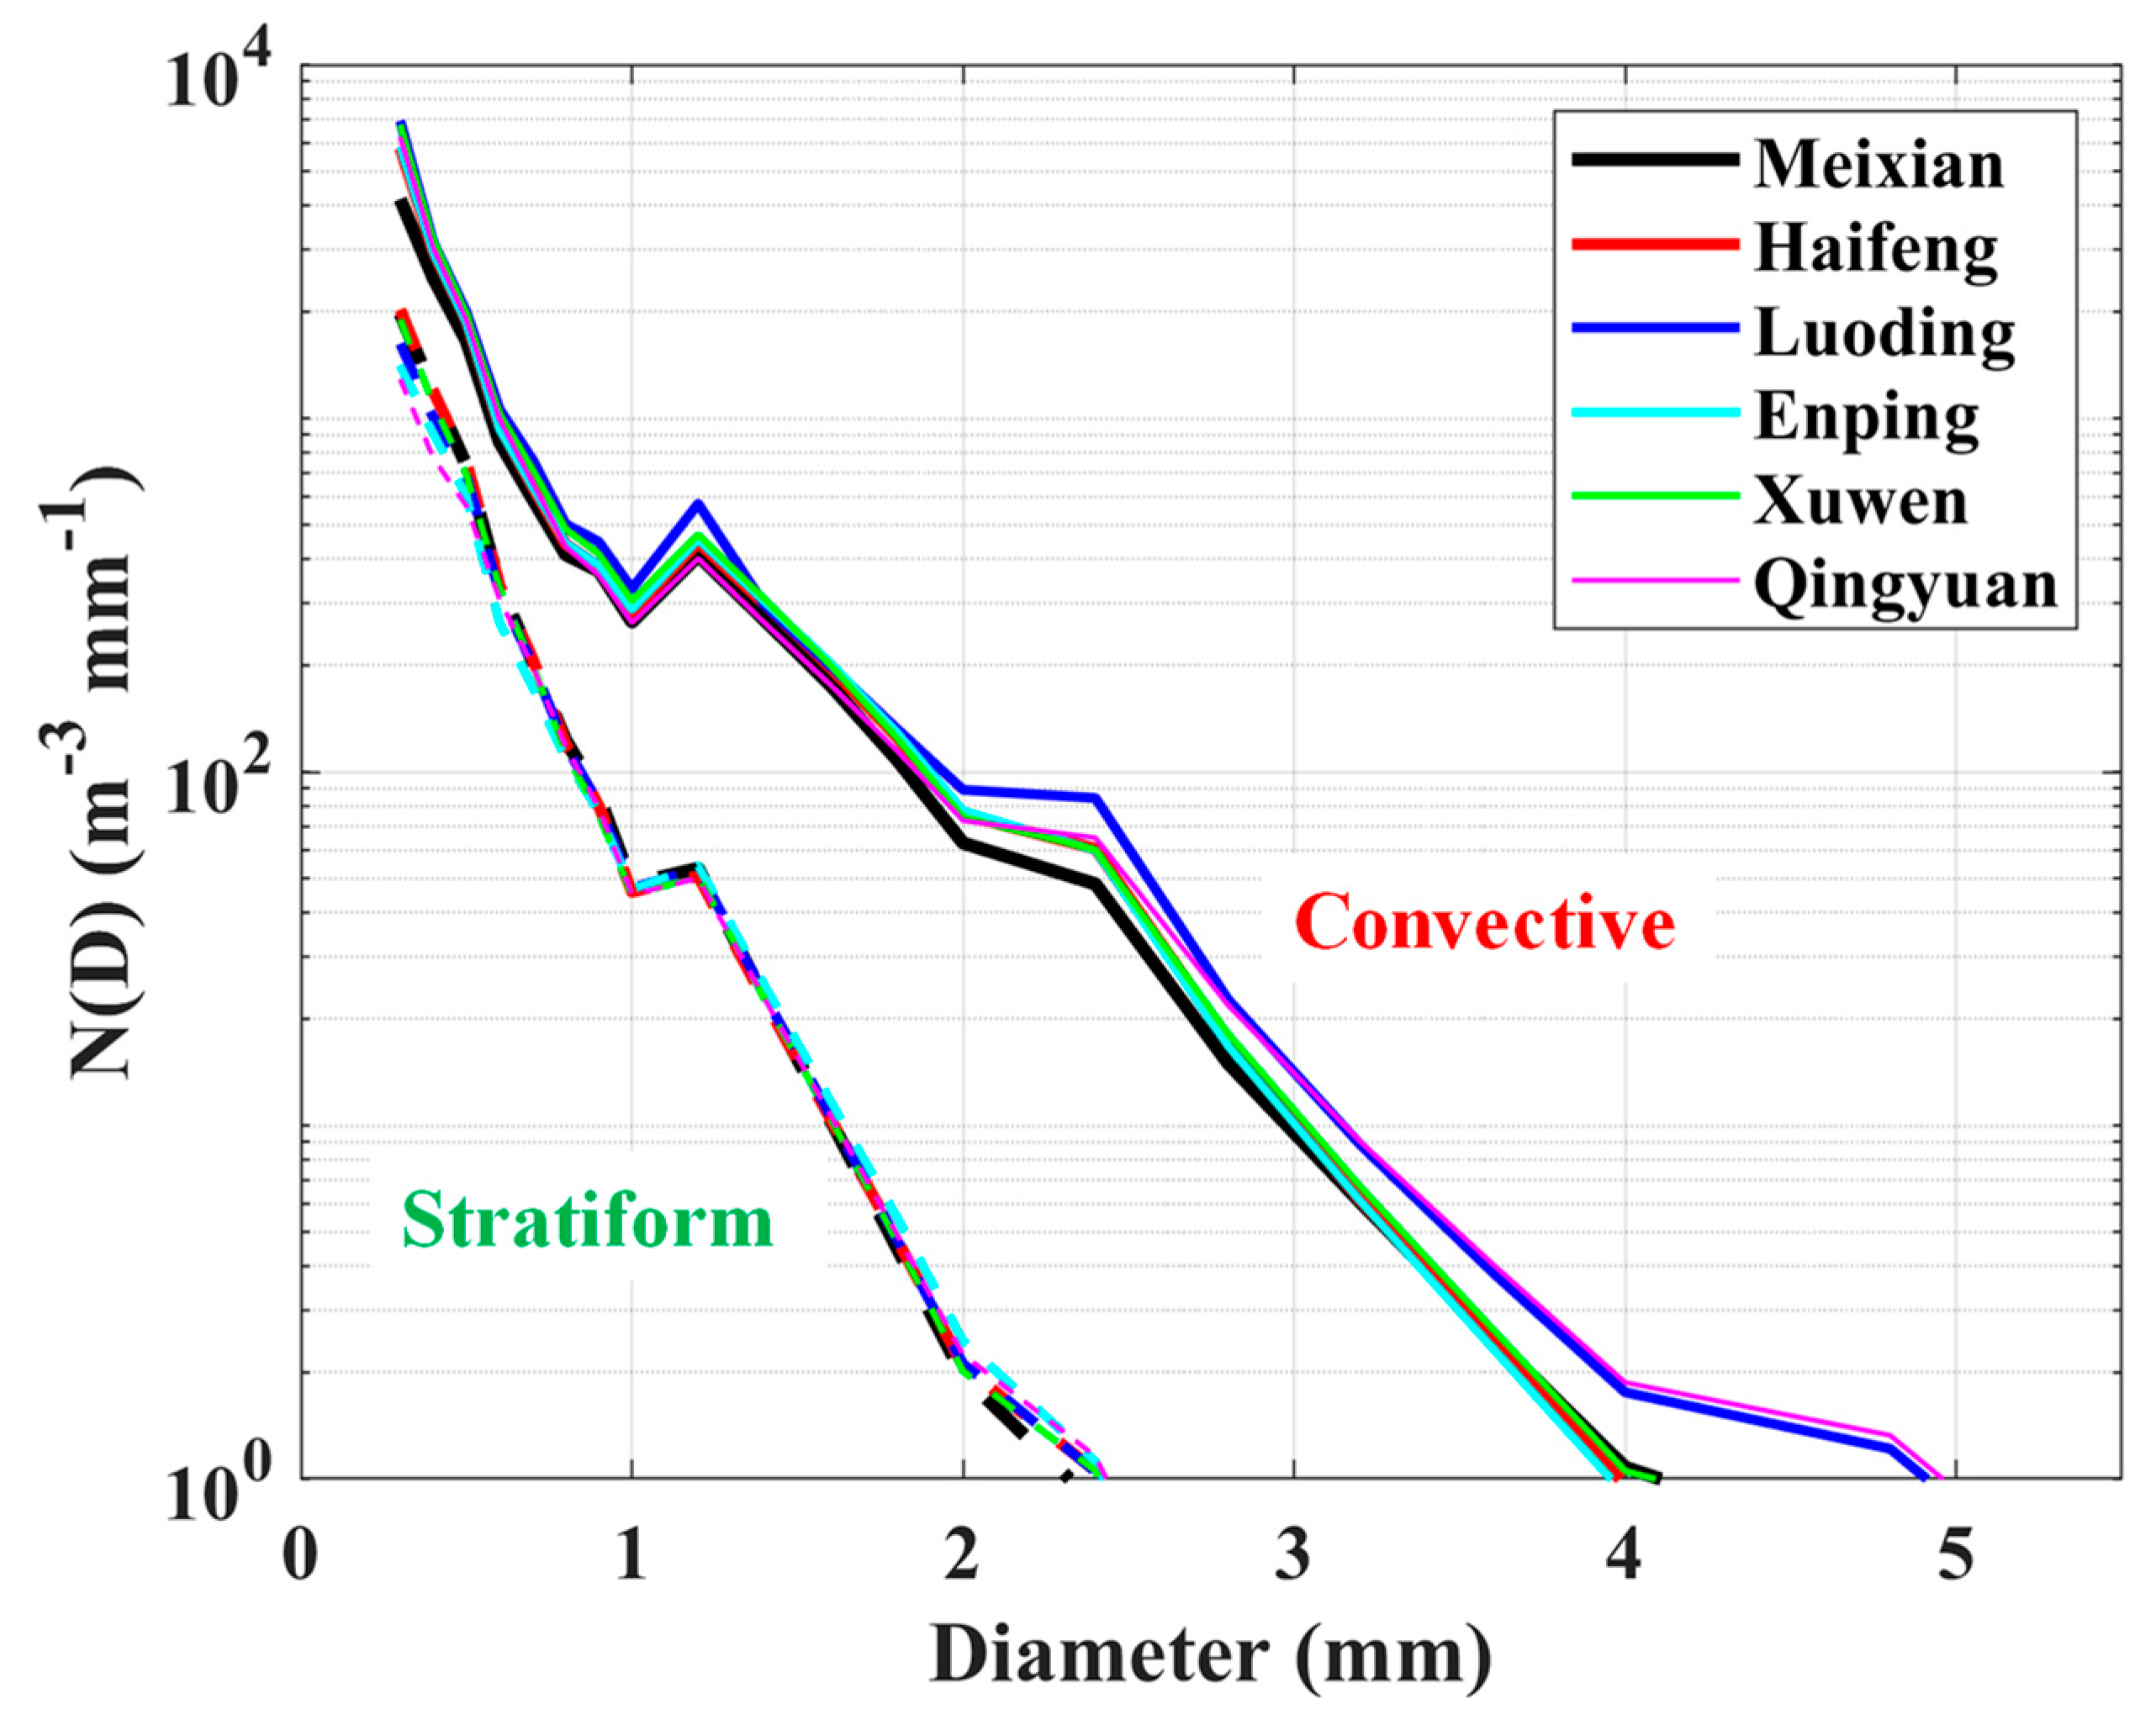
3.5. Stratiform and Convective DSDs
4. Summary and Conclusions
Author Contributions
Funding
Informed Consent Statement
Data Availability Statement
Acknowledgments
Conflicts of Interest
References
- Schneider, U.; Finger, P.; Meyer-Christoffer, A.; Rustemeier, E.; Ziese, M.; Becker, A. Evaluating the Hydrological Cycle over Land Using the Newly-Corrected Precipitation Climatology from the Global Precipitation Climatology Centre (GPCC). Amosphere-Basel 2017, 8, 52. [Google Scholar] [CrossRef]
- Oki, T.; Kanae, S. Global Hydrological Cycles and World Water Resources. Science 2006, 313, 1068–1072. [Google Scholar] [CrossRef] [PubMed]
- Holland, J.Z.; Rasmusson, E.M. Measurements of the Atmospheric Mass, Energy, and Momentum Budgets Over a 500-Kilometer Square of Tropical Ocean. Mon. Weather Rev. 1973, 101, 44–55. [Google Scholar] [CrossRef]
- Trenberth, K.E.; Smith, L.; Qian, T.; Dai, A.; Fasullo, J. Estimates of the Global Water Budget and Its Annual Cycle Using Observational and Model Data. J. Hydrometeorol. 2007, 8, 758–769. [Google Scholar] [CrossRef]
- Allan, R.P.; Barlow, M.; Byrne, M.P.; Cherchi, A.; Douville, H.; Fowler, H.J.; Gan, T.Y.; Pendergrass, A.G.; Rosenfeld, D.; Swann, A.L.S.; et al. Advances in understanding large-scale responses of the water cycle to climate change. Ann. New York Acad. Sci. 2020, 1472, 49–75. [Google Scholar] [CrossRef]
- Sun, J. Initialization and Numerical Forecasting of a Supercell Storm Observed during STEPS. Mon. Weather Rev. 2005, 133, 793–813. [Google Scholar] [CrossRef]
- Prat, O.P.; Barros, A.P. Exploring the use of a column model for the characterization of microphysical processes in warm rain: Results from a homogeneous rainshaft model. Adv. Geosci. 2007, 10, 145–152. [Google Scholar] [CrossRef]
- Kumjian, M.R.; Prat, O.P. The Impact of Raindrop Collisional Processes on the Polarimetric Radar Variables. J. Atmos. Sci. 2014, 71, 3052–3067. [Google Scholar] [CrossRef]
- Lai, R.; Liu, X.; Hu, S.; Xiao, H.; Xia, F.; Feng, L.; Li, H. Raindrop size distribution characteristic differences during the dry and wet seasons in South China. Atmos. Res. 2022, 266, 105947. [Google Scholar] [CrossRef]
- Radhakrishna, B.; Rao, T.N.; Rao, D.N.; Rao, N.P.; Nakamura, K.; Sharma, A.K. Spatial and seasonal variability of raindrop size distributions in southeast India. J. Geophys. Res.-Atmos. 2009, 114, D04203. [Google Scholar] [CrossRef]
- Chen, G.; Zhao, K.; Huang, H.; Yang, Z.; Lu, Y.; Yang, J. Evaluating Simulated Raindrop Size Distributions and Ice Microphysical Processes With Polarimetric Radar Observations in a Meiyu Front Event Over Eastern China. J. Geophys. Res.-Atmos. 2021, 126, e2020JD034511. [Google Scholar] [CrossRef]
- Dolan, B.; Rutledge, S.A.; Rasmussen, K.L. Multiscale Interactions Contributing to Enhanced Orographic Precipitation in Landfalling Frontal Systems over the Olympic Peninsula. Mon. Weather Rev. 2022, 150, 1207–1231. [Google Scholar] [CrossRef]
- Hopper, L.J.; Schumacher, C.; Humes, K.; Funk, A. Drop-Size Distribution Variations Associated with Different Storm Types in Southeast Texas. Amosphere-Basel 2020, 11, 8. [Google Scholar] [CrossRef]
- Friedrich, K.; Kalina, E.A.; Masters, F.J.; Lopez, C.R. Drop-Size Distributions in Thunderstorms Measured by Optical Disdrometers during VORTEX2. Mon. Weather Rev. 2013, 141, 1182–1203. [Google Scholar] [CrossRef]
- Chen, B.; Wang, J.; Gong, D. Raindrop Size Distribution in a Midlatitude Continental Squall Line Measured by Thies Optical Disdrometers over East China. J. Appl. Meteorol. Clim. 2016, 55, 621–634. [Google Scholar] [CrossRef]
- Wen, L.; Zhao, K.; Chen, G.; Wang, M.; Zhou, B.; Huang, H.; Hu, D.; Lee, W.-C.; Hu, H. Drop Size Distribution Characteristics of Seven Typhoons in China. J. Geophys. Res.-Atmos. 2018, 123, 6529–6548. [Google Scholar] [CrossRef]
- Suh, S.-H.; Kim, H.-J.; You, C.-H.; Lee, D.-I. Raindrop size distribution of rainfall system indirectly affected by Typhoon Kong-Rey (2018) passed through the southern parts of Korea. Atmos. Res. 2021, 257, 105561. [Google Scholar] [CrossRef]
- Janapati, J.; Seela, B.K.; Lin, P.-L.; Wang, P.K.; Tseng, C.-H.; Reddy, K.K.; Hashiguchi, H.; Feng, L.; Das, S.K.; Unnikrishnan, C.K. Raindrop Size Distribution Characteristics of Indian and Pacific Ocean Tropical Cyclones Observed at India and Taiwan Sites. J. Meteorol. Soc. Jpn. Ser. II 2020, advpub. [Google Scholar] [CrossRef]
- Chen, B.; Hu, Z.; Liu, L.; Zhang, G. Raindrop Size Distribution Measurements at 4500 m on the Tibetan Plateau during TIPEX-III. J. Geophys. Res.-Atmos. 2017, 122, 11,092–11,106. [Google Scholar] [CrossRef]
- Rivelli Zea, L.; Nesbitt, S.W.; Ladino, A.; Hardin, J.C.; Varble, A. Raindrop Size Spectrum in Deep Convective Regions of the Americas. Amosphere-Basel 2021, 12, 979. [Google Scholar] [CrossRef]
- Thurai, M.; Gatlin, P.N.; Bringi, V.N. Separating stratiform and convective rain types based on the drop size distribution characteristics using 2D video disdrometer data. Atmos. Res. 2016, 169, 416–423. [Google Scholar] [CrossRef]
- Saha, P.; Majumder, S.; Maitra, A. Rain drop size distribution analysis at a tropical location near land-sea boundary. Theor. Appl. Climatol. 2022, 147, 487–498. [Google Scholar] [CrossRef]
- Kim, D.K.; Song, C.K. Characteristics of vertical velocities estimated from drop size and fall velocity spectra of a Parsivel disdrometer. Atmos. Meas. Technol. 2018, 11, 3851–3860. [Google Scholar] [CrossRef]
- Thomas, A.; Kanawade, V.P.; Chakravarty, K.; Srivastava, A.K. Characterization of raindrop size distributions and its response to cloud microphysical properties. Atmos. Res. 2021, 249, 105292. [Google Scholar] [CrossRef]
- Murali Krishna, U.V.; Das, S.K.; Sulochana, E.G.; Bhowmik, U.; Deshpande, S.M.; Pandithurai, G. Statistical characteristics of raindrop size distribution over the Western Ghats of India: Wet versus dry spells of the Indian summer monsoon. Atmos. Chem. Phys. 2021, 21, 4741–4757. [Google Scholar] [CrossRef]
- Han, Y.; Guo, J.; Yun, Y.; Li, J.; Guo, X.; Lv, Y.; Wang, D.; Li, L.; Zhang, Y. Regional variability of summertime raindrop size distribution from a network of disdrometers in Beijing. Atmos. Res. 2021, 257, 105591. [Google Scholar] [CrossRef]
- Liu, X.; Xue, L.; Chen, B.; Zhang, Y. Characteristics of Raindrop Size Distributions in Chongqing Observed by a Dense Network of Disdrometers. J. Geophys. Res.-Atmos. 2021, 126, e2021JD035172. [Google Scholar] [CrossRef]
- Wu, Y.; Liu, L. Statistical characteristics of raindrop size distribution in the Tibetan Plateau and southern China. Adv. Atmos. Sci. 2017, 34, 727–736. [Google Scholar] [CrossRef]
- Zeng, Q.; Zhang, Y.; Lei, H.; Xie, Y.; Gao, T.; Zhang, L.; Wang, C.; Huang, Y. Microphysical Characteristics of Precipitation during Pre-monsoon, Monsoon, and Post-monsoon Periods over the South China Sea. Adv. Atmos. Sci. 2019, 36, 1103–1120. [Google Scholar] [CrossRef]
- Chen, X.; Zhang, F.; Zhao, K. Diurnal Variations of the Land–Sea Breeze and Its Related Precipitation over South China. J. Atmos. Sci. 2016, 73, 4793–4815. [Google Scholar] [CrossRef]
- Du, Y.; Chen, G. Heavy Rainfall Associated with Double Low-Level Jets over Southern China. Part I: Ensemble-Based Analysis. Mon. Weather Rev. 2018, 146, 3827–3844. [Google Scholar] [CrossRef]
- Xu, W.; Zipser, E.J.; Chen, Y.-L.; Liu, C.; Liou, Y.-C.; Lee, W.-C.; Jong-Dao Jou, B. An Orography-Associated Extreme Rainfall Event during TiMREX: Initiation, Storm Evolution, and Maintenance. Mon. Weather Rev. 2012, 140, 2555–2574. [Google Scholar] [CrossRef]
- Lau, K.M.; Ding, Y.; Wang, J.-T.; Johnson, R.; Keenan, T.; Cifelli, R.; Gerlach, J.; Thieleandamp, O.; Rickenbach, T.; Tsay, S.-C.; et al. A Report of the Field Operations and Early Results of the South China Sea Monsoon Experiment (SCSMEX). Bull. Am. Meteorol. Soc. 2000, 81, 1261–1270. [Google Scholar] [CrossRef]
- Luo, Y.; Wang, H.; Zhang, R.; Qian, W.; Luo, Z. Comparison of Rainfall Characteristics and Convective Properties of Monsoon Precipitation Systems over South China and the Yangtze and Huai River Basin. J. Clim. 2013, 26, 110–132. [Google Scholar] [CrossRef]
- Wang, G.; Zhang, D.-L.; Sun, J. A Multiscale Analysis of a Nocturnal Extreme Rainfall Event of 14 July 2017 in Northeast China. Mon. Weather Rev. 2021, 149, 173–187. [Google Scholar] [CrossRef]
- Chen, C.; Zhang, A.-S.; Wu, N.-G.; Liu, X.-T.; Sun, X.-G.; Wang, H. Statistical Characteristics of Raindrop Size Distribution in the South China Monsoon Region (Guangdong Province). J. Trop. Meteorol. 2023, 29, 55–67. [Google Scholar]
- Joss, J.; Waldvogel, A. Ein Spektrograph für Niederschlagstropfen mit automatischer Auswertung. Pure Appl. Geophys. 1967, 68, 240–246. [Google Scholar] [CrossRef]
- Tokay, A.; Wolff, D.B.; Petersen, W.A. Evaluation of the New Version of the Laser-Optical Disdrometer, OTT Parsivel2. J. Atmos. Ocean Technol. 2014, 31, 1276–1288. [Google Scholar] [CrossRef]
- Yuter, S.E.; Kingsmill, D.E.; Nance, L.B.; Löffler-Mang, M. Observations of Precipitation Size and Fall Speed Characteristics within Coexisting Rain and Wet Snow. J. Appl. Meteorol. Clim. 2006, 45, 1450–1464. [Google Scholar] [CrossRef]
- Jaffrain, J.; Berne, A. Experimental Quantification of the Sampling Uncertainty Associated with Measurements from PARSIVEL Disdrometers. J. Hydrometeorol. 2011, 12, 352–370. [Google Scholar] [CrossRef]
- Bringi, V.N.; Chandrasekar, V.; Hubbert, J.; Gorgucci, E.; Randeu, W.L.; Schoenhuber, M. Raindrop Size Distribution in Different Climatic Regimes from Disdrometer and Dual-Polarized Radar Analysis. J. Atmos. Sci. 2003, 60, 354–365. [Google Scholar] [CrossRef]
- Tokay, A.; Bashor, P.G.; Habib, E.; Kasparis, T. Raindrop Size Distribution Measurements in Tropical Cyclones. Mon. Weather Rev. 2008, 136, 1669–1685. [Google Scholar] [CrossRef]
- Narayana Rao, T.; Radhakrishna, B.; Nakamura, K.; Prabhakara Rao, N. Differences in raindrop size distribution from southwest monsoon to northeast monsoon at Gadanki. Q. J. Roy. Meteor. Soc. 2009, 135, 1630–1637. [Google Scholar] [CrossRef]
- Arulraj, M.; Barros, A.P. Improving quantitative precipitation estimates in mountainous regions by modelling low-level seeder-feeder interactions constrained by Global Precipitation Measurement Dual-frequency Precipitation Radar measurements. Remote Sens. Environ. 2019, 231, 111213. [Google Scholar] [CrossRef]
- Feng, Y.-C.; Chen Wang, T.-C. Precipitation Characteristics of an Autumn Torrential Rainfall Event in Northern Taiwan as Determined from Dual-Polarization Radar Data. J. Meteorol. Soc. Jpn. Ser. II 2011, 89, 133–150. [Google Scholar] [CrossRef]
- Du, Y.; Zhang, Q.; Chen, Y.-l.; Zhao, Y.; Wang, X. Numerical Simulations of Spatial Distributions and Diurnal Variations of Low-Level Jets in China during Early Summer. J. Clim. 2014, 27, 5747–5767. [Google Scholar] [CrossRef]
- Villalobos-Puma, E.; Martinez-Castro, D.; Flores-Rojas, J.L.; Saavedra-Huanca, M.; Silva-Vidal, Y. Diurnal Cycle of Raindrops Size Distribution in a Valley of the Peruvian Central Andes. Amosphere-Basel 2020, 11, 38. [Google Scholar] [CrossRef]
- Chen, S.S.; Houze Jr, R.A. Diurnal variation and life-cycle of deep convective systems over the tropical pacific warm pool. Q. J. Roy. Meteor. Soc. 1997, 123, 357–388. [Google Scholar] [CrossRef]
- Aves, S.; Johnson, R.H. The Diurnal Cycle of Convection over the Northern South China Sea. J. Meteorol. Soc. Jpn. Ser. II 2008, 86, 919–934. [Google Scholar] [CrossRef]
- Marzuki, M.; Hashiguchi, H.; Yamamoto, M.K.; Mori, S.; Yamanaka, M.D. Regional variability of raindrop size distribution over Indonesia. Ann. Geophys. 2013, 31, 1941–1948. [Google Scholar] [CrossRef]
- Wu, N.; Ding, X.; Wen, Z.; Chen, G.; Meng, Z.; Lin, L.; Min, J. Contrasting frontal and warm-sector heavy rainfalls over South China during the early-summer rainy season. Atmos. Res. 2020, 235, 104693. [Google Scholar] [CrossRef]
- Cao, Q.; Zhang, G. Errors in Estimating Raindrop Size Distribution Parameters Employing Disdrometer and Simulated Raindrop Spectra. J. Appl. Meteorol. Clim. 2009, 48, 406–425. [Google Scholar] [CrossRef]
- Ulbrich, C.W. Natural Variations in the Analytical Form of the Raindrop Size Distribution. J. Appl. Meteorol. Clim. 1983, 22, 1764–1775. [Google Scholar] [CrossRef]
- Zwiebel, J.; Van Baelen, J.; Anquetin, S.; Pointin, Y.; Boudevillain, B. Impacts of orography and rain intensity on rainfall structure. The case of the HyMeX IOP7a event. Q. J. Roy. Meteor. Soc. 2016, 142, 310–319. [Google Scholar] [CrossRef]
- Rosenfeld, D.; Ulbrich, C.W. Cloud Microphysical Properties, Processes, and Rainfall Estimation Opportunities. In Radar and Atmospheric Science: A Collection of Essays in Honor of David Atlas; Wakimoto, R.M., Srivastava, R., Eds.; American Meteorological Society: Boston, MA, USA, 2003; pp. 237–258. [Google Scholar]
- Medina, S.; Houze, R.A. Air motions and precipitation growth in Alpine storms. Q. J. Roy. Meteor. Soc. 2003, 129, 345–371. [Google Scholar] [CrossRef]
- Krishna, U.V.M.; Reddy, K.K.; Seela, B.K.; Shirooka, R.; Lin, P.-L.; Pan, C.-J. Raindrop size distribution of easterly and westerly monsoon precipitation observed over Palau islands in the Western Pacific Ocean. Atmos. Res. 2016, 174–175, 41–51. [Google Scholar] [CrossRef]
- Seela, B.K.; Janapati, J.; Lin, P.-L.; Reddy, K.K.; Shirooka, R.; Wang, P.K. A Comparison Study of Summer Season Raindrop Size Distribution Between Palau and Taiwan, Two Islands in Western Pacific. J. Geophys. Res.-Atmos. 2017, 122, 11,787–711,805. [Google Scholar] [CrossRef]
- Kim, H.-J.; Jung, W.; Suh, S.-H.; Lee, D.-I.; You, C.-H. The Characteristics of Raindrop Size Distribution at Windward and Leeward Side over Mountain Area. Remote Sens.-Basel 2022, 14, 2419. [Google Scholar] [CrossRef]
- Hu, Z.; Srivastava, R.C. Evolution of Raindrop Size Distribution by Coalescence, Breakup, and Evaporation: Theory and Observations. J. Atmos. Sci. 1995, 52, 1761–1783. [Google Scholar] [CrossRef]
- Houze, R.A., Jr. Cloud Dynamics; Academic Press: Cambridge, MA, USA, 2014. [Google Scholar]
- Raut, B.A.; Konwar, M.; Murugavel, P.; Kadge, D.; Gurnule, D.; Sayyed, I.; Todekar, K.; Malap, N.; Bankar, S.; Prabhakaran, T. Microphysical Origin of Raindrop Size Distributions During the Indian Monsoon. Geophys. Res. Lett. 2021, 48, e2021GL093581. [Google Scholar] [CrossRef]
- Campos, E.; Zawadzki, I. Instrumental Uncertainties in Z–R Relations. J. Appl. Meteorol. 2000, 39, 1088–1102. [Google Scholar] [CrossRef]
- Steiner, M.; Smith, J.A.; Uijlenhoet, R. A Microphysical Interpretation of Radar Reflectivity–Rain Rate Relationships. J. Atmos. Sci. 2004, 61, 1114–1131. [Google Scholar] [CrossRef]
- Ulbrich, C.W.; Atlas, D. Microphysics of Raindrop Size Spectra: Tropical Continental and Maritime Storms. J. Appl. Meteorol. Clim. 2007, 46, 1777–1791. [Google Scholar] [CrossRef]
- Fujiwara, M. Raindrop-size Distribution from Individual Storms. J. Atmos. Sci. 1965, 22, 585–591. [Google Scholar] [CrossRef]
- Suh, S.-H.; Kim, H.-J.; Lee, D.-I.; Kim, T.-H. Geographical Characteristics of Raindrop Size Distribution in the Southern Parts of South Korea. J. Appl. Meteorol. Clim. 2021, 60, 157–169. [Google Scholar] [CrossRef]


| Site | Location | Altitude (m) | 1 min DSD Spectra | Location |
|---|---|---|---|---|
| Meixian | 24.3°N, 116.1°E | 89.3 | 63,777 | Leeward |
| Haifeng | 23.0°N, 115.3°E | 5.7 | 54,296 | Windward |
| Luoding | 22.7°N, 111.6°E | 57.8 | 58,170 | Leeward |
| Enping | 22.3°N, 112.2°E | 25.4 | 78,710 | Windward |
| Xuwen | 20.3°N, 110.2°E | 69.0 | 34,079 | Leeward |
| Qingyuan | 23.7°N, 113.1°E | 19.4 | 75,370 | Windward |
| Station | Rain Type | Sample | Dm (mm) | log10Nw (m−3 mm−1) | R (mm h−1) | LWC (g m−3) |
|---|---|---|---|---|---|---|
| Meixian | C * | 2280 | 2.18 | 3.65 | 37.43 | 1.52 |
| S * | 9161 | 1.31 | 3.53 | 1.84 | 0.11 | |
| Haifeng | C | 2245 | 2.34 | 3.61 | 44.69 | 1.79 |
| S | 7524 | 1.32 | 3.54 | 1.86 | 0.11 | |
| Luoding | C | 2351 | 2.27 | 3.74 | 52.27 | 2.11 |
| S | 8619 | 1.37 | 3.44 | 1.87 | 0.11 | |
| Enping | C | 4235 | 2.19 | 3.69 | 41.51 | 1.70 |
| S | 10,157 | 1.45 | 3.34 | 1.94 | 0.11 | |
| Xuwen | C | 1634 | 2.26 | 3.72 | 47.39 | 1.90 |
| S | 4273 | 1.42 | 3.34 | 1.86 | 0.11 | |
| Qingyuan | C | 4112 | 2.43 | 3.55 | 48.87 | 1.91 |
| S | 10,683 | 1.43 | 3.34 | 1.60 | 0.11 | |
| All | C | 2809 | 2.28 | 3.67 | 45.36 | 1.82 |
| S | 8402 | 1.38 | 3.42 | 1.83 | 0.11 |
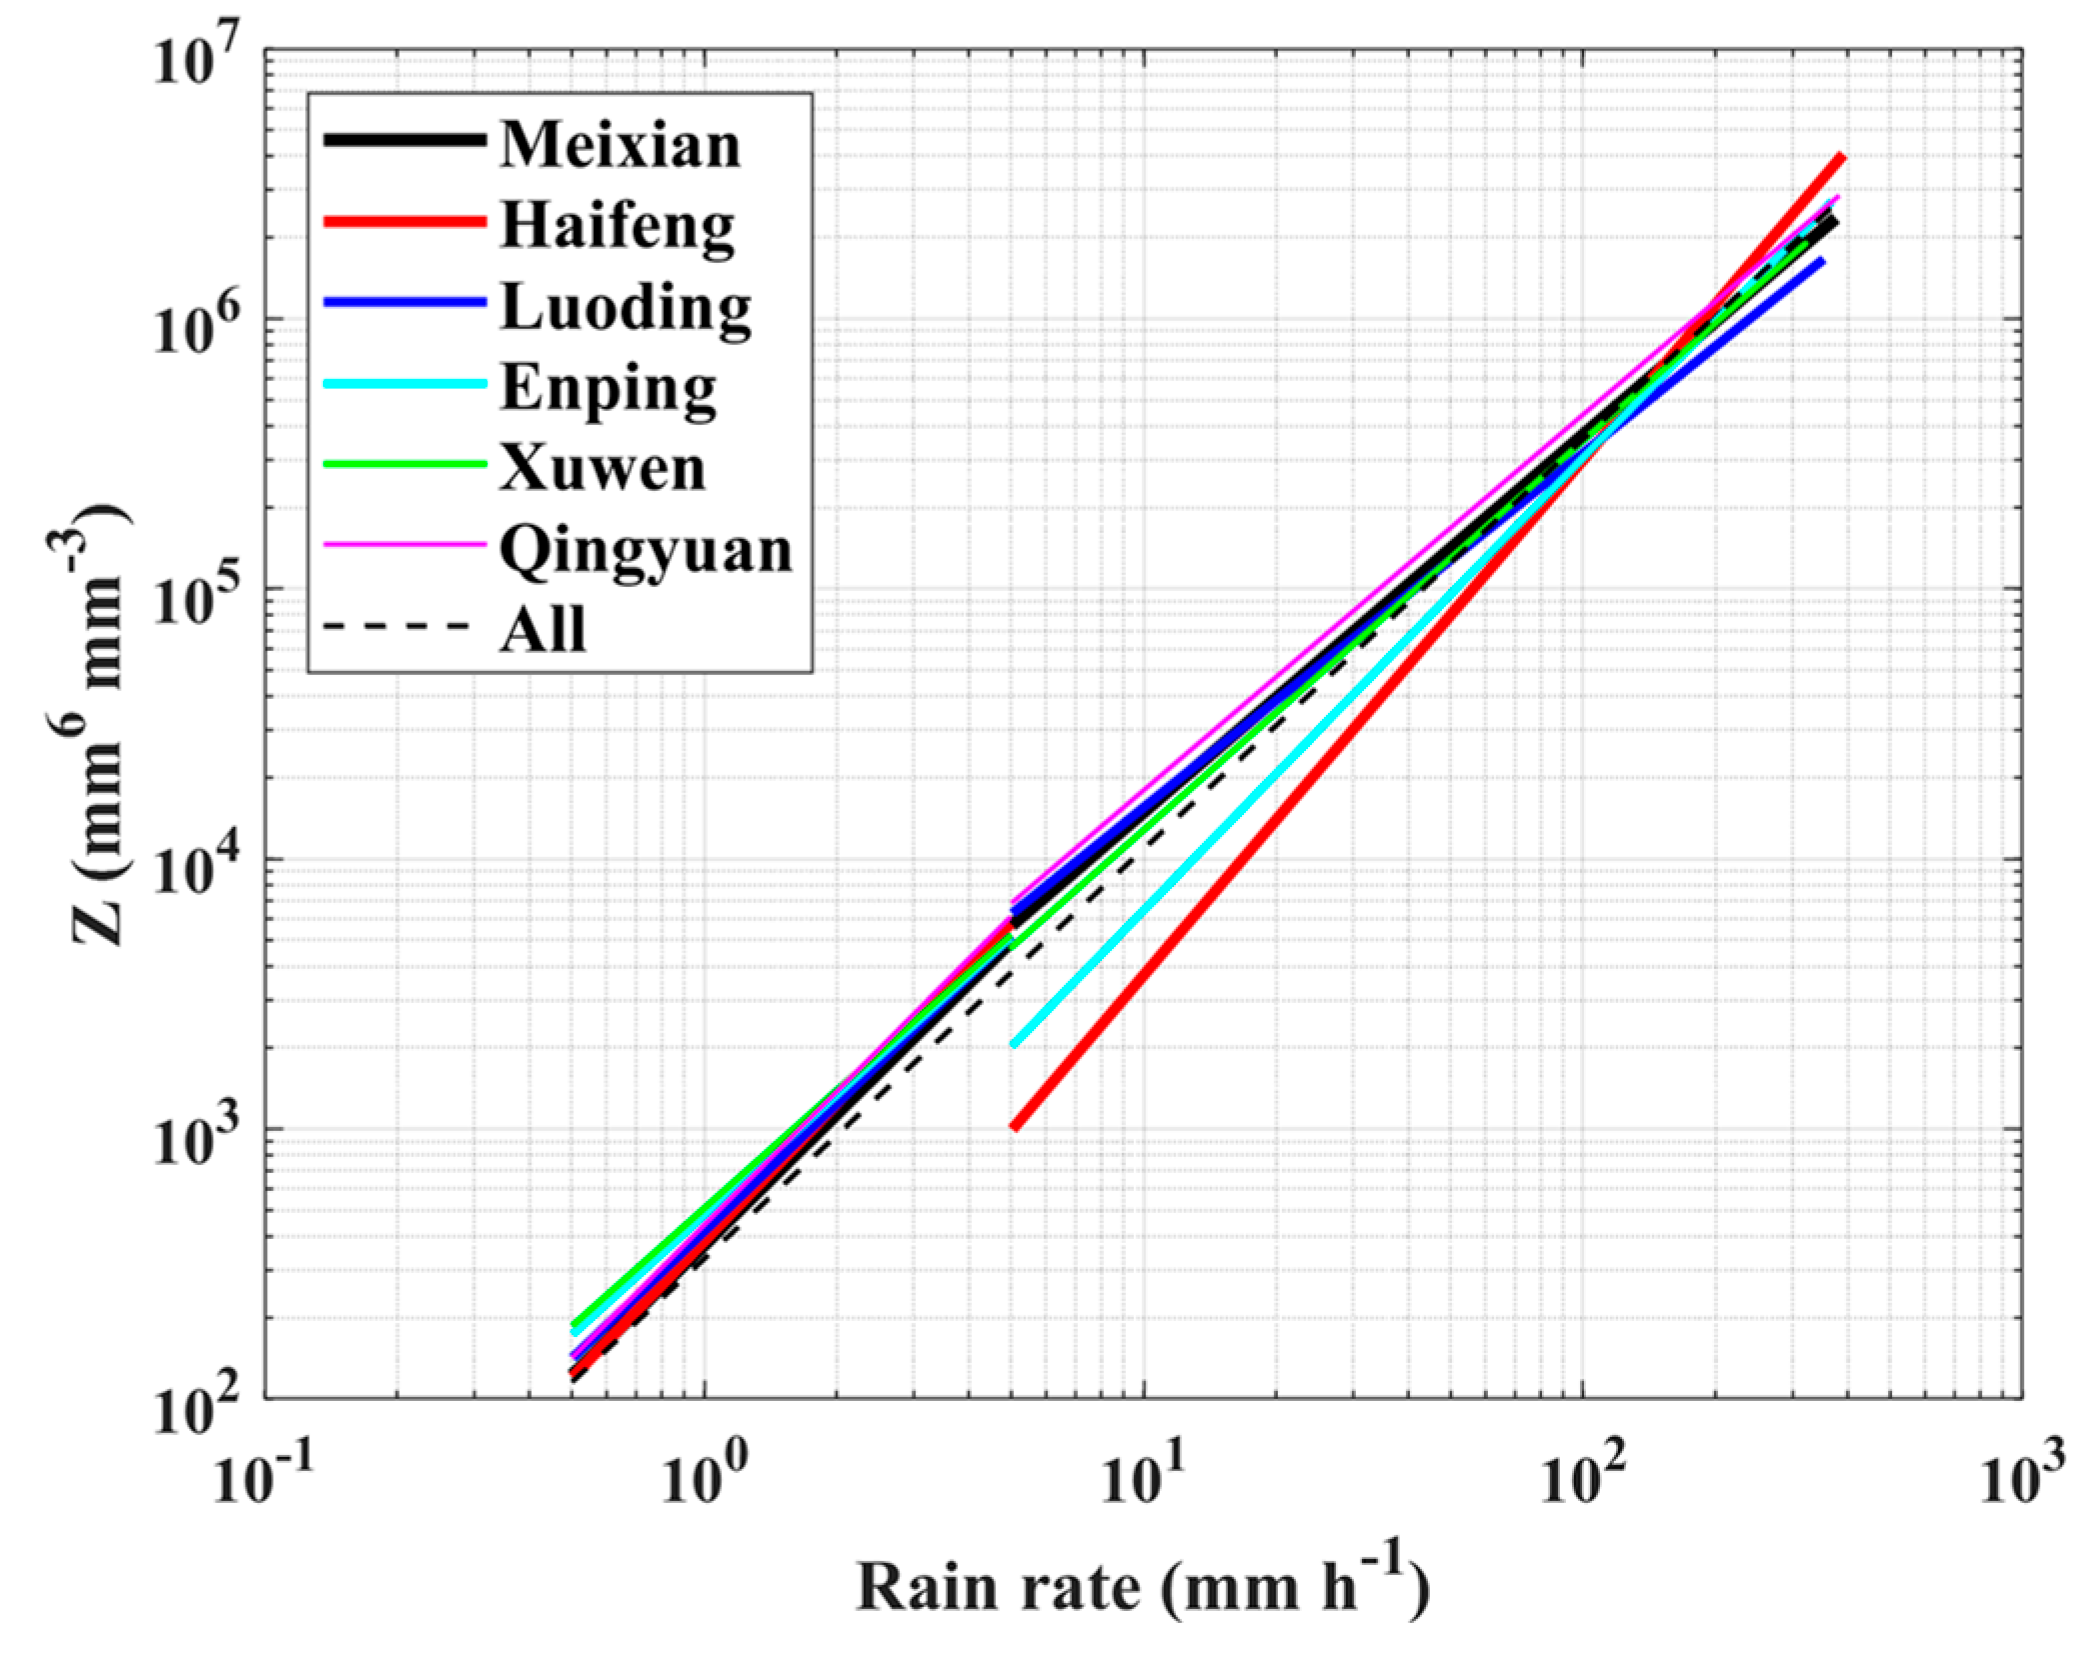
| Site | Z–R Relationship | ||
|---|---|---|---|
| Stratiform | Convective | All Rainfall | |
| Meixian | |||
| Haifeng | |||
| Luoding | |||
| Enping | |||
| Xuwen | |||
| Qingyuan | |||
| All | |||
Disclaimer/Publisher’s Note: The statements, opinions and data contained in all publications are solely those of the individual author(s) and contributor(s) and not of MDPI and/or the editor(s). MDPI and/or the editor(s) disclaim responsibility for any injury to people or property resulting from any ideas, methods, instructions or products referred to in the content. |
© 2023 by the authors. Licensee MDPI, Basel, Switzerland. This article is an open access article distributed under the terms and conditions of the Creative Commons Attribution (CC BY) license (https://creativecommons.org/licenses/by/4.0/).
Share and Cite
Zhang, A.; Chen, C.; Wu, L. Regional Variability of Raindrop Size Distribution from a Network of Disdrometers over Complex Terrain in Southern China. Remote Sens. 2023, 15, 2678. https://doi.org/10.3390/rs15102678
Zhang A, Chen C, Wu L. Regional Variability of Raindrop Size Distribution from a Network of Disdrometers over Complex Terrain in Southern China. Remote Sensing. 2023; 15(10):2678. https://doi.org/10.3390/rs15102678
Chicago/Turabian StyleZhang, Asi, Chao Chen, and Lin Wu. 2023. "Regional Variability of Raindrop Size Distribution from a Network of Disdrometers over Complex Terrain in Southern China" Remote Sensing 15, no. 10: 2678. https://doi.org/10.3390/rs15102678