Article

Diurnal Variation Characteristics of Clouds and Precipitation during the Summer Season in Two Typical Climate Regions of the Tibetan Plateau

1
State Key Laboratory of Severe Weather, Chinese Academy of Meteorological Science, Beijing 100081, China
2
University of Chinese Academy of Sciences, Beijing 100049, China
3
Key Laboratory of Mesoscale Severe Weather/MOE, School of Atmospheric Sciences, Nanjing University, Nanjing 210023, China
*
Author to whom correspondence should be addressed.
Remote Sens. 2023, 15(15), 3731; https://doi.org/10.3390/rs15153731
Submission received: 13 June 2023 / Revised: 17 July 2023 / Accepted: 25 July 2023 / Published: 27 July 2023
(This article belongs to the Special Issue Remote Sensing of Clouds and Precipitation at Multiple Scales II)

Abstract

:
Mêdog and Nagqu are two typical climate regions of the Tibetan Plateau, with different atmospheric conditions and local orography. This may lead to different diurnal variation patterns of clouds and precipitation. This paper investigates the diurnal variations of clouds and precipitation in Mêdog and Nagqu, using ground-based measurements from Ka-band cloud radar and a Particle Size and Velocity (PARSIVEL) disdrometer. High frequencies of cloud cover and precipitation occur from 23:00 local solar time (LST) to 05:00 LST in Mêdog, while low frequencies appear from 11:00 LST to 17:00 LST. The occurrence frequencies in Nagqu maintain high values from 13:00 LST to 21:00 LST. In terms of mean rain rate, heavier rainfall appears in the evening and at night in Mêdog, with peaks at 00:00 LST and 18:00 LST, respectively. In Nagqu, the heaviest rainfall occurs at 12:00 LST. In addition, the afternoon convective rainfall in Nagqu is characterized by a much higher concentration of large drops, which can be classified as continental-like. The morning rainfall has the lowest concentration of large drops and can be classified as maritime-like. Finally, the mechanisms of diurnal variations in the two regions are discussed. The diurnal cycle of clouds and precipitation in Mêdog may be associated with the nocturnal convergence of moisture flux and mountain–valley wind circulation. Diurnal variations in Nagqu have a high correlation with the diurnal cycle of solar radiation. The high nocturnal frequency of clouds and precipitation in the two regions at night is closely related to the convergence of moisture flux.

1. Introduction

The Tibetan Plateau (TP) has the highest altitude in the world, with an average elevation of more than 4000 m. Several important rivers in Asia such as the Yangtze, Yellow, Yarlung Zangbo, Indus, and Mekong Rivers originate from the TP. Thousands of lakes and glaciers and rich atmosphere water storage make the TP known as “the roof of the world” and “the water tower of Asia” [1]. Clouds and precipitation over the TP have a significant impact on global energy balances and the hydrologic cycle [1,2]. Cloud base heights (CBHs), cloud top heights (CTHs), cloud layer thicknesses and other cloud vertical structures (CVSs) play significant roles in determining the radiation effects of clouds [3]. Clouds and precipitation over the TP not only show an obvious seasonal variation, but also are characterized by a prominent diurnal cycle [4,5,6]. Diurnal variation is one of the most important components of CVSs and DSDs characteristics, and is usually associated with terrain and atmospheric dynamics [7,8]. Therefore, investigation of the diurnal variation characteristics of clouds and precipitation in different regions of the TP is crucial to improve the understanding of the unique climate over the TP and the linkage between synoptic conditions and local circulations. Previous studies based on the observations from satellites have revealed a series of valuable features of diurnal variation in CVSs and precipitation over the TP and its surrounding regions [8,9,10]. Using the Clouds and the Earth’s Radiant Energy System (CERES) data, Chen et al. [8] investigated diurnal variations in clouds and radiation budgets over four subareas of the TP during summer, and found that the total cloud amount is larger during daytime than nighttime over the TP. Based on Tropical Rainfall Measuring Mission (TRMM) precipitation radar (PR) data over the TP, Fu et al. [9] reported that precipitation occurred frequently over the steep slope of the southern Himalayas, and the rain rate decreased with elevation. They also pointed out that both elevation and topography play important roles in the spatial distribution of precipitation. Based on the cloud data set of the International Satellite Cloud Climatology Project (ISCCP), Rüthrich et al. [10] reported that the peaks of cloud frequencies above the slopes occur during afternoon, whereas high cloud frequencies persist throughout the nights in the valleys over the TP.
Nevertheless, satellite observations lack fine time and spatial resolution, and encounter difficulties in penetrating low clouds [11,12,13]. Previous studies have shown that station observations indicate a different rainfall diurnal variation from satellite data over the southeastern TP. The discrepancy can be attributed to the fact that the latter underestimate nocturnal rainfall caused by the insensitivity of microwave radiation to non-ice particles [14,15]. Therefore, ground-based observations are necessary for the investigation of clouds and precipitation over the TP, as they can make up for the above limitations of satellites and offer a reference for the calibration and quality control of satellite observations [16,17]. However, the lack of remote sensing instrument limits the investigation of clouds and precipitation over the TP. To strengthen the comprehensive ground-based observations of the atmospheric elements over the TP, three Tibetan Plateau Atmospheric Scientific Experiments (TIPEXs) have been conducted since the late 1970s [17,18,19]. During these field campaigns, characteristics of clouds and precipitation have been investigated using ground-based observations over the TP. Especially, during TIPEX-III, which was launched in the summer of 2014, various instruments were deployed in Nagqu (31.48°N, 92.01°E), located in central TP, to observe high spatial–temporal vertical structures of clouds and precipitation [16]. These instruments included a Ka-band cloud radar, a Particle Size Velocity (PARSIVEL) optical disdrometer and other remote sensing equipment. Nagqu has an altitude of about 4500 m, and is characterized by a typical plateau mountain climate regime (Figure 1). In the summer season, convective processes frequently occur in Nagqu due to the active TP vortex [16]. Affected by the warm and wet water vapor brought by Indian Ocean monsoons, more than 80% of the annual precipitation in Nagqu is concentrated in summer [20,21]. In summer, the precipitation over Nagqu increases rapidly in the afternoon and reaches its diurnal maximum at around 19:00 LST, then gradually weakens and reaches its diurnal minimum in morning [22]. Chang and Guo [23] analyzed the vertical structure of convective clouds and the raindrop size distribution (DSD) characteristics in Nagqu, and demonstrated that the convective activities were the strongest at 17:00–18:00 LST. Chen et al. [20] noted that the DSDs of convective rain in Nagqu showed a distinct diurnal variation, whereas those of stratiform rain exhibited little diurnal variation. However, because of the complex topography, vast area, and special climate conditions over the TP, the measurements from a single station have a very poor spatial representativeness. Clouds and precipitation characteristics in more regions over the TP need to be investigated.
It has been recognized that the valley of the Yarlung Zangbo Grand Canyon (YZGC) in the southeast TP is the main channel of water vapor to the plateau [24,25]. The warm and humid air flowing from the Indian Ocean and the Bay of Bengal can go deep into the interior of the TP along this channel. The changes in water vapor transport and precipitation in this region can further affect the weather and climate over the TP and even the whole East Asia [1,26]. To investigate the reasons and related mechanisms of water resource changes in the YZGC due to climate warming, a field campaign focused on clouds and precipitation observations was established at Mêdog in 2019, as a part of the Second Tibetan Plateau Scientific Expedition and Research (STEP) project [27,28]. A Ka-band millimeter wave radar, a PARSIVEL disdrometer, a X-band array radar, and other remote sensing instruments were deployed at Mêdog National Climate Observatory (MNCO, 29.31°N, 95.32°E, 1305 m ASL) by the Chinese Academy of Meteorological Sciences (CAMS). Mêdog is located in front of the main water vapor channel of YZGC, with a complex mountain and valley terrain and a mean altitude of 1200 m ASL (Figure 1). Mêdog is characterized by a subtropical climate with an annual average temperature of 18 °C and an annual rainfall of about 2000 mm [29]. Based on the measurements collected from these remote sensors at MNCO, the seasonal variations in CVSs and DSD characteristics in Mêdog have been investigated [21,27,28,30].
Previously, ground-based observations and research on diurnal variations in clouds and precipitation have been conducted over the TP and other regions of the world. Using measurements of a ground-based dual-wavelength radar, Sakaeda et al. [31] investigated the diurnal cycle of rainfall over the tropical Indian Ocean. They also discussed the impact of the complex interactions between radiation, water vapor, and clouds on the diurnal variation in the rainfall. Zeng et al. [32] found significant diurnal variations in clouds and precipitation in the northwest of China. They mentioned the role of the topography and incoming solar radiation in driving the diurnal cycle of the clouds and precipitation. Kozu et al. [33] analyzed the seasonal and diurnal variations in DSD distribution at different stations in the Asian monsoon region. They also suggested that ocean–land contrast and topography effects are the results of pronounced diurnal variation in DSD. Based on rain gauge observations obtained from surface automatic weather stations, Li [34] reported different diurnal variation patterns of precipitation in different regions on the TP, which are closely related to local topography. The above results enhance our understanding of the diurnal variation characteristics of clouds and precipitation over the TP. Nevertheless, few studies of diurnal variation in CVS and DSD characteristics have been carried out over different regions of the TP based on ground-based remote sensing observations, especially in the YZGC water vapor transmission channel.
Mêdog and Nagqu are two typical climate regions of the TP. The former, located at the entrance of water vapor conduit, has a subtropical climate with a valley terrain. The latter, located in the water vapor downstream area, is characterized by a plateau mountain climate and a mean altitude of more than 4500 m ASL. These differences may result in evident discrepancies in the diurnal variations of the CVSs and DSDs between the two regions.
Therefore, the objective of this study is to investigate the discrepancies in the diurnal variations of the CVSs and DSDs between the water vapor upstream and downstream areas and the possible causative mechanisms. The CVS and DSD characteristics are derived from the in-situ measurements obtained by Ka-band cloud radars and PARSIVEL disdrometers in Mêdog and Nagqu. The findings of this study may deepen the understanding of the characteristics of climatology and water vapor transport in the two typical climate regions of the TP, and provide references to develop and improve the microphysical parameterization schemes used in numerical models suitable for the TP.

2. Instruments and Methodology

High-resolution measurements from Ka-band cloud radars and PARSIVEL disdrometers are used in the present study. The measurements in Mêdog were collected from July to August of 2019–2021 during the STEP field campaign, and the data of Nagqu were obtained from July to August of 2014–2015 during the TIPEX-III. The total numbers of radar reflectivity profiles were 439,170 in Mêdog and 828,367 in Nagqu, respectively. The numbers of measurement samples collected from the disdrometers in Mêdog and Nagqu are 168,295 and 140,434, respectively. The instrument failures and the power outage caused some scarcity of observations.
In addition, the downward surface shortwave radiation (DSSR) obtained from the CERES satellite inversion product (SYN1 deg) is used to estimate the difference in solar radiation between Mêdog and Nagqu. The temporal and spatial resolutions of the DSSR data are 1° × 1° with a 1 h interval. The data at the closest grid points from Mêdog and Nagqu are selected and averaged during the same periods as the ground-based observations. The diurnal variations in the moisture flux divergence over the two regions for the radar and disdrometer-measured time series are analyzed by using the European Centre for Medium-Range Weather Forecasts (ECMWF) Reanalysis version 5 (ERA-5) data on 0.25° × 0.25° grid with a 1 h interval [35]. Surface temperature, pressure and dew point temperature obtained from the data of the automated weather station (AWS) of the China Meteorological Administration (CMA) are used to calculate the LCLs in Mêdog and Nagqu. The 10 m wind speed and direction of AWS were also extracted for the analysis of mountain–valley wind circulation.

2.1. Ka-Band Cloud Radar

The CVSs over Mêdog and Nagqu were investigated based on reflectivity obtained from Ka-band cloud radar. Operating at 33.44 GHz (8.7 mm wavelength), the Ka-band cloud radar is generally able to penetrate almost all types of clouds except for heavy rain, and can detect most hydrometeor particulates in the atmosphere [36]. The ability of the Ka-band cloud radar to detect particles of clouds and weak precipitation has been proven in many previous studies [11,28,37,38,39]. The main technical parameters of the Ka-band cloud radar used in Mêdog and Nagqu are shown in Table 1. The Ka-band cloud radar is a polarimetric, solid-state, vertically directed Doppler radar. It can provide vertical profiles of radar reflectivity, Doppler velocity, velocity spectrum width and the linear depolarization ratio (LDR) of clouds and precipitation in the air.
Cloud radars usually detect both hydrometeor particles and non-hydrometeor targets suspended near surface layer such as insects, dust and bits of vegetation. The latter often cause low-level clutter and are mistaken as cloud echoes [37]. Compared with echoes from hydrometeor targets such as clouds and precipitation, the low-level clutter is characterized by a smaller reflectivity, a larger LDR and a lower height (generally less than 3 km) [28,38,40]. Therefore, a simple “Z-LDR double-threshold” method was used to eliminate the clutter [28,41]. In addition, the random noise and radial interference clutter are filtered using a 3 × 3 filtering window [28,41]. Based on the above quality control methods, most of the clutter can be filtered out. The remaining non-hydrometeor echoes are removed through a quality control process of cloud layers. We exclude the cloud layers with a thickness <210 m (seven radar range gates) or a cloud duration <80 s, which are considered negligible cloud layers. It is worth noting that in the presence of heavy rainfall, cloud radar may not be able to detect the cloud tops due to severe attenuation. This will result in the underestimating of the cloud top and cloud layer thickness of precipitating clouds [28].
In order to improve detection capability, the Ka-band cloud radar adopts high-sensitivity operational modes by utilizing a phase-coded pulse compression technique at higher heights. The technique results in range sidelobe artifacts, thereby causing the smearing of data, especially near regions of stronger echoes [37,42]. The sidelobe echo seriously affects the identification of cloud heights. We removed the sidelobe echoes following the threshold method proposed by Moran et al. [42].
Following previous studies [23,38,43,44], the bottom height and top height of cloud radar echoes were used to indicate CBH and CTH, respectively, considering only cloud radar observations are available. In this study, a minimum radar reflectivity threshold of −40 dBZ was used to distinguish hydrometeor echoes from clear sky, thus the CBH, CTH and number of cloud layers in each of the hydrometeor profiles were determined. Then, the derived cloud boundaries were quality-controlled by eliminating the cloud layers with small thickness and short duration, as mentioned above. Finally, the total numbers of hydrometeor profiles observed by cloud radar in Mêdog and Nagqu were 281,529 and 509,845, respectively.
Following Zheng et al. [38], if the CBH is lower than the mean lifting condensation level (LCL) and the mean radar reflectivity from the ground to the 10th range gate is greater than −10 dBZ, the hydrometeor profile can be judged as a precipitating profile. The average LCLs during cloud radar observation periods in Mêdog and Nagqu are calculated based on the AWS data according to the empirical relationship proposed by Barnes [45]. The average LCLs in Mêdog and Nagqu are 243 m and 844 m AGL, respectively.

2.2. PARSIVEL Disdrometer

The DSD data in Mêdog and Nagqu were collected using a PARSIVEL disdrometer. Due to the high-temporal-resolution measurements of DSDs, the PARSIVEL disdrometer has been utilized in numerous studies for revealing the microphysical characteristics of precipitation in different regions [7,38,46,47]. The PARSIVEL disdrometer detects the diameter and velocity of hydrometeors based on the signal attenuation and the duration of particles passing through the sampling area. The sampling area was 54 cm2 and the temporal interval was 1 min. The hydrometeors diameter range of 0.062–24.5 mm and falling velocity range of 0.05–20.8 m s−1 were divided into 32 nonequidistant classes, respectively.
The first two size classes with low signal-to-noise ratio and the classes with sizes above 8 mm were excluded. Raindrops outside ±60% of the empirical fall velocity–diameter relationship proposed by Atlas et al. [48] were also removed. As suggested by Atlas et al. [48], to apply the empirical relationship to different levels, it should be multiplied by an air density modification coefficient. According to the coefficient values given by Atlas et al. [48] as a function of altitude, 1.04 and 1.20 were chosen for Mêdog and Nagqu, respectively. In addition, to reduce the sampling errors caused by insufficient original raindrops, 1 min samples with a rain rate less than 0.1 mm h−1 or a total particle count of less than 10 were rejected [49]. Finally, the numbers of DSD samples taken from the disdrometer in Mêdog and Nagqu used in this study are 44,620 and 13,383, respectively. Notably, limited by the performance of the PARSIVEL, the disdrometer underestimated the number of small drops, as reported by Chen et al. [20]. This may affect the spectral shape and DSD parameters to some extent.
Based on the raindrop size distribution obtained from disdrometer, the raindrop number concentration N(Di) (mm−1 m−3) in diameter class i can be calculated as follows:
N ( D i ) = j = 1 32 n i j A × V j × Δ t × Δ D i
where Di (mm) is the mean diameter for diameter class i, nij is the number of drops within the diameter class i and the velocity class j, Vj (m s−1) is the mean velocity for velocity class j, A (m2) is the sampling area (54 cm2 in this study), and Δt (s) is the sampling time interval (60 s in this study). Then, the rainfall rate R (mm h−1) was calculated as follows:
R = 6 π × 10 4 i = 1 32 j = 1 32 N ( D i ) D i 3 V j Δ D i
The normalized intercept parameter Nw (m−3 mm−1) and the mass-weighted mean diameter Dm (mm) are two key parameters in the normalized gamma distribution proposed by Willis [50]. Nw and Dm can reflect the concentration and mean size of rain drops, respectively. They can be obtained using the following equations [27]:
N w = 128 3 × M 3 5 M 4 4
D m = M 4 M 3
where the nth-order moment of the DSD, Mn, is defined as follows:
M n = i = 1 32 N ( D i ) D i n Δ D i

3. Diurnal Variation of Cloud Vertical Structures (CVSs)

3.1. Occurrence Frequency (OF)

The occurrence frequency of clouds in this study is defined as the ratio of the profile number of clouds to the total observed profile number. Table 2 lists the numbers of profiles and the occurrence frequency of clouds in Mêdog and Nagqu, where the cloud cover represents all cases of clouds, including precipitating clouds and non-precipitating clouds. The occurrence frequency of precipitating clouds in Mêdog (33.3%) was significantly higher than that in Nagqu (11.3%), suggesting that precipitation more frequently occurs in summer season at Mêdog. Large amounts of water vapor transported by the Indian monsoon in Mêdog are the result of a high occurrence frequency of rainfall. Figure 2 shows the diurnal variation in mean occurrence frequency of cloud cover, precipitating clouds, and non-precipitating clouds at Mêdog and Nagqu. Distinct diurnal variations in occurrence frequency of cloud cover can be noticed. A high (low) occurrence frequency of cloud cover occurred in nighttime (daytime) at Mêdog, while a high value of occurrence frequency lasted from the afternoon (e.g., 14:00 LST) to the early evening (e.g., 21:00 LST) at Nagqu. The diurnal curve of precipitating clouds in Mêdog is similar to that of cloud cover, and a high occurrence frequency appears between 23:00 LST and 05:00 LST. Nocturnal diurnal peaks of clouds and precipitation observed by satellites were also found in the southern part of Himalayas, which can be explained by the effects of monsoon flow and mountain–valley wind [51,52,53]. Although precipitating clouds in Nagqu showed a relatively lower occurrence frequency, they exhibited three peaks at 2:00 LST, 13:00 LST and 21:00 LST, respectively. The diurnal variation in the non-precipitating clouds in Mêdog is not as obvious as that of cloud cover and precipitating clouds. However, it also shows a decreasing trend after sunrise and an increasing trend after sunset, peaking in the early evening (e.g., 21:00 LST). In Nagqu, the diurnal variation in the non-precipitating clouds was significant and similar to that of cloud cover, with a diurnal maximum of occurrence frequency in the afternoon (e.g., 14:00 LST). The diurnal variation of cloud cover and precipitating clouds in Nagqu are consistent with previous studies using ground-based instruments [16,22,23] and satellites [54,55].

3.2. CBH, CTH and Cloud Layer Thickness

Figure 3 and Figure 4 show the diurnal cycles of frequency distributions of CTHs and CBHs in the two regions. CTH (CBH) samples are divided at 1 h time interval across a vertical resolution of 300 m. The frequency of each pixel in the figures is defined as the ratio of CTHs (CBHs) samples within the vertical distance and time interval to the total number of samples for the corresponding 1 h interval. It is evident that both the CTHs and CBHs in Mêdog exhibit a unimodal distribution, while those in Nagqu show a bimodal structure.
For non-precipitating clouds (Figure 3a,b), the CTHs in Mêdog occurred frequently at around 5 km AGL with higher occurrence frequency in daytime, while CTHs in Nagqu exhibited two peaks, with one at 3–4 km AGL and the other at 8–11 km AGL. In Nagqu, the CTH peak at the lower height remained roughly unchanged with time, whereas the other CTH peak at higher altitudes appeared more frequently from late afternoon to midnight (e.g., 15:00–02:00 LST) (Figure 3b). In terms of precipitating clouds, the CTHs in Mêdog mainly occurred above 5 km AGL, and the occurrence frequency showed a decreasing trend from midnight to afternoon, before increasing again after sunset (Figure 3c). The CTH distribution in Nagqu exhibited the highest height above 10 km AGL in late afternoon and a gradually decreasing height until noon (Figure 3d). It should be noted that the CTHs observed by the cloud radars in Mêdog and Nagqu may have been underestimated because of the attenuation caused by heavy rainfall [28].
Figure 4 gives the CBHs distributions of non-precipitating clouds in Mêdog and Nagqu. Considering the echo bottom of precipitation clouds is close to the ground, the CBHs of precipitating clouds are not shown. The CBHs of non-precipitating clouds in Mêdog concentrated at lower heights in afternoon, while they were dispersed at higher altitudes during night to early morning (Figure 4a). The diurnal variation in CBHs of non-precipitating clouds in Nagqu also shows a bimodal distribution characteristic, which is similar to the CTHs of non-precipitating clouds (i.e., Figure 3b). The two CBHs peaks appear at around 2–3 km AGL and 5–7 km AGL, respectively (Figure 4b).
Cloud layer thickness in this study is defined as the difference between CTH and CBH. Diurnal variations in cloud layer thicknesses in Mêdog and Nagqu are shown in Figure 5. Non-precipitating clouds are thin both in Mêdog and Nagqu, with an average thickness of less than 2 km. The cloud layer thickness of non-precipitating clouds in Mêdog showed two peaks, with one peak at 16:00 LST and the other at 21:00 LST, while Nagqu exhibited a unimodal feature, peaking at 17:00 LST (Figure 5a,b). Thinner non-precipitating clouds usually appeared in the morning in the two regions. For the precipitating clouds in Mêdog, different from non-precipitating ones, low thickness values appeared in the evening (Figure 5c). The attenuation of radar echo caused by the strong rainfall may be responsible for the presence of thinner clouds from evening to early morning in Mêdog. Nagqu showed thicker non-precipitating and precipitating clouds in the late afternoon and thinner clouds in the morning (Figure 5b,d). In the case of precipitating clouds, the average thickness of precipitating clouds reached up to 5 km and 6 km in Mêdog and Nagqu, respectively, probably indicating stronger convective activity in Nagqu. Of note is the fact that the CBHs detected by cloud radar were close to the ground, which may have caused the overestimate of cloud layer thickness [28].

3.3. Radar Echoes

In order to improve the understanding of the diurnal variation characteristics of clouds and precipitation in Mêdog and Nagqu, the occurrence frequencies of Ka-band cloud radar echoes were calculated every 60 s with a vertical resolution of 30 m (Figure 6). Only echoes with reflectivity higher than −40 dBZ were counted, considering the threshold was used to distinguish hydrometeor echoes from clear sky in this study. The frequency at each pixel in Figure 6 is defined as the ratio of the number of profiles with reflectivity >−40 dBZ to the total number of profiles. It can be seen from Figure 6 that the frequency distribution of radar echo in Mêdog and Nagqu had prominent diurnal variation during summer seasons. Radar echoes occurred more frequently at night than in daytime in Mêdog. The radar echoes were mainly distributed below 7 km AGL, above which radar echoes occasionally occurred (Figure 6a). This may indicate weak convective activity in Mêdog. The diurnal variation in frequency distribution of radar echo in Nagqu is obviously different from that in Mêdog. The frequency of high-level echo increased rapidly in the afternoon, and then declined slowly from the evening to the morning (Figure 6b). This is consistent with the diurnal variation in the cloud top over the center TP based on satellite data [56]. The rapid increase in high-level echo from afternoon to evening at Nagqu may be associated with the formation of convective activity due to strong surface heating.
Figure 7 shows the average profiles of radar reflectivity factors in four periods of the day (i.e., 00:00–06:00 LST, 06:00–12:00 LST, 12:00–18:00 LST, and 18:00–24:00 LST). To eliminate the error caused by scarce samples, the minimum number of samples at each height was limited by 0.2 ‰ of the total number of profiles. In Mêdog, the diurnal difference in the reflectivity factor profiles at lower altitudes is not obvious, which may be associated with the small influence of solar radiation and weak convective activity in this area, where continuous and stable stratiform precipitating clouds are dominant. At higher altitudes (e.g., above melting layer height of about 4 km AGL), the average reflectivity during 18:00–24:00 LST was the largest, followed by 12:00–18:00 LST, and that during 00:00–12:00 LST was the smallest. It is noted that attenuation resulted in the significant underestimation of reflectivity during nighttime (18:00–24:00 LST and 00:00–06:00 LST), due to the frequent occurrence of rain. In Nagqu, the average reflectivity showed a prominent diurnal variation, which may be partly related to the lower melting layer height (i.e., about 1.0 km AGL). In general, the average radar reflectivity during 12:00–18:00 LST was the strongest, followed by 18:00–24:00 LST, while that during 00:00–12:00 LST was the smallest.

4. Diurnal Variation of Precipitation

4.1. Rain Rate and Occurrence Frequency

Rain rate and occurrence frequency can reflect the characteristics of weather, climate, and water vapor transport in the regions. Rain rate in this study is calculated using Equation (2) from DSD data collected by PARSIVEL disdrometer. To better understand the diurnal variation in precipitation, DSD samples have been divided into five rain rate class (0.1 mm h−1R < 1 mm h−1, 1 mm h−1R < 2 mm h−1, 2 mm h−1R < 5 mm h−1, 5 mm h−1R < 10 mm h−1, and R > 10 mm h−1), following Tokay and Short [57]. The rainfall samples of the five classes in Mêdog/Nagqu are 26,084/6656, 8899/2713, 7549/2852, 1663/675 and 425/262, respectively. Figure 8 shows the diurnal variations of mean rain rate and the relative contribution of each rainfall rate class to the cumulative rainfall. The rain rate in Figure 8a was calculated by averaging the 1 min precipitation samples in an hour interval. In general, the mean rain rate in Nagqu (1.90 mm h−1) was higher than that in Mêdog (1.48 mm h−1), although Mêdog showed a much greater rainfall total. Specifically, the rain rate was higher at Nagqu than at Mêdog in the afternoon and evening, except for 00:00 LST, and was comparable in the morning. Nagqu exhibited more evident precipitation diurnal variation. Heavier precipitation occurred in the afternoon and evening, with a diurnal peak at 12:00 LST. In Mêdog, higher rain rates appeared in the evening and night, with the two diurnal peaks at 00:00 LST and 18:00 LST, respectively. In terms of the relative contribution of each rainfall rate class to rainfall amounts (Figure 8b,c), the third rain rate class (2 mm h−1 < R < 5 mm h−1) was the preponderant contributor in Mêdog, except for several hours at night (e.g., 18:00, 22:00, and 00:00 LST). The contribution of heavy rainfall with a rain rate greater than 10 mm h−1 was significant at night, and especially up to 50% at 18:00 LST. In Nagqu, the third rain rate class was the most important contributor to morning and night rainfall, whereas heavy rainfall was a dominant contributor to afternoon rainfall.
To further investigate the diurnal variation characteristics of precipitation in Mêdog and Nagqu, DSD samples in this study are separated into stratiform and convective rain types based on the rainfall rate (R) and the standard deviation (STD) over ten consecutive 1 min DSD samples [58]. That is, a DSD sample is identified as convective rain if R > 5 mm h−1 and STD > 1.5 mm h−1, and stratiform rain is identified if STD ≤ 1.5 mm h−1. Figure 9 shows the diurnal variations of occurrence frequency of total precipitation, stratiform precipitation and convective precipitation calculated from DSD data with an hour interval in Mêdog and Nagqu. The occurrence frequency in each hour is defined as the ratio of precipitation samples to all DSD samples in this hour. For occurrence frequency of total precipitation (Figure 9a), the diurnal curves are similar to the observations of precipitation clouds from cloud radar (Figure 2b), although the frequencies are slightly different (possibly due to the definition of precipitation based on cloud radar). This similarity indicates a good consistency between disdrometer and cloud radar measurements. Mêdog showed a much higher daily mean frequency of 27% (marked by the red dashed line) than Nagqu, of about 10% (marked by the blue dashed line), during the summer season. The precipitation occurred frequently during midnight to early morning (i.e., 23:00–06:00 LST) with a diurnal maximum occurrence frequency of 39% at 02:00 LST in Mêdog, while the precipitation in Nagqu showed higher occurrence frequency in early afternoon (i.e., 12:00–13:00 LST) and at night (i.e., 22:00–05:00 LST). The occurrence frequency of stratiform precipitation showed a similar diurnal variation to the total precipitation (Figure 9b), which was due to the predominance of stratiform precipitation in the two regions. The convective precipitation in Mêdog mainly occurred at night between 22:00 and 02:00 LST, with a pronounced diurnal maximum at around 00:00 LST (2.95%) and a secondary diurnal peak at around 22:00 LST (1.99%), reflecting more favorable conditions for convection at nighttime (Figure 9c). In Nagqu, similar to the diurnal cycle of rain rate shown in Figure 8a, the convective precipitation usually occurred between 12:00 and 22:00 LST, with two diurnal peaks at 12:00 LST and 20:00 LST, respectively.

4.2. DSD Characteristics

In addition to rain rate and occurrence frequency, the microphysical characteristics of precipitation also exhibit typical diurnal variation [7,33,46]. DSD plays an important role in reflecting the fundamental microphysics of rainfall [20]. Previous studies have demonstrated that different precipitation types generally have different DSD characteristics [20,27,57,58]. To investigate the diurnal variation characteristics of DSD in Mêdog and Nagqu, the 1 min DSD samples were divided at 6 h intervals (00:00–06:00, 06:00–12:00, 12:00–18:00, and 18:00–24:00 LST) and then classified as stratiform and convective precipitation. The samples of convective rain and stratiform rain during the four periods are listed in Table 3. In Mêdog, convective rain samples at night (00:00–06:00 LST and 18:00–24:00 LST) were higher than those in daytime. In addition, convective rain during 18:00–24:00 LST was characterized by the highest mean rain rate of 13.68 mm h−1. In Nagqu, the convective rain samples at 12:00–18:00 LST and 18:00–24:00 LST were significantly higher than those at 00:00–06:00 LST and 06:00–12:00 LST. The heavier convective rain occurred in the afternoon, with the highest mean rain rate of 14.0 mm h−1.
The diurnal variations of DSD with a 6 h interval in Mêdog and Nagqu are depicted in Figure 10. The DSDs of convective and stratiform rain are quite different. It is obvious that the concentration of large raindrops in convective rain was higher than that in stratiform rain. In general, the diurnal variation in DSD of stratiform precipitation was negligible in Mêdog and Nagqu. This is consistent with earlier studies reporting that the seasonal and diurnal variations of DSD characteristics of stratiform precipitation in different regions are not significant [20,33]. For convective precipitation, the DSDs in the two regions show different diurnal variations. In Mêdog, the number concentration of large drops was highest in the evening (18:00–24:00 LST), followed by midnight to the early morning (00:00–06:00 LST), and lower in daytime (06:00–18:00 LST) (Figure 10a). In Nagqu, the highest concentration of large drops appeared in afternoon (12:00–18:00 LST), followed by the evening (18:00–24:00 LST). The curve of 06:00–12:00 LST is not smooth due to fewer convective rain samples during this period (only 47, Table 3). The concentration of smaller raindrops (D < 2 mm) was relatively lower in afternoon (12:00–18:00 LST) than in the other periods of the day (Figure 10b). In general, the spectral width of the DSDs and the concentration of large drops increased with the mean rate of convective rain (Table 3), which is consistent with the features found by Chen et al. [20] and Wang et al. [21].
To better understand the diurnal variations in DSD in the two regions, Figure 11 shows the distribution of the mean values of normalized intercept parameter, log10Nw (m−3 mm−1), and mass-weighted mean diameter, Dm (mm), during the four periods of a day. The two solid rectangles correspond to the maritime and continental convective populations reported by Bringi et al. [58], respectively. In general, Mêdog exhibited an insignificant diurnal variation in DSDs, whereas evident diurnal variation could be observed in Nagqu, especially for convective precipitation. In Mêdog, stratiform precipitation during the period of 00:00–06:00 LST had a slightly larger mean Dm value and lower Nw value than in the other periods of a day, which might be related to large snow particles with low density [58,59]. Convective precipitation is characterized by smaller Dm and higher Nw, which is close to the maritime-like convection precipitation proposed by Bringi et al. [58]. Relatively larger drop size strongly corresponded to the heavier rain rate and higher cloud top between 18:00 LST and 24:00 LST (Figure 8a and Figure 3c). In Nagqu, the stratiform precipitation exhibited slightly larger Dm and relatively lower Nw during 12:00–24:00 LST than during 00:00–12:00 LST. The convective clusters in the afternoon (12:00–18:00 LST) were expected to be prominently characterized by the largest Dm and the lowest Nw, compared to the other periods of a day, and should be classified as a continental-like population. However, the convective clusters in the early morning (00:00–06:00 LST) had the highest Nw and the smallest Dm, which is close to maritime-like convective precipitation.

5. Discussions

The obvious difference in diurnal variation of clouds and precipitation in Mêdog and Nagqu can provide a better understanding for the characteristics of atmospheric dynamics in the two typical regions over the TP. Previous studies have shown that the diurnal variation of clouds and precipitation is often associated with convergence of water vapor and geographical features [15,34,39].
Since the ascending motion induced by convergence is conducive to the condensation of water vapor, the occurrence frequency of clouds and precipitation is closely related to the divergence of water vapor. The diurnal variations in mean moisture flux divergence in Mêdog and Nagqu are calculated from ERA5 reanalysis data and shown in Figure A1. The convergence of water vapor (negative divergence values) near the surface can be seen from evening to early morning in Mêdog and Nagqu, which is probably responsible for the higher occurrence frequency of clouds and precipitation in this region (e.g., Figure 2a, Figure 6a and Figure 9a). Of note is the stronger convergence (smaller negative moisture flux divergence) layer that can be observed at the heights of 2.0–2.5 km in nocturnal hours at Mêdog. This may be attributed to the local strong updrafts owing to the interaction between convective activity and steep terrain [21]. In addition, convergence during nighttime is stronger in Mêdog than in Nagqu, which may be associated with the much higher occurrence frequency of clouds and precipitation in Mêdog than in Nagqu.
Mêdog is located at the entrance of the Yarlung Zangbo Grand Canyon, with a typical southeast–northeast-oriented valley terrain. Previous studies have shown that the topography-induced local thermal forcing (e.g., mountain–valley winds) may play a primary role in the diurnal variation in clouds and precipitation [51,52,53]. The diurnal cycles of the terrain-related mean surface wind vector, obtained from AWS, are provided in Figure A2. Figure A2a shows that the southwest wind prevails in Mêdog after sunrise, and northeast wind is predominant after sunset. This indicates a significant diurnal reversal of wind direction along the valley axis, suggesting evident mountain–valley wind. The sidewalls of the narrow valley in Mêdog may be responsible for the wind direction parallel to the valley axis [60]. It is worth noting that the wind speeds of the upslope flow during daytime are generally stronger than the downslope flow during nighttime. This asymmetry in the diurnal wind cycle is also found in other areas in the Himalayas, which is probably attributed to the southwest monsoon strengthening the upslope winds [51,53]. The interaction between the nocturnal downvalley winds and the climatic monsoon flow leads to the moisture flux convergence, tending to the formation and evolution of rain in the valley at night (e.g., Figure 8, Figure 9, Figure 10a, Figure 11a and Figure A2a). In addition, the cool outflow from thunderstorm generated over the mountain in the afternoon may enhance the downvalley winds [51].
Similar to Mêdog, the convergence of water vapor above ground in Nagqu occurs from evening to early morning; this corresponds to the period of a higher occurrence frequency of clouds (e.g., Figure 2 and Figure 6b), larger contributions of the weak rain rate category to rainfall totals (i.e., Figure 8c), and a higher frequency of stratiform rain (e.g., Figure 9b). Of note is that the higher occurrence frequency of clouds and precipitation in Nagqu (blue lines in Figure 2a and Figure 9a) also appears in the afternoon, which is not reflected by the moisture flux divergence. It is observed that the occurrence frequency of high cloudiness (>8 km AGL) rapidly increases in the afternoon (e.g., Figure 6b), the cloud top height develops up to more than 10 km AGL (e.g., Figure 3b,d), and the occurrence frequency and contributor of convective rain peak in the afternoon (e.g., Figure 8c and Figure 9c). This is related to the isolated short-term (e.g., life cycles less than half an hour) thermal convection bubbles occurring due to the increasing surface sensible heat flux after sunrise [22,23,34,61]. The reanalysis data with coarse space resolution of 0.25° × 0.25° and temporal interval of 1 h may struggle to capture the information of thermal convection bubbles. Convection over land is commonly considered to be the result of the solar heating of the surface, the turbulent transfer of heat and moisture, and other lifting conditions [62]. The total amount of radiation over the TP is the largest in the world, with an extreme area of super solar constant [63]. Figure A3 indicates that the downward surface shortwave radiation maximum in Nagqu (734 W m−2) is much greater than that in Mêdog (537 W m−2). Nagqu has a higher altitude of about 4500 m ASL; therefore, strong surface radiation heating could lead to the increase in atmospheric instability, which tends to trigger thermal convection in the afternoon. This may be closely related to the frequent convective activities and the peak in clouds and precipitation during the afternoon in Nagqu. In addition, different from Mêdog with obvious mountain–valley wind, the surface wind in Nagqu exhibits an irregular diurnal variation (Figure A2b).

6. Conclusions

The diurnal cycle of clouds and precipitation is a striking characteristic over the TP in the summer season. Mêdog and Nagqu, with different terrains and geographical locations, are two typical climatic regions over the TP. In this paper, we have analyzed the diurnal variations of clouds and precipitation in the two regions during summer based on ground-based measurements from Ka-band cloud radar and a PARSIVEL disdrometer. The possible mechanisms responsible for the diurnal variation discrepancies between the two regions are also elucidated. The major conclusions can be summarized as follows:
(1)
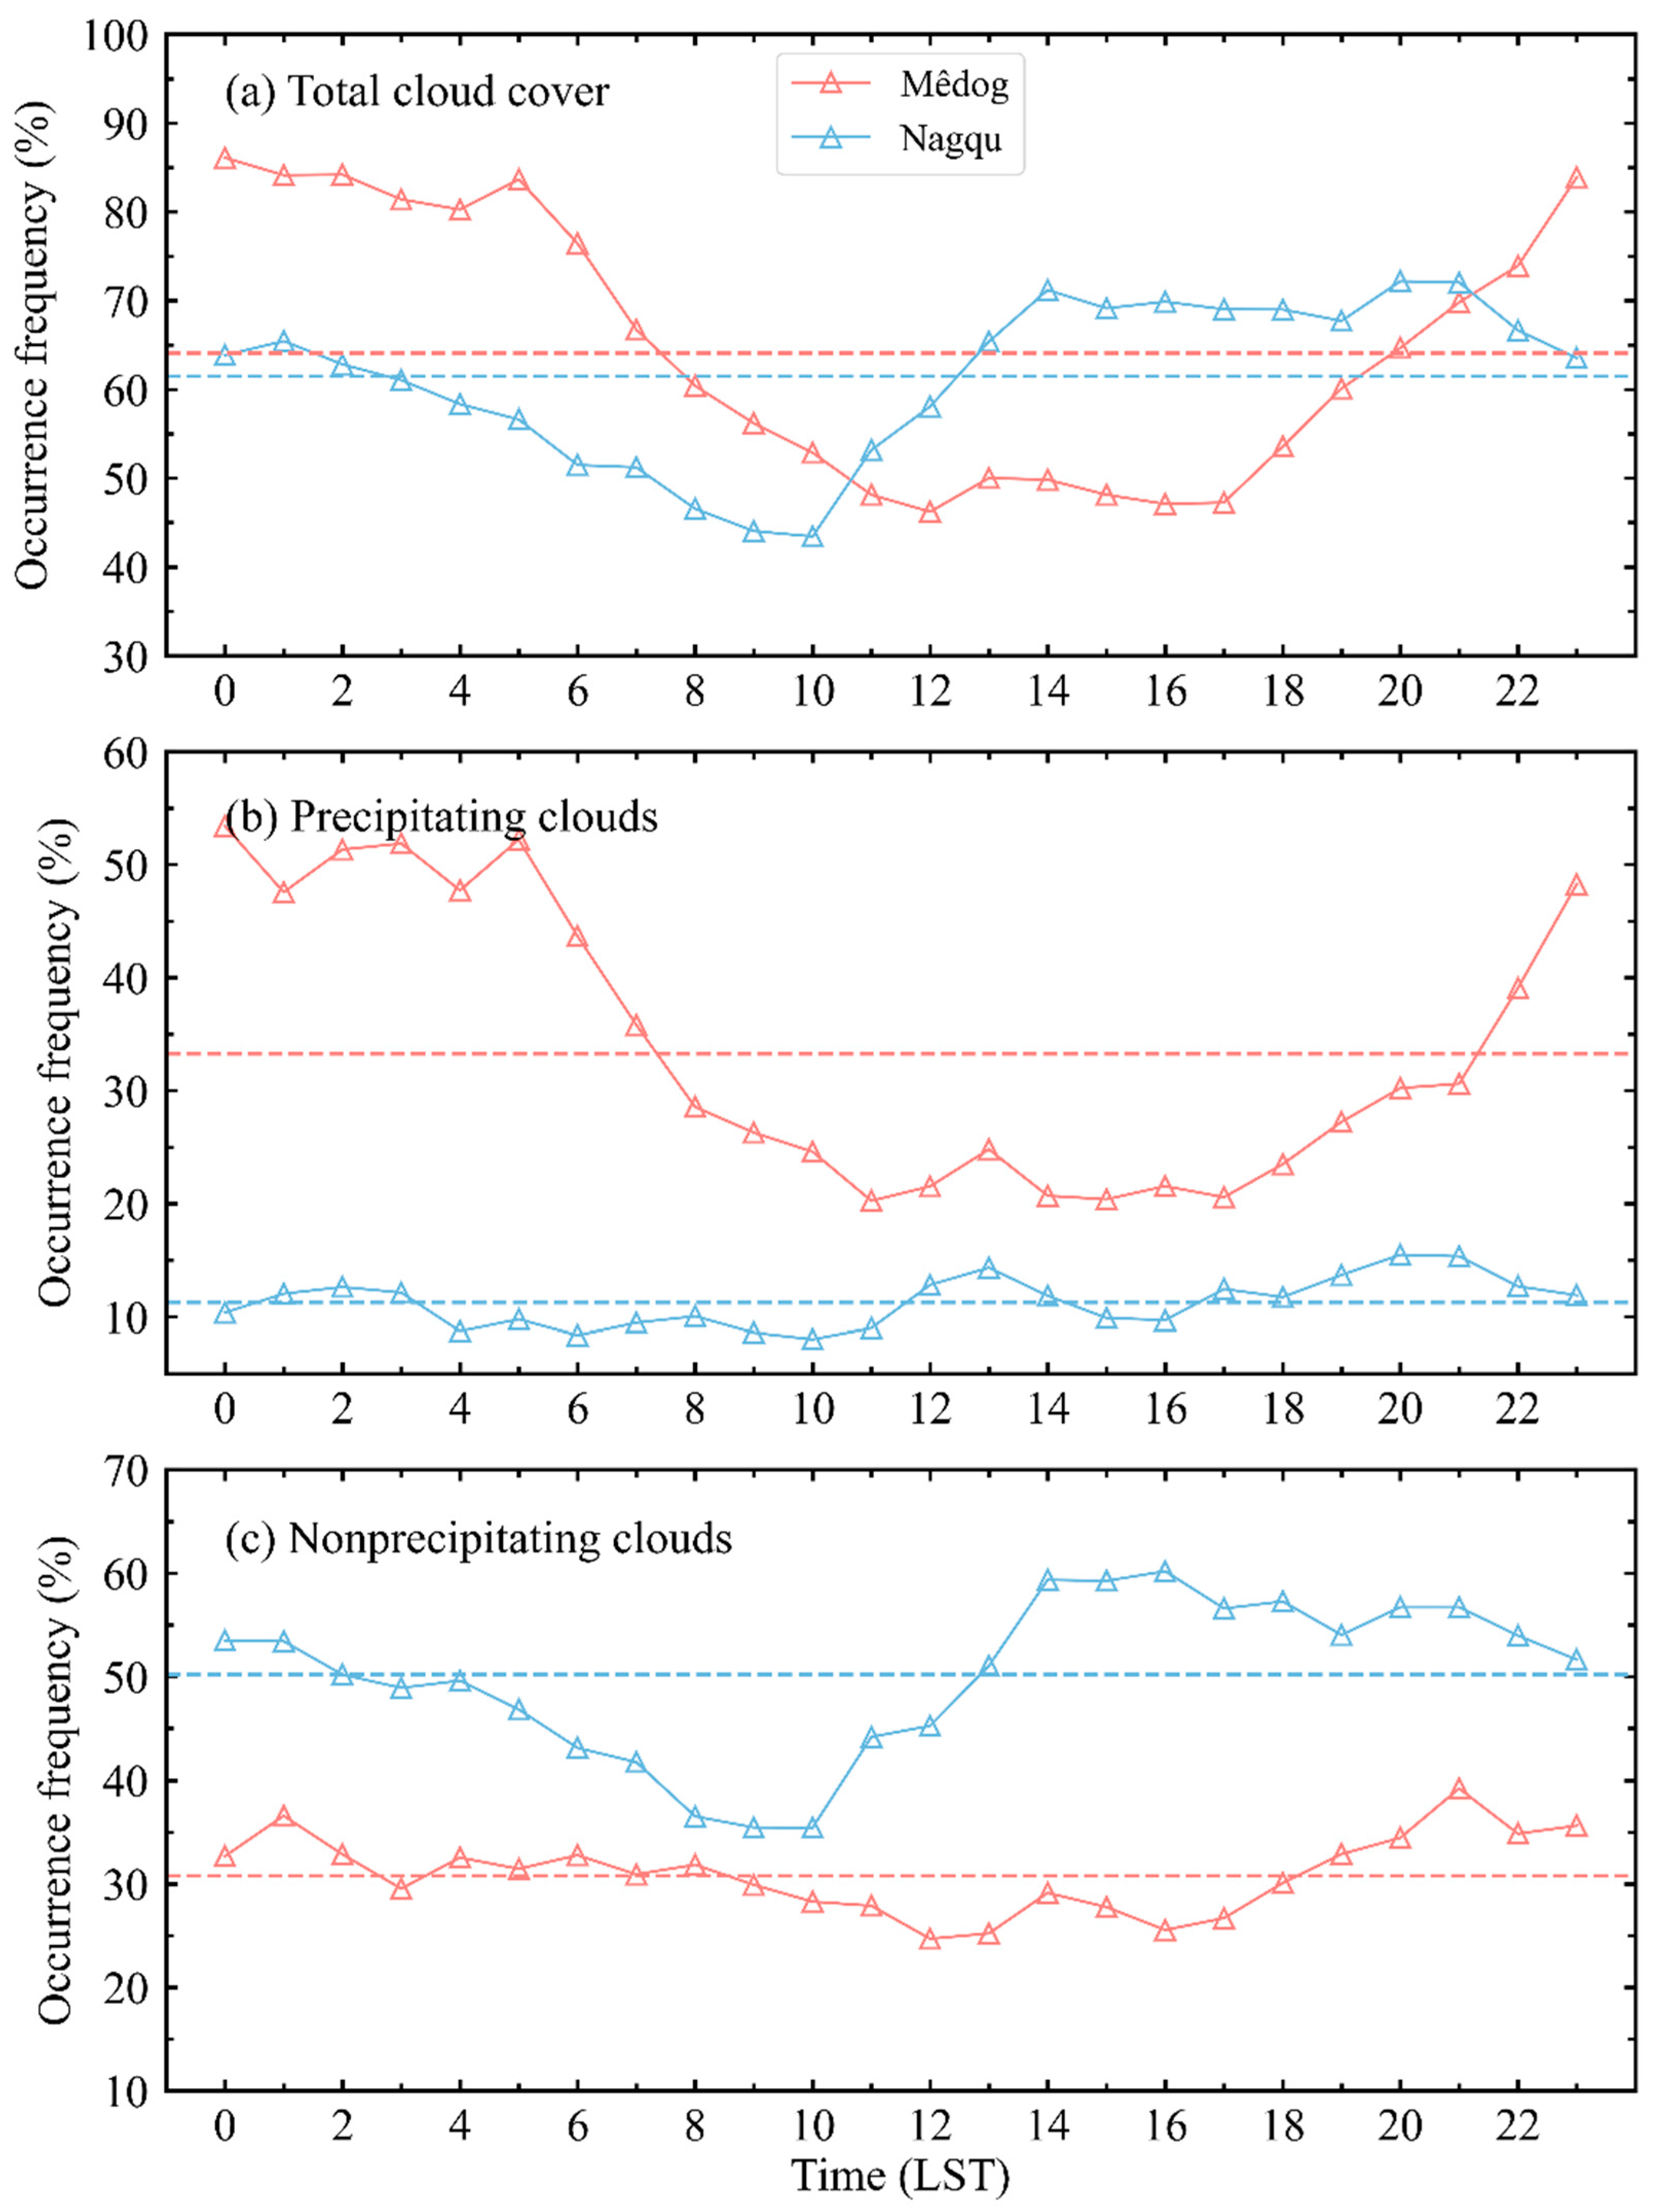
Cloud cover and precipitating clouds in Mêdog tend to form in the evening (e.g., 18:00–22:00 LST), occur frequently in the nighttime (e.g., 23:00–05:00 LST) and gradually dissipate in the daytime (e.g., 06:00–17:00 LST). The occurrence frequency of cloud cover in Nagqu increases around noon (e.g., 11:00–14:00 LST) and maintains a relatively higher occurrence frequency value from 14:00 to 21:00 LST, then gradually decreases during night and morning (e.g., 22:00–10:00 LST);
(2)
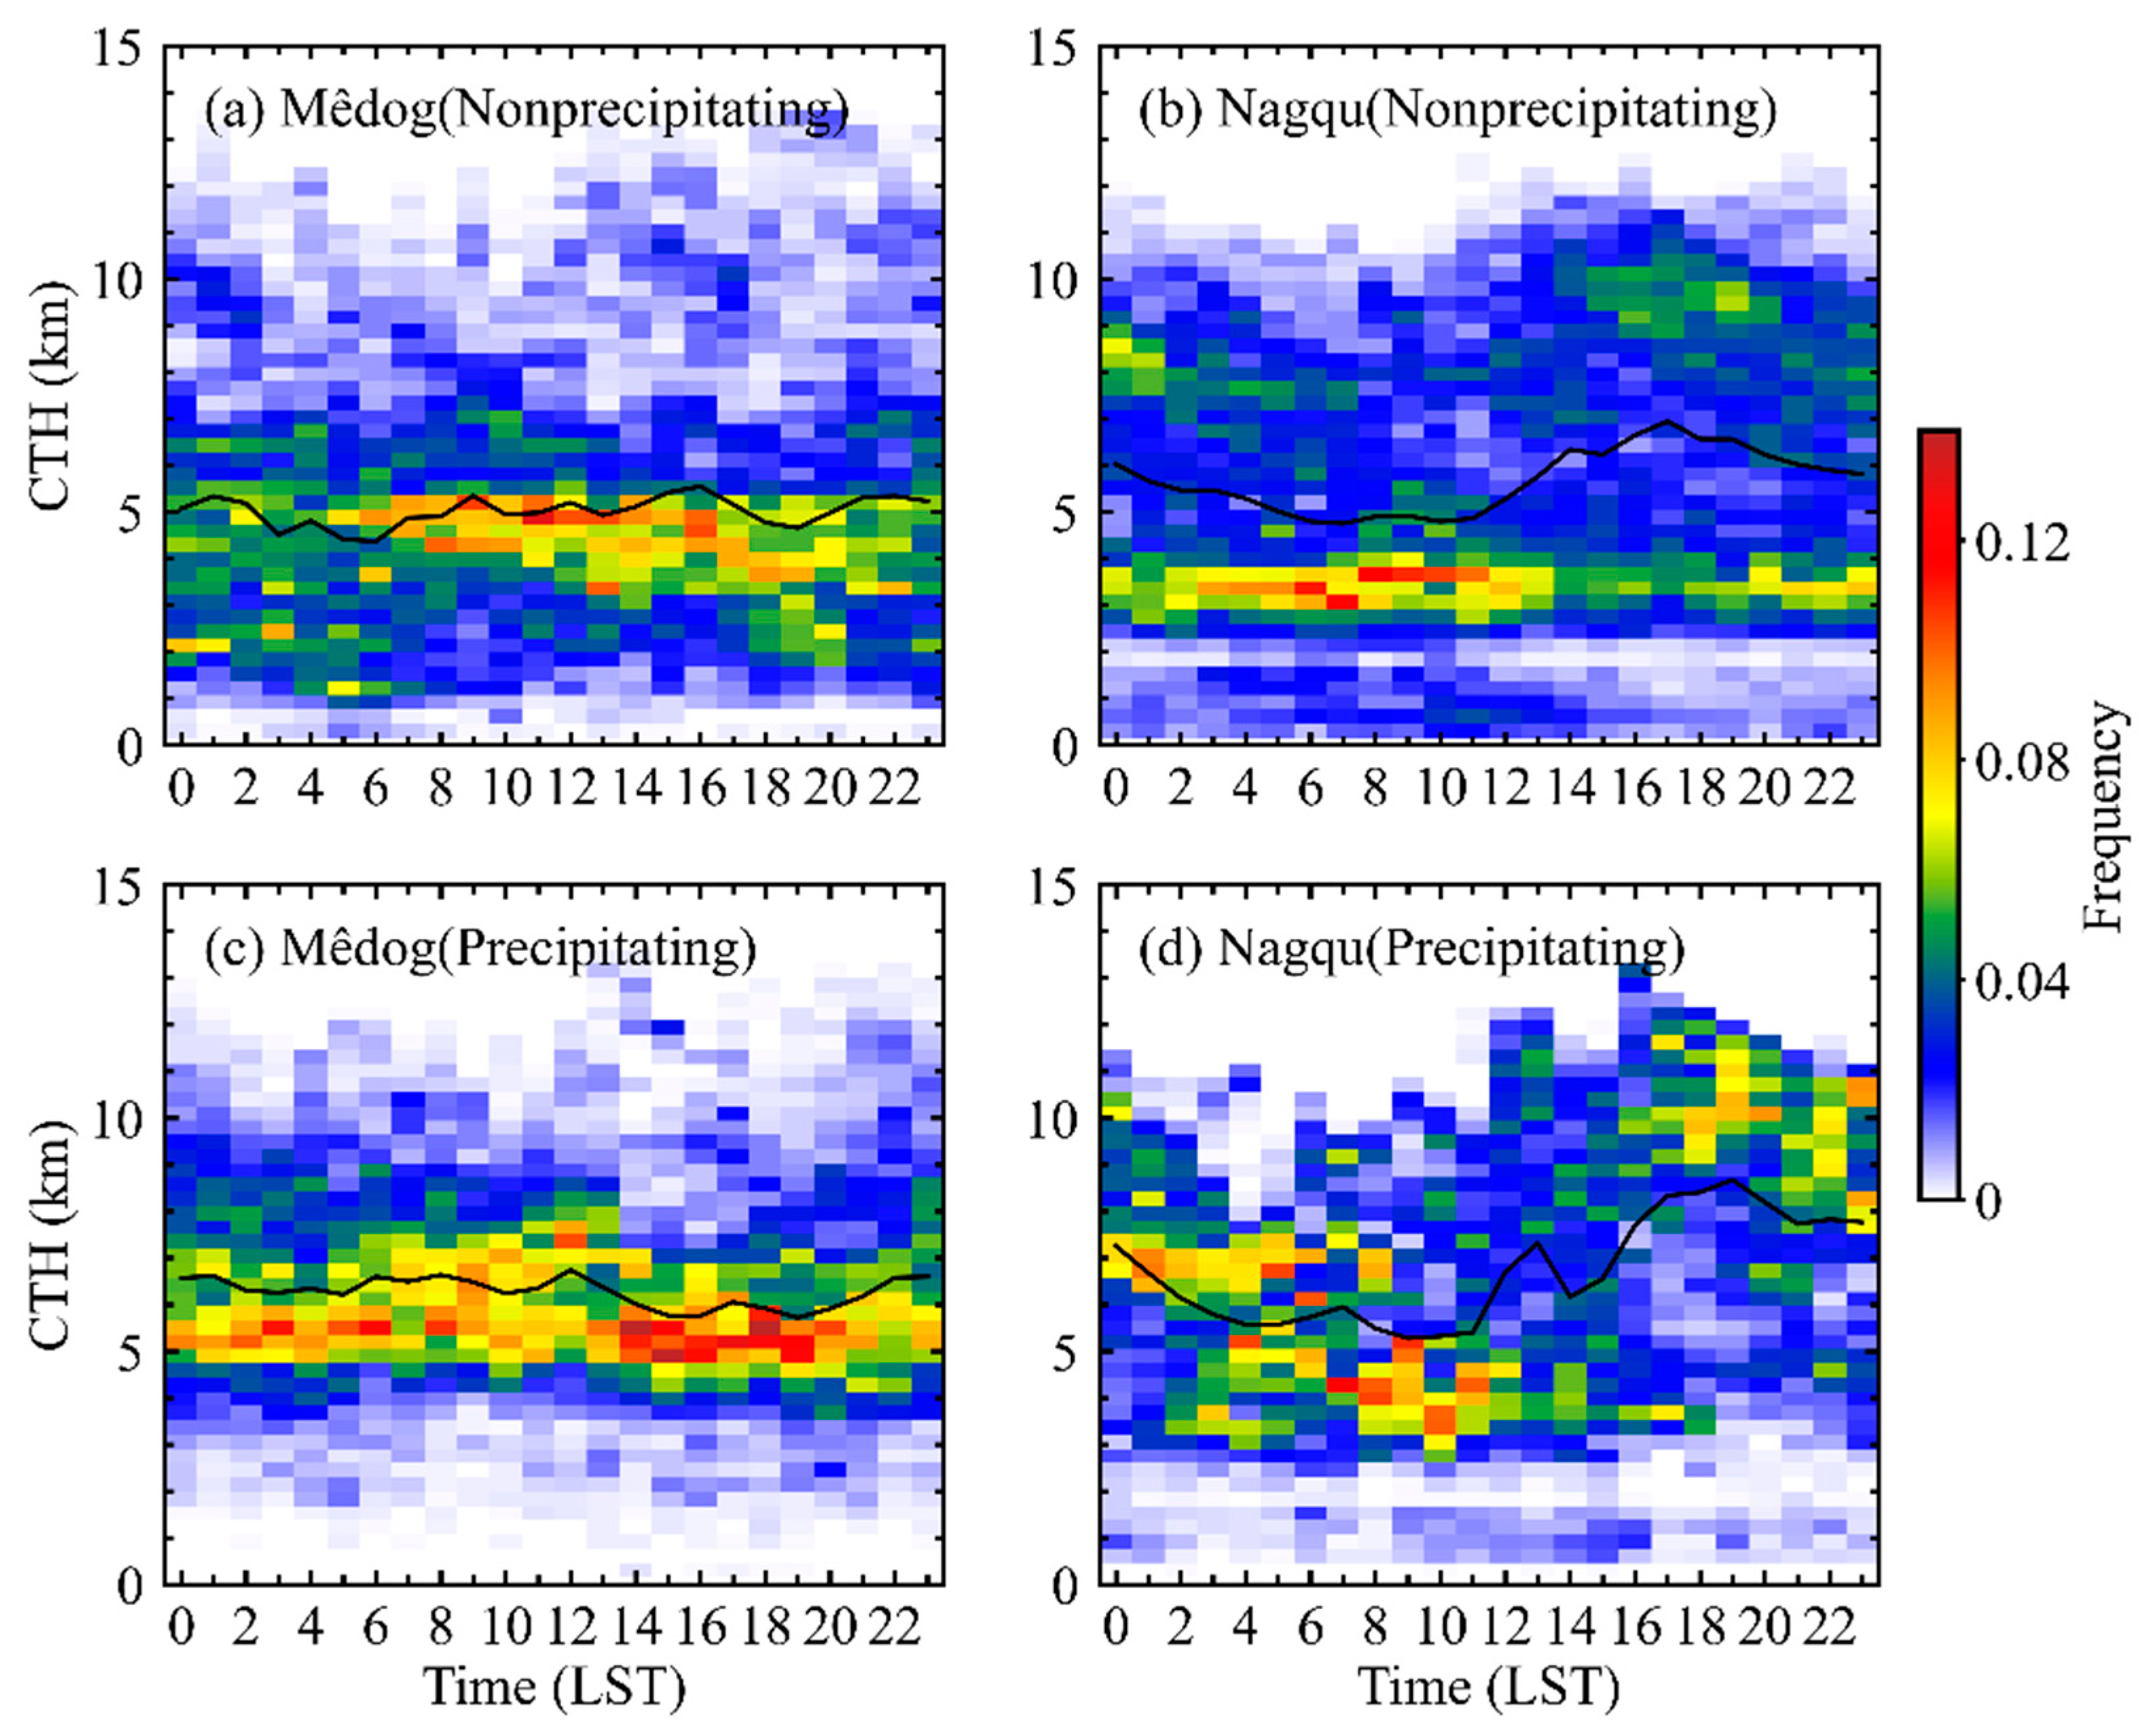
CTHs of non-precipitating clouds in Mêdog occur frequently at around 5 km AGL, whereas CTHs in Nagqu show two peaks, with one at 3–4 km AGL that is almost unchanged with time, and the other at 8–11 km AGL, which occurs more frequently at 15:00–02:00 LST. In terms of precipitating clouds, the CTHs in Mêdog mainly appear above 5 km AGL, and are much lower in the daytime (e.g., 09:00–20:00 LST) than in the nighttime (e.g., 21:00–08:00 LST). The CTH distribution in Nagqu exhibits the greatest height, above 10 km AGL, in late afternoon. The cloud layer thickness of non-precipitating clouds in Mêdog shows a bimodal structure, with one peak in late afternoon (e.g., 16:00 LST) and the other in the evening (e.g., 21:00 LST), while the cloud layer thickness of non-precipitating clouds in Nagqu shows a unimodal feature with a diurnal peak at 17:00 LST. The average profiles of radar reflectivity factors above the melting layer level (about 4 km AGL) in Mêdog show that the largest value appears during 18:00–24:00 LST and the smallest one occurs during 00:00–12:00 LST. In Nagqu, the average radar reflectivity during 12:00–18:00 (00:00–12:00) LST is the strongest (weakest);
(3)
The rain rate in Mêdog (Nagqu) peaks at 00:00 LST and 18:00 (12:00) LST. In Mêdog, the relative contribution of heavy rainfall (R > 10 mm h−1) to the cumulative rainfall is more significant at night (e.g., 18:00, 22:00, 00:00 LST), while in Nagqu, the heavy rainfall makes the largest contribution to the afternoon rainfall. For different precipitation types (cf. stratiform precipitation and convective precipitation), the stratiform precipitation is predominant in the two regions, and the diurnal variation in stratiform precipitation shows a similar pattern to that of total precipitation. The convective precipitation in Mêdog and Nagqu mainly occurs at 22:00–02:00 LST and 12:00–22:00 LST, respectively;
(4)
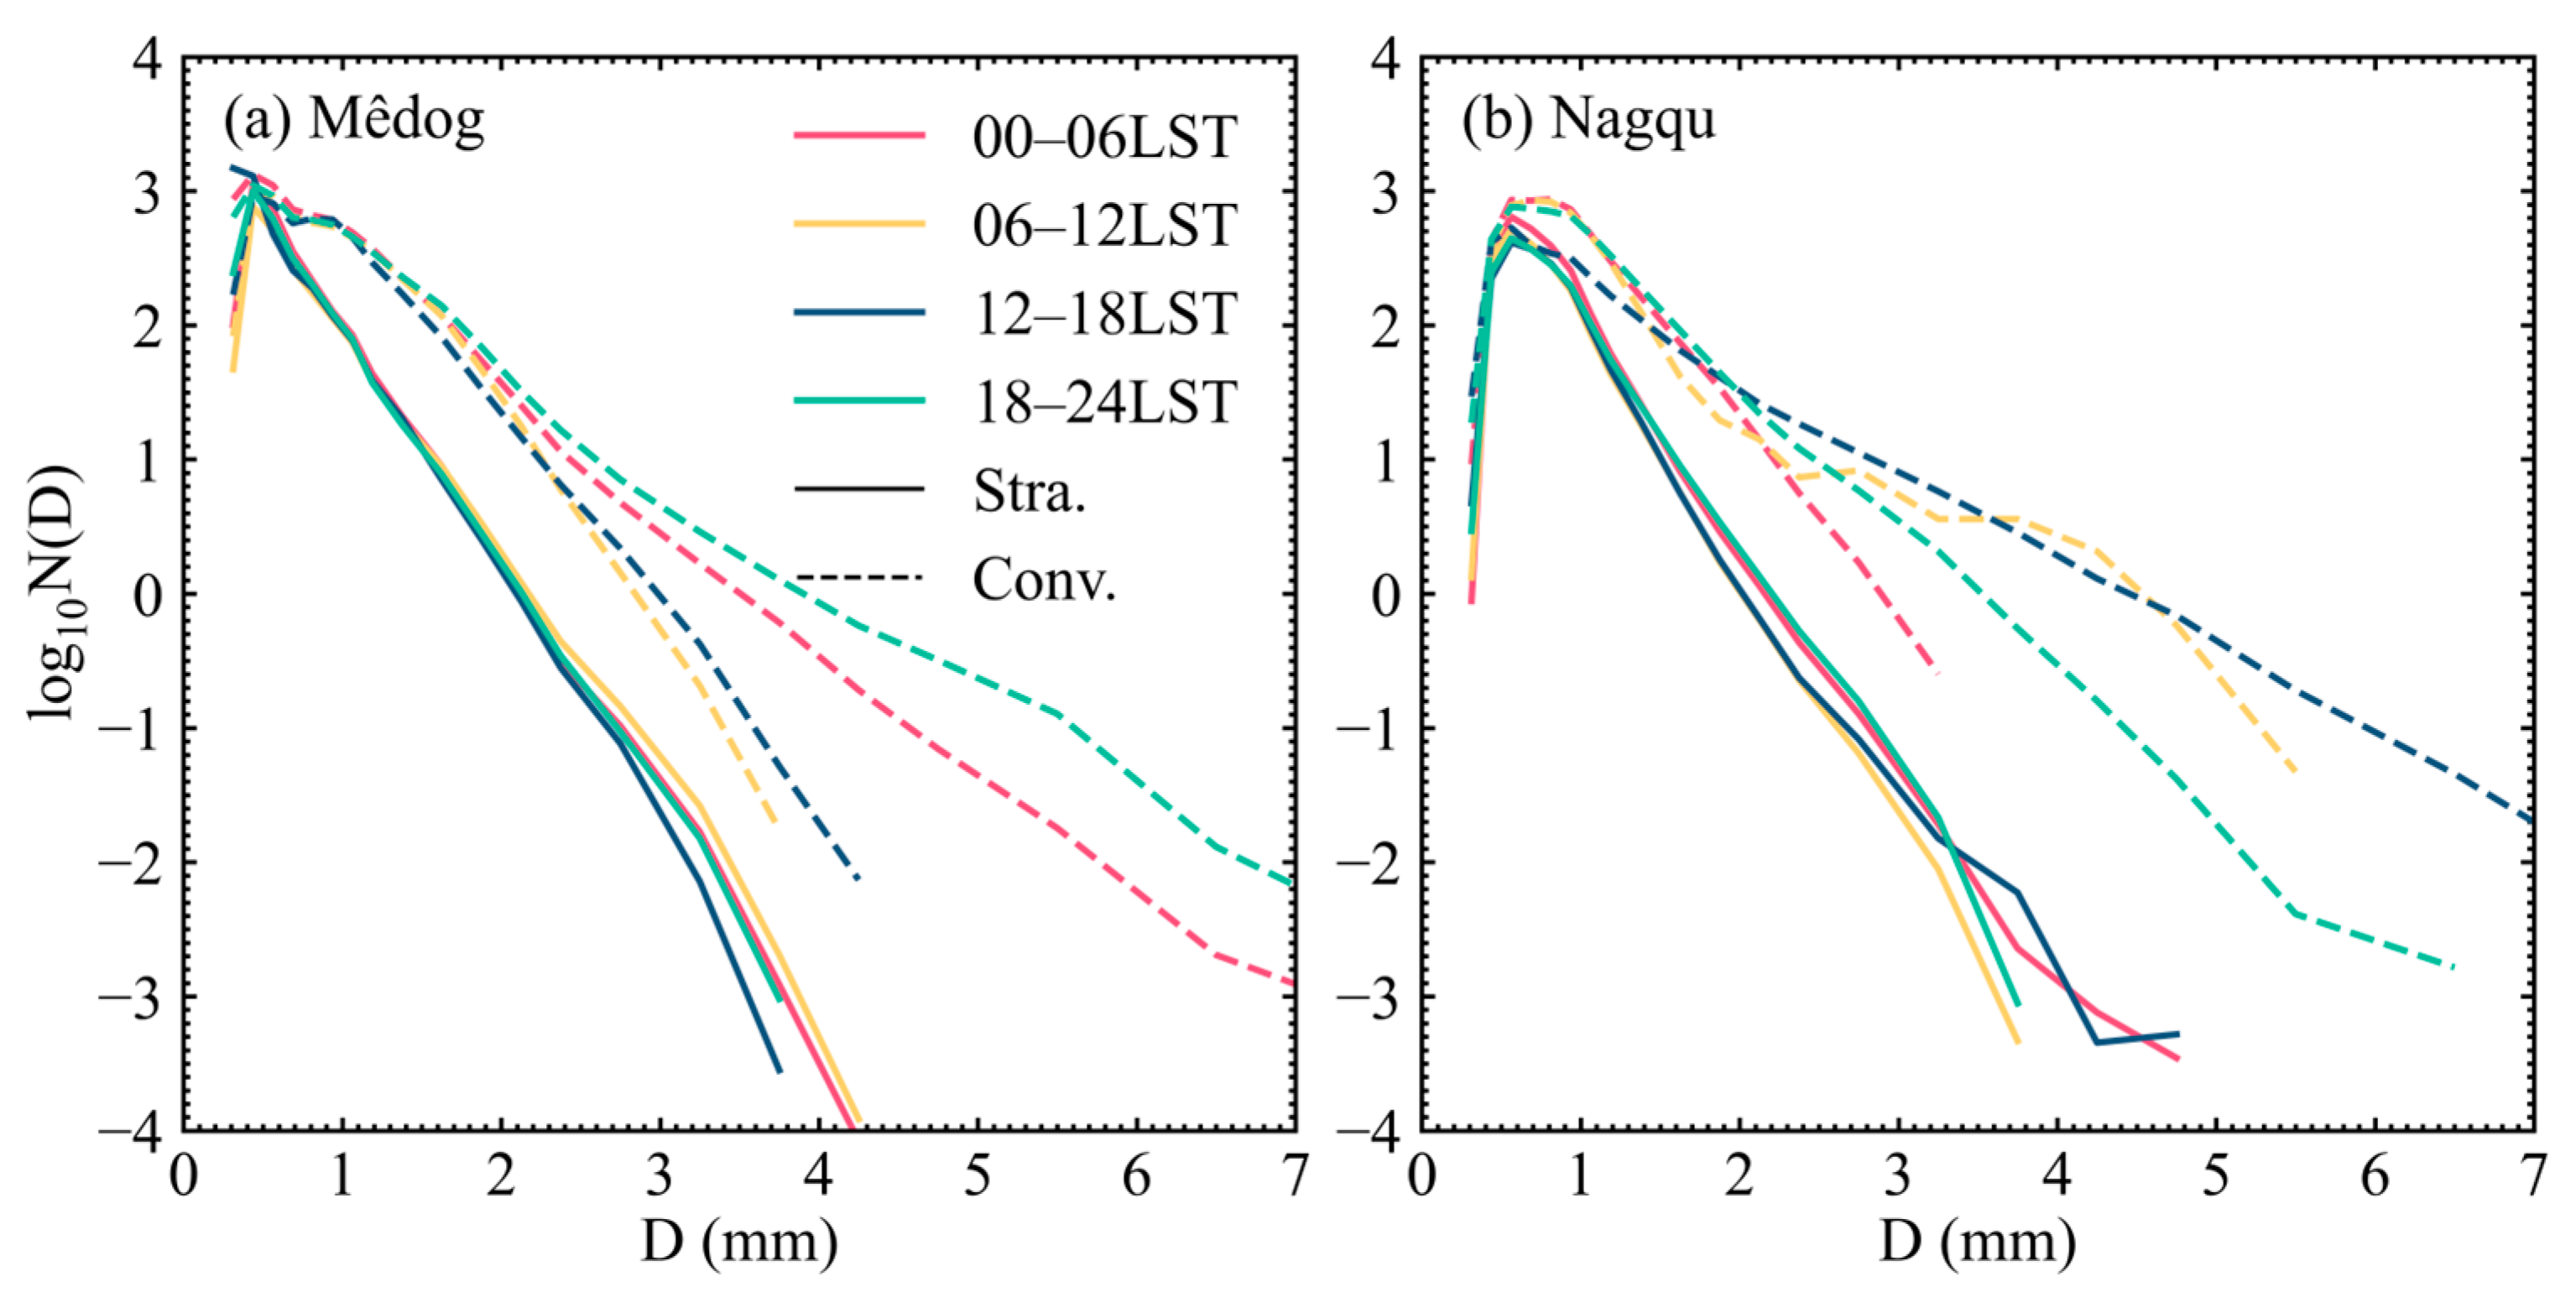
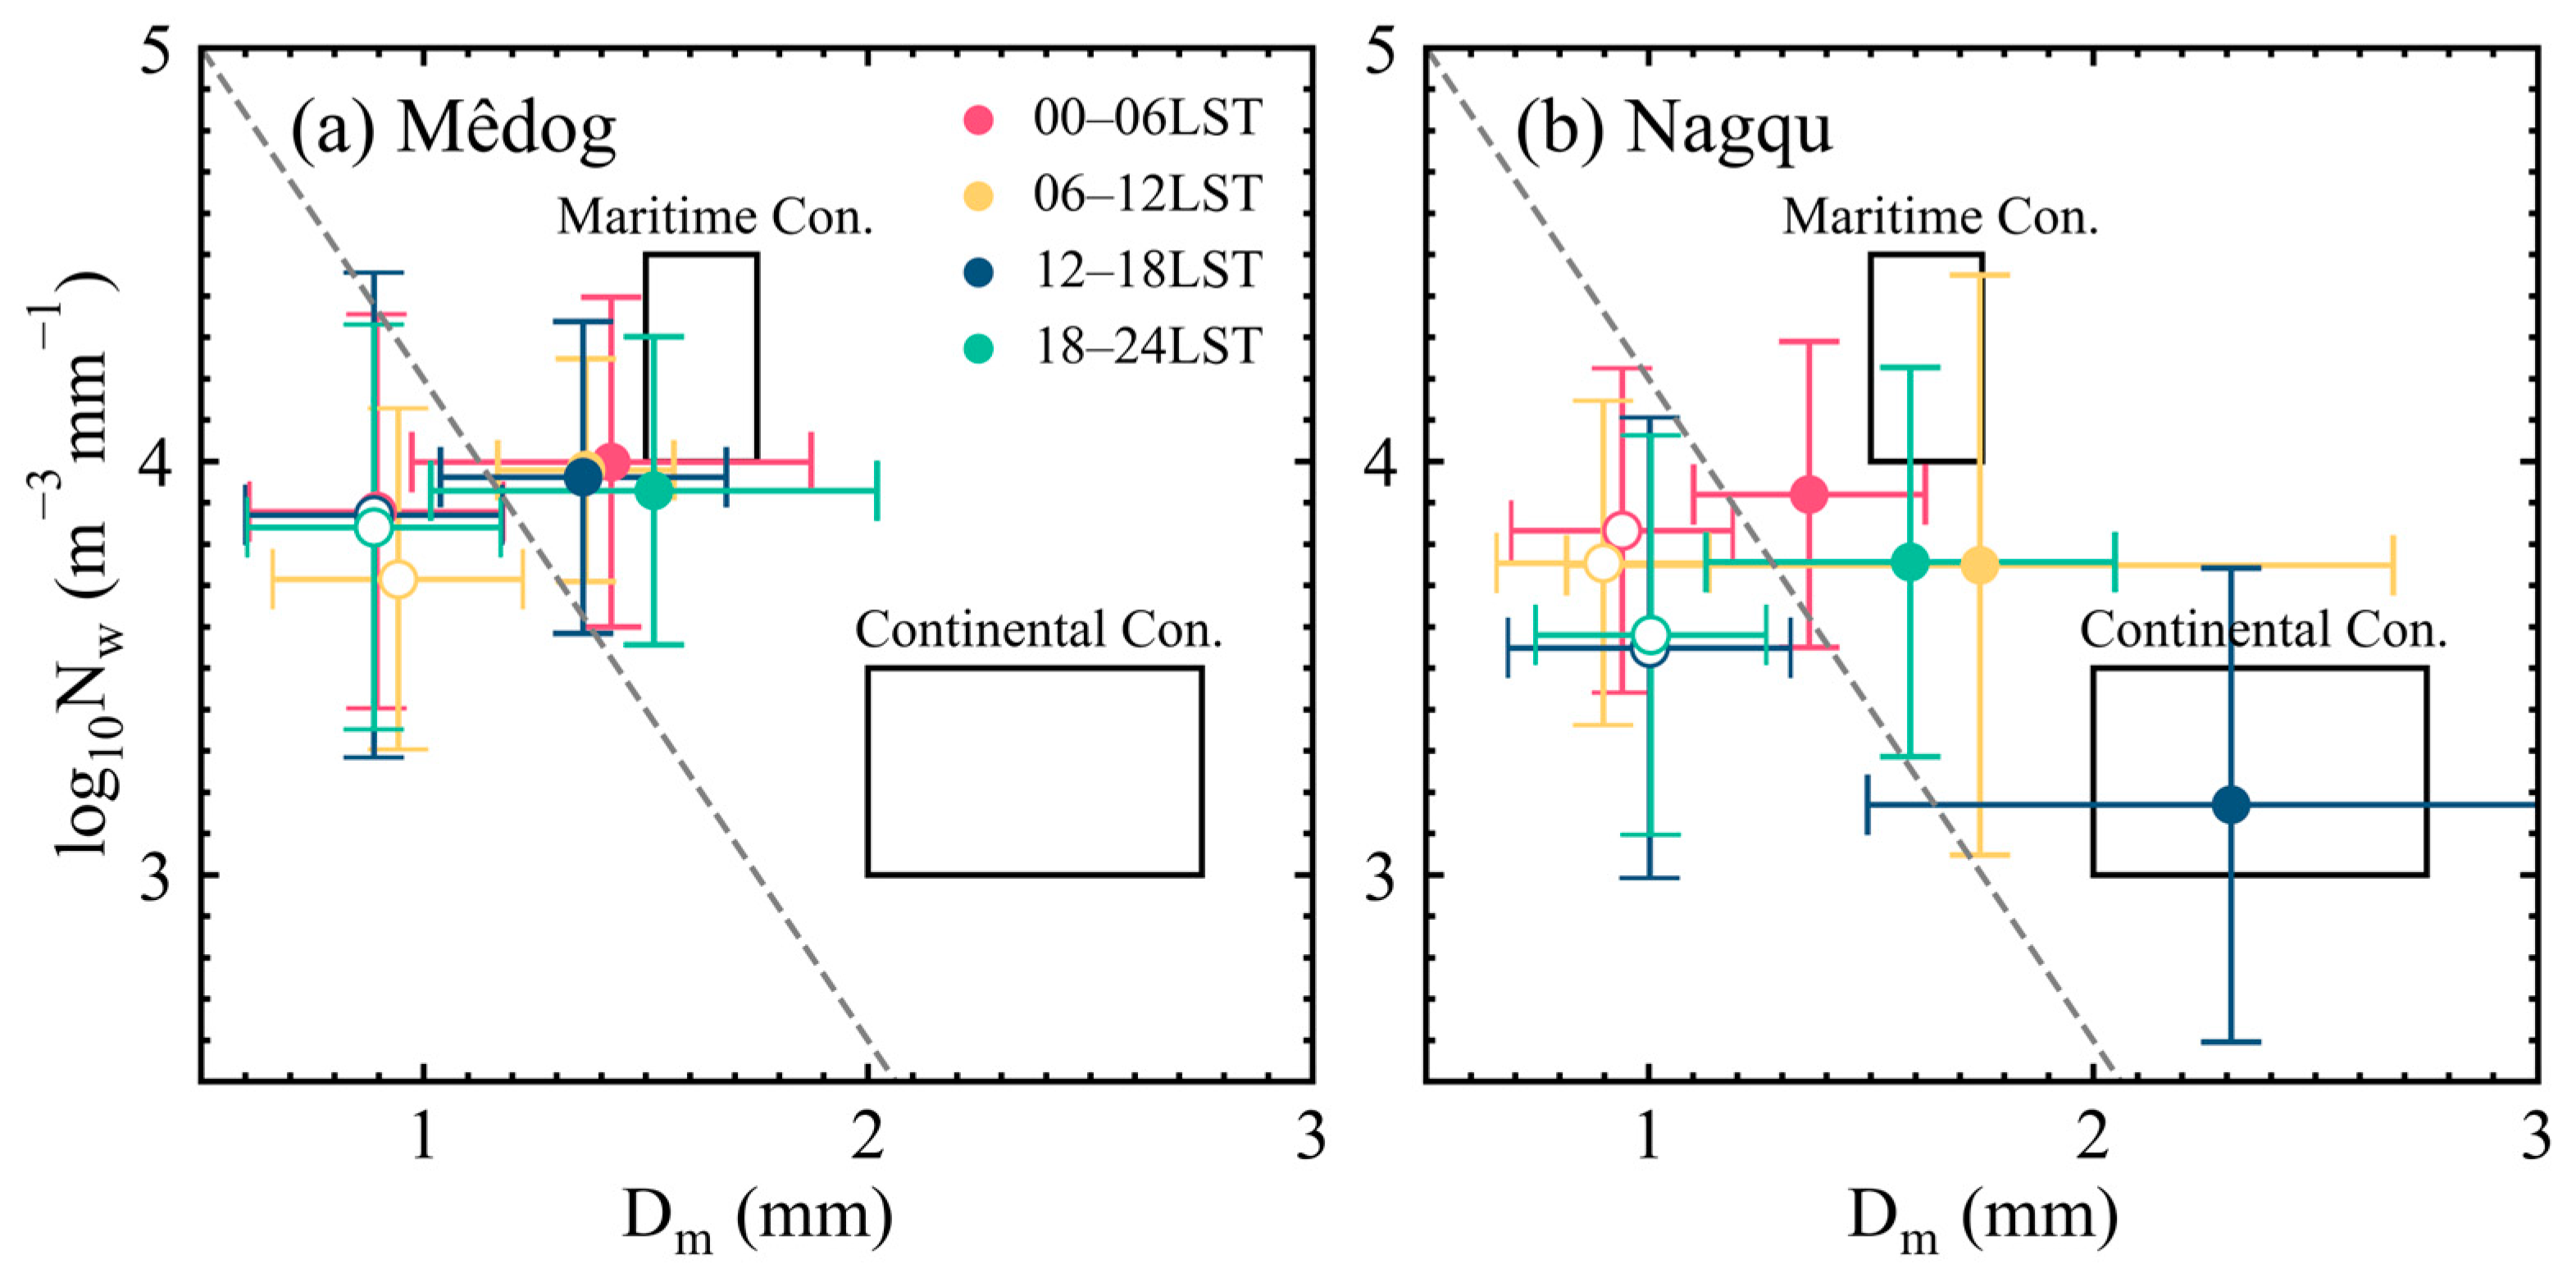
The diurnal variation in DSD of stratiform precipitation is not obvious in the two regions. As far as convective precipitation is concerned, the precipitation in Mêdog is generally characterized by a high concentration of limited-size raindrops and close to maritime-like population. The number concentration of large drops in Mêdog is the highest during 18:00–24:00 LST, with the largest Dm and the lowest Nw. The convective precipitation in Mêdog at 06:00–18:00 LST has less large raindrops with relatively lower Dm. In Nagqu, the convective precipitation during 12:00–18:00 (00:00–06:00) LST has the highest (lowest) concentration of large drops, and can be classified as a continental-like (maritime-like) population with the largest (smallest) Dm and the lowest (highest) Nw;
(5)
The relevant mechanisms for the discrepancies in diurnal variations between the two regions are also discussed in this paper. The low-level convergence of water vapor from evening to early morning in Mêdog and Nagqu results in the nocturnal peak of occurrence frequency of clouds and precipitation at the two sites. Stronger convergence in Mêdog than in Nagqu might lead to much higher occurrence frequency of clouds and precipitation in Mêdog. In addition, Mêdog is characterized by a significant diurnal cycle of mountain–valley wind. The interaction between the nocturnal down-valley winds and the background monsoon flow is the possible mechanism for the accumulation of water vapor and the development of convection in Mêdog. In Nagqu, the occurrence frequency and contribution of convective rain peaking in the afternoon are probably related to the isolated short-term thermal convection bubbles resulting from the surface sensible heat flux, which are difficult to capture using hourly ERA5 reanalysis data with coarse space resolution.
Overall, the clouds and precipitation characteristics in Mêdog and Nagqu exhibit pronounced diurnal variability. This study extends our understanding of the influences of topography and atmospheric dynamics on clouds and precipitation characteristics in two typical climatic regions of the TP. A further study focusing on the spatiotemporal distribution characteristics of clouds and precipitation over more regions of the TP and the complex meteorological factors behind them is warranted.

Author Contributions

Conceptualization, G.W., L.L. and J.S.; methodology, R.Z. and G.W.; validation, G.W.; writing—original draft preparation, R.Z.; writing—review and editing, G.W. and K.Z.; funding acquisition, G.W. All authors have read and agreed to the published version of the manuscript.

Funding

This research was funded by the Second Tibetan Plateau Scientific Expedition and Research (STEP) program, Grant No. 2019QZKK0105; Basic Research Fund of CAMS (2023Z009); Science and Technology Development Fund of Chinese Academy of Meteorological Sciences (2023KJ041).

Data Availability Statement

Data used in this study can be requested from the corresponding author under the research institute polices of Chinese Academy of Meteorological Sciences.

Acknowledgments

The authors would like to thank Suolang Zhaxi, Ting Wang from Meteorology Bureau of Motuo County. for their assistance in the maintenance of the instruments.

Conflicts of Interest

The authors declare no conflict of interest.

Appendix A

Figure A1. Diurnal variations in moisture flux divergence in Mêdog and Nagqu. The negative values present convergence, and the positive values present divergence.
Remotesensing 15 03731 g0a1
Figure A2. Time evolution of the surface wind vectors in Mêdog and Nagqu.
Remotesensing 15 03731 g0a2
Figure A3. Diurnal variations in downward surface shortwave radiation in Mêdog and Nagqu. The curves are averaged from ERA-5 hourly data during the same analysis period as cloud radars and disdrometers.
Remotesensing 15 03731 g0a3

References

  1. Xu, X.; Lu, C.; Shi, X.; Gao, S. World Water Tower: An Atmospheric Perspective. Geophys. Res. Lett. 2008, 35, L20815. [Google Scholar] [CrossRef]
  2. Kang, S.C.; Xu, Y.W.; You, Q.L.; Flugel, W.A.; Pepin, N.; Yao, T.D. Review of Climate and Cryospheric Change in the Tibetan Plateau. Environ. Res. Lett. 2010, 5, 015101. [Google Scholar] [CrossRef]
  3. Hawkinson, J.A.; Feltz, W.; Ackerman, S.A. A Comparison of Goes Sounder- and Cloud Lidar- and Radar-Retrieved Cloud-Top Heights. J. Appl. Meteorol. 2005, 44, 1234–1242. [Google Scholar] [CrossRef]
  4. Fujinami, H.; Yasunari, T. The Seasonal and Intraseasonal Variability of Diurnal Cloud Activity over the Tibetan Plateau. J. Meteorol. Soc. Jpn. 2001, 79, 1207–1227. [Google Scholar] [CrossRef] [Green Version]
  5. Bhatt, B.C.; Nakamura, K. Characteristics of Monsoon Rainfall around the Himalayas Revealed by Trmm Precipitation Radar. Mon. Weather Rev. 2005, 133, 149–165. [Google Scholar] [CrossRef]
  6. Taniguchi, K.; Koike, T. Seasonal Variation of Cloud Activity and Atmospheric Profiles over the Eastern Part of the Tibetan Plateau. J. Geophys. Res. Atmos. 2008, 113, D10104. [Google Scholar] [CrossRef]
  7. Ramadhan, R.; Marzuki; Vonnisa, M.; Harmadi; Hashiguchi, H.; Shimomai, T. Diurnal Variation in the Vertical Profile of the Raindrop Size Distribution for Stratiform Rain as Inferred from Micro Rain Radar Observations in Sumatra. Adv. Atmos. Sci. 2020, 37, 832–846. [Google Scholar] [CrossRef]
  8. Chen, G.; Zhang, X.; Fu, Y. Diurnal Variation in Clouds and Radiative Budgets over the Tibetan Plateau During Summer Using Ceres Data. J. Geophys. Res. Atmos. 2022, 127, e2021JD036329. [Google Scholar] [CrossRef]
  9. Fu, Y.; Pan, X.; Xian, T.; Liu, G.; Zhong, L.; Liu, Q.; Li, R.; Wang, Y.; Ma, M. Precipitation Characteristics over the Steep Slope of the Himalayas in Rainy Season Observed by TRMM PR and VIRS. Clim. Dyn. 2018, 51, 1971–1989. [Google Scholar] [CrossRef]
  10. Rüthrich, F.; Thies, B.; Reudenbach, C.; Bendix, J. Cloud Detection and Analysis on the Tibetan Plateau Using Meteosat and Cloudsat. J. Geophys. Res. Atmos. 2013, 118, 10082–10099. [Google Scholar] [CrossRef]
  11. Uttal, T.; Intrieri, J.M.; Eberhard, W.L.; Clothiaux, E.E.; Ackerman, T.P. Cloud Boundary Statistics During Fire Ii. J. Atmos. Sci. 1995, 52, 4276–4284. [Google Scholar] [CrossRef]
  12. Hollars, S.; Fu, Q.; Comstock, J.; Ackerman, T. Comparison of Cloud-Top Height Retrievals from Ground-Based 35 Ghz Mmcr and Gms-5 Satellite Observations at Arm Twp Manus Site. Atmos. Res. 2004, 72, 169–186. [Google Scholar] [CrossRef]
  13. Liu, L.; Ruan, Z.; Zheng, J.; Gao, W. Comparing and Merging Observation Data from Ka-Band Cloud Radar, C-Band Frequency-Modulated Continuous Wave Radar and Ceilometer Systems. Remote Sens. 2017, 9, 1282. [Google Scholar] [CrossRef] [Green Version]
  14. Sanderson, V.L.; Kidd, C.; McGregor, G.R. A Comparison of TRMM Microwave Techniques for Detecting the Diurnal Rainfall Cycle. J. Hydrometeorol. 2006, 7, 687–704. [Google Scholar] [CrossRef]
  15. Chen, H.; Yuan, W.; Li, J.; Yu, R. A Possible Cause for Different Diurnal Variations of Warm Season Rainfall as Shown in Station Observations and TRMM 3b42 Data over the Southeastern Tibetan Plateau. Adv. Atmos. Sci. 2012, 29, 193–200. [Google Scholar] [CrossRef]
  16. Liu, L.; Zheng, J.; Ruan, Z.; Cui, Z.; Hu, Z.; Wu, S.; Dai, G.; Wu, Y. Comprehensive Radar Observations of Clouds and Precipitation over the Tibetan Plateau and Preliminary Analysis of Cloud Properties. J. Meteorol. Res. 2015, 29, 546–561. [Google Scholar] [CrossRef]
  17. Zhao, P.; Li, Y.; Guo, X.; Xu, X.; Liu, Y.; Tang, S.; Xiao, W.; Shi, C.; Ma, Y.; Yu, X.; et al. The Tibetan Plateau Surface-Atmosphere Coupling System and Its Weather and Climate Effects: The Third Tibetan Plateau Atmospheric Science Experiment. J. Meteorol. Res. 2019, 33, 375–399. [Google Scholar] [CrossRef]
  18. Tao, S.; Luo, S.; Zhang, H. The Qinghai-Xizang Plateau Meteorological Experiment (Qxpmex) May–August 1979. In Proceedings of the International Symposium on the Qinghai-Xizang Plateau and Mountain Meteorology, Beijing, China, 20–24 March 1984; American Meteorological Society: Boston, MA, USA, 1986. [Google Scholar]
  19. Chen, L.; Xu, X.; Yu, S. The Second Tibetan Plateau Field Experiment: Air-Land Process and Planetary Boundary Layer Observational Study. In Annual Report of Chinese Academy of Meteorological Sciences; Chinese Academy of Meteorological Sciences: Beijing, China, 1999; pp. 15–16. [Google Scholar]
  20. Chen, B.; Hu, Z.; Liu, L.; Zhang, G. Raindrop Size Distribution Measurements at 4,500 m on the Tibetan Plateau During Tipex-Iii. J. Geophys. Res. Atmos. 2017, 122, 11092–11106. [Google Scholar] [CrossRef]
  21. Wang, G.; Li, R.; Sun, J.; Xu, X.; Zhou, R.; Liu, L. Comparative Analysis of the Characteristics of Rainy Season Raindrop Size Distributions in Two Typical Regions of the Tibetan Plateau. Adv. Atmos. Sci. 2022, 39, 1062–1078. [Google Scholar] [CrossRef]
  22. Liu, L.P.; Feng, J.M.; Chu, R.Z.; Zhou, Y.J.; Ueno, K. The Diurnal Variation of Precipitation in Monsoon Season in the Tibetan Plateau. Adv. Atmos. Sci. 2002, 19, 365–378. [Google Scholar] [CrossRef]
  23. Chang, Y.; Guo, X. Characteristics of Convective Cloud and Precipitation During Summer Time at Naqu over Tibetan Plateau. Chin. Sci. Bull. 2016, 61, 1706–1720. [Google Scholar] [CrossRef] [Green Version]
  24. Xu, J.; Zheng, X.; Xu, H.; Fang, X. Gms-5 Upper tropospheric moisture distribution over the Tibet Plateau as revealed from GMS-5 vapour images. J. Appl. Meteorol. Sci. 1996, 7, 246–251. (In Chinese) [Google Scholar]
  25. Gao, D. Expeditionary studies on the Moisture Passage of the Yarlung Zangbo River. Chin. J. Nat. 2008, 30, 301–303. (In Chinese) [Google Scholar]
  26. Xu, X.; Tao, S.; Wang, J.; Chen, L.; Zhou, L.; Wang, X. The relationship between water vapor transport features of Tibetan Plateau-monsoon ‘‘Large Triangle’’ affecting region and drought-flood abnormality of China. Acta Meteorol. Sin. 2002, 60, 257–266. (In Chinese) [Google Scholar] [CrossRef]
  27. Wang, G.L.; Zhou, R.R.; Zhaxi, S.L.; Liu, S.N. Raindrop Size Distribution Measurements on the Southeast Tibetan Plateau During the Step Project. Atmos. Res. 2021, 249, 105311. [Google Scholar] [CrossRef]
  28. Zhou, R.; Wang, G.; Zhaxi, S. Cloud Vertical Structure Measurements from a Ground-Based Cloud Radar over the Southeastern Tibetan Plateau. Atmos. Res. 2021, 258, 105629. [Google Scholar] [CrossRef]
  29. Chen, P.; Li, B. Characteristics of water vapor transport and its influence in southeast Tibet. S. China Agric. 2018, 12, 124–125. (In Chinese) [Google Scholar] [CrossRef]
  30. Li, R.; Wang, G.; Zhou, R.; Zhang, J.; Liu, L. Seasonal Variation in Microphysical Characteristics of Precipitation at the Entrance of Water Vapor Channel in Yarlung Zangbo Grand Canyon. Remote Sens. 2022, 14, 3149. [Google Scholar] [CrossRef]
  31. Sakaeda, N.; Powell, S.W.; Dias, J.; Kiladis, G.N. The Diurnal Variability of Precipitating Cloud Populations During Dynamo. J. Atmos. Sci. 2018, 75, 1307–1326. [Google Scholar] [CrossRef]
  32. Zeng, Y.; Yang, L.; Zhang, Z.; Tong, Z.; Li, J.; Liu, F.; Zhang, J.; Jiang, Y. Characteristics of Clouds and Raindrop Size Distribution in Xinjiang, Using Cloud Radar Datasets and a Disdrometer. Atmosphere 2020, 11, 1382. [Google Scholar] [CrossRef]
  33. Kozu, T.; Reddy, K.K.; Mori, S.; Thurai, M.; Ong, J.T.; Rao, D.N.; Shimomai, T. Seasonal and Diurnal Variations of Raindrop Size Distribution in Asian Monsoon Region. J. Meteorol. Soc. Jpn. 2006, 84, 195–209. [Google Scholar] [CrossRef] [Green Version]
  34. Li, J. Hourly Station-Based Precipitation Characteristics over the Tibetan Plateau. Int. J. Climatol. 2018, 38, 1560–1570. [Google Scholar] [CrossRef]
  35. Hersbach, H.; Bell, B.; Berrisford, P.; Hirahara, S.; Horányi, A.; Muñoz-Sabater, J.; Nicolas, J.; Peubey, C.; Radu, R.; Schepers, D.; et al. The Era5 Global Reanalysis. Q. J. R. Meteorol. Soc. 2020, 146, 1999–2049. [Google Scholar] [CrossRef]
  36. Clothiaux, E.E.; Moran, K.P.; Martner, B.E.; Ackerman, T.P.; Mace, G.G.; Uttal, T.; Mather, J.H.; Widener, K.B.; Miller, M.A.; Rodriguez, D.J. The Atmospheric Radiation Measurement Program Cloud Radars: Operational Modes. J. Atmos. Ocean. Technol. 1999, 16, 819–827. [Google Scholar] [CrossRef]
  37. Clothiaux, E.E.; Ackerman, T.P.; Mace, G.G.; Moran, K.P.; Marchand, R.T.; Miller, M.A.; Martner, B.E. Objective Determination of Cloud Heights and Radar Reflectivities Using a Combination of Active Remote Sensors at the Arm Cart Sites. J. Appl. Meteorol. 2000, 39, 645–665. [Google Scholar] [CrossRef]
  38. Zheng, J.; Liu, L.; Chen, H.; Gou, Y.; Che, Y.; Xu, H.; Li, Q. Characteristics of Warm Clouds and Precipitation in South China During the Pre-Flood Season Using Datasets from a Cloud Radar, a Ceilometer, and a Disdrometer. Remote Sens. 2019, 11, 3045. [Google Scholar] [CrossRef] [Green Version]
  39. Wan, X.; Zheng, J.; Wan, R.; Xu, G.; Qin, J.; Yi, L. Intercomparison of Cloud Vertical Structures over Four Different Sites of the Eastern Slope of the Tibetan Plateau in Summer Using Ka-Band Millimeter-Wave Radar Measurements. Remote Sens. 2022, 14, 3702. [Google Scholar] [CrossRef]
  40. Görsdorf, U.; Lehmann, V.; Bauer-Pfundstein, M.; Peters, G.; Vavriv, D.; Vinogradov, V.; Volkov, V. A 35-Ghz Polarimetric Doppler Radar for Long-Term Observations of Cloud Parameters—Description of System and Data Processing. J. Atmos. Ocean. Technol. 2015, 32, 675–690. [Google Scholar] [CrossRef]
  41. Zheng, J.; Liu, L.; Zeng, Z.; Xie, X.; Wu, J.; Feng, K. Ka-band millimeter wave cloud radar data quality control. J. Infrared Millim. Waves 2016, 35, 748–757. (In Chinese) [Google Scholar]
  42. Moran, K.P.; Martner, B.E.; Post, M.J.; Kropfli, R.A.; Welsh, D.C.; Widener, K.B. An Unattended Cloud-Profiling Radar for Use in Climate Research. Bull. Am. Meteorol. Soc. 1998, 79, 443–455. [Google Scholar] [CrossRef]
  43. Wang, Y.; Wang, C.H.; Shi, C.Z.; Xiao, B.H. Integration of Cloud Top Heights Retrieved from Fy-2 Meteorological Satellite, Radiosonde, and Ground-Based Millimeter Wavelength Cloud Radar Observations. Atmos. Res. 2018, 214, 284–295. [Google Scholar] [CrossRef]
  44. Zhang, Y.; Zhou, Q.; Lv, S.; Jia, S.; Tao, F.; Chen, D.; Guo, J. Elucidating Cloud Vertical Structures Based on Three-Year Ka-Band Cloud Radar Observations from Beijing, China. Atmos. Res. 2019, 222, 88–99. [Google Scholar] [CrossRef]
  45. Barnes, S.L. An Empirical Shortcut to the Calculation of Temperature and Pressure at the Lifted Condensation Level. J. Appl. Meteorol. Climatol. 1968, 7, 511. [Google Scholar] [CrossRef]
  46. Seela, B.K.; Janapati, J.; Lin, P.-L.; Wang, P.K.; Lee, M.-T. Raindrop Size Distribution Characteristics of Summer and Winter Season Rainfall over North Taiwan. J. Geophys. Res. Atmos. 2018, 123, 11602–11624. [Google Scholar] [CrossRef] [Green Version]
  47. Ye, B.Y.; Jung, E.; Shin, S.; Lee, G. Statistical Characteristics of Cloud Occurrence and Vertical Structure Observed by a Ground-Based Ka-Band Cloud Radar in South Korea. Remote Sens. 2020, 12, 2242. [Google Scholar] [CrossRef]
  48. Atlas, D.; Srivastava, R.C.; Sekhon, R.S. Doppler Radar Characteristics of Precipitation at Vertical Incidence. Rev. Geophys. Space Phys. 1973, 11, 1–35. [Google Scholar] [CrossRef]
  49. Tokay, A.; Petersen, W.A.; Gatlin, P.; Wingo, M. Comparison of Raindrop Size Distribution Measurements by Collocated Disdrometers. J. Atmos. Ocean. Technol. 2013, 30, 1672–1690. [Google Scholar] [CrossRef]
  50. Willis, P.T. Functional Fits to Some Observed Drop Size Distributions and Parameterization of Rain. J. Atmos. Sci. 1984, 41, 1648–1661. [Google Scholar] [CrossRef]
  51. Barros, A.; Lang, T.J. Monitoring the Monsoon in the Himalayas- Observations in Central Nepal, June 2001. Mon. Weather Rev. 2003, 131, 1408–1427. [Google Scholar] [CrossRef]
  52. Bhatt, B.C.; Nakamura, K. A Climatological-Dynamical Analysis Associated with Precipitation around the Southern Part of the Himalayas. J. Geophys. Res. Atmos. 2006, 111, D02115. [Google Scholar] [CrossRef]
  53. Hunt, K.M.R.; Turner, A.G.; Schiemann, R.K.H. Katabatic and Convective Processes Drive Two Preferred Peaks in the Precipitation Diurnal Cycle over the Central Himalaya. Q. J. R. Meteorol. Soc. 2022, 148, 1731–1751. [Google Scholar] [CrossRef]
  54. Fujinami, H.; Nomura, S.; Yasunari, T. Characteristics of Diurnal Variations in Convection and Precipitation over the Southern Tibetan Plateau During Summer. Sola 2005, 1, 49–52. [Google Scholar] [CrossRef] [Green Version]
  55. Hirose, M.; Nakamura, K. Spatial and Diurnal Variation of Precipitation Systems over Asia Observed by the TRMM Precipitation Radar. J. Geophys. Res. Atmos. 2005, 110, ssD05106. [Google Scholar] [CrossRef]
  56. Kurosaki, Y.; Kimura, F. Relationship between Topography and Daytime Cloud Activity around Tibetan Plateau. J. Meteorol. Soc. Jpn. 2002, 80, 1339–1355. [Google Scholar] [CrossRef] [Green Version]
  57. Tokay, A.; Short, D.A. Evidence from Tropical Raindrop Spectra of the Origin of Rain from Stratiform Versus Convective Clouds. J. Appl. Meteorol. Climatol. 1996, 35, 355–371. [Google Scholar] [CrossRef]
  58. Bringi, V.N.; Chandrasekar, V.; Hubbert, J.; Gorgucci, E.; Randeu, W.L.; Schoenhuber, M. Raindrop Size Distribution in Different Climatic Regimes from Disdrometer and Dual-Polarized Radar Analysis. J. Atmos. Sci. 2003, 60, 354–365. [Google Scholar] [CrossRef]
  59. Fabry, F.; Zawadzki, I. Long-Term Radar Observations of the Melting Layer of Precipitation and Their Interpretation. J. Atmos. Sci. 1995, 52, 838–851. [Google Scholar] [CrossRef]
  60. Zhong, S.Y.; Li, J.; Whiteman, C.D.; Bian, X.D.; Yao, W.Q. Climatology of High Wind Events in the Owens Valley, California. Mon. Weather Rev. 2008, 136, 3536–3552. [Google Scholar] [CrossRef] [Green Version]
  61. Xu, X.; Zhao, T.; Lu, C.; Shi, X. Characteristics of the water cycle in the atmosphere over the Tibetan Plateau. Acta Meteorol. Sin. 2014, 72, 1079–1095. (In Chinese) [Google Scholar] [CrossRef]
  62. Mapes, B.E.; Warner, T.T.; Xu, M. Diurnal Patterns of Rainfall in Northwestern South America. Part Iii: Diurnal Gravity Waves and Nocturnal Convection Offshore. Mon. Weather Rev. 2003, 131, 830–844. [Google Scholar] [CrossRef]
  63. Xu, X.; Ma, Y.; Sun, C.; Wei, F. Effect of Energy and Water Circulation over Tibetan Plateau. Bull. Chin. Acad. Sci. 2019, 34, 1293–1305. (In Chinese) [Google Scholar] [CrossRef]
Figure 1. The topography of the Tibetan Plateau (TP) and the locations of Mêdog and Nagqu overlapped with 500 hPa wind averaged during summer season from 2014 to 2021 (plot at 0.5° grid resolution). The red rectangle denotes the Yarlung Zangbo Grand Canyon (YZGC).
Remotesensing 15 03731 g001
Figure 2. The diurnal variations of occurrence frequency of (a) total cloud cover, (b) precipitating clouds and (c) non-precipitating clouds in Mêdog (red triangles and lines) and Nagqu (blue triangles and lines) during summer season. The dashed lines represent the mean values.
Remotesensing 15 03731 g002
Figure 3. Diurnal cycles of occurrence frequency of CTHs in Mêdog (a,c) and Nagqu (b,d). The samples are vertically divided with a resolution of 300 m. The frequency for a pixel is defined as the ratio of samples within the pixel to the total number of samples for the corresponding 1 h interval. Mean CTHs are presented by the black lines.
Remotesensing 15 03731 g003
Figure 4. Same as Figure 3 but for CBHs. Note that the CBHs of precipitating clouds are close to the ground and not shown.
Remotesensing 15 03731 g004
Figure 5. Boxplots of diurnal variations in cloud layer thicknesses in Mêdog (a,c) and Nagqu (b,d). The bottom and top edges of each box represent the 25th and 75th percentiles, respectively. The dots and lines represent the average.
Remotesensing 15 03731 g005
Figure 6. Diurnal variations in frequency of radar reflectivity >−40 dBZ in (a) Mêdog and (b) Nagqu. The frequency for each pixel is calculated as the ratio of the number of days with reflectivity > −40 dBZ to the total number of days of observation.
Remotesensing 15 03731 g006
Figure 7. Vertical profiles of radar reflectivity in four periods of the day in (a) Mêdog and (b) Nagqu.
Remotesensing 15 03731 g007
Figure 8. Diurnal variations in (a) rain rate obtained by disdrometers in Mêdog (red triangles and line) and Nagqu (blue triangles and line), and relative contributions of each rainfall rate category to the cumulative rainfall totals (mm) in Mêdog (b) and Nagqu (c). The blue lines in panels b and c represent the cumulative rainfall totals (mm) in Mêdog and Nagqu, respectively.
Remotesensing 15 03731 g008
Figure 9. The diurnal variations of occurrence frequency of (a) total precipitation, (b) stratiform precipitation, and (c) convective precipitation in Mêdog (black triangles and lines) and Nagqu (blue triangles and lines) during summer season. The dashed lines represent the mean values.
Remotesensing 15 03731 g009
Figure 10. Variation in mean raindrop concentration, N(D) (m−3 mm−1), with drop diameter, D (mm), for (a) Mêdog and (b) Nagqu. The samples are divided into 6 h intervals. The solid lines (dashed lines) represent stratiform (convective) rain.
Remotesensing 15 03731 g010
Figure 11. Variation of normalized intercept parameter, log10Nw (m−3 mm−1), with mass-weighted mean diameter, Dm (mm), in (a) Mêdog and (b) Nagqu. The samples are divided into 6 h intervals as in Figure 10. The solid rectangles correspond to the maritime and continental convective populations reported by Bringi et al. [58]. The dashed line indicates the separation line of stratiform and convective clusters according to Bringi et al. [58]. Below the dashed line to the left are the stratiform samples.
Remotesensing 15 03731 g011
Table 1. Main technical parameters of cloud radars used in current study.
ItemsTechnical Specifications
Working systemPulsed wave Doppler, pulse compression
Transmitter typeAll solid-state transmitter
Observation modeZenith-pointed vertically
Beam width≤0.35°
Working frequency33.44 GHz (Ka-band)
Measured variablesReflectivity, radial velocity, velocity spectrum width, linear depolarization factor (LDR), power spectral density data
Maximum detection range15 km above ground level (AGL)
Table 2. The numbers of profiles and occurrence frequencies of clouds in Mêdog and Nagqu during summer. Percentages are in parentheses.
MêdogNagqu
All profiles439,170828,367
Total cloud cover profiles281,529 (64.1%)509,845 (61.5%)
Precipitation profiles146,040 (33.3%)93,974 (11.3%)
Single-layered cloud220,161 (50.1%)345,249 (41.7%)
Double-layered cloud51,477 (11.7%)124,993 (15.1%)
Triple-layered cloud8762 (2.0%)32,162 (3.9%)
Table 3. Samples’ mean rain rates of convective rain and stratiform rain in Mêdog and Nagqu with a 6 h interval.
Mêdog (Samples/Rain Rate (mm h−1))Nagqu (Samples/Rain Rate (mm h−1))
Conv.Stra.Conv.Stra.
00–06544/11.0814,183/1.2671/7.33414/1.54
06–12228/8.909736/1.1247/8.882549/1.09
12–18161/7.658416/1.01246/14.02276/1.11
18–24377/13.689342/1.12313/10.313159/1.34
Total1310/11.0341,677/1.15677/11.2411,398/1.30
Disclaimer/Publisher’s Note: The statements, opinions and data contained in all publications are solely those of the individual author(s) and contributor(s) and not of MDPI and/or the editor(s). MDPI and/or the editor(s) disclaim responsibility for any injury to people or property resulting from any ideas, methods, instructions or products referred to in the content.

