Article

Sensitivity Assessment of Land Desertification in China Based on Multi-Source Remote Sensing

1
College of Geography and Environmental Science, Northwest Normal University, Lanzhou 730070, China
2
School of Geography and Tourism, Jiaying University, Meizhou 514015, China
3
Future Urbanity & Sustainable Environment (FUSE) Lab, Division of Landscape Architecture, Department of Architecture, Faculty of Architecture, The University of Hong Kong, Hong Kong SAR 999007, China
*
Author to whom correspondence should be addressed.
Remote Sens. 2023, 15(10), 2674; https://doi.org/10.3390/rs15102674
Submission received: 31 March 2023 / Revised: 13 May 2023 / Accepted: 19 May 2023 / Published: 21 May 2023
(This article belongs to the Special Issue Integrating Earth Observations into Ecosystem Service Models)

Abstract

:
Desertification, a current serious global environmental problem, has caused ecosystems and the environment to degrade. The total area of desertified land is about 1.72 million km2 in China, which is extensively affected by desertification. Estimating land desertification risks is the top priority for the sustainable development of arid and semi-arid lands in China. In this study, the Mediterranean Desertification and Land Use (MEDALUS) model was used to assess the sensitivity of land desertification in China. Based on multi-source remote sensing data, this study integrated natural and human factors, calculated the land desertification sensitivity index by overlaying four indicators (soil quality, vegetation quality, climate quality, and management quality), and explored the driving forces of desertification using a principal component and correlation analysis. It was found that the spatial distribution of desertification sensitivity areas in China shows a distribution pattern of gradually decreasing from northwest to southeast, and the areas with very high and high desertification sensitivities were about 620,629 km2 and 2,384,410 km2, respectively, which accounts for about 31.84% of the total area of the country. The very high and high desertification sensitivity areas were mainly concentrated in the desert region of northwest China. The principal component and correlation analysis of the sub-indicators in the MEDALUS model indicated that erosion protection, drought resistance, and land use were the main drivers of desertification in China. Furthermore, the aridity index, soil pH, plant coverage, soil texture, precipitation, soil depth, and evapotranspiration were the secondary drivers of desertification in China. Moreover, the desertification sensitivity caused by drought resistance, erosion protection, and land use was higher in the North China Plain region and Guanzhong Basin. The results of the quantitative analysis of the driving forces of desertification based on mathematical statistical methods in this study provide a reference for a comprehensive strategy to combat desertification in China and offer new ideas for the assessment of desertification sensitivity at macroscopic scales.

1. Introduction

Desertification, a pressing environmental issue affecting the earth [1,2,3], results in the degradation and depletion of natural resource systems, consequently impeding social stability and economic growth [4,5]. It is estimated that desertification reduces food production for at least 40% of the world’s land and affects approximately 1.4 billion people globally, with the majority of effects occurring in developing countries [6]. China, as a large developing country, is extensively affected by desertification, with a total desertified land area of about 1.72 million km2, accounting for 17.93% of its territory area [2], and the economic loss caused by desertification is about USD 6.8 billion per year [7]. Given the gravity of the desertification issue in China, the pursuit of scientific and precise monitoring of land degradation processes, prompt efficient evaluation of desertification hazards, identification of underlying causes, and implementation of early warning systems rank among the top priorities for promoting sustainable development, safeguarding biodiversity, and preserving cultivable resources in China [8].
Traditional desertification monitoring and assessment mainly analyze current situation and spatial distributions of land desertification by means of field surveys and image interpretation [9,10]. While remote sensing technology has incomparable advantages in desertification monitoring, such as large-scale monitoring and long timeliness [11,12], researchers have extensively explored methods of desertification monitoring and assessment using remote sensing since the 1980s, and many research advances have been made [8,13,14,15,16,17,18,19,20]. The main desertification monitoring methods are divided into three categories: visual interpretation [13], spectral hybrid analysis [14,15], and automatic extraction based on remote sensing information [16]. Desertification assessment techniques have developed from single vegetation index evaluation [8,17] to comprehensive evaluation combining multi-disciplinary and multiple remote sensing indexes [18,19,20]. However, to date, land desertification assessment in China is regionally conducted, and most assessments are small-scale focused, with nationwide assessment is still lacking. Moreover, it is difficult to quantitatively analyze the driving forces of land desertification considering the combined effects of natural and human factors [21,22]. In this study, we adopted the Mediterranean Desertification and Land Use (MEDALUS) model, which is relatively mature in application, and integrate natural and human factors to assess the sensitivity of land desertification in the entire China in an attempt to discover the spatial distribution characteristics of areas with high risk of land desertification in China and to explore the driving mechanisms in areas with increased risk of desertification.
MEDALUS was first proposed by Kosmas et al., (1999) [23] and tested in the Mediterranean region. Subsequently, a large number of researchers have used this model to assess desertification in small-scale areas, with good results [6,24,25,26,27]. The model was then gradually refined and expanded to large spatial areas and even used in the assessment of global desertification [28]. In this study, we used the MEDALUS model to assess the land desertification in China by considering both natural and human factors, and we also made some improvements to the model. First, we selected evapotranspiration and soil pH assessment indicators based on the unique natural environment of China. Second, we refined the desertification sensitivity grade to facilitate the government in implementing countermeasures to address the different levels of desertification risk. Finally, we quantitatively analyze the driving forces of the selected indicators in the desertification process to further refine the model. This paper provides a reference and scientific basis for the management of desertification in China and provides new references and ideas for quantitative analysis of the driving forces of desertification on a large scale.

2. Study Area and Data
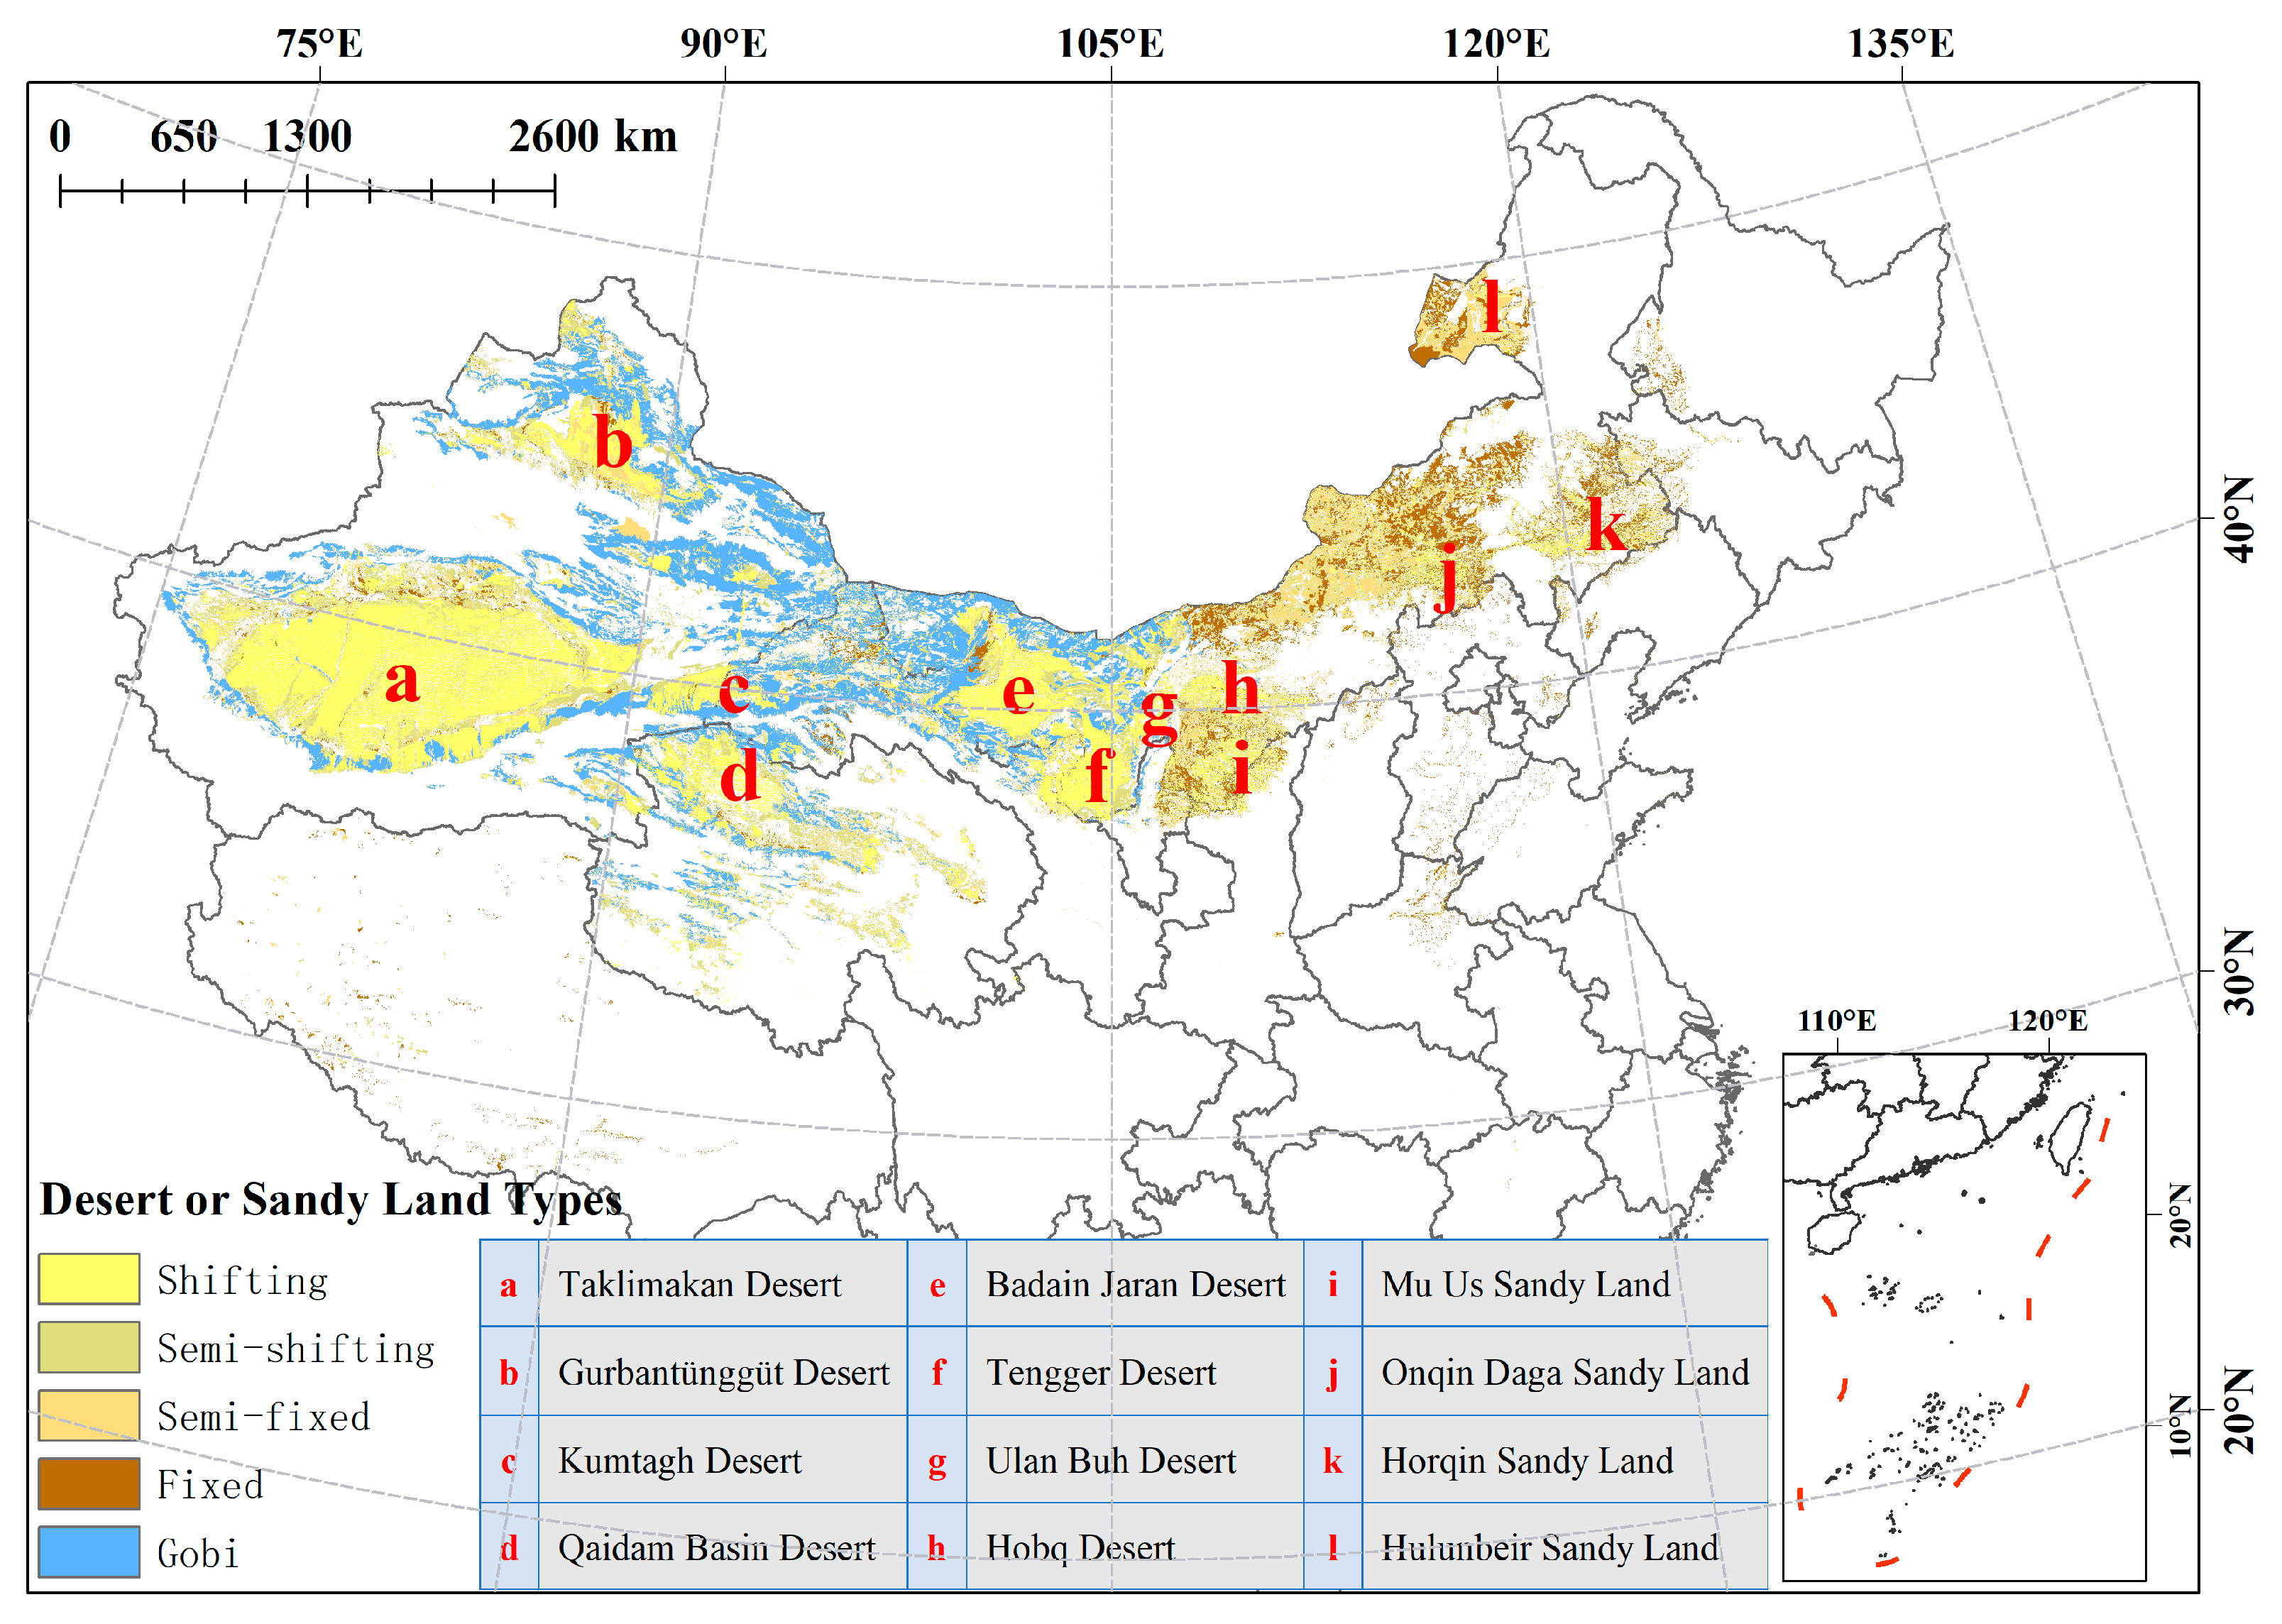
2.1. Study Area

China has a land area of about 9.6 million km2 and a total desertified land area of about 1.72 million km2, dominated by varying degrees of desertification, with sandy land types including mobile dunes, semi-mobile dunes, semi-fixed dunes, fixed dunes, and the Gobi [2]. There are eight deserts and four sandy areas in northern China (Figure 1), and the desertified land forms a discontinuous belt from northeast China through to north and northwest China [4]. China has a wide variety of climate types, including a tropical monsoon climate, subtropical monsoon climate, temperate monsoon climate, highland mountain climate, temperate continental climate, and tropical rainforest climate, with uneven precipitation distribution. Arid and semi-arid areas are mainly located in north and northwest China, where the risk of desertification is high. In addition, the population of China is about 1.39 billion, which means it is the most populous country in the world, and dramatic human activities (overcultivation, overgrazing, urbanization, and land pollution) lead to serious desertification [29]. Therefore, timely monitoring and assessment of land desertification sensitivity in China is crucial.

2.2. Data and Pre-Processing
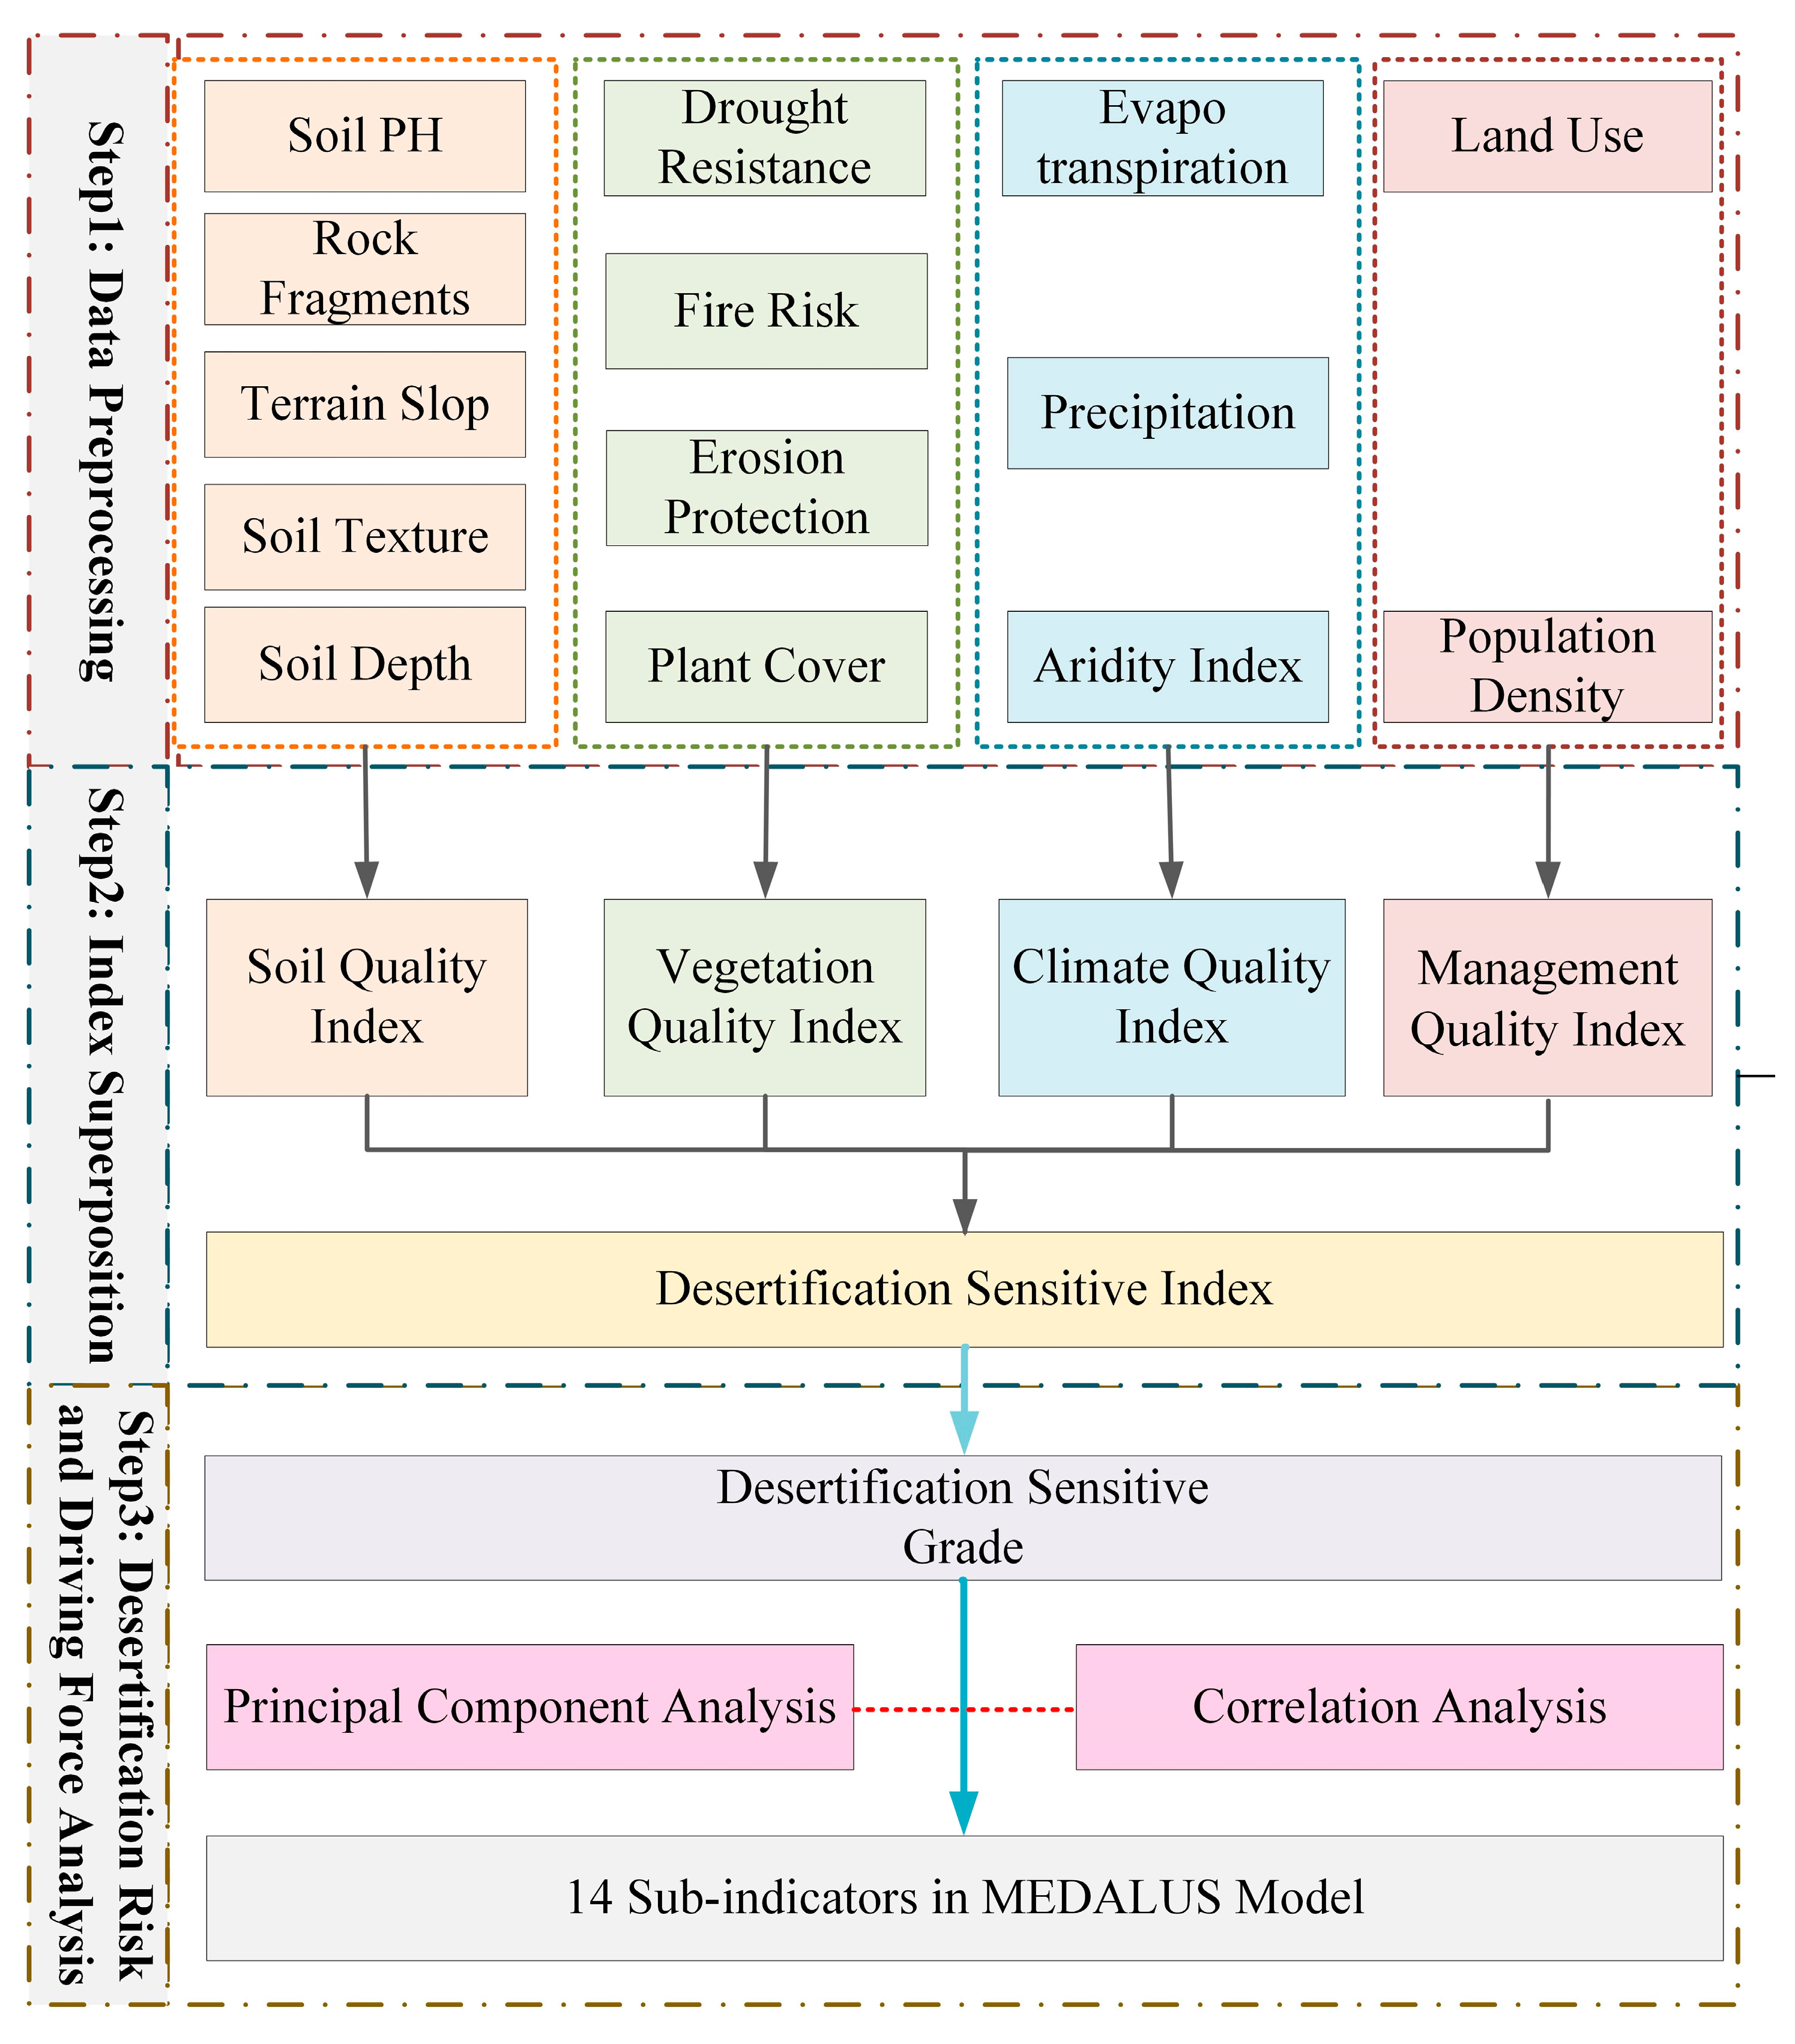
The improved MEDALUS model in this study requires data for soil, vegetation, climate, and management. The soil data included soil pH, rock fragments, terrain slope, soil texture, and soil depth, with the terrain slope data being generated via the Digital Elevation Model (DME) [30]. The vegetation data included drought resistance, fire risk, erosion protection, and plant cover. Drought resistance, fire risk, and erosion protection data were generated via reclassification of land cover classification products [28]. The climate data included evapotranspiration, precipitation, and aridity index. The aridity index was generated via processing precipitation and evapotranspiration (Equation (1)) [31]. The management data included population density and land use. The data sources and their time and spatial resolutions are detailed in Table 1.
A I = P / E T P
where A I is the aridity index; P is the annual precipitation; and E T P is the annual evapotranspiration.
For the above data, we aggregated them to the Chinese regional scale using ArcGIS. The spatial resolution of the DEM data was 250 m, and we resampled them to a resolution of 1 km using the bilinear interpolation method that is more suitable for resampling DEM data [32]. Soil pH, rock fragments, soil texture, and soil depth were continuously updated to 2018 [33,34]. The precipitation data and evapotranspiration data were continuously updated into monthly data sets [35,36,37,38,39]. After generating yearly data using ArcGIS, the average values for 2018–2020 were used to eliminate the effects of a possible extreme climate in a particular year.

3. Method

In response to the complex multi-factorial interactions in the process of desertification, the original MEDALUS model selects key indicators that have an impact on desertification from four aspects: soil quality, vegetation quality, climate quality, and management quality [23]. The contribution of each sub-indicator to desertification is expressed quantitatively as weight values, which are often set as a value between 1.0 and 2.0 [40]. The MEDALUS model shows great flexibility, reliability, and comprehensiveness in indicator selection and framework construction, and can adapt to a wide range of spatial scales and different data sources. Suitable indicators can be selected according to the natural environment of the study area [28]. The reasons for the sub-indicators chosen for this study will be elaborated in Section 3.1, Section 3.2, Section 3.3 and Section 3.4.
Compared to the original MEDALUS model, this study makes the following improvements: (1) evapotranspiration data were added to the climate quality index and slope direction data were removed. The reason is that under large-scale coarse resolution monitoring, subtle changes in topographic slope orientation are difficult to show in the assessment results. However, the vegetation covers and landscapes throughout China are various, from tropical rainforest in the south to shrub and desert in the northwest, and the evapotranspiration varies greatly, which makes evapotranspiration more suitable than slope orientation for large-scale desertification assessment. (2) The parent material data in soil quality was replaced with soil pH data. The reason for this is that land salinization, as a desertification phenomenon, is serious in semi-arid and arid land in China, and soil pH is an important indicator of the degree of land salinization; in addition, parent material data available for collection were updated more than ten years ago and do not reflect the current soil parent material conditions [8]. Furthermore, in terms of analysis methods, according to the results of the desertification risk assessment, the land in China is subdivided into eight grades, which enables the government to take management measures to cope with different levels of desertification risk. We further tested the stability within the MEDALUS model and analyzed the driving force of the selected indicators in the process of desertification.
In this study, we first classified the selected sub-indicators (soil pH, rock fragments, terrain slope, soil depth, plant coverage, evapotranspiration, precipitation, aridity index, and population density) based on the Jenks natural breaks classification method (Equation (2)) [41] and combined it with the MEDALUS model. The Jenks natural breaks classification method is a clustering algorithm for map classification which naturally classifies indicators based on their numerical distribution characteristics so that the difference between indicators of the same category is minimized and the difference between different categories is maximized. Compared to similar algorithms, such as k-means and hierarchical clustering, the Jenks natural breaks classification method has several advantages. It can adaptively determine the number of categories and is less affected by outliers or individual data points. Additionally, this classification method provides clear and interpretable results that can help to illustrate the characteristics and distribution of the data. As a result, for the purpose of map classification in this study, the Jenks natural breaks method was deemed more suitable [41,42,43]. The rest of the sub-indicators (soil texture, drought resistance, fire risk, erosion protection, and land use) were classified according to the MEDALUS model classification method. After the classification, the indicators were assigned weights according to the MEDALUS model. Then, the soil quality index, vegetation quality index, climate quality index, and management quality index were calculated separately (Equation (3)) [28]. The geometric mean of the four quality indexes of soil, vegetation, climate, and management was calculated to generate the desertification sensitivity index (Equation (4)) [28]. Finally, the desertification sensitivity index was classified into risk levels using the Jenks natural breaks classification method, followed by an analysis of the driving forces behind the desertification process. The specific process is shown in Figure 2.
S S D m n = k = 1 n A [ k ] 2 ( k = 1 n A [ k ] ) 2 n m + 1
where S S D is the variance of each classified category; m and n are the m-th and n-th elements; A is the assigned category; and k is the k-th element in category A .
Quality _ x i j = ( variable _ 1 i j · variable _ 2 i j · variable _ 3 i j · · variable _ n i j ) 1 / n i j
where i j is the row and column of a single elementary pixel of each variable; n is the number of active variables for each elementary unit; and x is the four qualities referring to soil, climate, vegetation, and management.
D S I i j = ( S Q I i j V Q I i j C Q I i j M Q I i j ) 1 / 4
where i j is the row and column of a single elementary pixel of each quality; D S I is the desertification sensitive index; S Q I is the soil quality index; V Q I is the vegetation quality index; C Q I is the climate quality index; and M Q I is the management quality index.

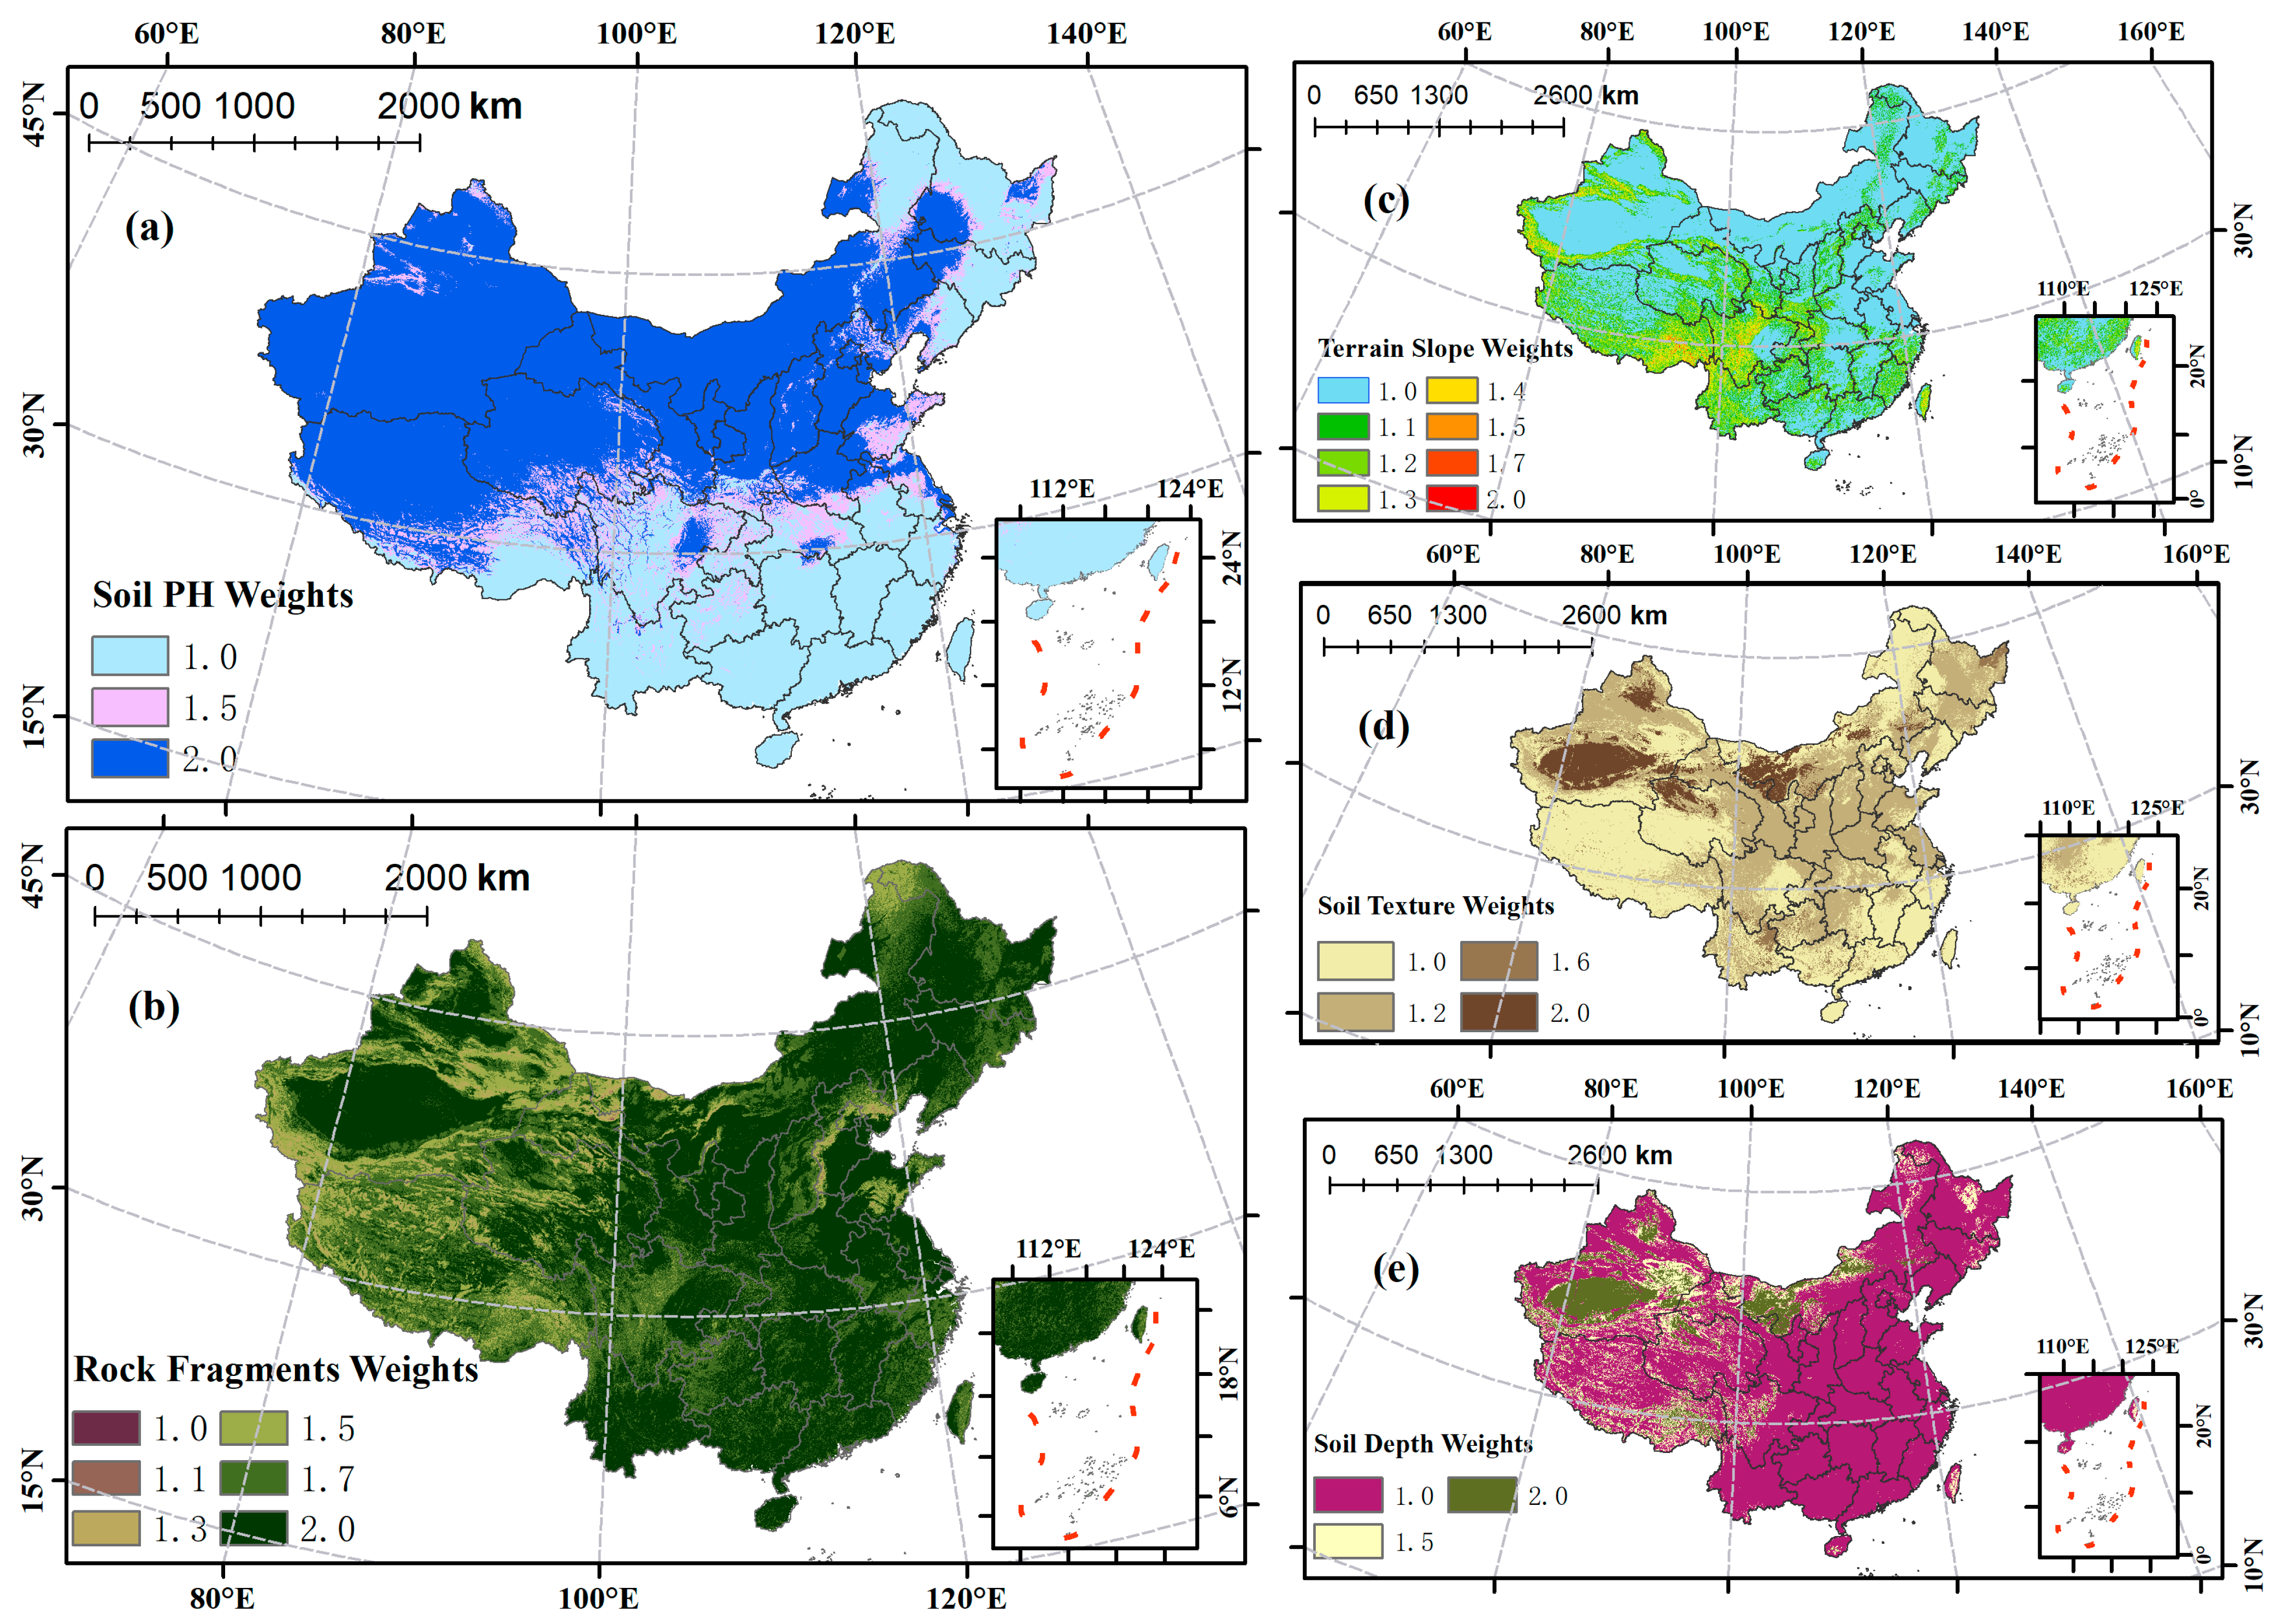
3.1. Soil Quality Index

Soil maintains biological productivity and is essential for the survival of various plants and animals in the ecosystem [44]. In this study, five sub-indexes (soil pH, rock fragments, terrain slope, soil texture, and soil depth) were selected to assess soil quality, including the chemical and physical properties of the soil, and the water retention and fertility of the soil [26,45]. This study classified and assigned weights to these five indicators based on the Jenks natural breaks classification method and the MEDALUS model (Table 2); the classification results are shown in Figure 3.

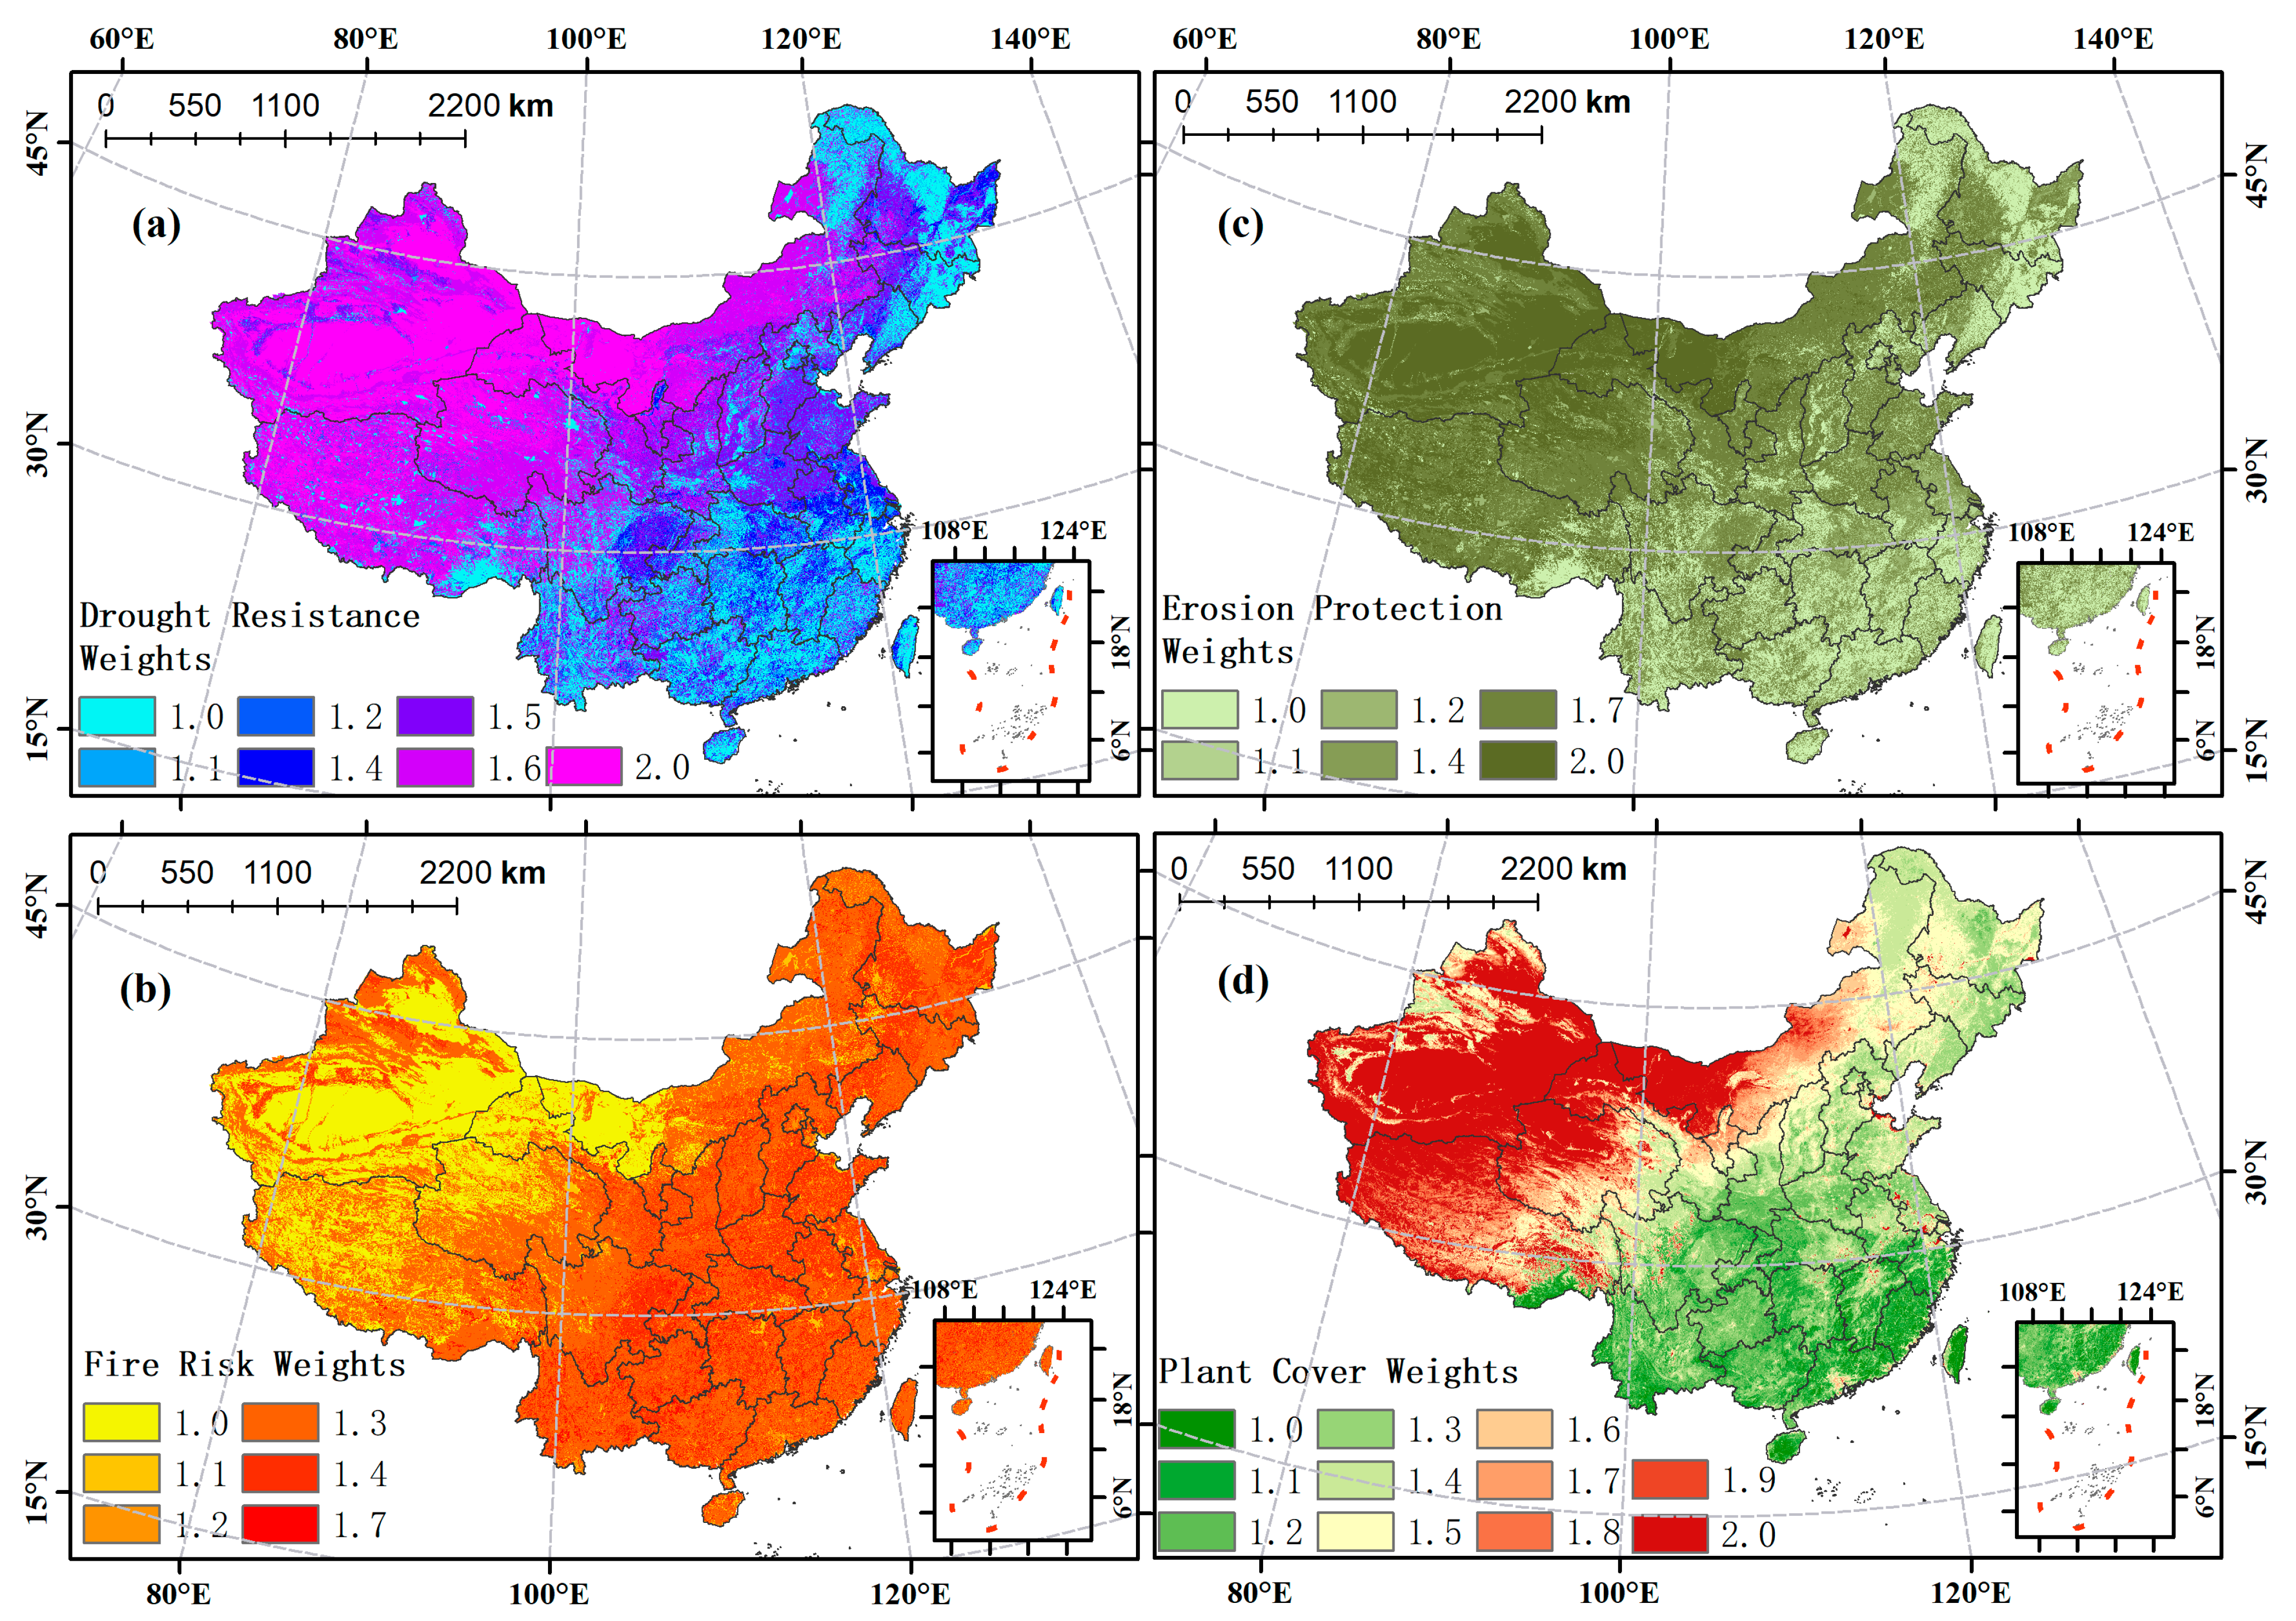
3.2. Vegetation Quality Index

Vegetation plays an important role in climate regulation, soil and water conservation, and wind and sand control, etc. It reduces runoff by promoting water infiltration and reduces soil erosion by improving soil structure and strengthening soil cohesion [46]. Based on the MEDALUS model, four indicators (drought resistance, fire risk, erosion protection, and plant cover) were chosen to assess the quality of the vegetation cover. Based on the Jenks natural breaks classification method and MEDALUS model, these four indicators were classified and assigned weights (Table 3); the classification results are shown in Figure 4.

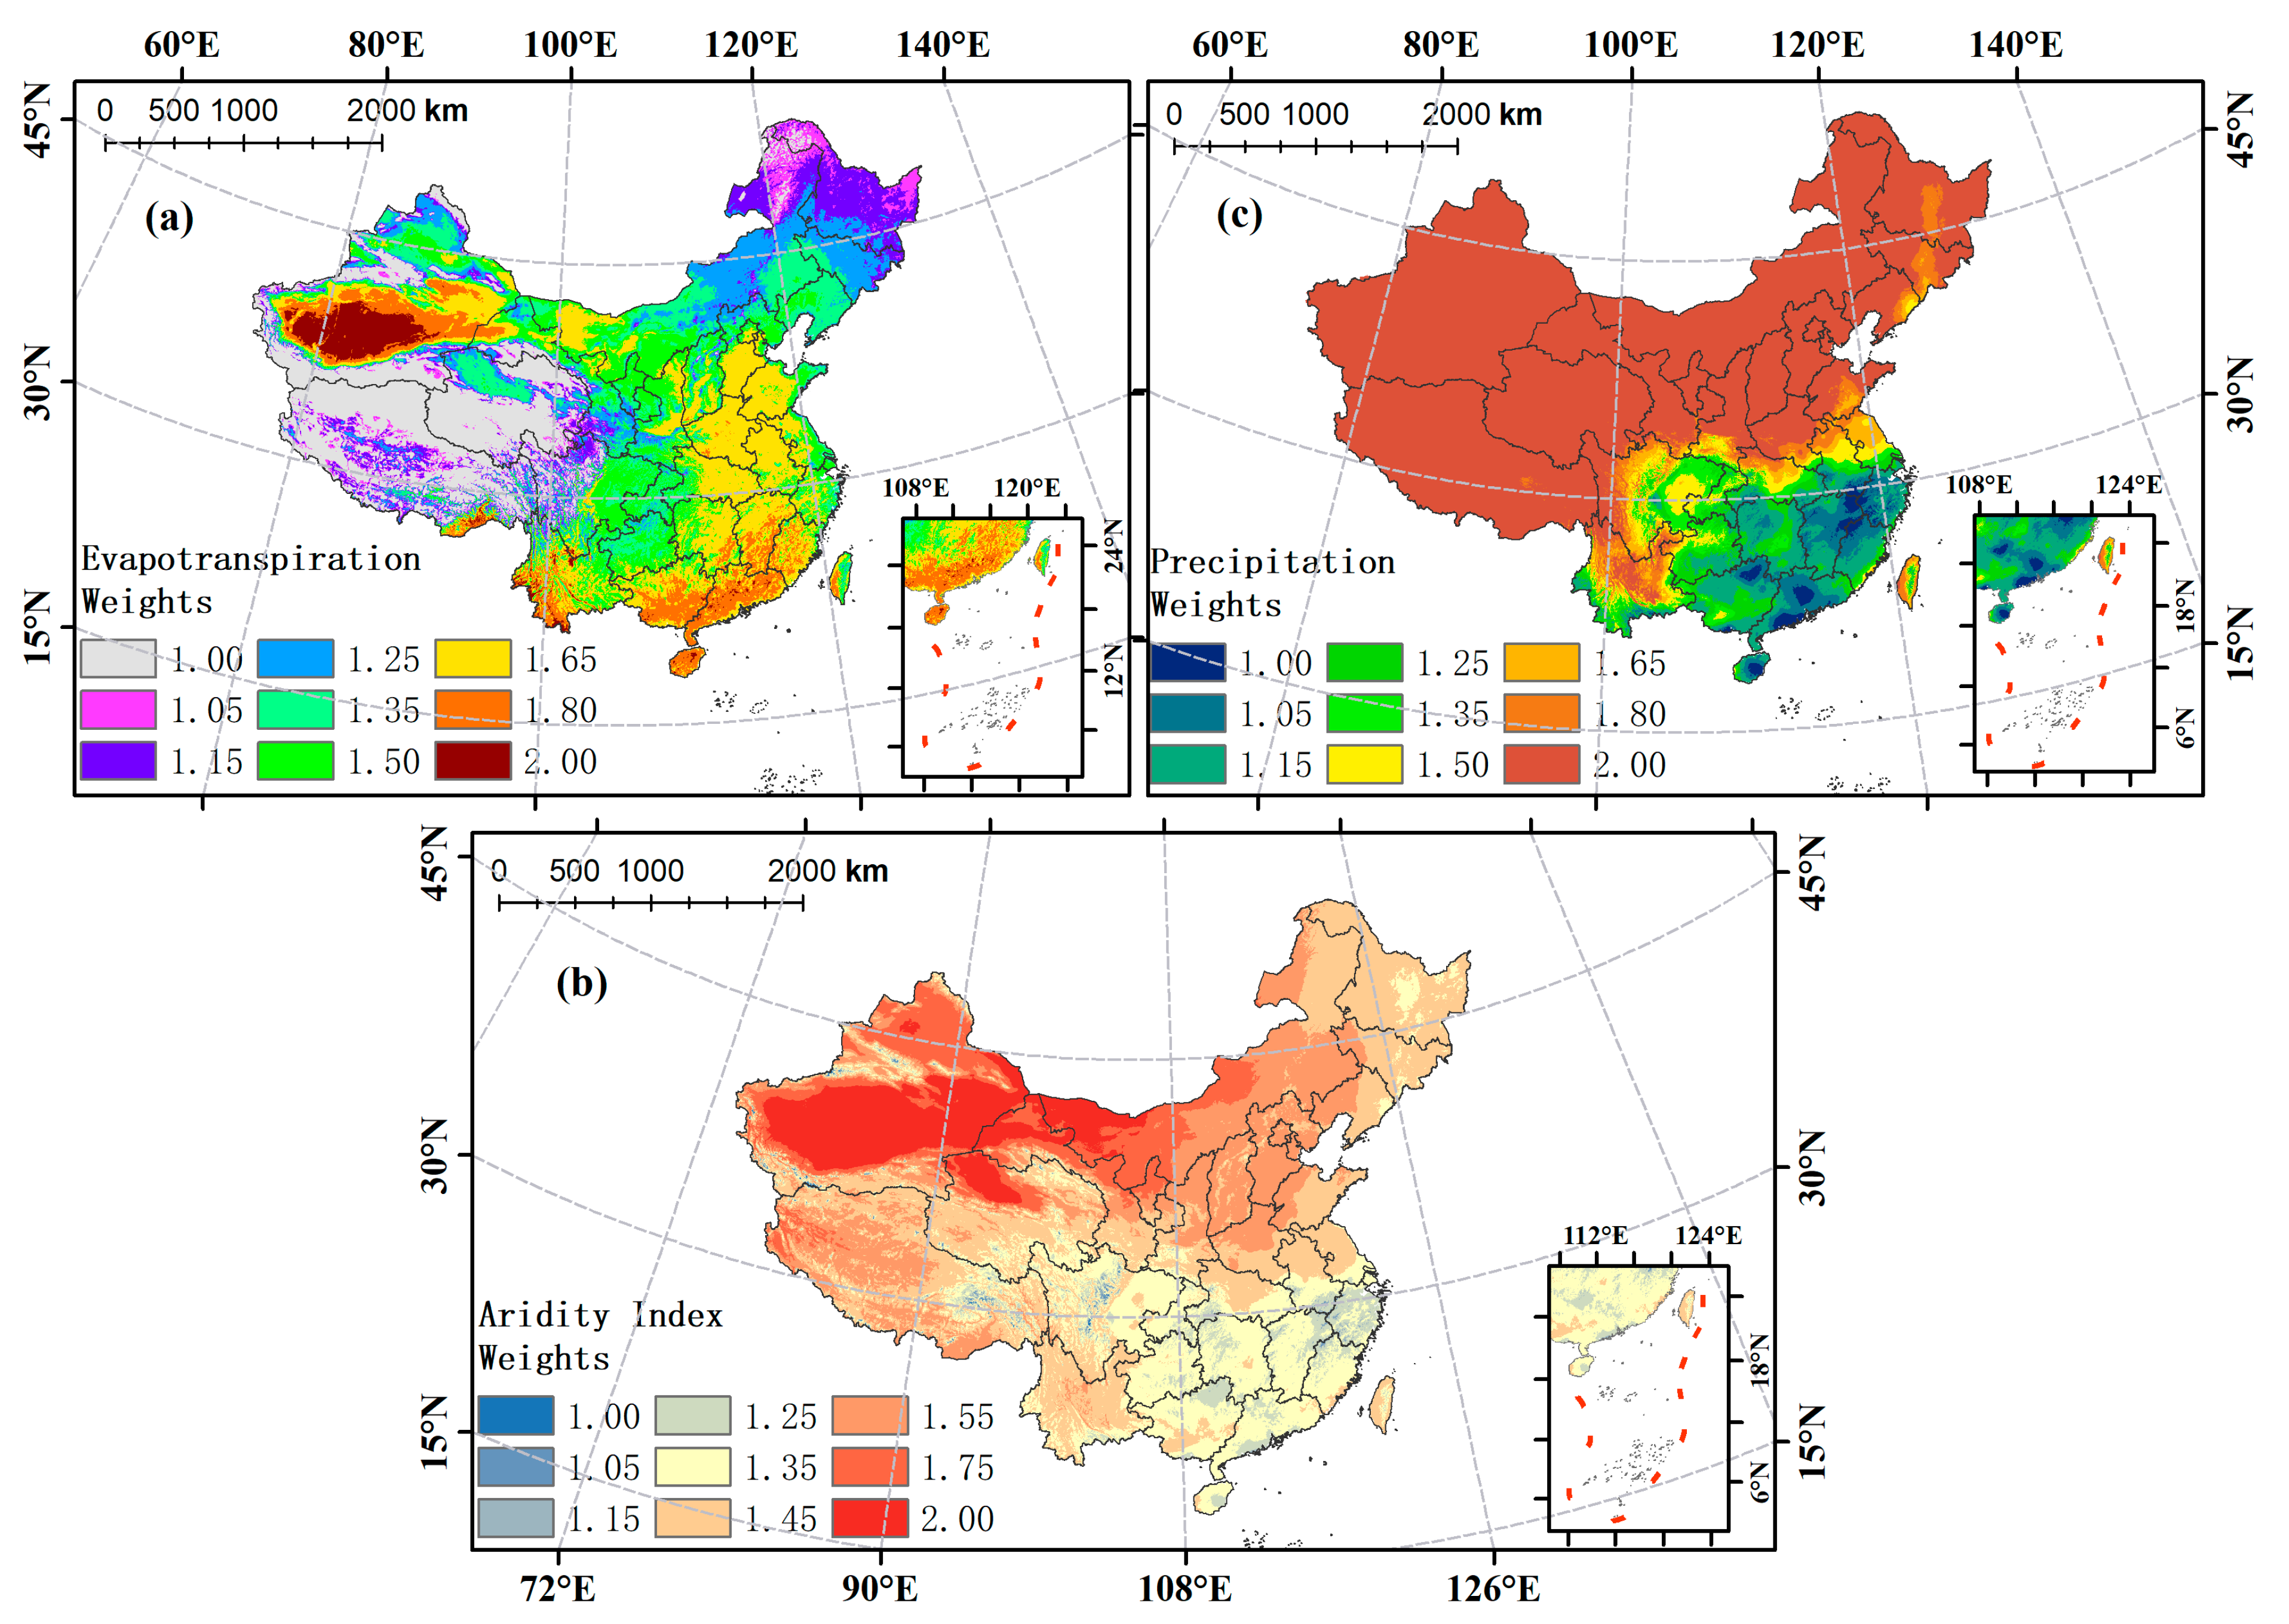
3.3. Climate Quality Index

Three indicators (evapotranspiration, precipitation, and aridity index) were chosen to assess the climate quality. The evapotranspiration, precipitation, and aridity indexes are important indicators in ecology: evapotranspiration is a channel for surface energy and water interaction and provides a scientific basis for drought monitoring [47]; precipitation determines runoff and soil water content [48]; and the aridity index is also an important basis for desertification processes. This study classified and assigned weights to these three indexes based on the Jenks natural breaks classification method and MEDALUS model (Table 4); the classification results are shown in Figure 5.

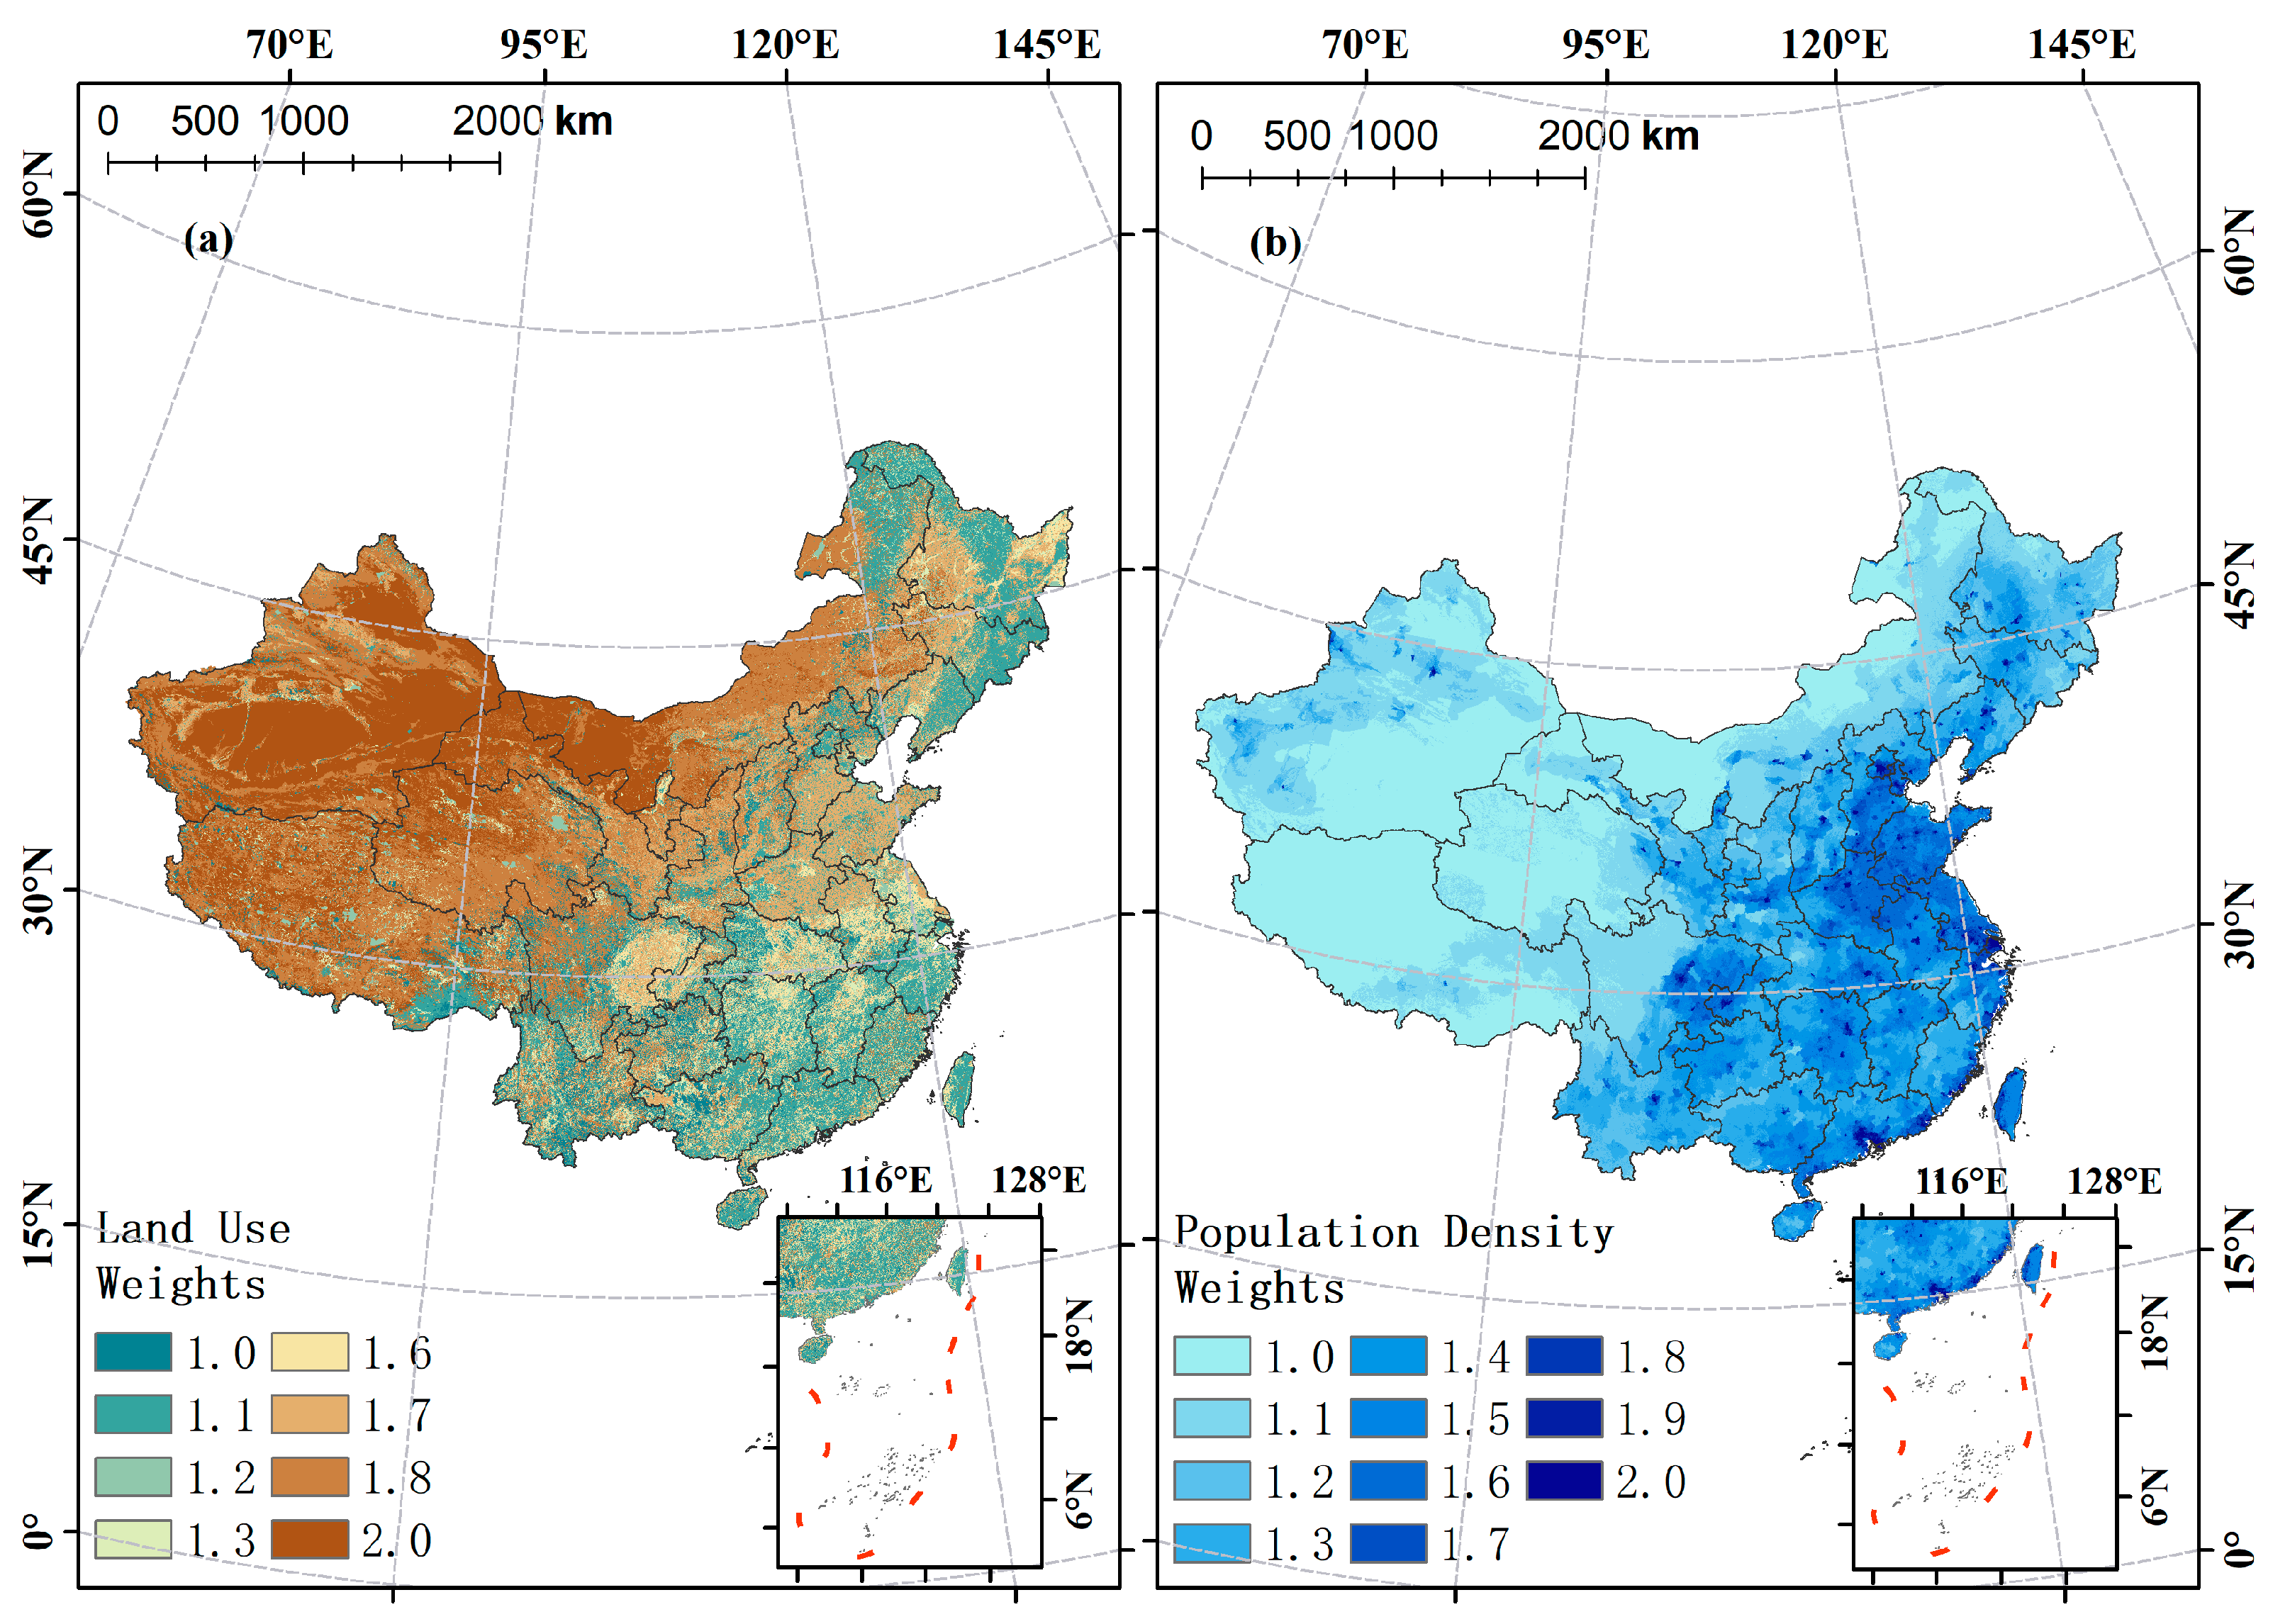
3.4. Management Quality Index

When population pressure exceeds the carrying capacity of the land, large-scale deforestation, endless grazing, and improper land use can increase the sensitivity of the land to desertification [49]. In this study, two indicators, land use and population density, were chosen to assess management quality, and they were classified and assigned weights based on the Jenks natural breaks classification method and MEDALUS model (Table 5); the classification results are shown in Figure 6.

3.5. Desertification Sensitivity Index

The desertification sensitivity index is a comprehensive index generated by the geometric mean of the soil quality index, vegetation quality index, climate quality index, and management quality index (Equation (4)). In this study, we classified the desertification sensitivity index into 8 grades based on the Jenks natural breaks classification method and described the desertification risk of different grades based on the MEDALUS model improved by Ferrara et al., (2020) [28] (Table 6).

4. Results

The spatial distributions of the soil, vegetation, climate, and management quality indexes are shown in Figure 7; the desertification sensitivity index and graded spatial distribution of desertification sensitivity are shown in Figure 8; and the area of each grade and its percentage are shown in Table 7 (excluding the South China Sea Islands). A larger value of the desertification sensitivity index indicates higher desertification sensitivity (Figure 8a), and a high grade in Figure 8b indicates a higher desertification risk.

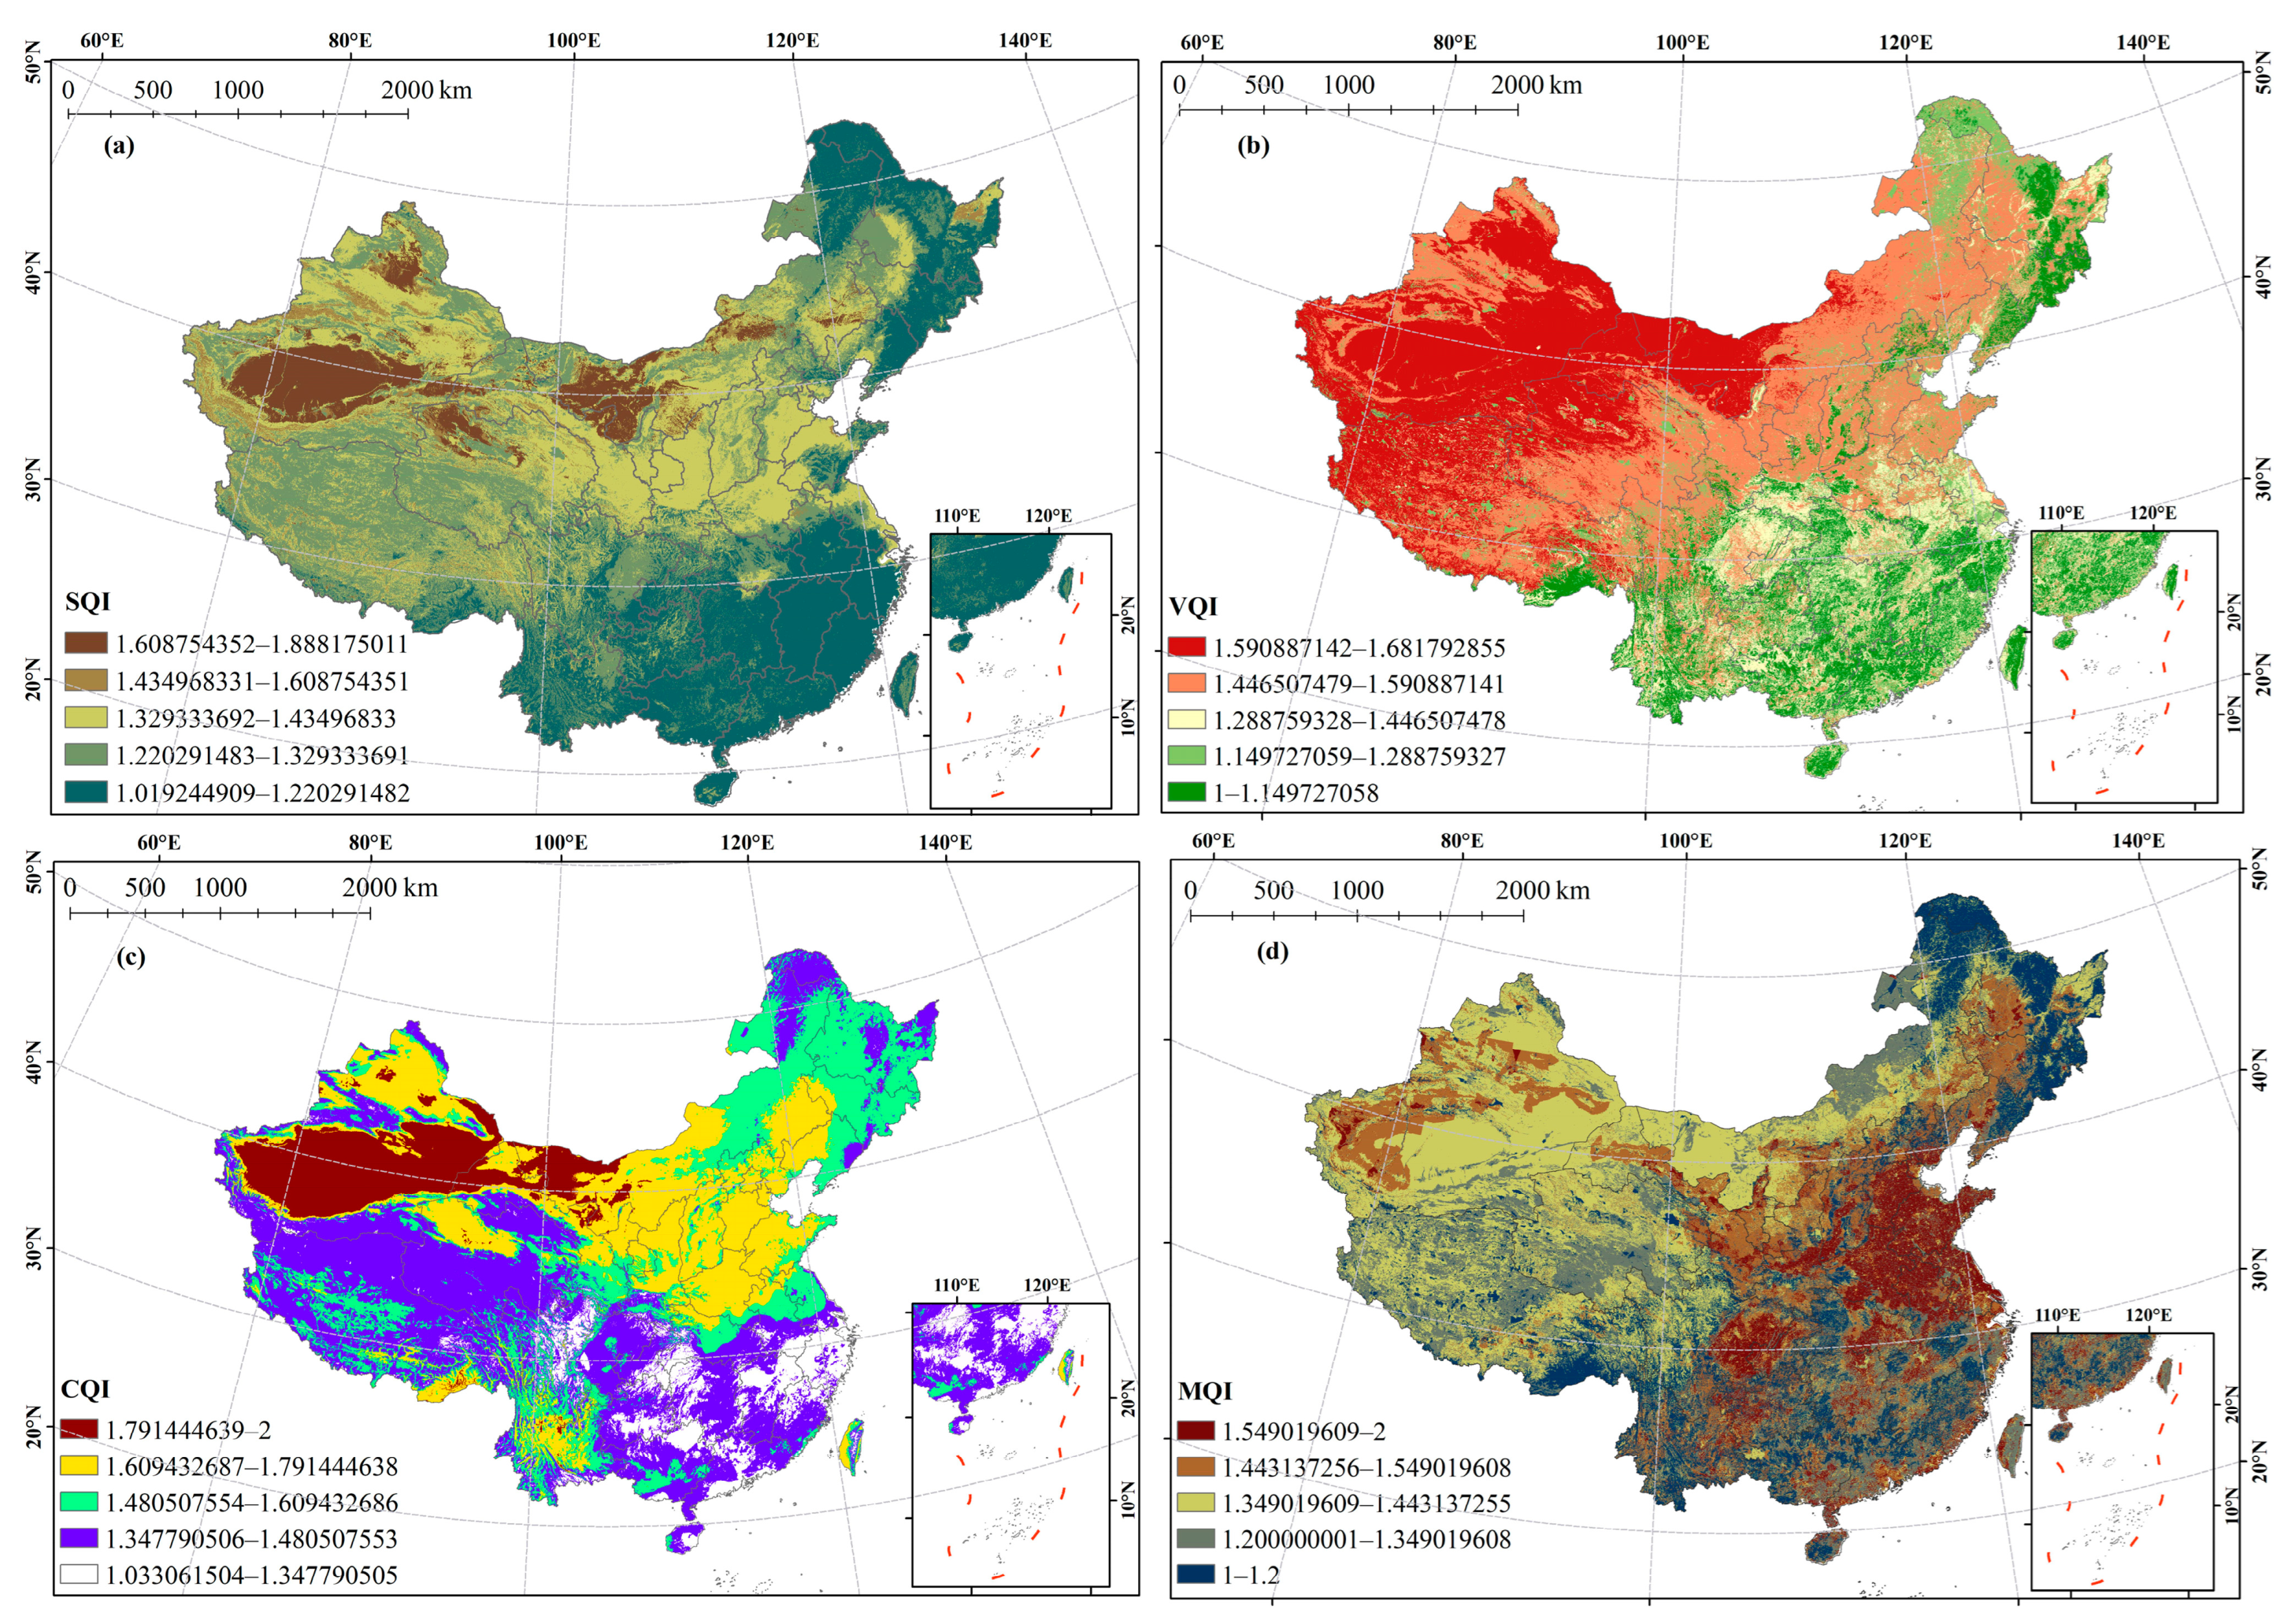
4.1. Soil, Vegetation, Climate, and Management Quality Indexes

From Figure 7a, the soil quality gradually improved from northwest to southeast China, with regions of poor soil quality mainly concentrated in the desert belt of northwest China (eight deserts and four sandy lands), such as the Taklamakan Desert (the largest desert in China) and the Horqin Sandy Land (the largest sandy in China). However, the Hulunbuir Sandy Land had slightly better soil quality compared to other deserts and sandy lands. Comparing the five sub-indicators of soil quality in Figure 3 revealed that soil pH, soil depth, and soil texture were “strong factors” affecting soil quality, while rock fragments were a “weak factor”, and terrain slope had almost no effect. It can be seen from Figure 7b that vegetation quality in southern China was significantly higher than that in the north, with vegetation quality in the east being significantly higher than that in the west. Specifically, vegetation quality in the northwest was the lowest. Comparing the four sub-indicators of vegetation quality in Figure 4 revealed that drought resistance, erosion protection, and plant cover were “strong factors” affecting vegetation quality, while fire risk had almost no effect. From Figure 7c, it can be observed that regions with harsh climate conditions were mainly distributed in the desert regions of northwest China, such as the Taklamakan Desert. Comparing the three sub-indicators of climate quality in Figure 5 revealed that the aridity index, precipitation, and evapotranspiration were all “strong factors” affecting climate quality, with the drought index had a greater impact on climate quality. From Figure 7d, the regions with poor management quality in China were mainly dominated by the Hebei, Henan, and Shandong provinces. Comparing the two sub-indicators of management quality in Figure 6 revealed that land use was a “strong factor” affecting management quality, while population density was a “weak factor”.

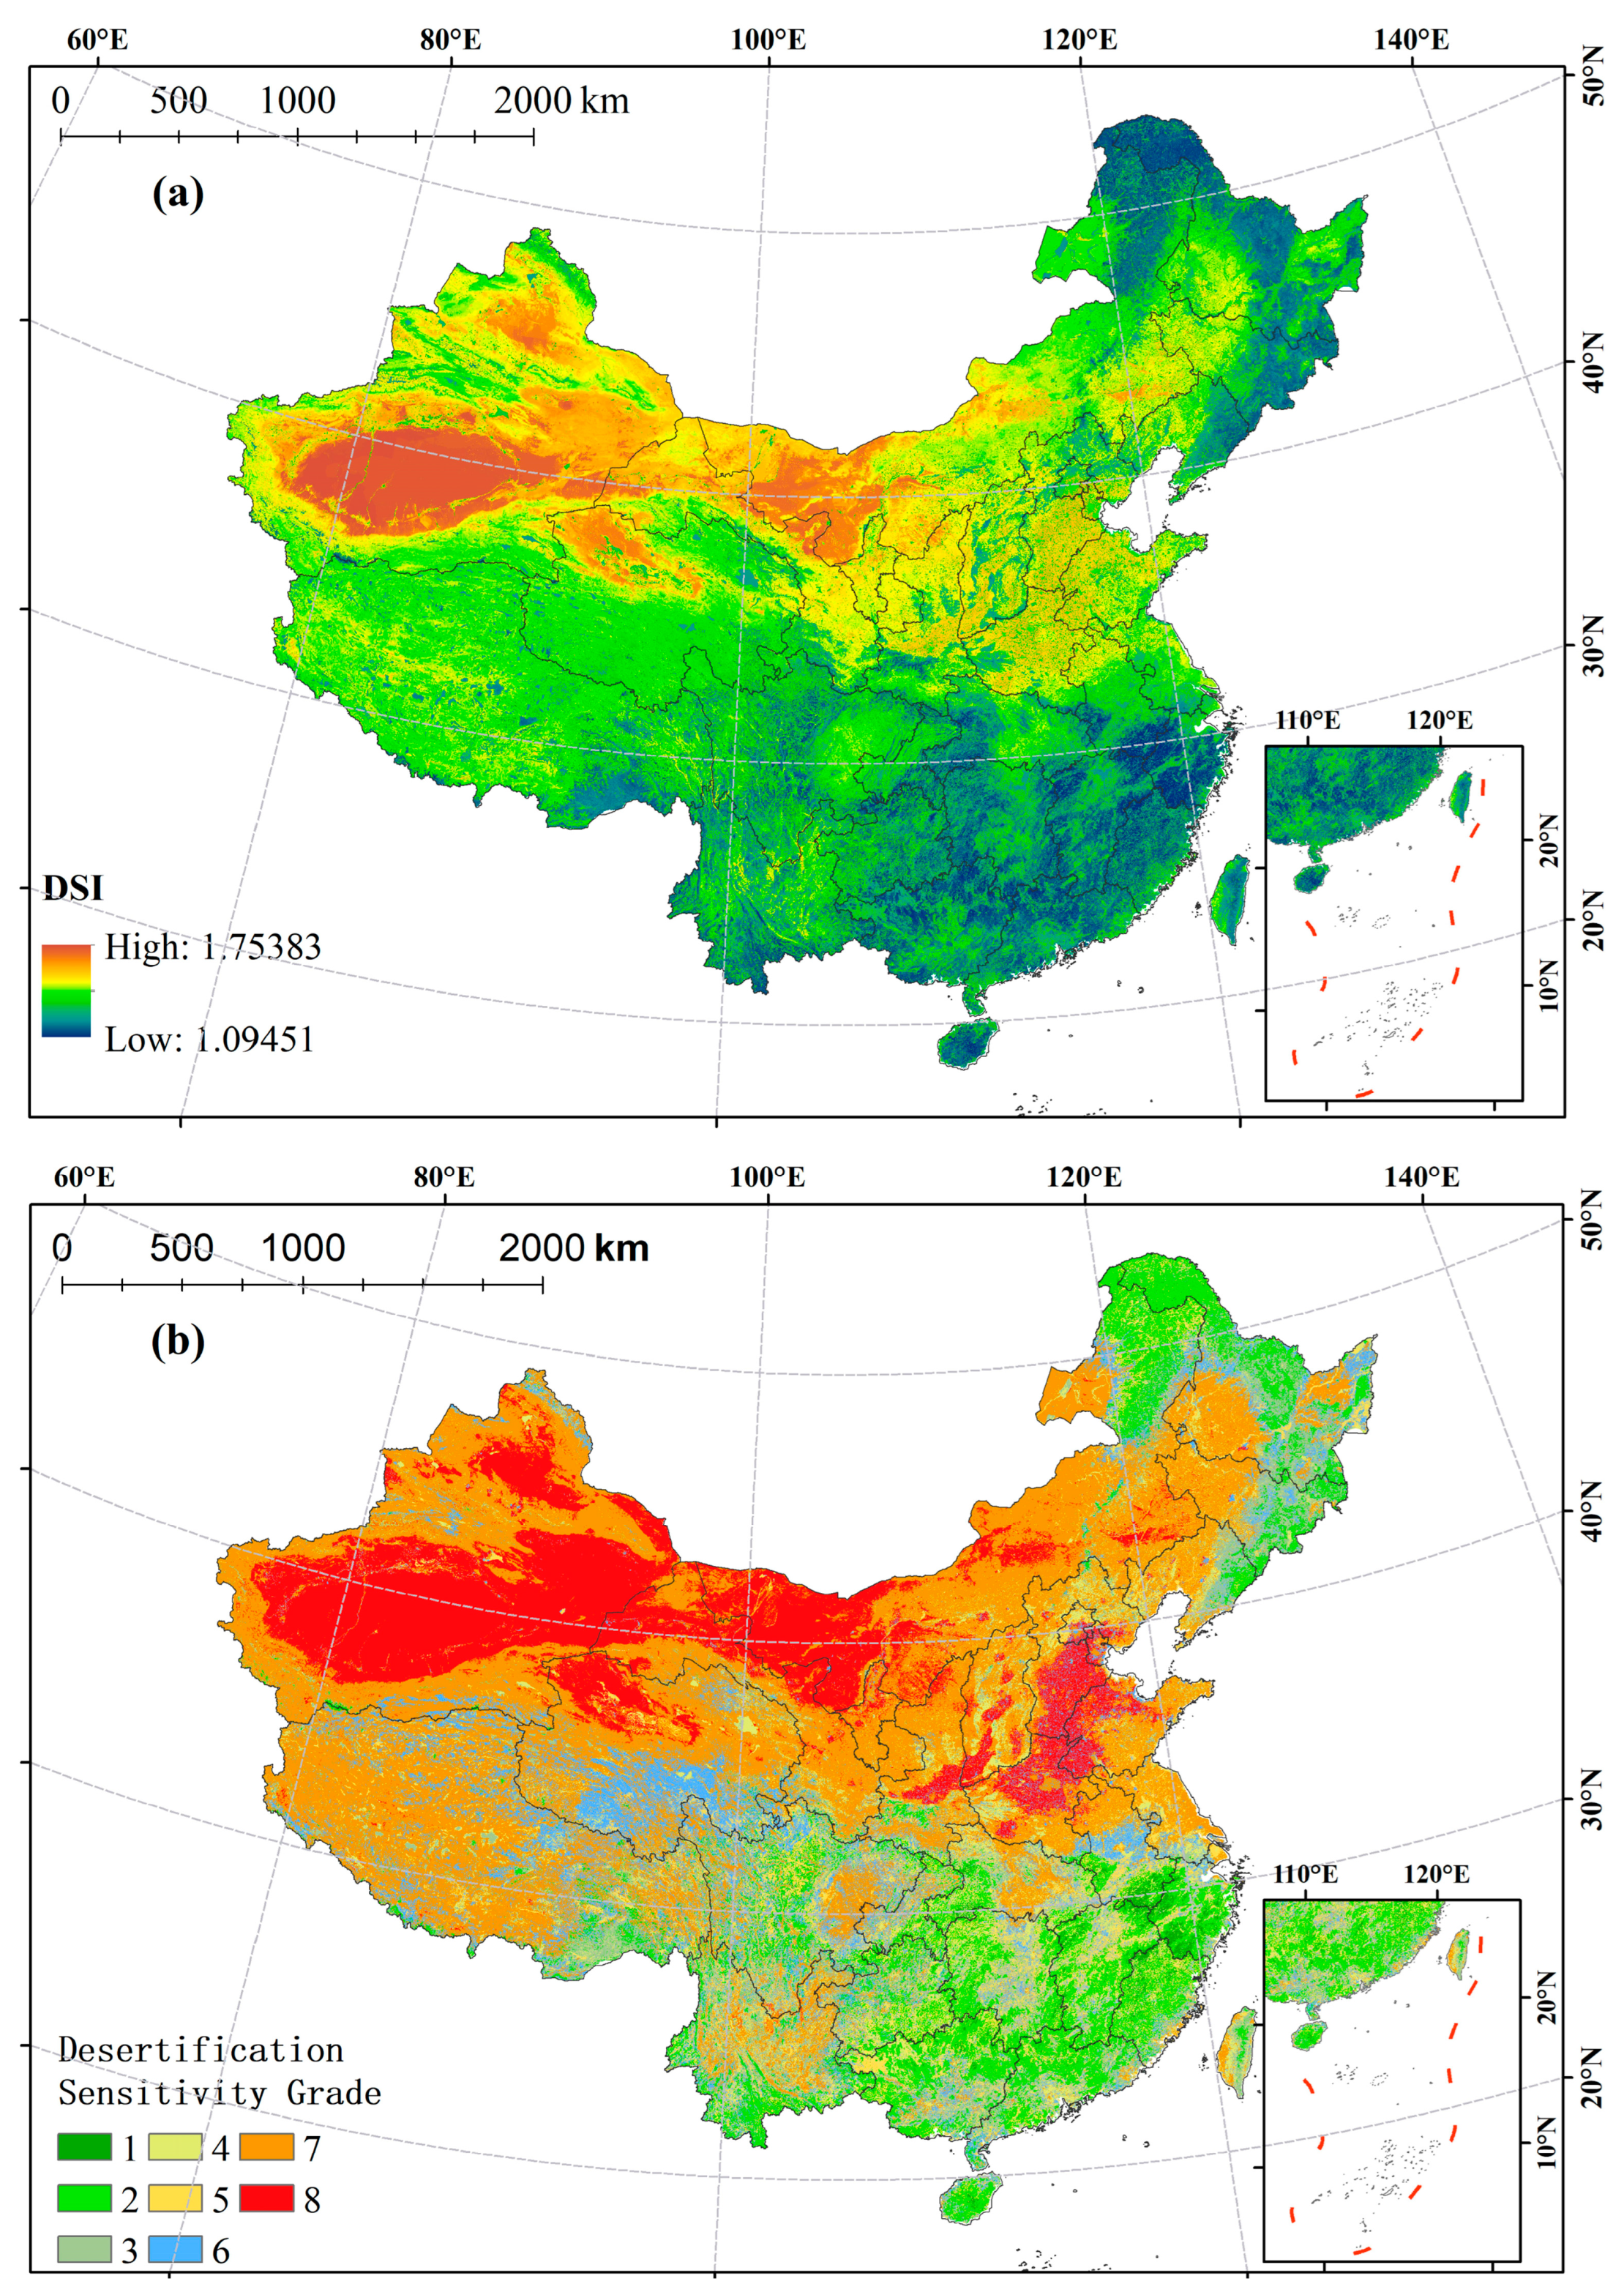
4.2. Desertification Sensitivity Index

From Figure 8a, China’s desertification susceptibility showed a spatial distribution pattern of a higher sensitivity in northwestern than in northeastern and southern China. Through the classification of desertification sensitivity levels and the statistics of the area of each level, it is found that the areas with a very low desertification sensitivity (grade 1) covered about 1,100,547.14 km2, accounting for about 11.66% of the total area of the country, mainly concentrated in southern China and northeastern China (Table 7, Figure 8b). The areas with low desertification sensitivity (grade 2) covered about 1,004,806.87 km2, accounting for about 10.65% of the total area of the country, which were distributed in regions surrounding the areas with very low desertification sensitivity (Table 7, Figure 8b). The areas with medium sensitivity to desertification (grades 3–5) covered about 4,326,269.33 km2, accounting for about 45.86% of the total surface area of the country, with the highest percentage mainly distributed in the Qinghai–Tibet Plateau and Inner Mongolia Plateau (Table 7, Figure 8b). The areas with high desertification sensitivity (grades 6 and 7) covered about 2,384,409.72 km2, accounting for about 25.27% of the total area of the country, mainly concentrated in central and northern China, and in the peripheral areas of various deserts and sandy areas (Table 7, Figure 8b). In addition, the North China Plain area adjacent to the provinces of southern Hebei, northern Henan, and western Shandong, and the Guanzhong Basin adjacent to the central Shaanxi and southern Shanxi provinces showed a high sensitivity to desertification; the areas with extremely high desertification sensitivity (grade 8) covered about 620,628.79 km2, accounting for about 6.58% of the total area of the country, mainly concentrated in the northwest desert belt, with the eight deserts and the sandy land and Gobi in the four major sandy land areas being representative of the areas with an extremely high desertification sensitivity (Table 7, Figure 8b). In summary, the spatial distribution of desertification sensitivity in China showed a distribution pattern of high in the northwest and low in the southeast. Although the overall desertification sensitivity in China was medium–low, accounting for 68.16% of the country area, the percentage of high and very high desertification was 31.84%, and it was mainly concentrated in the northwest desert belt, showing a distribution pattern of low in the desert periphery and high in the interior desert and nested together.

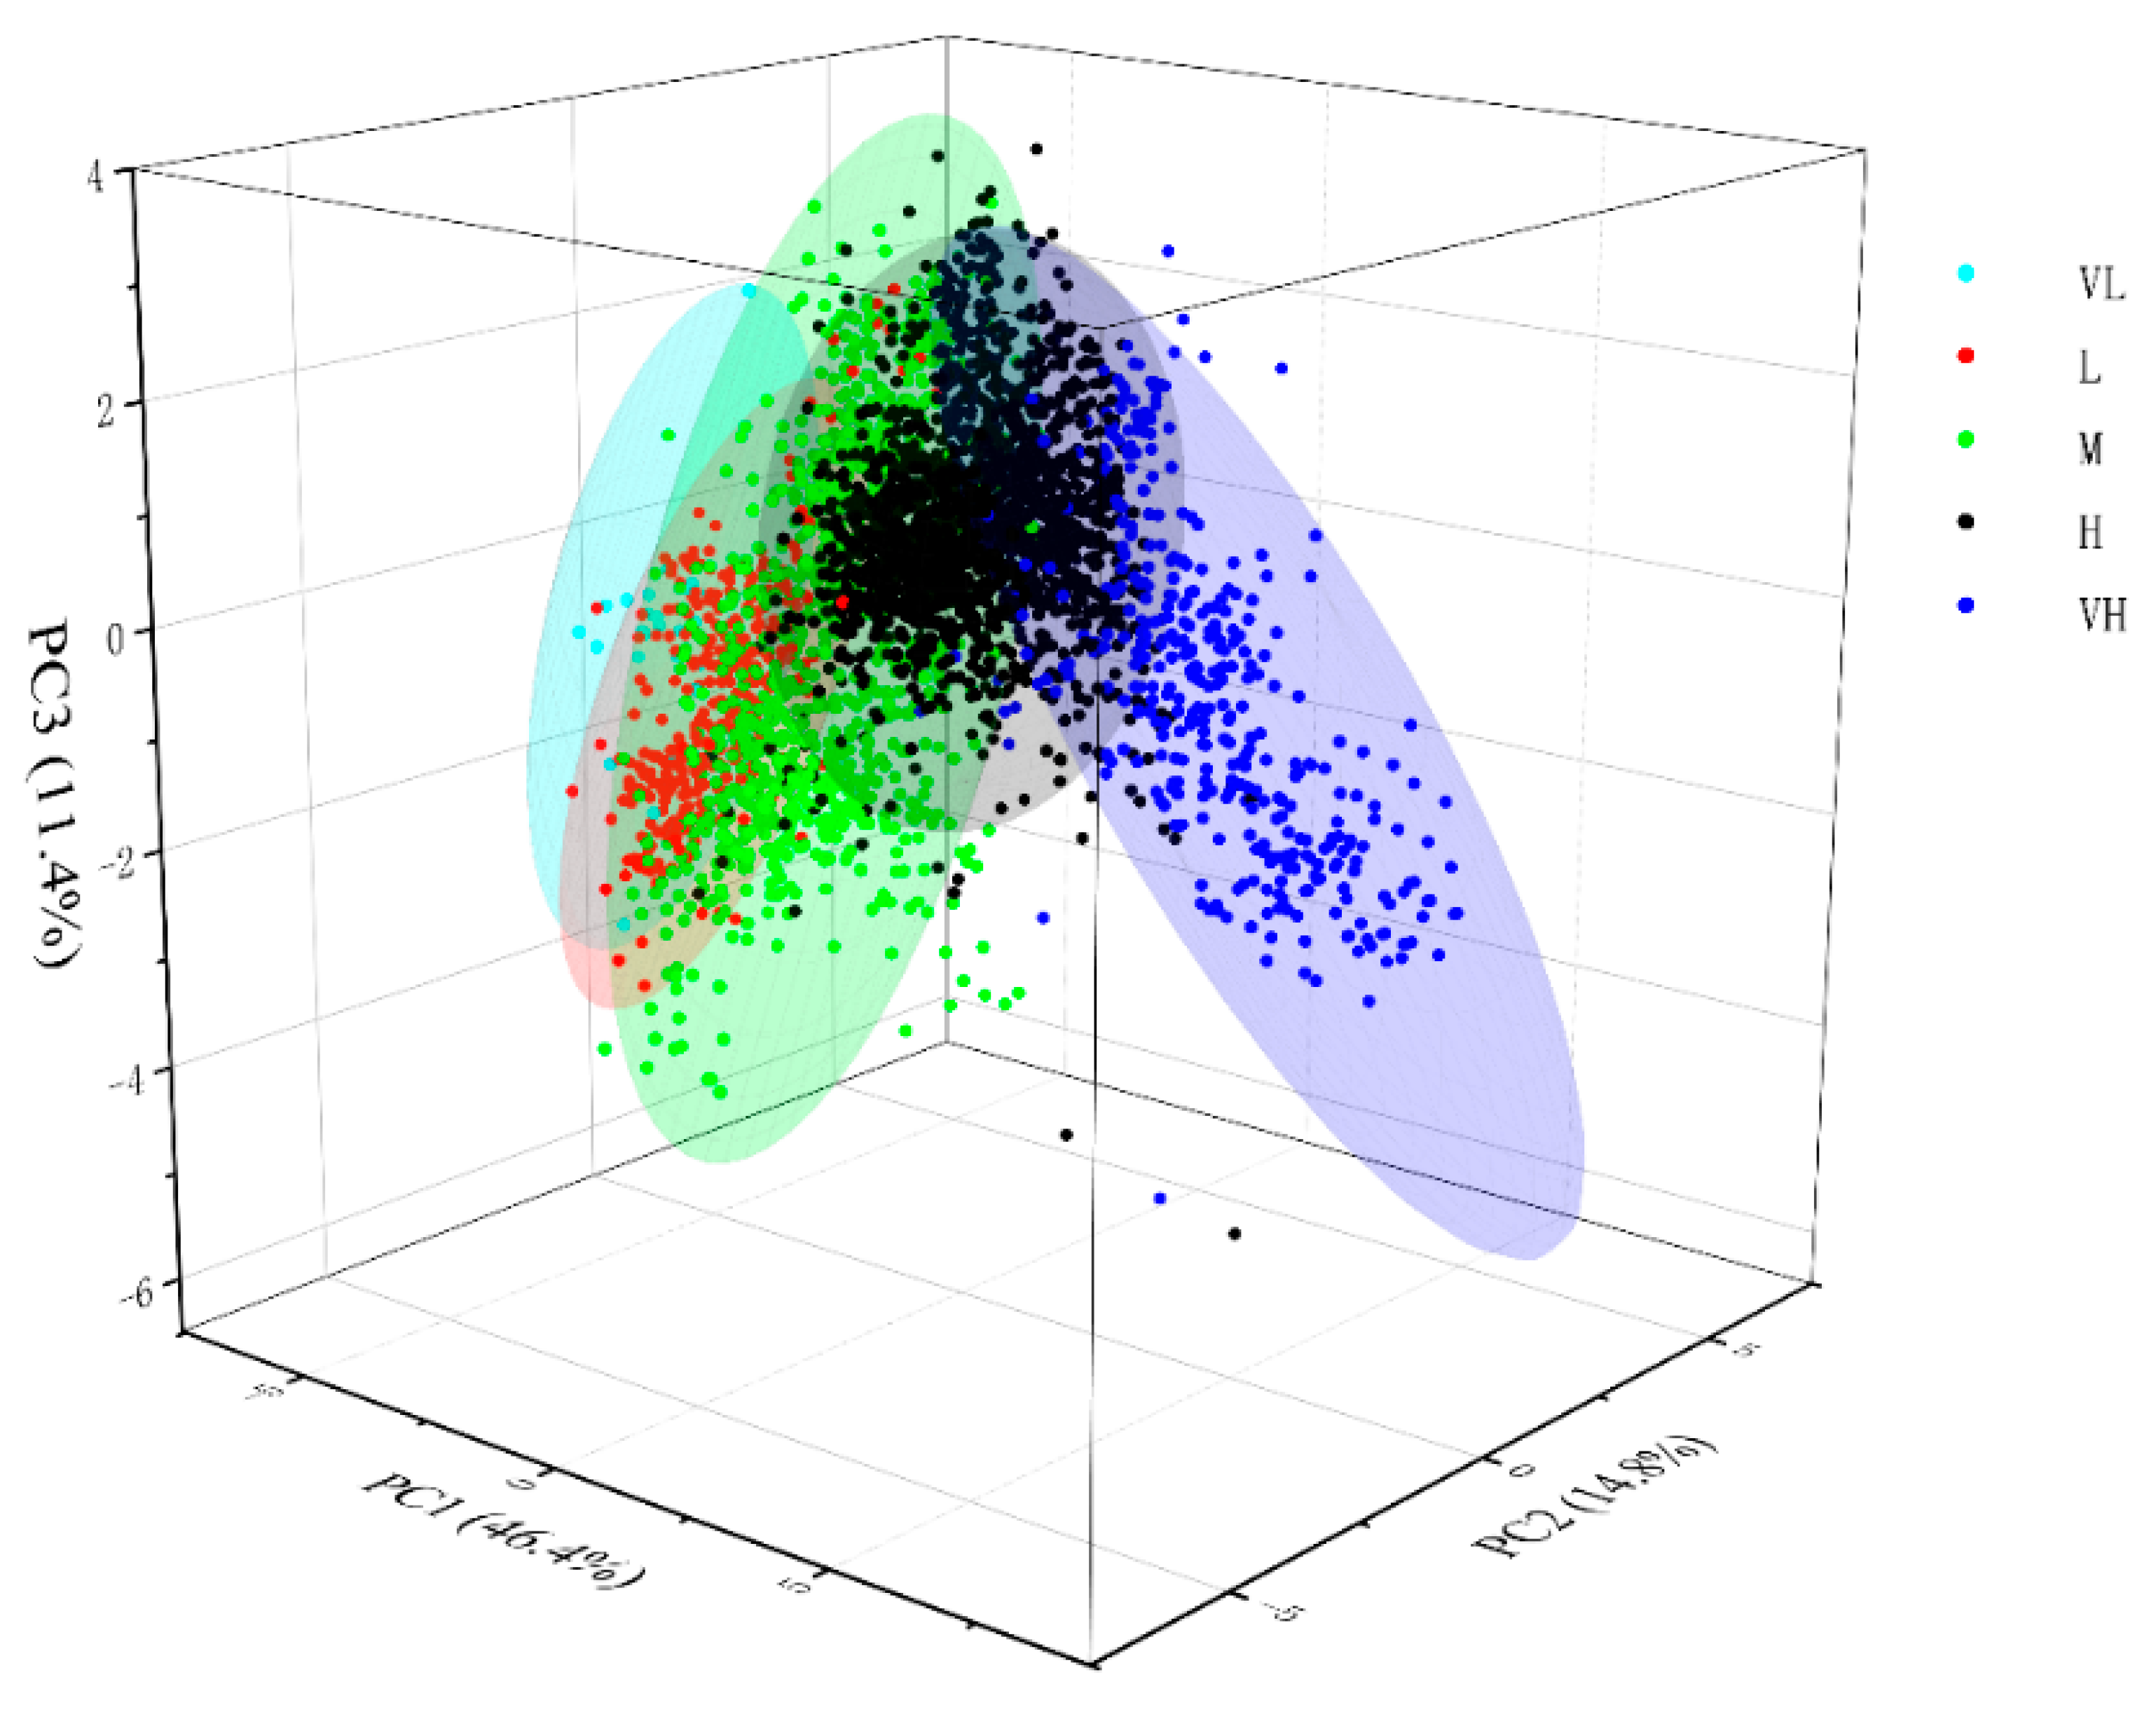
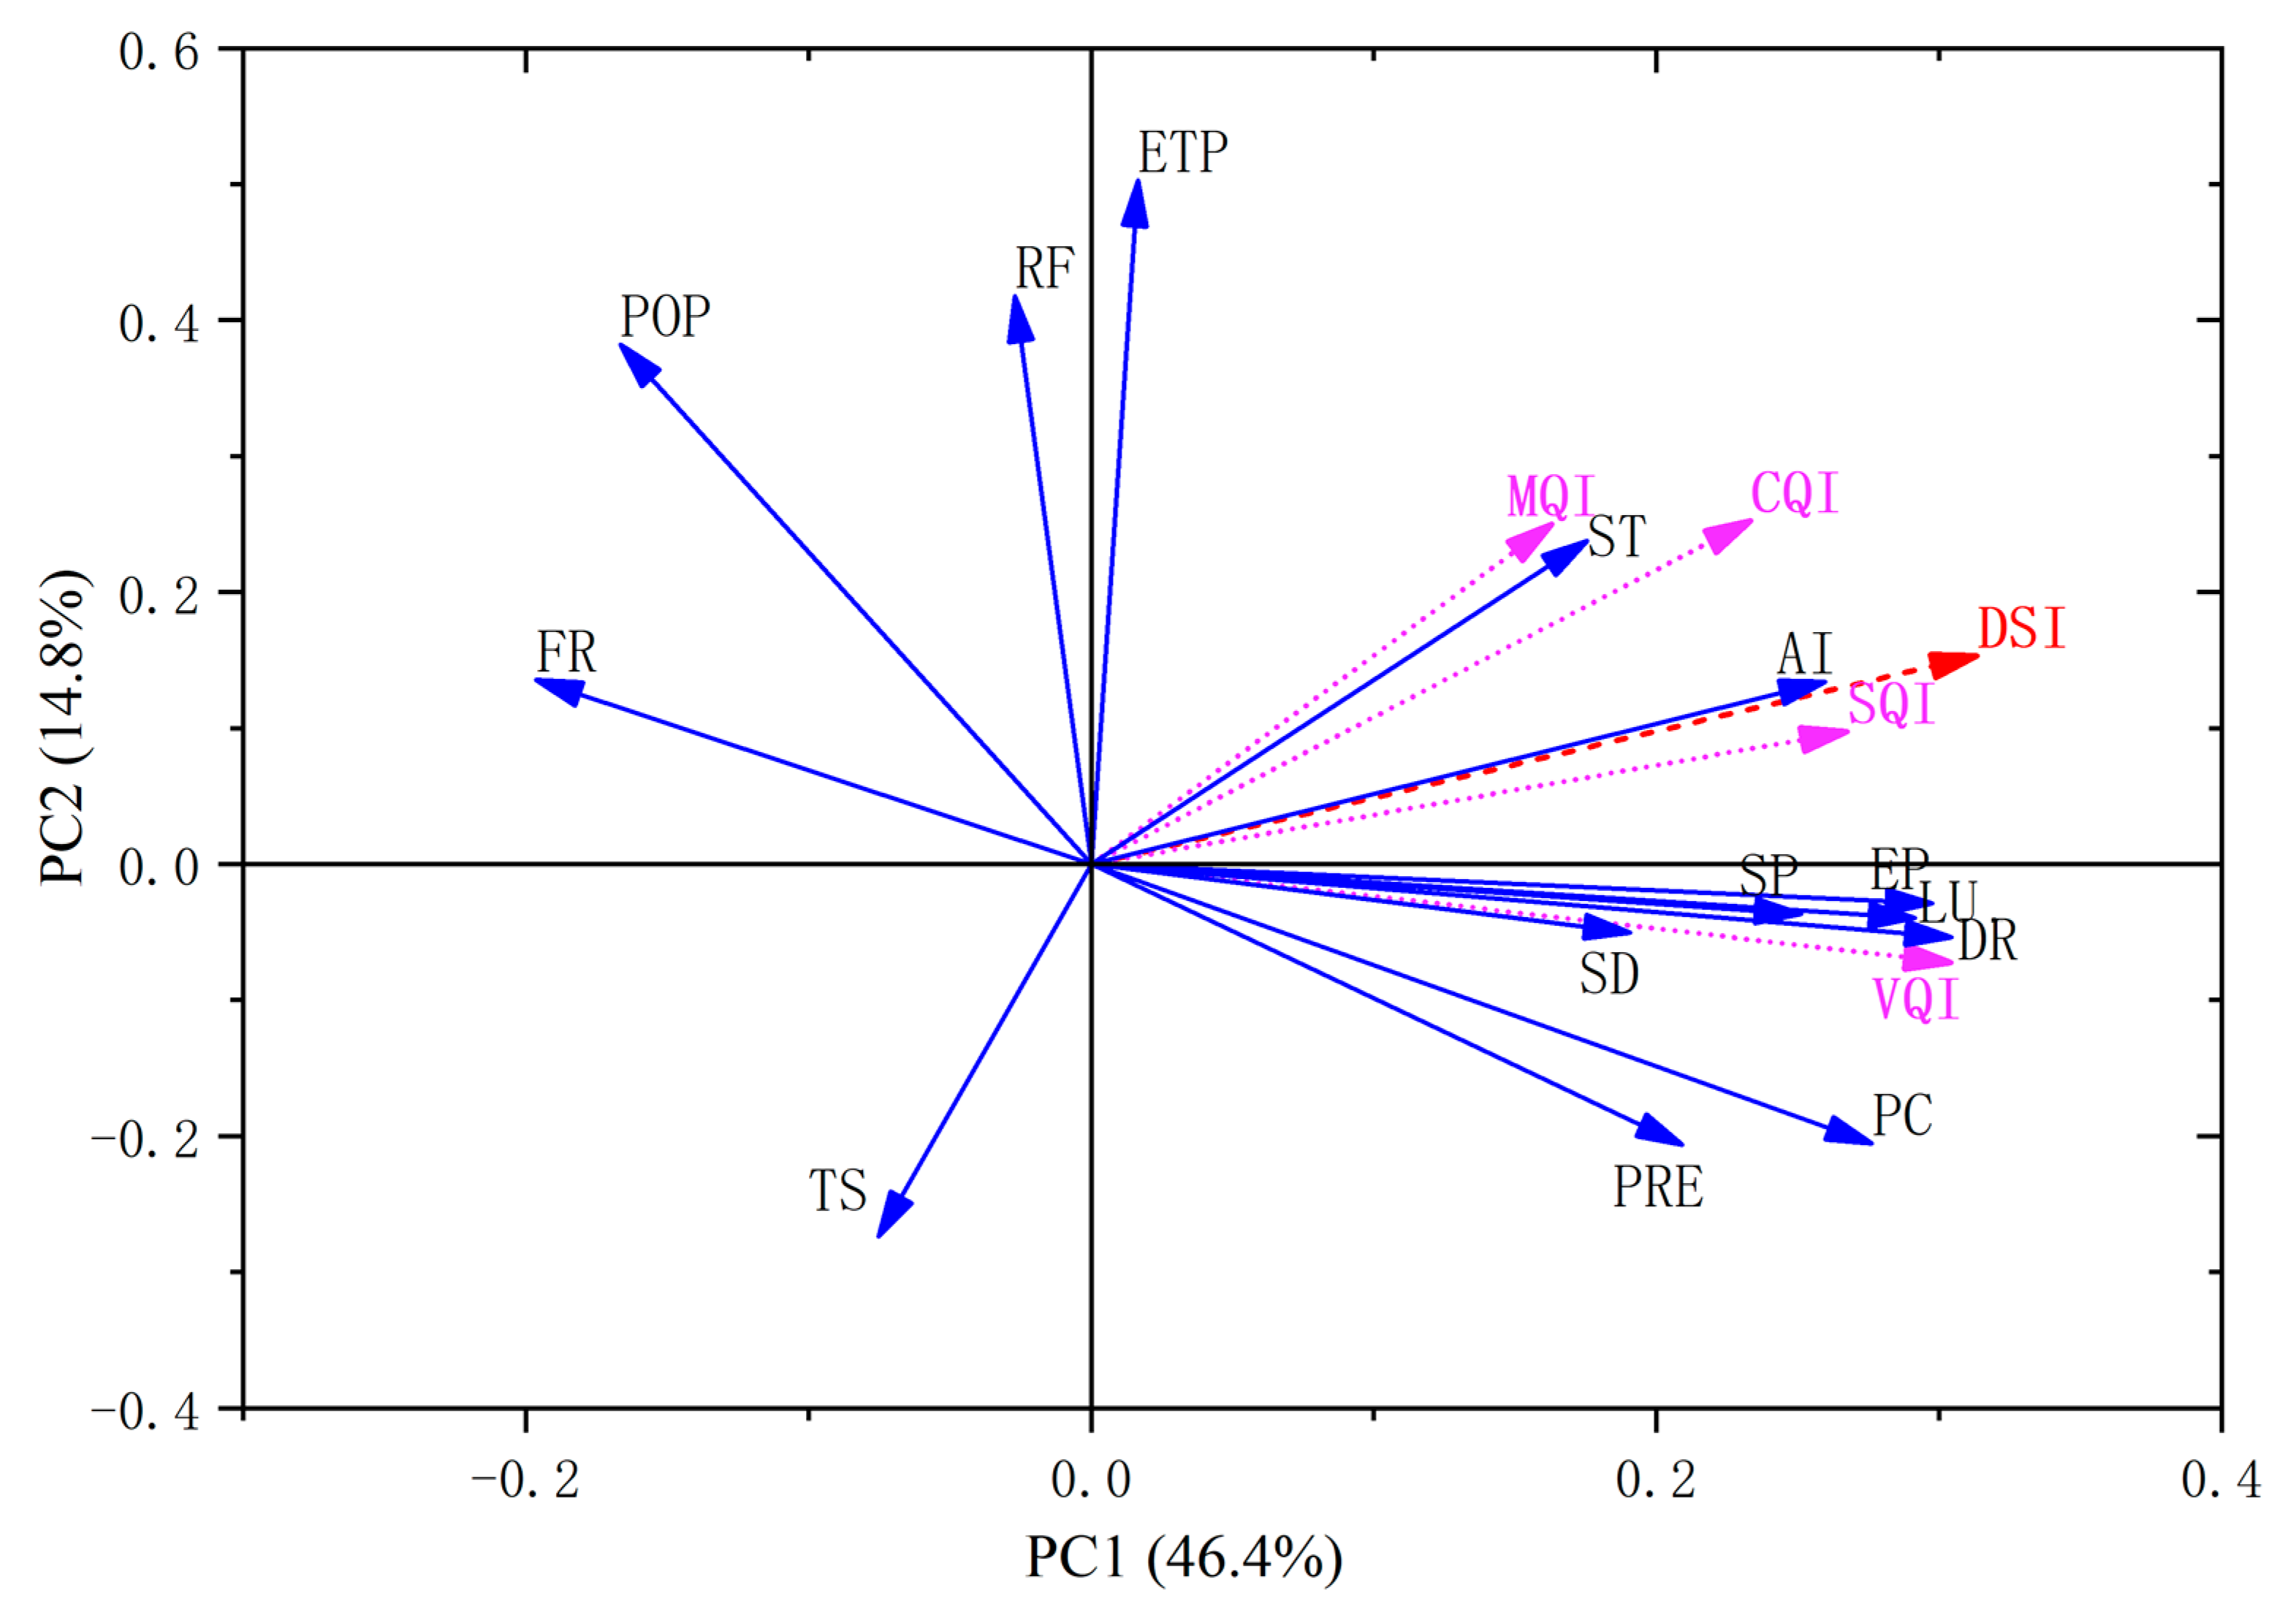
4.3. Analysis of Desertification Drivers

Firstly, sufficient uniform sampling points (a total of 11,924) were obtained in the Chinese region by creating 10 × 10 km fishing nets, dividing the sample points into five groups according to the five levels (very low, low, medium, high, and very high desertification sensitivity) classified in Table 7, and ranking the components according to their percentage of the total component variance after dimensionality reduction and extracting three principal components to obtain the principal components (Figure 9). Figure 9 showed that the three principal components explained 72.6% of the total variance, the similar sample points showed extremely strong clustering, and the clustering results of the sample points were highly consistent with the division of the desertification sensitivity index, except for some outliers, which indicated the internal stability of the MEDALUS model. Secondly, based on the extracted sample points, a principal component loadings map (Figure 10) was generated considering principal components 1 and 2 (explaining 61.2% of the variance), and a correlation heat map (Figure 11) was generated based on Pearson correlation analysis [50], which led to the identification of the overall desertification drivers in China. It was found that the magnitude of the driving force of the four key indicators on desertification sensitivity was in the order of VQI (0.84) > SQI (0.77) > CQI (0.73) > MQI (0.65), which suggested that vegetation quality was the main driver of land desertification in the country, with soil quality and climate quality as secondary drivers and management quality as a relatively weak driver. In response to this situation, in terms of sand prevention and control projects in China, the government or relevant departments can take measures to improve the vegetation quality index by reverting farmland back to forests or grasslands and controlling grazing activity, supplemented with improved soil quality and paying attention to climate change, etc., to mitigate the risk of land desertification in China.
The magnitude of the 14 sub-indicators driving desertification in China was in the following order: EP (0.84) > DR (0.83) > LU (0.82) > AI (0.73) > SP (0.70) > PC (0.65) > ST (0.54) > PRE (0.51) > SD (0.47) > ETP (0.24) > RF (0.089); population density (−0.23), terrain slope (−0.26), and fire risk (−0.39) showed negative correlations with desertification sensitivity. This indicates that erosion protection, drought resistance, and land use are the main drivers of desertification in China; aridity index, soil pH, vegetation cover, soil texture, precipitation, soil depth, and evapotranspiration are the secondary drivers of desertification in China; and soil debris content has almost no driving effect on desertification trends in China. Erosion protection, drought resistance, and land use have become the main drivers of China’s desertification process, which is closely related to the existence of a large number of native deserts and the Gobi in northwest China. The aridity index, precipitation, and evapotranspiration have become secondary drivers of China’s desertification process, indicating that the overall climatic environment of China is poor, especially in northwest China, which is deep in the hinterland of Eurasia, with little water vapor from the ocean and annual precipitation below 160 mm, forming one of the harshest arid zones in the world [51]. Soil pH was a secondary driver of the desertification process in China, which confirms, to some extent, that the current salinization of semi-arid and arid land in China is serious [8]. Based on the above research results, the spread of primary deserts should be focused on in the process of land desertification control in China. Since climate has a lagging effect on desertification, the monitoring of China’s climatic environment is also a priority in the control of land desertification in China; it is also necessary to pay more attention to the problem of soil salinization.

5. Discussion

5.1. Discussion of the Reliability and Pros and Cons of the MEDALUS Model

The regions with a high and very high desertification sensitivity assessed in this paper were mainly concentrated in the desert belt of northwest China, including Xinjiang, Gansu, Qinghai, inner Mongolia, and other provinces, which is consistent with the previous results [19,51]. Guo et al., (2020) [51] calculated the land desertification sensitivity index in the arid zone of northwest China based on a spatial distance model and found that the highly sensitive areas were mainly distributed in most areas of the Junggar Basin, Tarim Basin, and Inner Mongolia Plateau, including the Taklamakan Desert, Badain Jaran Desert, and Tengger Desert hinterland. Xu et al., (2019) [19] constructed the Land Desertification Sensitivity Index (LDSI) to assess desertification in northern China and found that the highly sensitive areas were mainly distributed in the eastern part of the Horqin steppe, Qaidam Basin, Tarim Basin, and Junggar Basin. Although the methods used in this study differ from those of previous research, the assessed desertification-sensitive areas in northern China were highly consistent, which further confirmed the rationality of the MEDALUS model in desertification sensitivity assessments in China and the reliability of our results.
In comparison with similar models for assessing desertification sensitivity, such as the spatial distance model [51] and LDSI assessment method [19], the MEDALUS model has a broader applicability to different types of desertification areas, and it is especially advantageous in large-scale assessments. This model is capable of integrating various factors that contribute to desertification, including natural and human factors, leading to more accurate assessment results, which is why it was chosen for this study. However, the MEDALUS model also has some limitations. Firstly, the model’s complexity is high, since it needs to consider a range of factors and collect a large amount of data for numerous calculations, which makes it costly to apply and implement. Secondly, the model’s targeting is relatively weak as it is applicable to different types of desertification assessments. However, the specific influencing factors of desertification in different regions may differ and vary. Therefore, fieldwork verification would improve the model’s accuracy.

5.2. Discussion of Localized Highly Sensitive Areas

This study found that the junction areas among Hebei Province, northern Henan Province, western Shandong Province, central Shaanxi Province, and southern Shanxi Province, showed a high sensitivity to desertification (Figure 8b). Since the newly discovered, highly sensitive areas are close to the capital city of China (Beijing), once the desertification level is elevated, wind and sand disasters will directly influence Beijing, causing serious impacts on the residents’ living health, the ecological environment, and economic development. In this study, we identified and extracted two regions (Figure 12) outside the northwest desert belt. Despite their different landscape types (region A is predominantly plains, while region B is predominantly basin), both regions were characterized by dryland land use and exhibited a high risk of desertification. To investigate the driving forces of desertification in these two regions, we randomly selected 1000 uniformly distributed sample points in each region and generated correlation heat maps (Figure 13 and Figure 14). Through this quantitative analysis, we aimed to identify the key factors contributing to desertification in these two areas.
From Figure 13, it can be seen that the four main indicators drove desertification in region A (MQI (0.91) = VQI (0.91) > SQI (0.31) > CQI (0.0062)). The management quality index and vegetation quality index were the main drivers of desertification in region A, soil quality index was the secondary driver, and climate quality had almost no driving effect on region A; these results indicate that poor quality of vegetation due to poor human management may be the main reason for the high sensitivity to desertification in region A. Among the 14 sub-indicators, drought resistance (0.91), erosion protection (0.91), and land use (0.90) were the main drivers of region A. From Figure 14, the four main indicators driving desertification in region B were VQI (0.87) > MQI (0.86) > CQI (0.20) > SQI (0.14), which shows that vegetation quality and management quality were the main drivers of desertification in region B, and climate quality and soil quality were the secondary drivers. Among the 14 sub-indicators, erosion protection (0.87), land use (0.84), and drought resistance (0.84) were the main drivers of region B. In this paper, the junction areas of southern Hebei Province, north-central Henan Province and western Shandong Province, central Shaanxi Province, and south-central Shanxi Province were considered densely populated, and the land use type was mostly dry farmland, with excessive cultivation and irregular use of chemical fertilizers leading to soil erosion and severe salinization of the land. In addition, extracting groundwater for agricultural irrigation leads to a decrease in groundwater level and soil moisture content, exacerbating the risk of soil desertification. Hence, the susceptibilities to desertification in region A and region B were high. In addition, both region A and region B are close to the ancient Yellow River path, and the erosion phenomenon may be the source of sand in both places. However, in China, government policies have mostly focused on controlling wind and sand in the northwest region, while overlooking desertification in other areas. To address the high risk of desertification in regions A and B, relevant policies should be formulated to avoid over-exploitation of natural resources, ensure a balanced industrial structure, reasonably allocate agricultural and forestry resources, control the development of agricultural resources, and promote the conversion of farmland to forests in the affected areas. For densely populated areas that are highly sensitive to desertification, the government should also consider reasonable diversion and the implementation of ecological migration policies to promote coordinated and sustainable development of the environment and society.

5.3. Recommendations Related to Land Desertification Control and Restoration in China

Humans are the victims of land desertification, and, to a certain extent, they also play a role in triggering land desertification. Within the context of harmony between humans and nature, the environmental problem of land desertification in China is still serious; therefore, based on the results of this paper, the following suggestions are proposed for the future prevention and control of desertification.
(1)
In our study, among the four major indicators, vegetation quality was the main driver of land desertification in China. In this regard, in the process of desertification control in China, we can improve vegetation cover and establish a green barrier to stop the expansion of desertification by strengthening policies such as grazing bans and grazing rotation. Among the 14 sub-indicators, erosion protection, drought resistance, and land use were the main drivers of desertification, which can be reduced by reducing land erosion, improving land drought resistance, and strengthening the control over land use.
(2)
For native deserts and the Gobi (grade 8), the focus of desertification control should be to establish artificial wind and sand forests to stop the spread of desertification to surrounding areas. For non-native deserts and Gobi regions with a high sensitivity (grade 6 and 7), the degradation of land, soil, and vegetation caused by human abuse of land, overgrazing, and overirrigation should be strictly controlled to prevent the expansion of desertification. For regions with medium and low sensitivities to desertification (grades 1–5), the local governance prevention model should be maintained.
Although this paper provides reference values and a scientific basis for targeted and deep-rooted strategies to combat desertification in China, there are still shortcomings. The northern regions of China are mostly grazing areas, and the study did not include the conversion of livestock into livestock pressure in the assessment index. In the future, the impact of grazing pressure on desertification sensitivity in northern China can be quantitatively assessed by field counting livestock populations. Furthermore, it is crucial to consider the impact of socio-economic development on desertification, and future versions of the MEDALUS model should incorporate the relevant indicators. While fire risk, population density, and topographic slope can influence desertification sensitivity, their relative effects were relatively minor. Therefore, the inclusion of these parameters as sub-indicators in the MEDALUS model requires further investigation.

6. Conclusions

Based on the multi-source remote sensing data and the improved MEDALUS model, this study assessed the desertification sensitivity in China and analyzed the driving forces of desertification and drew the following conclusions.
(1)
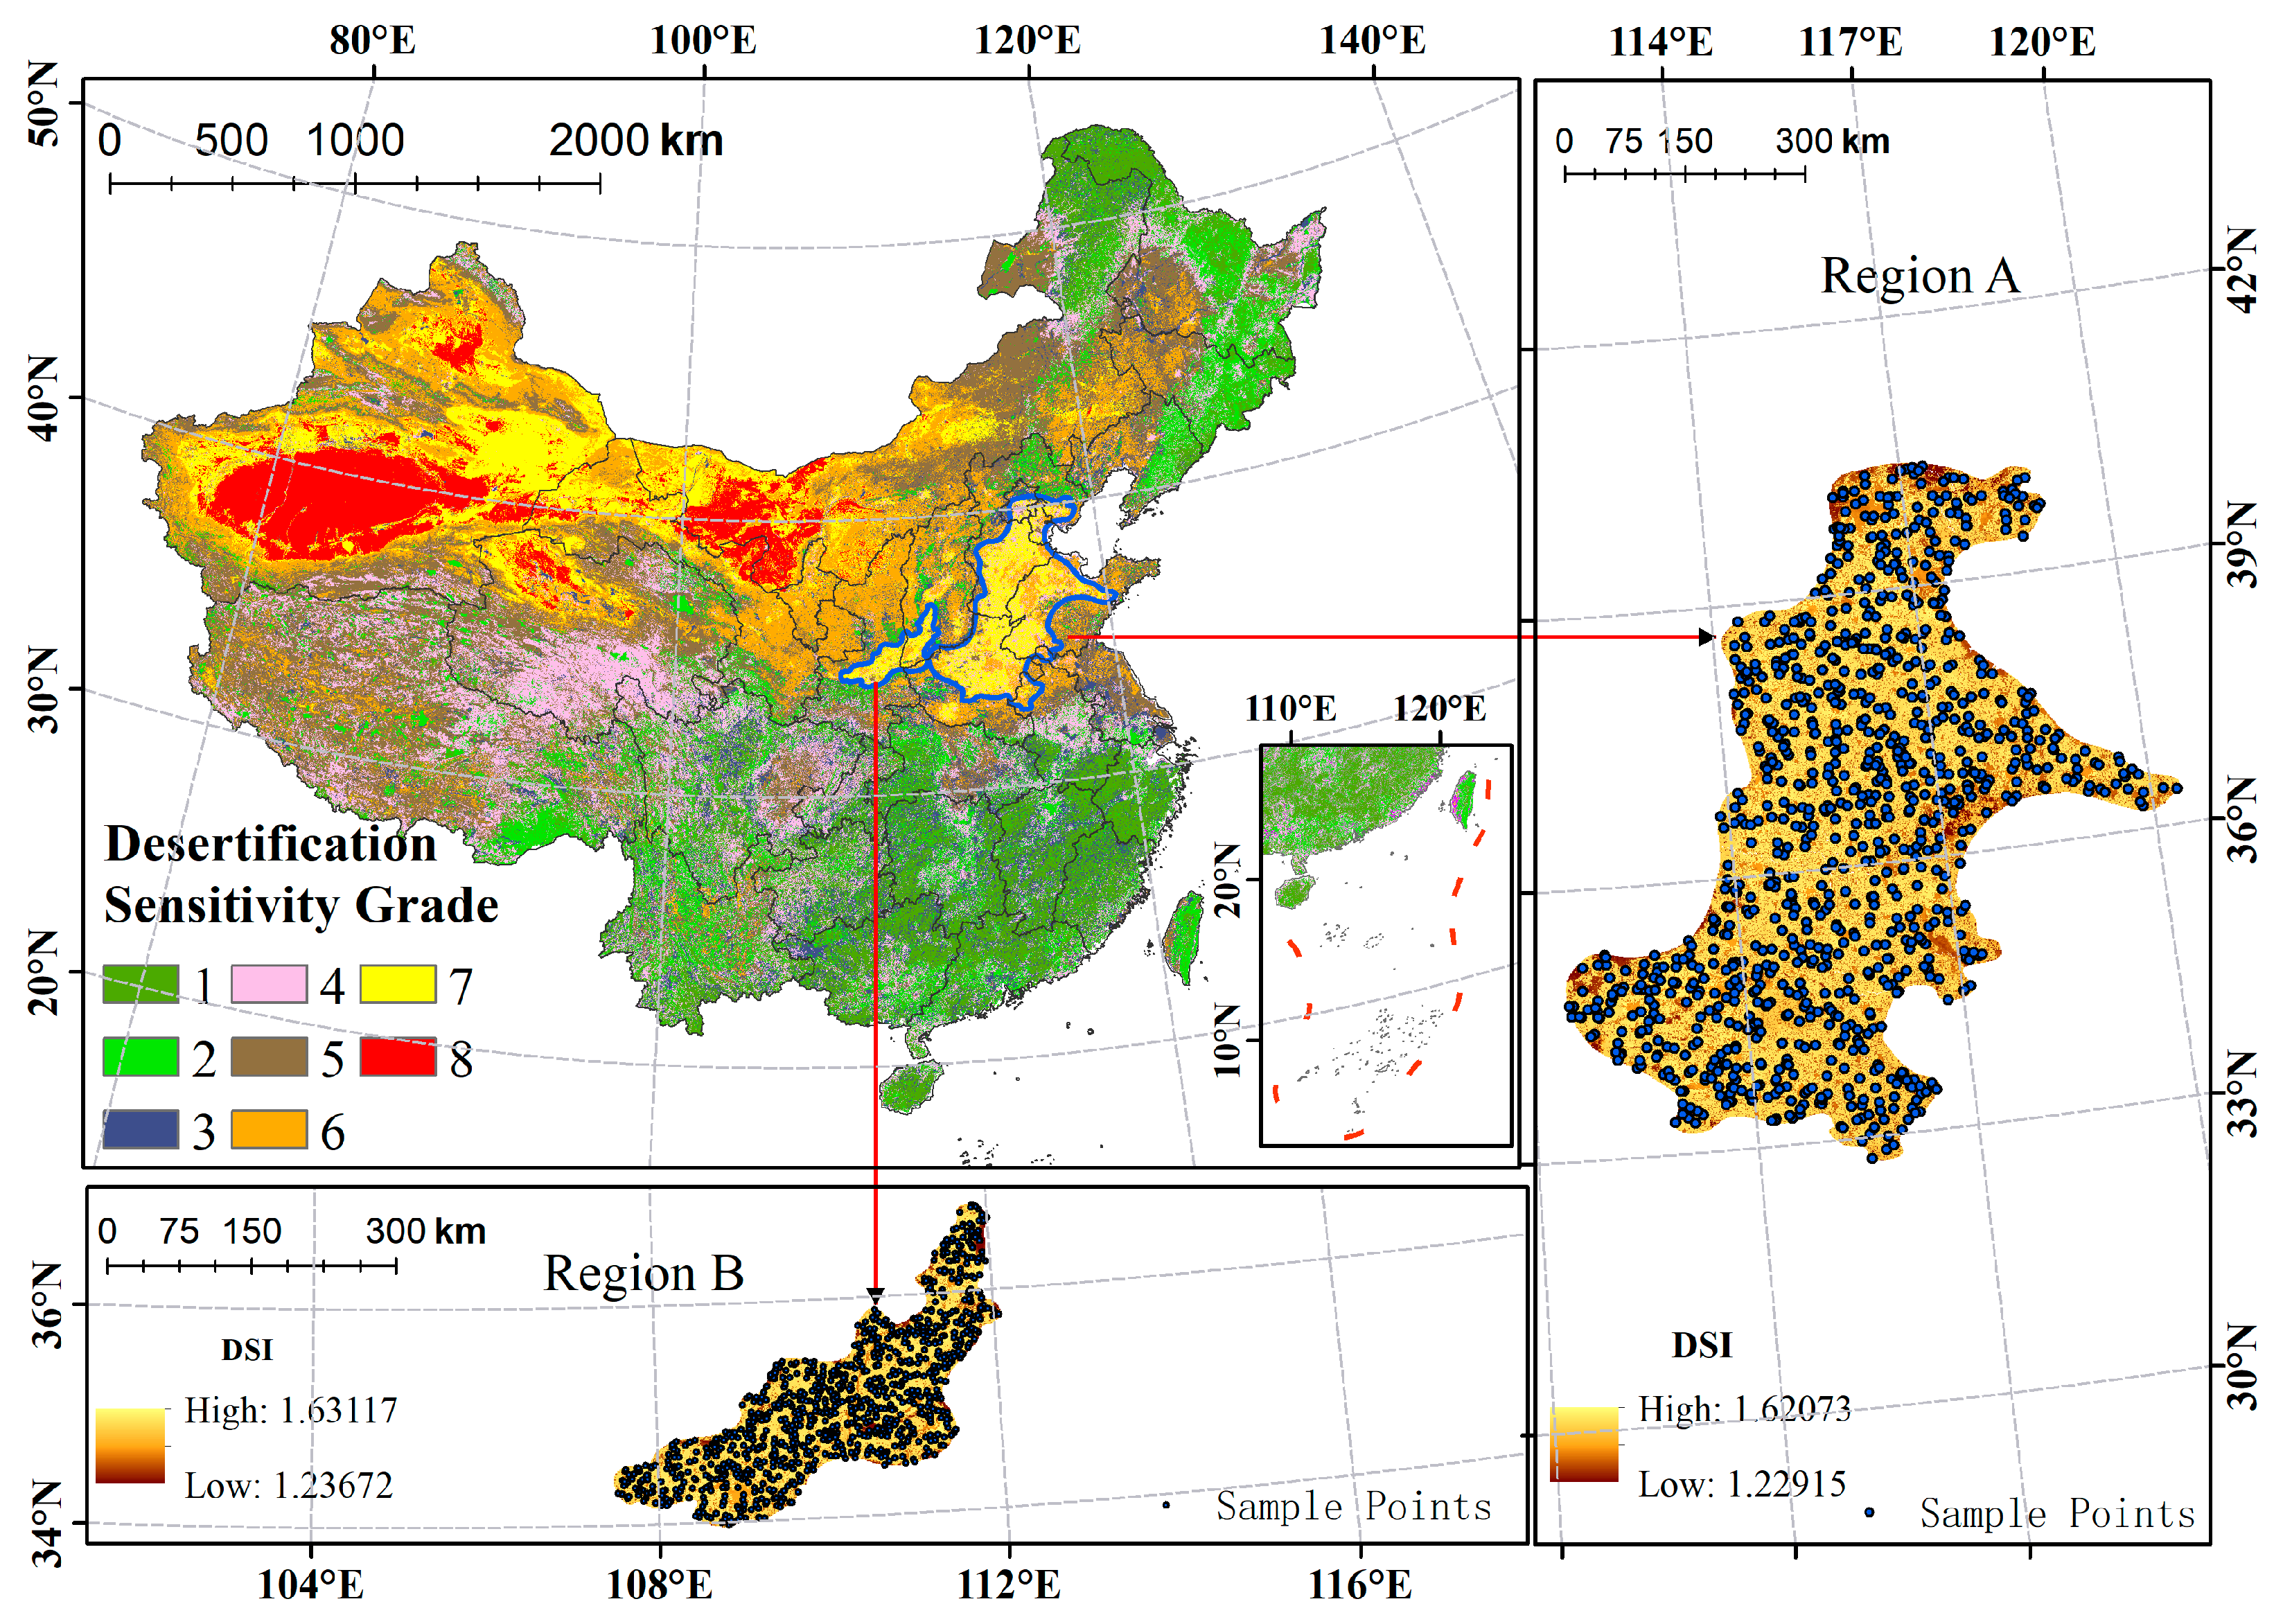
The spatial distribution of desertification sensitivity in China showed a gradually decreasing distribution pattern from northwest to southeast, and the desertification sensitivity was generally at a medium–low level, with an area of about 6,431,623.34 km2, accounting for about 68.16% of the national land area, mainly distributed in the eastern and southern regions of China. The areas with a very high desertification sensitivity covered about 620,628.79 km2, and the areas with a high sensitivity to desertification covered 2,384,409.72 km2, they accounting for 31.84% of the national land area, mainly concentrated in the desert belt of northwest China and showing a nested distribution pattern of a low periphery and high interior.
(2)
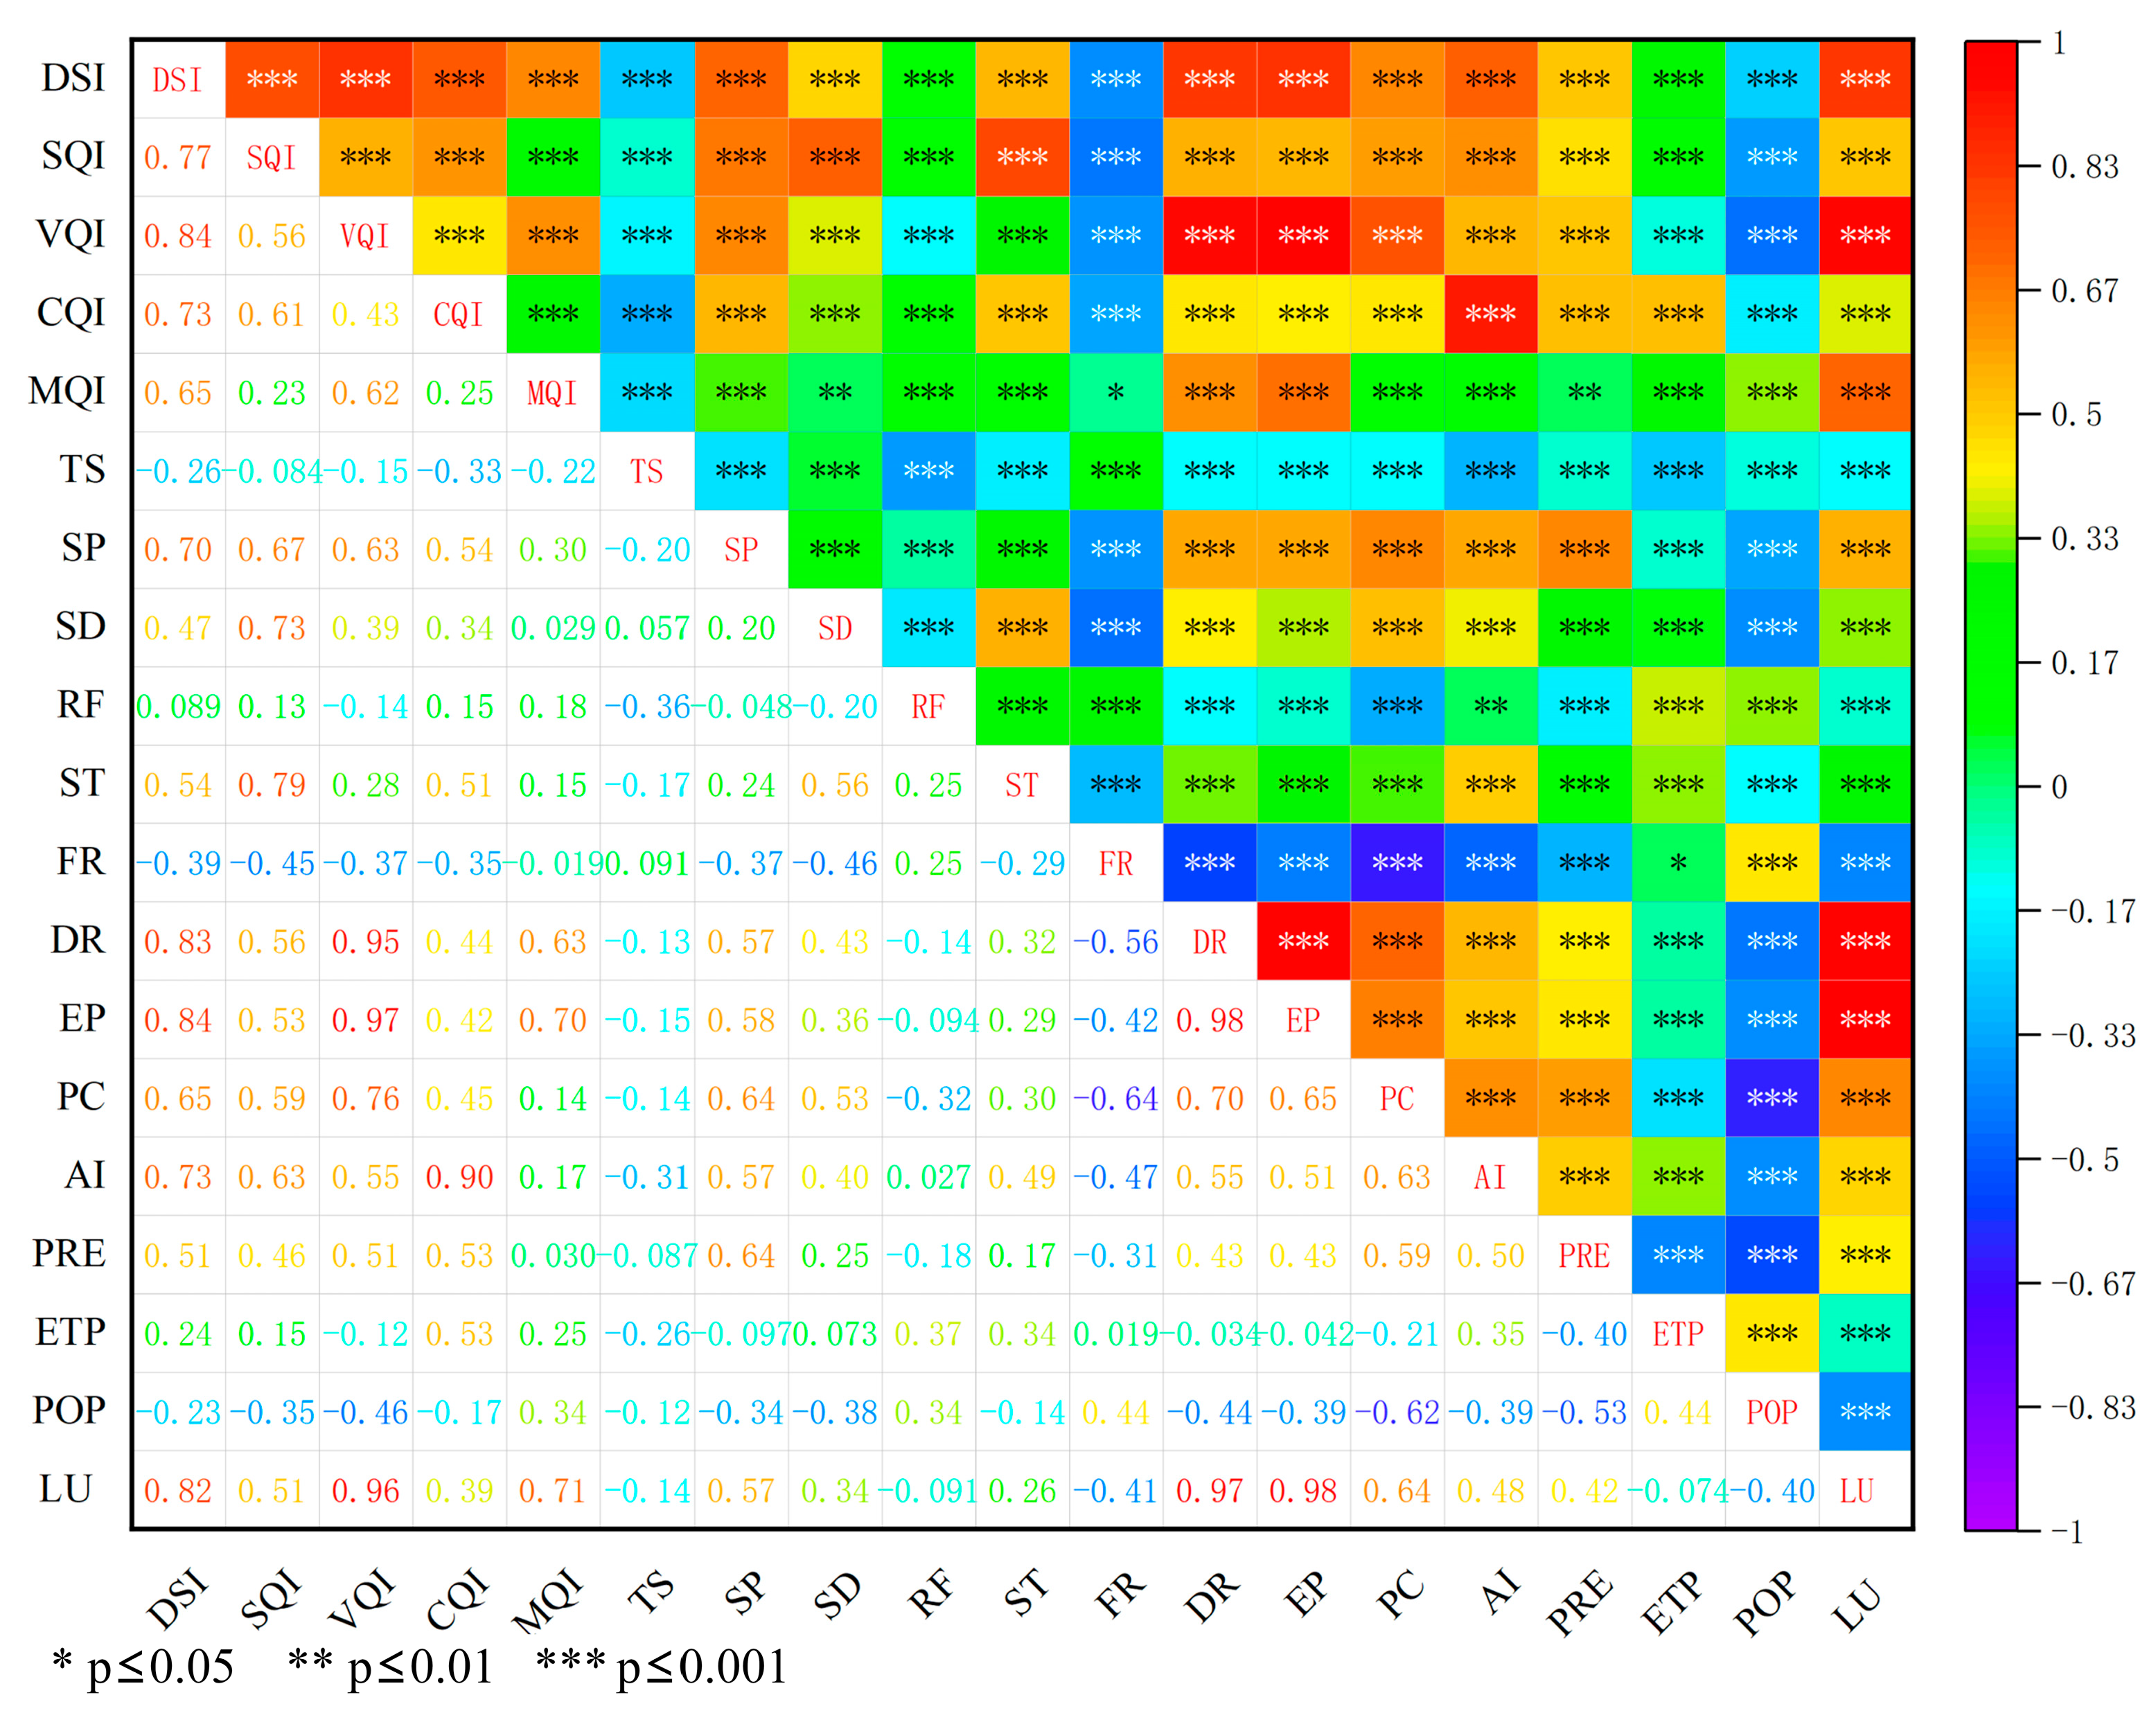
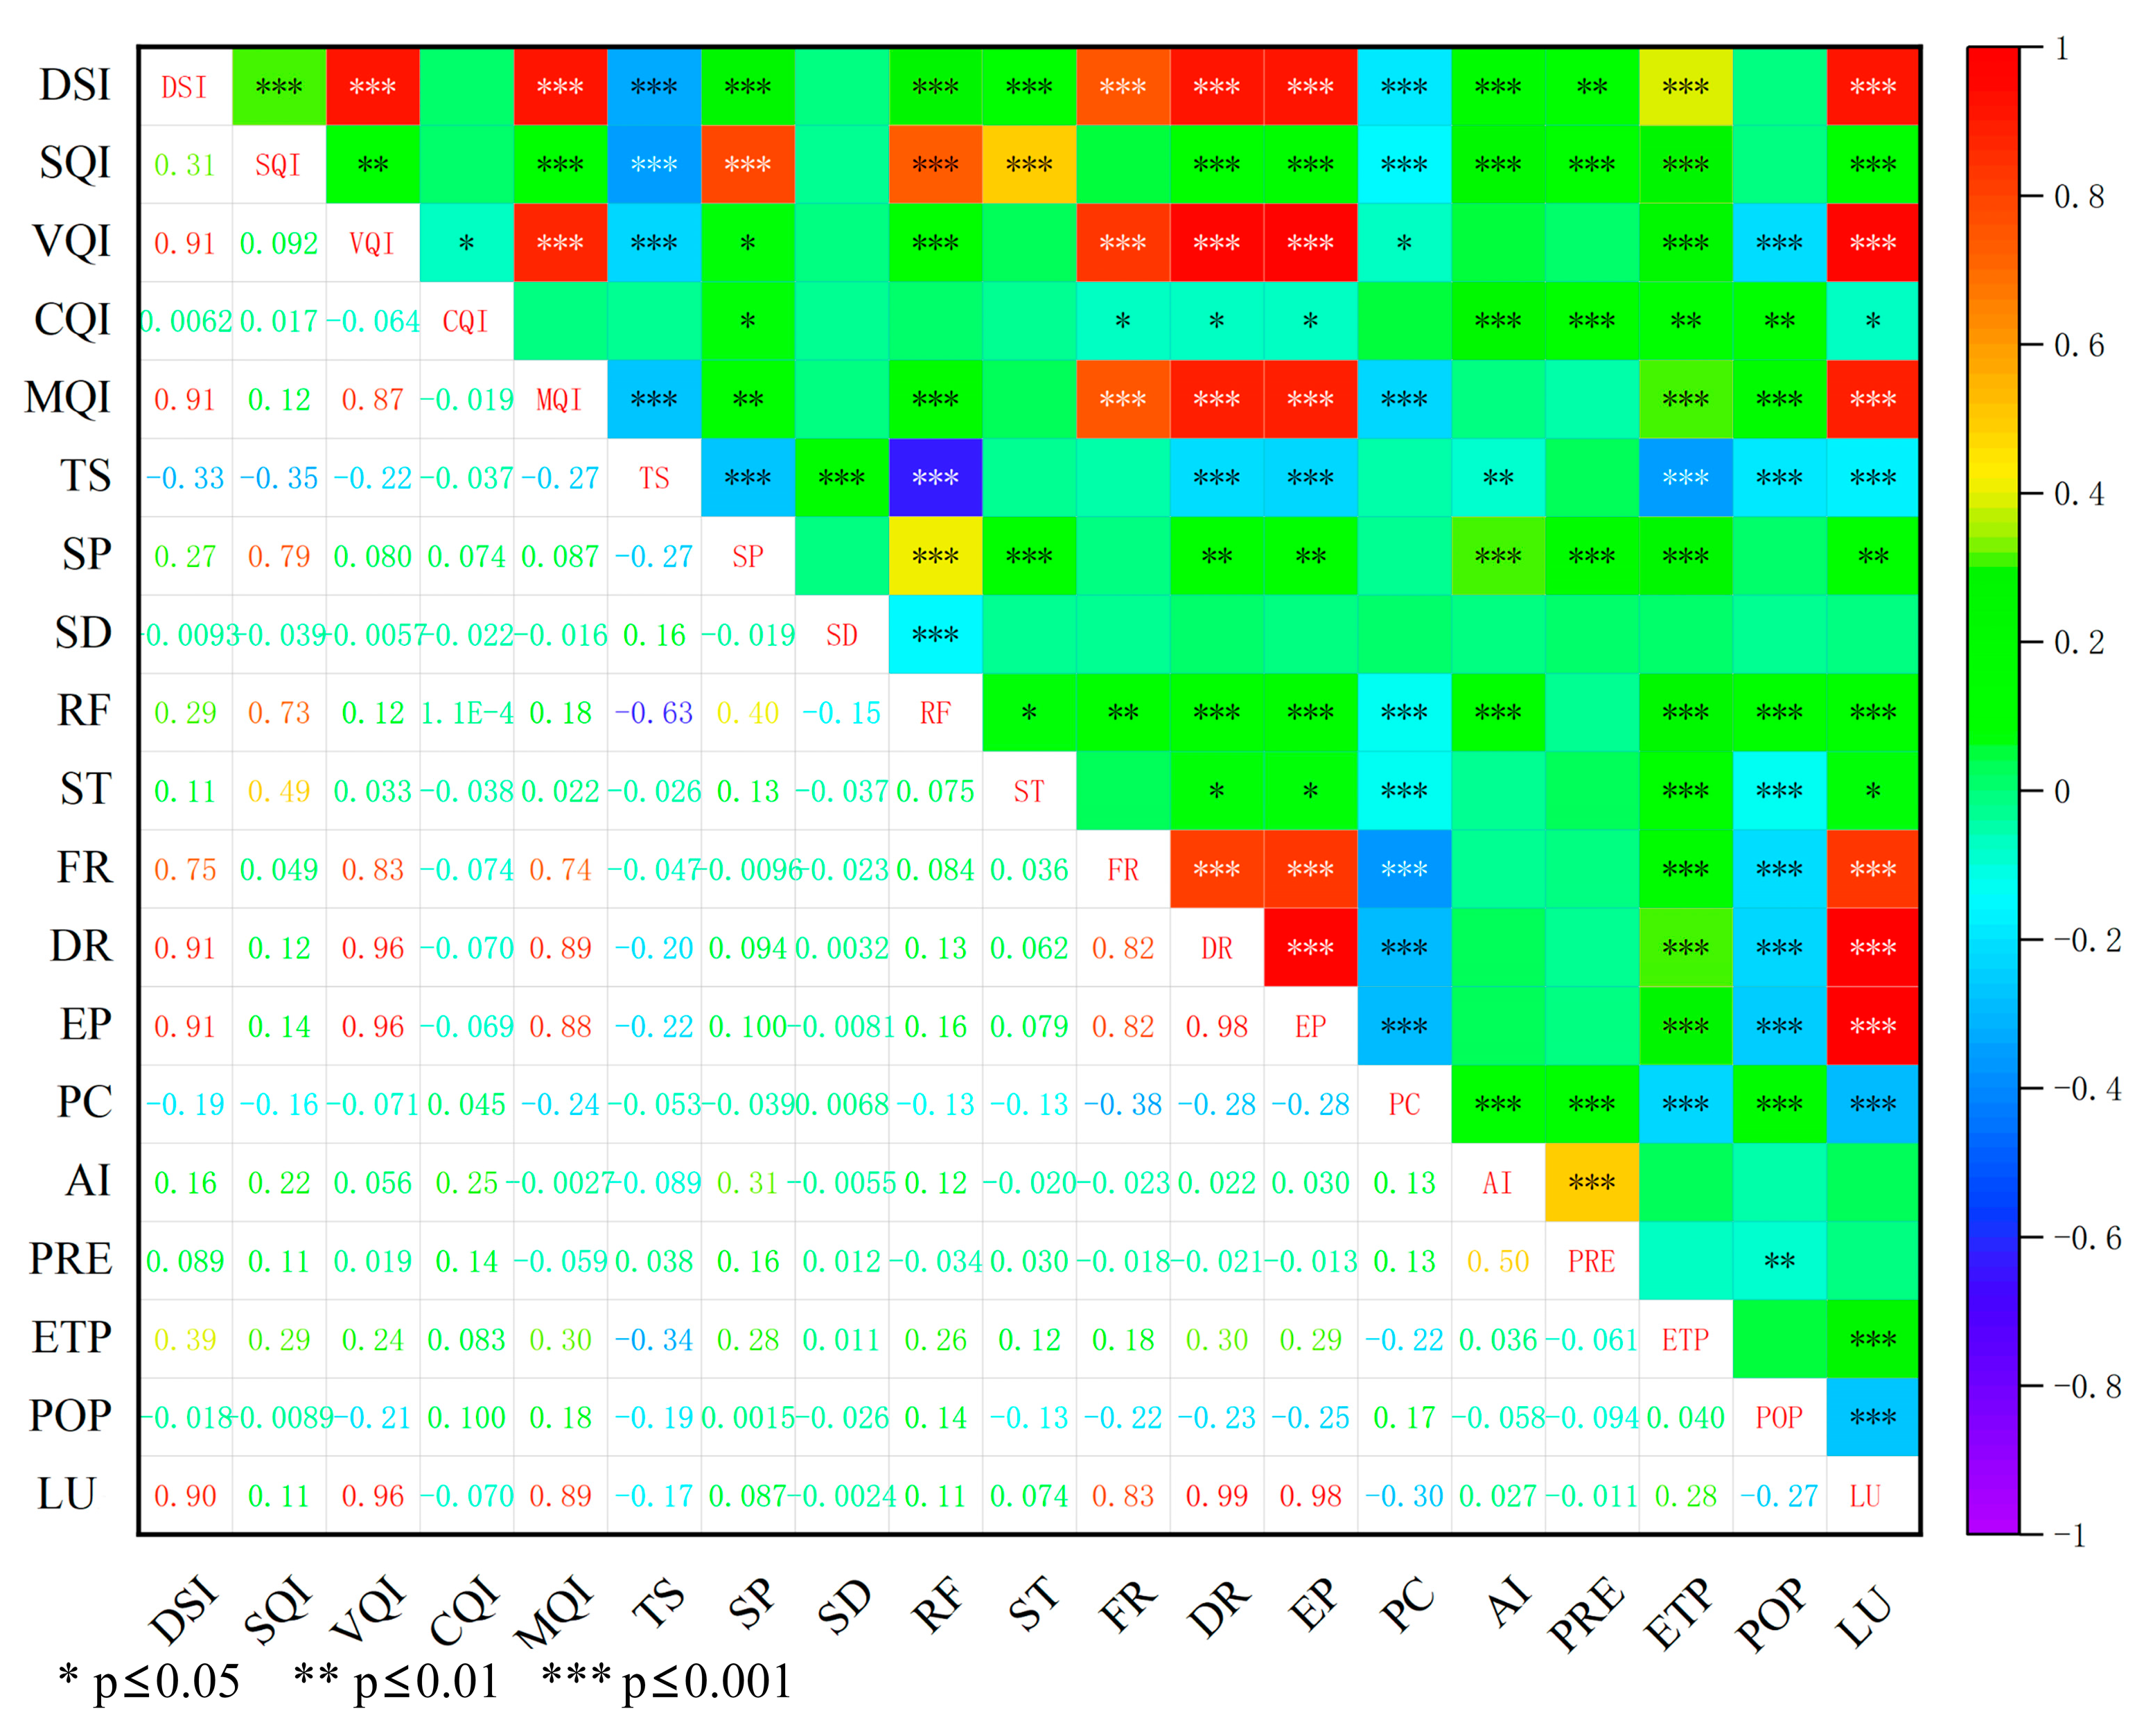
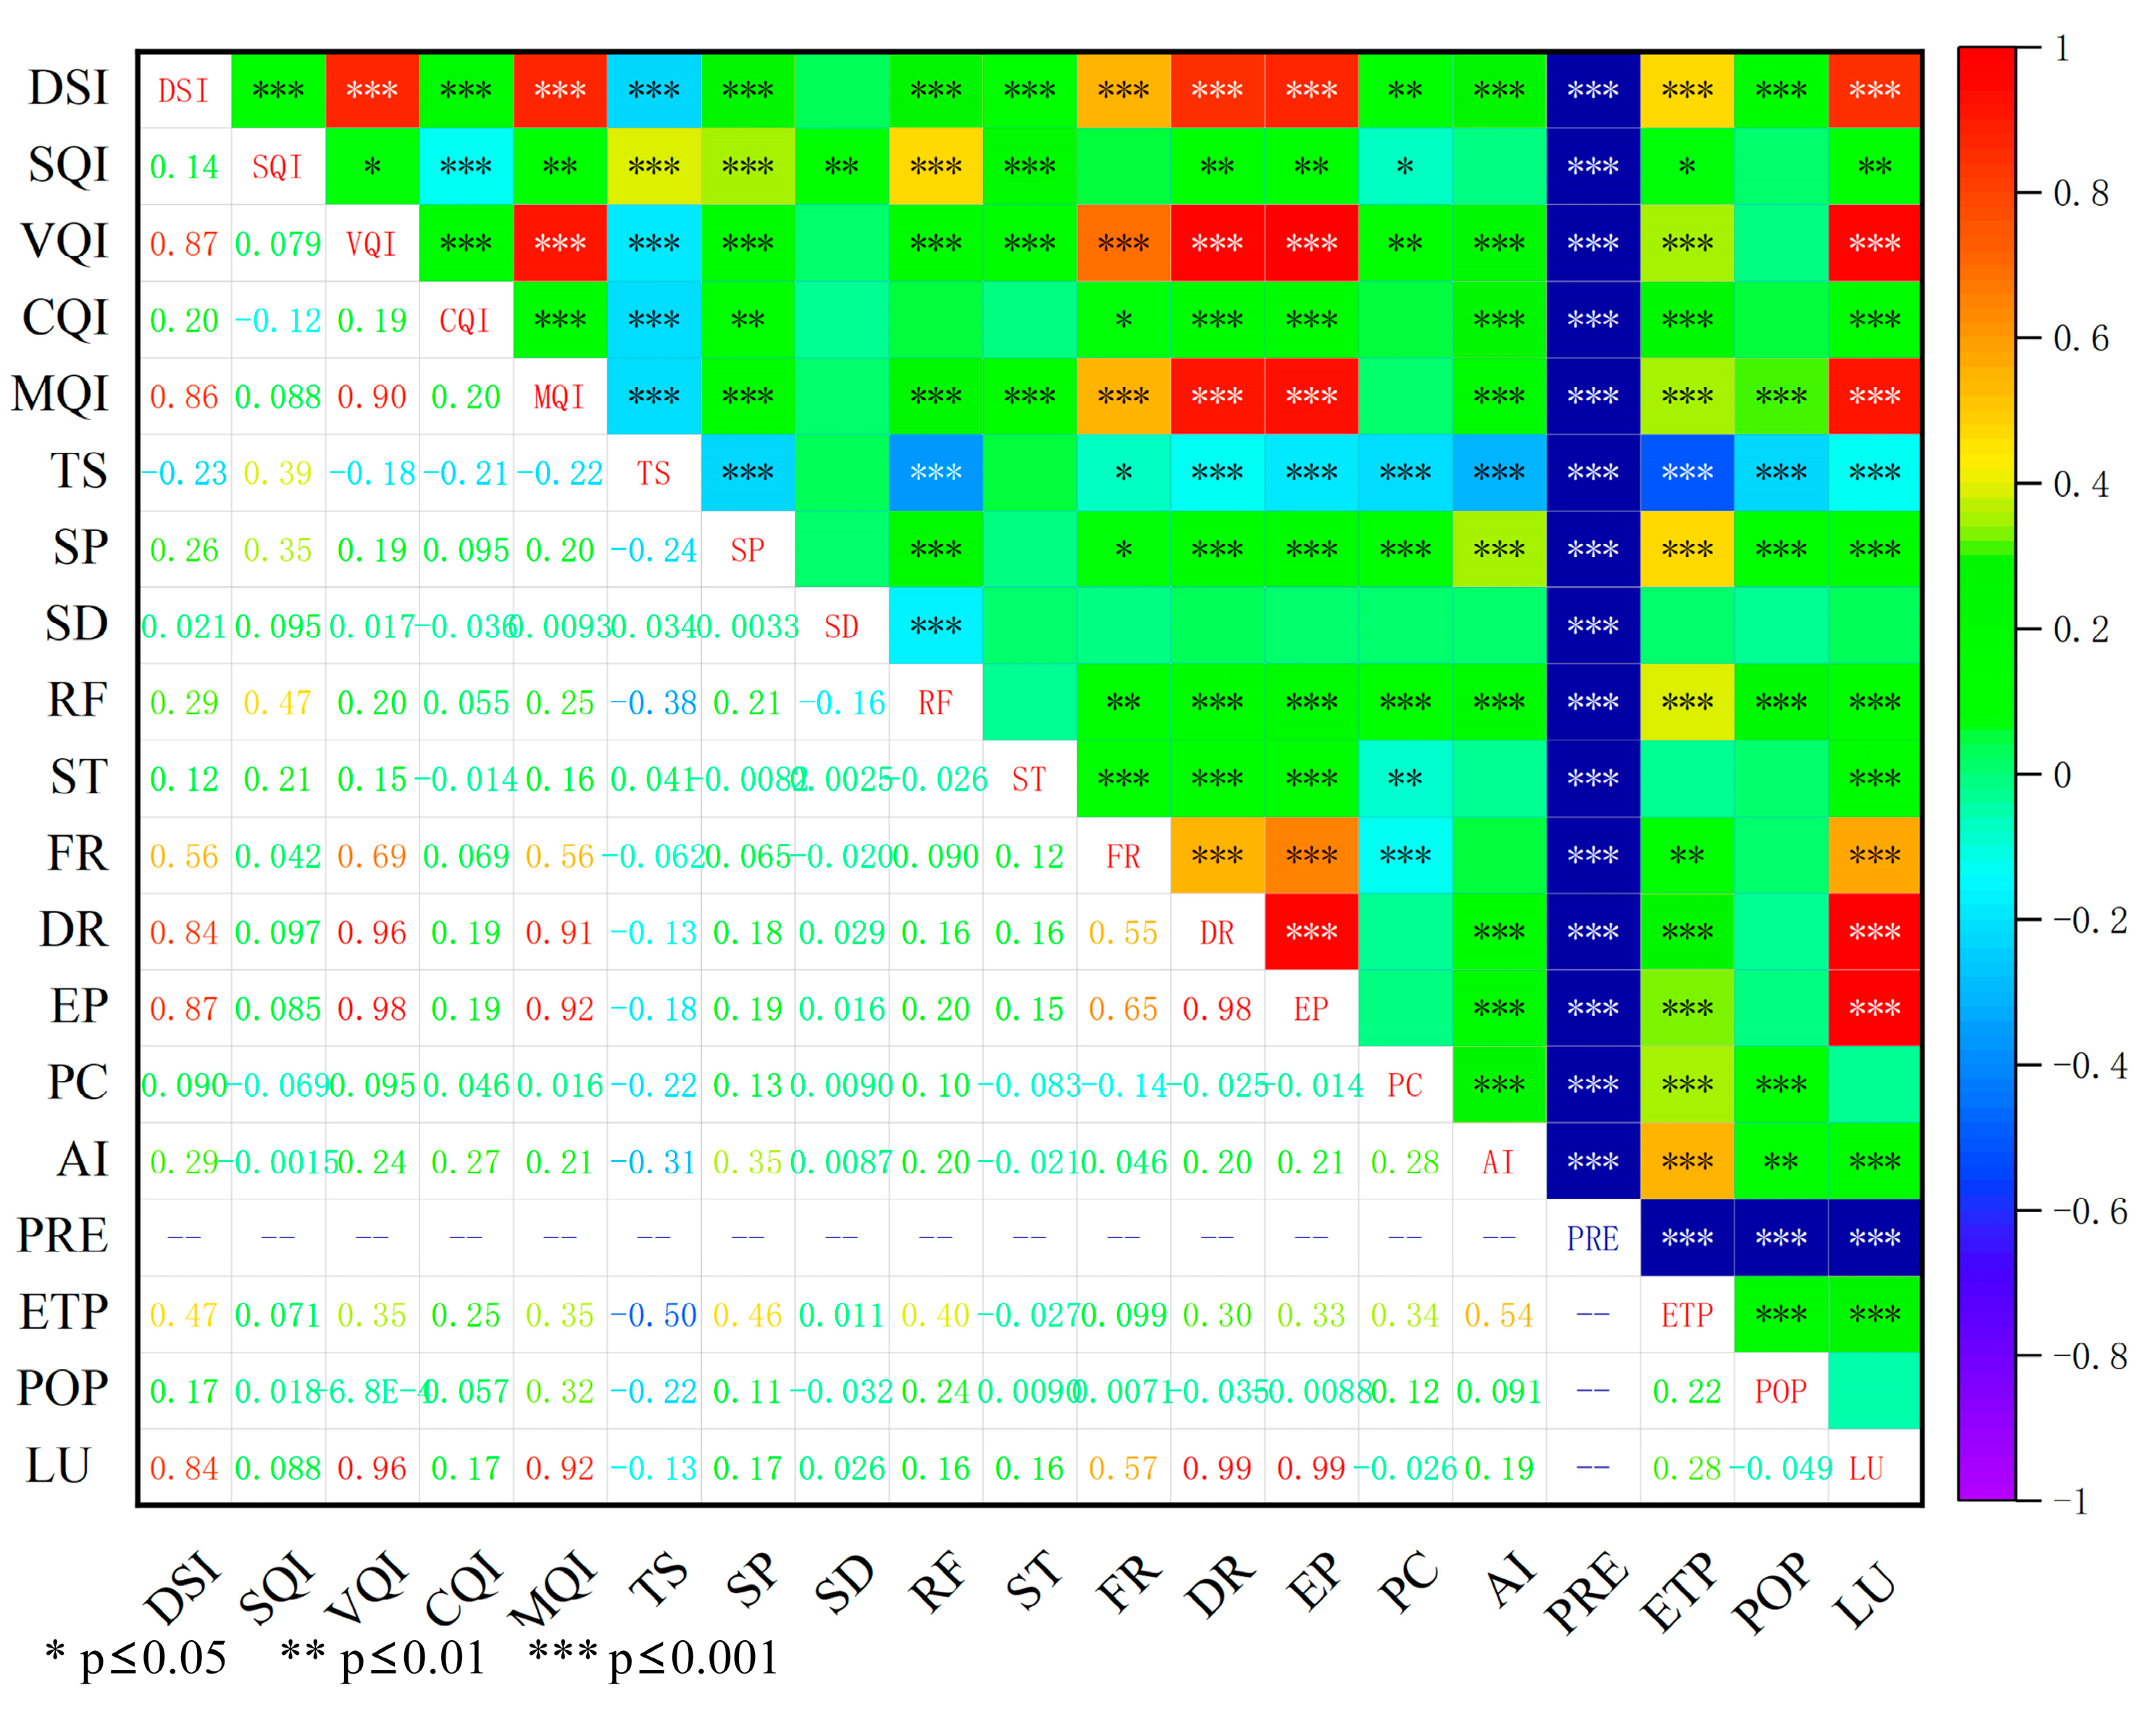
The four key indicators for desertification sensitivity were ranked as follows: VQI (0.84) > SQI (0.77) > CQI (0.73) > MQI (0.65). This indicates that vegetation quality was the main driver of land desertification in China, while soil quality and climate quality were secondary drivers. The ranking of the 14 sub-indicators driving desertification was as follows: EP (0.84) > DR (0.83) > LU (0.82) > AI (0.73) > SP (0.70) > PC (0.65) > ST (0.54) > PRE (0.51) > SD (0.47) > ETP (0.24) > RF (0.089) > POP (−0.23) > TS (−0.26) > FR (−0.39). Thus, erosion protection, drought resistance, and land use were the primary drivers of desertification in China, while aridity index, soil pH, vegetation cover, soil texture, precipitation, soil depth, and evapotranspiration were secondary drivers. Soil debris content, on the other hand, had little to no effect on the trend of desertification in China.
(3)
Mainly driven by the sub-indicators of drought resistance, erosion protection, and land use, the desertification sensitivity was higher in the North China Plain region adjacent to the capital city of Beijing than across three provinces, namely, southern Hebei province, north-central Henan province, and western Shandong province, as well as the Guanzhong Basin region adjacent to central Shaanxi province and south-central Shanxi province.

Author Contributions

Conceptualization, Y.R., X.L. and B.Z.; methodology, Y.R., X.L. and B.Z.; software, Y.R. and X.C.; validation, Y.R. and X.C.; formal analysis, Y.R.; investigation, Y.R.; resources, X.L.; data curation, Y.R. and X.C.; writing—original draft preparation, Y.R.; writing—review and editing, X.L. and B.Z.; visualization, Y.R. and X.C.; supervision, X.L. and B.Z.; project administration, X.L.; funding acquisition, X.L. All authors have read and agreed to the published version of the manuscript.

Funding

This research was funded by the National Natural Science Foundation of China (42271010 and 42177425), the Second TP Scientific Expedition and Research Program (2019QZKK0202), and the Research Start-Up Funding granted to Liu Xiangjun by Jiaying University.

Data Availability Statement

The data are unavailable due to privacy or ethical restrictions.

Acknowledgments

We thank Zhenting Wang of the Northwest Institute of Eco-Environment and Resources, Chinese Academy of Sciences, for his constructive comments on the manuscript, as well as Yantian Xu of Jiaying University for his help in the revision of the manuscript.

Conflicts of Interest

The authors declare no conflict of interest.

References

  1. Kong, Z.-H.; Stringer, L.; Paavola, J.; Lu, Q. Situating China in the Global Effort to Combat Desertification. Land 2021, 10, 702. [Google Scholar] [CrossRef]
  2. Na, R.; Du, H.; Na, L.; Shan, Y.; He, H.S.; Wu, Z.; Zong, S.; Yang, Y.; Huang, L. Spatiotemporal changes in the Aeolian desertification of Hulunbuir Grassland and its driving factors in China during 1980–2015. Catena 2019, 182, 104123. [Google Scholar] [CrossRef]
  3. Yang, X.; Zhang, K.; Jia, B.; Ci, L. Desertification assessment in China: An overview. J. Arid Environ. 2005, 63, 517–531. [Google Scholar] [CrossRef]
  4. Wang, T.; Zhu, Z. Some Problems of Desertification in Northern China. Quat. Sci. 2001, 21, 56–65. [Google Scholar]
  5. Gou, F.; Liang, W.; Sun, S.; Jin, Z.; Zhang, W.; Yan, J. Analysis of the desertification dynamics of sandy lands in Northern China over the period 2000–2017. Geocarto Int. 2019, 36, 1938–1959. [Google Scholar] [CrossRef]
  6. Elnashar, A.; Zeng, H.; Wu, B.; Gebremicael, T.G.; Marie, K. Assessment of environmentally sensitive areas to desertification in the Blue Nile Basin driven by the MEDALUS-GEE framework. Sci. Total Environ. 2022, 815, 152925. [Google Scholar] [CrossRef]
  7. Lyu, Y.; Shi, P.; Han, G.; Liu, L.; Guo, L.; Hu, X.; Zhang, G. Desertification Control Practices in China. Sustainability 2020, 12, 3258. [Google Scholar] [CrossRef]
  8. Li, J.; Yang, X.; Jin, Y.; Yang, Z.; Huang, W.; Zhao, L.; Gao, T.; Yu, H.; Ma, H.; Qin, Z.; et al. Monitoring and analysis of grassland desertification dynamics using Landsat images in Ningxia, China. Remote Sens. Environ. 2013, 138, 19–26. [Google Scholar] [CrossRef]
  9. Wang, T.; Wu, W.; Xue, X.; Sun, Q.; Chen, G. Study of spatial distribution of sandy desertification in North China in recent 10 years. Sci. China Ser. D Earth Sci. 2004, 47, 78–88. [Google Scholar] [CrossRef]
  10. Kefi, S.; Rietkerk, M.; Alados, C.L.; Pueyo, Y.; Papanastasis, V.P.; Elaich, A.; Ruiter, P. Spatial vegetation patterns and imminent desertification in Mediterranean arid ecosystems. Nature 2007, 449, 213–217. [Google Scholar] [CrossRef]
  11. Wang, X.; Chen, F.; Hasi, E.; Li, J. Desertification in China: An assessment. Earth-Sci. Rev. 2008, 88, 188–206. [Google Scholar] [CrossRef]
  12. Hansen, M.C.; Loveland, T.R. A review of large area monitoring of land cover change using Landsat data. Remote Sens. Environ. 2012, 122, 66–74. [Google Scholar] [CrossRef]
  13. Wang, T.; Yan, C.; Song, X.; Xie, J. Monitoring recent trends in the area of aeolian desertified land using Landsat images in China’s Xinjiang region. ISPRS J. Photogramm. Remote Sens. 2012, 68, 184–190. [Google Scholar] [CrossRef]
  14. Tromp, M.; Epema, G.F. Spectral mixture analysis for mapping land degradation in semi-arid areas. Geol. Mijnb. 1998, 77, 153–160. [Google Scholar] [CrossRef]
  15. Collado, A.D.; Chuvieco, E.; Camarasa, A. Satellite remote sensing analysis to monitor desertification processes in the crop-rangeland boundary of Argentina. J. Arid Environ. 2002, 52, 121–133. [Google Scholar] [CrossRef]
  16. Ringrose, S.; Matheson, W.; Tempest, F.; Boyle, T. The Development and Causes of Range~ egradation Features in Southeast Botswana~ shg Multi-Temporal Landsat MSS Imagery. Photogramm. Eng. Remote Sens. 1990, 56, 1253–1262. [Google Scholar]
  17. Huang, S.; Siegert, F. Land cover classification optimized to detect areas at risk of desertification in North China based on SPOT VEGETATION imagery. J. Arid Environ. 2006, 67, 308–327. [Google Scholar] [CrossRef]
  18. Sun, D.; Dawson, R.; Li, H.; Li, B. Modeling desertification change in Minqin County, China. Environ. Monit. Assess. 2005, 108, 169–188. [Google Scholar] [CrossRef]
  19. Xu, D.; You, X.; Xia, C. Assessing the spatial-temporal pattern and evolution of areas sensitive to land desertification in North China. Ecol. Indic. 2019, 97, 150–158. [Google Scholar] [CrossRef]
  20. Zhang, C.; Wang, X.; Li, J.; Hua, T. Identifying the effect of climate change on desertification in northern China via trend analysis of potential evapotranspiration and precipitation. Ecol. Indic. 2020, 112, 106141. [Google Scholar] [CrossRef]
  21. Zhang, J.; Guan, Q.; Du, Q.; Ni, F.; Mi, J.; Luo, H.; Shao, W. Spatial and temporal dynamics of desertification and its driving mechanism in Hexi region. Land Degrad. Dev. 2022, 33, 3539–3556. [Google Scholar] [CrossRef]
  22. Xu, D.; Kang, X.; Zhuang, D.; Pan, J. Multi-scale quantitative assessment of the relative roles of climate change and human activities in desertification–a case study of the Ordos Plateau, China. J. Arid Environ. 2010, 74, 498–507. [Google Scholar] [CrossRef]
  23. Kosmas, C.; Ferrara, A.; Briassouli, H.; Imeson, A. Methodology for Mapping Environmentally Sensitive Areas (ESAs) to Desertification; European Commission: Luxembourg, 1999.
  24. Boudjemline, F.; Semar, A. Assessment and mapping of desertification sensitivity with MEDALUS model and GIS—Case study: Basin of Hodna, Algeria. J. Water Land Dev. 2018, 36, 17–26. [Google Scholar] [CrossRef]
  25. Aliero, M.M.; Ismail, M.H.; Alias, M.A.; Sood, A.M. Geospatial analysis of desertification vulnerability using Mediterranean desertification and land use (MEDALUS) model in Kebbi State, Nigeria. Appl. Geomat. 2021, 13, 527–536. [Google Scholar] [CrossRef]
  26. Afzali, S.F.; Khanamani, A.; Maskooni, E.K.; Berndtsson, R. Quantitative Assessment of Environmental Sensitivity to Desertification Using the Modified MEDALUS Model in a Semiarid Area. Sustainability 2021, 13, 7817. [Google Scholar] [CrossRef]
  27. Wu, Y.; Wang, Z. Desertification sensitivity assessment in the middle and lower reaches of the Shule River Basin. J. Desert Res. 2022, 42, 163–171. [Google Scholar]
  28. Ferrara, A.; Kosmas, C.; Salvati, L.; Padula, A.; Mancino, G.; Nolè, A. Updating the MEDALUS-ESA Framework for Worldwide Land Degradation and Desertification Assessment. Land Degrad. Dev. 2020, 31, 1593–1607. [Google Scholar] [CrossRef]
  29. Xu, D.; Kang, X.; Qiu, D.; Zhuang, D.; Pan, J. Quantitative assessment of desertification using landsat data on a regional scale—A case study in the ordos plateau, China. Sensors 2009, 9, 1738–1753. [Google Scholar] [CrossRef]
  30. Warren, S.D.; Hohmann, M.G.; Auerswald, K.; Mitasova, H. An evaluation of methods to determine slope using digital elevation data. Catena 2004, 58, 215–233. [Google Scholar] [CrossRef]
  31. Ding, J.; Chen, Y.; Wang, X.; Cao, M. Land degradation sensitivity assessment and convergence analysis in Korla of Xinjiang, China. J. Arid Land 2020, 12, 594–608. [Google Scholar] [CrossRef]
  32. Tan, M.L.; Ficklin, D.L.; Dixon, B.; Yusop, Z.; Chaplot, V. Impacts of DEM resolution, source, and resampling technique on SWAT-simulated streamflow. Appl. Geogr. 2015, 63, 357–368. [Google Scholar] [CrossRef]
  33. Liu, F.; Wu, H.; Zhao, Y.; Li, D.; Yang, J.-L.; Song, X.; Shi, Z.; Zhu, A.-X.; Zhang, G.-L. Mapping high resolution National Soil Information Grids of China. Sci. Bull. 2022, 67, 328–340. [Google Scholar] [CrossRef] [PubMed]
  34. Liu, F.; Zhang, G.-L.; Song, X.; Li, D.; Zhao, Y.; Yang, J.; Wu, H.; Yang, F. High-resolution and three-dimensional mapping of soil texture of China. Geoderma 2020, 361, 114061. [Google Scholar] [CrossRef]
  35. Peng, S.; Ding, Y.; Wen, Z.; Chen, Y.; Cao, Y.; Ren, J. Spatiotemporal change and trend analysis of potential evapotranspiration over the Loess Plateau of China during 2011–2100. Agric. For. Meteorol. 2017, 233, 183–194. [Google Scholar] [CrossRef]
  36. Peng, S.; Ding, Y.; Liu, W.; Li, Z. 1 km monthly temperature and precipitation dataset for China from 1901 to 2017. Earth Syst. Sci. Data 2019, 11, 1931–1946. [Google Scholar] [CrossRef]
  37. Peng, S.; Gang, C.; Cao, Y.; Chen, Y. Assessment of climate change trends over the Loess Plateau in China from 1901 to 2100. Int. J. Climatol. 2018, 38, 2250–2264. [Google Scholar] [CrossRef]
  38. Ding, Y.; Peng, S. Spatiotemporal trends and attribution of drought across China from 1901–2100. Sustainability 2020, 12, 477. [Google Scholar] [CrossRef]
  39. Ding, Y.; Peng, S. Spatiotemporal change and attribution of potential evapotranspiration over China from 1901 to 2100. Theor. Appl. Climatol. 2021, 145, 79–94. [Google Scholar] [CrossRef]
  40. Lamqadem, A.A.; Pradhan, B.; Saber, H.; Rahimi, A. Desertification Sensitivity Analysis Using MEDALUS Model and GIS: A Case Study of the Oases of Middle Draa Valley, Morocco. Sensors 2018, 18, 2230. [Google Scholar] [CrossRef]
  41. Hou, C.; Xie, Y.; Zhang, Z. An improved convolutional neural network based indoor localization by using Jenks natural breaks algorithm. China Commun. 2022, 19, 291–301. [Google Scholar] [CrossRef]
  42. Chen, J.; Yang, S.; Li, H.; Zhang, B.; Lv, J. Research on geographical environment unit division based on the method of natural breaks (Jenks). Int. Arch. Photogramm. Remote Sens. Spat. Inf. Sci. 2013, 3, 47–50. [Google Scholar] [CrossRef]
  43. Jenks, G.F. The data model concept in statistical mapping. Int. Yearb. Cartogr. 1967, 7, 186–190. [Google Scholar]
  44. Bünemann, E.K.; Bongiorno, G.; Bai, Z.; Creamer, R.E.; De Deyn, G.; de Goede, R.; Fleskens, L.; Geissen, V.; Kuyper, T.W.; Mäder, P. Soil quality–A critical review. Soil Biol. Biochem. 2018, 120, 105–125. [Google Scholar] [CrossRef]
  45. Neina, D. The role of soil pH in plant nutrition and soil remediation. Appl. Environ. Soil Sci. 2019, 2019, 5794869. [Google Scholar] [CrossRef]
  46. Lahlaoi, H.; Rhinane, H.; Hilali, A.; Lahssini, S.; Moukrim, S. Desertification assessment using MEDALUS model in watershed Oued El Maleh, Morocco. Geosciences 2017, 7, 50. [Google Scholar] [CrossRef]
  47. Saleh, A.; Belal, A.; Jalhoum, M. Quantitative assessment of environmental sensitivity to desertification in Sidi Abdel-Rahman area, Northern West Coast of Egypt. Egypt. J. Soil Sci. 2018, 58, 13–26. [Google Scholar] [CrossRef]
  48. Lee, E.J.; Piao, D.; Song, C.; Kim, J.; Lim, C.-H.; Kim, E.; Moon, J.; Kafatos, M.; Lamchin, M.; Jeon, S.W. Assessing environmentally sensitive land to desertification using MEDALUS method in Mongolia. For. Sci. Technol. 2019, 15, 210–220. [Google Scholar] [CrossRef]
  49. Tariq, A.; Ullah, A.; Sardans, J.; Zeng, F.; Graciano, C.; Li, X.; Wang, W.; Ahmed, Z.; Ali, S.; Zhang, Z.; et al. Alhagi sparsifolia: An ideal phreatophyte for combating desertification and land degradation. Sci. Total. Environ. 2022, 844, 157228. [Google Scholar] [CrossRef]
  50. Cleophas, T.J.; Zwinderman, A.H. Bayesian Pearson correlation analysis. In Modern Bayesian Statistics in Clinical Research; Springer: Berlin/Heidelberg, Germany, 2018; pp. 111–118. [Google Scholar]
  51. Guo, Z.; Wei, W.; Shi, P.; Zhou, L.; Wang, X.; Li, Z.; Pang, S.; Xie, B. Spatiotemporal changes of land desertification sensitivity in the arid region of Northwest China. Acta Geogr. Sin. 2020, 75, 1948–1965. [Google Scholar] [CrossRef]
Figure 1. Study area overview. The map includes the types of deserts in China and the specific locations of the eight major deserts and four major sandy land areas. The data set was provided by the Environmental and Ecological Science Data Center for West China, National Natural Science Foundation of China (http://westdcwestgis.ac.cn, accessed on 2 February 2022). Review Number: GS (2020) 4619.
Remotesensing 15 02674 g001
Figure 2. Flowchart of land desertification sensitivity assessment in China, modified from Ferrara et al. [28].
Remotesensing 15 02674 g002
Figure 3. Soil quality sub-index classification results. (a) The result after classifying and assigning weights to soil pH; (b) the result after classifying and assigning weights to rock fragments; (c) the result after classifying and assigning weights to terrain slope; (d) the result after classifying and assigning weights to soil texture; (e) the result after classifying and assigning weights to soil depth.
Remotesensing 15 02674 g003
Figure 4. Vegetation quality sub-index classification results. (a) The result after classifying and assigning weights to drought resistance; (b) the result after classifying and assigning weights to fire risk; (c) the result after classifying and assigning weights to erosion protection; (d) the result after classifying and assigning weights to plant cover.
Remotesensing 15 02674 g004
Figure 5. Climate quality sub-index classification results. (a) The result after classifying and assigning weights to evapotranspiration; (b) the result after classifying and assigning weights to the aridity index; (c) the result after classifying and assigning weights to precipitation.
Remotesensing 15 02674 g005
Figure 6. Management quality sub-index classification results. (a) The result after classifying and assigning weights to land use; (b) the result after classifying and assigning weights to population density.
Remotesensing 15 02674 g006
Figure 7. Spatial distribution of soil, vegetation, climate, and management quality indexes. (a) Soil quality index map; (b) vegetation quality index map; (c) climate quality index map; (d) management quality index map.
Remotesensing 15 02674 g007
Figure 8. Spatial distribution of desertification sensitivity index and grade. (a) Desertification sensitivity index map; (b) desertification sensitivity grade map. Grades 1–8 represent different levels of desertification sensitivity, with a higher grade indicating a greater risk of desertification.
Remotesensing 15 02674 g008
Figure 9. Principal component analysis score plot. VL indicates the sample points with very low sensitivity to desertification; L indicates the sample points with low sensitivity to desertification; M indicates the sample points with medium sensitivity to desertification; H indicates the sample points with high sensitivity to desertification; VH indicates the sample points with very high sensitivity to desertification.
Remotesensing 15 02674 g009
Figure 10. Plot of principal component analysis loadings. DSI, desertification sensitivity index; SQI, soil quality index; VQI, vegetation quality index; CQI, climate quality index; MQI, management quality index; TS, terrain slope; SP, soil pH; SD, soil depth; RF, rock fragments; ST, soil texture; FR, fire risk; DR, drought resistance; EP, erosion protection; PC, plant cover; AI, aridity index; PRE, precipitation; ETP, evapotranspiration; POP, population density; LU, land use.
Remotesensing 15 02674 g010
Figure 11. Heat map of desertification correlation in China. DSI, desertification sensitivity index; SQI, soil quality index; VQI, vegetation quality index; CQI, climate quality index; MQI, management quality index; TS, terrain slop; SP, soil pH; SD, soil depth; RF, rock fragments; ST, soil texture; FR, fire risk; DR, drought resistance; EP, erosion protection; PC, plant cover; AI, aridity index; PRE, precipitation; ETP, evapotranspiration; POP, population density; LU, land use. p < 0.05 is a slightly significant correlation; p < 0.01 is a significant correlation; p < 0.001 is a very significant correlation.
Remotesensing 15 02674 g011
Figure 12. Localized areas of high desertification sensitivity.
Remotesensing 15 02674 g012
Figure 13. Heat map of desertification correlation in region A in Figure 12. DSI, desertification sensitivity index; SQI, soil quality index; VQI, vegetation quality index; CQI, climate quality index; MQI, management quality index; TS, terrain slope; SP, soil pH; SD, soil depth; RF, rock fragments; ST, soil texture; FR, fire risk; DR, drought resistance; EP, erosion protection; PC, plant cover; AI, aridity index; PRE, precipitation; ETP, evapotranspiration; POP, population density; LU, land use. p < 0.05 is a slightly significant correlation; p < 0.01 is a significant correlation; p < 0.001 is a very significant correlation.
Remotesensing 15 02674 g013
Figure 14. Heat map of desertification correlation in region B in Figure 12. DSI, desertification sensitivity index; SQI, soil quality index; VQI, vegetation quality index; CQI, climate quality index; MQI, management quality index; TS, terrain slope; SP, soil pH; SD, soil depth; RF, rock fragments; ST, soil texture; FR, fire risk; DR, drought resistance; EP, erosion protection; PC, plant cover; AI, aridity index; PRE, precipitation; ETP, evapotranspiration; POP, population density; LU, land use. p < 0.05 is a slightly significant correlation; p < 0.01 is a significant correlation; p < 0.001 is a very significant correlation.
Remotesensing 15 02674 g014
Table 1. Data details and sources.
DataTime Resolution (Year)Spatial Resolution (m)Source
Soil pH
Rock fragments
Soil texture
Soil depth
2010–20181000http://data.tpdc.ac.cn/zh-hans/, accessed on 3 March 2022.
DEM2008250http://www.gscloud.cn, accessed on 6 March 2022.
Surface cover products
Plant coverage
20201000https://www.resdc.cn/Datalist1.aspx?FieldTyepID=1,3, accessed on 6 March 2022.
Precipitation
Evapotranspiration
2018–20201000http://data.tpdc.ac.cn/zh-hans/, accessed on 11 March 2022.
Population density20201000https://www.worldpop.org/geodata/summary?id=29798, accessed on 11 March 2022.
Table 2. Classes and corresponding weights of soil sub-indexes [25,28,29].
IndexClassWeight
Soil pH (SP)<6.51.0
6.5–71.5
≥72.0
Rock fragments (RF)≥50%1.0
40–50%1.1
30–40%1.3
20–30%1.5
10–20%1.7
<10%2.0
Terrain slope (TS)<3%1.0
3–6%1.1
6–12%1.2
12–18%1.3
18–24%1.4
24–30%1.5
30–36%1.7
≥36%2.0
Soil texture (ST)CL; L; SCL; SL; LS1.0
SiCL; SiL; SC1.2
C; SiC; Si1.6
S2.0
Soil depth (SD)≥60 cm1.0
30–60 cm1.5
<30 cm2.0
L: loam, SCL: sandy clay loam, SL: sandy loam, LS: loamy sand, CL: clay loam, SC: sandy clay, SiL: silty loam, SiCL: silty clay loam, Si: silt, C: clay, SiC: silty clay, S: sand.
Table 3. Classes and corresponding weights of vegetation sub-indexes [28].
IndexClassWeight
Drought
resistance (DR)
wooded land, shrub land, other wooded land, rivers and canals, lakes, reservoirs, permanent glacial snow, ocean1.0
towns, rural settlements, public transport construction land, swampy land1.1
open forest land, sea shoals, mudflats1.2
paddy field1.4
dry land1.5
grassland1.6
sandy land, Gobi, saline land, bare land, bare rocky gravel land, other unused land2.0
Fire risk (FR)permanent glacial snow, sandy land, Gobi, saline land, bare land, bare rocky gravel land, other unused land, ocean1.0
other forest land, rivers and canals, lakes, reservoirs, sea shoals, mudflats, marshlands1.1
towns, rural settlements, public transport construction land1.2
forested land, shrub land, grassland1.3
paddy field, dry land1.4
open forest land1.7
Erosion
protection (EP)
wooded land, shrub land, other wooded land, permanent glacial snow, ocean1.0
towns, rural settlements, public transport construction land1.1
rivers and canals, lakes, reservoirs, sea shoals, mudflats, marshlands1.2
paddy fields, open forest land1.4
dry land, grassland1.7
sandy land, Gobi, saline land, bare land, bare rocky gravel land, other unused land2.0
Plant cover (PC)≥0.801.0
0.72–0.801.1
0.62–0.721.2
0.5–0.621.3
0.38–0.501.4
0.26–0.381.5
0.18–0.261.6
0.13–0.181.7
0.11–0.131.8
0.10–0.111.9
<0.102.0
Table 4. Classes and corresponding weights of climate sub-indexes [25,28].
IndexClassWeight
Evapotranspiration (ETP, mm)<7001.00
700–7501.05
750–8251.15
825–9251.25
925–10251.35
1025–11251.50
1125–12751.65
1275–14001.80
≥14002.00
Precipitation (PRE, mm)≥6501.00
570–6501.05
490–5701.15
440–4901.25
390–4401.35
345–3901.50
310–3451.65
280–3101.80
<2802.00
Aridity index (AI)≥11.00
0.75–11.05
0.65–0.751.15
0.5–0.651.25
0.35–0.51.35
0.2–0.351.45
0.1–0.21.55
0.03–0.11.75
<0.032.00
Table 5. Classes and corresponding weights of management sub-indexes [6,28].
IndexClassWeight
Land use (LU)shrubland, other woodland, permanent glacial snow, ocean1.0
forested land, towns, rural settlements, public transport construction land1.1
rivers and canals, lakes, and reservoirs1.2
open forest land, sea shoals, mudflat, marshland1.3
paddy fields1.6
dry land1.7
grassland1.8
sandy land, Gobi, saline land, bare land, bare rocky gravel land, other unused land2.0
Population density (POP, inhabitants/km2)<41.0
4–301.1
30–801.2
80–1701.3
170–3001.4
300–5001.5
500–8501.6
850–14001.7
1400–20001.8
2000–27001.9
≥27002.0
Table 6. Desertification sensitivity classification and its corresponding level [28].
Level of SensitivitySensitivity GradeSensitivity ScoreShort Description
Very low11.00 ≤ DSI < 1.226Very low risk of desertification, with a perfect balance of natural and human factors.
Low21.226 ≤ DSI < 1.294Low risk of desertification, except in cases of major climate change or serious mismanagement.
Medium31.294 ≤ DSI < 1.363Medium risk of desertification, with a relative balance between natural and human activities, with the possibility of land desertification if there is an imbalance in one aspect.
41.363 ≤ DSI < 1.423
51.423 ≤ DSI < 1.477
High61.477 ≤ DSI < 1.537High risk of desertification; imbalance between natural and anthropogenic activities has occurred, and local areas have seen desertification trends.
71.537 ≤ DSI < 1.622
Very high81.622 ≤ DSIVery high risk of desertification (including desertified landscapes); serious imbalance between natural and human activities; has experienced desertification, rock desertification, salinization, or there is an obvious desertification process that poses a threat to the environment of the surrounding area.
Table 7. Area and percentage of each desertification sensitivity grade.
Level of SensitivitySensitivity GradeArea (km2)Percent (%)
Very low11,100,547.1411.66
Low21,004,806.8710.65
Medium3857,317.069.09
41,510,479.8116.01
51,958,472.4620.75
High61,509,278.7815.99
7875,130.949.27
Very high8620,628.796.58
Disclaimer/Publisher’s Note: The statements, opinions and data contained in all publications are solely those of the individual author(s) and contributor(s) and not of MDPI and/or the editor(s). MDPI and/or the editor(s) disclaim responsibility for any injury to people or property resulting from any ideas, methods, instructions or products referred to in the content.

