

Bias-Corrected RADARSAT-2 Soil Moisture Dynamics Reveal Discharge Hysteresis at An Agricultural Watershed

Abstract
:1. Introduction
2. Methods and Data
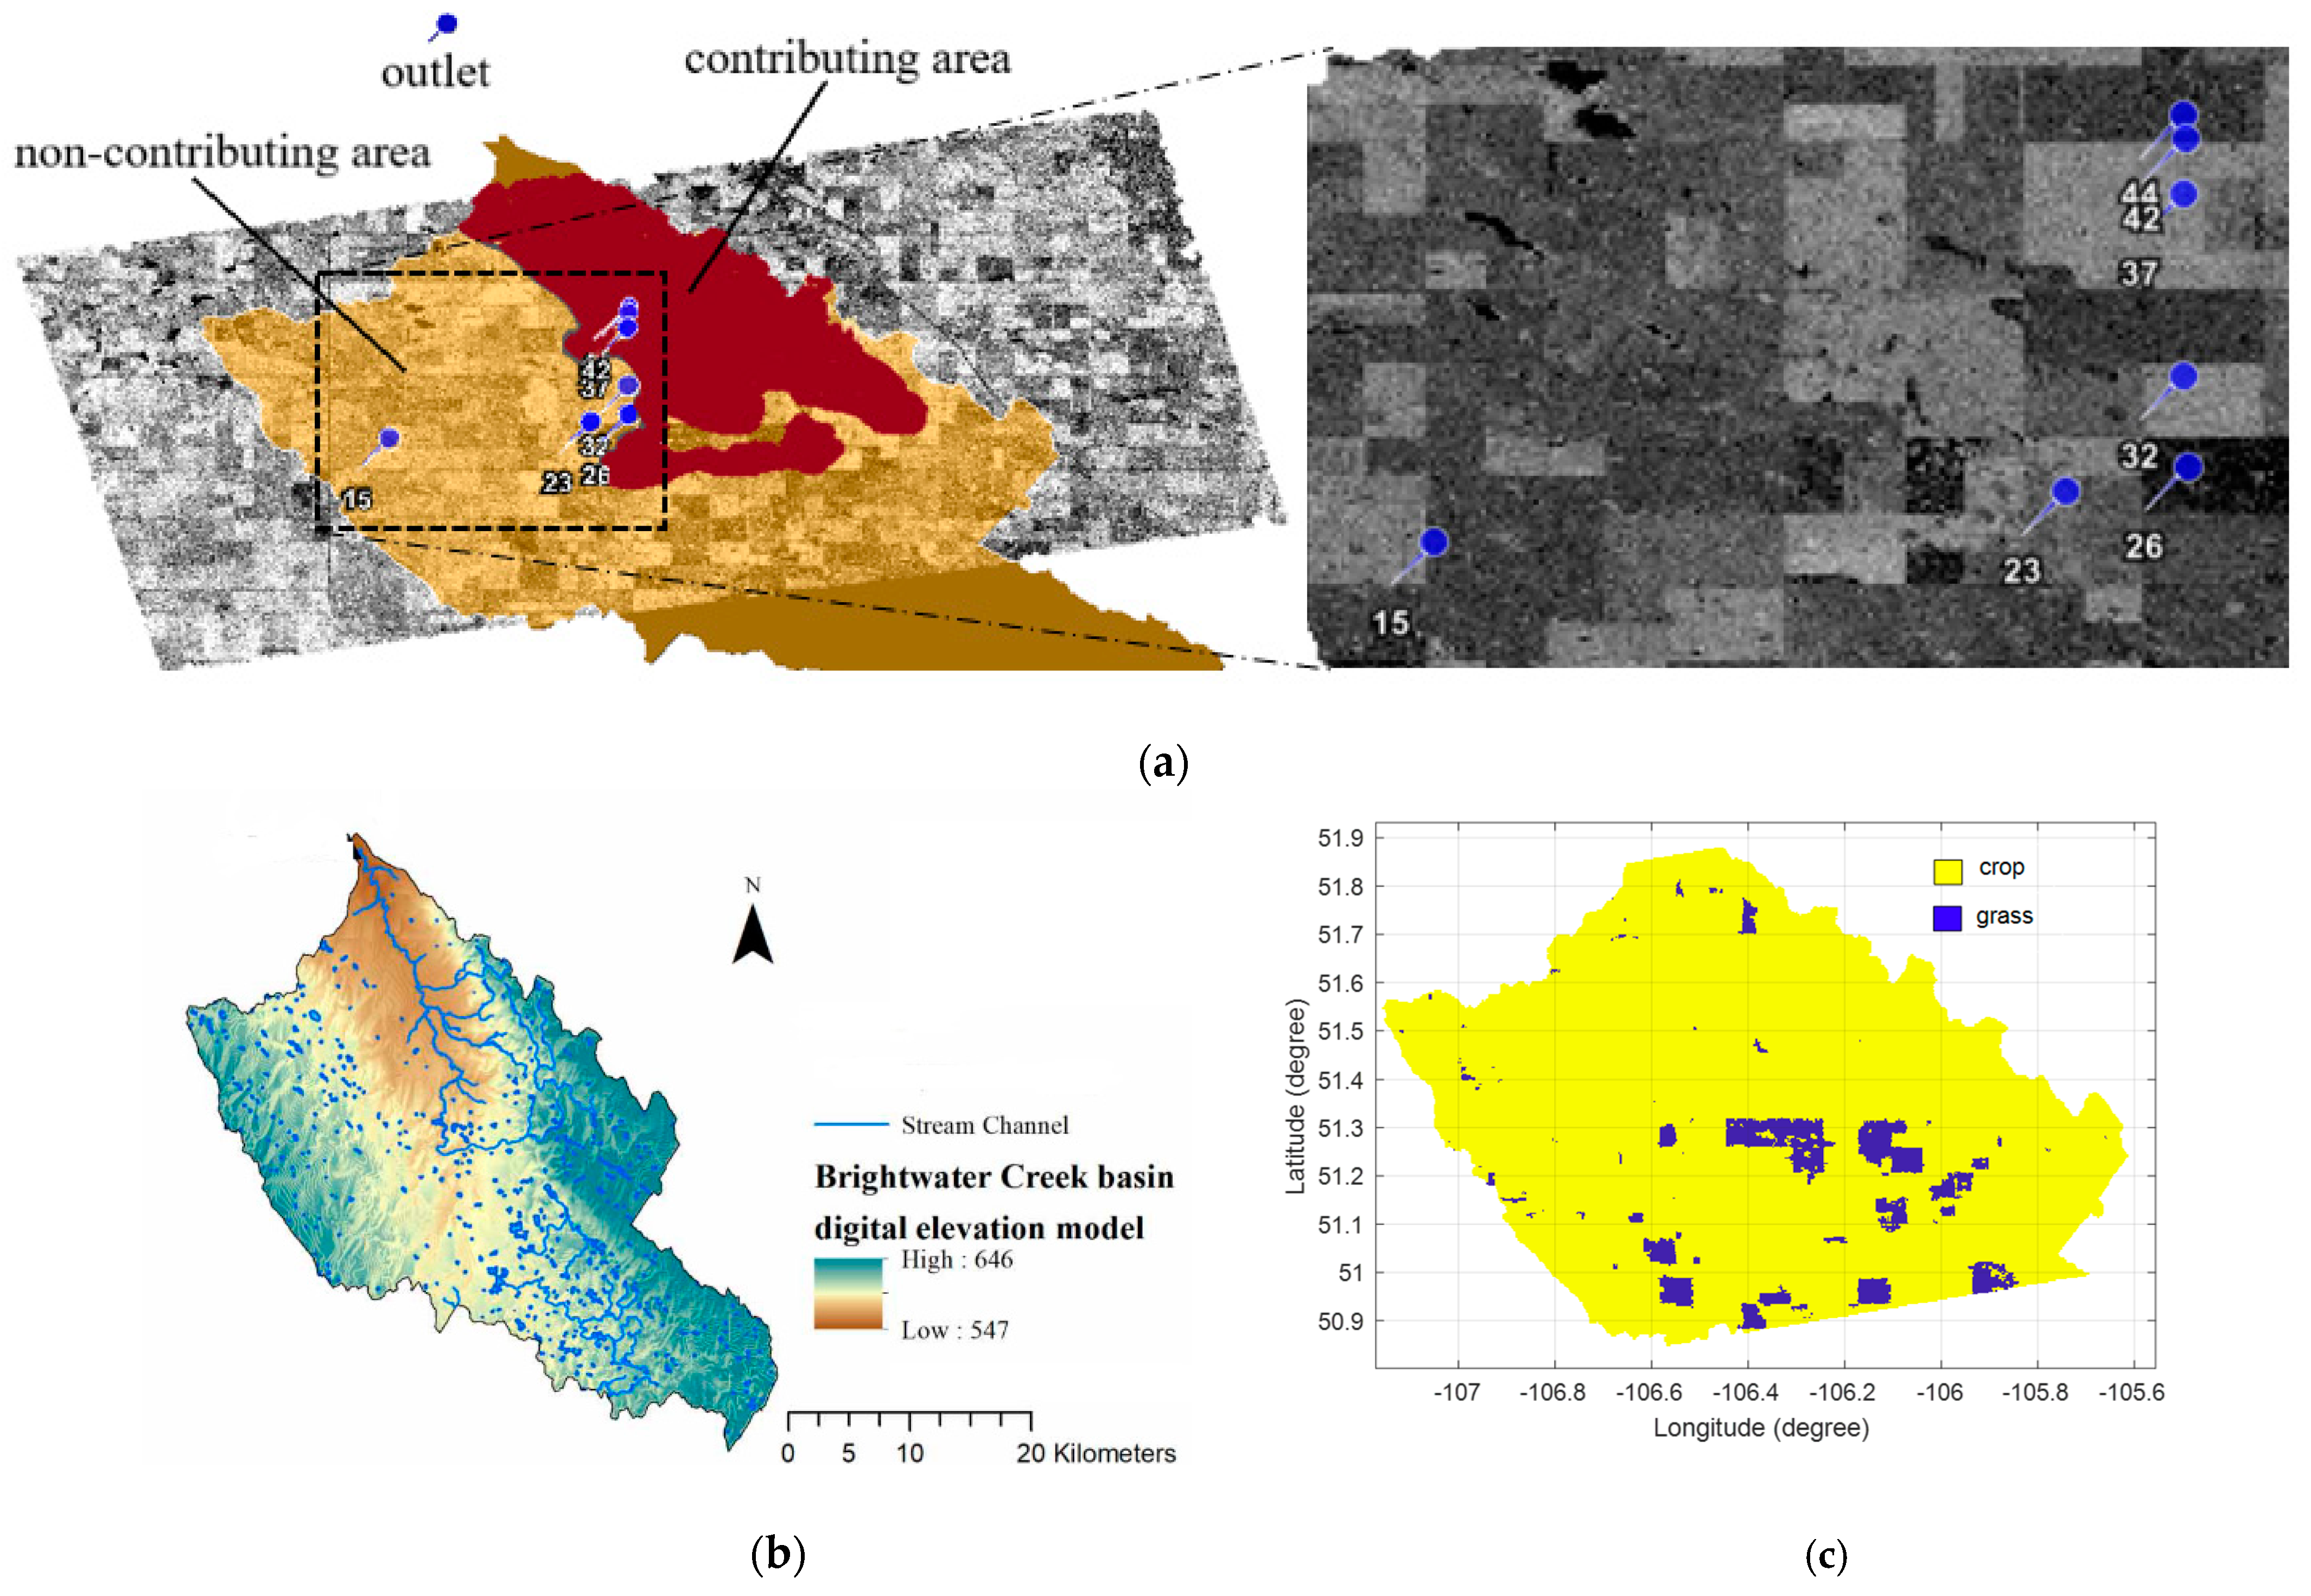
2.1. Study Area
2.2. Field Measurements
2.3. Radarsat-2 Soil Moisture Retrieval Algorithm
2.3.1. SAR Scattering Model
2.3.2. Optimization of a Cost Function
2.3.3. Stochastic Bias Correction
2.4. SMAP Soil Moisture
3. Results
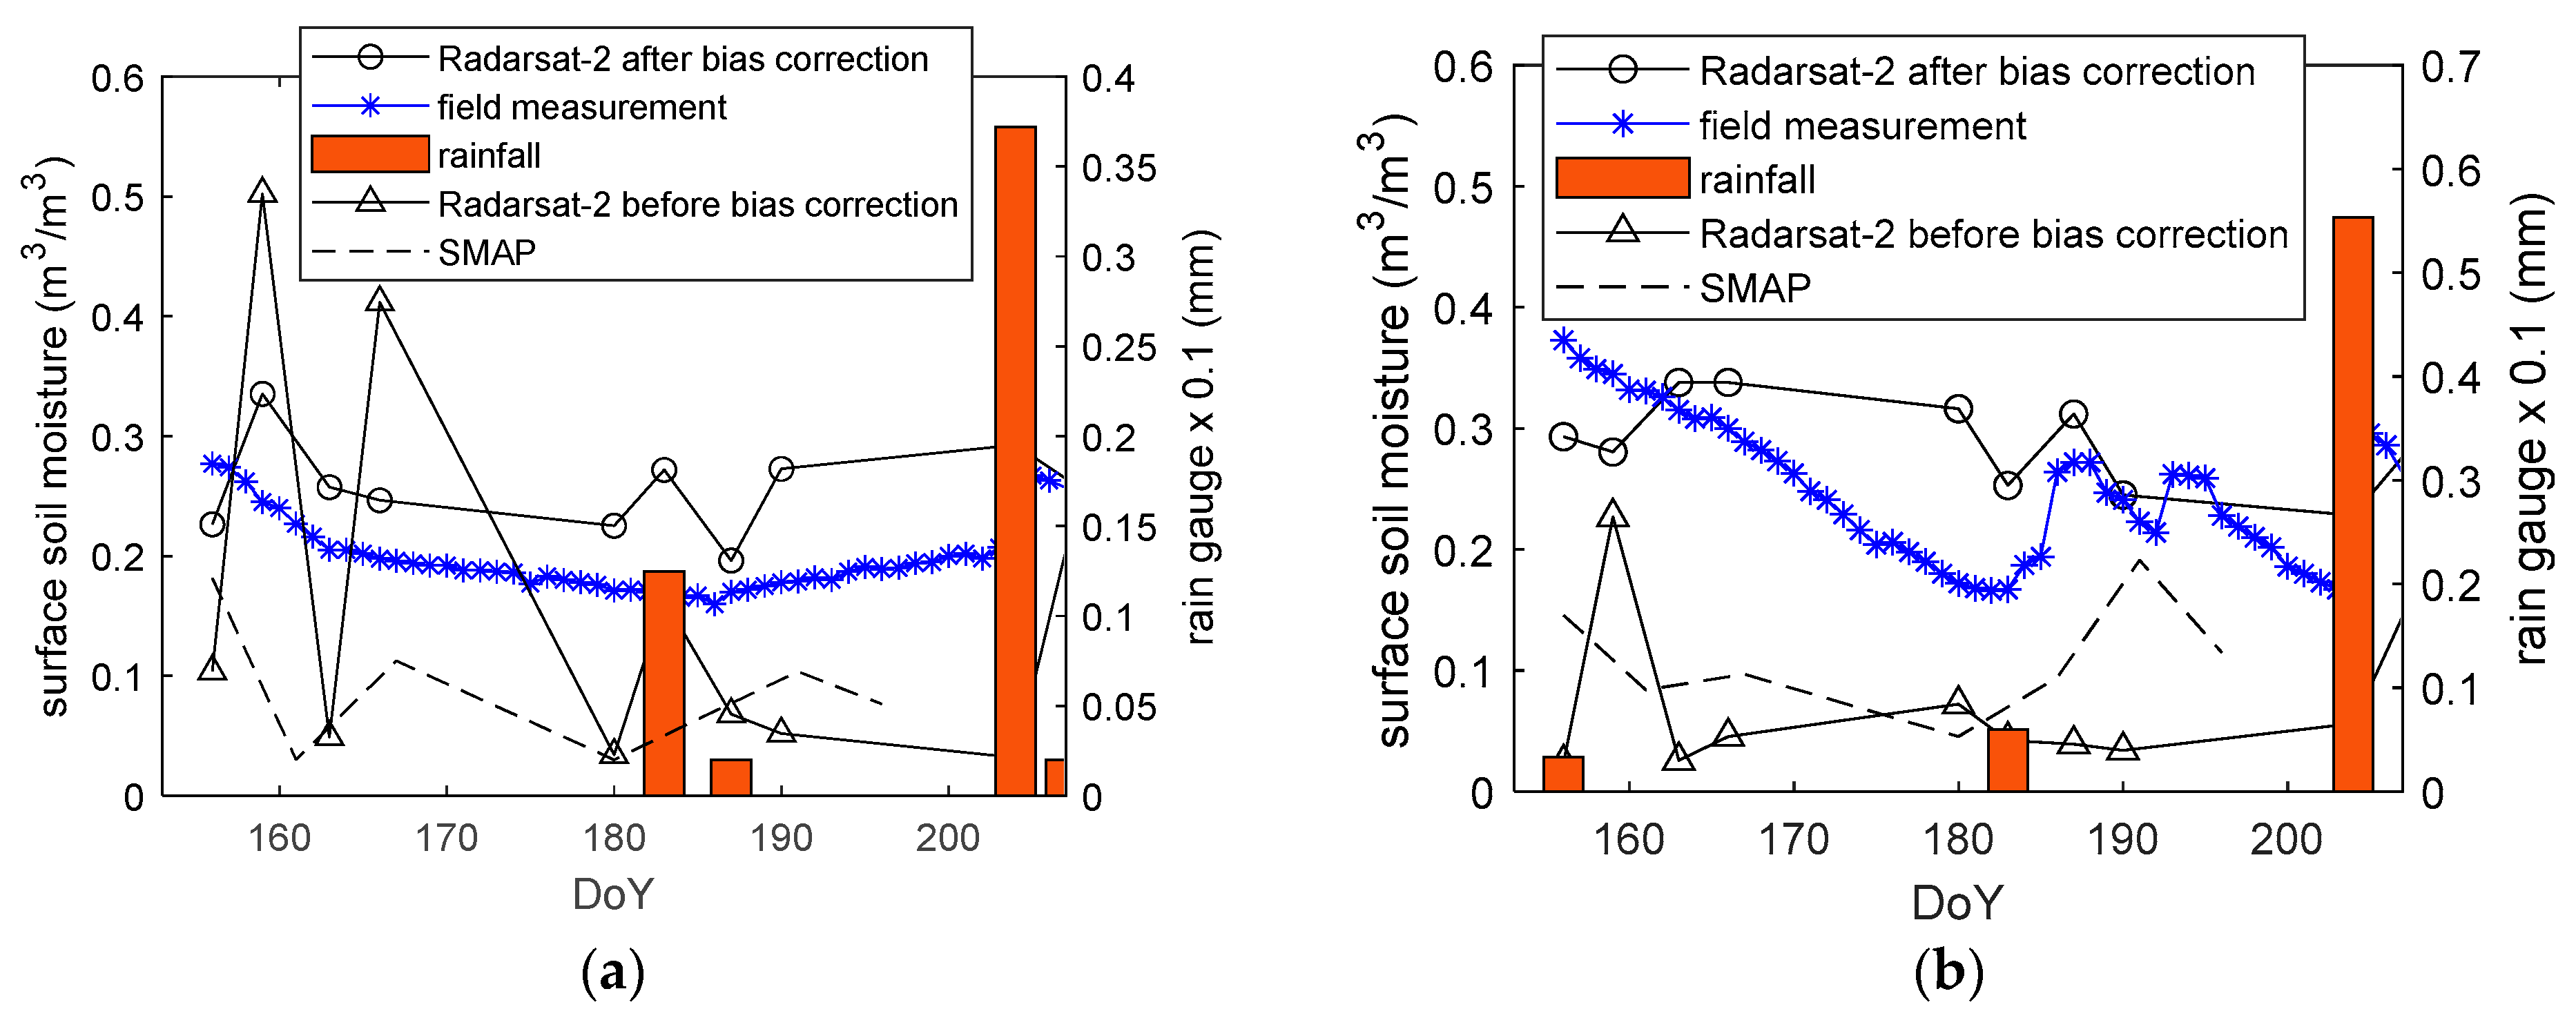
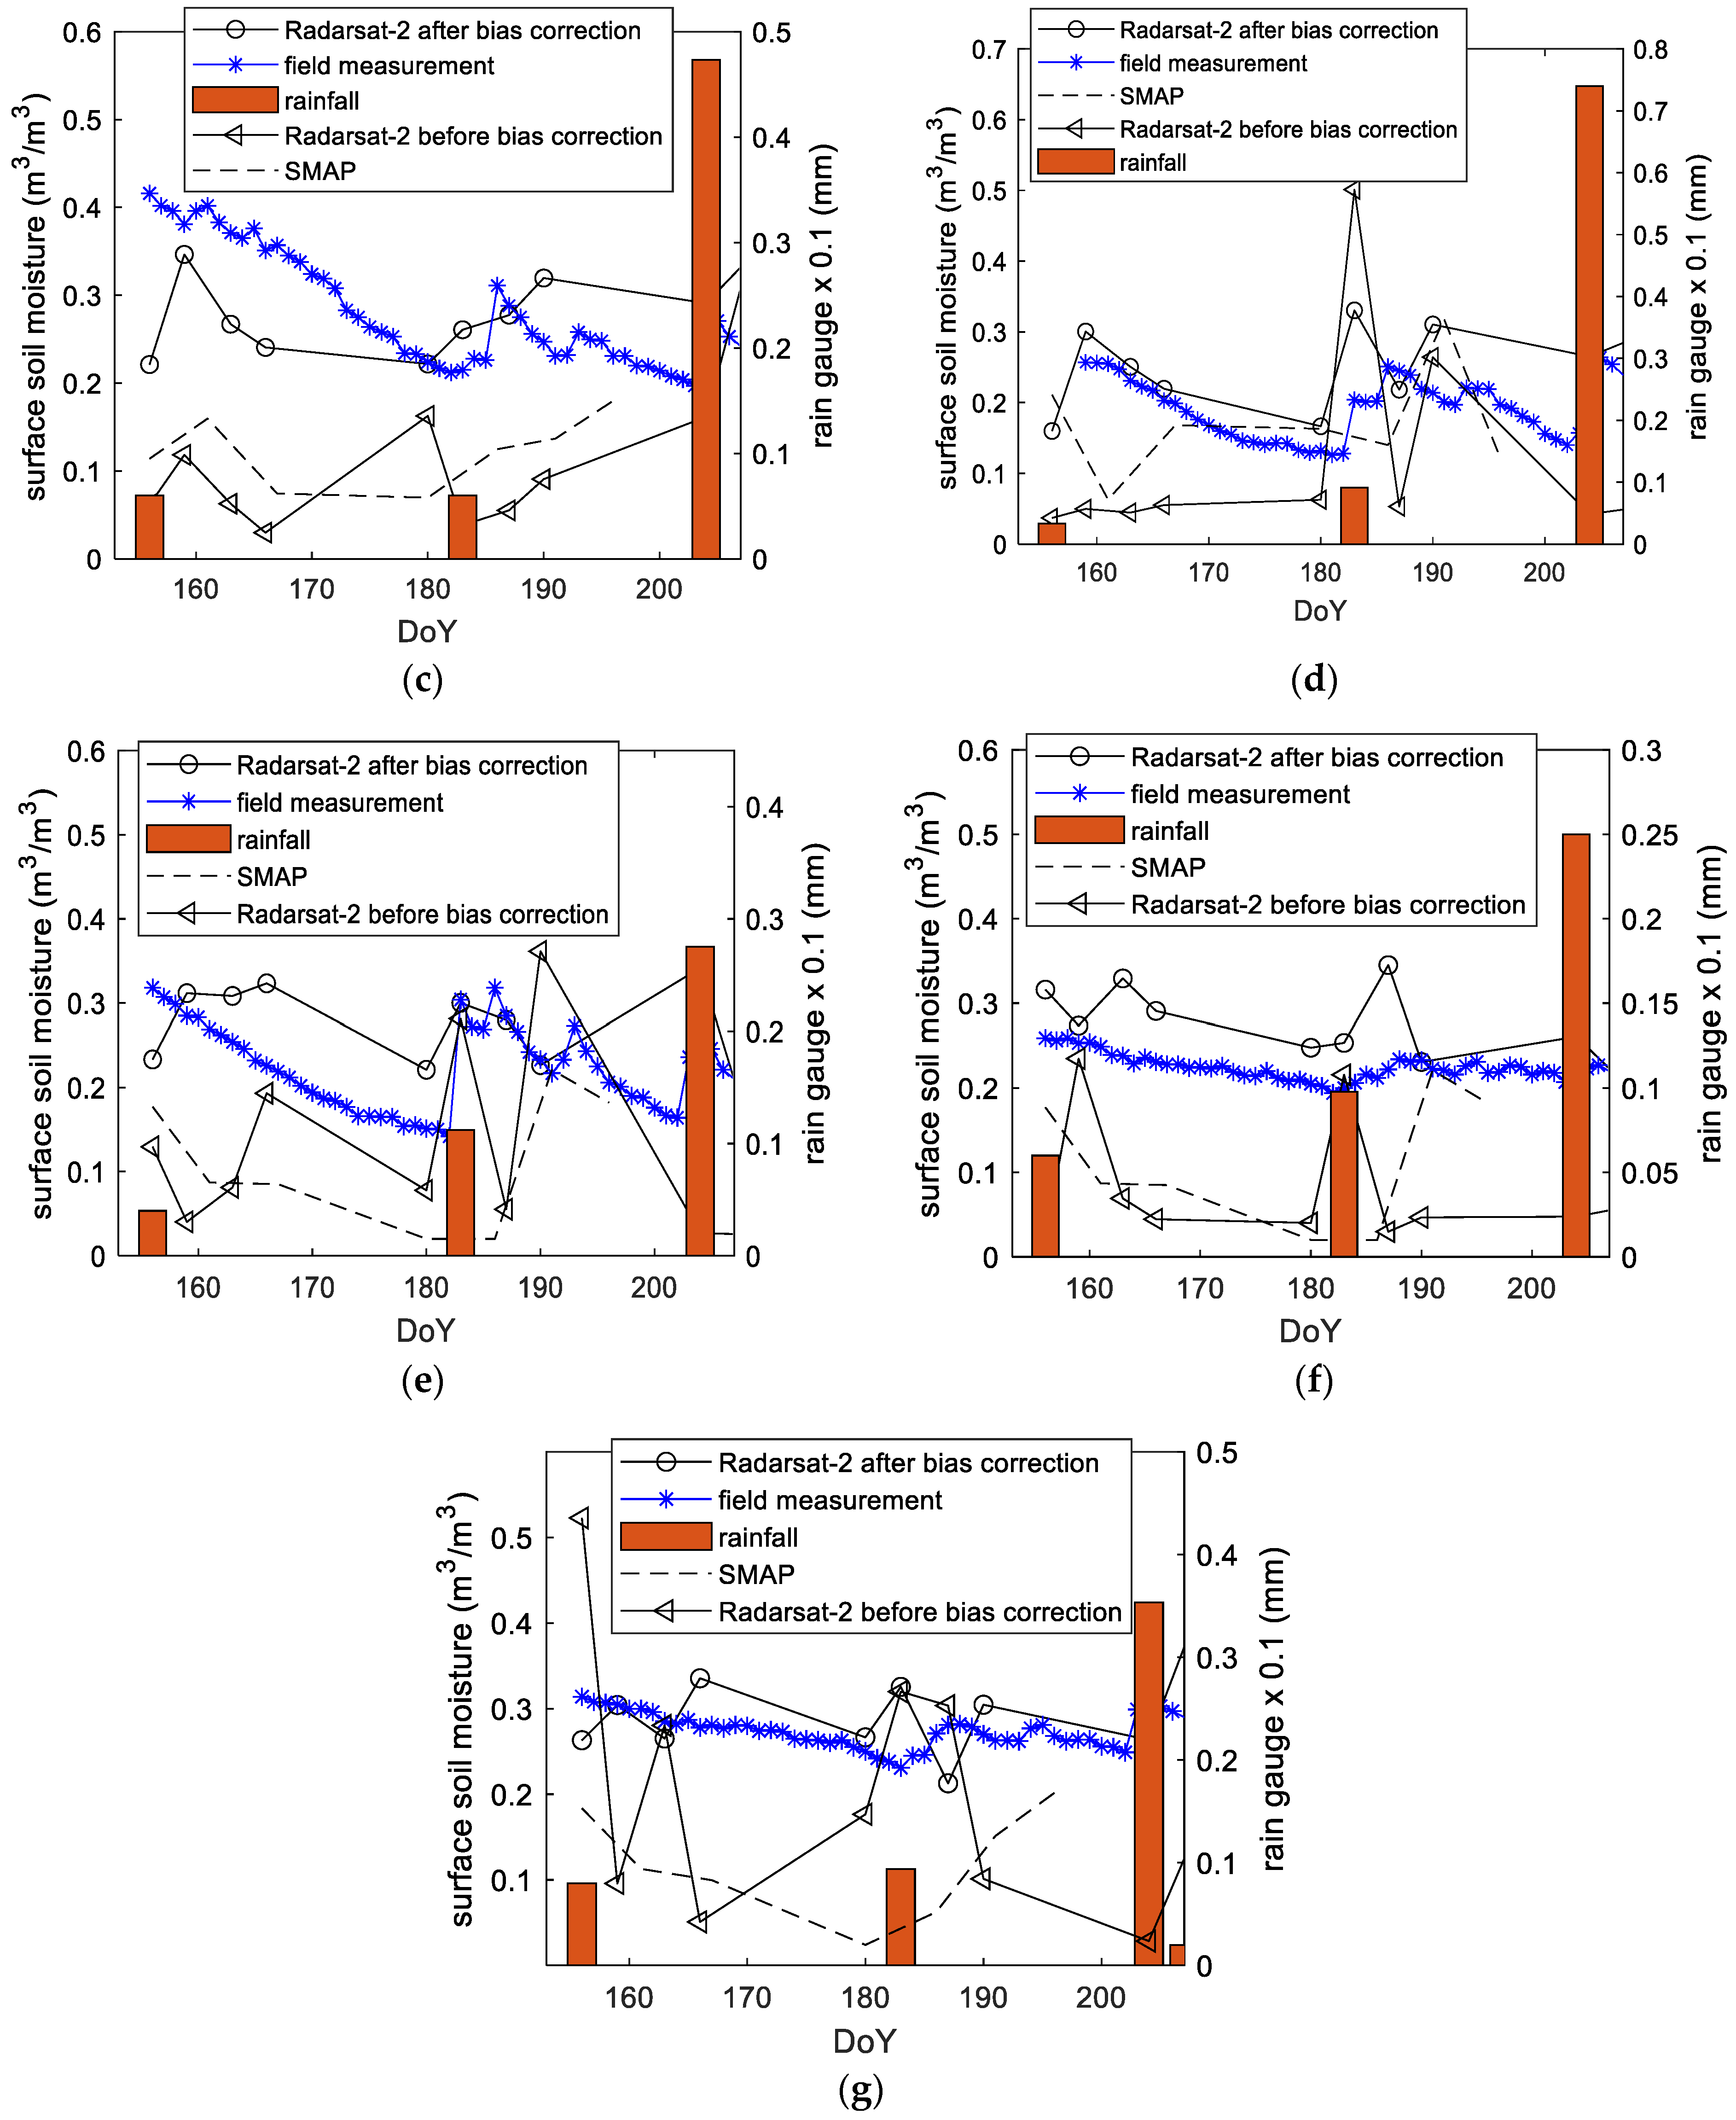
3.1. Local Validation for Time Series SAR Soil Moisture: Point Scale
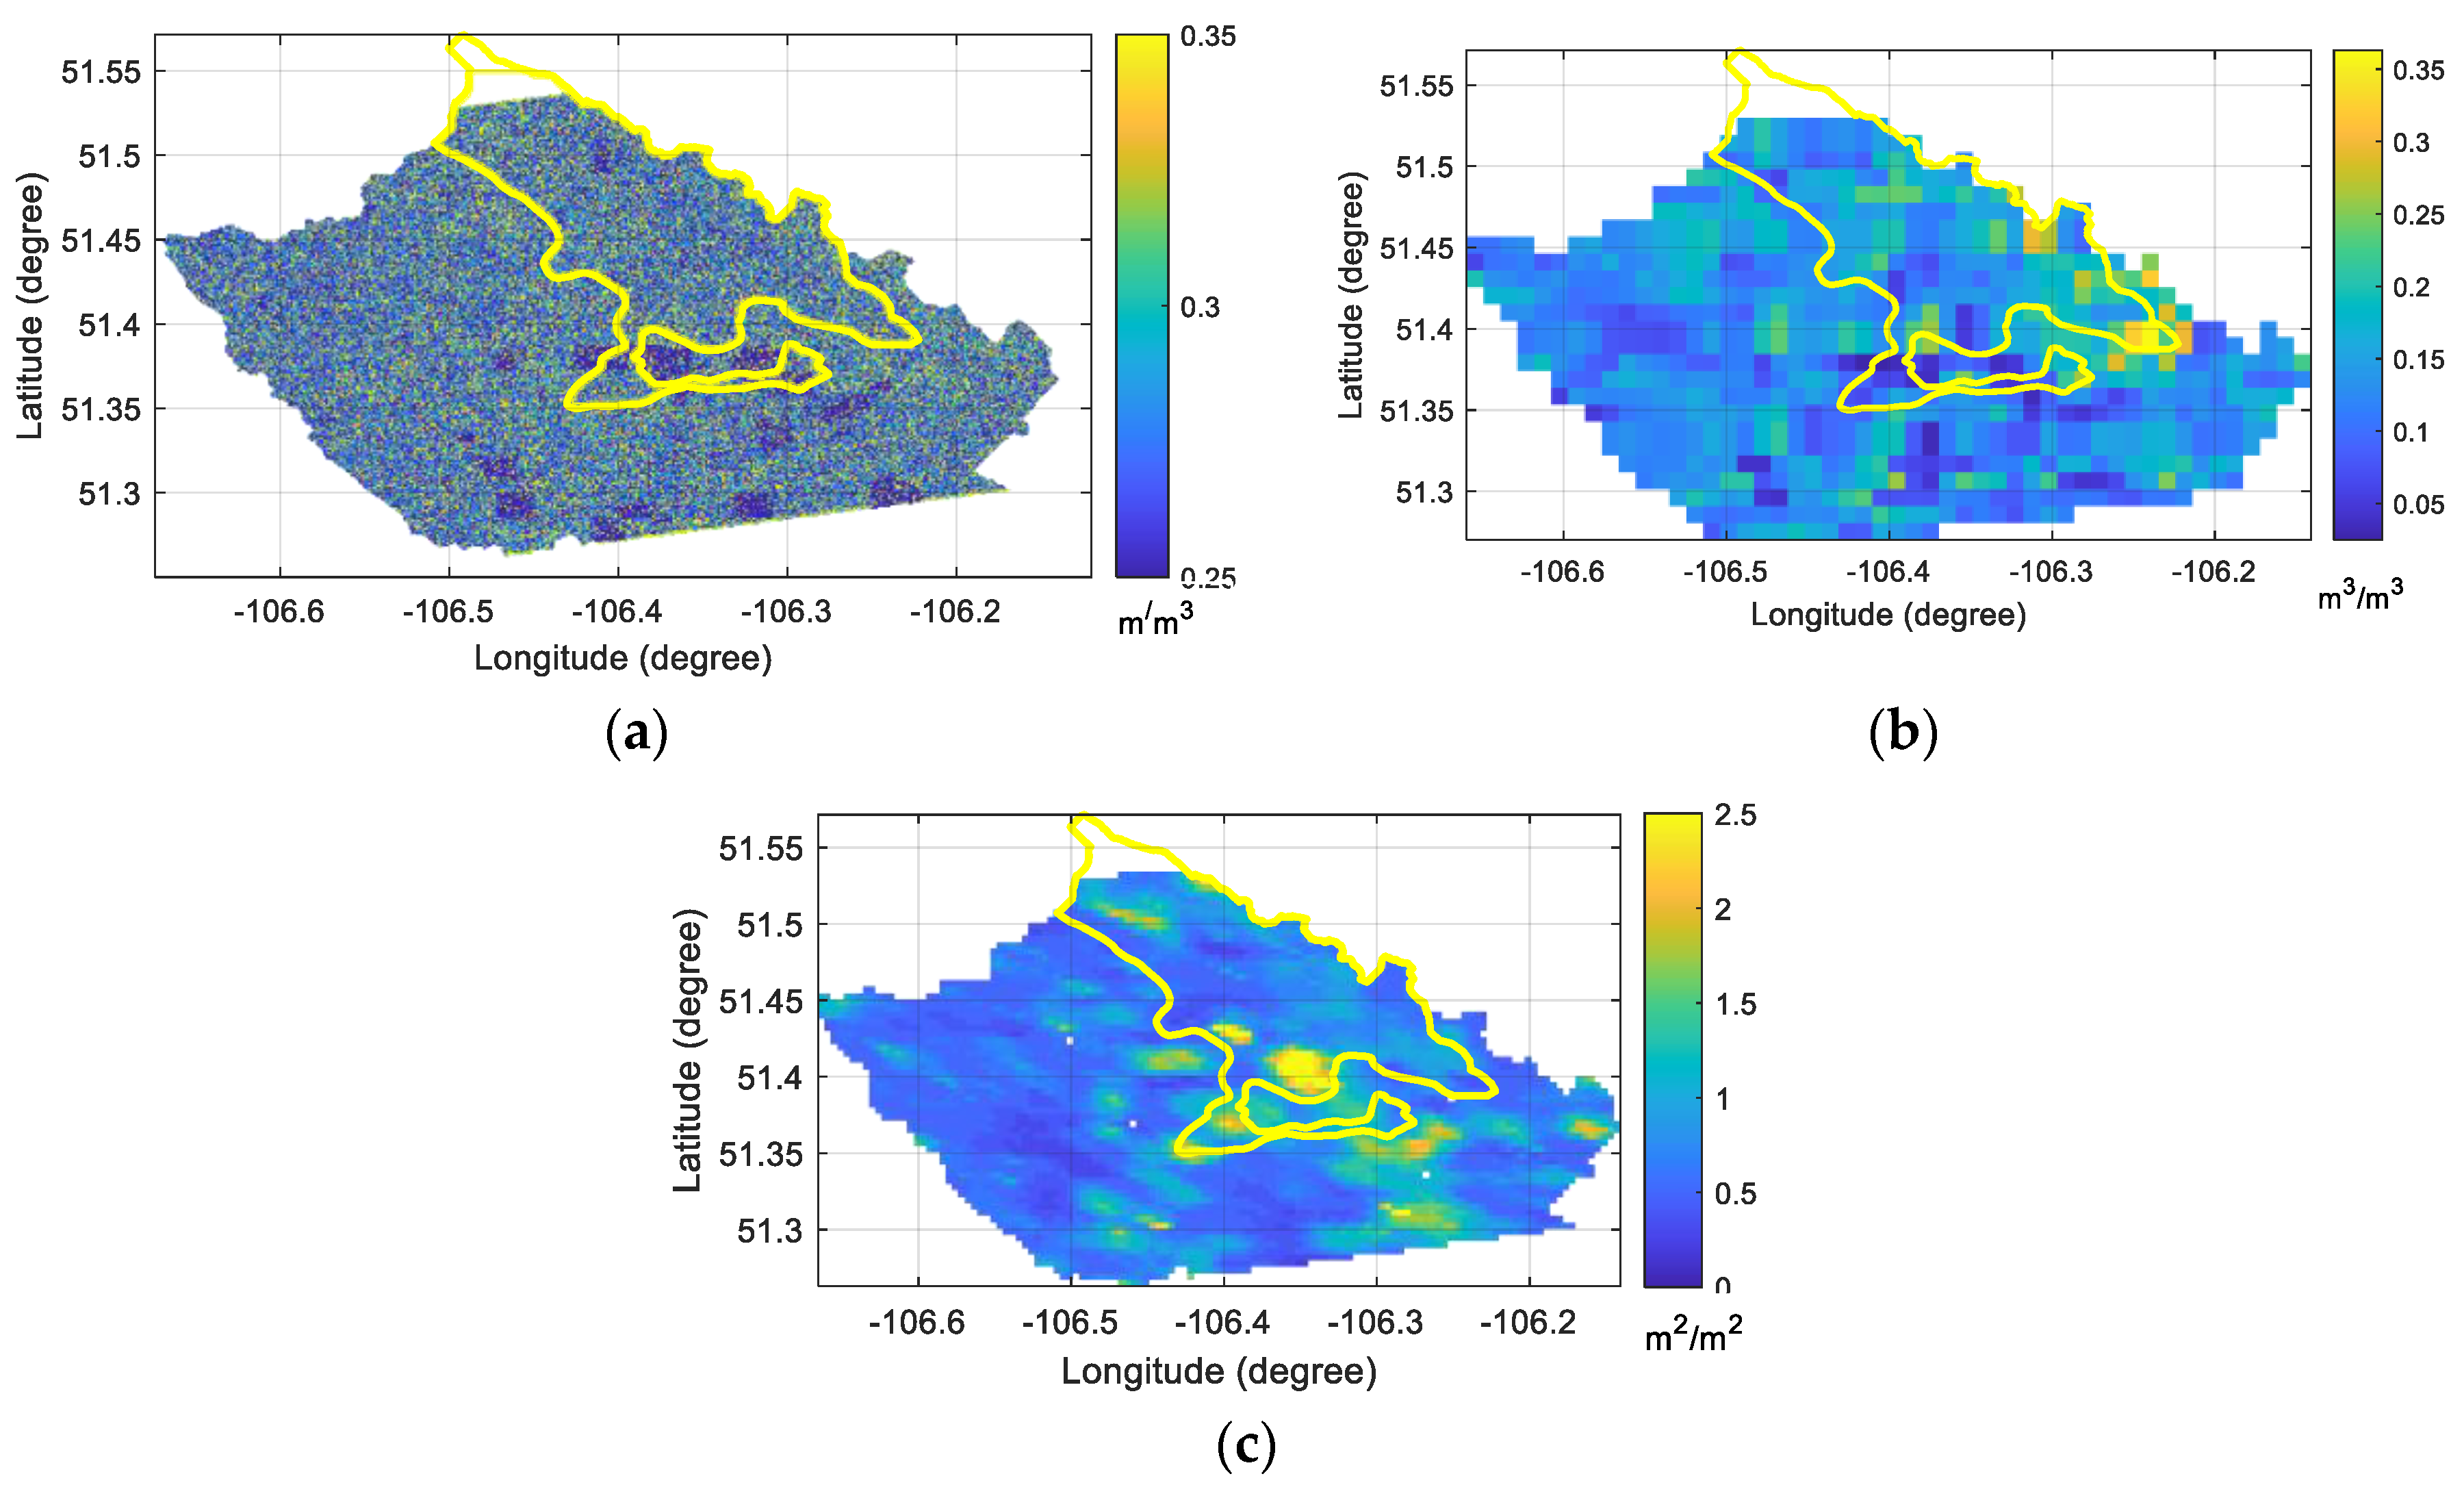
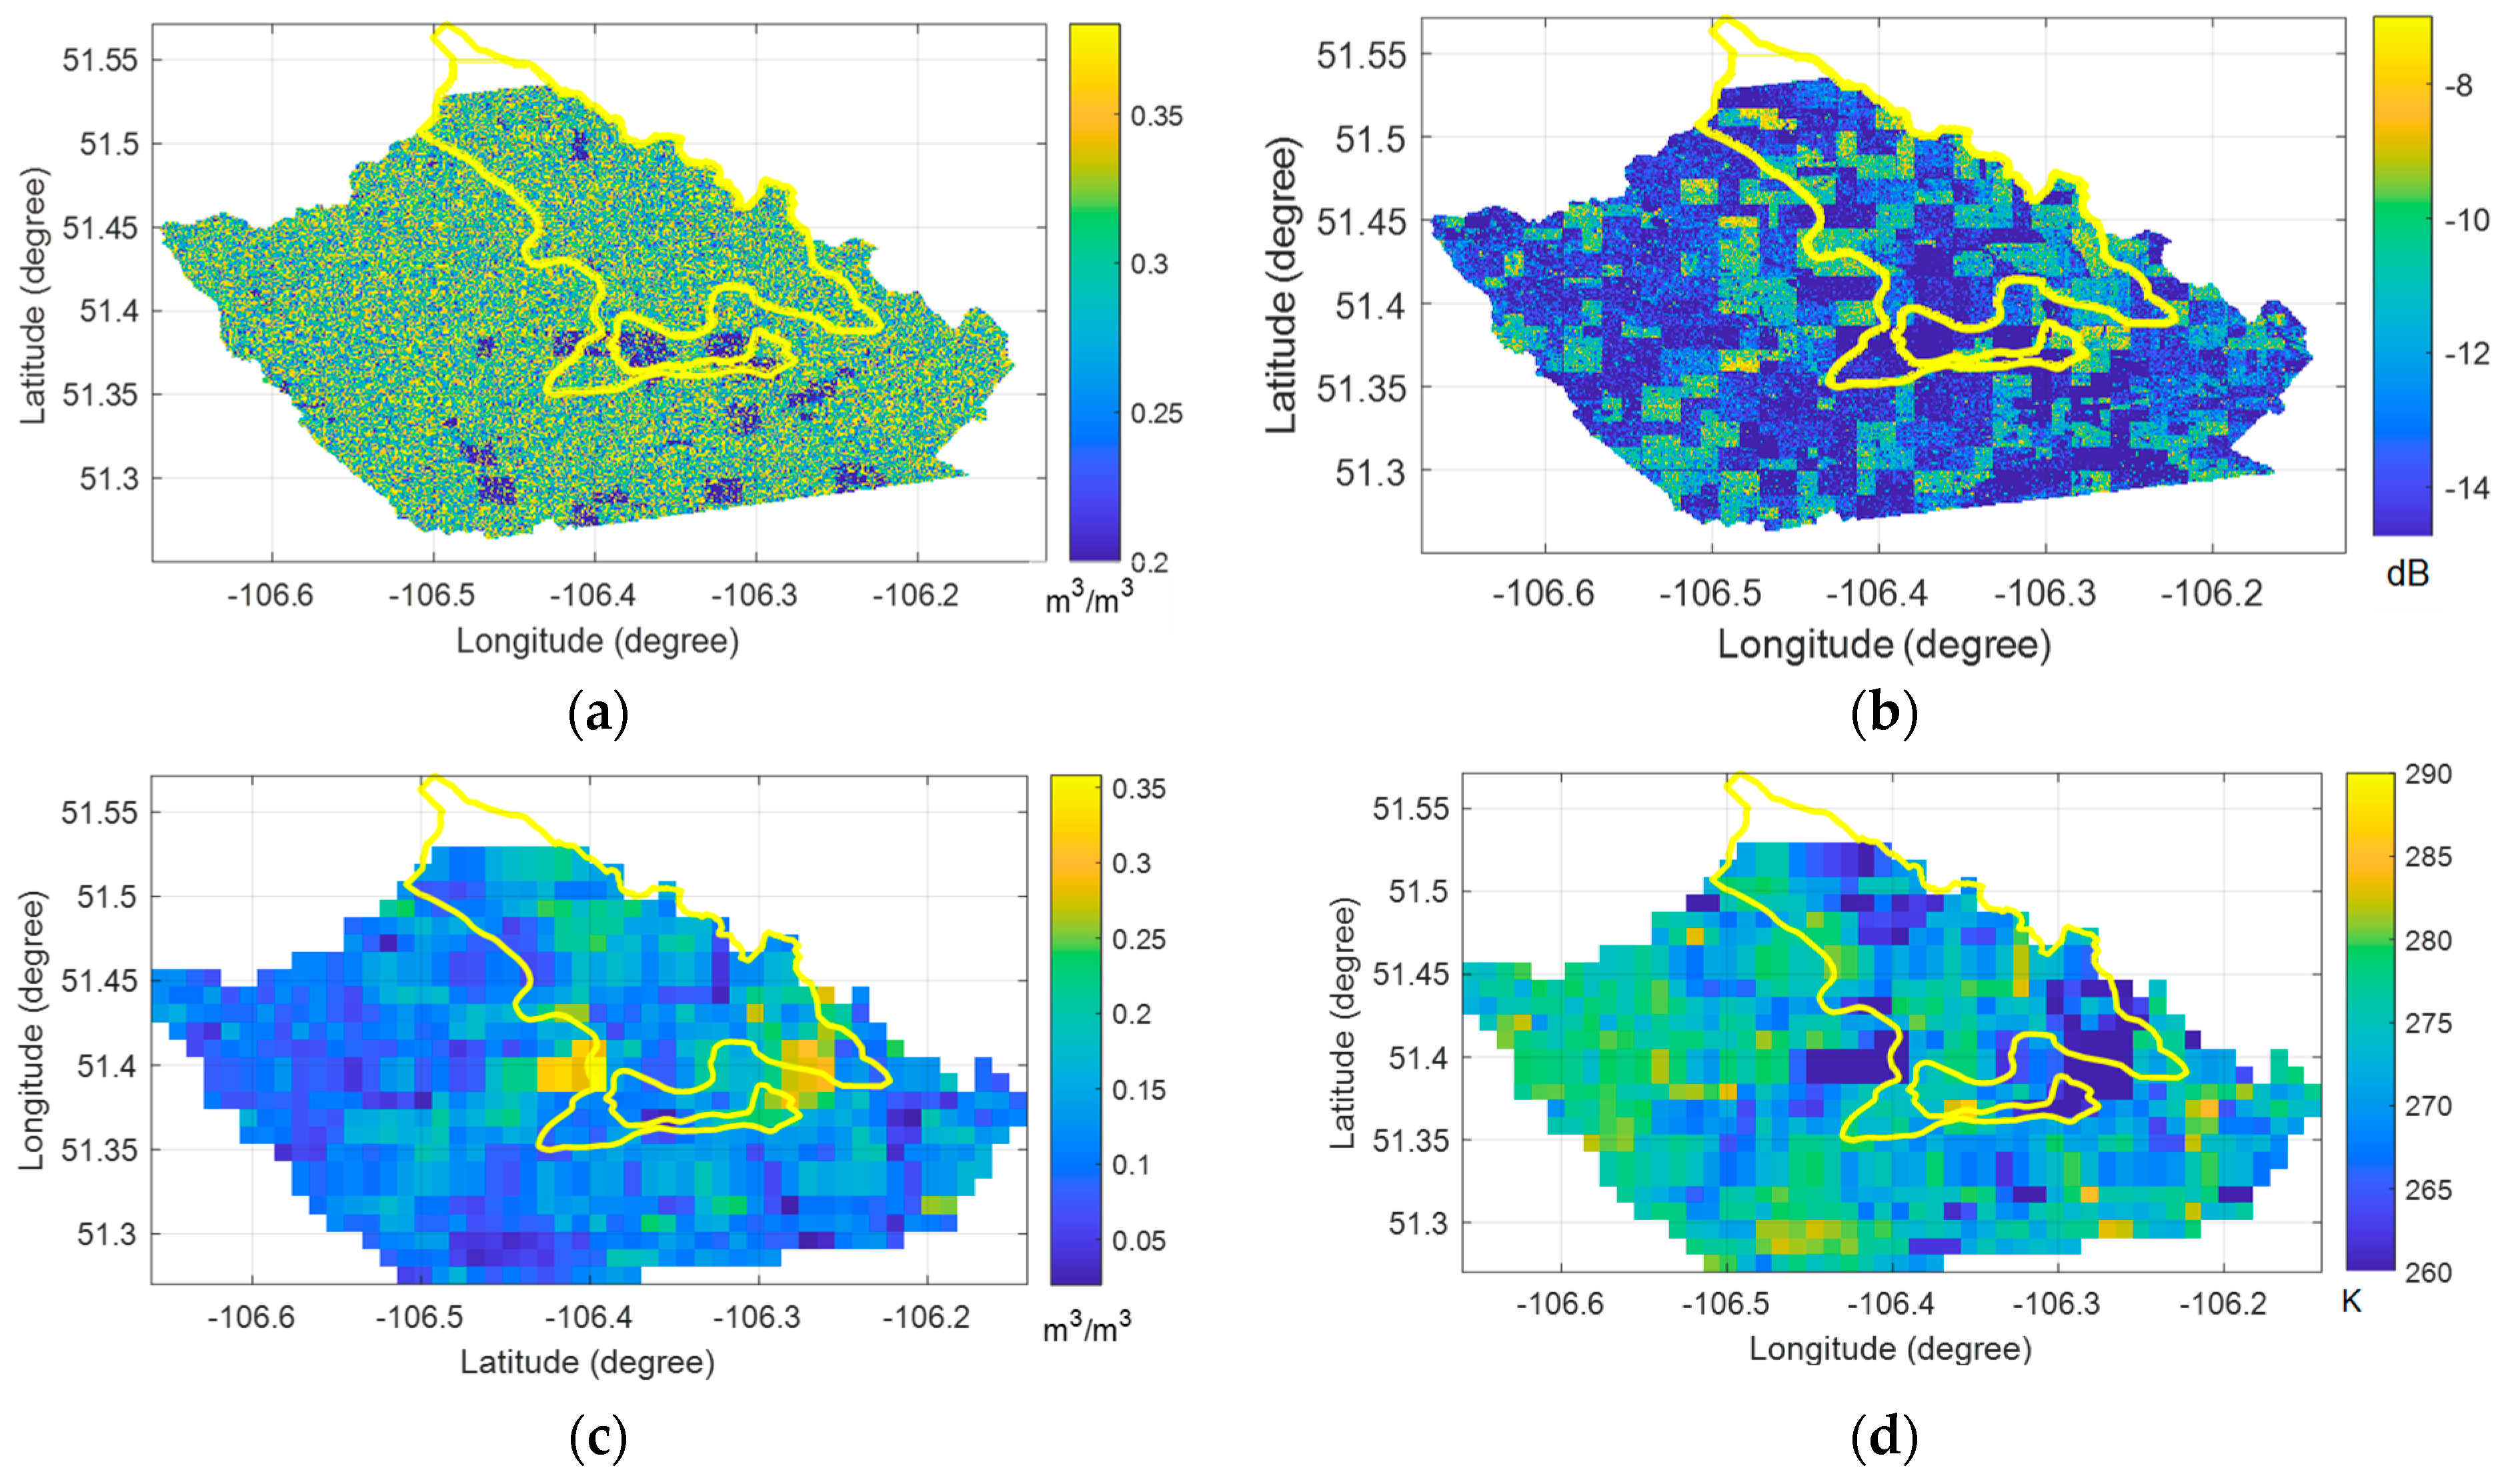
3.2. Spatial Distribution: Sub-Catchment Scale
3.2.1. Dry Period Comparisons
3.2.2. Wet Period Comparisons
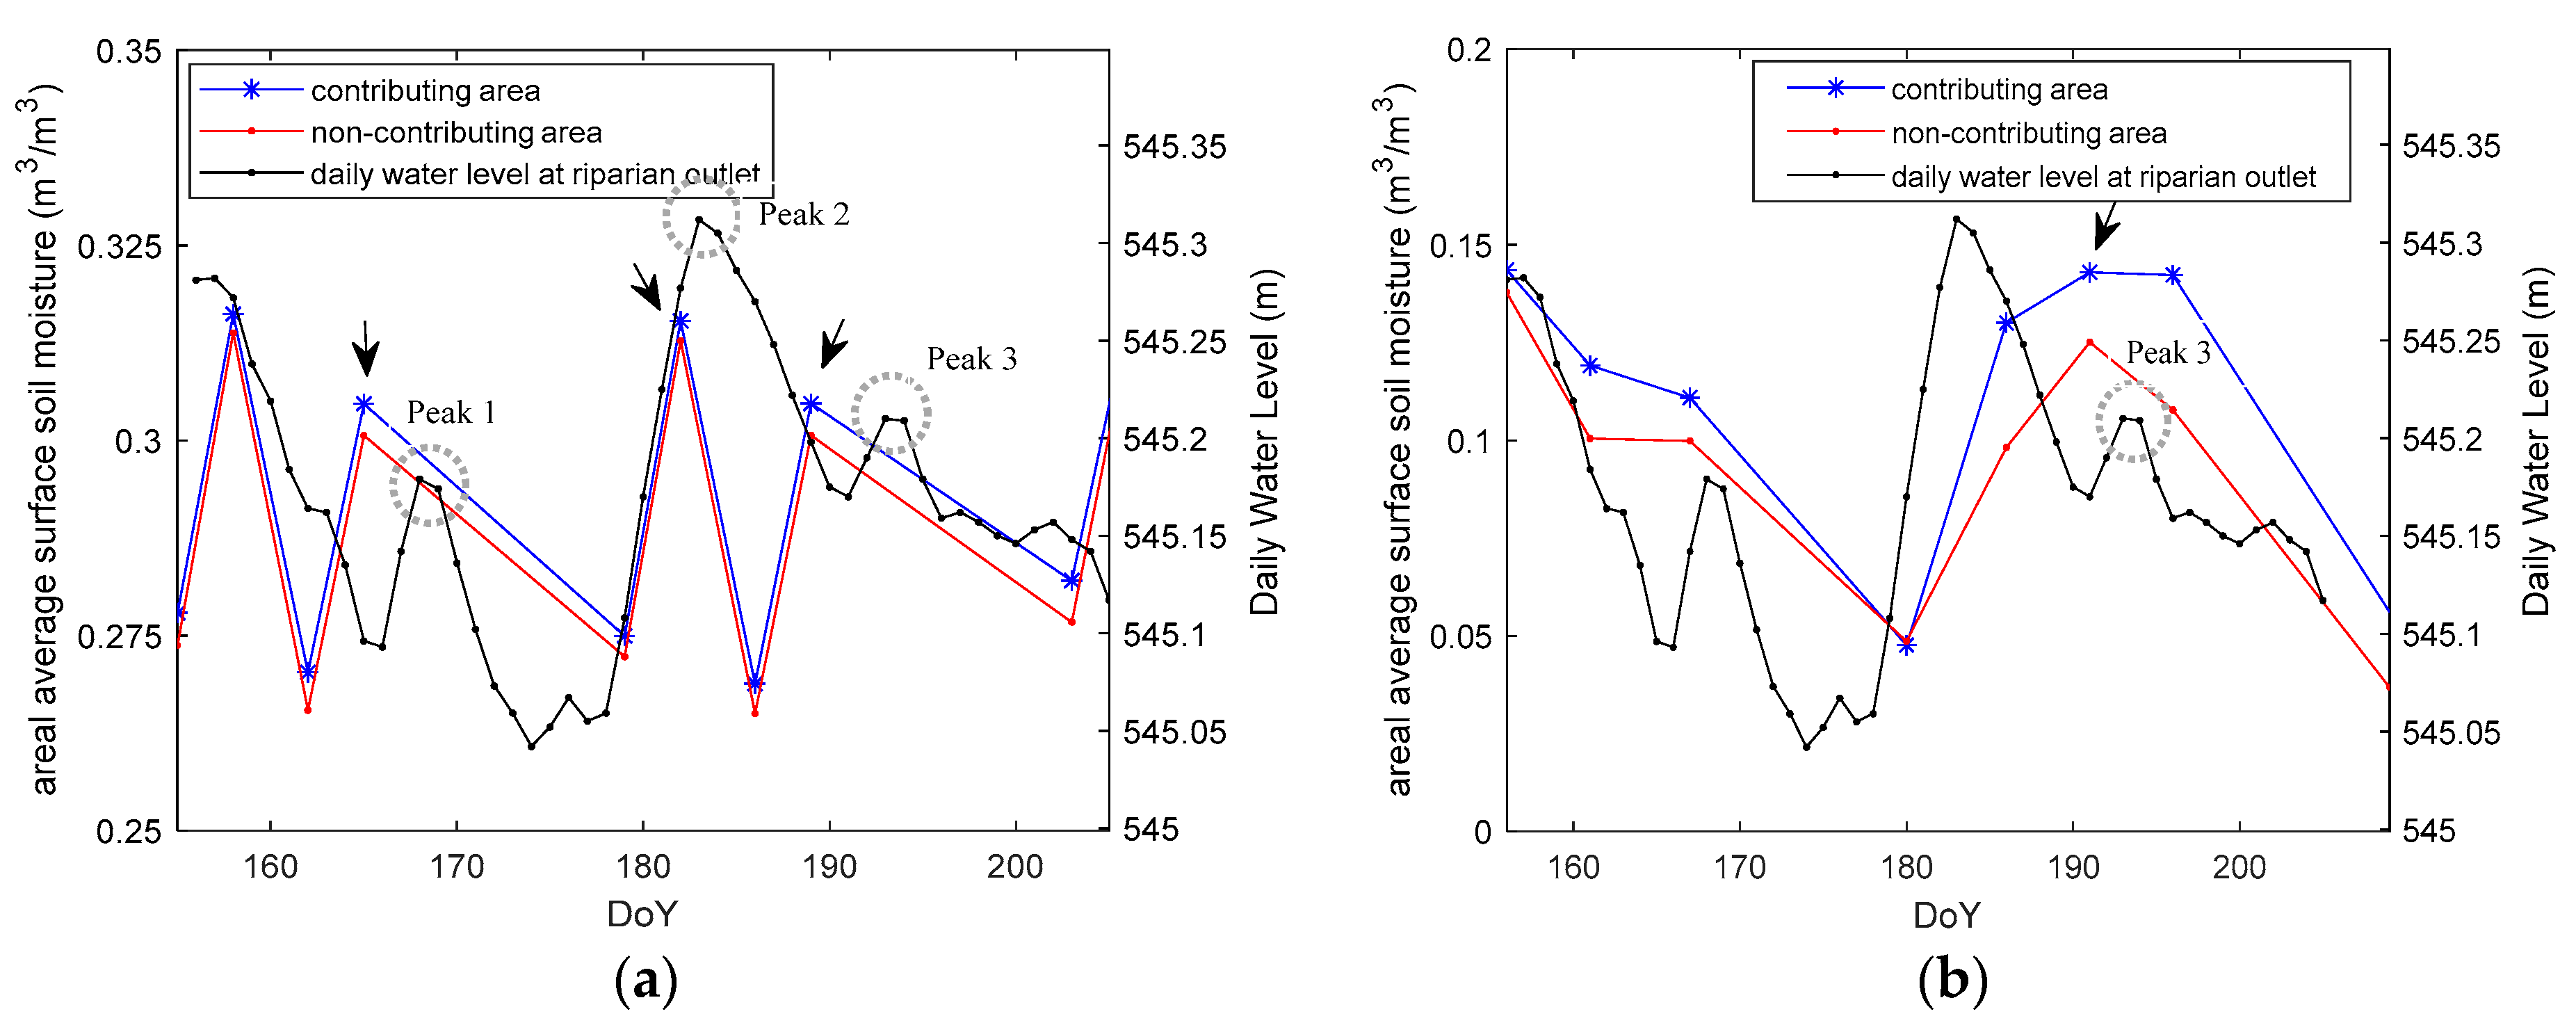
3.3. Hydrological Validation at Prairie Outlet: Watershed Scale
4. Discussion
5. Conclusions
Author Contributions
Funding
Data Availability Statement
Acknowledgments
Conflicts of Interest
References
- Brocca, L.; Melone, F.; Moramarco, T.; Wagner, W.; Naeimi, V.; Bartalis, Z.; Hasenauer, S. Improving runoff prediction through the assimilation of the ASCAT soil moisture product. Hydrol. Earth Syst. Sci. 2010, 14, 1881–1893. [Google Scholar] [CrossRef] [Green Version]
- Wanders, N.; Karssenberg, D.; Bierkens, M.; Parinussa, R.; de Jeu, R.; van Dam, J.; de Jong, S. Observation uncertainty of satellite soil moisture products determined with physically-based modeling. Remote Sens. Environ. 2012, 127, 341–356. [Google Scholar] [CrossRef]
- Massari, C.; Brocca, L.; Moramarco, T.; Tramblay, Y.; Didon Lescot, J.-F. Potential of soil moisture observations in flood modelling: Estimating initial conditions and correcting rainfall. Adv. Water Resour. 2014, 74, 44–53. [Google Scholar] [CrossRef]
- Budhathoki, S.; Rokaya, P.; Lindenschmidt, K.-E. Improved modelling of a Prairie catchment using a progressive two-stage calibration strategy with in situ soil moisture and streamflow data. Hydrol. Res. 2020, 51, 505–520. [Google Scholar] [CrossRef]
- Draper, C.S.; Mahfouf, J.F.; Walker, J.P. An EKF assimilation of AMSR-E soil moisture into the ISBA land surface scheme. J. Geophys. Res. Atmos. 2009, 114, D20104. [Google Scholar] [CrossRef] [Green Version]
- Devia, G.K.; Ganasri, B.P.; Dwarakish, G.S. A Review on Hydrological Models. Aquat. Procedia 2015, 4, 1001–1007. [Google Scholar] [CrossRef]
- Budhathoki, S.; Rokaya, P.; Lindenschmidt, K.-E.; Davison, B. A multi-objective calibration approach using in-situ soil moisture data for improved hydrological simulation of the Prairies. Hydrol. Sci. J. 2020, 65, 638–649. [Google Scholar] [CrossRef]
- Mengistu, S.G.; Spence, C. Testing the ability of a semidistributed hydrological model to simulate contributing area. Water Resour. Res. 2016, 52, 4399–4415. [Google Scholar] [CrossRef] [Green Version]
- Gala, T.S.; Aldred, D.A.; Carlyle, S.; Creed, I.F. Topographically based spatially averaging of SAR data improves performance of soil moisture models. Remote Sens. Environ. 2011, 115, 3507–3516. [Google Scholar] [CrossRef]
- Gala, T.S.; Melesse, A.M. Monitoring prairie wet area with an integrated LANDSAT ETM+, RADARSAT-1 SAR and ancillary data from LIDAR. Catena 2012, 95, 12–23. [Google Scholar] [CrossRef]
- Kerr, Y.H.; Waldteufel, P.; Richaume, P.; Wigneron, J.P.; Ferrazzoli, P.; Mahmoodi, A.; Bitar, A.A.; Cabot, F.; Gruhier, C.; Juglea, S.E.; et al. The SMOS Soil Moisture Retrieval Algorithm. IEEE Trans. Geosci. Remote Sens. 2012, 50, 1384–1403. [Google Scholar] [CrossRef]
- Entekhabi, D.; Yueh, S.; O’Neill, P.E.; Kellogg, K.H.; Allen, A.; Bindlish, R.; Brown, M.; Chan, S.; Colliander, A.; Crow, W.T.; et al. SMAP Handbook–Soil Moisture Active Passive: Mapping Soil Moisture and Freeze/Thaw from Space; JPL Publication: Pasadena, CA, USA, 2014. [Google Scholar]
- Das, N.N.; Entekhabi, D.; Dunbar, R.S.; Chaubell, M.J.; Colliander, A.; Yueh, S.; Jagdhuber, T.; Chen, F.; Crow, W.; O’Neill, P.E.; et al. The SMAP and Copernicus Sentinel 1A/B microwave active-passive high resolution surface soil moisture product. Remote Sens. Environ. 2019, 233, 111380. [Google Scholar] [CrossRef]
- Kornelsen, K.; Coulibaly, P. Advances in soil moisture retrieval from synthetic aperture radar and hydrological applications. J. Hydrol. 2013, 476, 460–489. [Google Scholar] [CrossRef]
- Baghdadi, N.; Aubert, M.; Zribi, M. Use of TerraSAR-X Data to Retrieve Soil Moisture Over Bare Soil Agricultural Fields. IEEE Geosci. Remote Sens. Lett. 2012, 9, 512–516. [Google Scholar] [CrossRef] [Green Version]
- Gao, Y.; Gao, M.; Wang, L.; Rozenstein, O. Soil Moisture Retrieval over a Vegetation-Covered Area Using ALOS-2 L-Band Synthetic Aperture Radar Data. Remote Sens. 2021, 13, 3894. [Google Scholar] [CrossRef]
- Zhang, L.; Meng, Q.; Yao, S.; Wang, Q.; Zeng, J.; Zhao, S.; Ma, J. Soil Moisture Retrieval from the Chinese GF-3 Satellite and Optical Data over Agricultural Fields. Sensors 2018, 18, 2675. [Google Scholar] [CrossRef] [Green Version]
- Singh, G.; Das, N.N.; Panda, R.K.; Mohanty, B.P.; Entekhabi, D.; Bhattacharya, B.K. Soil Moisture Retrieval Using SMAP L-Band Radiometer and RISAT-1 C-Band SAR Data in the Paddy Dominated Tropical Region of India. IEEE J. Sel. Top. Appl. Earth Obs. Remote Sens. 2021, 14, 10644–10664. [Google Scholar] [CrossRef]
- Attema, E.P.W.; Ulaby, F.T. Vegetation modeled as a water cloud. Radio Sci. 1978, 13, 357–364. [Google Scholar] [CrossRef]
- Gherboudj, I.; Magagi, R.; Berg, A.A.; Toth, B. Soil moisture retrieval over agricultural fields from multi-polarized and multi-angular RADARSAT-2 SAR data. Remote Sens. Environ. 2011, 115, 33–43. [Google Scholar] [CrossRef]
- Bindlish, R.; Barros, A.P. Multifrequency Soil Moisture Inversion from SAR Measurements with the Use of IEM. Remote Sens. Environ. 2000, 71, 67–88. [Google Scholar] [CrossRef]
- Mirsoleimani, H.R.; Sahebi, M.R.; Baghdadi, N.; El Hajj, M. Bare Soil Surface Moisture Retrieval from Sentinel-1 SAR Data Based on the Calibrated IEM and Dubois Models Using Neural Networks. Sensors 2019, 19, 3209. [Google Scholar] [CrossRef] [PubMed] [Green Version]
- Wagner, W.; Sabel, D.; Doubkova, M.; Bartsch, A.; Pathe, C. The potential of sentinel-1 for monitoring soil moisture with a high spatial resolution at global scale. In Proceedings of the Earth Observation and Water Cycle Science, Frascati, Italy, 18–20 November 2009. ESA SP-674. [Google Scholar]
- Mattia, F.; Le Toan, T. Backscattering Properties of Multi-Scale Rough Surfaces. J. Electromagn. Waves Appl. 1999, 13, 493–527. [Google Scholar] [CrossRef]
- Chen, K.S.; Yen, S.K.; Huang, W.P. A simple model for retrieving bare soil moisture from radar-scattering coefficients. Remote Sens. Environ. 1995, 54, 121–126. [Google Scholar] [CrossRef]
- O’Neill, P.; Bindlish, R.; Chan, S.; Njoku, E.; Jackson, T. SMAP Algorithm Theoretical Basis Document: Level 2 & 3 Soil Moisture (Passive) Data Products; JPL Publication: Pasadena, CA, USA, 2015. [Google Scholar]
- Roy, S.K.; Rowlandson, T.L.; Berg, A.A.; Champagne, C.; Adams, J.R. Impact of sub-pixel heterogeneity on modelled brightness temperature for an agricultural region. Int. J. Appl. Earth Obs. Geoinf. 2016, 45, 212–220. [Google Scholar] [CrossRef]
- Baghdadi, N.; Gherboudj, I.; Zribi, M.; Sahebi, M.; King, C.; Bonn, F. Semi-empirical calibration of the IEM backscattering model using radar images and moisture and roughness field measurements. Int. J. Remote Sens. 2004, 25, 3593–3623. [Google Scholar] [CrossRef]
- Merzouki, A.; McNairn, H.; Pacheco, A. Mapping Soil Moisture Using RADARSAT-2 Data and Local Autocorrelation Statistics. IEEE J. Sel. Top. Appl. Earth Obs. Remote Sens. 2011, 4, 128–137. [Google Scholar] [CrossRef]
- Pauwels, V.R.N.; Hoeben, R.; Verhoest, N.E.C.; De Troch, F.P.; Troch, P.A. Improvement of TOPLATS-based discharge predictions through assimilation of ERS-based remotely sensed soil moisture values. Hydrol. Process. 2002, 16, 995–1013. [Google Scholar] [CrossRef]
- Shi, J.C.; Wang, J.; Hsu, A.Y.; Neill, P.E.O.; Engman, E.T. Estimation of bare surface soil moisture and surface roughness parameter using L-band SAR image data. IEEE Trans. Geosci. Remote Sens. 1997, 35, 1254–1266. [Google Scholar] [CrossRef]
- van der Velde, R.; Su, Z.; van Oevelen, P.; Wen, J.; Ma, Y.; Salama, M.S. Soil moisture mapping over the central part of the Tibetan Plateau using a series of ASAR WS images. Remote Sens. Environ. 2012, 120, 175–187. [Google Scholar] [CrossRef]
- Verhoest, N.E.C.; De Baets, B.; Mattia, F.; Satalino, G.; Lucau, C.; Defourny, P. A possibilistic approach to soil moisture retrieval from ERS synthetic aperture radar backscattering under soil roughness uncertainty. Water Resour. Res. 2007, 43, W07435. [Google Scholar] [CrossRef]
- Lee, J.H.; Budhathoki, S.; Lindenschmidt, K.-E. Stochastic bias correction for RADARSAT-2 soil moisture retrieved over vegetated areas. Geocarto Int. 2021, 37, 9190–9203. [Google Scholar] [CrossRef]
- Zhu, L.; Walker, J.P.; Shen, X. Stochastic ensemble methods for multi-SAR-mission soil moisture retrieval. Remote Sens. Environ. 2020, 251, 112099. [Google Scholar] [CrossRef]
- Pierdicca, N.; Pulvirenti, L.; Bignami, C. Soil moisture estimation over vegetated terrains using multitemporal remote sensing data. Remote Sens. Environ. 2010, 114, 440–448. [Google Scholar] [CrossRef]
- Notarnicola, C.; Angiulli, M.; Posa, F. Use of radar and optical remotely sensed data for soil moisture retrieval over vegetated areas. IEEE Trans. Geosci. Remote Sens. 2006, 44, 925–935. [Google Scholar] [CrossRef]
- Lee, J.H.; Ahn, C.K. Stochastic relaxation of nonlinear soil moisture ocean salinity (SMOS) soil moisture retrieval errors with maximal Lyapunov exponent optimization. Nonlinear Dyn. 2019, 95, 653–667. [Google Scholar] [CrossRef]
- Lee, J.H. Using Ranked Probability Skill Score (RPSS) as Nonlocal Root-Mean-Square Errors (RMSEs) for Mitigating Wet Bias of Soil Moisture Ocean Salinity (SMOS) Soil Moisture. Photogramm. Eng. Remote Sens. 2020, 86, 91–98. [Google Scholar] [CrossRef]
- Reichle, R.H.; Koster, R.D. Bias reduction in short records of satellite soil moisture. Geophys. Res. Lett. 2004, 31, L19501. [Google Scholar] [CrossRef] [Green Version]
- Chen, F.; Crow, W.T.; Bindlish, R.; Colliander, A.; Burgin, M.S.; Asanuma, J.; Aida, K. Global-scale evaluation of SMAP, SMOS and ASCAT soil moisture products using triple collocation. Remote Sens. Environ. 2018, 214, 1–13. [Google Scholar] [CrossRef]
- Lee, H.J.; Im, J. A Novel Bias Correction Method for Soil Moisture and Ocean Salinity (SMOS) Soil Moisture: Retrieval Ensembles. Remote Sens. 2015, 7, 5824. [Google Scholar] [CrossRef] [Green Version]
- DeBeer, C.M.; Wheater, H.S.; Pomeroy, J.W.; Barr, A.G.; Baltzer, J.L.; Johnstone, J.F.; Turetsky, M.R.; Stewart, R.E.; Hayashi, M.; van der Kamp, G.; et al. Summary and synthesis of Changing Cold Regions Network (CCRN) research in the interior of western Canada—Part 2: Future change in cryosphere, vegetation, and hydrology. Hydrol. Earth Syst. Sci. 2021, 25, 1849–1882. [Google Scholar] [CrossRef]
- Magagi, R.; Berg, A.A.; Goita, K.; Belair, S.; Jackson, T.J.; Toth, B.; Walker, A.; McNairn, H.; Neill, P.E.O.; Moghaddam, M.; et al. Canadian Experiment for Soil Moisture in 2010 (CanEx-SM10): Overview and Preliminary Results. IEEE Trans. Geosci. Remote Sens. 2013, 51, 347–363. [Google Scholar] [CrossRef] [Green Version]
- Tetlock, E.; Toth, B.; Berg, A.; Rowlandson, T.; Ambadan, J.T. An 11-year (2007–2017) soil moisture and precipitation dataset from the Kenaston Network in the Brightwater Creek basin, Saskatchewan, Canada. ESSD 2019, 11, 787–796. [Google Scholar] [CrossRef] [Green Version]
- Shook, K.; Papalexiou, S.; Pomeroy, J.W. Quantifying the effects of Prairie depressional storage complexes on drainage basin connectivity. J. Hydrol. 2021, 593, 125846. [Google Scholar] [CrossRef]
- Myneni, R.; Knyazikhin, Y.; Park, T. MCD15A2H MODIS/Terra+Aqua Leaf Area Index/FPAR 8-day L4 Global 500m SIN Grid V006; United States Geological Survey: Reston, VA, USA, 2015.
- Laur, H.; Bally, P.; Meadows, P.; Sanchez, J.; Schaettler, B.; Lopinto, E.; Esteban, D. Derivation of the backscattering coefficient in ESA ERS SAR PRI products. In ESA Document No. ES-TN-RS-PM-HL09; Revision 5f; European Space Agency: Paris, France, 2004. [Google Scholar]
- Al-Zuhairi, M.; Nahhas, F.; Hussein, F.; Pradhan, B.; Shariff, R. A refined classification approach by integrating Landsat Operational Land Imager (OLI) and RADARSAT-2 imagery for land-use and land-cover mapping in a tropical area. Int. J. Remote Sens. 2016, 37, 2358–2375. [Google Scholar] [CrossRef]
- Weeks, R.; Smith, M.; Pak, K.; Gillespie, A. Inversions of SIR-C and AIRSAR data for the roughness of geological surfaces. Remote Sens. Environ. 1997, 59, 383–396. [Google Scholar] [CrossRef]
- Ulaby, F.; Moore, R.; Fung, A. Microwave Remote Sensing: Active and Passive. Volume 2-Radar Remote Sensing and Surface Scattering and Emission Theory; Artech House: London, UK, 1982. [Google Scholar]
- Chen, K.S.; Tzong-Dar, W.; Leung, T.; Qin, L.; Jiancheng, S.; Fung, A.K. Emission of rough surfaces calculated by the integral equation method with comparison to three-dimensional moment method simulations. IEEE Trans. Geosci. Remote Sens. 2003, 41, 90–101. [Google Scholar] [CrossRef]
- Davidson, M.W.J.; Thuy Le, T.; Mattia, F.; Satalino, G.; Manninen, T.; Borgeaud, M. On the characterization of agricultural soil roughness for radar remote sensing studies. IEEE Trans. Geosci. Remote Sens. 2000, 38, 630–640. [Google Scholar] [CrossRef] [Green Version]
- Fung, A.K. Microwave Scattering and Emission Models and Their Applications; Artech House: Norwood, MA, USA, 1994. [Google Scholar]
- Hallikainen, M.T.; Ulaby, F.T.; Dobson, M.C.; El-Rayes, M.A.; Wu, L. Microwave Dielectric Behavior of Wet Soil-Part 1: Empirical Models and Experimental Observations. IEEE Trans. Geosci. Remote Sens. 1985, GE-23, 25–34. [Google Scholar] [CrossRef]
- Das, N.; Entekhabi, D.; Dunbar, R.S.; Kim, S.; Yueh, S.; Colliander, A.; O’Neill, P.E.; Jackson, T.; Jagdhuber, T.; Chen, F.; et al. SMAP/Sentinel-1 L2 Radiometer/Radar 30-Second Scene 3 km EASE-Grid Soil Moisture, Version 3; NASA: Washington, DC, USA, 2020. [CrossRef]
- de Jeu, R.A.M.; Wagner, W.; Holmes, T.R.H.; Dolman, A.J.; van de Giesen, N.C.; Friesen, J. Global Soil Moisture Patterns Observed by Space Borne Microwave Radiometers and Scatterometers. Surv. Geophys. 2008, 29, 399–420. [Google Scholar] [CrossRef] [Green Version]
- Dorigo, W.A.; Scipal, K.; Parinussa, R.M.; Liu, Y.Y.; Wagner, W.; de Jeu, R.A.M.; Naeimi, V. Error characterisation of global active and passive microwave soil moisture datasets. Hydrol. Earth Syst. Sci. 2010, 14, 2605–2616. [Google Scholar] [CrossRef] [Green Version]
- Parinussa, R.M.; Meesters, A.G.C.A.; Liu, Y.Y.; Dorigo, W.; Wagner, W.; Jeu, R.A.M.d. Error Estimates for Near-Real-Time Satellite Soil Moisture as Derived From the Land Parameter Retrieval Model. IEEE Geosci. Remote Sens. Lett. 2011, 8, 779–783. [Google Scholar] [CrossRef]
- Zwieback, S.; Colliander, A.; Cosh, M.H.; Martínez-Fernández, J.; McNairn, H.; Starks, P.J.; Thibeault, M.; Berg, A. Estimating time-dependent vegetation biases in the SMAP soil moisture product. Hydrol. Earth Syst. Sci. 2018, 22, 4473–4489. [Google Scholar] [CrossRef] [Green Version]
- Fan, X.; Liu, Y.; Gan, G.; Wu, G. SMAP underestimates soil moisture in vegetation-disturbed areas primarily as a result of biased surface temperature data. Remote Sens. Environ. 2020, 247, 111914. [Google Scholar] [CrossRef]
- Wadsworth, E.; Champagne, C.; Berg, A.A. Evaluating the utility of remotely sensed soil moisture for the characterization of runoff response over Canadian watersheds. Can. Water Resour. J./Rev. Can. Des Ressour. Hydr. 2020, 45, 77–89. [Google Scholar] [CrossRef]
- Álvarez-Mozos, J.; Casalí, J.; González-Audícana, M.; Verhoest, N.E.C. Correlation between Ground Measured Soil Moisture and RADARSAT-1 derived Backscattering Coefficient over an Agricultural Catchment of Navarre (North of Spain). Biosyst. Eng. 2005, 92, 119–133. [Google Scholar] [CrossRef]


| Station ID | Latitude (Degree) | Longitude (Degree) | Radarsat-2 Soil Moisture | SMAP Soil Moisture | ||||||
|---|---|---|---|---|---|---|---|---|---|---|
| RMSE (m3/m3) | Bias (m3/m3) | ub RMSE (m3/m3) | Retrieval Mean (m3/m3) (Field Measurements) | RMSE (m3/m3) | Bias (m3/m3) | ub RMSE (m3/m3) | Retrieval Mean (m3/m3) | |||
| 2701015 | 51.3577 | −106.573 | 0.06 | 0.05 | 0.04 | 0.26 (0.20) | 0.15 | −0.14 | 0.03 | 0.06 |
| 2701023 | 51.3679 | −106.449 | 0.07 | 0.01 | 0.07 | 0.29 (0.25) | 0.16 | −0.14 | 0.07 | 0.13 |
| 2701026 | 51.3727 | −106.425 | 0.09 | −0.03 | 0.08 | 0.28 (0.28) | 0.22 | −0.21 | 0.08 | 0.10 |
| 2701032 | 51.3904 | −106.426 | 0.06 | 0.03 | 0.05 | 0.25 (0.19) | 0.11 | −0.04 | 0.10 | 0.17 |
| 2701037 | 51.4262 | −106.426 | 0.07 | 0.02 | 0.06 | 0.28 (0.22) | 0.16 | −0.13 | 0.09 | 0.11 |
| 2701042 | 51.437 | −106.426 | 0.06 | 0.05 | 0.04 | 0.28 (0.22) | 0.13 | −0.12 | 0.07 | 0.11 |
| 2701044 | 51.4416 | −106.426 | 0.06 | 0.01 | 0.05 | 0.29 (0.28) | 0.18 | −0.18 | 0.04 | 0.10 |
| DoY | Radarsat-2 | SMAP | ||
|---|---|---|---|---|
| Backscattering Coefficient (dB) | Soil Moisture (m3/m3) | Brightness Temperature (K) | Soil Moisture (m3/m3) | |
| 156 | −11.5283 | 0.2758 | 261.1109 | 0.1390 |
| 190 | −13.6557 | 0.3030 | 272.9279 | 0.1247 |
Disclaimer/Publisher’s Note: The statements, opinions and data contained in all publications are solely those of the individual author(s) and contributor(s) and not of MDPI and/or the editor(s). MDPI and/or the editor(s) disclaim responsibility for any injury to people or property resulting from any ideas, methods, instructions or products referred to in the content. |
© 2023 by the authors. Licensee MDPI, Basel, Switzerland. This article is an open access article distributed under the terms and conditions of the Creative Commons Attribution (CC BY) license (https://creativecommons.org/licenses/by/4.0/).
Share and Cite
Lee, J.H.; Lindenschmidt, K.-E. Bias-Corrected RADARSAT-2 Soil Moisture Dynamics Reveal Discharge Hysteresis at An Agricultural Watershed. Remote Sens. 2023, 15, 2677. https://doi.org/10.3390/rs15102677
Lee JH, Lindenschmidt K-E. Bias-Corrected RADARSAT-2 Soil Moisture Dynamics Reveal Discharge Hysteresis at An Agricultural Watershed. Remote Sensing. 2023; 15(10):2677. https://doi.org/10.3390/rs15102677
Chicago/Turabian StyleLee, Ju Hyoung, and Karl-Erich Lindenschmidt. 2023. "Bias-Corrected RADARSAT-2 Soil Moisture Dynamics Reveal Discharge Hysteresis at An Agricultural Watershed" Remote Sensing 15, no. 10: 2677. https://doi.org/10.3390/rs15102677