Article

Accelerated Restoration of Vegetation in Wuwei in the Arid Region of Northwestern China since 2000 Driven by the Interaction between Climate and Human Beings

1
College of Urban Construction, Lanzhou City University, Lanzhou 730070, China
2
College of Geography and Environmental Science, Northwest Normal University, Lanzhou 730000, China
*
Author to whom correspondence should be addressed.
Remote Sens. 2023, 15(10), 2675; https://doi.org/10.3390/rs15102675
Submission received: 25 March 2023 / Revised: 15 May 2023 / Accepted: 17 May 2023 / Published: 21 May 2023

Abstract

:
The Wuwei area in the arid region of northwestern China is impacted by the harsh natural environment and human activities, and the problem of ecological degradation is severe there. In order to ensure the sustainable development of the regional social economy, it is necessary to monitor the changes in vegetation in Wuwei and its corresponding nonlinear relationships with climate change and human activities. In this study, the inter-annual and spatial–temporal evolution characteristics of vegetation in Wuwei from 1982 to 2015 have been analyzed based on non-parametric statistical methods. The analysis revealed that the areas of vegetation restoration and degradation accounted for 77 and 23% of the total area of the research area, respectively. From 1982 to 1999, vegetation degradation became extremely serious (14.4%) and was primarily concentrated in Gulang County and the high-altitude areas in the southwest. Since the ecological restoration project was implemented in 2000, there have been prominent results in vegetation restoration. The geographically and temporally weighted regression model shows that each climate factor has contributed to the vegetation restoration in the Wuwei area during the last 34 years, with their contributions ranked as precipitation (71.2%), PET (43.9%), solar radiation (34.8%), temperature (33.1%), and wind speed (31%). An analysis of the land-use data with 30 m resolution performed in this study revealed that the conversion area among land cover from 1985 to 2015 accounts for 14.9% of the total area. In it, the conversion area from non-ecological land to ecological land accounts for 5.7% of the total area. The farmland, grassland, and woodland areas have increased by 20.1, 20.6, and 8.5%, respectively, indicating that human activities such as agricultural intensification and ecological restoration projects have played a crucial role in vegetation restoration.

1. Introduction

Vegetation in arid areas is an important participator in carbon cycling, climate change, and energy exchange [1,2,3,4], providing multiple ecosystem services and core human well-being [5]. Since the end of the 20th century, with methods of model simulation and field observation, many studies have found that vegetation in most areas worldwide has significantly turned green [6,7,8], and that a series of human management measures (agricultural intensification and ecological restoration projects) have increased vegetation coverage and terrestrial carbon sinks [8,9]. At the same time, other human activities, such as farmland expansion, urbanization, and land abandonment, have led to the alternating emergence of vegetation greening and browning, thus increasing the uncertainty of vegetation and ecosystem structure changes [9,10,11,12]. Vegetation change is primarily affected by the “fertilization effect” of atmospheric CO2, climate change, nitrogen deposition, and land-use change [6,9,13,14]. Vegetation in arid areas coupling humans and land is more vulnerable to climate and land-use changes. Therefore, clarifying the interactive effects of climate change and human activity on the changing trend of vegetation is an important challenge for scholars and decision makers to explore the stability of fragile ecosystems in arid areas [4,15]. In most areas of northwestern China, significant abrupt changes in vegetation growth trends were observed since 1999 [11,16]. These changes primarily resulted from the implementation of the ecological restoration project. A model-based prediction shows that droughts caused by continued warming will occur more frequently in this century, leading to the increased limitation on vegetation growth due to a lack of moisture in arid areas [8,17,18]. It provides a potential platform for identifying the spatial–temporal changes in vegetation growth trends and the interaction between vegetation dynamics and climate change. Thus, long-term monitoring of the spatial–temporal evolution of system structure and functions of dry land is an imperative research hotspot.
Previous studies primarily explored the responding mechanism of vegetation growth trends to driving factors assuming a steady state of the vegetation trend change [19,20]. However, the vegetation trend change is a nonlinear and non-stationary process, which will change with time [8,21]. Research has revealed that with an increase in CO2 concentration and continuous warming of global temperature during recent years, the large-scale greening of vegetation has stagnated or even reversed to browning [8]. A lot of research has established correlations between NDVI and major climate factors (precipitation, temperature, and radiation) to investigate the vegetation changes on the global and regional scales, especially in arid and semi-arid areas [22,23,24,25]. However, few studies have taken into account the influences of wind speed and potential evapotranspiration on vegetation trends. In fact, for drylands where ground surface evapotranspiration is greater than precipitation, the introduction of this variable is conducive to the attribution analysis of vegetation inter-annual changes.
Furthermore, the spatial heterogeneity of ground surface, the complexity of influencing processes, and the diversity of influencing factors result in the differences and uncertainties of vegetation responses in different areas to climate change [18,26,27]. Therefore, the attribution analysis methods based on linear assumptions may overlook its intrinsic trend changes and driving factors. Due to the strong interactions between natural and human activities, there is a nonlinear response relationship between vegetation and driving factors [21,28]. Linear attribution methods cannot quantify the relative importance of different climate elements and human activities on the vegetation trend change. Thus, their influences could be overestimated or underestimated [8,21,29]. At present, scholars mainly apply correlation analysis, multiple regression, GeoDetector, and GWR methods in performing their attribution analyses. Traditional regression models have the underlying assumption that geographic variables are linear and homogeneous and neglect the characteristics of spatial–temporal non-stationarity of environmental elements [30,31]. GeoDetector is a statistical method that primarily explores spatial heterogeneity [27]. It can be used to characterize the interactions of each factor and multiple factors and the features of strength, direction, and linearity or non-linearity of such interactions [27]. GWR can reflect the non-stationary spatial relationship through latitude and longitude. It is a method that measures the proximity relationships of geographic locations with spatial distances based on the local-weighting theory [32,33]. Therefore, it is necessary to disclose the nonlinear response relationships of vegetation trends with climate change and human activities and their relative importance. The geographical and temporal weighted regression model (GTWR) coupling both temporal and spatial factors is an extended geographical weighted regression model (GWR). With the integration of spatial heterogeneity and temporal non-stationarity into the response system of vegetation and climate change, GTWR can more effectively estimate the factor parameters [30]. It can not only complete the processing of spatial influencing factors but also more completely analyze the spatial–temporal variation mechanism of influencing factors on vegetation trend change. Especially in the era of more coordinated and integrated regional development, GTWR is more helpful for decision makers to perform differentiated ecological protection and sustainable development management.
Wuwei, located in the arid region of northwestern China, is the only oasis that separates the Badain Jaran Desert and the Tengger Desert and is a critical zone carrying regional human socioeconomic activities. Restricted by a harsh natural environment, the Wuwei area suffers from severe ecological and environmental problems, such as land desertification, soil erosion, vegetation browning, soil degradation, and reserve evolution. Furthermore, the influences of socioeconomic activities, including urbanization expansion, population explosion, and agricultural production activities in Wuwei City during recent years on vegetation cannot be neglected [11,29,34]. Government policymakers and scholars started to focus on ecological restoration issues. They drew on the wisdom of the masses and were determined to change those adverse situations. Then, the grassland ecological restoration and treatment projects have been continuously carried out, and the grassland grazing prohibition and grass–livestock balance system have been fully implemented. In addition, a series of wind erosion prevention, sand dune control, and afforestation measures have been employed. Meanwhile, the layout of “protecting water sources in the south, securing oasis in the middle, and addressing wind and sand in the north” will be optimized. However, under the trend of more frequent droughts caused by continuous warming in the future, the vegetation restoration status under a series of comprehensive treatment measures and its nonlinear response relationship with climate change and human activities are yet to be disclosed.
In this paper, Wuwei, the most ecologically fragile area in the northwestern arid region, was selected as the research object to explore the nonlinear variation characteristics of the spatial–temporal evolution of vegetation trends and its response relationship with climate change and human driving factors. In this study, a comparative analysis has been further performed on the spatial–temporal pattern evolution of vegetation trends in Wuwei during the period of 1982–2015 and before and after the ecological restoration project implemented in 2000. This research aims to understand the characteristics and driving factors of vegetation restoration in ecologically fragile areas and provide scientific evidence for ecological restoration and protection under the background of climate change and increasing human activities. Figure 1 shows the data processing andanalysis procedures in this study. The main content of this research includes: (1) exploring the spatial–temporal nonlinear variation characteristics of vegetation trend in the Wuwei area during the three periods of 1982–2015, 1982–1999, and 2000–2015; (2) clarifying the nonlinear response relationship between climate change and vegetation trend; and (3) quantifying the influences of human activities on vegetation restoration based on 30 m high-resolution land-use data.

2. Materials and Methods

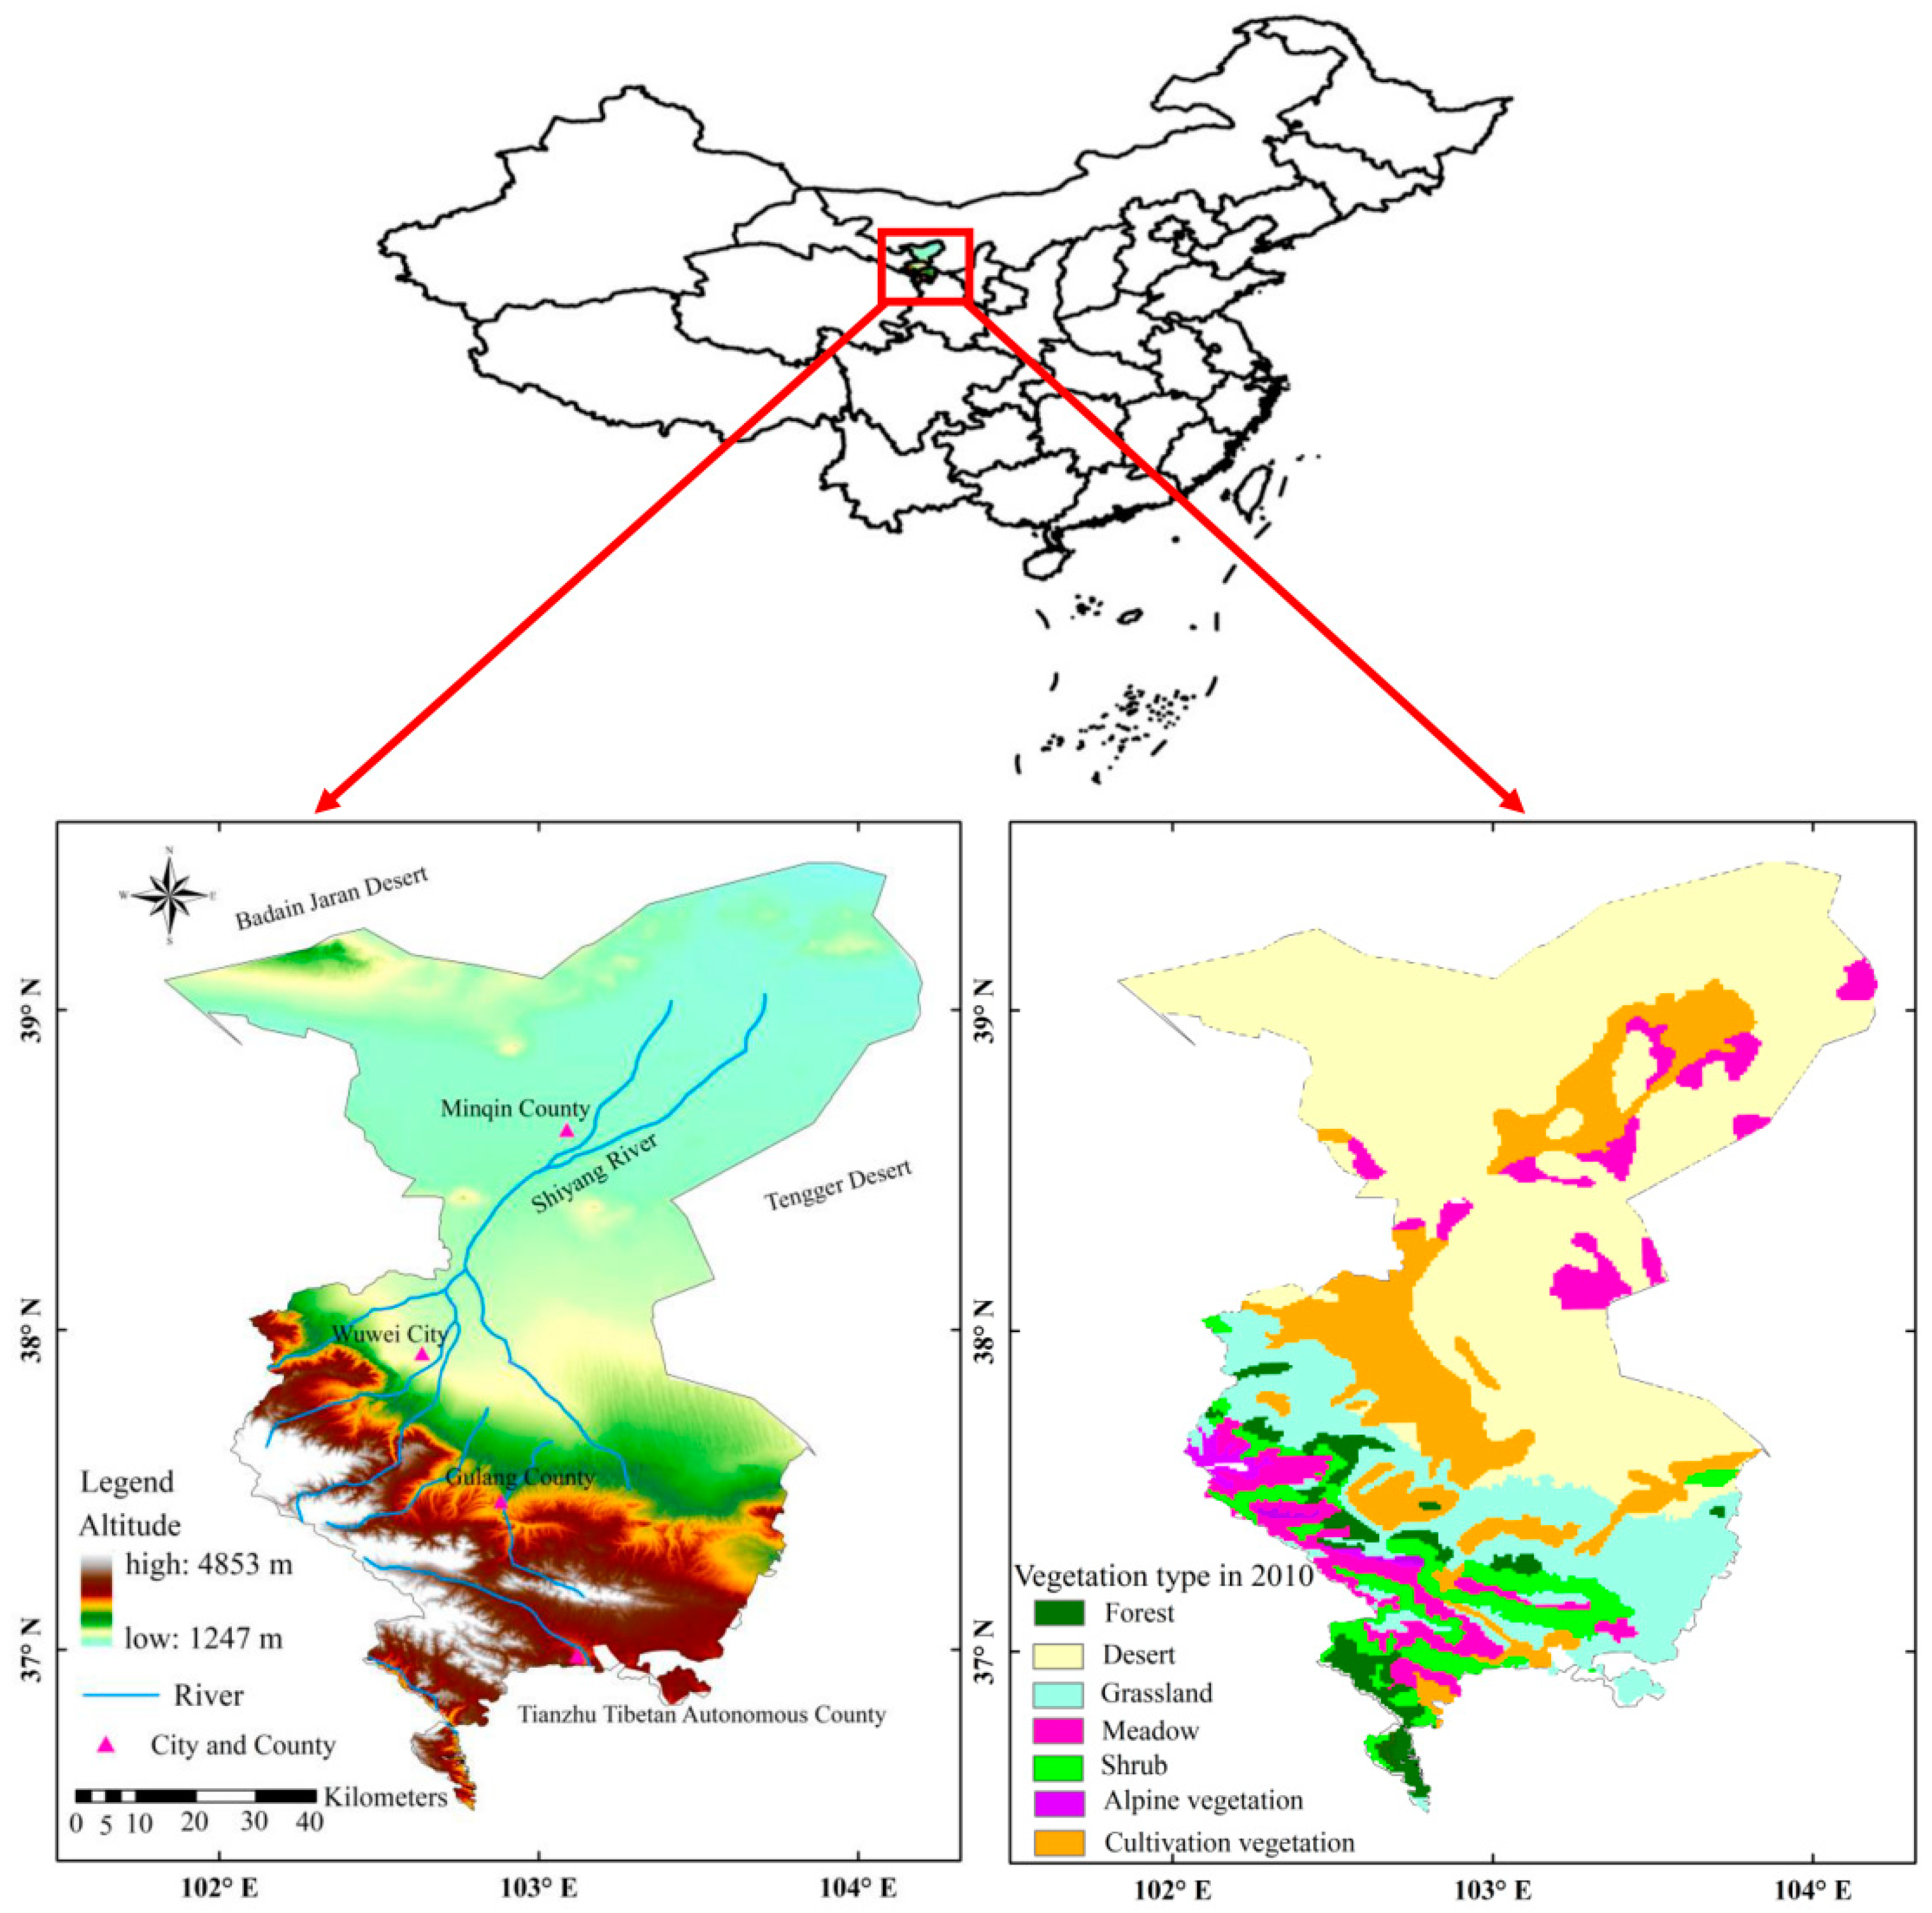
2.1. Overview of the Research Area

The name Wuwei (36°29′–39°27′N, 101°49′–104°16′E) originates from the words “Military might and accomplishments,” coined by the ambitious Emperor Wu of the Han Dynasty to demonstrate the military power of his Han Empire. In ancient times, Wuwei was also called “Liangzhou” and was a hub of the famous Silk Road in history. As the “eastern gate” of Hexi, Wuwei has been Hexi’s political, economic, and cultural center and its “provincial capital” for centuries. Wuwei is a unique city of humanity and ecology. In the south of Wuwei, there are the Qilian Mountains, and in the middle, there is the corridor plain. The ice and snow meltwater from the Qilian Mountains flows into the Shiyang River and others that traverse Wuwei, irrigating the oasis farmland alongside these rivers. In the north, Wuwei borders the Tengger Desert, forming desert landscapes. Altitudes gradually decrease from south to north, with elevations ranging from 1247 to 4853 m (Figure 2). The average annual precipitation in Wuwei is 295.2 mm, with an average annual temperature of 6.3 °C, sunshine duration of about 2200–30,320 h, and total annual radiation amount of about 3234–3975 MJ/m2. The potential evapotranspiration in the north is relatively large. Against the backdrop of population explosion, urbanization expansion, and accelerated desertification, the mismatch between water supply and demand has been intensified, and the ecological environment has been seriously degraded.

2.2. Data Sources and Processing

2.2.1. NDVI Dataset

The GIMMS 3g NDVI dataset with a time resolution of 15 days comes from the NASA Earth Exchange platform (http://ecocast.arc.nasa.gov/data/pub/gimms/3g.v1/, accessed on 1 January 2020). In order to remove the influences of atmospheric conditions, residual clouds, and aerosol scattering on the NDVI data [35], in this study, the GIMMS 3g NDVI data with a time interval of 15 days have been integrated into monthly NDVImax data through the method of Maximum Value Composites (MVC). The monthly GIMMS 3g NDVI dataset was further integrated into a growing season (from April to October, according to the definition) NDVI dataset through the MVC method. Meanwhile, NDVI image elements with an annual mean value higher than 0.1 in the NDVImax data of the research area from 1982 to 2015 were extracted to represent vegetated areas for later analysis. The annual mean value lower than 0.1 in the NDVImax data of the research area from 1982 to 2015 was defined as a non-vegetation area. In order to be consistent with the spatial–temporal resolution of the meteorological dataset, in this study, resampling was performed on the GIMMS NDVI dataset with a spatial resolution of 500 m under the ArcGIS 10.3 environment.

2.2.2. Climate Dataset

The 1982–2015 time-series precipitation (PRE) and temperature (TEM) interpolation datasets were provided by the Resource and Environmental Science Data Center (RESDC) of the Chinese Academy of Sciences (http://www.resdc.cn, accessed on 1 June 2020). These datasets with a spatial resolution of 0.1° were obtained through interpolation with the Australian ANUSPLIN software [36]. The influences of elevation and latitude significantly correlated with precipitation and temperature in the meteorological elements. The elevation and latitude have been considered during the analysis and interpolation processes of the ANUSPLIN software, which is based on the thin disk spline function principle. Especially, it has a very good ability to describe the zonal distribution characteristics of meteorological elements. Thus, compared with other interpolation methods, this method can generate more accurate interpolation results. With the ANUSPLIN4.3 software, interpolation processes were applied to those meteorological data passing the quality control, with point data converted into surface data. In this study, the cumulative precipitation was used for calculating the growing-season precipitation, and daily temperatures were used for calculating the average growing-season temperature. The wind speed (Wind) and total solar radiation (RAD) datasets came from the China meteorological forcing dataset (http://westdc.westgis.ac.cn, accessed on 1 June 2020). A spatial resolution of 0.1° and a temporal resolution of 3 h were applied to these datasets. The total solar radiation dataset was generated from the downward shortwave and downward longwave radiation datasets, which were obtained by integrating the Global Land Data Assimilation System (GLDAS) and Global Energy and Water Cycle Experiments-Surface Radiation Budget (GEWEX-SRB) radiation dataset with the meteorological station data [37]. The daily dataset of potential evapotranspiration (PET) uses the Penman–Monteith formula recommended by the World Food and Agriculture Organization (FAO). Based on the daily maximum temperature, daily minimum temperature, solar radiation, daily mean relative humidity, and average wind speed of each meteorological station to calculate PET. In this paper, the daily data set of potential evapotranspiration was integrated into the growing season potential evapotranspiration dataset from 1982 to 2015, and the spatial interpolation of potential evapotranspiration data in the growing season in the Wuwei region was carried out by inverse distance weighting (IDW) to obtain raster data with a spatial resolution of 500 m. All the above climate data sets were resampled to a spatial resolution of 500 m to detect the important climate-driving forces causing vegetation trend changes.

2.2.3. Other Auxiliary Data
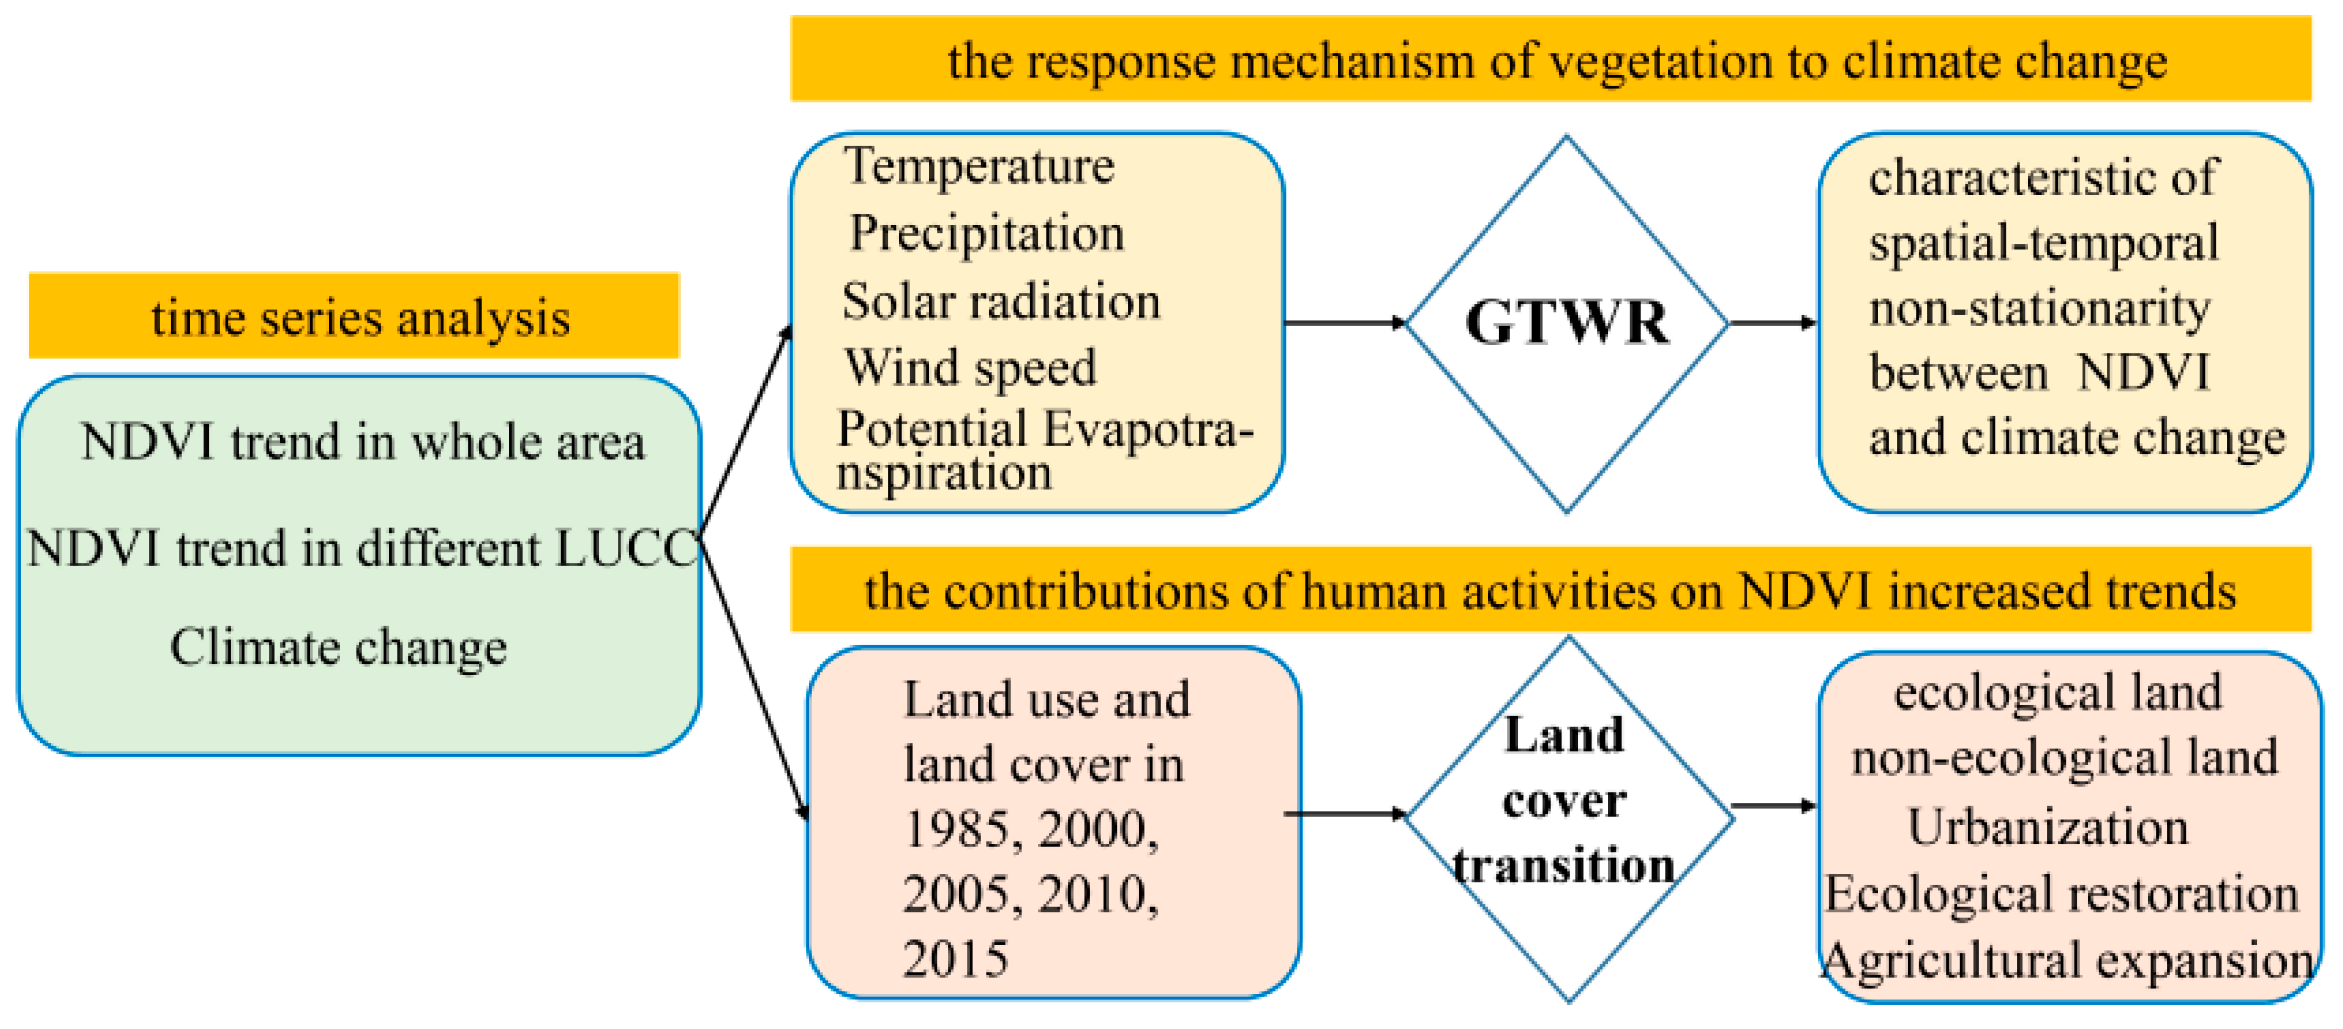
The Digital Elevation Model (DEM) dataset with a spatial resolution of 30 m was provided by the international science and technology data image-mirror website (http://www.gscloud.cn, accessed on 1 July 2020) of the Computer Network Information Center of the Chinese Academy of Sciences. In this study, land-use and land-cover changes (LULC) with a spatial resolution of 30 m in 1985 and 2015 were used to explore the changes in land use. These land-use data were based on the Landsat-derived annual China land-cover dataset obtained from the Google Earth Engine (GEE) platform [38].

2.3. Methods

2.3.1. Trend Analysis

In this study, the NDVI spatial–temporal evolution trend has been assessed through the combination of Theil–Sen median trend analysis and Mann–Kendall test methods. The Theil–Sen median trend analysis method does not require data to follow a normal distribution and is robust to data errors [39]. Thus, this method has been widely used to explore vegetation’s long time-series trend evolution processes as a robust non-parametric trend statistical method [37,40]. The Mann–Kendall test was employed to judge the significance of Sen’s slope [39]. This method does not require samples to follow a particular distribution, nor is it disturbed by a few abnormal values. With the combination of ρ and |Z| values obtained through the Theil–Sen method, the change trends of NDVI can be divided into the following six classes: non-significant increase (slight increase) (ρ ≥ 0, |Z| ≤ 1.96); significant increase under a confidence level of 0.05 (ρ ≥ 0, |Z| > 1.96); highly significant increase under a confidence level of 0.01 (ρ ≥ 0, |Z| > 2.58); highly significant decrease under a confidence level of 0.01 (ρ < 0, |Z| > 2.58); significant decrease under a confidence level of 0.05 (ρ < 0, |Z| > 1.96); and non-significant decrease (slight decrease) (ρ < 0, |Z| ≤ 1.96).

2.3.2. GTWR

In order to better resolve the spatial–temporal non-stationarity and heterogeneity problems in exploring how climate change affects vegetation trends, a GTWR method that introduces the time dimension has been applied in this paper. With this GTWR method, not only the spatial heterogeneity and temporal non-stationarity have been introduced in the analysis of the response relationship between vegetation and climate change, but also the spatial–temporal non-stationarity characteristics of vegetation trend have been taken into account in this study. In addition, a more effective multi-variable investigation has been conducted on the effects of climate change on vegetation trends. The GTWR method calculates the spatial–temporal weighting matrix by coupling temporal information and spatial locations. Huang et al. (2010) have introduced more details on the method implementation and parameters of GTWR [30]. In this study, 400 vector points in the research area were randomly selected using the Create Random Points tool on the rcGIS environment, with the meteorological elements and NDVI inter-annual component data values from 1982 through 2015 of each point extracted. First, based on a correlation analysis, the meteorological elements significantly correlated with NDVI were selected in this study. Then, the variance inflation factor (VIF) of each meteorological variable selected was calculated with the ordinary least squares regression model to judge the collinear feature of each variable. A VIF higher than 7.5 indicates that there exist redundancy and multi-collinearities among the explanatory variables, while a VIF lower than 7.5 indicates that variables are independent of each other [30,35]. The meteorological elements (precipitation, temperature, solar radiation, average wind speed, and PET) selected in this study all have a VIF lower than 7.5. Thus, these variables will be incorporated into the GTWR model.
In this study, the following structure was used in the model algorithm:
N D V I i = β 0 ( u i , v i , t i ) + β 1 ( u i , v i , t i ) × P R E i + β 2 ( u i , v i , t i ) × T E M i + β 3 ( u i , v i , t i ) × R A D i + β 4 ( u i , v i , t i ) × W I N i + β 5 ( u i , v i , t i ) × P E T i + ε i
where NDVIi represents the growing-season NDVI value of the i image element in the year ti; ( u i , v i , t i ) is the spatial–temporal coordinate of the I image element; β 0 ( u i , v i , t i ) is the constant term of the i image element in the GTWR model; β 1 ( u i , v i , t i ) , β 2 ( u i , v i , t i ) , β 3 ( u i , v i , t i ) , β 4 ( u i , v i , t i ) , and β 5 ( u i , v i , t i ) are the coefficients of precipitation, temperature, solar radiation, wind speed, and potential evapotranspiration of the image element ( u i , v i ) in the year (ti), respectively; and ε i represents the error term. The following structure was used to estimate each variable (k) and spatial–temporal location (i):
β u i , v i , t i = X T W u i , v i , t i X 1 X T W u i , v i , t i Y
where W u i , v i , t i = d i a g ( α i 1 , α i 2 , , α i n ) is the spatial–temporal weight matrix. In this study, the currently widely-used Gaussian distance decay function was combined with the spatial–temporal distance method proposed by Huang et al. (2010) [30] to measure the spatial–temporal weights W.
The core of GTWR is the selection of weight function and bandwidth. The Gaussian function was selected in this study as the spatial–temporal weight matrix function, and a 10-fold Cross Validation (CV) was performed to locate the optimal bandwidth. In this study, the model performance was evaluated with the model goodness of fit (R2), root mean square error (RMSE), and Akaichi Information Criteria (AICc). T-tests with significance levels of 0.05 (significant) and 0.01 (highly significant) were applied to examine the significance of climate variables and vegetation response coefficients.

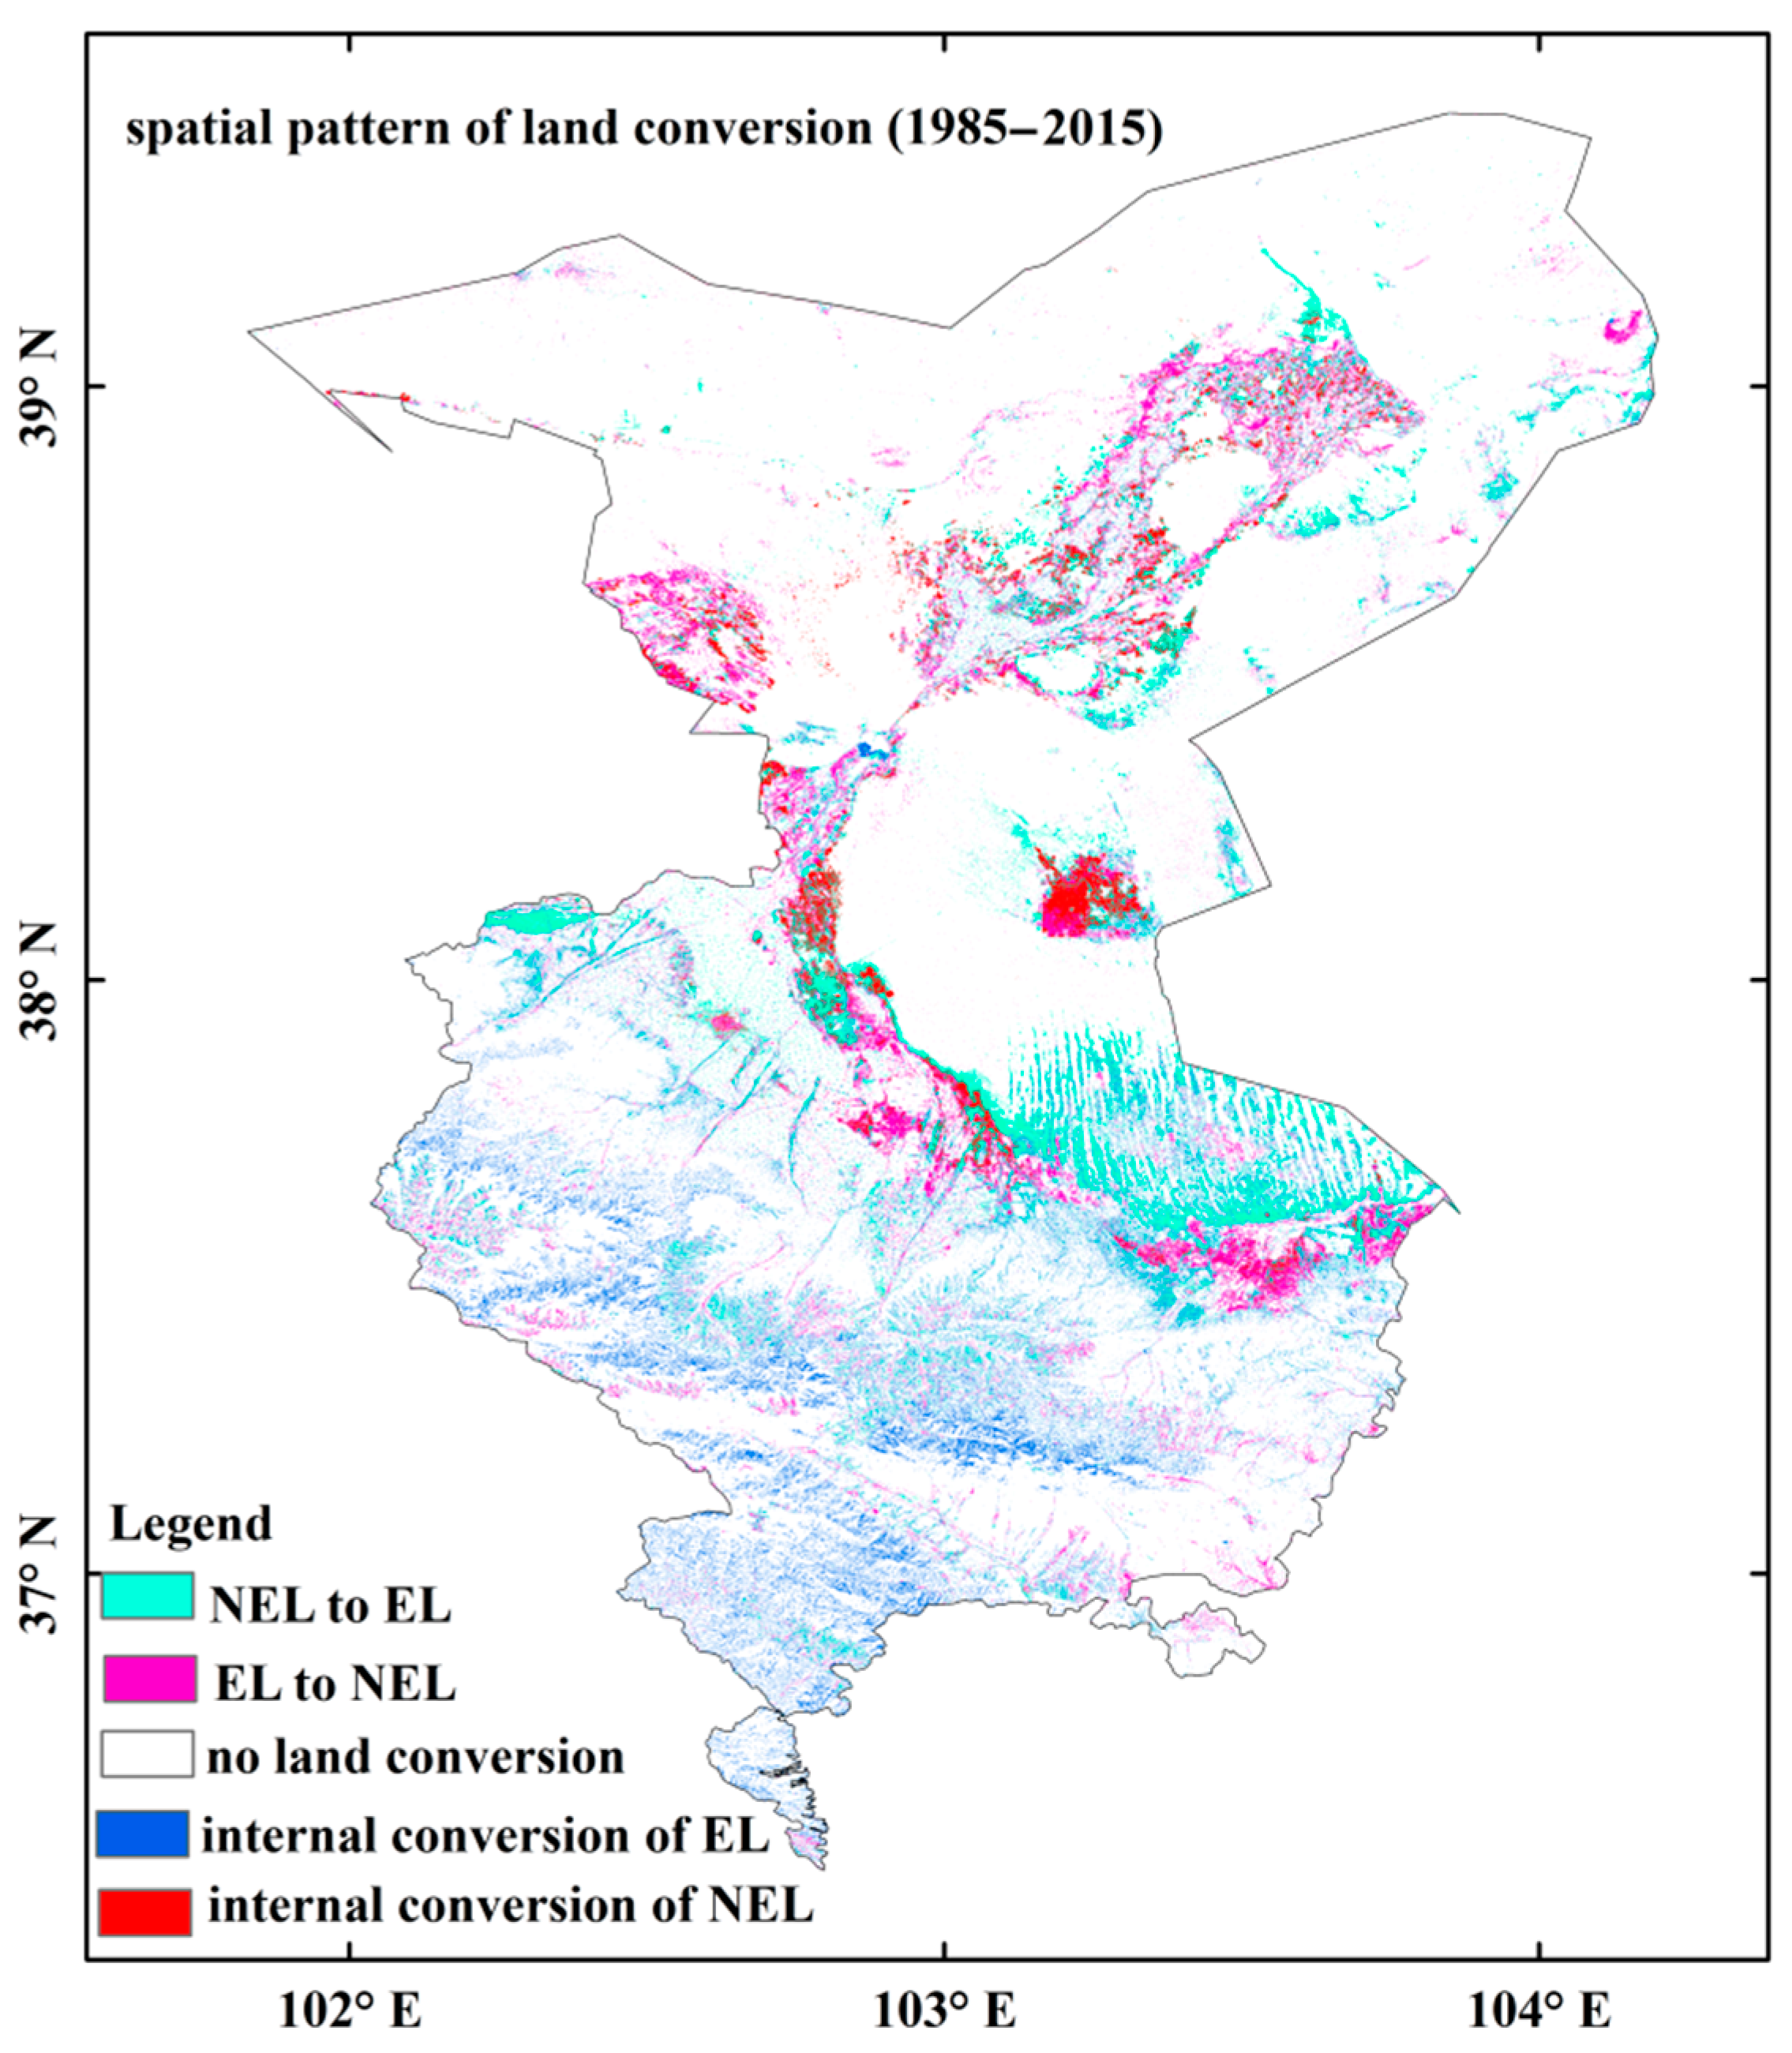
2.3.3. Land-Cover Transition

Different types of land use and land cover (LULC) usually have different levels of ecological functions (Table 1). A land-use transition matrix was used in this study to determine the amount and direction of the land-cover transition. Based on the LULC vector data with a spatial resolution of 30 m, internal LULC transition in the region in 1985 and 2015 was measured. The transitional matrix, wherein the rows (columns) mean the LULC categorical transition of land-use areas of 1985 (2015); the on-diagonal entries display a persistence of categories. The loss column and the gain row indicate the gross loss and gross gain by category in each land type during the period of 1985–2015, respectively. In order to quantitatively and conveniently characterize the ecological and environmental changes associated with land-use and land-cover changes, based on the research conducted by Shao et al. (2010) and Li et al. (2017) [41,42], the land was classified as ecological land and non-ecological land according to the ecosystem service functions of each land-cover type. We defined forest, shrub, grassland, water (includes permanently or temporarily flooded surfaces), snow/ice (surfaces permanently covered by snow throughout the summer), and wetland as ecological land (EL), and barren (dune and rocky areas without vegetation or fertile soil), impervious (includes urban, rural, and construction areas), and cropland as non-ecological land (NEL) (Table 1). The other land types in 1985 were converted to impervious land in 2015 and were defined as urbanization pixels. The conversion of other land types in 1985 to ecological land types in 2015 was defined as an ecological restoration pixel, and the conversion of other land types to farmland from 1985 to 2015 was defined as an agricultural expansion pixel.

3. Results

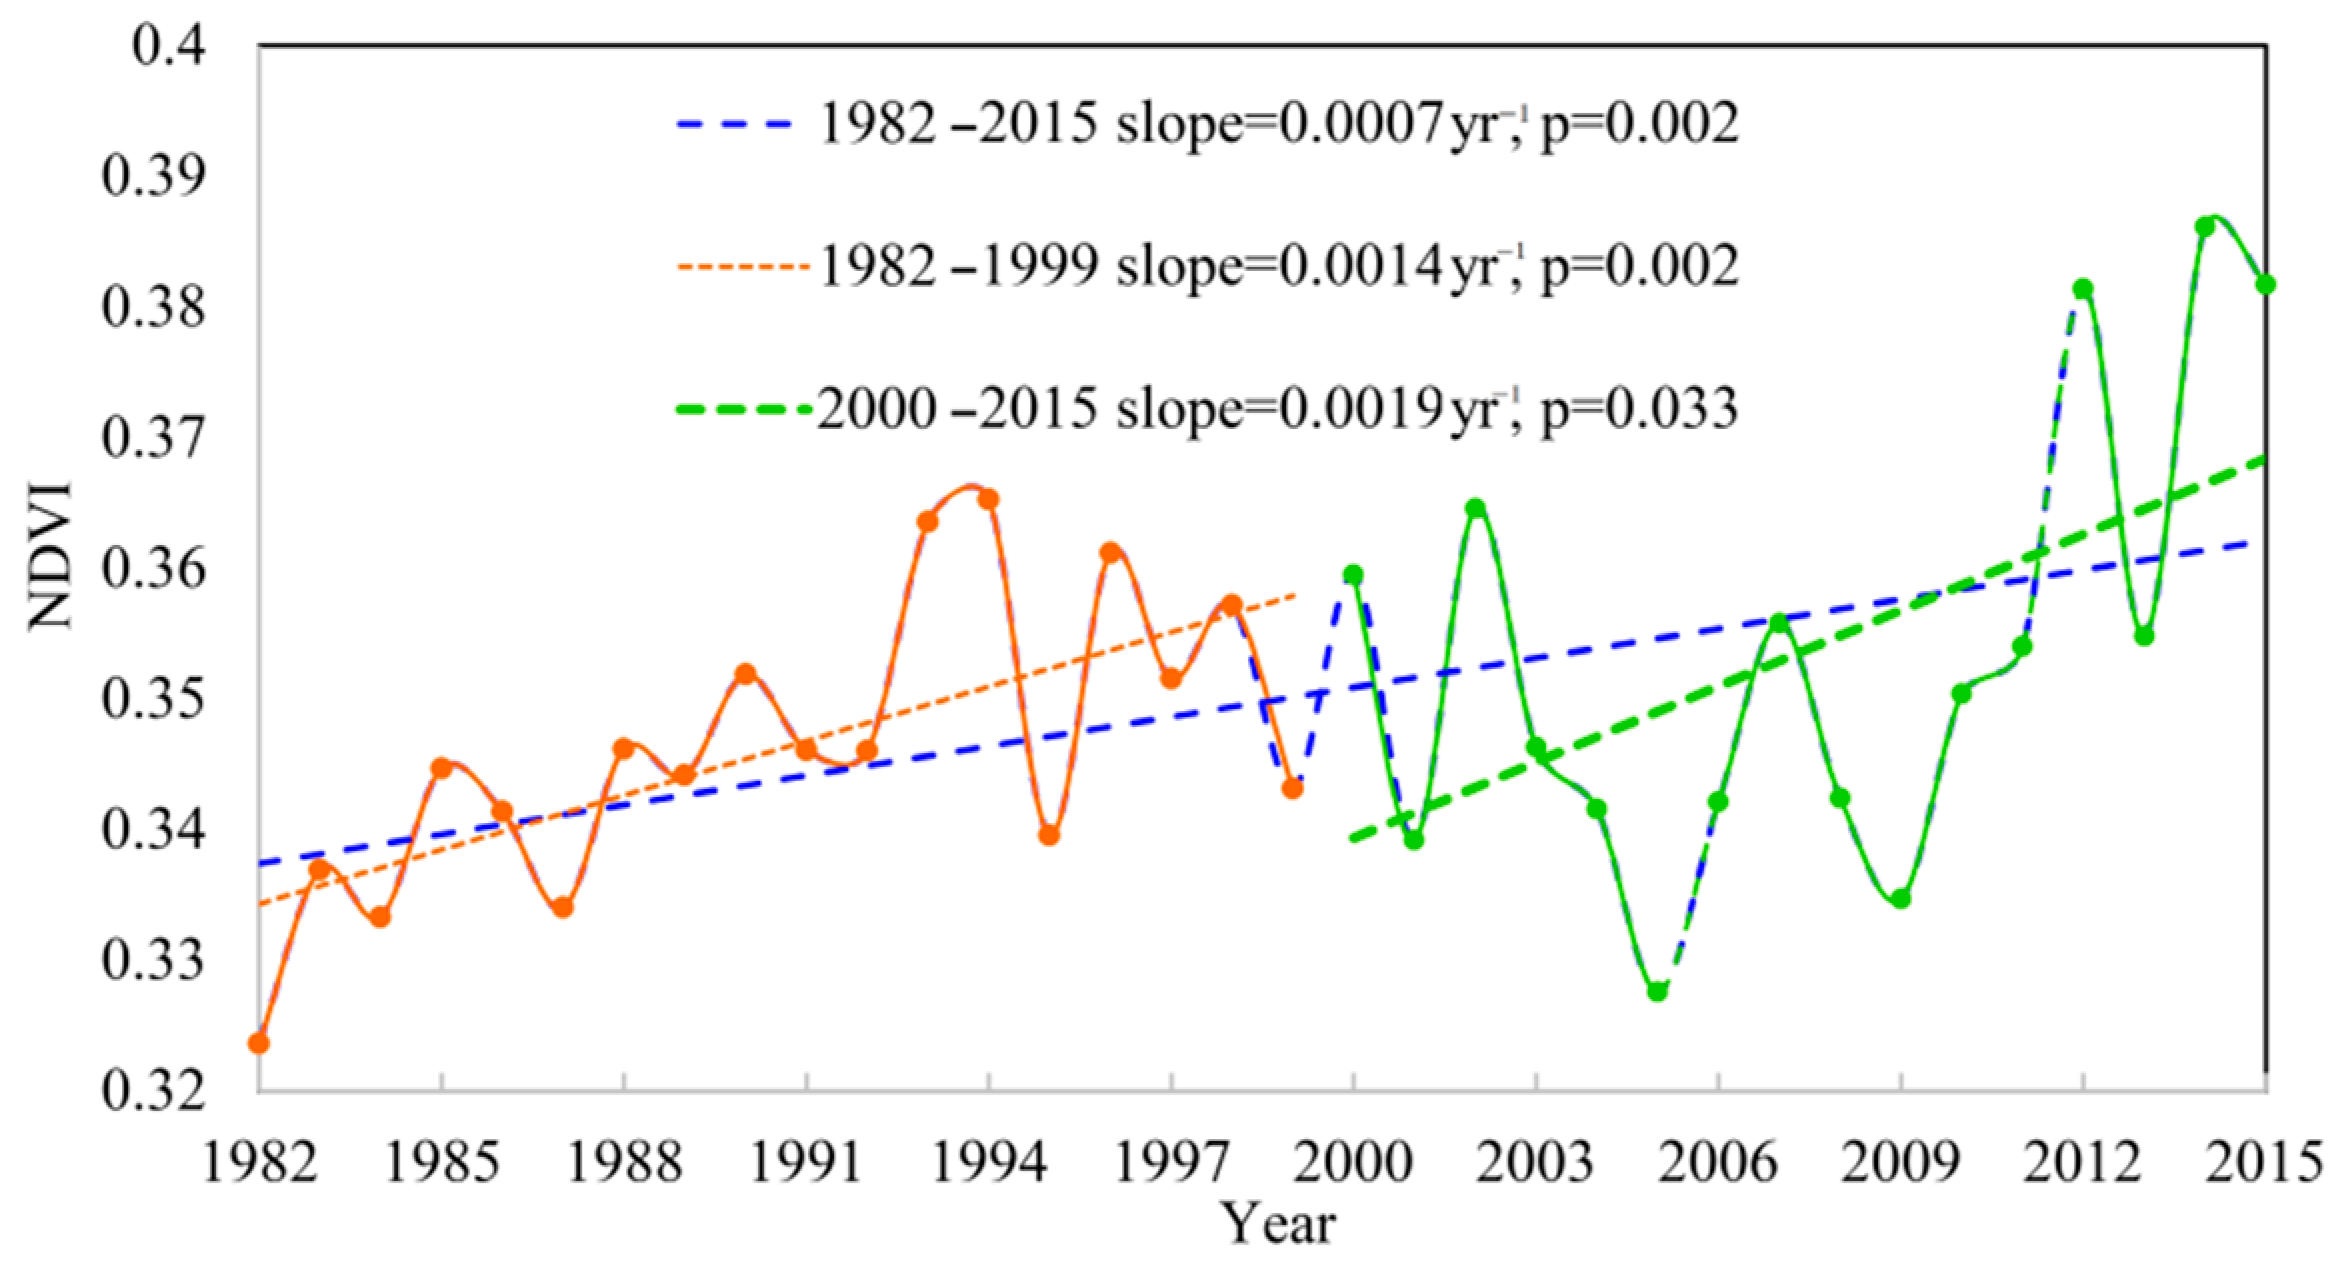
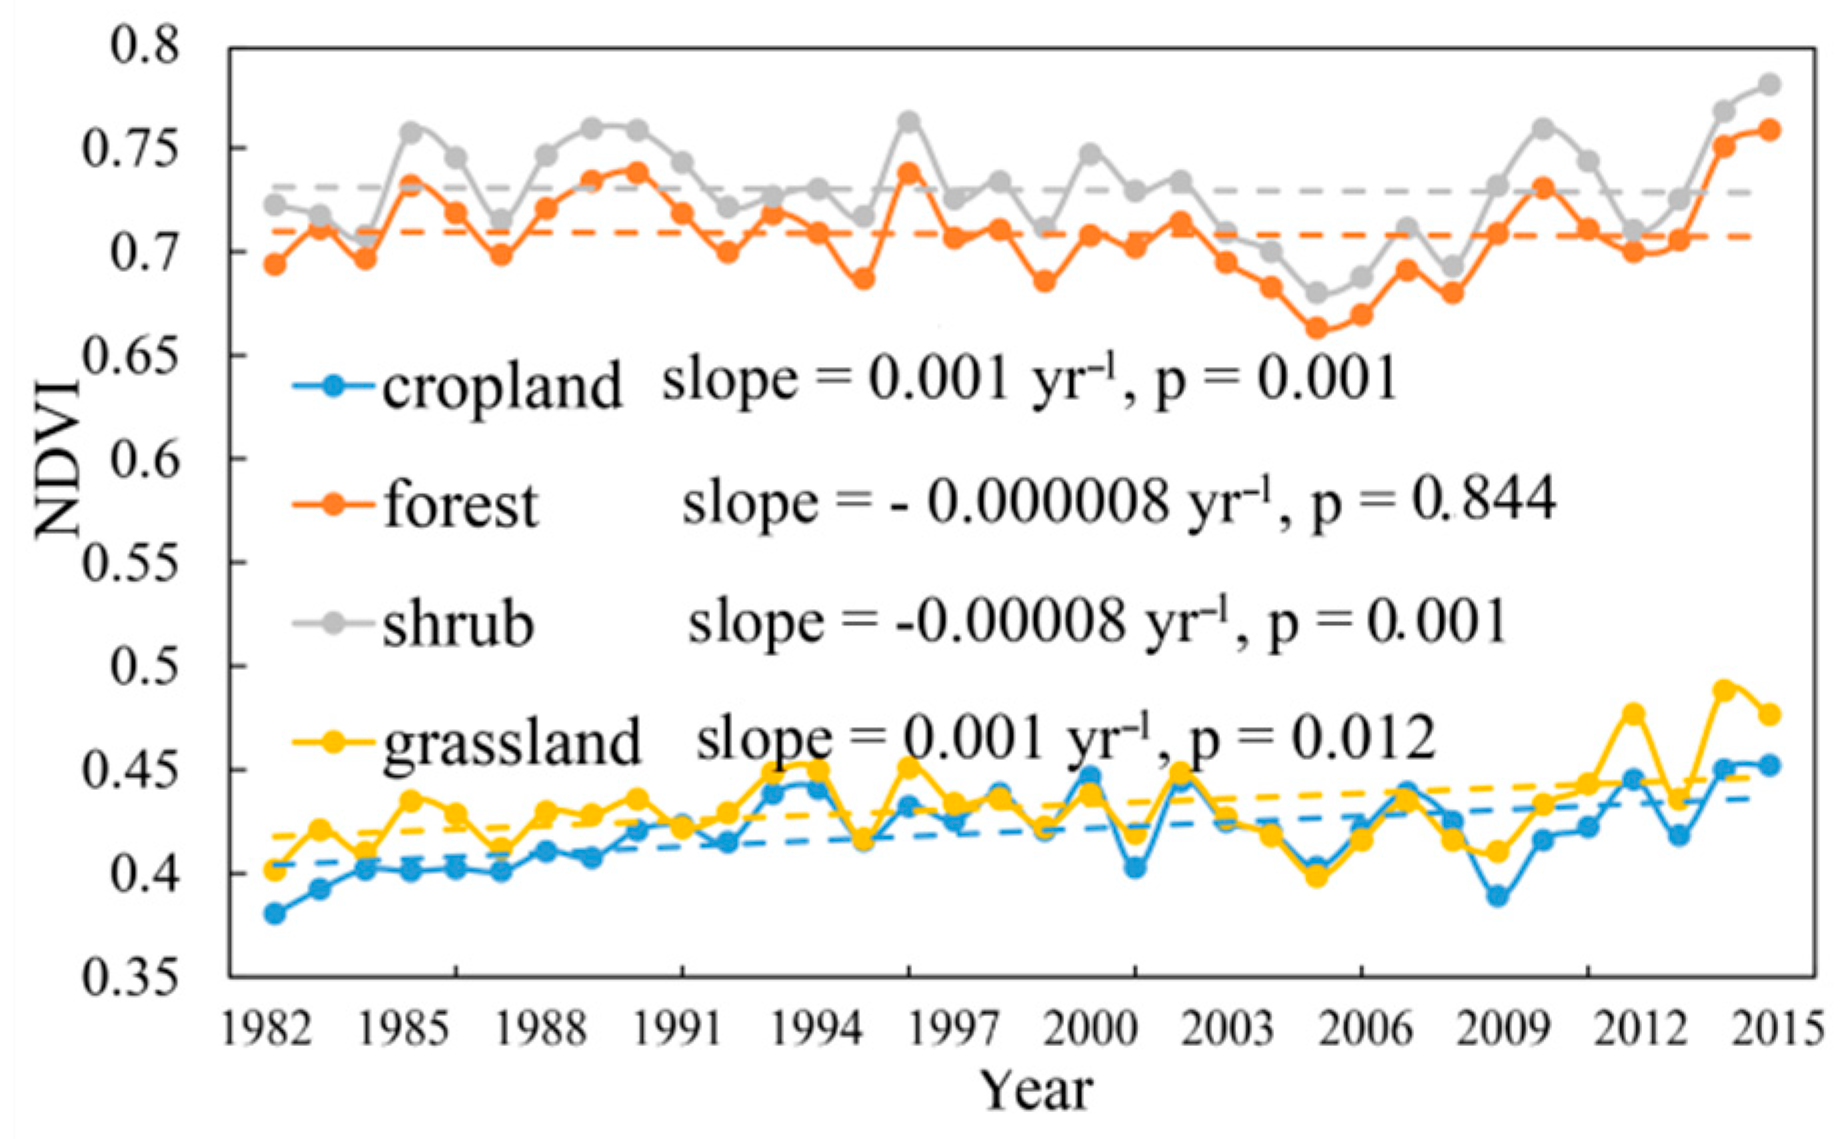
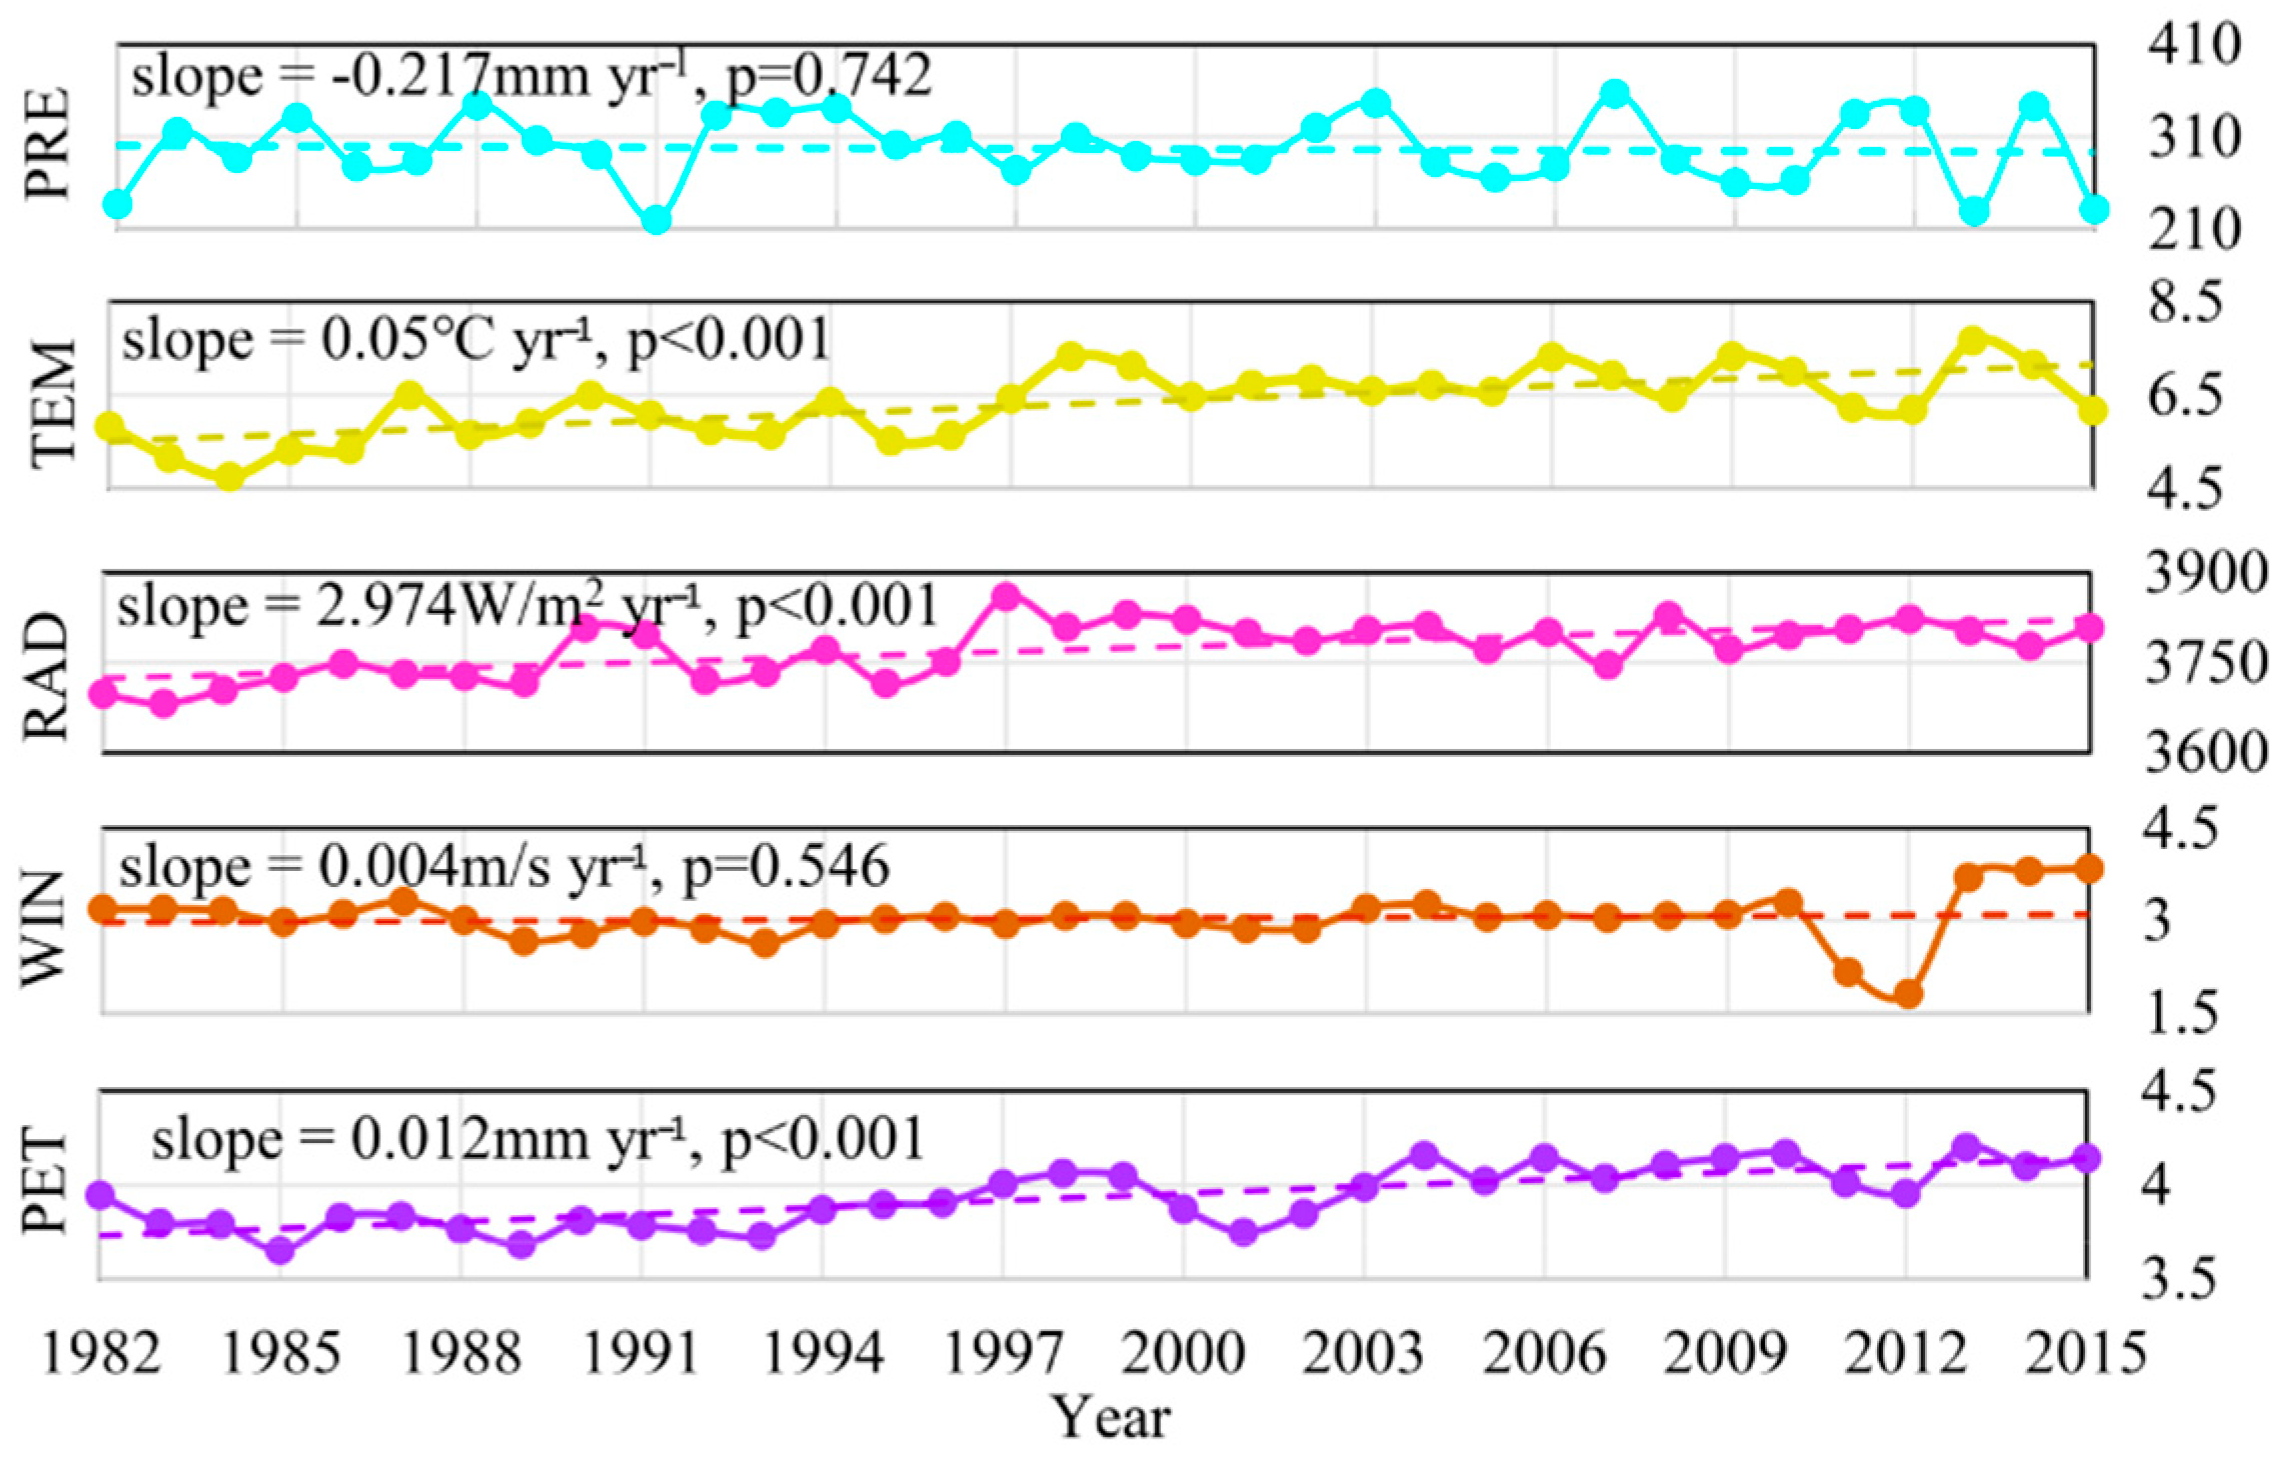
3.1. Temporal Variation Characteristics of Inter-Annual Vegetation Trends during the Growing Season

In this study, a comparison analysis was performed on the vegetation growth trends in Wuwei during the period of 1982–2015 and before and after the ecological restoration project implemented in 2000 (Figure 3). The inter-annual variation of NDVI in Wuwei during the period of 1982–2015 exhibited a significant increase trend at a rate of 0.007/yr (p = 0.002). Vegetation growth trend during the period of 1982–1999 exhibited a significant increase trend with a relatively low growth rate of 0.0014/yr (p = 0.002). After 2000, there was a relatively large fluctuation in the magnitude of NDVI and satisfying vegetation restoration, with NDVI presenting a significant increase under a rate of 0.0019/yr (p = 0.033). In this study, the change in NDVI trend among different land-use types in the Wuwei region showed that that the NDVI of forest and shrub was higher than that of grassland and farmland, and the NDVI of farmland and shrub showed a significant increasing trend (Figure 4). An analysis of the inter-annual variation of climate factors in Wuwei during the period of 1982–2015 shows that temperature, solar radiation, and PET all present a significant increasing trend (increased at an annual rate of 0.05 °C, 2.974 W/m2 and 0.012 mm, respectively) (Figure 5). During the last 34 years, the precipitation in Wuwei has slightly decreased (decreased at an annual rate of −0.217 mm), and the average wind speed there has slightly increased (increased at an annual rate of 0.004 m/s). It can be concluded that on the inter-annual scale, temperature and solar radiation are the primary climate factors that affect vegetation growth. Water stress increases with the decrease of precipitation and increase of wind speed and PET. Furthermore, under the energy limitation imposed by climate warming, vegetation presents a significant increasing trend.

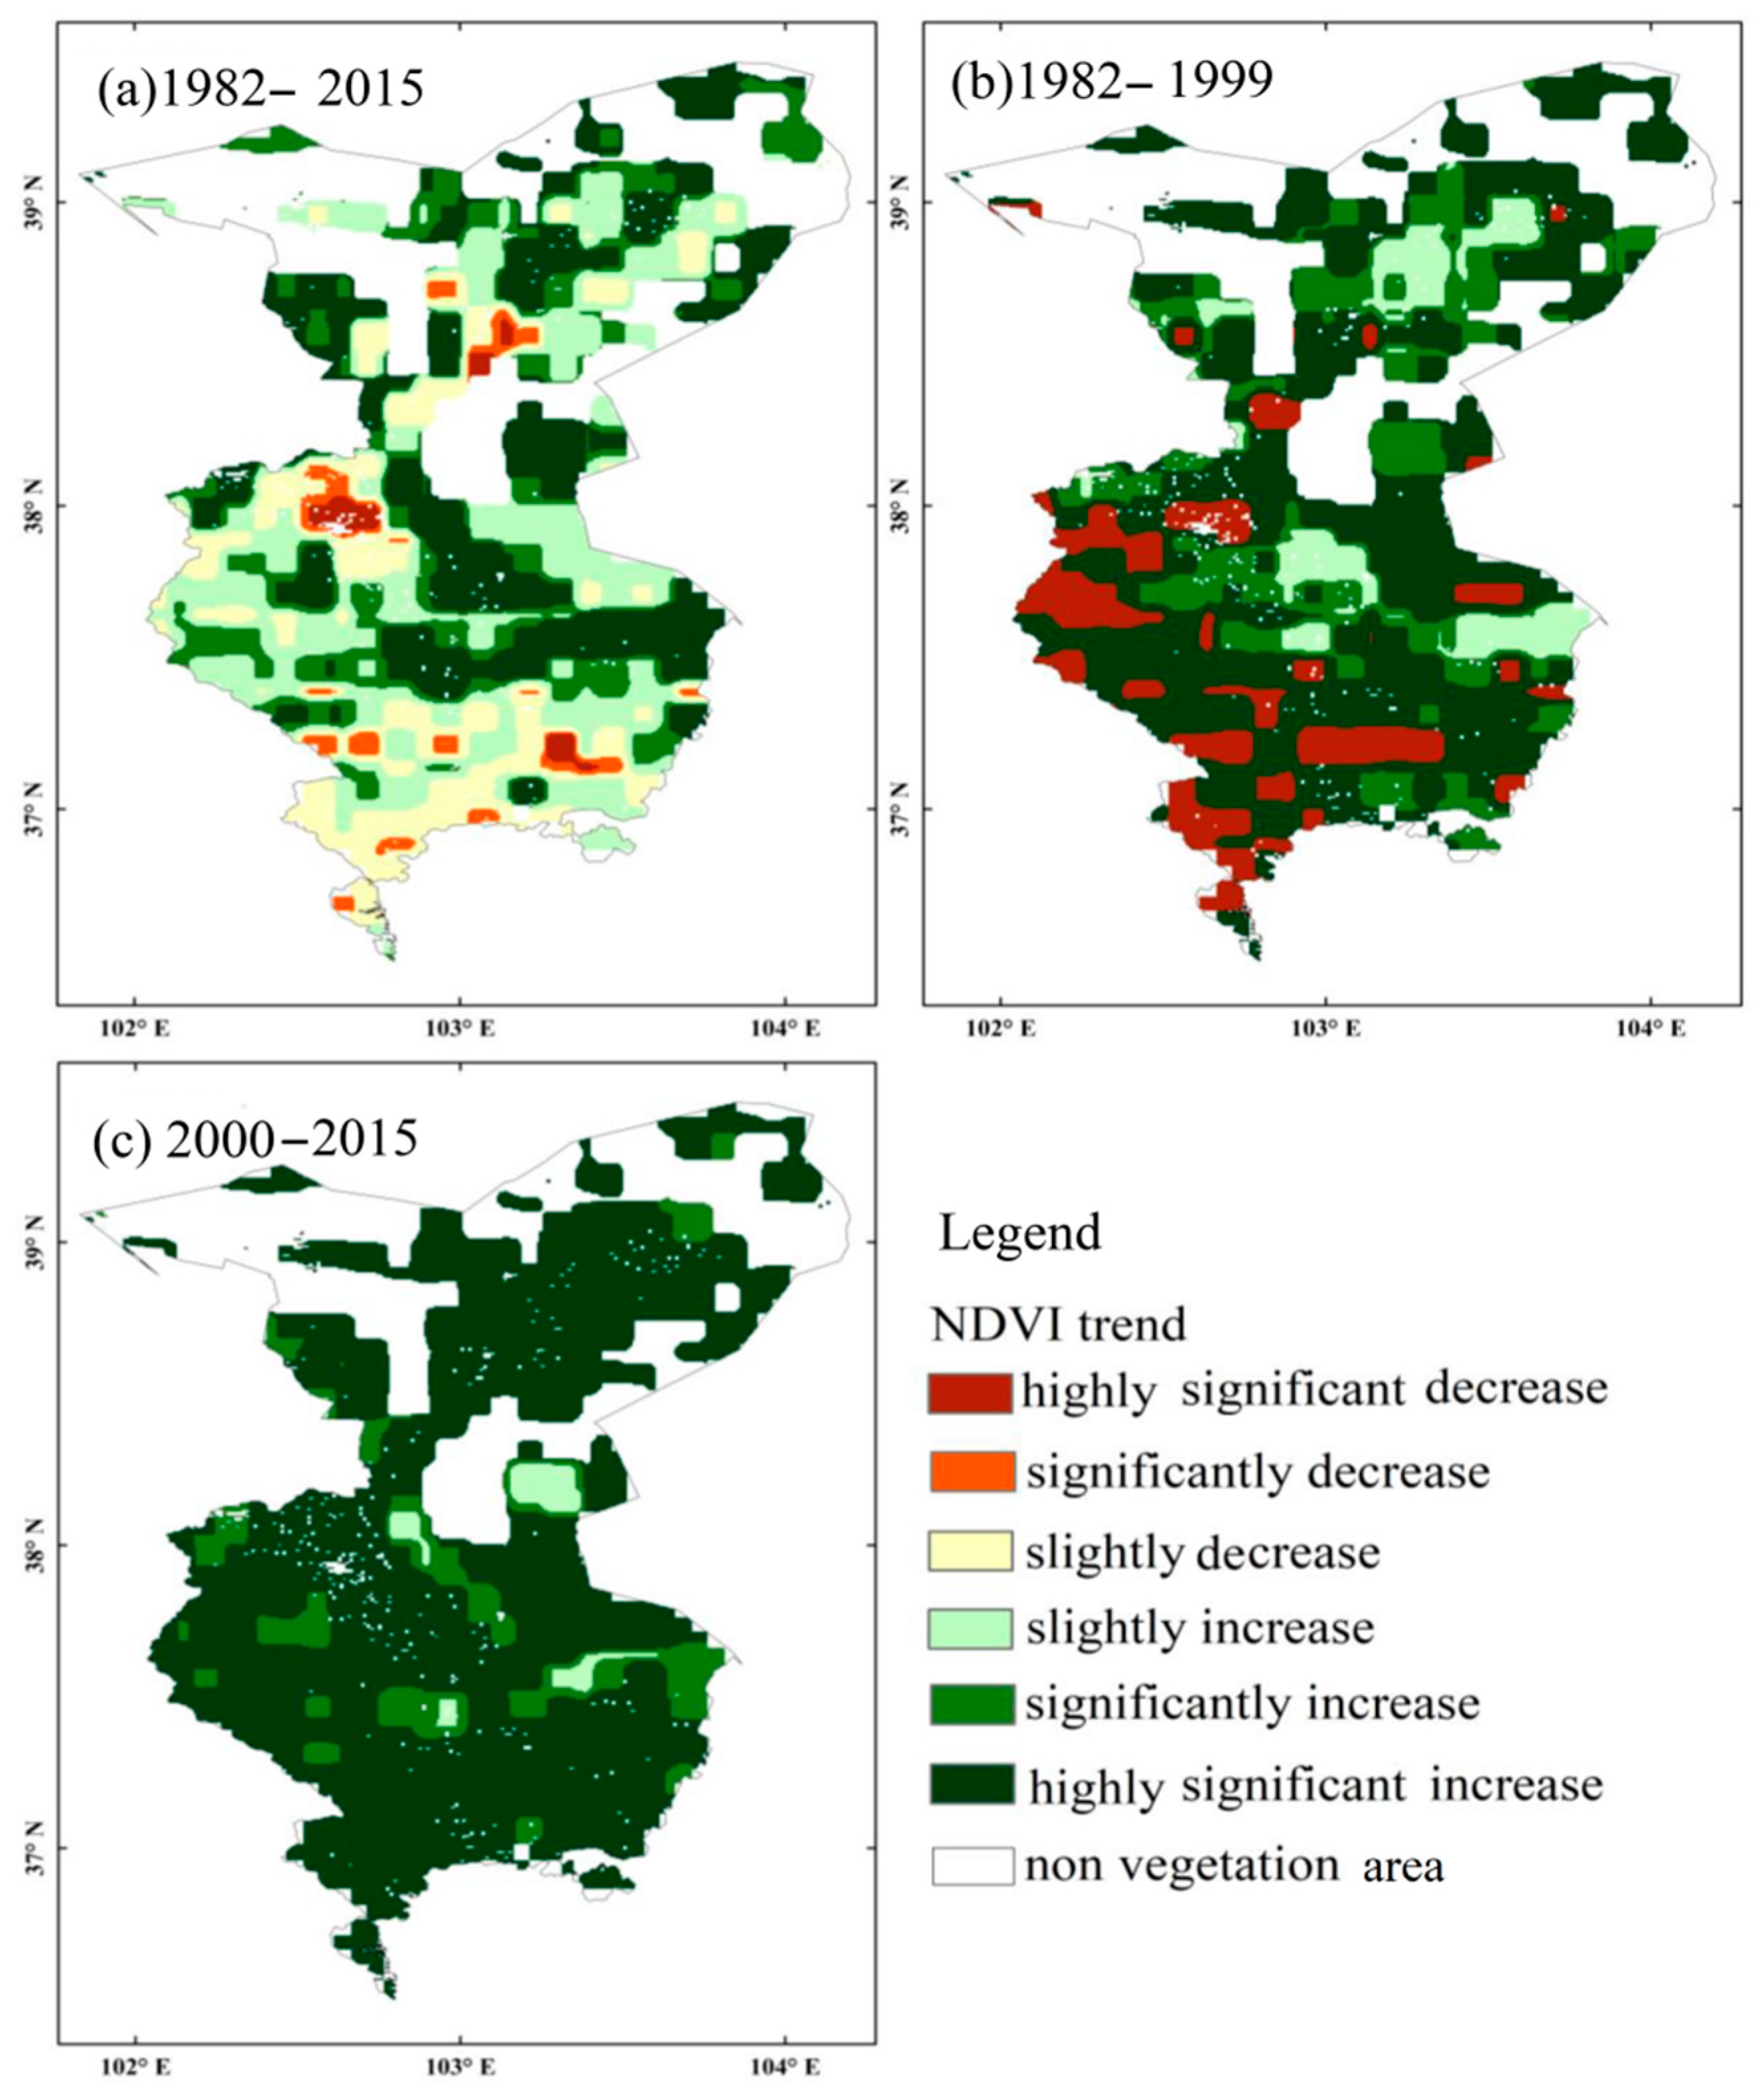
3.2. Spatial–Temporal Pattern Evolution of Growing Season Vegetation

In this study, a comparative analysis has been further performed on the spatial–temporal pattern evolution of vegetation trends in Wuwei during the period of 1982–2015 and before and after the ecological restoration project implemented in 2000 (Figure 6). The areas with vegetation growth and degradation trends in Wuwei during the period of 1982–2015 were cross-distributed, with the areas with vegetation degradation and growth trends accounting for 23 and 77% of the total area of the research region, respectively (Figure 6a). Among them, the areas with highly significant, significant, and slight degradation trends of NDVI during the period of 1982–2015 accounted for 1.4, 3.0, and 18.6% of the total area of vegetation zone, respectively. These areas were mainly located in the south of Minqin, Wuwei City, and most parts of Tianzhu Tibetan Autonomous County (Figure 2). The areas with highly significant, significant, and slight increase trends of NDVI during the last 34 years accounted for 28.1, 18.5, and 30.4% of the total area of vegetation zone, respectively. From 1982 to 1999, the vegetation degradation trend in Wuwei was severe. The areas with highly significant vegetation degradation during that period accounted for 14.4% of the total area of the vegetation zone (Figure 6b). These areas were primarily located in Wuwei City and the high-altitude zones in the southwest. Before 1999, the areas with vegetation growth trend in Wuwei accounted for 85.6% of the total area of the vegetation zone (and the areas with highly significant, significant, and slight increase trends of NDVI accounted for 57.9, 19.4, and 8.3% of the total area of the vegetation zone, respectively). During the period of 2000–2015, the NDVI in Wuwei City presented an overall significant increase trend, with magnitudes of vegetation growth relatively higher than those of other periods. The areas with highly significant, significant, and slight increase trends of NDVI accounted for 87.1, 11.1, and 2.3% of the total area of Wuwei City, respectively (Figure 6c). In summary, it can be seen that significant vegetation restoration in Wuwei has been achieved with the interaction of climate and human activities.

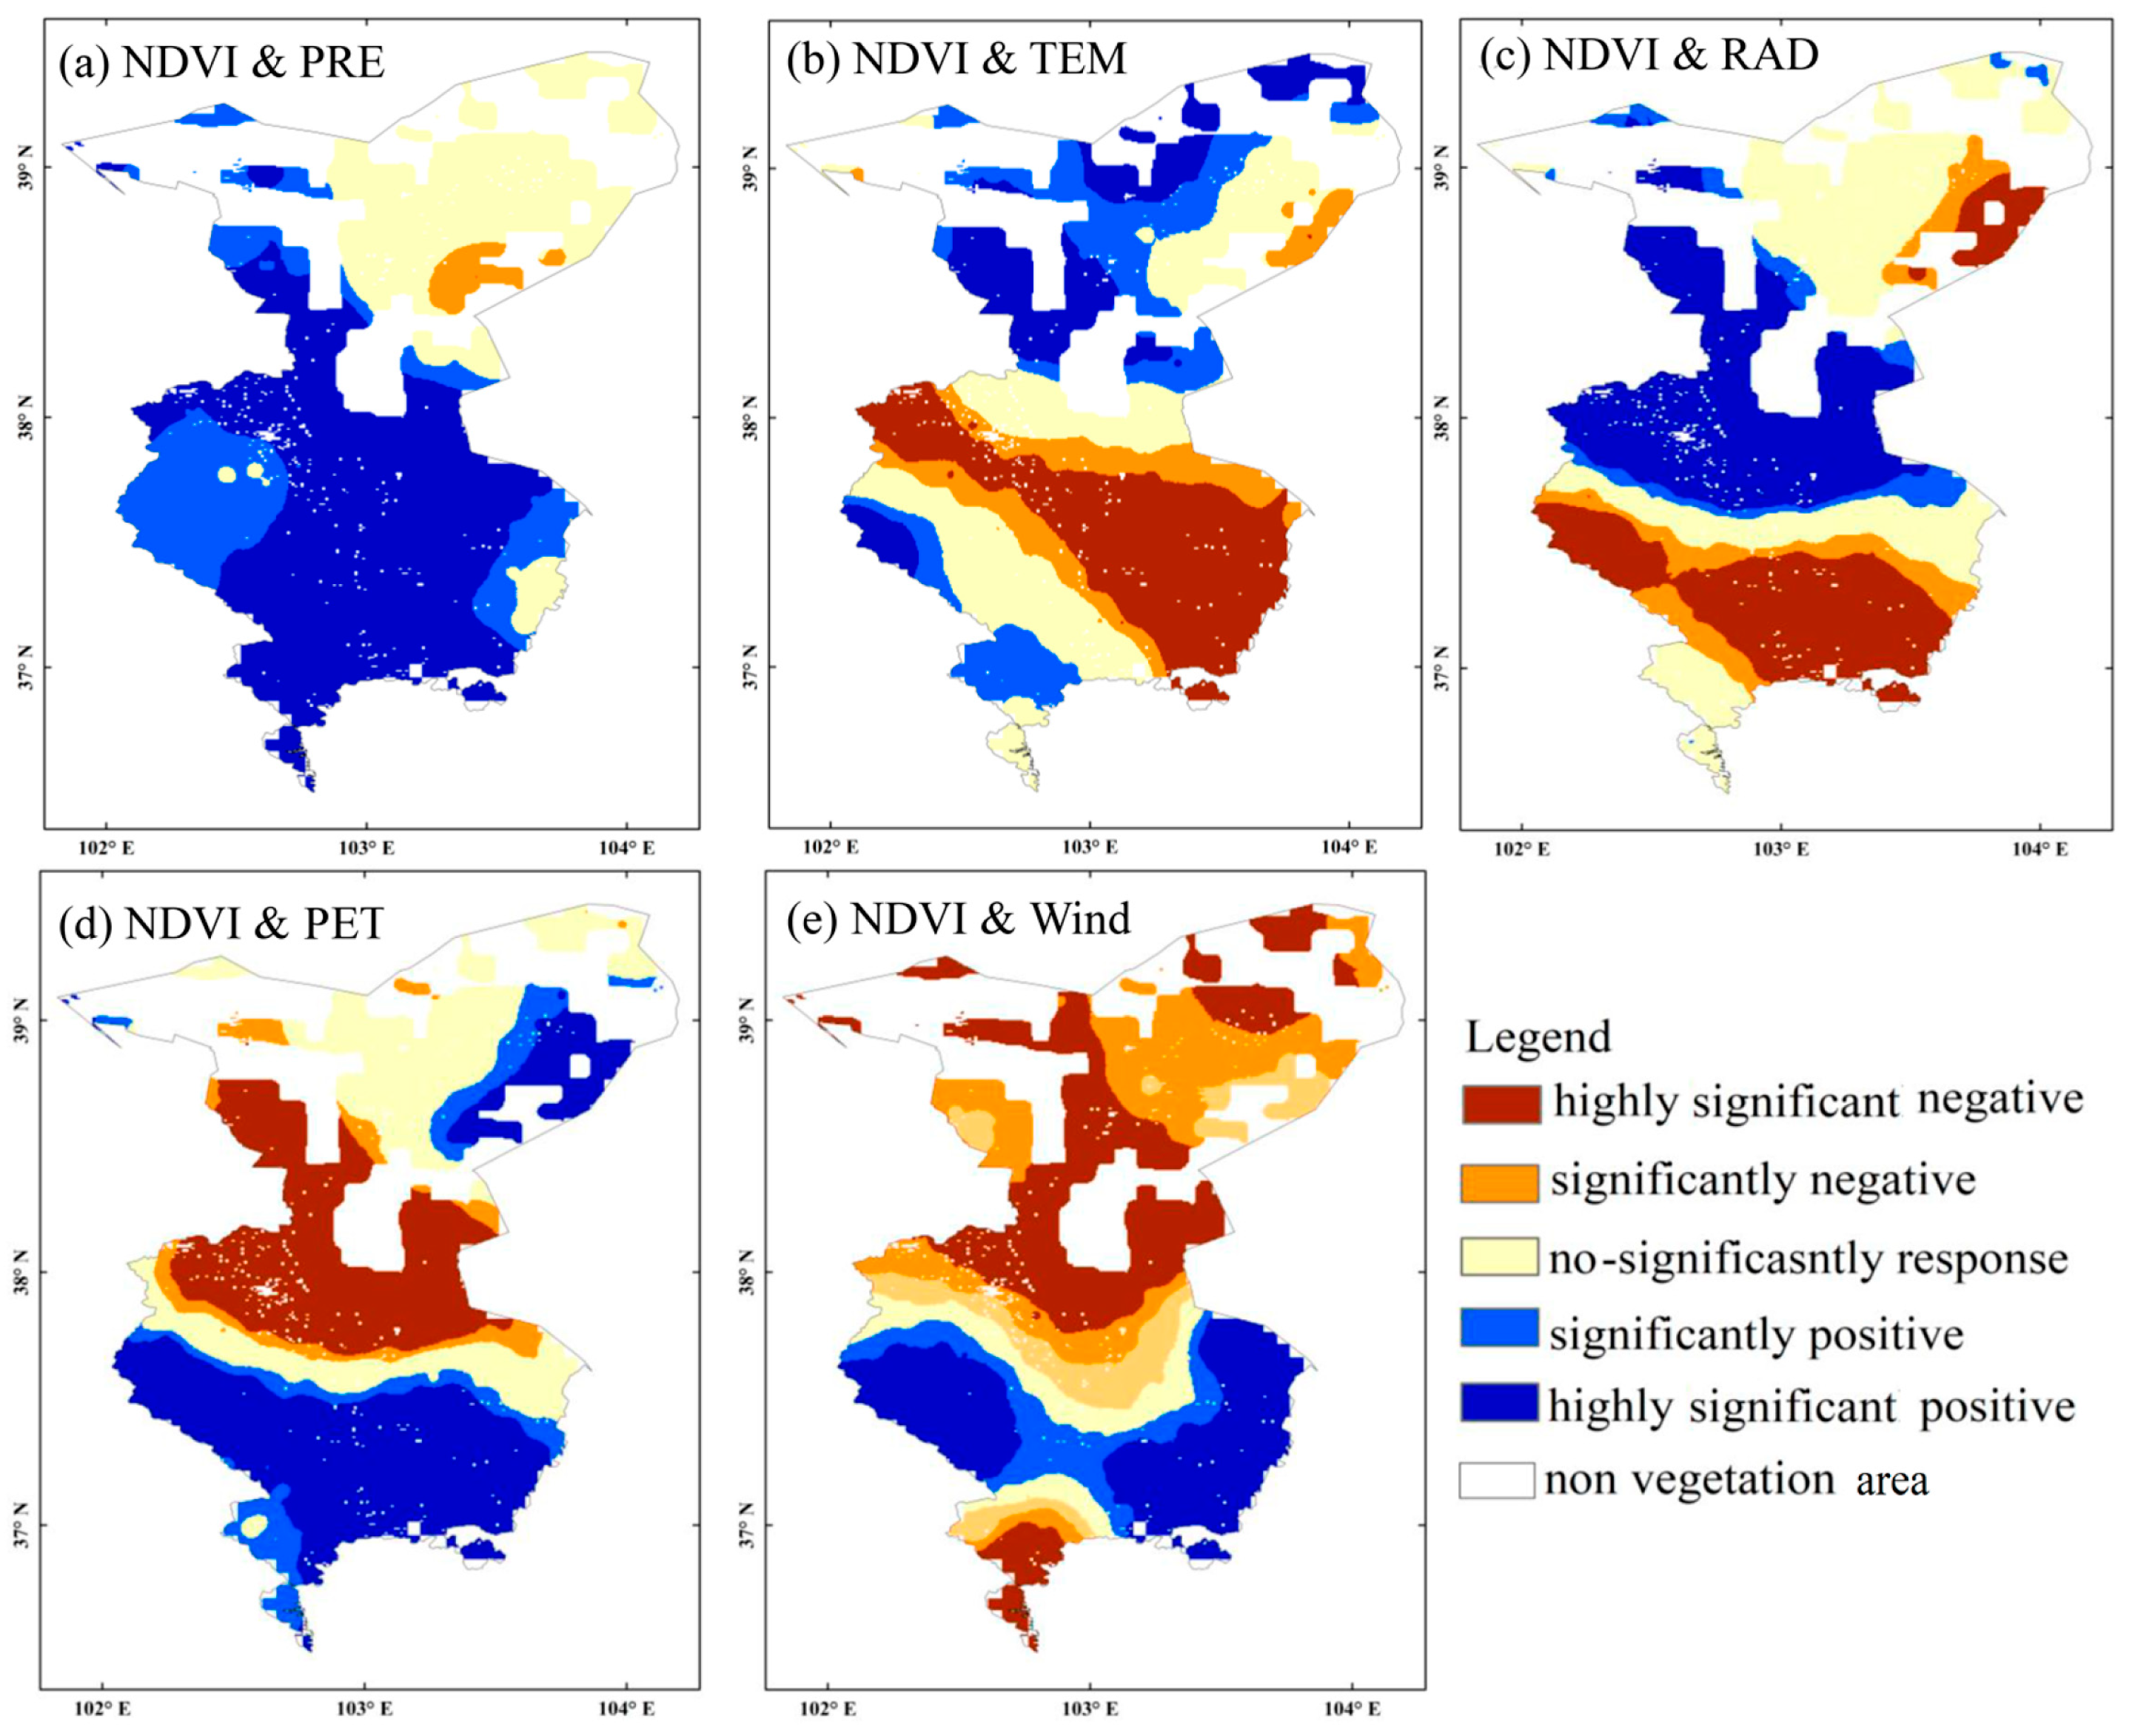
3.3. Analysis of the Response of Vegetation in the Wuwei Area to Climate Change

In this study, the GTWR model has been used to analyze the response mechanism of vegetation to climate change. The explanatory degree of GTWR in analyzing the effects of climate change on vegetation is 0.86, p < 0.001, with a root mean square error of 0.07 and an Akaike information criterion of 64.03. These indicators show that the response relationships of NDVI with temperature, wind speed, precipitation, total solar radiation, and potential evapotranspiration have a significant characteristic of spatial–temporal non-stationarity.
Based on the significance test results of response coefficients obtained through the GTWR model (Figure 7), the contributions of climate elements on the increasing trends of NDVI in Wuwei are ranked as follows: precipitation (71.2%), PET (43.9%), solar radiation (34.8%), temperature (33.1%), and wind speed (31%). Among all the climate elements, wind speed contributed the most (50%) to the NDVI decrease trends in Wuwei from 1982 to 2015, followed by temperature (38.6%), solar radiation (32.9%), PET (30.1%) and precipitation (2.5%). Except for the vegetation in the east of Minqin, which was negatively impacted by precipitation, the vegetation in other areas all exhibited a significant positive correlation with precipitation. The areas with highly significant and significant positive correlations between vegetation and precipitation accounted for 50.9 and 20.3% of the total area of the vegetation zone, respectively, while the areas with a significant negative response relationship between precipitation and vegetation accounted for 2.5% of the total area of that zone (Figure 7b). The areas with highly significant and significant negative response relationships between temperature and vegetation accounted for 26.4 and 12.2% of the total area of the vegetation zone, respectively. These areas were primarily located in grassland and cropland areas in Wuwei City and Gulang. Meanwhile, the areas where there are highly significant and significant positive response relationships between temperature and vegetation accounted for 15.3 and 17.8% of the total area of the vegetation zone, respectively (Figure 7b). Moreover, these areas were primarily located in Minqin farmland, desert areas, and forestland in the high-cold region of Tianzhu Tibetan Autonomous County. The response relationship between total solar radiation and NDVI shows a similar pattern to that of temperature distribution, but their spatial ranges vary. The areas with highly significant and significant negative response relationships between total solar radiation and NDVI accounted for 23.1 and 9.8% of the total area of the vegetation zone, respectively, with the areas with highly significant and significant positive response relationships between total solar radiation and vegetation accounting for 29.3 and 5.5% of the total area of that zone, respectively (Figure 7c). The areas with highly significant and significant negative response relationships between PET and NDVI accounted for 24.4 and 5.7% of the total area of the vegetation zone, respectively. These areas were primarily located in the farmland and desert areas in west Minqin and Wuwei City. The areas with highly significant and significant positive response relationships between PET and vegetation accounted for 34.0 and 9.9% of the total area of the vegetation zone, respectively. Moreover, these areas were primarily located in grassland and forestland in the high cold region of Tianzhu Tibetan Autonomous County. Wind speed had a significant negative impact on the vegetation in farmland and desert areas in Minqin, Wuwei City, and Wushao Mountain, with the areas with highly significant and significant negative correlations between wind speed and vegetation accounting for 28.8 and 21.2% of the total area of the vegetation zone, respectively (Figure 7e). The areas with highly significant and significant positive response relationships between wind speed and vegetation accounted for 22.0 and 9.0% of the total area of the vegetation zone, respectively. These areas were primarily located in the grassland and forestland areas in the south of the research area.

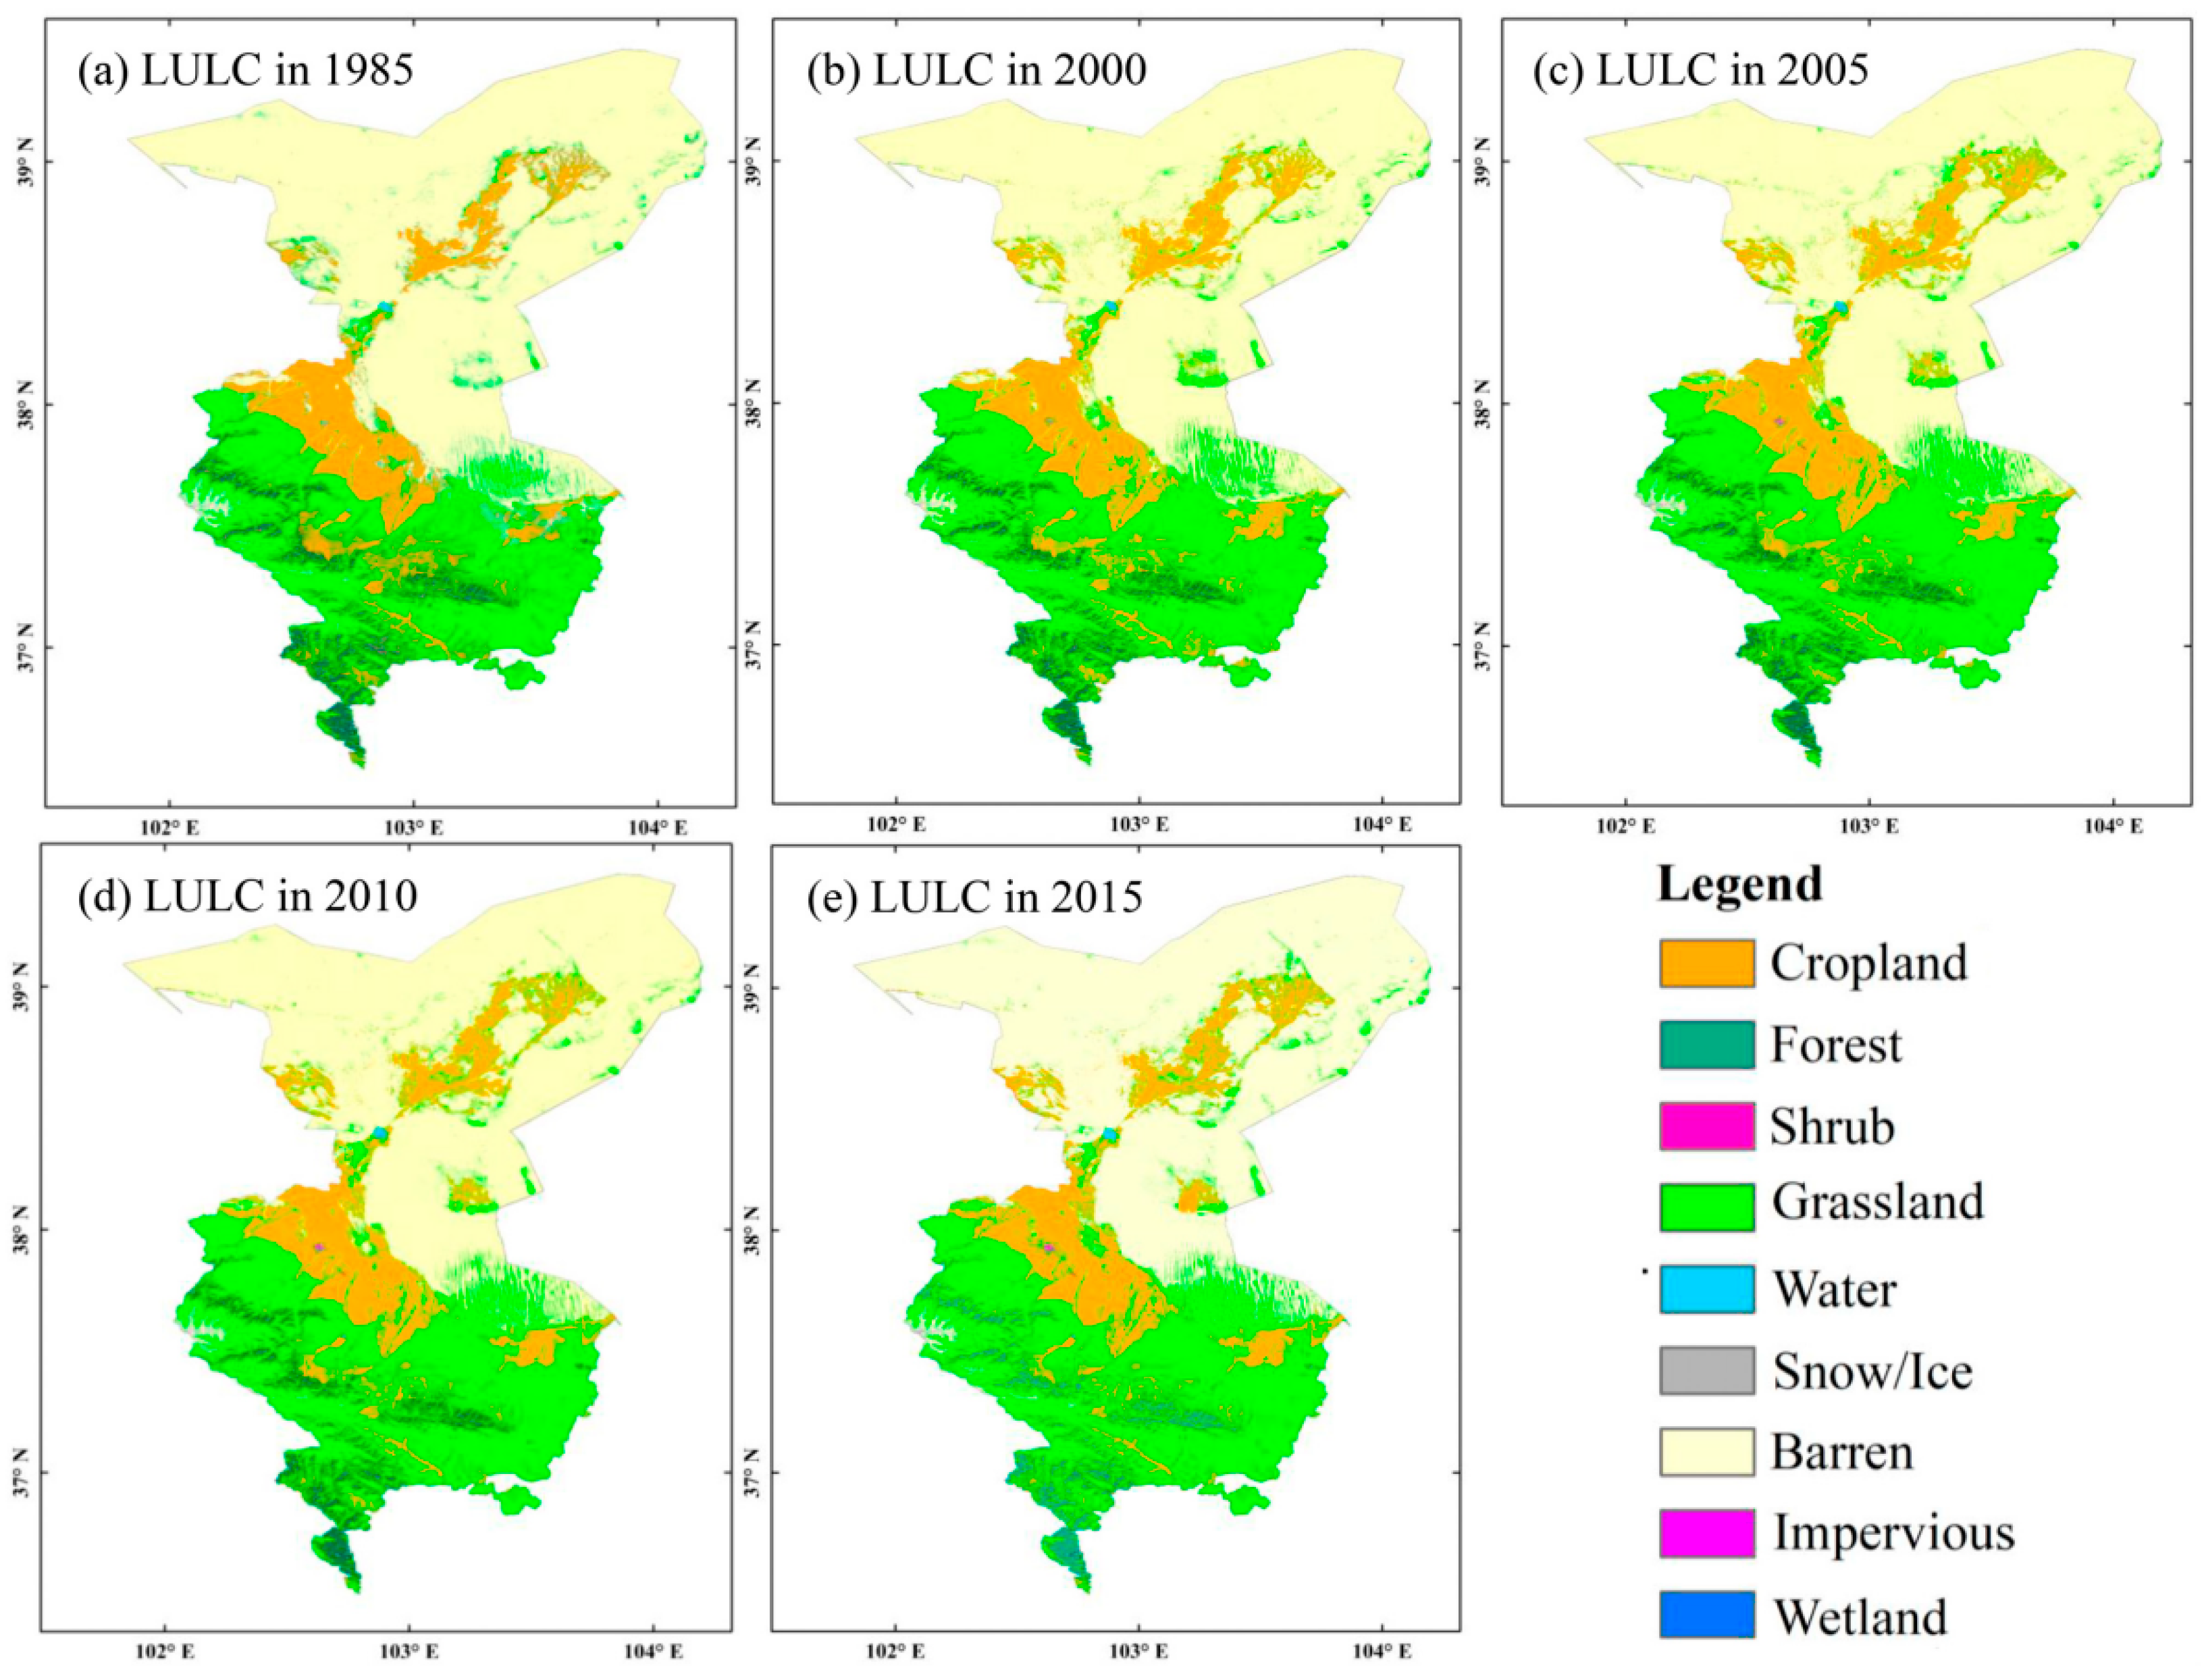
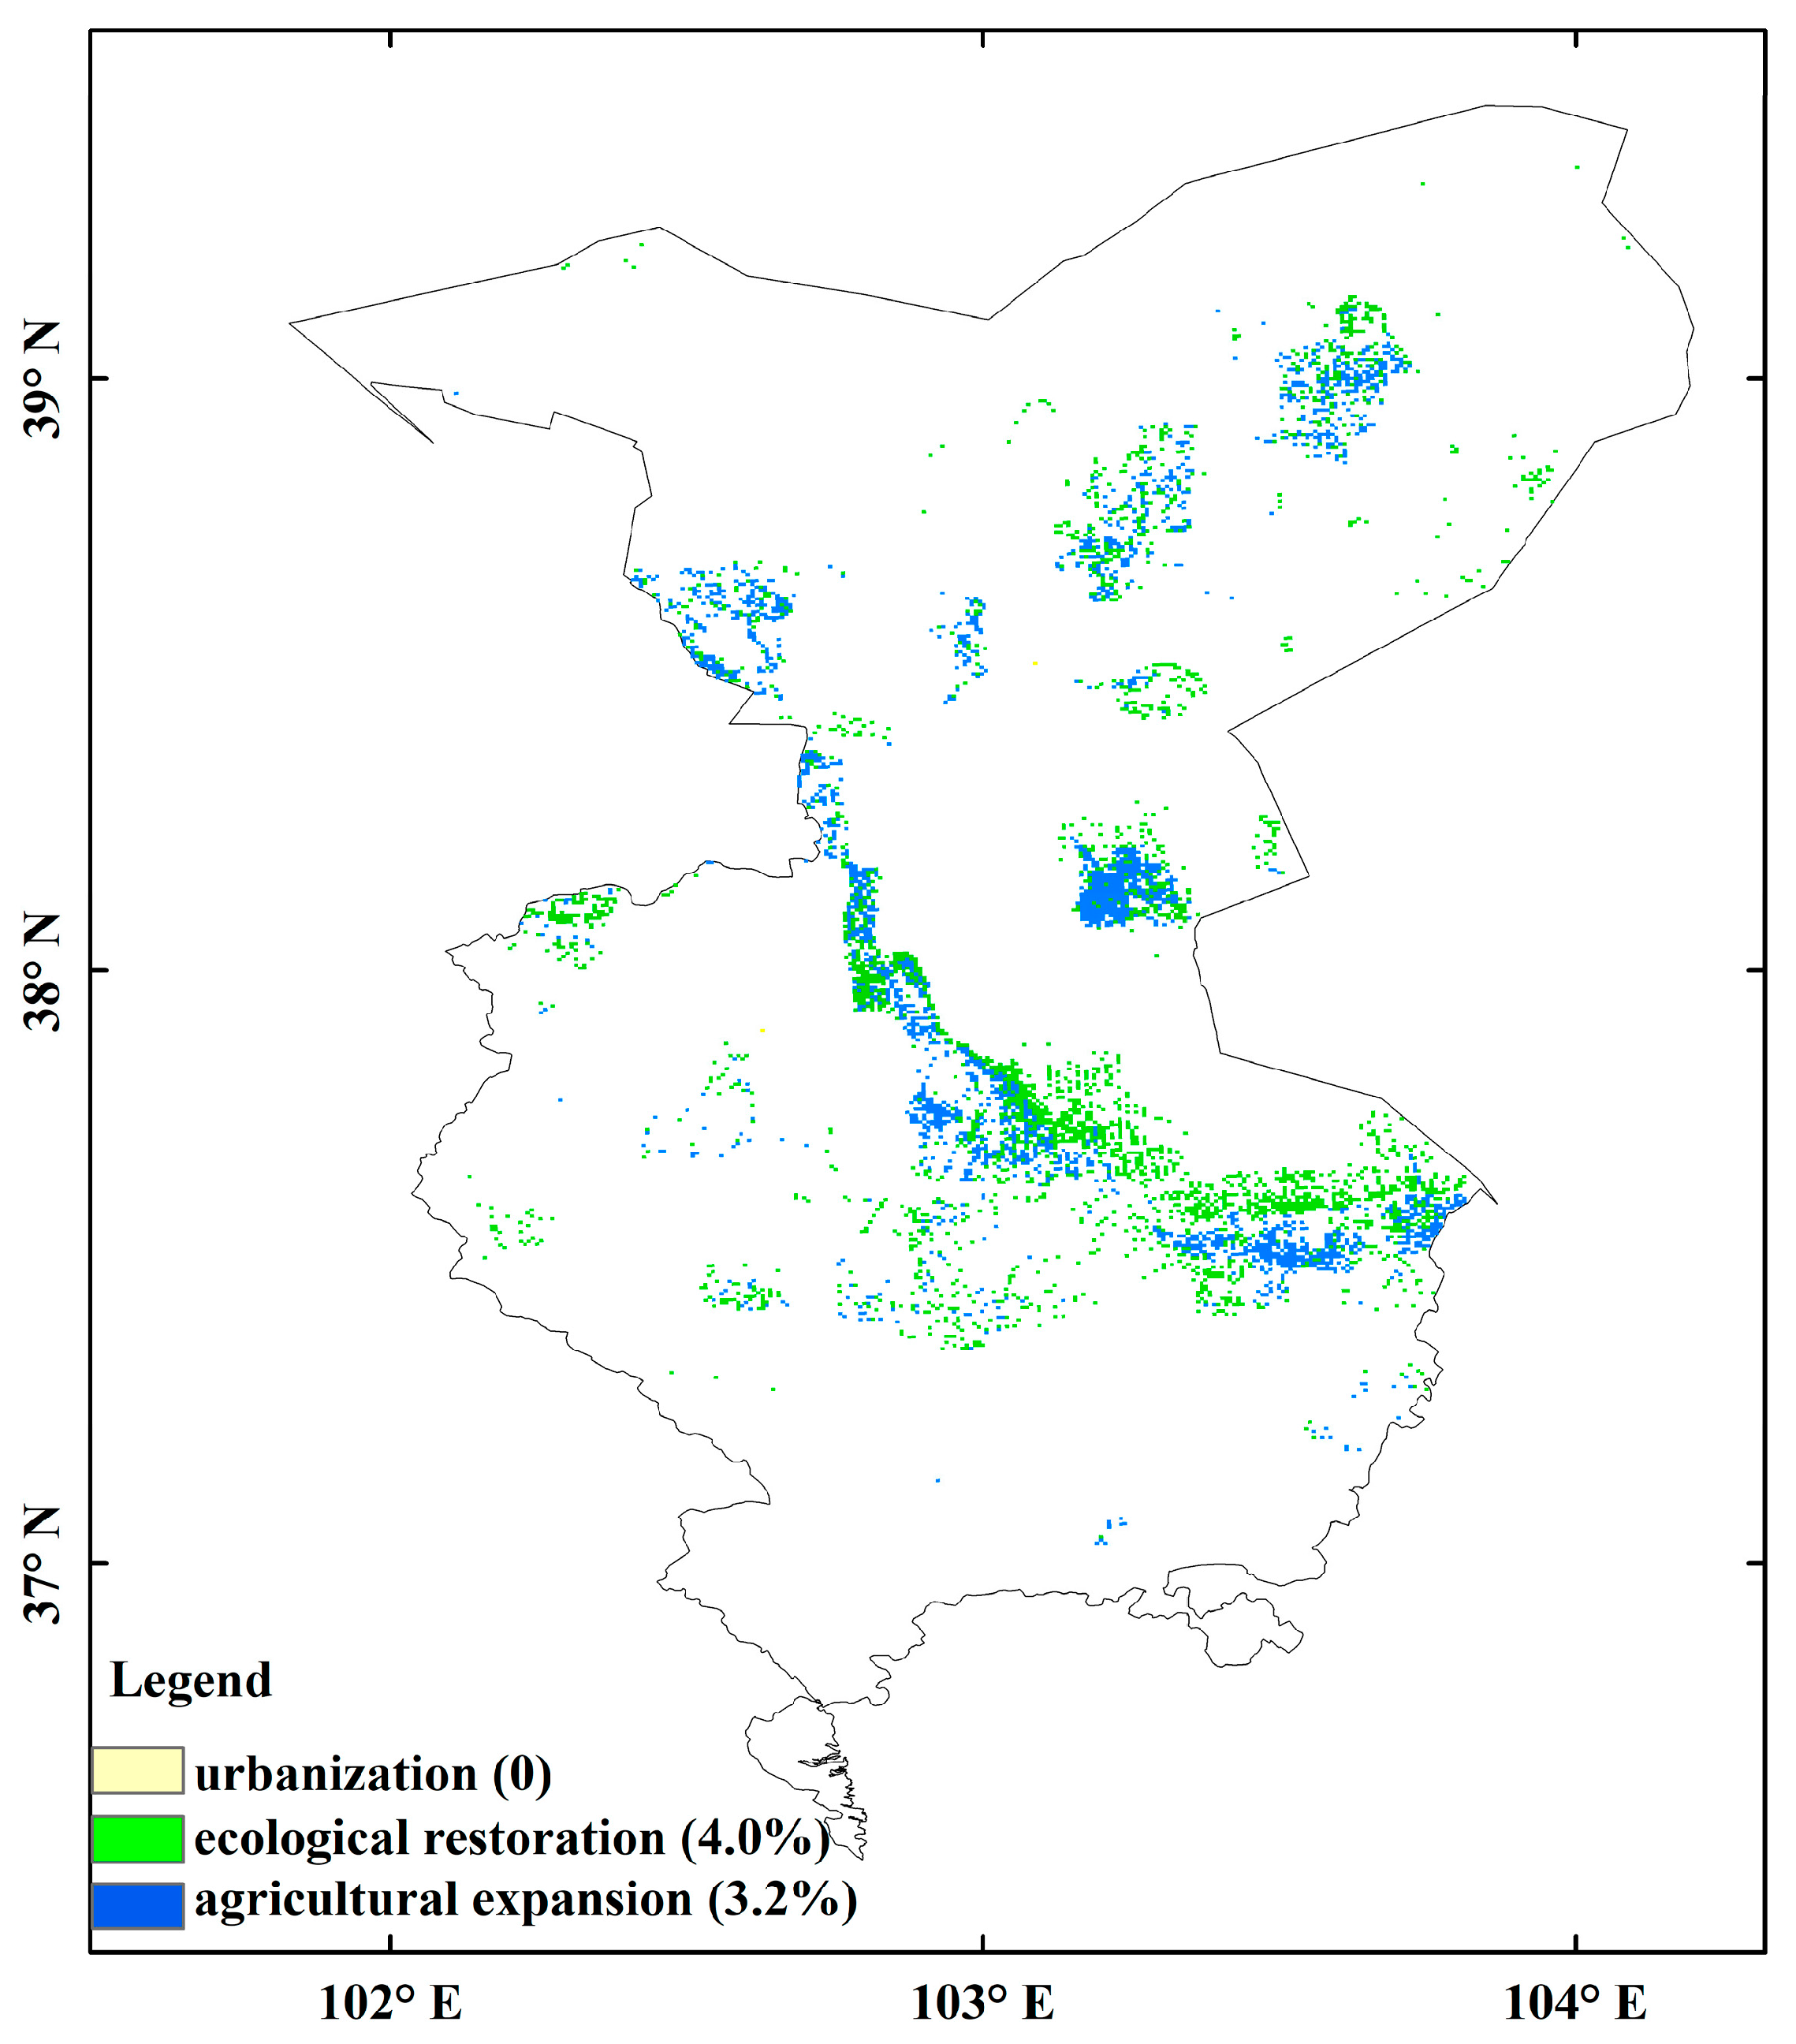
3.4. Combined Analysis of NDVI Trends and LULC

In order to clarify whether the land-cover changes in Wuwei cause changes in vegetation trends and environment, the land-use and land-cover change conversion in Wuwei was first analyzed in this research. The spatial pattern of land use and land cover in Wuwei presents the dominance of grassland, farmland, and unused land in this area (Figure 8). The conversions among land covers during the period of 1985–2015 had been relatively strong, with a conversion rate of 14.9% (Table 2). In other words, most landscapes had not been disturbed (and these areas were primarily located in Minqin, accounting for 85.1% of the total area of the research zone). From the perspective of the net conversion rate of each land type during the last 34 years, from 1985 through 2015, except for farmland, grassland, and forestland—which all presented a significant expansion trend—other land-use types presented a decreasing trend to some extent. Among these land-use types, wetland, snow/ice, water, and shrub exhibited the most significant decrease trend, with a net conversion rate of 99.4, 94.7, and 92.3%, respectively, and impervious and barren land had a relatively significant decrease trend, with net conversion rates of 29.8 and 8.4%, respectively (Table 2). The areas of farmland and grassland had increased by 20.1 and 20.6%, respectively, and their increases were mainly at the cost of the conversions of ecological land and barren land. Barren land, grassland, and forestland contributed the most to the increase in farmland, while the increase in grassland was primarily at the cost of the decrease in the areas of barren land, cropland, and shrub. From the perspective of the net increase area of each land-use type, the net increases in grassland, farmland, forestland, and barren areas were 3299.8, 1560.5, 517.4, and 454.7 km2, respectively (Table 2). There was no significant conversion in the areas of wetland, and the increases in the areas of other land-use types had been minor. From the perspective of the net converted area of each land-use type, the areas of unused land and grassland, which are the land-use types accounting for the highest proportion of the total area of the research area, had decreased by 2205.2 and 985.1 km2 by 2015, respectively, followed by shrub, cropland, water, and snow/ice, which had decreased by 725.3, 683.4, 447.8, and 442.6 km2, respectively (Table 2). Meanwhile, the areas of farmland converted to grassland had reached 654.3 km2, and the areas of barren land converted to grassland had reached 1580 km2, further indicating the remarkable effectiveness of the policy of returning farmland to grassland implemented in Wuwei City.
In this study, the conversion status of ecological land and non-ecological land determined by the direction of land-use transition was used to distinguish the positive and negative influences of human activities on the changes in NDVI trends. The areas of non-ecological land internally converted accounted for 1.6% of the total area. These areas were primarily located in the farmland areas in Minqin County and Wuwei City. The areas of ecological land converted to non-ecological land accounted for 3.5% of the total area (Figure 9). These areas were primarily located in the farmland and barren land in Wuwei. Meanwhile, the areas of non-ecological land converted to ecological land accounted for 5.7% of the total area (Figure 9). These areas were primarily located in the grassland areas in the Shiyang River zone of Minqin and the Gulang section in Wuwei. Furthermore, the areas of internally converted ecological land accounted for 32.9% of the total area. These areas were primarily located in the whole intersection zone of Shiyang River’s tributaries. Combined with statistical analysis and spatial overlay analysis of NDVI trends and human activities induced by land-cover change, we quantified the contribution of urbanization, ecological restoration, and agricultural expansion to NDVI trend change. The contributions of ecological restoration and agricultural expansion to increasing trends of NDVI during the period of 1982–2015 were 4.0 and 3.2%, respectively (Figure 10). Urbanization has contributed essentially nothing to NDVI’s increased trend (Figure 10).

4. Discussion

4.1. Performance of GTWR Method

The evolution process of the geographic environment is a heterogeneous process varying with time. The time dimension, as an intrinsic dimension of the geographic process, also influences its succession and response relationships. Considering that the GWR model does not take into account the influences of time dimension on geographic spatial environmental variables [33,35], Huang et al. (2010) proposed the GTWR model to characterize the spatiotemporal succession process of atmospheric pollutants, introducing the multi-dimensional variations and differences of temporal and spatial factors on the spatial–temporal scales [30]. The spatial–temporal evolution processes of vegetation and the response relationships of climate-driving factors were viewed in this study as a spatial–temporal variation system, with a GTWR model explanatory degree of 0.86. In addition, it has been analyzed and revealed that the response mechanism of vegetation to climate factors has the characteristics of significant spatial–temporal non-stationarity and agglomerations. Many scholars have used the GTWR model in various fields, such as land use, meteorology, house price assessment, resource environment, and vegetation trend succession [21,30,35]. They all found that compared with the OLS and GWR models, the GTWR model could better characterize the features of spatial–temporal non-linearity and non-stationarity of geographic and environmental variables [30,35,42]. This further verified that the GTWR model, which deals with the non-stationarity of time and space at the same time based on the spatial–temporal distance and weight matrix, can solve the spatial–temporal heterogeneity problem very well [43].

4.2. The Influence of Climate Change on the Spatial–Temporal Evolution of Vegetation

The climate is the major driving factor of vegetation change. Climate elements such as air temperature, precipitation, solar radiation, and wind speed can cause long-term or short-term changes in vegetation ecosystems. In its fifth report, the IPCC pointed out that global warming will continue, and regional or even global ecosystems could be irreversibly harmed by future climate change [5,44,45]. Climate change characteristics were analyzed in this study with meteorological data during the last 34 years. The analysis revealed that the air temperature in Wuwei continues to rise, which is consistent with the results of other scholars’ research carried out in different areas in China [46,47]. Meanwhile, PET and wind speed presented a slight increase trend. All these findings indicate that future climatic anomalies will be a key topic that we need to continuously pay attention to [48]. On the inter-annual scale, the NDVI trend in Wuwei had increased at a rate of 0.0007 yr−1 from 1982 through 2015. Especially after the ecological restoration project was implemented in 2000, vegetation restoration continued at a rate which is 1.4 times the rate before 2000 (Figure 3). During the last 34 years, the inter-annual vegetation trend in Wuwei has presented a significant increase pattern, primarily caused by the rapid increase in temperature since the 1980s. Climate warming has not only extended the growth cycle of vegetation but also accelerated the decomposition of soil organic substances and the release of nutrient elements, thus favoring accelerated growth of vegetation [42]. On the other hand, human activities improving agricultural management and implementation levels, such as the vegetation restoration project, have effectively increased the regional vegetation cover in this area.
Precipitation (71.2%) has contributed to the vegetation restoration trend in Wuwei the most. For the desert and grassland ecosystems in the long-term arid areas in north Wuwei, vegetation is extremely insensitive to precipitation changes. Less precipitation and high evapotranspiration have resulted in vegetation degradation [49]. Vegetation is susceptible to phenology changes instead [11,21]. Forest vegetation in the high-cold region with relatively high precipitation can supplement water by absorbing underground water with roots, thus driving the greening of vegetation [49]. Among all climate elements, wind speed and temperature have contributed to the vegetation degradation trend in Wuwei the most. The landscapes in Minqin (barren) and Gulang oasis (desert grassland) are dominated by sandy areas with sparse vegetation, chronic drought, low rainfall, and high potential evapotranspiration (Figure 2). The increase in wind speed has accelerated the ground-surface evapotranspiration and the transpiration rates of vegetation. Meanwhile, nutrients of poor soil have been further released and lost under the action of wind [42], resulting in a significant negative effect of wind speed and potential evapotranspiration on vegetation growth in deserts and farmland (Figure 6a and Figure 7c,d). For vegetation in high-cold areas, temperature, instead of precipitation, is the dominant factor that promotes vegetation photosynthesis (Figure 7a,b). This is mainly because, in high-cold areas with relatively cold and wet environmental conditions, the reduction of atmospheric evapotranspiration can decrease the sensibility of vegetation to water stress [25]. Temperature rise can usually lead to early snowmelt and trigger early spring phenology, thus increasing vegetation greening [50]. We found that there was a significant negative effect of air temperature on the grassland vegetation in the middle of the research area. The main reason is that excessive rises in temperature can decrease vegetation leaf conductivity and enhance the dark respiration effect that inhibits the growth of grassland vegetation [24,51]. It should also be noted that there was a non-significant positive correlation between precipitation in the oasis areas and NDVI (Figure 7a). Because there is a cross-distribution of rain-fed and irrigated farmland in the middle of the Minqin oasis zone, farmland vegetation presents a big difference in its sensitivities to temperature and precipitation [11,52,53]. The primary reason is that human irrigation has provided most of the water for vegetation growth in the oasis areas, leading to an insensitive vegetation response to precipitation [54]. The temperature significantly affects vegetation in the oasis areas, and their relationship exhibits relatively significant spatial heterogeneity (Figure 7b). The primary reason is that temperature rise is detrimental to the growth of rain-fed plants but is conducive to the growth of irrigated crops [53].

4.3. The Influence of Land-Use Change Pattern on Vegetation Restoration

The topography of Wuwei is complex and fragmented. Soil erosion is severe there, and the impacts of human activities on vegetation are extremely drastic. Land-use and land-cover change, as the most direct manifestation type of the interactions between human activities and the natural environment [55], can directly interact with surrounding land-use types under the effects of human activities and impose profound influences on those land-use types [56]. Compared with the current widely used coarse-resolution data, the land-use data with a resolution of 30 m used in this study are more helpful for clarifying the directions and internal patterns of land-use changes.
An analysis of NDVI spatial–temporal trend changes was performed based on regional and image-element scales. It revealed that since the project of returning farmland to forestland and grassland was implemented in Wuwei, the vegetation cover has significantly increased, and the ecological environment has been further improved. This represents the positive feedback of human activities on the natural environment and indicates the prominent effects of ecological restoration. Different from the development of the social economy at the cost of the ecological environment, land-cover-change protection measures have been implemented in some areas to directly promote the increases in vegetation greening, with environmental protection emphasized and ecological restoration projects and agricultural intensification implemented. Some other scholars have pointed out that large-scale ecological restoration projects (such as the Three-North Shelter Forest Program, returning farmland to grassland, etc.) are the primary non-climatic factors causing vegetation restoration [7,57,58]. Some studies have pointed out that ecological restoration projects such as forestry construction have no significant impacts on the vegetation cover in arid and semi-arid areas [59,60]. The spatial–temporal non-stationarity phenomenon detected by GTWR indicates that vegetation is also influenced by human activities in different years and with varying degrees. The contributions of ecological restoration and agricultural expansion on NDVI’s increased trends during the period of 1982–2015 were 4.0 and 3.2%, respectively (Figure 10). Cultivated vegetation in oasis areas exhibited a significant increasing trend, which could result from the greater contributions of human factors such as fertilization, irrigation, and land-use management to the vegetation trends [61]. Meanwhile, the aeolian process has caused a considerable loss of soil nutrients, decreasing total soil organic carbon and total nitrogen content [42]. Thus, wind speed significantly negatively affects the farmland vegetation in Wuwei. Therefore, the interaction of natural and human factors influences vegetation in oasis areas (Figure 7e).

5. Conclusions

In this study, GTWR, a spatial–temporal non-stationary relationship model of NDVI trends and climate change, was constructed to explore the driving mechanism of vegetation spatial–temporal evolution patterns. The results of the GTWR model showed that the correlations between the vegetation spatial–temporal evolution process and climate driving factors presented significant spatial–temporal non-stationarity and agglomeration. The inter-annual vegetation change in Wuwei during the period of 1982–2015 exhibited a significant increasing trend, with the inter-annual NDVI increase trend during the period of 2000–2015 being 1.4 times the trend during the period of 1982–1999. This significant vegetation restoration is primarily caused by climate warming. There was a significant spatial–temporal difference between the evolution trends of vegetation before and after the ecological restoration project implemented in 2000. After 2000, the vegetation trend presented a significant restoration pattern. On the contrary, vegetation degradation was severe before 2000. Among those climate elements, precipitation (71.2%) and PET (43.9%) contributed the most to the vegetation restoration trend in Wuwei from 1982 to 2015, followed by solar radiation, temperature, and wind speed. In addition, wind speed (50%) and temperature (38.6%) are the climate elements that contributed the most to the vegetation degradation trend in Wuwei between 1982 and 2015. It should be noted that the stress effect of wind speed on the vegetation of desert and grassland ecosystems should not be underestimated. Meanwhile, compared with the significantly-expanded farmland, grassland, and forestland during the period of 1985–2015, wetlands, snow/ice, water, and shrub had shrunk by a relatively large proportion. The area of cropland, grassland, and forestland increased by 20.1, 20.6, and 8.5%, respectively. The area of ecological land converted to non-ecological land accounted for 3.5%, mainly in cropland and barren area of Wuwei. The area of non-ecological land converted to ecological land accounted for 5.7%. This indicates that agricultural intensification and vegetation restoration projects have a significant positive effect on vegetation trends.

Author Contributions

Methodology, software, and writing—original draft preparation, X.L.; conceptualization, writing—reviewing and editing, and data processing, L.Y. All authors have read and agreed to the published version of the manuscript.

Funding

This research was funded by the Natural Science Foundation Project of Gansu Province, grant number 22JR5RA141 and Northwest Normal University Young Teachers Research Ability Enhancement Program General Project, grant number 20220024.

Data Availability Statement

The GIMMS 3g NDVI dataset was downloaded from the NASA Earth Exchange platform. The climate dataset was provided by the Resource and Environmental Science Data Center (RESDC) of the Chinese Academy of Sciences. The Landsat-derived annual China land-cover dataset was obtained from the Google Earth Engine (GEE) platform.

Acknowledgments

All authors have read and agreed to the published version of the manuscript. We would like to express our sincere gratitude to the editors and reviewers, who have put considerable time and effort into their comments on this paper.

Conflicts of Interest

The authors declare no conflict of interest.

References

  1. Law, B.; Falge, E.; Gu, L.; Baldocchi, D.; Bakwin, P.; Berbigier, P.; Wofsy, S. Environmental controls over carbon dioxide and water vapor exchange of terrestrial vegetation. Agric. For. Meteorol. 2002, 113, 97–120. [Google Scholar] [CrossRef]
  2. Potter, C.; Boriah, S.; Steinbach, M.; Kumar, V.; Klooster, S. Terrestrial vegetation dynamics and global climate controls. Clim. Dyn. 2008, 31, 67–78. [Google Scholar] [CrossRef]
  3. Bégué, A.; Vintrou, E.; Ruelland, D.; Claden, M.; Dessay, N. Can a 25-year trend in Soudano-Sahelian vegetation dynamics be interpreted in terms of land use change? A remote sensing approach. Glob. Environ. Chang. 2011, 21, 413–420. [Google Scholar] [CrossRef]
  4. Wen, Z.F.; Wu, S.J.; Chen, J.L.; Lv, M.Q. NDVI indicated long-term interannual changes in vegetation activities and their responses to climatic and anthropogenic factors in the Three Gorges Reservoir Region, China. Sci. Total Environ. 2017, 574, 947–959. [Google Scholar] [CrossRef] [PubMed]
  5. Fu, B.J.; Wu, X.T.; Wang, Z.Z.; Wu, X.L.; Wang, S. Coupling Human and Natural Systems for Sustainability: Experiences from China’s Loess Plateau. Earth Syst. Dyn. Discuss. 2022, 13, 795–808. [Google Scholar] [CrossRef]
  6. Zhu, Z.C.; Piao, S.L.; Myneni, R.B.; Huang, M.; Zeng, Z.; Canadell, J.G.; Ciais, P.; Sitch, S.; Friedlingstein, P.; Arneth, A.; et al. Greening of the Earth and its drivers. Nat. Clim. Chang. 2016, 6, 791–795. [Google Scholar] [CrossRef]
  7. Pan, N.Q.; Feng, X.M.; Fu, B.J.; Wang, S.; Ji, F.; Pan, S.F. Increasing global vegetation browning hidden in overall vegetation greening: Insights from time varying trends. Remote Sens. Environ. 2018, 214, 59–72. [Google Scholar] [CrossRef]
  8. Feng, X.M.; Fu, B.J.; Piao, S.L.; Wang, S.; Ciais, P.; Zeng, Z.Z.; Lü, Y.H.; Zeng, Y.; Li, Y.; Jiang, X.H.; et al. Revegetation in China’s loess plateau is approaching sustainable water resource limits. Nat. Clim. Chang. 2016, 6, 1019–1022. [Google Scholar] [CrossRef]
  9. Chen, C.; Park, T.; Wang, X.; Piao, S.; Xu, B.; Chaturvedi, R.K.; Fuchs, R.; Brovkin, V.; Ciais, P.; Fensholt, R.; et al. China and India lead in greening of the world through land-use management. Nat. Sustain. 2019, 2, 122–129. [Google Scholar] [CrossRef]
  10. Sun, R.H.; Zhang, B.P. Topographic effects on spatial pattern of surface air temperature in complex mountain environment. Environ. Earth Sci. 2016, 75, 621. [Google Scholar] [CrossRef]
  11. Guan, Q.Y.; Yang, L.Q.; Pan, N.H.; Lin, J.K.; Xu, C.Q.; Wang, F.F.; Liu, Z.Y. Greening and Browning of the Hexi Corridor in Northwest China: Spatial patterns and responses to climatic variability and anthropogenic drivers. Remote Sens. 2018, 10, 1270. [Google Scholar] [CrossRef]
  12. Xu, Z.W.; Hu, R.; Wang, K.X.; Mason, J.A.; Wu, S.Y.; Lu, H.Y. Recent greening (1981–2013) in the Mu Us dune field, north-central china, and its potential causes. Land Degrad. Dev. 2018, 29, 1509–1520. [Google Scholar] [CrossRef]
  13. Donohue, R.J.; Roderick, M.L.; Mcvicar, T.R.; Farquhar, G.D. Impact of CO2 fertilization on maximum foliage cover across the globe’s warm, arid environments. Geophys. Res. Lett. 2013, 40, 3031–3035. [Google Scholar] [CrossRef]
  14. Piao, S.L.; Yin, G.D.; Tan, J.G.; Cheng, L.; Huang, M.T.; Li, Y.; Liu, R.G.; Mao, J.F.; Myneni, R.B.; Peng, S.S.; et al. Detection and attribution of vegetation greening trend in China over the last 30 years. Glob. Chang. Biol. 2015, 21, 1601–1609. [Google Scholar] [CrossRef]
  15. Zhou, J.H.; Cai, W.T.; Qin, Y.; Lai, L.M.; Guan, T.Y.; Zhang, X.L.; Jiang, L.H.; Du, H.; Yang, D.W.; Cong, Z.T.; et al. Alpine vegetation phenology dynamic over 16 years and its covariation with climate in a semi-arid region of China. Sci. Total Environ. 2016, 572, 119–128. [Google Scholar] [CrossRef]
  16. Zhao, W.; Yu, X.Y.; Jiao, C.C.; Xu, C.D.; Liu, Y.; Wu, G. Increased association between climate change and vegetation index variation promotes the coupling of dominant factors and vegetation growth. Sci. Total Environ. 2021, 767, 144669. [Google Scholar] [CrossRef]
  17. Jiao, W.Z.; Wang, L.X.; Smith, W.K.; Chang, Q.; Wang, H.L.; D’Odorico, P. Observed increasing water constraint on vegetation growth over the last three decades. Nat. Commun. 2021, 12, 3777. [Google Scholar] [CrossRef]
  18. Xu, X.J.; Liu, H.Y.; Jiao, F.S. Nonlinear relationship of greening and shifts from greening to browning in vegetation with nature and human factors along the Silk Road Economic Belt. Sci. Total Environ. 2021, 766, 142553. [Google Scholar] [CrossRef]
  19. Chen, B.; Guang, X.; Coops, N.; Ciais, P.; Innes, J.; Wang, G.; Myneni, R. Changes in vegetation photosynthetic activity trends across the Asia-Pacific region over the last three decades. Remote Sens. Environ. 2014, 144, 28–41. [Google Scholar] [CrossRef]
  20. Bai, M.; Mo, X.; Liu, S.; Hu, S. Contributions of climate change and vegetation greening to evapotranspiration trend in a typical hilly-gully basin on the Loess Plateau, China. Sci. Total Environ. 2019, 657, 325–339. [Google Scholar] [CrossRef]
  21. Yang, L.Q.; Guan, Q.Y.; Lin, J.K.; Tian, J.; Tan, Z.; Li, H.C. Evolution of NDVI secular trends and responses to climate change: A perspective from nonlinearity and nonstationarity characteristics. Remote Sens. Environ. 2021, 254, 112247. [Google Scholar] [CrossRef]
  22. Nemani, R.R.; Keeling, C.D.; Hashimoto, H.; Jolly, W.M.; Piper, S.C.; Tucker, C.J.; Myneni, R.B.; Running, S.W. Climate-driven increases in global terrestrial net primary production from 1982 to 1999. Science 2003, 300, 1560–1563. [Google Scholar] [CrossRef] [PubMed]
  23. Zhong, L.; Ma, Y.M.; Salama, S.M.; Su, Z.B. Assessment of vegetation dynamics and their response to variations in precipitation and temperature in the Tibetan Plateau. Clim. Chang. 2010, 103, 519–535. [Google Scholar] [CrossRef]
  24. Fensholt, R.; Proud, S.R. Evaluation of earth observation based global long term vegetation trends—Comparing GIMMS and MODIS global NDVI time series. Remote Sens. Environ. 2012, 119, 131–147. [Google Scholar] [CrossRef]
  25. Zhang, Y.L.; Song, C.H.; Band, L.E.; Sun, G.; Li, J.X. Reanalysis of global terrestrial vegetation trends from MODIS products: Browning or greening? Remote Sens. Environ. 2017, 191, 145–155. [Google Scholar] [CrossRef]
  26. Reynolds, J.F.; Smith, D.M.S.; Lambin, E.F.; Turner, B.L.; Mortimore, I.I.; Batterbury, M.; Downing, S.P.; Dowlatabadi, T.E.; Fernandez, H.; Herrick, R.J.; et al. Global desertification: Building a science for dryland development. Science 2008, 316, 847–851. [Google Scholar] [CrossRef] [PubMed]
  27. Wang, J.; Zhang, T.; Fu, B.A. A measure of spatial stratified heterogeneity. Ecol. Indic. 2016, 67, 250–256. [Google Scholar] [CrossRef]
  28. Xu, X.; Liu, H.; Jiao, F.; Gong, H.; Lin, Z. Time-varying trends of vegetation change and their driving forces during 1981–2016 along the silk road economic belt. Catena 2020, 195, 104796. [Google Scholar] [CrossRef]
  29. Tong, X.Y.; Brandt, M.; Hiernaux, P.; Herrmann, S.M.; Tian, F.; Prishchepov, A.V.; Fensholt, R. Revisiting the coupling between NDVI trends and cropland changes in the Sahel drylands: A case study in western Niger. Remote Sens. Environ. 2017, 191, 286–296. [Google Scholar] [CrossRef]
  30. Huang, B.; Wu, B.; Barry, M. Geographically and temporally weighted regression for modeling spatio-temporal variation in house prices. Int. J. Geogr. Inf. Sci. 2010, 24, 383–401. [Google Scholar] [CrossRef]
  31. Kraak, M.J.; Koussoulakou, A. A visualization environment for the space-timecube. In Developments in Spatial Data Handling; Springer: Berlin/Heidelberg, Germany, 2005; pp. 189–200. [Google Scholar] [CrossRef]
  32. Telesca, L.; Lasaponara, R. Discriminating dynamical patterns in burned and unburned vegetational covers by using SPOT-VGT NDVI data. Geophys. Res. Lett. 2005, 32, L21401. [Google Scholar] [CrossRef]
  33. Li, Z.; Huffman, T.; Mcconkey, B.; Townley-Smith, L. Monitoring and modeling spatial and temporal patterns of grassland dynamics using time-series MODIS NDVI with climate and stocking data. Remote Sens. Environ. 2013, 138, 232–244. [Google Scholar] [CrossRef]
  34. Dong, J.; Xiao, X.; Kou, W.; Qin, Y.; Zhang, G.; Li, L.; Moore III, B. Tracking the dynamics of paddy rice planting area in 1986-2010 through time series Landsat images and phenology-based algorithms. Remote Sens. Environ. 2015, 160, 99–113. [Google Scholar] [CrossRef]
  35. He, Q.; Huang, B. Satellite-based mapping of daily high-resolution ground PM2.5 in China via space-time regression modeling. Remote Sens. Environ. 2018, 206, 72–83. [Google Scholar] [CrossRef]
  36. Hutchinson, M.F. Interpolation of rainfall data with thin plate smoothing splinespart I. Two dimensional smoothing of data with short range correlation. J. Geogr. Inf. Decis. Anal. 1998, 2, 139–151. [Google Scholar] [CrossRef]
  37. Yang, K.; He, J.; Tang, W.J.; Qin, J.; Cheng, C.C.K. On downward shortwave and longwave radiations over high altitude regions: Observation and modeling in the Tibetan plateau. Agric. For. Meteorol. 2010, 150, 38–46. [Google Scholar] [CrossRef]
  38. Yang, J.; Huang, X. The 30 m annual land cover dataset and its dynamics in China from 1990 to 2019. Earth Syst. Sci. Data 2021, 13, 3907–3925. [Google Scholar] [CrossRef]
  39. Fernandes, R.; Leblanc, S.G. Parametric (modifed least squares) and nonparametric (Theil-Sen) linear regressions for predicting biophysical parameters in the presence of measurement errors. Remote Sens. Environ. 2005, 95, 303–316. [Google Scholar] [CrossRef]
  40. Ma, Y.R.; Guan, Q.Y.; Sun, Y.F.; Zhang, J.; Yang, L.Q.; Yang, E.Q.; Li, H.C.; Du, Q.Q. Three-dimensional dynamic characteristics of vegetation and its response to climatic factors in the Qilian Mountains. Catena 2022, 208, 105694. [Google Scholar] [CrossRef]
  41. Shao, Q.Q.; Zhao, Z.P.; Liu, J.Y.; Fan, J.W. The characteristics of land cover and macroscopical ecology changes in the source region of three rivers on QinghaiTibet Plateau during last 30 years. Geogr. Res. 2010, 29, 1439–1451. (In Chinese) [Google Scholar] [CrossRef]
  42. Li, J.R.; Okin, G.S.; Alvarez, L.; Epstein, H. Quantitative effects of vegetation cover on wind erosion and soil nutrient loss in a desert grassland of southern New Mexico, USA. Biogeochemistry 2017, 85, 317–332. [Google Scholar] [CrossRef]
  43. Chu, H.J.; Huang, B.; Lin, C.Y. Modeling the spatio-temporal heterogeneity in the PM10-PM2.5 relationship. Atmos. Environ. 2015, 102, 176–182. [Google Scholar] [CrossRef]
  44. Berg, A.; Findell, K.; Lintner, B.; Giannini, A.; Seneviratne, S.I.; Hurk, B.V.D.; Lorenz, R.; Pitman, A.; Hagemann, S.; Meier, A.; et al. Land–atmosphere feedbacks amplify aridity increase over land under global warming. Nat. Clim. Chang. 2016, 6, 869–874. [Google Scholar] [CrossRef]
  45. Zhou, S.; Williams, A.P.; Berg, A.M.; Cook, B.I.; Zhang, Y.; Hagemann, S.; Lorenzg, R.; Seneviratneg, S.I.; Gentine, P. Land–atmosphere feedbacks exacerbate concurrent soil drought and atmospheric aridity. Proc. Natl. Acad. Sci. USA 2019, 116, 18849. [Google Scholar] [CrossRef] [PubMed]
  46. Shi, Y.F.; Shen, Y.P. Signal, Impact and Outlook of Climatic Shift from Warm-Dry to WarmHumid in Northwest China. Sci. Technol. Rev. 2003, 2, 54–56. [Google Scholar] [CrossRef]
  47. Yan, J.H.; Liu, D.M.; Yan, J.P. The spatial structure of climate change in Shaanxi-Gansu-Ningxia region. J. Arid. Land Resour. Environ. 2009, 23, 67–71. [Google Scholar]
  48. Xu, S.Q.; McVicar, T.R.; Li, L.C.; Yu, Z.B.; Jiang, P.; Zhang, Y.L.; Ban, Z.X.; Xing, W.Q.; Dong, N.P.; Zhang, H.; et al. Globally assessing the hysteresis between sub-diurnal actual evaporation and vapor pressure deficit at the ccosystem scale: Pattern and mechanisms. Agric. For. Meterology 2022, 323, 109085. [Google Scholar] [CrossRef]
  49. Li, A.; Wu, J.G.; Huang, J.H. Distinguishing between human-induced and climate-driven vegetation changes: A critical application of RESTREND in Inner Mongolia. Landsc. Ecol. 2012, 27, 969–982. [Google Scholar] [CrossRef]
  50. Lian, X.; Piao, S.L.; Li, L.Z.X.; Yue, L.; Chris, H.; Ciais, P.; Cescatti, A.; Janssens, I.A.; Peñuelas, J.; Buermann, W.; et al. Summer soil drying exacerbated by earlier spring greening of northern vegetation. Sci. Adv. 2020, 6, 2375–2548. [Google Scholar] [CrossRef]
  51. Midgley, G.F.; Aranibar, J.N.; Mantlana, K.B.; Macko, S. Photosynthetic and gas exchange characteristics of dominant woody plants on a moisture gradient in an African savanna. Glob. Chang. Biol. 2004, 10, 309–317. [Google Scholar] [CrossRef]
  52. Guan, Q.Y.; Yang, L.Q.; Guan, W.Q.; Wang, F.F.; Liu, Z.Y.; Xu, C.Q. Assessing vegetation response to climatic variations and human activities: Spatiotemporal NDVI variations in the Hexi Corridor and surrounding areas from 2000 to 2010. Theor. Appl. Climatol. 2019, 135, 1179–1193. [Google Scholar] [CrossRef]
  53. Wang, X.H.; Piao, S.L.; Ciais, P.; Li, J.S.; Friedlingstein, P.; Koven, C.; Chen, A.P. Spring temperature change and its implication in the change of vegetation growth in North America from 1982 to 2006. Proc. Natl. Acad. Sci. USA 2011, 108, 1240–1245. [Google Scholar] [CrossRef] [PubMed]
  54. Zhang, Y.; Peng, C.H.; Li, W.Z.; Tian, L.Z.; Zhu, Q.A.; Chen, H.; Fang, X.Q.; Zhang, G.L.; Liu, G.B.; Mu, X.M.; et al. Multiple afforestation programs accelerate the greenness in the ‘three north’ region of china from 1982 to 2013. Ecol. Indic. 2016, 61, 404–412. [Google Scholar] [CrossRef]
  55. Lawler, J.; Lewis, D.; Nelson, E.; Plantinga, A.; Polasky, S.; Withey, J.; Radeloff, V. Projected land-use change impacts on ecosystem services in the United States. Proc. Natl. Acad. Sci. USA 2014, 111, 7492–7497. [Google Scholar] [CrossRef] [PubMed]
  56. Beurs, K.; Henebry, G.; Owsley, B.; Sokolik, I. Using multiple remote sensing perspectives to identify and attribute land surface dynamics in Central Asia 2001-2013. Remote Sens. Environ. 2015, 170, 48–61. [Google Scholar] [CrossRef]
  57. Zhang, G.L.; Dong, J.W.; Xiao, X.L.; Hu, Z.M.; Sheldon, S. Effectiveness of ecological restoration projects in Horqin Sandy Land, China based on SPOT-VGT NDVI data. Ecol. Eng. 2012, 38, 20–29. [Google Scholar] [CrossRef]
  58. Tian, H.J.; Cao, C.X.; Chen, W.; Bao, S.N.; Yang, B. Response of vegetation activity dynamic to climatic change and ecological restoration programs in Inner Mongolia from 2000 to 2012. Ecol. Eng. 2015, 82, 276–289. [Google Scholar] [CrossRef]
  59. Cao, S.X. Why large-scale afforestation efforts in China have failed to solve the desertification problem. Environ. Sci. Technol. 2008, 42, 1826–1831. [Google Scholar] [CrossRef]
  60. Cao, S.X.; Suo, X.H.; Xia, C.Q. Payoff from afforestation under the Three-North Shelter Forest Program. J. Clean. Prod. 2020, 256, 120461. [Google Scholar] [CrossRef]
  61. Mishra, N.B.; Mainali, K.P. Greening and browning of the Himalaya: Spatial patterns and the role of climatic change and human drivers. Sci. Total Environ. 2017, 587, 326–339. [Google Scholar] [CrossRef]
Figure 1. Flow chart of this study.
Remotesensing 15 02675 g001
Figure 2. Location of Wuwei prefecture, in northwest central Gansu province.
Remotesensing 15 02675 g002
Figure 3. The interannual evolution and abrupt change of NDVI throughout the growing season (April to October) in the whole study area during the period of 1982–2015.
Remotesensing 15 02675 g003
Figure 4. Change in NDVI trend among different land-use types in Wuwei region during the period of 1982–2015.
Remotesensing 15 02675 g004
Figure 5. The interannual change of climate factors throughout the growing season (April to October) in the whole study area during the period of 1982–2015.
Remotesensing 15 02675 g005
Figure 6. The spatial–temporal variations of NDVI trends in the three periods. (a) 1982–2015, (b) 1982–1999, and (c) 2000–2015.
Remotesensing 15 02675 g006
Figure 7. Spatial–temporal distribution diagram of the response of vegetation in the Wuwei area to climate change.
Remotesensing 15 02675 g007
Figure 8. The spatial–temporal distributions of land-use and land-cover type in 1985, 2000, 2005, 2010, and 2015 in Wuwei.
Remotesensing 15 02675 g008
Figure 9. Spatial diagram of the internal transition of NEL and EL during the period of 1982–2015 in Wuwei.
Remotesensing 15 02675 g009
Figure 10. The contributions of urbanization, ecological restoration, and agricultural expansion on NDVI’s increased trends during the period of 1982–2015.
Remotesensing 15 02675 g010
Table 1. Land use and land cover type and ecological land reclassify.
NumberLand-Use/Land-Cover TypeEcological Land
1CroplandNo
2ForestYes
3ShrubYes
4GrasslandYes
5WaterYes
6Snow/iceYes
7WetlandYes
8BarrenNo
9ImperviousNo
Table 2. Transition areas of the total LULC categories during the period of 1985–2015 (%).
2015Unit: km2
1985CroplandForestShrubGrasslandWaterSnow
/Ice
BarrenImperviousWetlandTotal
1985
LossNet
Change
(%)
Cropland3679.814.10.0654.31.70.08.94.40.04363.2683.420.1
Forest186.71067.117.1185.00.40.03.10.40.01459.8392.78.5
Shrub129.0229.753.5358.60.50.07.10.50.0778.7725.3−89.2
Grassland467.6273.513.710,263.18.10.7218.33.40.011,248.3985.120.6
Water80.70.10.0272.119.91.087.11.50.0462.5442.6−92.3
Snow/ice76.80.00.0240.41.812.8126.91.90.0460.6447.8−94.7
Barren608.70.00.01580.03.110.118,611.23.20.020,816.42205.2−8.4
Impervious11.00.00.09.40.00.03.32.90.026.723.7−29.8
Wetland0.00.00.00.00.00.00.00.40.00.40.4−99.4
Total 20155240.31584.484.213,562.935.424.619,065.918.70.033,710.3
Gain1560.5517.430.83299.815.511.8454.715.80.0
Disclaimer/Publisher’s Note: The statements, opinions and data contained in all publications are solely those of the individual author(s) and contributor(s) and not of MDPI and/or the editor(s). MDPI and/or the editor(s) disclaim responsibility for any injury to people or property resulting from any ideas, methods, instructions or products referred to in the content.

